Article

Can Protection Motivation Theory Explain Farmers’ Adaptation to Climate Change Decision Making in The Gambia?

1
International Livestock Research Institute, West Africa regional office, 01 BP 1496 Ouagadougou, Burkina Faso
2
The CGIAR Program on Climate Change, Agriculture and Food Security (CCAFS), ICRISAT West & Central Africa Office, BP 320, Bamako, Mali
3
West African Science Service Center on Climate Change and Adapted Land Use (WASCAL), 06 BP 9507 Ouagadougou, Burkina Faso
4
School of Education, University of The Gambia, P.O. Box 3530, Serrekunda, The Gambia
5
Department of Epidemiology & Population Health, School of Public Health & Information Sciences, University of Louisville
*
Author to whom correspondence should be addressed.
Submission received: 11 December 2018 / Revised: 28 December 2018 / Accepted: 31 December 2018 / Published: 14 January 2019

Abstract

:
In The Gambia, climate change has affected, and continues to affect, the agriculture sector. Thus, there is a need to develop and understand effective agricultural adaptation policies. The present study used protection motivation theory to describe farmers’ adoption of climate change adaptation measures in the Central River Region of The Gambia. Primary data were collected in eight communities of the region. A transect walk was conducted, followed by a survey of farmers (n = 283). Perception data collected referred back to the past 20 years, with stated implementation addressing current adaptation practices. Results showed that the perception variables, namely, severity, ability to withstand, and internal barriers, were significantly correlated with protection motivation, while protection motivation and stated implementation for water conservation technique were strongly correlated. Structural equation modeling confirmed the mediation role of protection motivation between farmers’ “stated implementation” of adaptation measures and their perception of climate variability. A decrease in soil water storage capacity, degradation of the quality of soil surface structure, and a decrease of the length of the growing season are all factors that motivate farmers to implement an adaptation measure. The cost of the implementation and farmers’ vulnerability are factors that prevent implantation of adaptation measures. This study suggested that farmers’ resilience should be improved and adaptation measures should be subsidized in order to make them more accessible to farmers.

1. Introduction

The global climate system has changed over the past decades and millennia [1]. Although Africa’s carbon dioxide (CO2) emission level is relatively low, the African continent is one of the most vulnerable regions to climate change [2]. With the increase in rainfall variability predicted in sub-Saharan Africa, agriculture is most likely to be negatively affected by these changes [3]. Simulation models predict a drastic reduction of maize crop production in Africa by 2055 [4], even though a large proportion of the population still depends on a rural livelihood and natural resources. Adger, et al. [5] stated that climate change may increase developmental challenges, especially in countries with a heavy reliance on natural resources. Prior research found that coping measures alone were not enough to avoid loss and damages in the North Bank Region of The Gambia [6]. Therefore, adaptation to present and future changes in climate should be a priority in Africa.
Farmers’ perception of climate variability may influence their adaptation decisions [7]. According to Adesina and Baidu-Forson [8], farmers’ “perception of the characteristics of adaptation measures may influence their adaptation choices”. A study conducted in Senegal has shown that farmers’ access to climate information services positively influenced their adaptation decision making [9]. Other studies [10,11,12] indicated that farmers perceive the variation of the climate around them. In Senegal, for instance, which is very close to The Gambia, most farmers perceive changes in the frequency of drought and length of the drought season [11]. Yaffa [6] described how farmers use various measures and coping strategies to adapt to drought and climate variability in The Gambia. Understanding the underlying relationship between farmers’ perception of climate variability and their adaptation decision making is likely to provide good insight for implementing climate change adaptation policies. In some studies, the link between farmers’ perception and implementation of adaptation measures is made using logistic regression and the Heckman probit and tobit model [13,14,15,16].
The present paper is an attempt to make the linkage between farmers’ perception variables and their adaptation decision making through the protection motivation theory (PMT) using structural equation modeling. More specifically, the analysis of the linkage will identify perception variables which drive or hinder adaptation decisions. PMT was originally developed to explain human response to fear of health threats [17]. Protection motivation corresponds to the impulse to protect oneself against health threats and to the intent to adopt a responsive action [18]. A meta-analysis reported its application in studies of political issues, environmental concerns, and protecting others [17]. In this case, we applied PMT to climate change sciences to find out about the drivers of farmers’ decision to adopt an adaptation intervention. PMT has been used as a suitable model to guide campaigns in the area of climate change [19]. It has also been used to predict the adoption of electric vehicles in The Netherlands [20]. Similarly, in the present study, PMT is used to explain the adoption of farm-level adaptation measures in the Central River Region of The Gambia. Until recently, few studies in the climate change arena have been conducted in The Gambia. Most of the studies conducted focused on the North Bank Region, which is the driest region in The Gambia. This study focused on the Central River Region (CRR) because this region is perceived as the “food basket” of The Gambia. The CRR is a relevant location for this study as it could be an important contribution to farmers’ resilience, building for improved food productivity and poverty reduction. Following Karrer [21], the risk appraisal, coping appraisal, response cost, internal multipliers and barriers, external multipliers and barriers, protection motivation and implementation decision are variables used to construct the theoretical model. First, cues or signals, such as an observation or a question concerning climate change adaptation in agriculture activate both a risk and a coping appraisal. The risk appraisal assesses potential negative consequences of a risk that could affect the decision maker. The coping appraisal process evaluates the ability to avert the threatened danger [17]. These two appraisals interact and lead to a protection motivation decision that, in turn, is influenced by barriers (i.e., ideas about and attitudes regarding the feasibility and effects of a behavioral option) that hinder the decision in favor of a particular option. The present study will clarify whether farmers’ adoption of climate-risk management strategies in The Gambia is driven by their protection motivation.

2. Materials and Methods
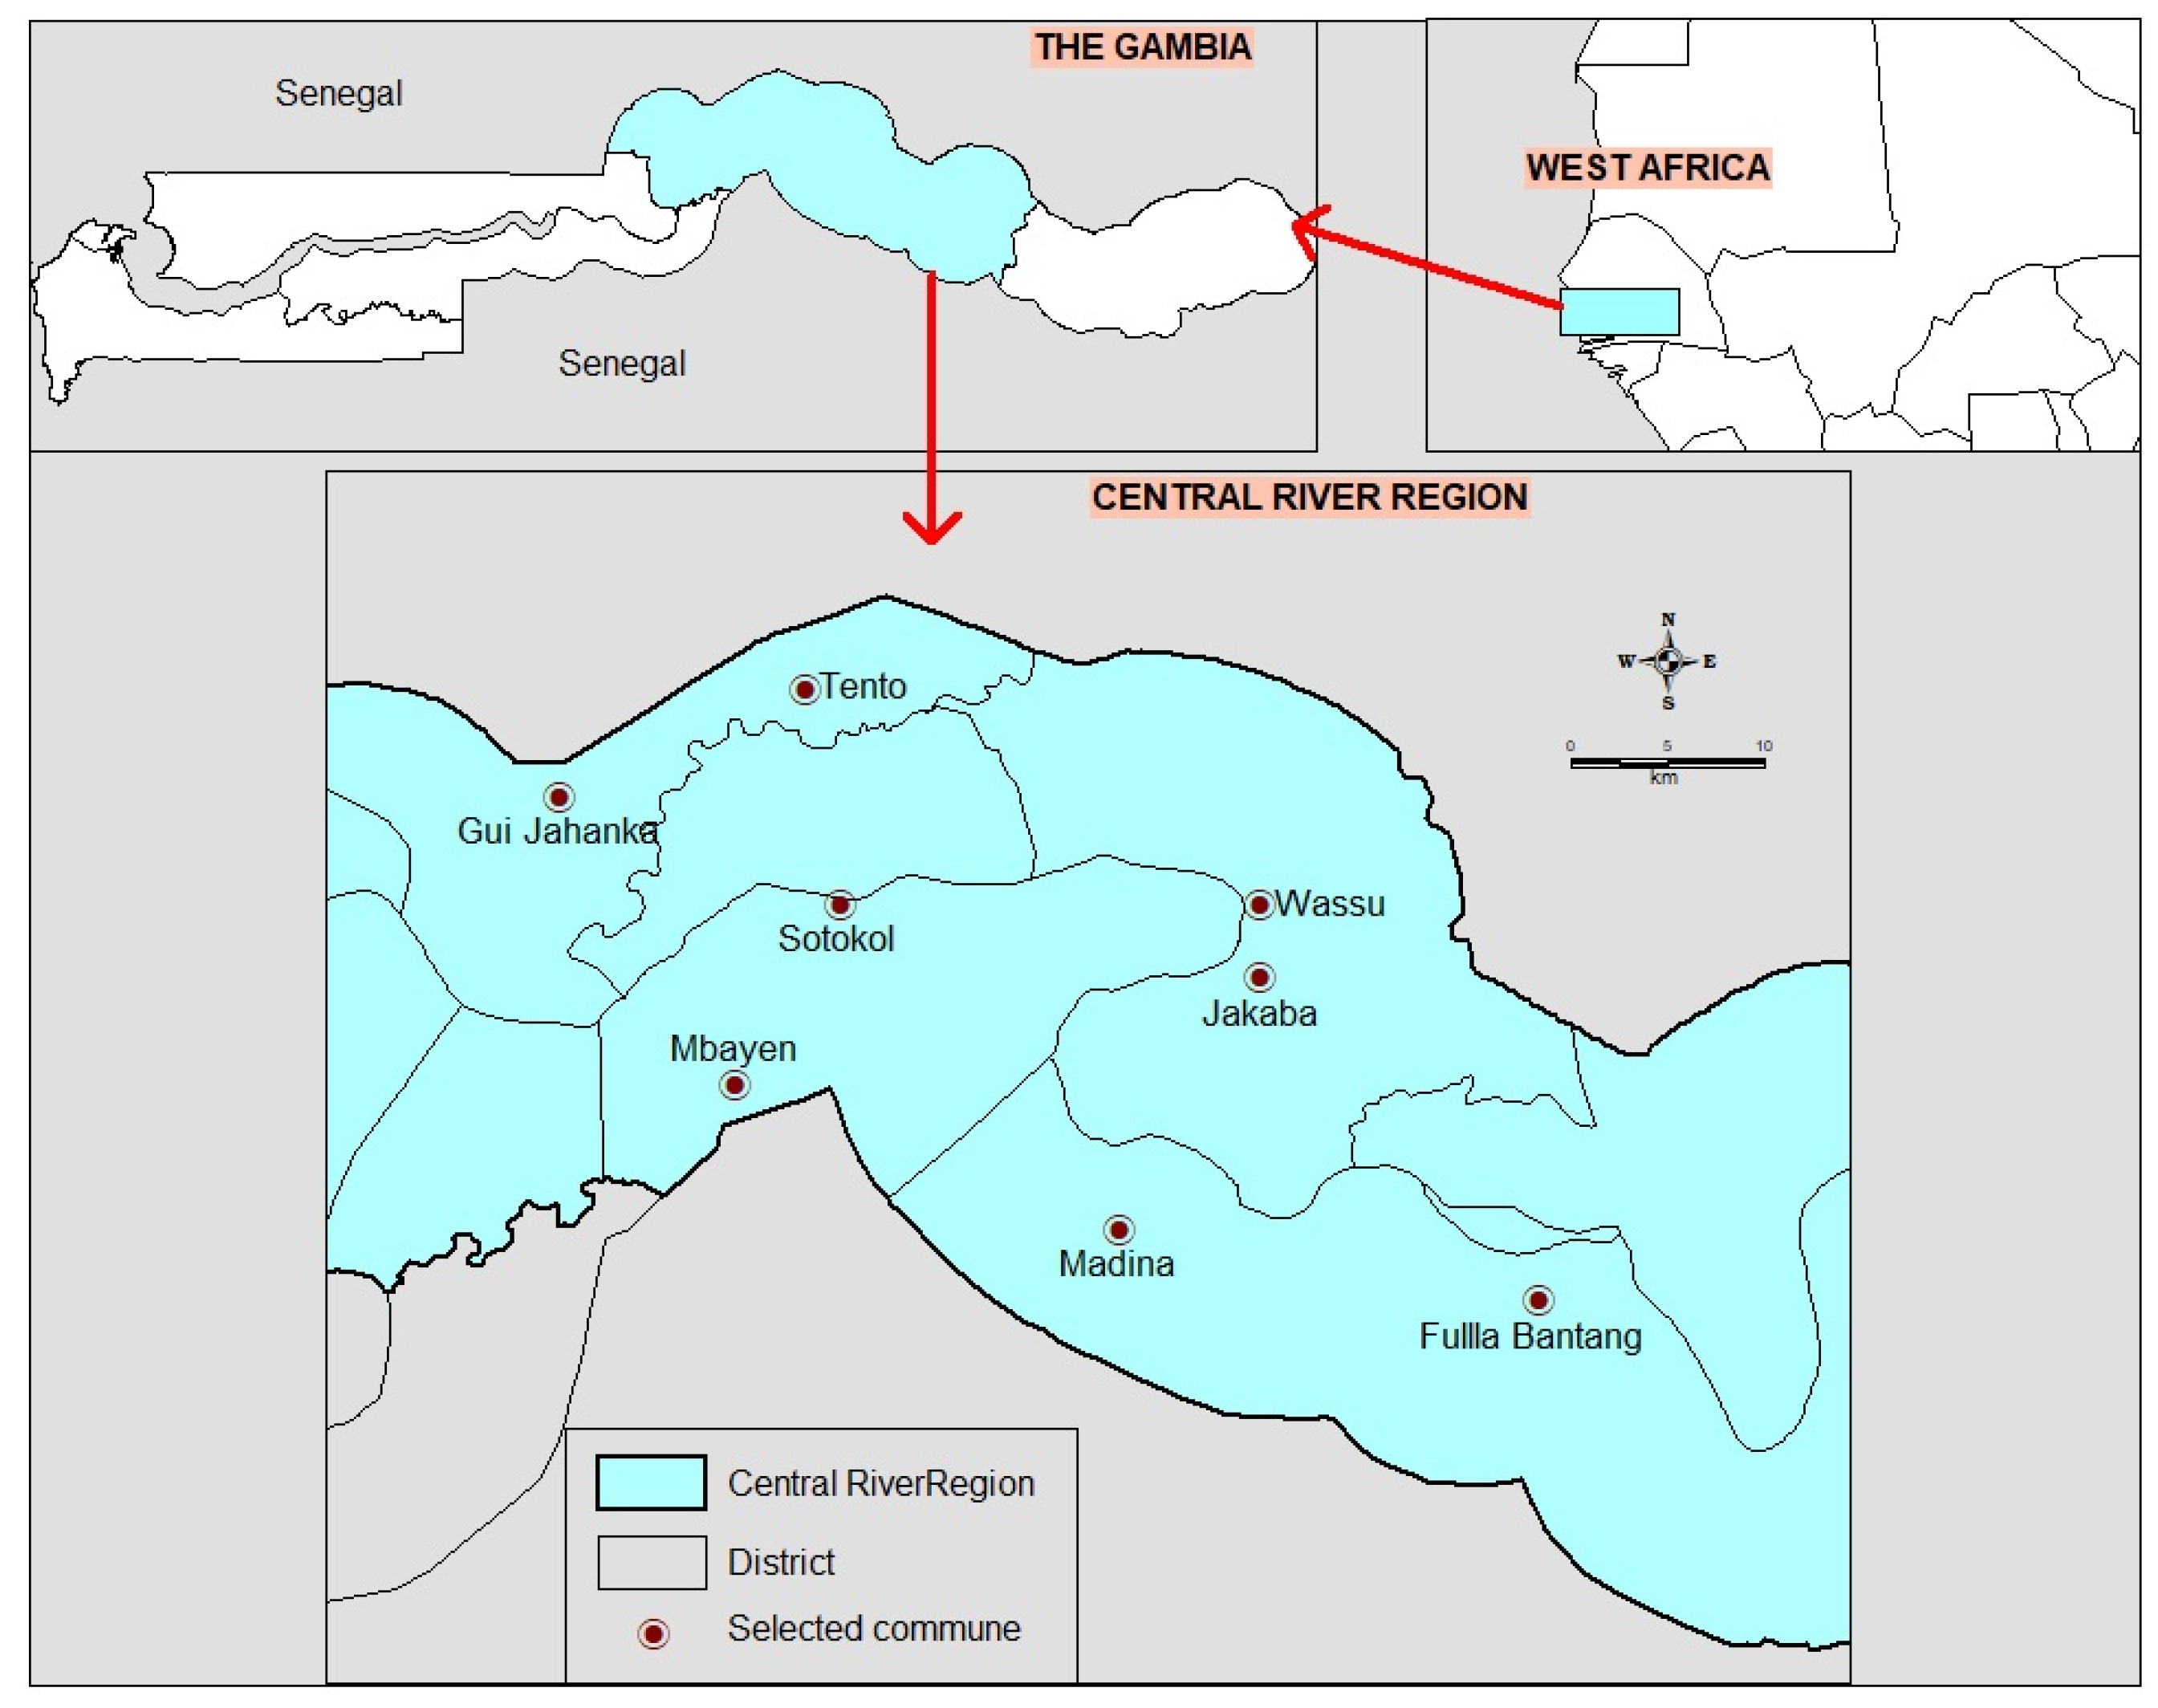
2.1. Study Area

The CRR is the largest region of The Gambia, with a land area of 2894 km2 and a total population of 226,000 inhabitants [22]. It is divided into two banks by the River Gambia: the North Bank Region and the South Bank Region. Extensive fresh water floodplains are found on either side of the river. The main ethnic group is the Fulani, who were historically cattle owners. Most of the population in this region makes their livelihood through farming millet, peanuts and rice. To fight climate variability, farmers in the region are using natural and chemical fertilizers, irrigation schemes and water conservation techniques, mixed cropping systems, crop rotation systems and improved crop varieties (mainly NERICA for rice and early millet for millet) as adaptation techniques. The study was conducted in four districts of the CRR. The four districts were purposefully selected, with the aim of covering both north and south banks of the region. Therefore, Upper Saloum and Niani were selected in CRR North, while Niamina East and lower Fulladu West were selected in CRR South (Figure 1). With the assumption that agriculture is a naturally occurring activity and adaptation measures vary little within a district, two communities were selected randomly in each district, totaling eight communities.

2.2. Data Collection

Data collection was conducted in two steps using two tools: (1) a transect walk guide and (2) a semi-structured questionnaire for farmers who are household heads. A linear transect was used since it is praised for good replicability [23]. The transect walk guide was comprised of open-ended questions to which key informants responded, while walking the farmland. The key informants were the Alkalos (local chiefs) and two to three selected farmers. The transect walk guide informed researchers on current adaptation measures implemented at the farm level. The survey questionnaire contained five sections as follows: Section (a): perceived risk appraisal; section (b): perception of coping ability; section (c): protection motivation, response cost, stated preference, and perceived effectiveness; section (d): assessed internal multipliers and barriers to pro-environmental behavior; and section (e): recorded socio-demographic and farm-specific variables. The perceived risk appraisal included the evolution of extreme weather event variables and plant growth factor variables, while the perception of coping ability included variables related to farmers’ perception of their own ability to deal with some extreme weather events when they occur. Protection motivation included the farmer’s willingness to protect their farm against climate hazards. The perceived cost, stated preference and perceived effectiveness were related to the adaptation measure; the internal multipliers and barriers included beliefs and thoughts that may motivate or prevent farmers to adopt an adaptation measure; and the socio-demographic and farm specific variables included respondent age, sex, farm size, income from farm, etc. Items included 6-item Likert type responses with an “I don’t know” option. The rating scale varied across sections. For instance, the rating scale of the coping appraisal included six ratings: Strongly disagree (1), disagree (2), somewhat disagree (3), somewhat agree (4), agree (5), strongly agree (6). Only the risk appraisal included 7-item Likert type responses. Since this section was dealing with the perceived change, an additional option for “no change” in the middle was needed. The rating scale for the risk appraisal was as follows: Very strong decrease (1), decrease (2), little decrease (3), no change (4), little increase (5), increase (6), very strong increase (7). The items were designed according to the indicators of PMT [24]. Each indicator contained items ranging from 3 to 8. The survey questionnaire was pretested and validated by experts in the domain. The results of the transect walk were used to finalize the survey questionnaire, which was administered by the first author with the help of local guides for translation.
The data collected were entered and cleaned in Excel and transferred into SPSS and AMOS for statistical analysis. Variables were coded into 6 or 7 Likert-type categories. A principal components analysis (PCA) was performed using varimax rotation with Kaiser normalization, following Brown [25]. Items with low factor loading values (<0.4) were removed from the analysis for consistency purposes, and acceptable factor loading values were retained (≥0.5 or >0.7), following Karrer [21]. In order to confirm that the items loaded on the same indicator (meaning they measured the same factor construct), internal consistency, or reliability, was tested using Cronbach’s alpha (∂) [26], with a cut-off value of ≥0.5 to 0.7 [21]. All items loading adequately on a factor were averaged using the recode function of SPSS to obtain an index for the factor. Items describing implementation, cost, stated preference, and effectiveness of adaptation measures loaded on two factorial constructs: (1) Water diversion and conservation techniques (water management techniques), and (2) all remaining items. Therefore, the indicator for implementation, response cost, stated preference, and response effectiveness was analyzed based only on water management techniques. The indexes were used as variables in the multivariable linear regression models. The dependent variable was implementation, the remaining were considered independent variables.

3. Results

3.1. Characteristics of Study Population

The study sample included household heads who were farmers. Of the 285 forms administered, 283 were correctly completed and included in data analysis. Descriptive statistics indicate that respondents were 35% female and 65% male; the average household size was 20. The average annual income from farming was estimated at D 15,330.95 (USD 346.44) per year. Among the respondents, 281 (99.3%) were married, 11 (0.4%) were single, and 11 (0.4%) were widows/widowers.

3.2. Principal Components Analysis

3.2.1. Risk Appraisal

A principal components analysis (PCA) of the risk appraisal variables showed the following results (see Table 1). Heavy precipitation, length of growing season, and soil water storage capacity loaded together on the first factor and were named “Factors with Decreasing Effect.” The consistency level of this factor was shown by an acceptable Cronbach’s alpha (0.707). Only one item with an increasing effect loaded on the second factor; this was named “Factor with Increasing Effect”.
The severity items loaded on one single factor with a good reliability (Cronbach’s alpha = 0.753) and the vulnerability items also loaded on a single factor with an acceptable reliability Cronbach’s alpha = 0.642) (see Table 2).

3.2.2. Coping Appraisal

The PCA for coping resulted in two rotated factors, with three items removed because of low loading scores (see Table 3). The first three items of responsibility loaded on one single factor with an acceptable Cronbach’s alpha = 0.648. Among the items measuring responsibility, “consumers are responsible” loaded highest (0.938) and the “extension workers are responsible” loaded at 0.599. The last two items measuring “ability to withstand” loaded on a single factor (∂ = 0.83).

3.2.3. Internal Multipliers and Barriers to Pro-Environmental Behavior

Internal multipliers were captured through eight items in the questionnaire. Internal barriers were captured in the questionnaire through four items. A PCA of the 12 items using varimax rotation with Kaiser normalization showed that most of the items loaded on two factors (see Table 4). Some items were removed because of low loading scores. The items of internal multipliers loaded on the first factor with alpha = 0.601, while the internal barriers loaded on the second factor with alpha = 0.671.

3.3. Correlation

Spearman’s rank correlation coefficient was used to examine the underlying relationship between the model variables in order to validate the descriptive model. Spearman’s correlation was chosen because the variables included un-ranked and numerical ordinal data [27]. The results of the analysis showed a significant, positive correlation between the farmers’ perception variables (i.e., farmers’ perception of factors with decreasing effect (e.g., rainfall, soil water storage capacity, etc.)), vulnerability and farmers’ stated implementation of adaptation measure.
Vulnerability is significantly and negatively correlated with ability to withstand. The implementation cost is positively correlated with effectiveness of water management technique and preference for water management technique, but negatively correlated with the stated implementation.

3.4. Multiple Linear Regressions

3.4.1. Significance of the Independent Variables

The multiple linear regression for stated implementation of water management techniques showed that factors that influence significantly, at a 95% confidence level, farmers’ stated implementation of water management techniques are the means of decreasing factors, ability to withstand, internal barriers, and implementation cost.
The mean of decreasing factors is an indicator of perception made up of the observed evolution of heavy precipitation, length of the growing season and soil water storage capacity. In fact, it is a factor of the risk appraisal. It has a positive beta coefficient, meaning that it has a positive effect on the stated implementation of water management techniques. The mean of ability to withstand is an indicator that measures the farmers’ ability to withstand drought and flood. In fact, it is a factor of the coping appraisal. It has a positive beta coefficient, meaning that it has a positive effect on the implementation for water management technique. The mean of internal barriers measures beliefs and mental conceptualization of the farmers about what could prevent him or her from implementing an adaptation measure. It has a positive beta coefficient, which means that it has a positive effect on the stated implementation for water management technique. The mean of implementation cost is the mean of the estimated cost associated with the implementation of water conservation techniques and water diversion techniques. It has a beta coefficient equal to −0.417, which means that it has a negative effect on the stated implementation for water management techniques.

3.4.2. Regression Fit

The regression for the stated implementation of water conservation technique has an adjusted R-square equal to 0.526. This means that 52.6% of the implementation variance is explained by the independent variable. Since 0.526 > 0.5, this regression has a strong fit [27]. The model is also significant at a 99% level of confidence (sig. F = 0.000).

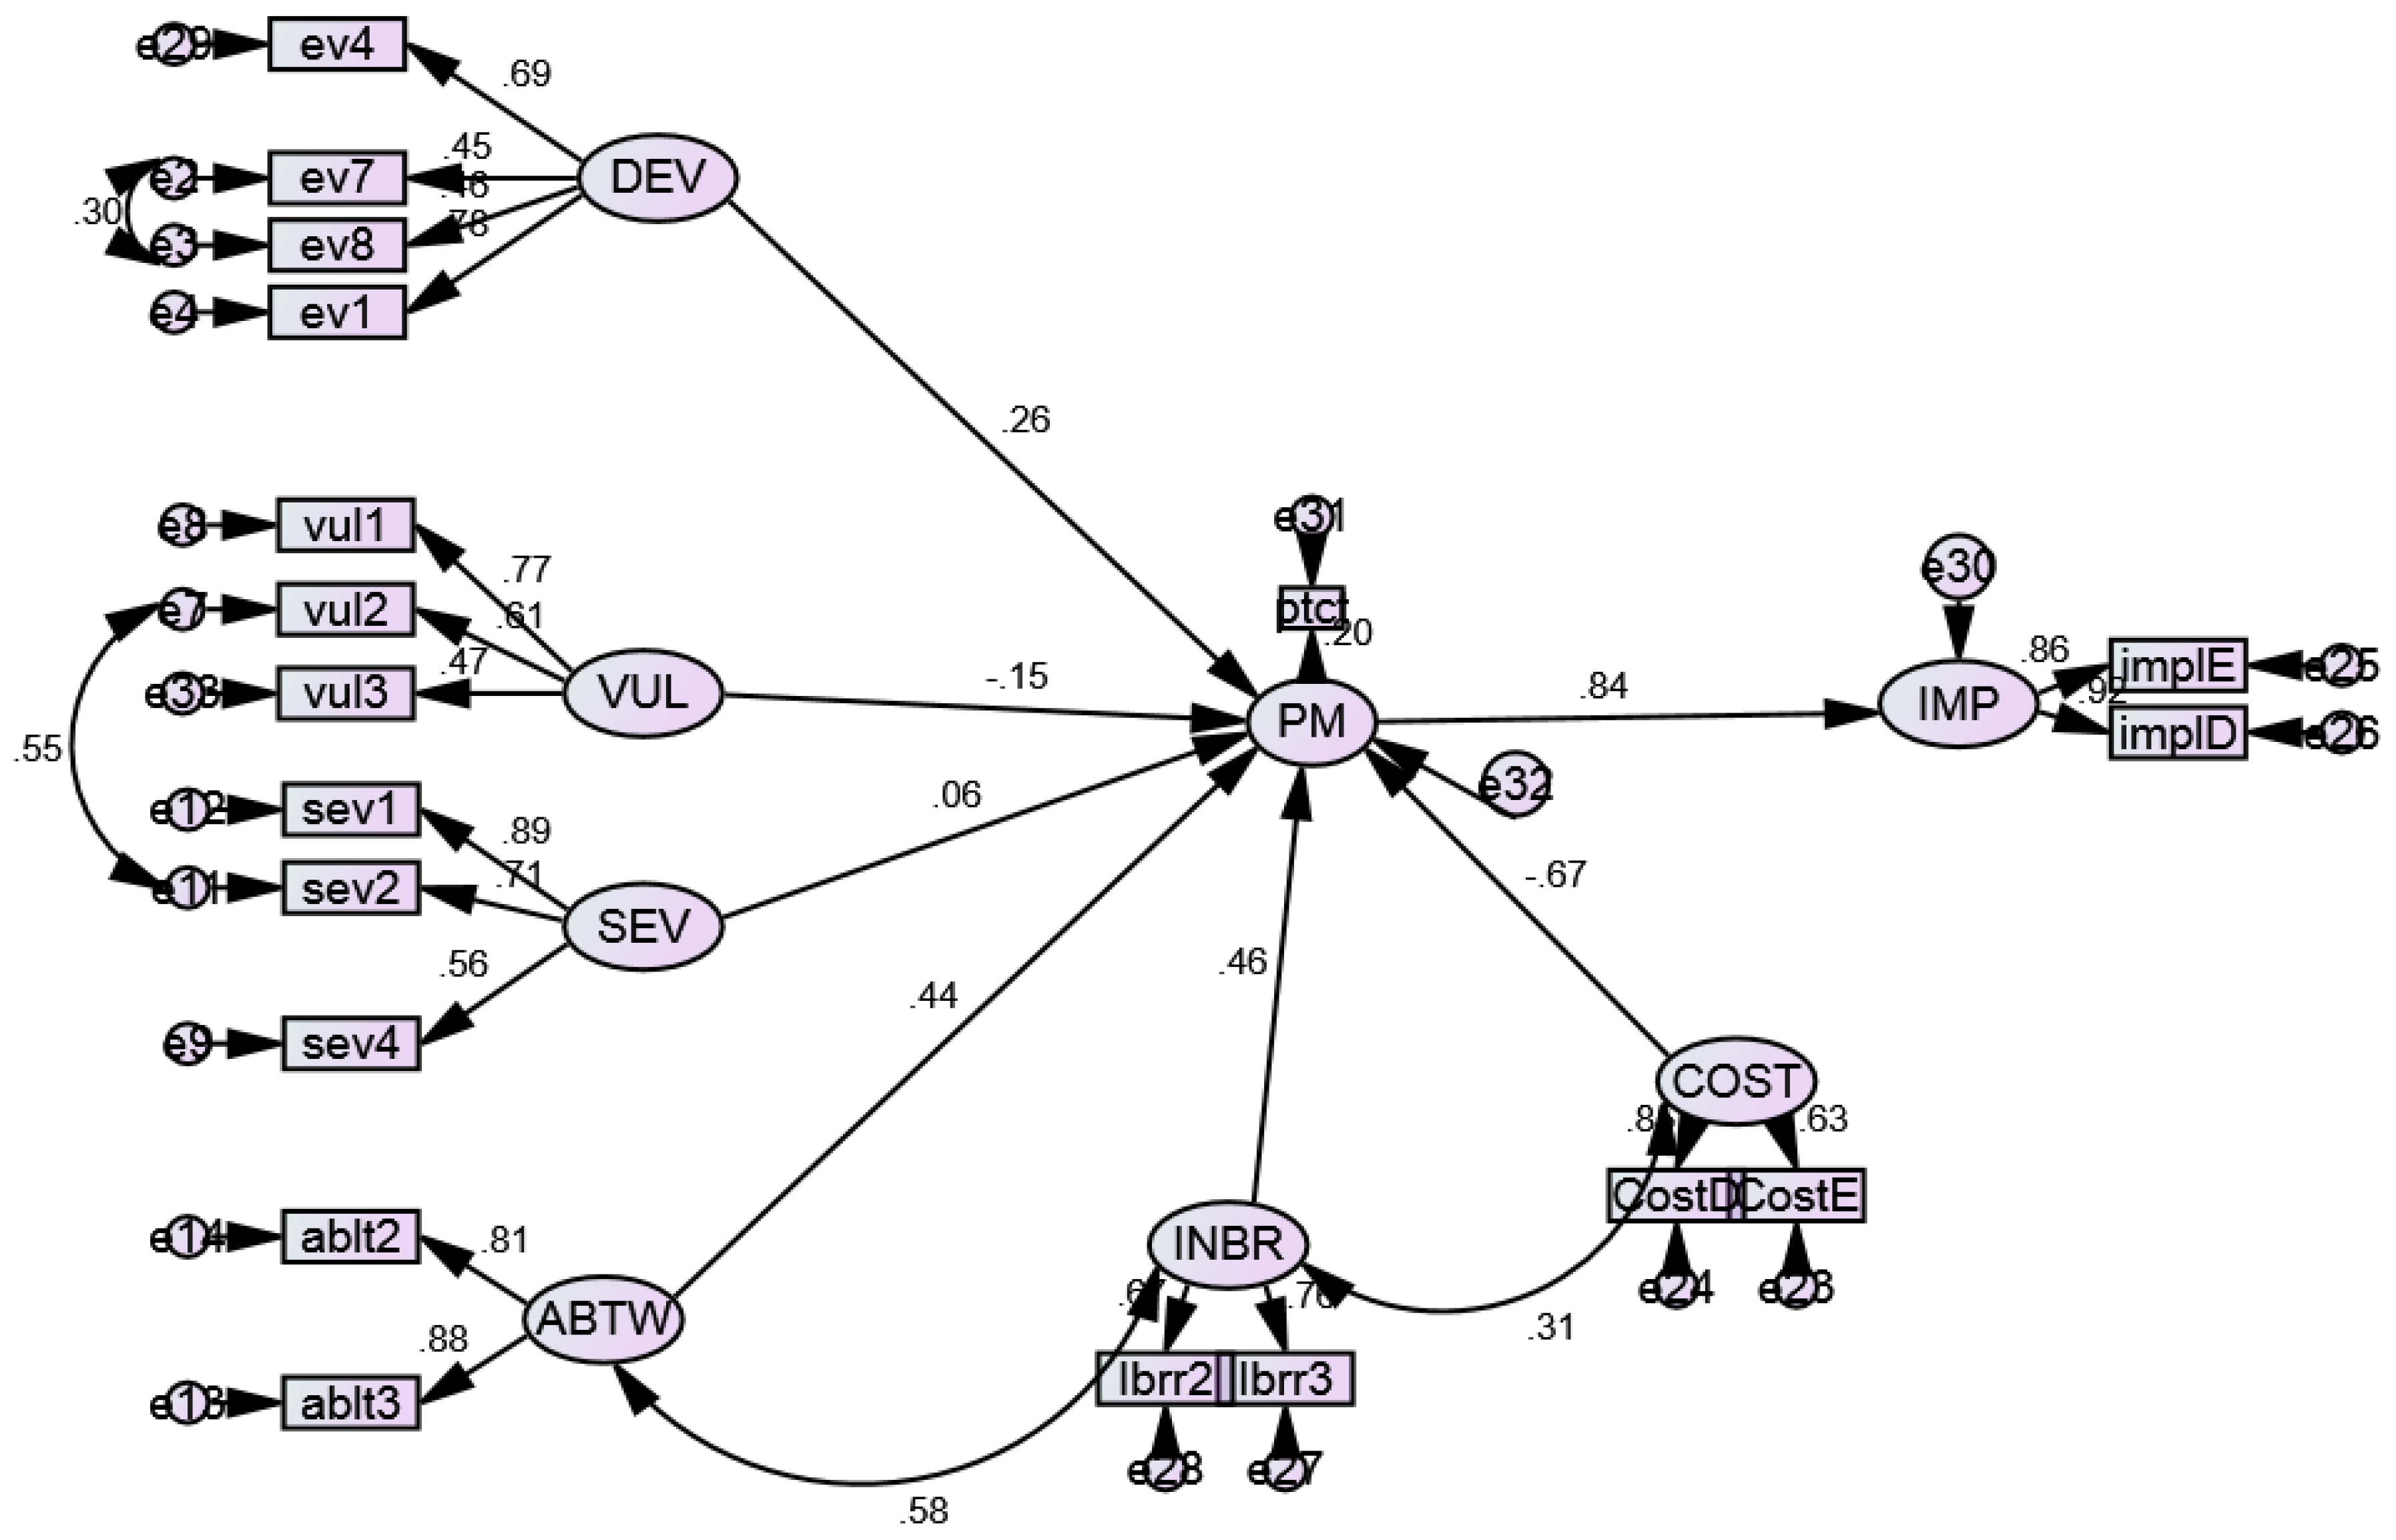
3.5. Structural Equation Modeling

The structural equation modeling was done using stated implementation as a criterion. The criterion was a factor construct (latent variable) made up of the stated implementation for water conservation measure and water diversion measure. Therefore, the criterion is called stated implementation for water management techniques. Factor analysis and Cronbach’s alpha were used to check the internal consistency of the items before combining them into one factor. The same approach was used to extract the exogenous latent variable “response cost”. The mediator variable protection motivation was measured on one single construct. The remaining exogenous latent variables were DEV, VUL, SEV, ABTW, and INBR. One of the conditions for causality effect is that the independent variables and the outcome variables should be measured at different periods. In this study, the criterion was measured in the present (i.e., under current practices), while the independent variables were measured retrospectively (based on recollections from the past 20 years).
In the structural equation modeling output (Figure 2), the rectangles represent the indicator variables, the ellipses the latent variable and the circle for errors terms. The single-headed arrow represents the specification of the causal effect. The two-headed arrow shows the correlation. The indicators represent the individual items and the latent variable represents the factorial construct. For instance, ev1 to ev8 represent the items estimating the evolution of weather factor. The latent variable “DEV” represents the factorial construct called the risk appraisal and ev1, ev4, ev7, ev8 were the items loaded in this factorial construct. The same explanation applies to vulnerability, severity, coping appraisal and internal barriers. Only protection motivation was measured with one indicator variable.
DEV: Perception of factors with decreasing effect (risk appraisal),
VUL: Vulnerability (the estimated likelihood or probability of the farmer being affected by climate hazards),
SEV: Severity (the estimated losses associated to the occurrence of the climate hazards)
ABTW: Ability to withstand (coping appraisal),
INBR: Internal barriers,
PM: protection motivation,
IMP: Stated implementation,
COST: Response cost.

3.6. Model Fit

From the literature, the common model fit indicators used by most of the researchers are the chi-square value, comparative fit index (CFI), normed fit index (NFI), non-normal fit index (NNFI) and the root mean square error of approximation (RMSEA). Following Byrne [28], in this paper, chi-square, CFI and RMSEA are used to check the goodness of fit (χ2 (143) = 394.74, CFI = 0.861, RMSEA = 0.079). The model showed a relatively good fit. The cut-off value of the RMSEA is <0.05 to 0.08 [28].

3.7. Motives and Barriers to Implementation of Adaptation Measures

Two types of factors can be distinguished among the factors that significantly influence farmers’ protection motivation and stated implementation: The factors with positive effects, meaning factors which favor farmers’ protection motivation and their stated implementation for adaptation measure (motives); and factors with negative effects, meaning factors which prevent or hinder farmers’ protection motivation and their stated implementation for adaptation measures (barriers).

3.7.1. Motives

Motives are factors with a positive contribution to protection motivation and implementation decisions. Referring to the regression of stated implementation output and the output of the structural equation modeling, the following factors can be mentioned: the risk appraisal contributes positively to protection motivation and therefore stated implementation (see Figure 2). This indicates that if farmers perceive a decrease in soil water storage capacity, a degradation of the quality of soil surface structure, or a decrease of the length of the growing season, it motivates them to protect their farm and to implement an adaptation measure (e.g., water management measures). The coping appraisal implies that if farmers perceived that they have a capacity to face climate hazards, they are motivated to protect their farm and it pushes them to implement an adaptation measure. The protection motivation shows that if farmers are motivated to protect their farms, it can lead to the implementation of an adaptation measure.

3.7.2. Barriers

Barriers are factors which negatively contribute to protection motivation and implementation decisions. The results of the stated implementation regression) showed that only two factors have a negative contribution to protection motivation and the stated implementation. Those factors were implementation cost and vulnerability. However, vulnerability is not significant at the 95% confidence level. The negative influence of the perceived implementation cost on both protection motivation and stated implementation means that an increase in the perceived implementation cost will demotivate farmers to protect their farm and therefore reduce their stated implementation.

4. Discussion

The results of the principal component analysis show that the items related to vulnerability, severity, responsibility, ability, internal multipliers and internal barriers are loaded on their respective factors. This finding is similar to results of a previous study [21]. It means that respondents were able to make the distinction between climate change terminologies such as vulnerability, severity, etc. This might be attributed to the respondents’ awareness of climate change terminologies or of the explanations given by the translator during the survey. The farmers’ risk appraisal was grouped into two factors by the PCA analysis. The above result could not be achieved with the items of risk appraisal because the factors seemed to be loaded in a first factor which gathered items with decreasing effect (e.g., rainfall, length of growing season, quality of soil surface structure, etc.) and in the second factor, which gathered items with increasing effects (e.g., storm).
The significant correlation between perception variables such as the risk appraisal, vulnerability and farmers’ stated implementation of adaptation measure (See Table 5), indicates that farmers’ perceptions seem to have influenced their stated implementation of adaptation measures. A similar study was conducted in Kenya and found a significant relationship between farmers’ perception of drought and some of the adaptation measures [29]. The negative correlation between coping appraisal and vulnerability implies that the lower the ability to withstand is, the higher the vulnerability of the farmer. The positive correlation between stated implementation, stated preference and the negative correlation between the cost and the stated implementation indicates that farmers consider a higher price technique as being more effective; thus, they prefer it.
The results of the regression confirmed that the risk appraisal and coping appraisal contribute to increased farmers’ protection motivation and stated implementation of the adaptation measure. Martin et al. [30] found that risk-mitigating behavior of homeowners is influenced by their perception of risk severity, response efficacy and self-efficacy
A study conducted in Burkina Faso revealed that farmers’ livestock and their material capability, which confers to them an ability to withstand climate variation, are determinant factors in technology adoption [31]. Internal barriers also influence stated implementation. Psychological and socio-cultural factors were found to have an influential effect on public response to climate change [32]. The implementation cost has a negative effect on stated implementation. Using protection motivation theory to predict secondary school students’ cigarette smoking in China, the response showed a negative correlation between the cost and smoking decision [33]. The cost of the adaptation measure was found to be a barrier to climate change adaptation [34,35]. Structural equation modeling showed similar results with the correlation and regression, but provided more detail. It exposed the mediating effect of protection motivation, meaning that farmers’ perception of climate change influences their stated implementation of adaptation measure through their protection motivation.
The result of the modeling showed that the stated implementation of water management techniques is directly influenced by protection motivation. This influence is strong, with a positive predictive power equal to 0.84. Protection motivation is also influenced by farmers’ perception of the risk appraisal, vulnerability, severity, coping appraisal, internal barriers and response cost. Floyd et al. [17] conducted a meta-analysis on PMT and found that the risk appraisal variables have a low influence effect when compared to the variables of coping appraisal and protection motivation, which have a strong influence on behavioral change. The result of the structural equation modeling (SEM) of the present study is in line with results of a previous meta-analysis [17]. In fact, a study conducted in Ghana revealed that the decrease in quality of soil structure, which is a factor of the risk appraisal, significantly affects farmers’ adaptation capacity [36]. The risk appraisal and the coping appraisal variables were expected to have a positive influence on protection motivation and stated implementation. Internal barriers and response costs were expected to have a negative influence on protection motivation and stated implementation. Bockarjova and Steg [20] found similar results about the cost when using PMT to explain the adoption of electric vehicles in The Netherlands.
The factors influencing farmers’ stated implementation are divided into motives and barriers. Eisenack et al. [37] stated that factors which constrain or prevent farmers from implementing an adaptation measure are called barriers. Similarly, factors which favor or motivate farmers to implement an adaptation measure are called motives. In fact, a farmers’ perception of the risk appraisal motivates them to adopt an adaptation measure. Martin et al. [30] reported similar results in their study. A farmers’ perceived coping appraisal motivates them to implement an adaptation measure. Similar studies conducted in the Netherlands and Vietnam showed that behavioral factors, such as perceived threat and ability, significantly influence farmers’ adaptation behaviors [38,39]. Similar to this study, the risk appraisal and ability to withstand were found to have a positive effect on the intention to adopt a recommended measure [40]. The implementation cost seems to be the main barrier, since it was found in the results of the correlation, regression and SEM. This finding is supported by results of a previous study [41]. According to Yameogo, et al. [42], credit constraint and climate risk seem to be a barrier to a farmers’ ability and willingness to adopt climate-smart agriculture (CSA) practices, which is an approach that helps to guide actions needed to transform and reorient agricultural systems to effectively support development and ensure food security in a changing climate. CSA simultaneously tackles three main issues: (i) Sustainably increasing agricultural productivity and incomes; (ii) adapting and building resilience to climate change; and (iii) reducing and/or removing greenhouse gas emissions, where possible [43]. Vulnerability had a negative influence when it was expected to have a positive influence, but that is not unusual since a meta-analysis showed that in some studies vulnerability had a negative influence on protection motivation and behavioral change [17]. An explanation for such a situation is that when individuals feel particularly vulnerable to a threat, they may experience a high level of anxiety and thereby engage in maladaptive coping responses to deal with the anxiety associated with the threat (e.g., denial, avoidance, trusting that God will provide protection [44]). In the Gambian case, the latter explanation seems to fit best the reality because most of the farmers think that climate change is God made, therefore the real solutions come from God. But in this study, vulnerability is not significant at a 95% confidence level for both regression and structural equation modeling. This finding is in line with another meta-analysis [17]. The cost of the adaptation measure was found to have a relatively strong and significant influence on both protection motivation and stated implementation. The internal barriers (cultural) were found to be determinants for adaptation technology adoption [45]. But in this study, internal barriers were expected to influence negatively protection motivation, while it showed a positive influence. A possible explanation of this situation is social desirability, meaning that respondents might not want to reveal their negative thinking and wanted to look good by always making positive statements. Severity showed the expected influence, meaning that it positively influenced the protection motivation and stated implementation. However, severity was not significant at a 95% confidence level.

5. Conclusions

The present study was conducted in the Central River Region of The Gambia. Farmers in this region perceive changes in climate patterns, especially rainfall, temperature, and quality of soil structure. Farmers’ perception of changes in the climate positively influences their protection motivation, while the cost of adaptation measures negatively affects their protection motivation. In return, protection motivation positively influences the implementation decision. Consequently, farmers’ perception of climate change threat contributes to motivate them to implement an adaptation measure. Therefore, the protection motivation theory, which stipulates that individuals turn to protect themselves when they are faced with a health threat, can explain farmers’ adaptation decision making in the Central River Region of The Gambia. In fact, when farmers are faced with climate change threats, they turn to protect their farm by implementing some adaptation measures. This study suggests that climate change adaptation policies should first seek to promote farmers’ awareness of climate change; second, to reduce the cost of climate change adaptation measures; and finally, to strengthen farmers’ ability to implement measures through training and capacity building. Since farmers in this region perceived a decrease in the quality of the soil surface structure and a decrease in rainfall quantity, the promotion of conservation agriculture could be a way to strengthen farmers’ resilience and improve food security in The Gambia.

Author Contributions

A.R.B. conceived the paper rationale, carried out data collection and analysis and drafted the paper; W.M.F. and M.S. supervised data collection and contributed to the writing of the first draft; I.O. and A.W. contributed to the writing of the first draft, data interpretation, discussion and review. All authors participated in writing the final draft.

Funding

We received fund on field work from the German Federal Ministry of Education and Research (BMBF).

Acknowledgments

The study was conducted for the West African Science Service Centre on Climate Change and Adapted Land Use (www.wascal.org (http://www.wascal.org/)). I’d like to thank the Agricultural Station of Kountaur and Sapu in The Gambia for their support during the field work.

Conflicts of Interest

The authors declare no conflict of interest.

References

  1. Intergovernmental Panel on Climate Change (IPCC). Climate Change 2013: The Physical Science Basis. Contribution of Working Group I to the Fifth Assessment Report of the Intergovernmental Panel on Climate Change; Cambridge University Press: Cambridge, UK; New York, NY, USA, 2013; p. 1535. [Google Scholar]
  2. Intergovernmental Panel on Climate Change (IPCC). Climate Change 2007: Impacts, Adaptation and Vulnerability. Contribution of Working Group II to the Fourth Assessment Report of the Intergovernmental Panel on Climate Change; Parry, M.L., Canziani, O.F., Palutikof, J.P., van der linden, P.J., Hanson, C.E., Eds.; Cambridge University Press: Cambridge, UK, 2007; p. 976. [Google Scholar]
  3. Cooper, P.J.M.; Dimes, J.; Rao, K.P.C.; Shapiro, B.; Shiferaw, B.; Twomlow, S. Coping better with current climatic variability in the rain-fed farming systems of sub-saharan Africa: An essential first step in adapting to future climate change? Agric. Ecosyst. Environ. 2008, 126, 24–35. [Google Scholar] [CrossRef]
  4. Jones, P.G.; Thornton, P.K. The potential impacts of climate change on maize production in Africa and Latin America in 2055. Glob. Environ. Chang. 2003, 13, 51–59. [Google Scholar] [CrossRef]
  5. Adger, W.N.; Huq, S.; Brown, K.; Conway, D.; Hulme, M. Adaptation to climate change in the developing world. Prog. Dev. Stud. 2003, 3, 179–195. [Google Scholar] [CrossRef] [Green Version]
  6. Yaffa, S. Coping measures not enough to avoid loss and damage from drought in the north bank region of the gambia. Int. J. Glob. Warm. 2013, 5, 467–482. [Google Scholar] [CrossRef]
  7. Kibue, G.W.; Liu, X.; Zheng, J.; Zhang, X.; Pan, G.; Li, L.; Han, X. Farmers’ perceptions of climate variability and factors influencing adaptation: Evidence from anhui and Jiangsu, China. Environ. Manag. 2016, 57, 976–986. [Google Scholar] [CrossRef] [PubMed]
  8. Adesina, A.A.; Baidu-Forson, J. Farmers’ perceptions and adoption of new agricultural technology: Evidence from analysis in Burkina Faso and Guinea, West Africa. Agric. Econ. 1995, 13, 1–9. [Google Scholar] [CrossRef]
  9. Ouedraogo, I.; Diouf, N.S.; Ouédraogo, M.; Ndiaye, O.; Zougmoré, R. Closing the gap between climate information producers and users: Assessment of needs and uptake in Senegal. Climate 2018, 6, 13. [Google Scholar] [CrossRef]
  10. Deressa, T.T.; Hassan, R.M.; Ringler, C. Perception of and adaptation to climate change by farmers in the Nile basin of Ethiopia. J. Agric. Sci. 2011, 149, 23–31. [Google Scholar] [CrossRef]
  11. Maddison, D. The Perception of and Adaptation to Climate Change in Africa; The World Bank: Washington, DC, USA, 2007; p. 53. [Google Scholar]
  12. Thomas, D.S.G.; Twyman, C.; Osbahr, H.; Hewitson, B. Adaptation to climate change and variability: Farmer responses to intra-seasonal precipitation trends in South Africa. Clim. Chang. 2007, 83, 301. [Google Scholar]
  13. Apata, T. Factors influencing the perception and choice of adaptation measures to climate change among farmers in Nigeria. Environ. Econ. 2011, 2, 74–83. [Google Scholar]
  14. Deressa, T. Analysis of Perception and Adaptation to Climate Change in the Nile Basin of Ethiopia; Centre for Environmental Economics and Policy for Africa (CEEPA), University of Pretoria: Pretoria, South Africa, 2008. [Google Scholar]
  15. Mandleni, B.; Anim, F. Climate Change Awareness and Decision on Adaptation Measures by Livestock Farmers. In Proceedings of the 85rd Annual Conference of the Agricultura Economics Society, Coventry, UK, 18–20 April 2011; p. 26. [Google Scholar]
  16. Okonya, J.S.; Kroschel, J. Gender differences in access and use of selected productive resources among sweet potato farmers in Uganda. Agric. Food Secur. 2014, 3, 1. [Google Scholar] [CrossRef] [Green Version]
  17. Floyd, D.L.; Prentice-Dunn, S.; Rogers, R.W. A meta-analysis of research on protection motivation theory. J. Appl. Soc. Psychol. 2000, 30, 407–429. [Google Scholar] [CrossRef]
  18. Tanner, J.F.; Day, E.; Crask, M.R. Protection motivation theory an extension of fear appeals theory in communication. J. Bus. Res. 1989, 19, 267. [Google Scholar]
  19. Cismaru, M.; Cismaru, R.; Ono, T.; Nelson, K. “Act on climate change”: An application of protection motivation theory. Soc. Mark. Q. 2011, 17, 62–84. [Google Scholar] [CrossRef]
  20. Bockarjova, M.; Steg, L. Can protection motivation theory predict pro-environmental behavior? Explaining the adoption of electric vehicles in The Netherlands. Glob. Environ. Chang. 2014, 28, 276–288. [Google Scholar] [CrossRef]
  21. Karrer, S.L. Swiss Farmers’ Perception of and Response to Climate Change; ETH Zurich: Zürich, Switzerland, 2012. [Google Scholar]
  22. GBOS. Households and Population by Lga, District and Settlement; Gambia Buro of Statiatics: Serrekunda, Gambia, 2013; p. 93.
  23. Kadlec, T.; Tropek, R.; Konvicka, M. Timed surveys and transect walks as comparable methods for monitoring butterflies in small plots. J. Insect Conserv. 2012, 16, 275–280. [Google Scholar] [CrossRef]
  24. Rogers, R.W. Cognitive and psychological processes in fear appeals and attitude change: A revised theory of protection motivation. In Social Psychophysiology: A Sourcebook; Guilford Press: New York, NY, USA, 1983; pp. 153–176. [Google Scholar]
  25. Brown, J.D. Choosing the Right Type of Rotation in PCA and EFA, 3rd ed.; University of Hawai‘i at Manoa: Honolulu, HI, USA, 2009; p. 25. [Google Scholar]
  26. Tang, W.; Cui, Y.; Babenko, O. Internal consistency: Do we really know what it is and how to assess it. J. Psychol. Behav. Sci. 2014, 2, 205–220. [Google Scholar]
  27. Muijs, D. Doing Quantitative Research in Education with SPSS; Sage: London, UK, 2011; p. 243. [Google Scholar]
  28. Byrne, B.M. Structural Equation Modeling with AMOS: Basic Concepts, Applications, and Programming; Routledge: Abingdon, UK, 2016. [Google Scholar]
  29. Ogalleh, S.; Vogl, C.; Eitzinger, J.; Hauser, M. Local perceptions and responses to climate change and variability: The case of Laikipia District, Kenya. Sustainability 2012, 4, 3302–3325. [Google Scholar] [CrossRef]
  30. Martin, I.M.; Bender, H.; Raish, C. What motivates individuals to protect themselves from risks: The case of wildland fires. Risk Anal. 2007, 27, 887–900. [Google Scholar] [CrossRef]
  31. Ouedraogo, S.R. Intensification Agricole par les Fertilisants Chimiques et les Semences Ameliorees Dans le Centre-Nord du Burkina FASO: Influence des Facteurs Institutionnels. série Sci. Econ. Gest. 2013, 7, 131–164. [Google Scholar]
  32. Leiserowitz, A. Climate change risk perception and policy preferences: The role of affect, imagery, and values. Clim. Chang. 2006, 77, 45–72. [Google Scholar] [CrossRef]
  33. MacDonell, K.; Chen, X.; Yan, Y.; Li, F.; Gong, J.; Sun, H.; Li, X.; Stanton, B. A protection motivation theory-based scale for tobacco research among chinese youth. J. Addict. Res. Ther. 2013, 4, 154. [Google Scholar] [CrossRef] [PubMed]
  34. Bryan, E.; Deressa, T.T.; Gbetibouo, G.A.; Ringler, C. Adaptation to climate change in ethiopia and south africa: Options and constraints. Environ. Sci. Policy 2009, 12, 413–426. [Google Scholar] [CrossRef]
  35. Ndamani, F.; Watanabe, T. Farmers’ perceptions about adaptation practices to climate change and barriers to adaptation: A micro-level study in ghana. Water 2015, 7, 4593–4604. [Google Scholar] [CrossRef]
  36. Fosu-Mensah, B.; Vlek, P.; Maccarthy, D. Farmers’ perception and adaptation to climate change: A case study of sekyedumase district in Ghana. Environ. Dev. Sustain. 2012, 14, 495–505. [Google Scholar] [CrossRef]
  37. Eisenack, K.; Moser, S.C.; Hoffmann, E.; Klein, R.J.; Oberlack, C.; Pechan, A.; Rotter, M.; Termeer, C.J. Explaining and overcoming barriers to climate change adaptation. Nat. Clim. Chang. 2014, 4, 867. [Google Scholar] [CrossRef]
  38. Le Dang, H.; Li, E.; Nuberg, I.; Bruwer, J. Understanding farmers’ adaptation intention to climate change: A structural equation modelling study in the Mekong Delta, Vietnam. Environ. Sci. Policy 2014, 41, 11–22. [Google Scholar] [CrossRef]
  39. Van Duinen, R.; Filatova, T.; Geurts, P.; van der Veen, A. Coping with drought risk: Empirical analysis of farmers’ drought adaptation in the south-west Netherlands. Reg. Environ. Chang. 2015, 15, 1081–1093. [Google Scholar] [CrossRef]
  40. Maddux, J.E.; Rogers, R.W. Protection motivation and self-efficacy: A revised theory of fear appeals and attitude change. J. Exp. Soc. Psychol. 1983, 19, 469–479. [Google Scholar] [CrossRef]
  41. Keshavarz, M.; Karami, E. Farmers’ pro-environmental behavior under drought: Application of protection motivation theory. J. Arid Environ. 2016, 127, 128–136. [Google Scholar] [CrossRef]
  42. Yameogo, T.; Emma, P.; Bontogho, K.; Torou, B.M.; Rasmane Bagagnan, A.; Barry, B. Barriers to Uptake of Climate-Smart Agriculture Practices: A Case Study of Dano and Ouahigouya Farmers, Burkina FASO. Int. J. Agric. Environ. Res. 2017, 3, 3409–3428. [Google Scholar]
  43. Zougmoré, R.; Partey, S.; Ouédraogo, M.; Omitoyin, B.; Thomas, T.; Ayantunde, A.; Ericksen, P.; Said, M.; Jalloh, A. Toward climate-smart agriculture in West Africa: A review of climate change impacts, adaptation strategies and policy developments for the livestock, fishery and crop production sectors. Agric. Food Secur. 2016, 5, 26. [Google Scholar] [CrossRef]
  44. Conner, M.; Norman, P. Predicting Health Behaviour; McGraw-Hill Education (UK): London, UK, 2005. [Google Scholar]
  45. Nielsen, J.Ø.; Reenberg, A. Cultural barriers to climate change adaptation: A case study from northern burkina faso. Glob. Environ. Chang. 2010, 20, 142–152. [Google Scholar] [CrossRef]
Figure 1. Study area map.
Climate 07 00013 g001
Figure 2. Structural equation model output.
Climate 07 00013 g002
Table 1. Principal components analysis (PCA) and factor reliability for extreme weather and production factors.
ItemsnFactorsCronbach’s Alpha
12
Heavy Precipitation2830.7390.3640.707
Length of growing season2830.736−0.310
Soil Water storage capacity2830.716−0.026
Longer Precipitation period2830.6520.346
Quality of soil surface structure2830.504−0.402
storm2830.0330.753
Table 2. Rotated factors loading and factors reliability for Vulnerability and Severity Items.
ItemsnFactorsCronbach’s Alpha
12
More yield losses due to dryness severity2830.8130.0640.753
Increase of plant disease severity2830.7820.059
More Yield losses due to heat stress severity2830.7270.218
Increase of animal disease severity2830.6980.025
More yield losses due to dryness vulnerability2830.0440.7460.642
More yield losses due to heat stress vulnerability2830.0100.745
Increase of animal disease vulnerability2830.1210.715
Increase of plant diseases vulnerability2830.1240.561
Table 3. Rotated factors loading and reliability for responsibility and ability.
VariablesnFactorsCronbach’s Alpha
12
Consumers are responsible2830.938−0.0590.648
Government is responsible2830.919−0.052
Extension workers are responsible 2830.5990.135
I feel I am in the position to withstand the effect of a flood in case it occurs283−0.0240.9240.83
I feel I am in the position to withstand the effect of drought in case it occurs2830.0710.919
Table 4. Rotated factors loading and reliability for internal multipliers and barriers to pro-environmental behavior.
ItemsnFactorsCronbach’s Alpha
12
I feel a personal bond with things in my natural surroundings like trees or certain tracts of land2830.680−0.1470.601
I collect herbs, mushrooms or wild fruit2830.6260.059
I am very attached to my farm2830.617−0.078
I get more satisfaction out of visiting my farm than visiting any other farm2830.593−0.377
Using new farming methods are bad for our culture2830.1170.7510.671
Nature can adapt itself to changes so no need for intervention283−0.0040.730
Table 5. Spearman correlation between perception variables and stated implementation.
123456789101112
1Mean of decreasing factors
2Mean of severity−0.0501
3Mean of vulnerability−0.178 **0.202 **1
4Mean of responsibility0.127 *0.133 *−0.0541
5Mean of ability to withstand0.205 **−0.044−0.188 **0.0151
6Mean of internal multipliers−0.132 *0.0430.244 **−0.0030.0081
7Mean of internal barriers0.281 **−0.141−0.232 **−0.0270.440 **−0.1161
8Protection motivation0.0080.117 *−0.062−0.178 **0.192 **0.230 **−129 *1
9Implementation cost of water management technique0.215 **−0.1430.1100.0990.129 *0.237 **0.248 **−0.0451
10Effectiveness of water management technique0.760.0500.0300.0760.233 *0.117 *0.121 *−0.0090.3021
11Preference of water management technique−0.017−0.0900.089−0.210.177 **0.385 **0.121 *0.0760.3980.464 **1
12Implementation of water management recoded0.287 **0.073−0.298−0.0570.534−0.262 **0.468 **0.231 **−0.1850.108−0.0431
**. Correlation is significant at the 0.01 level (2-tailed). *. Correlation is significant at the 0.05 level (2-tailed).

