Study of the Lower Stratospheric Temperature over the Arabian Peninsula


1
Astronomy, Space Science and Meteorology Department, Faculty of Science, Cairo University, P.O. Box 12613, Giza 12613, Egypt
2
Department of Meteorology, King Abdulaziz University, P.O. Box 80208, Jeddah 21589, Saudi Arabia
*
Author to whom correspondence should be addressed.
Climate 2019, 7(4), 54; https://0-doi-org.brum.beds.ac.uk/10.3390/cli7040054
Submission received: 1 March 2019
/
Revised: 27 March 2019
/
Accepted: 1 April 2019
/
Published: 8 April 2019
Abstract
:Given the current concerns about climate change, particularly, the stratospheric temperature effect on climatic surface temperature, it is of fundamental importance to investigate the impact of the lower stratospheric temperature on regional climate. This paper examines the lower stratospheric temperature (LST) at 50 hPa in the winter season and its relation to the surface air temperature (ST) over the Arabian Peninsula in the period 1951–2016. Generally, LST had an insignificant decreasing trend over the entire period, with a relatively high standard deviation of 1.3 °C. According to the coefficient of variability (COV), the fluctuation in the LST from year to year is relatively high, especially in the last reference period (1981–2010). An insignificant increasing (0.05 °C per year) trend through the period between 1951 and 1992 was observed, while an insignificant decreasing (−0.05 °C per year) trend was observed during the second period of 1993–2016. From the spectral analysis, the periodicity cycles of LST time series at periods of about 2.2, 2.54, and 13.2 years with respect to the 95% significance confidence level were found. LST may be influenced by quasi-biennial oscillation and the sunspot cycle. A strong relationship was found between LST and ST over the Arabian Peninsula.
1. Introduction
Recently, researchers have become aware of the importance of stratospheric temperature in the climate system. Study of the stratospheric temperature is one of the important components of global climate change. Studies of [1,2] reveal that changes in the tropospheric temperature and/or changes in the stratospheric temperature provide insights into their effects on these mechanisms, which induce climate change [3,4]. Based on satellite data in the 1990s, the mean annual lower and middle stratospheric temperatures decreased [5]. In addition, based on observed data from satellite and radiosondes, it was found that, globally, the troposphere has warmed and the stratosphere has cooled since the mid-20th century [6]. Manabe and Strickler; Simmons et al. [7,8] found that tropospheric warming and stratospheric cooling are affected by increasing stratospheric water vapor. Variations in temperature within the stratosphere are important for estimating trends [9] and changes in stratospheric ozone [4,10,11,12]. These studies concluded that, as a global mean, the upper stratosphere and lower mesosphere cooled at a rate of at least 2 K/decade between 1980 and 2000, and the lower stratosphere cooled at approximately half to one K per decade while the cooling rate of the mid-stratosphere was approximately 0.5 K/decade. Over a similar period, the magnitude of mean stratospheric temperature trends was approximately −0.2 K/decade, which is closely related to the magnitude of trends in the global mean surface temperature (e.g., [2]).
Holton and Tan [13] determined that polar stratospheric temperature tends to be warmer in the easterly phase of the quasi-biennial oscillation compared to the westerly phase during the winter season. Numerous scientists, such as [14,15], have studied the impact of the quasi-biennial oscillation on the lower stratosphere of the tropics. Randel and Gaffen [16] used a one-dimensional model to detect the effect of the quasi-biennial oscillation on the lower stratosphere. Hood and Soukharev; Labitzke [17,18] proposed that in winter, the sun affects the strength of the Arctic Oscillation in the stratosphere. Solar variability caused by the 11-year sunspot cycle has a predictable impact on the stratosphere [19]. In addition, the easterly quasi-biennial oscillation and strong solar activity tend to make the stratospheric polar vortex warmer [20,21]. Stratospheric processes, e.g., [22], may influence climatic variability in the troposphere. On interannual timescales, ref. [23] demonstrated that the stratospheric quasi-biennial oscillation may affect surface climatic parameters [24]. Thompson et al. [25] suggested that stratospheric processes play an important role in adjusting the tropospheric reaction to solar forcing and El Nino Southern Oscillation changes [26]. The cooling trend in the lower stratospheric temperature has the strongest impact in the Indo-Pacific warm pool, but it is the lowest within the central and western Pacific in boreal winter [27]. Garfinkel et al. [28] proposed that the heating due to moist processes in the troposphere lead to the lower stratosphere’s cooling.
2. Data and Methodology
2.1. Data
The data used in this study include the stratospheric temperature at 50 hPa (LST), zonal wind at 50 hPa, and 2 m surface air temperature (ST) for the wintertime (from December to February) in the period 1951–2016. These data were obtained from the National Centers for Environmental Prediction (NCEP) and the National Center for Atmospheric Research (NCAR) reanalysis product [29,30]. Quasi-biennial oscillation (QBO) was calculated at the Physical Sciences Division (PSD-NCEP/NCAR) from the zonal average of the 30 hPa zonal wind at the equator. Sunspot number time series were obtained from SILSO, World Data Center—Sunspot Number and Long-Term Solar Observations, Royal Observatory of Belgium, (online Sunspot Number catalog: http://www.sidc.be/SILSO/, ‘year(s)-of-data’). The borders of the Arabian Peninsula are well-established [31]. Arabian Peninsula: a peninsula between the Red Sea and the Arabian Gulf. Peninsular region: southwest Asia with its offshore islands, covering about 2.6 million km2. It is located in the subtropical belt between 12° N, 35° N, 30° E, and 60° E, and connects Asia with Africa (Figure 1).
2.2. Methodology
Regression method with least squares [32] was used to derive a linear trend and evaluate the temperature variations in climate change. Regarding the data of the lower stratospheric temperature time series (Figure 2), one can find that the temperature was gradually increased until the beginning of the 1990s, then decreased to the end of the period. Therefore, for the trend analysis of the wintertime stratospheric temperature over Arabian Peninsula, the entire analysis period (1951–2016) was divided into two phases: the first half is from 1951 to 1992 and the second from 1993 to 2016. Correlation and principal component analysis can be used to access teleconnection patterns [33]. These methods, which possess both advantages and disadvantages, are broadly applied in climate research. The correlation method is the most straightforward of these methods [34]. Many natural physical systems are characterized by lead–lag relationships and play a crucial role in the study of the correlation between time series [35]. Cross-correlation of lead–lag is often used to explore physical mechanisms that could participate in the Arabian Peninsula’s temperature changes. Average value change could be expressed as the coefficient of variations (COV), as , where is the average value and is the reference period standard deviation. The COV was used to evaluate the stability of the temperature regime at lower stratospheric temperature (LST). Moreover, the COV is an indicator of the reliability of the average. The average is less reliable when the COV is high, but more reliable when the COV is low. Also, changes in COV show a change in the mean value. It is worth noting that the best spectral explanation and the best autocorrelation explanation are closely linked to Fourier transform [36]. Broersen; Priestley [36,37] provided the foundation for calculation of the LST time series power spectrum. Markov red noise theory and 2-tests were used for testing the statistical confidence of power spectra [38].
3. Results and Discussion
3.1. Lower Stratospheric Temperature Changes
3.1.1. Trend Analysis
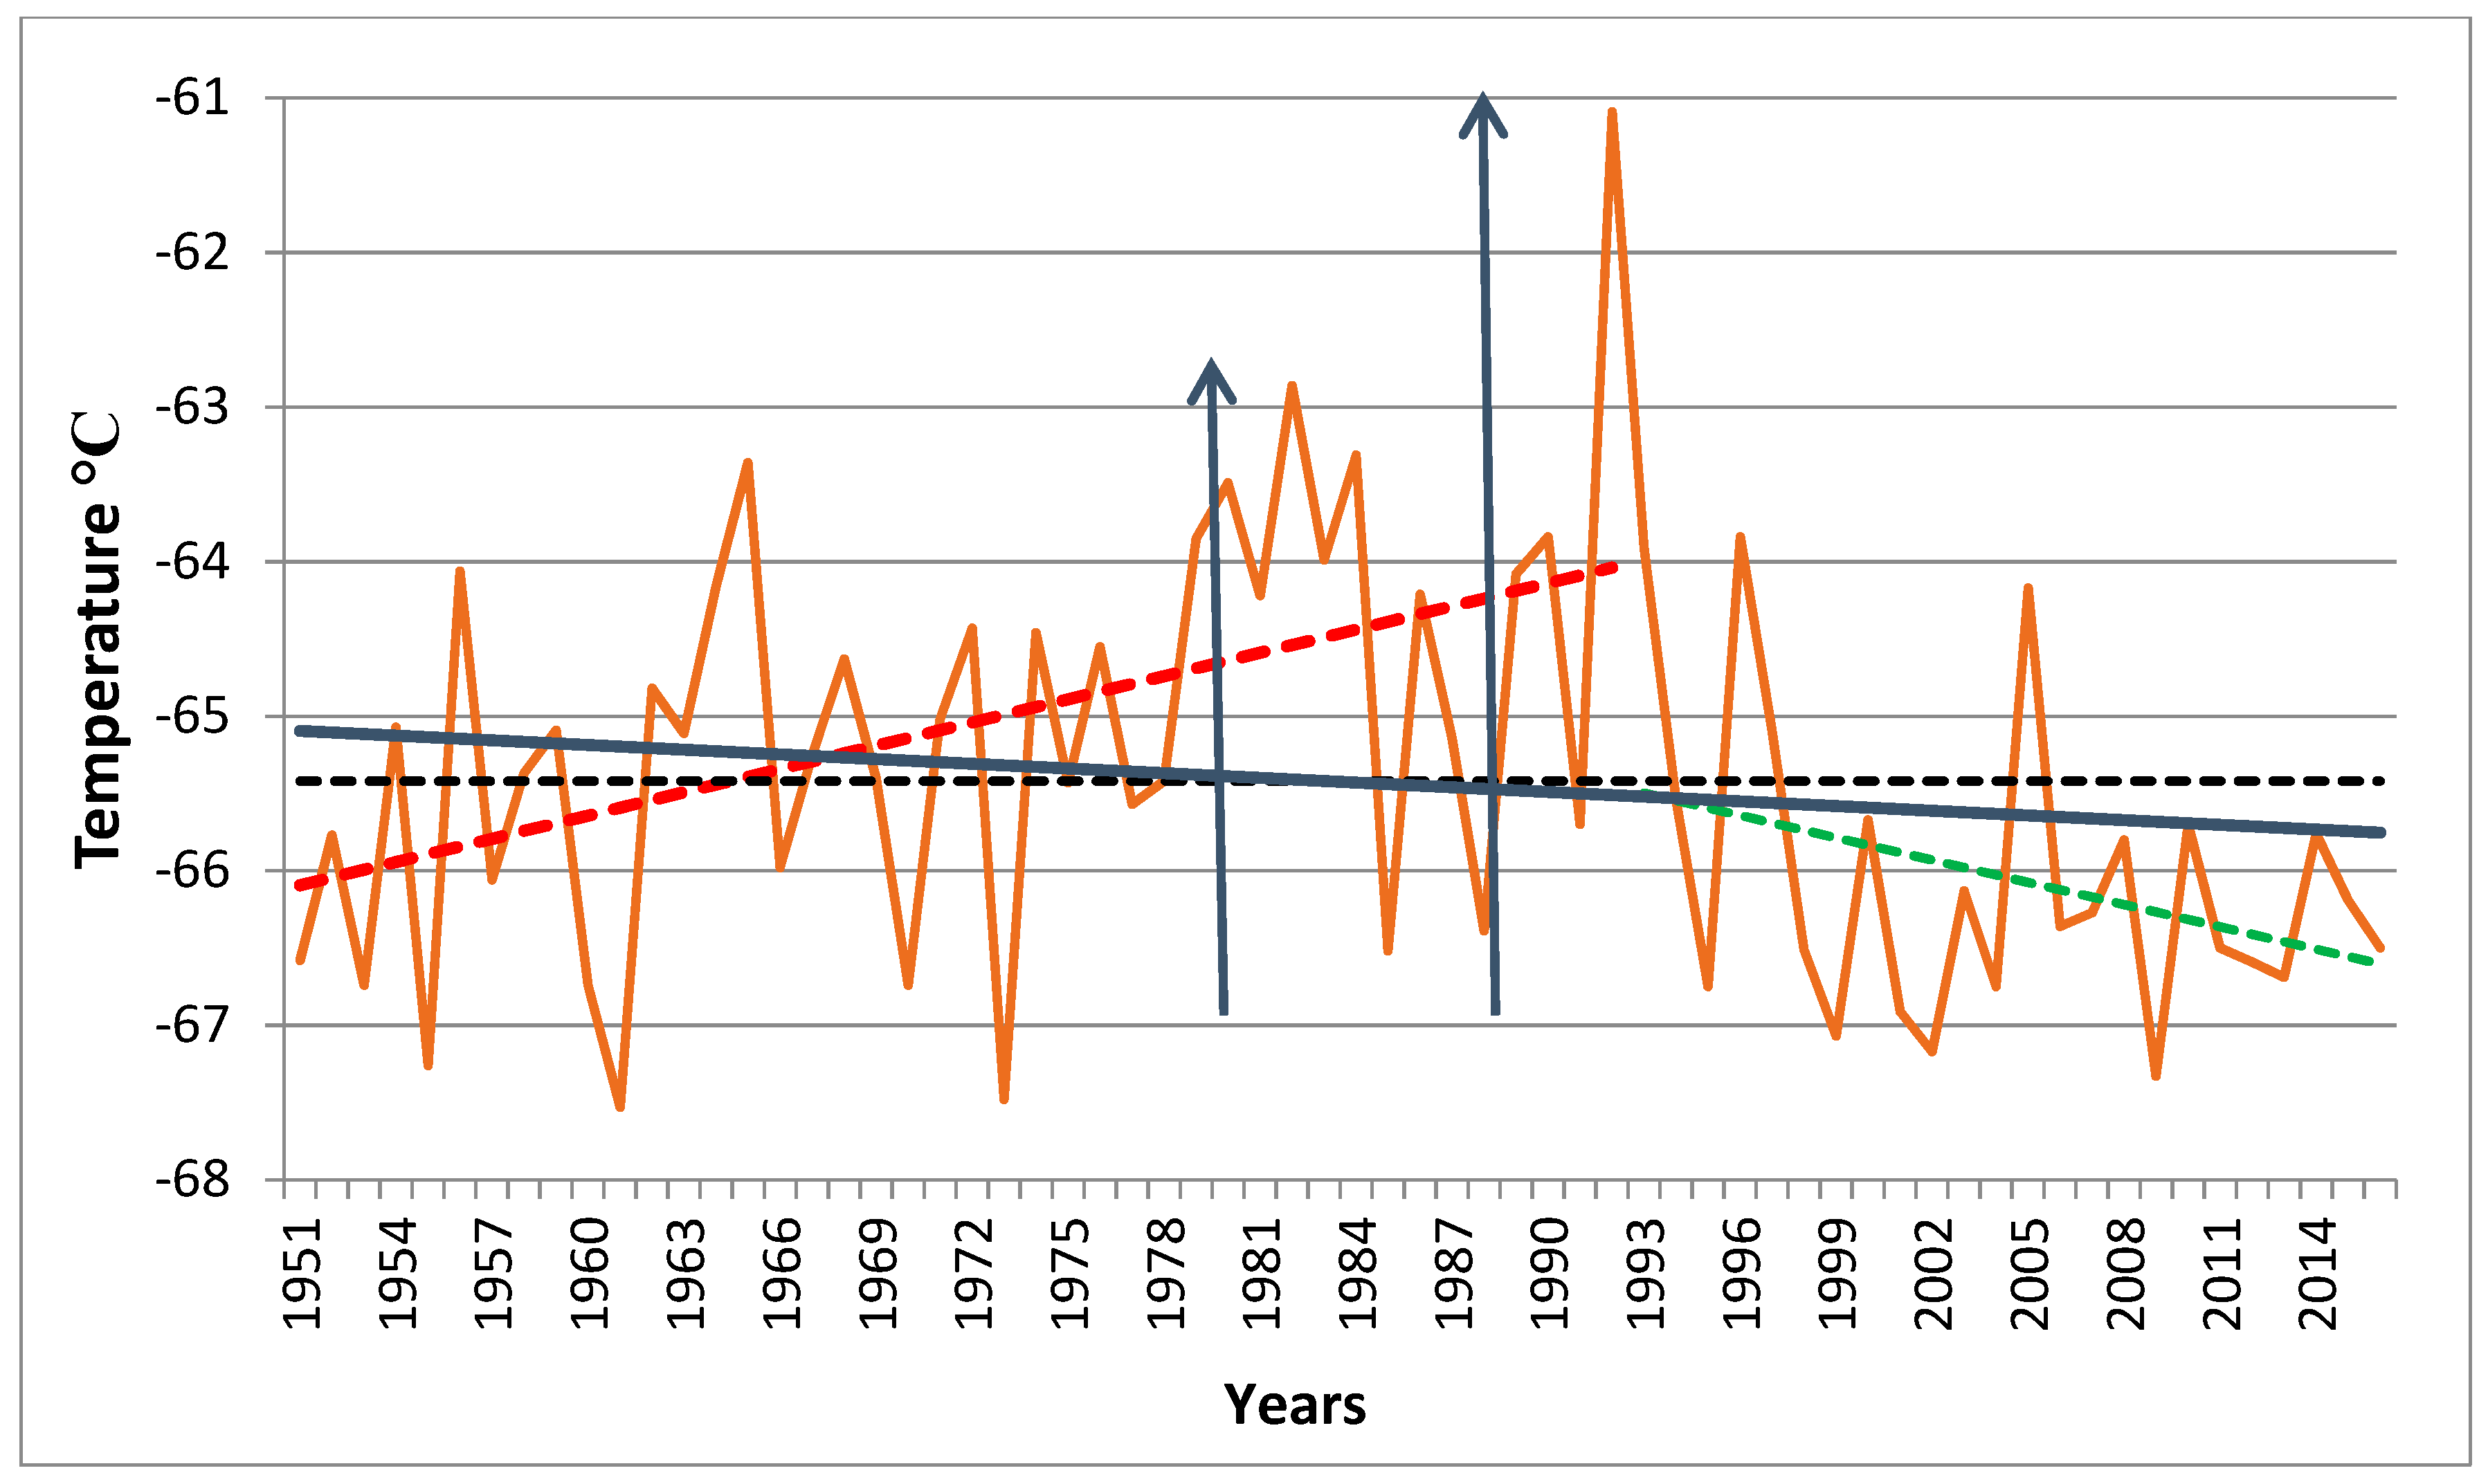
In wintertime, averages of the lower stratospheric temperature at 50 hPa (LST) were calculated and plotted for the period 1951–2016 (Figure 2). The mean LST value was −65.42 °C for the entire period, but the variation of LST was unclear for any specific year. The time series of the LST in the period 1951–2016 is displayed in Figure 2, accompanied by the findings of the linear trend analysis. In general, an insignificant decreasing trend (−0.01 °C) of the winter LST during the whole period (1951–2016) was found, with a comparatively large standard deviation of 1.3 °C. This cooling over 66 years could not well-described as a linear trend, due to the increased cooling since 1993. As stated in Section 2 of this study, the total period of analysis was categorized into two phases: the first one between 1951 and 1992, and the second one between 1993 and 2016. Accurate examination showed that the LST has increased during the first phase but decreased in the second one. An insignificant increasing trend (), at a rate of 0.05 °C per year with a standard deviation value of 1.34 °C, was found for the first phase, whereas the time series exhibited an insignificant decreasing trend ( 0.12) at −0.05 °C per year in the second phase, with a standard deviation of 1.0 °C. This finding is a clear demonstration of the phase selection effect on the trend evaluations, as discussed in [39]. Over the Arabian Peninsula, the warmest years of the LST (Figure 2) were 1992 and 1982, which may have been influenced by eruptions of Mount Pinatubo and El Chichon, respectively. The results align or support analyses conducted in the past, including [4,40]. The 1982 El Chichon and 1992 Mt. Pinatubo influenced the northern hemisphere’s stratospheric temperature [5]. The lower stratosphere warmed, while the area close to the surface cooled after the Pinatubo eruption caused changes in atmospheric circulation [41].
For more insight on the dynamics of temperature variability, one can compare the lower stratospheric temperatures in the Arabian Peninsula with those in other areas. Therefore, the correlation coefficient between the Arabian Peninsula LST time series and the Northern Hemisphere (0°–90° N), tropical LST (0°–23.5° N), subtropical LST (23.5°–40° N), mid-latitude LST (40°–60° N), and polar regions LST (60°–90° N) time series was computed (Table 1). A strong positive relationship (99% significance level) between the Arabian Peninsula LST time series and tropical LST, subtropical LST, and mid-latitude LST regions was found (Table 1). However, a strong negative relationship (99% significance level) between the Arabian Peninsula LST and polar regions was observed (Table 1). Moreover, there was no relationship between the Northern Hemisphere LST time series and the Arabian Peninsula LST (Table 1). Salby and Callaghan [42] showed the inverse relationship between high and low latitudes of the stratospheric temperature, and that relationship was accompanied by a similar reversal trend of ozone [43]. The behavior of subtropical and mid-latitude lower stratospheric temperature time series was the same as in the tropics [4].
According to the coefficient of variability method for the reference period (1961–1990), the average change of the LST has a negative value of −0.43, and for the other period (1971–2000), the average change of the LST was −0.42, while it was −0.10 for the reference period (1981–2010). Thus, the change in the average value of the LST tended to increase. Moreover, standard deviation values during the reference periods, 1961–1990, 1971–2000, and 1981–2010, were 1.19, 1.38, and 1.51 °C, respectively; thus, the variability in LST from year to year was relatively high, especially in the last reference period (1981–2010).
3.1.2. Periodogram Analysis
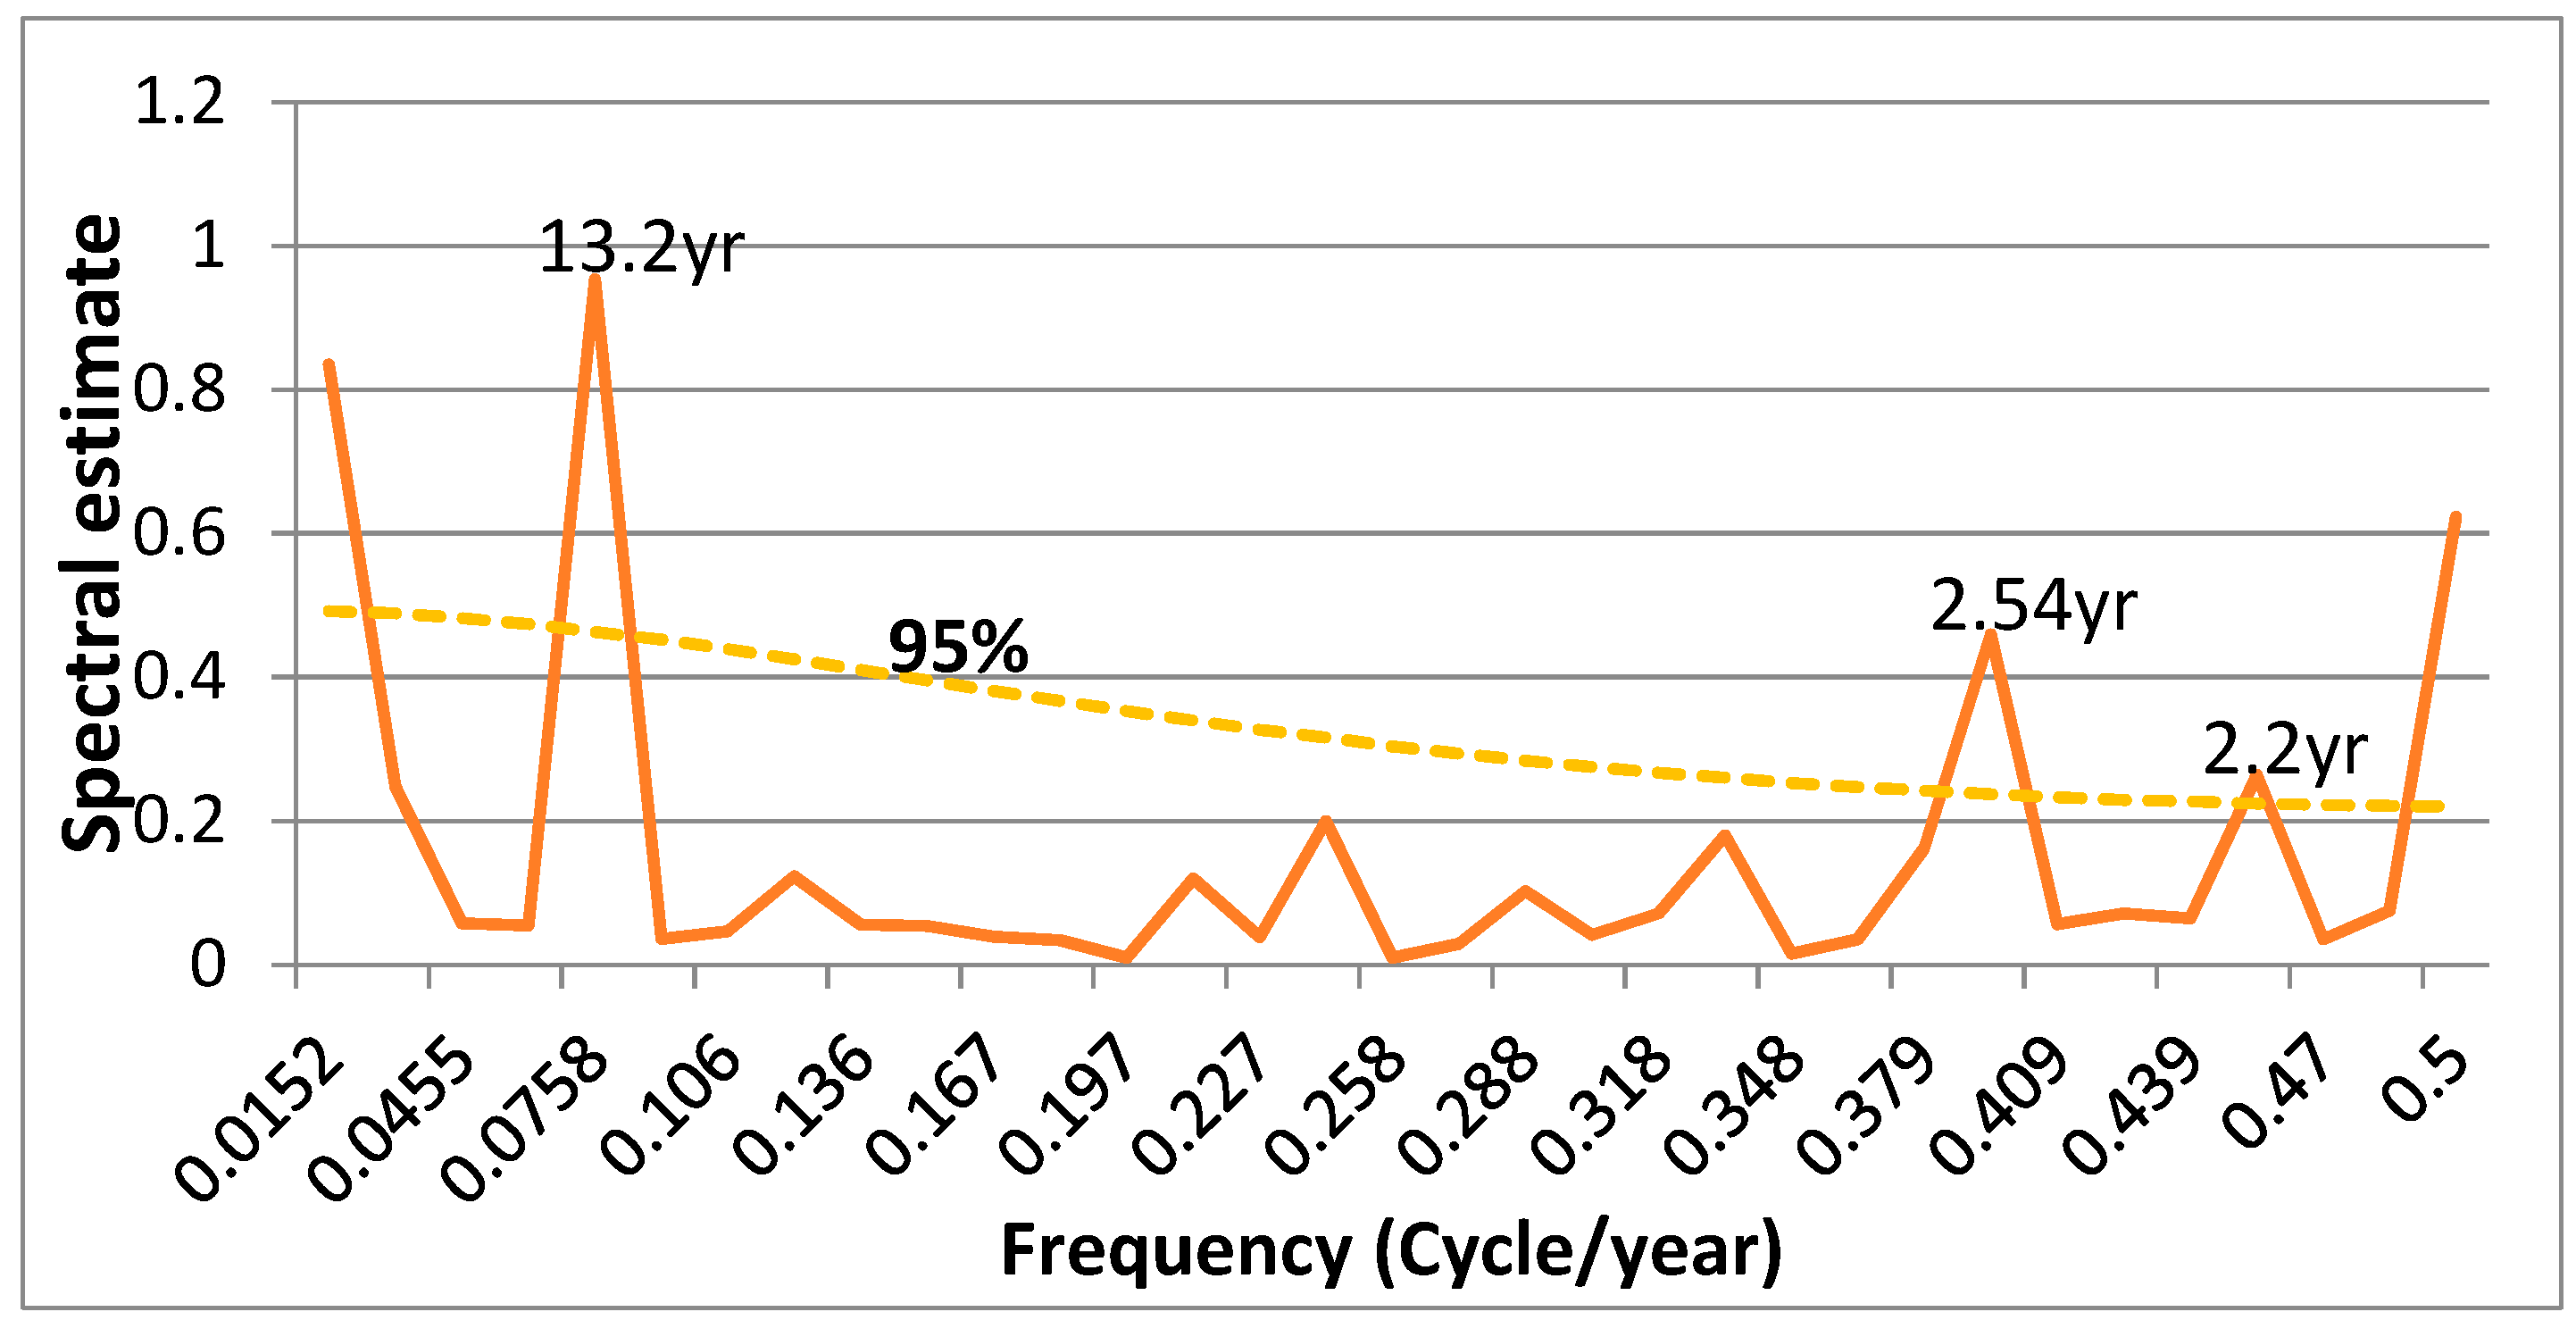
The power spectrum of the LST time series was computed using the autocorrelation spectral analysis method [36,37], and tested using Markov red noise theory and 2-tests [38]. The linear graphs of LST highlight the persistent alternating periods between the anomalies. Through the analysis of periodic behavior, a spectral analysis of the variance of these time series can provide more detailed information. Figure 3 clearly demonstrates peaks at periods of about 2.2, 2.54, and 13.2 years, which are significant at the 95% confidence level. From the spectral analysis, one can suppose that LST was described by non-periodic behavior. In this study, some explanations of the periodicities stated above are presented.
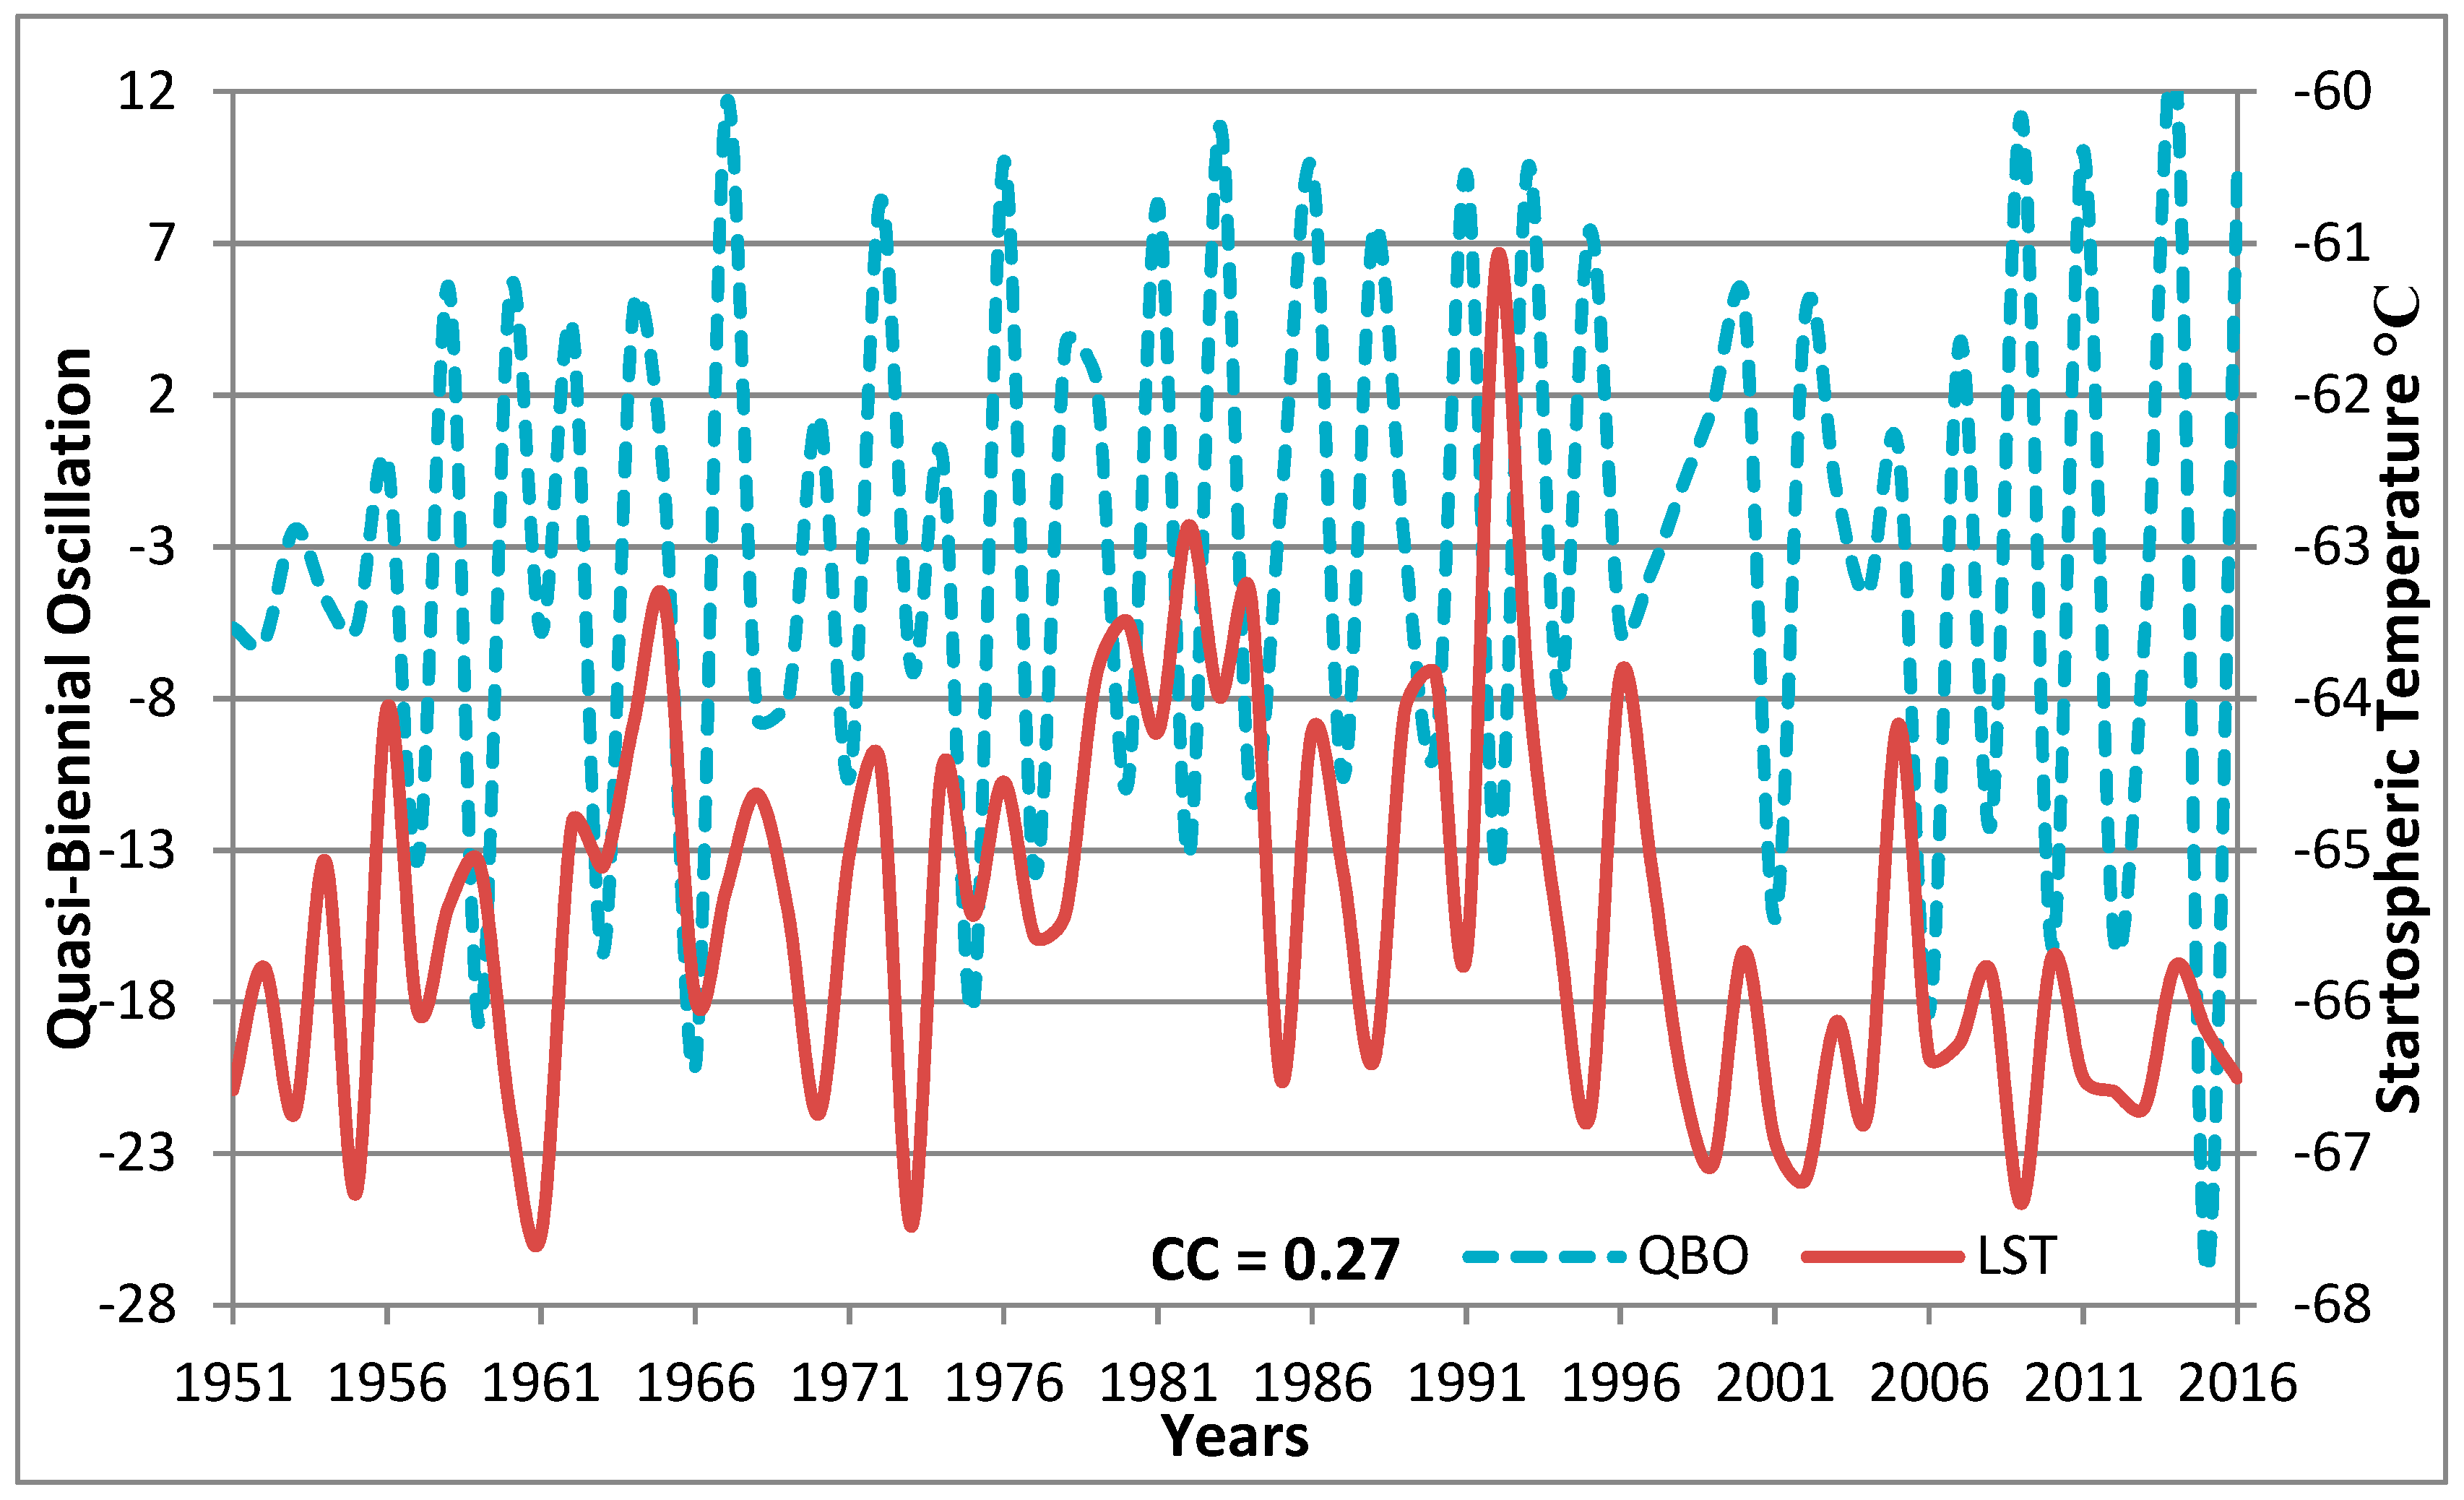
This study has shown that the quasi-biennial oscillation may affect LST. The findings of [44] showed that the quasi-biennial oscillation normally operates with a periodicity of 26 to 30 months. In addition, [45] found that the periodicity of the quasi-biennial oscillation was approximately 28 months in the lower stratosphere. Anstey et al. [46] argued that the periodicity of the quasi-biennial oscillation varies from approximately 22 to 36 months. The periodicity of the quasi-biennial oscillation averages approximately 28 months [29], but is known to have interannual variations of several months, [45]; however, the quasi-biennial oscillation could be affected by solar cycles [47] and by the propagating planetary waves into the stratosphere [13]. Figure 4 illustrates the distribution pattern of the quasi-biennial oscillation and LST time series. Also, cross-correlation coefficient lead–lag between two time series is represented in Figure 4. From this Figure, it is easily observed that significant cross-correlations (0.27) at the 95% level are spotted at lag 1 of the quasi-biennial oscillation. Therefore, the LST may be affected by previous quasi-biennial oscillations.
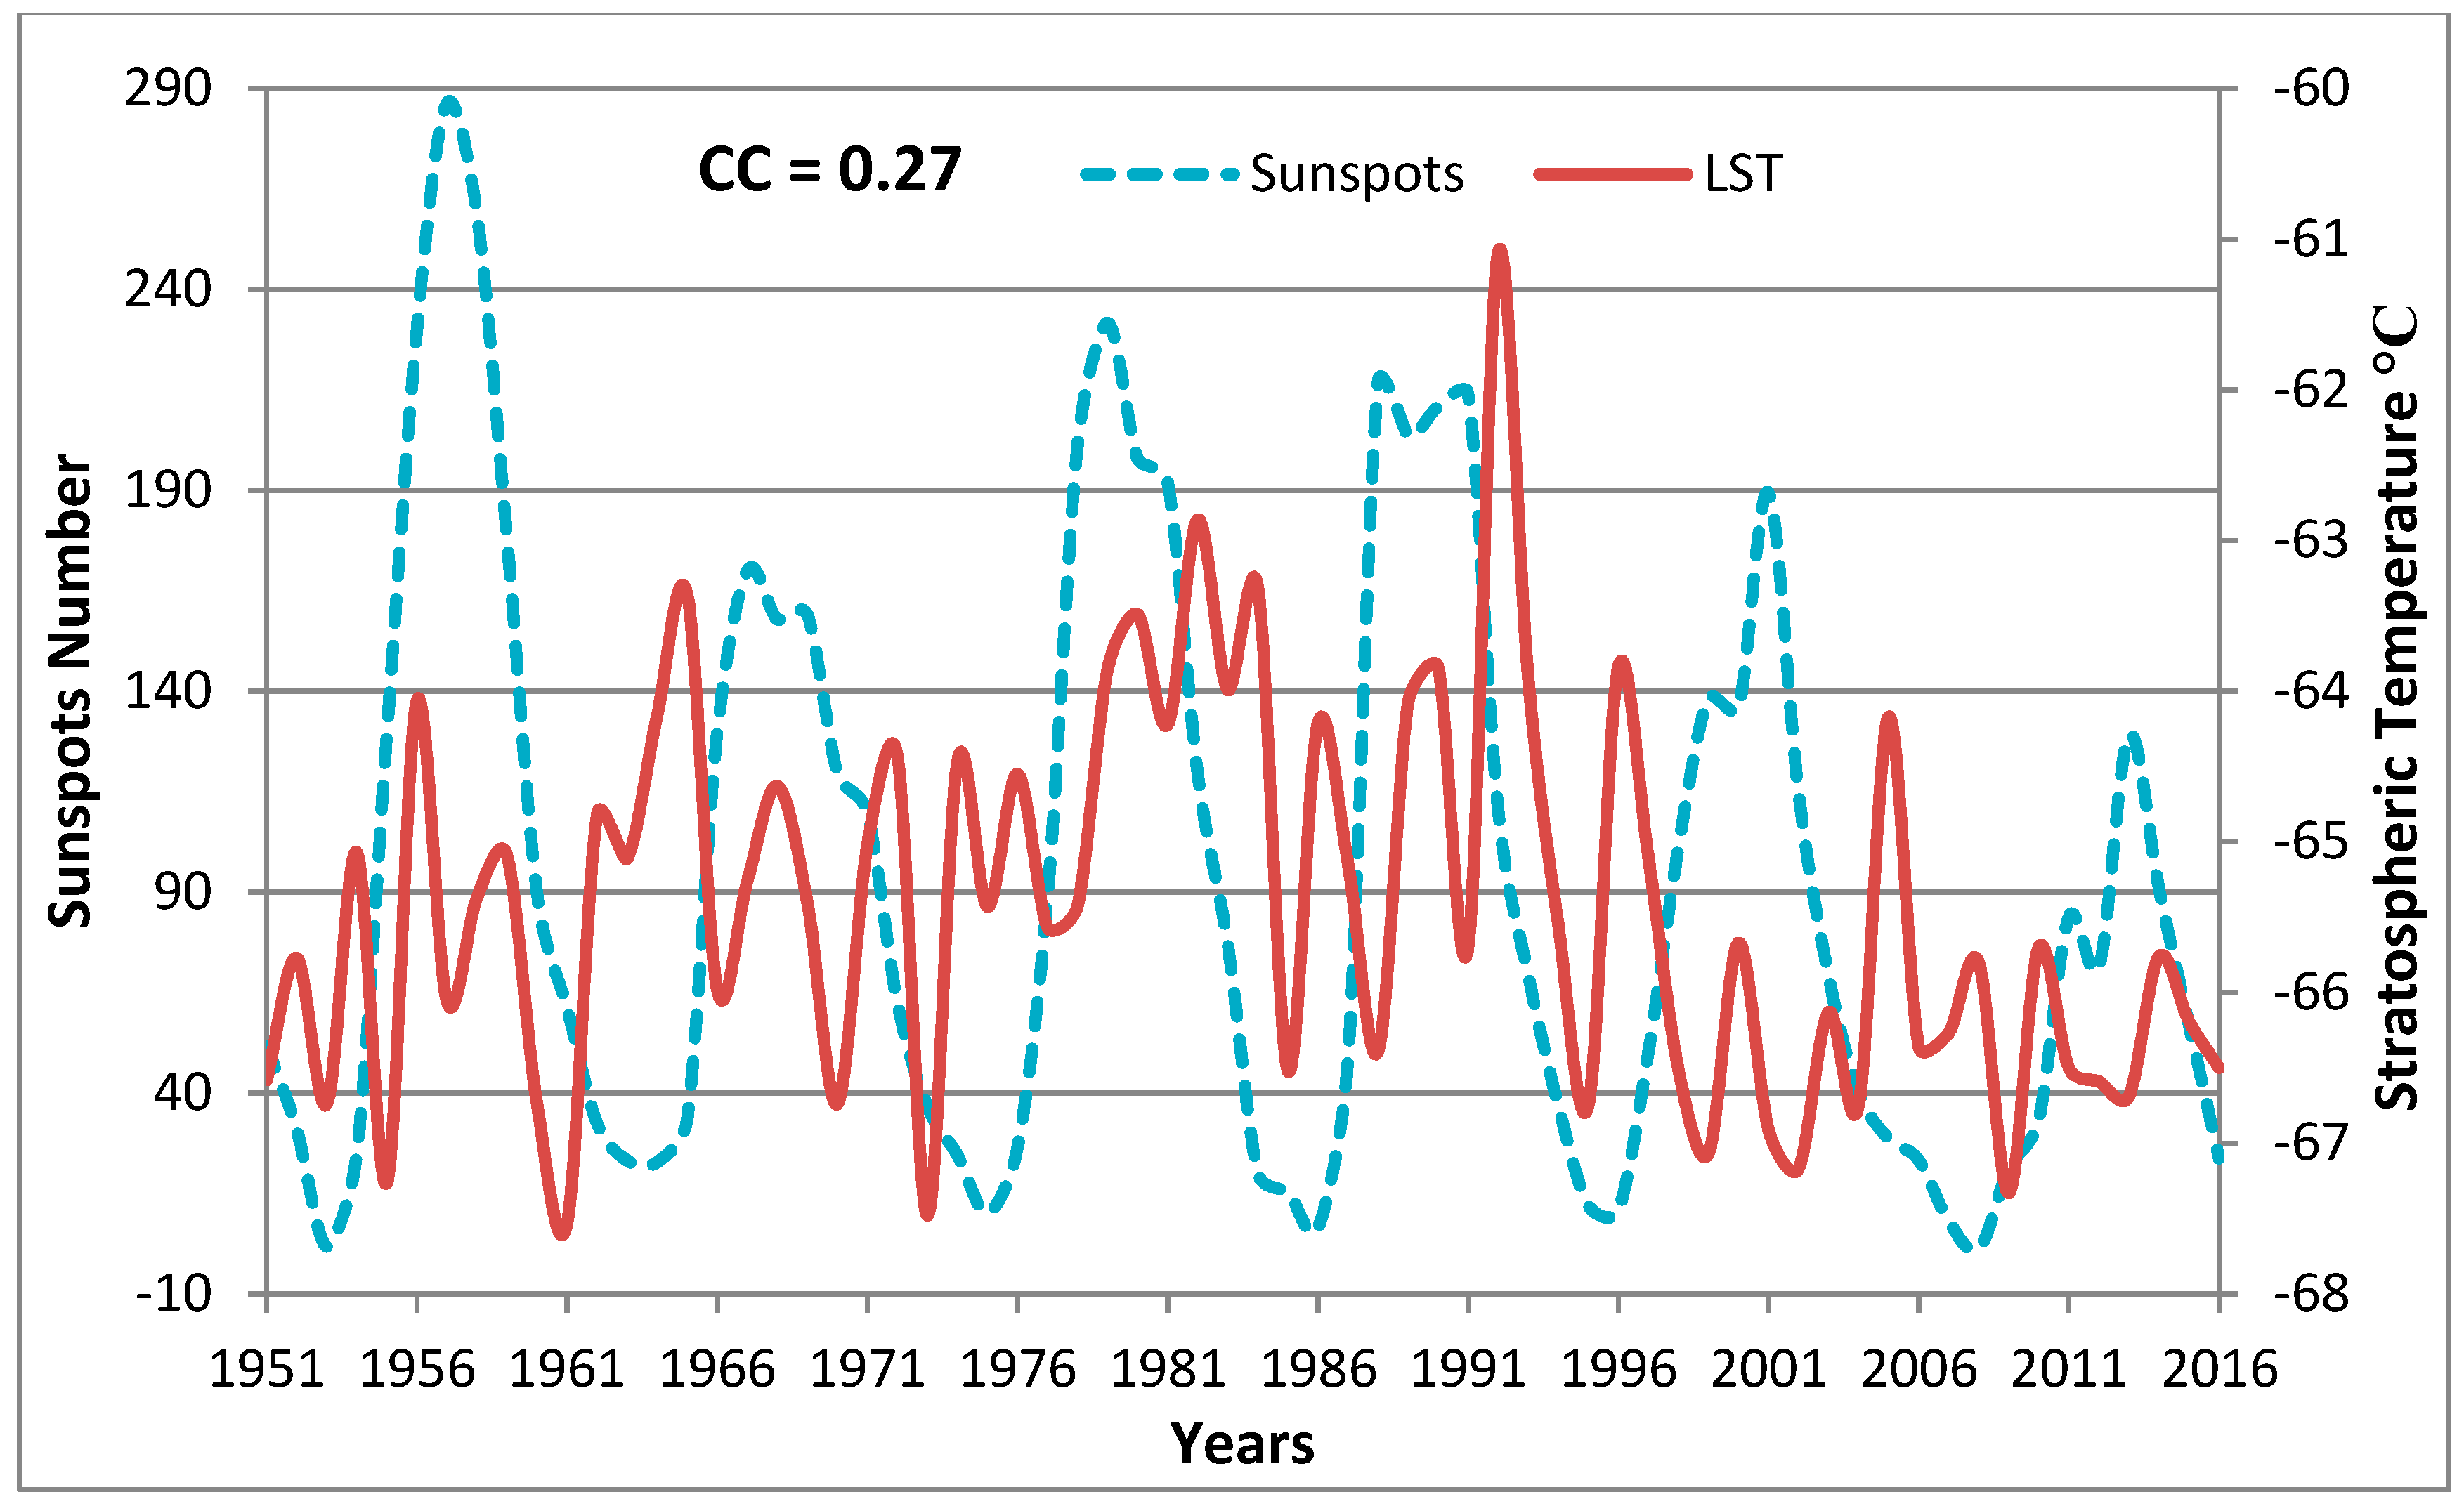
Kuai et al.; Haigh [48,49] found that the sunspot cycle is a significant contributor to stratospheric variability. The length of the solar cycle has varied between 9 and 13 years [50]. Between two solar minima, the sunspot cycle’s interval may be as short as 9 years and up to 14 years (https://scied.ucar.edu/sunspot-cycle). Figure 5 shows the time series of the sunspot number and LST. It is obvious from this figure that the cross-correlation coefficient between sunspot number and LST is 0.27 at zero lag; therefore, the number of sunspots may affect the LST in the winter season. Crooks and Gray [21] found the same results when studying the effects of the sunspot cycle and quasi-biennial oscillation on the polar vortex.
3.2. Relationship between the Lower Stratospheric and Tropospheric Temperature over the Arabian Peninsula
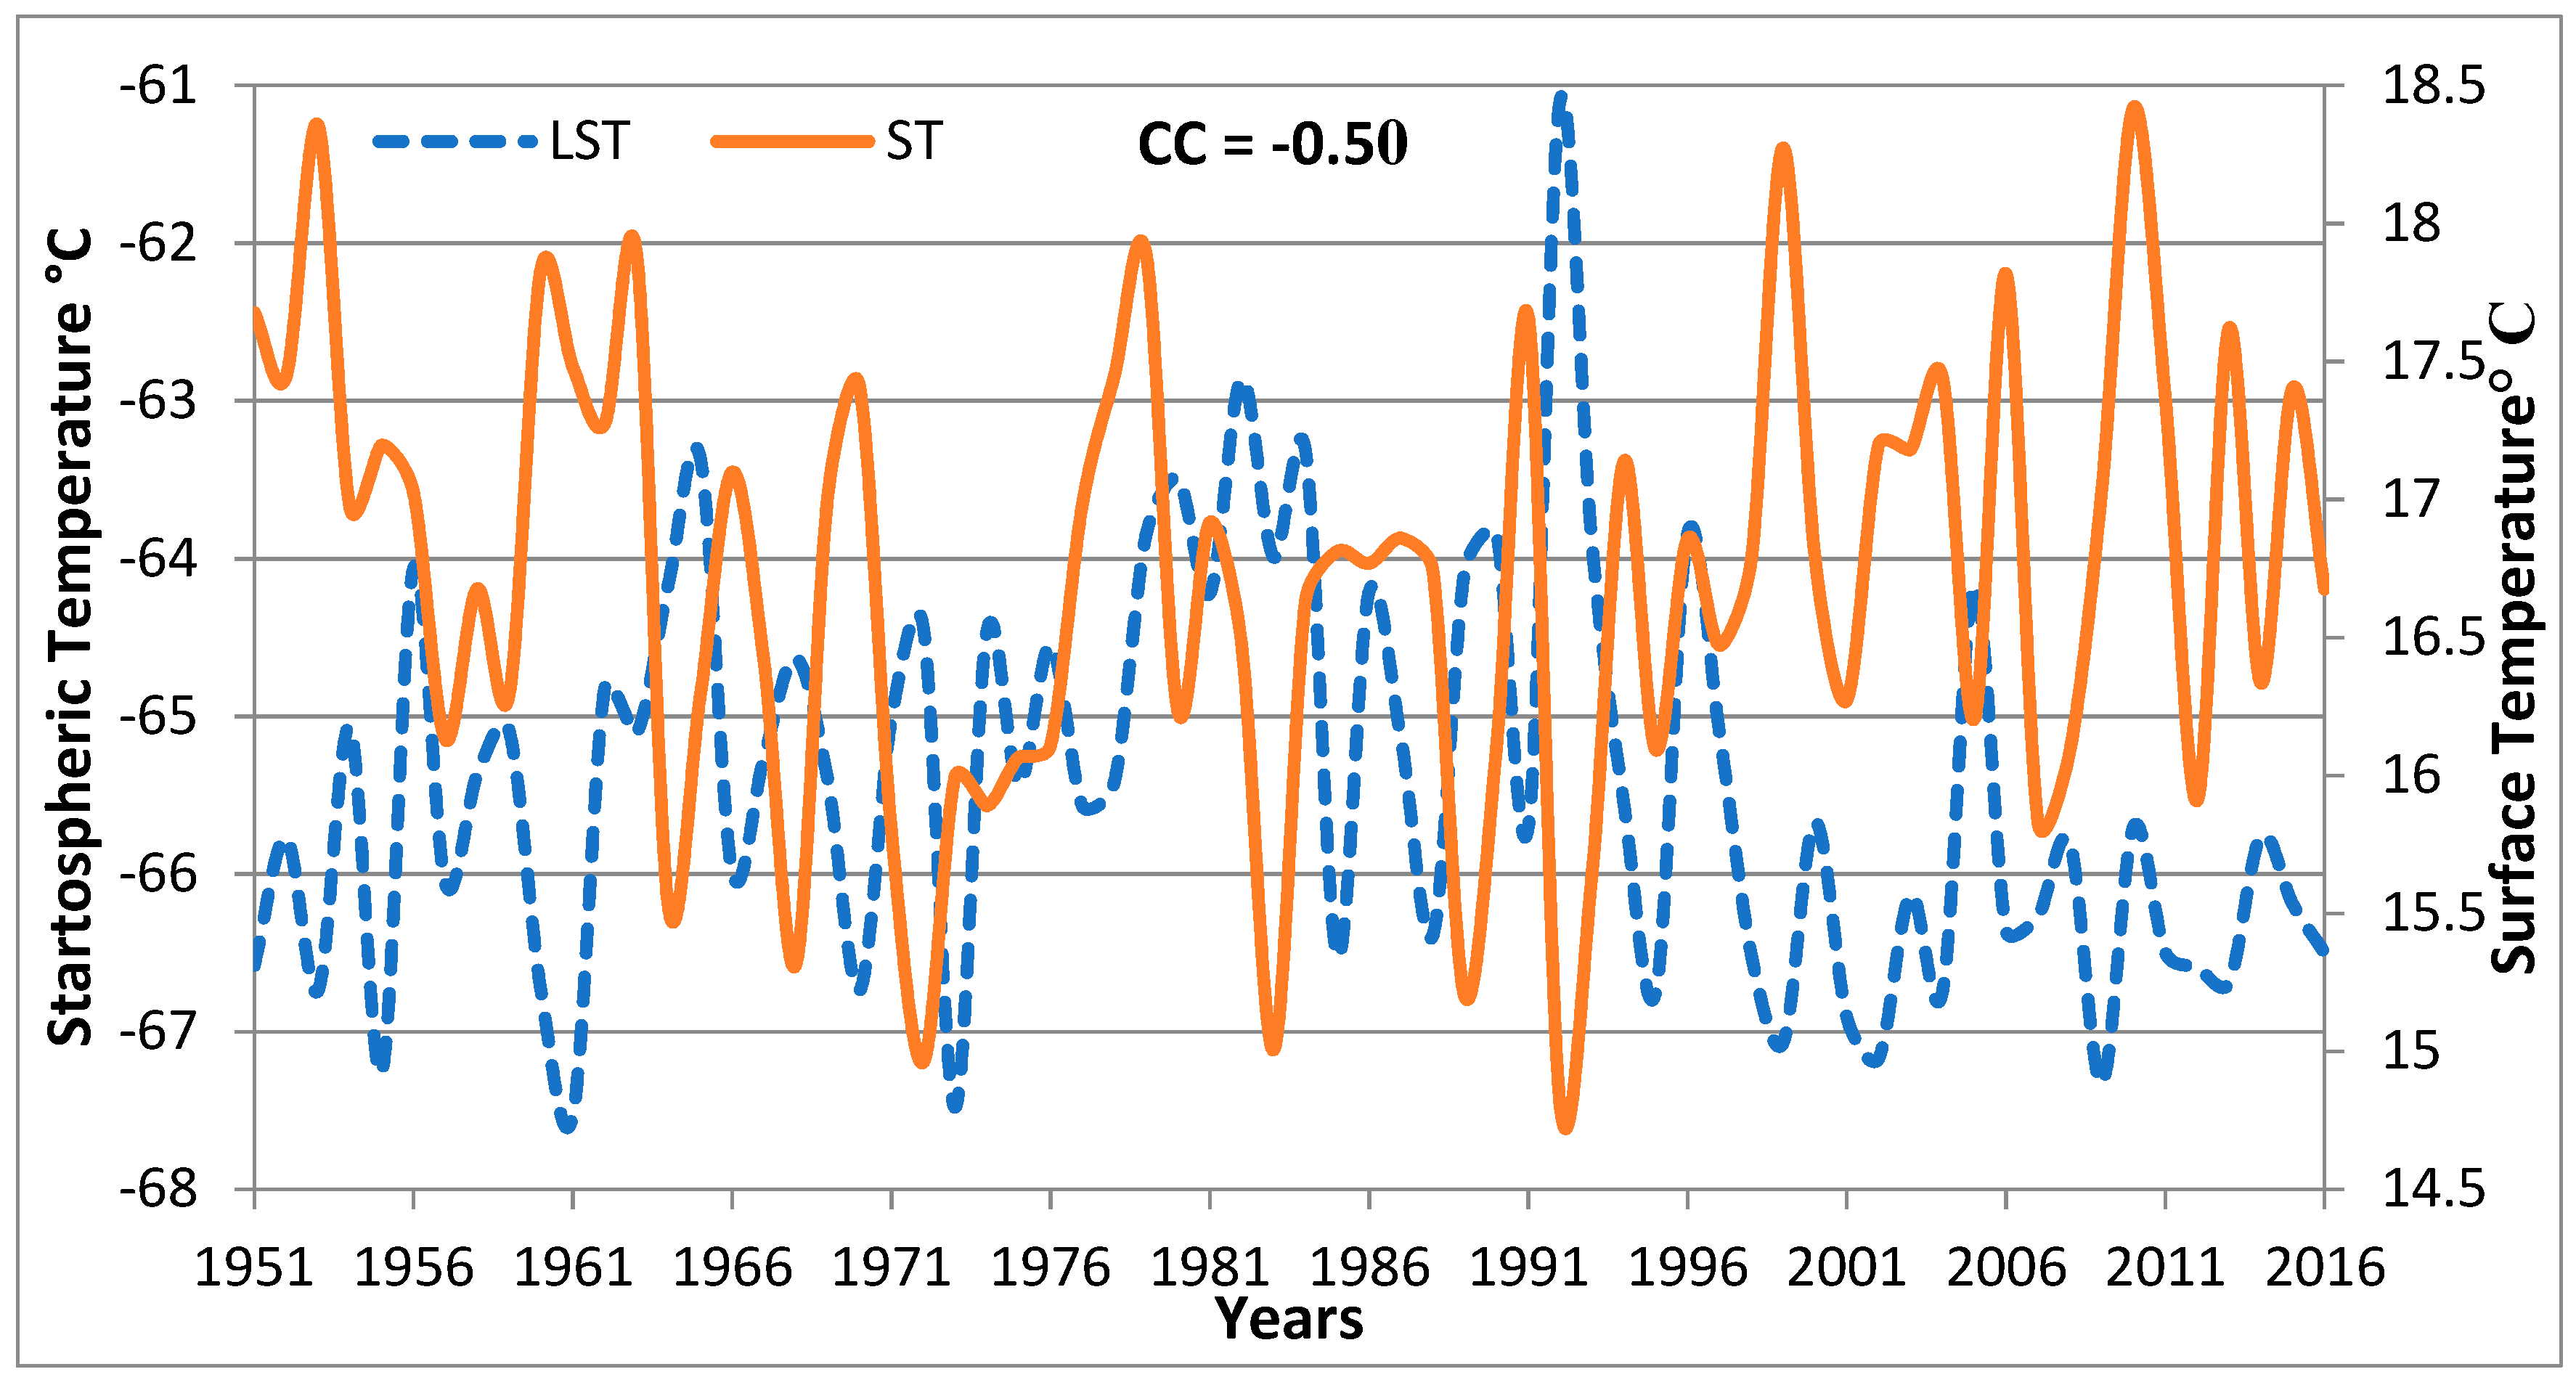
Many researchers, such as [51,52], have studied the relationship between the stratospheric and tropospheric temperature. They concluded that stratospheric processes are important in organizing the weather and climate systems of Earth. In addition, [53] found that stratospheric disturbances can affect the surface, and may represent an essential part of the mean zonal tropospheric response [54,55,56]. Moreover, during the winter season, stratosphere–troposphere connections display a strong coupling [57,58]. In this section, the relationship between LST and ST over the Arabian Peninsula is examined. Cross-correlation lead–lag is critical for exploration of physical mechanisms that could contribute to the relationship between LST and ST over the Arabian Peninsula. Figure 6 indicates that the maximum correlation coefficient between LST and ST was observed at zero lag (r = −0.50). This finding suggests that ST is linked to LST in this region.
Domeisen; Angell [59,60] showed coupling between the troposphere and the stratosphere on extreme weather and climate incidences. On a global average, since 1979, the temperature at the surface was warmer when compared to the troposphere, and the troposphere was warmer than the stratosphere [61,62,63,64]. Also, globally, the observed tropospheric temperature since 1958 has warmed and the stratosphere has cooled, in general, at a rate of 0.1 °C per decade [65,66,67,68,69] notwithstanding in the tropics and subtropics, where warming was spatially variable and most significant [70,71]. Based on global observations, the ST has warmed since the late 1950s, whereas cooling of the stratosphere has been an ongoing process since 1979 [2]. This is attributed to the important role of greenhouse gases in cooling the stratosphere and warming the troposphere [2,10,72,73]. Troposphere–stratosphere conjunctions characterized by this association exist through all timescales, from weekly variations [74] to long-term climate change [75,76,77,78]. In the extremely cold winters of 1962 and 1963 all across Europe, that recurred in the years 2009–2010, the recorded low values of the North Atlantic Oscillation were due to the strong easterly phase of quasi-biennial oscillation [79,80].
4. Conclusions
This study examines the lower stratospheric temperature (LST) and the relationship between surface air temperature and lower stratospheric temperature over the Arabian Peninsula. In 1982 and 1992, the maximum LST was observed, which could be related to volcanic eruptions. Numerous studies, such as [81,82,83], demonstrate the influence of volcanic eruptions on the temperatures of the lower stratosphere and Earth’s surface. These studies found that lower stratospheric warming and surface cooling occurred after a volcanic eruption. According to the linear trend, an insignificant downward cooling (−0.01 °C/year) through the period between 1951 and 2016 was found. The time series of the LST over the entire period was divided into two phases: the first one was from 1951 to 1992 and the second one was from 1993 to 2016. In the period between 1951 and 1992, there was an insignificant increasing linear trend (0.05 °C/year) in the LST, whereas in the period between 1993 and 2016, there was an insignificant decreasing linear trend (−0.05 °C/year). From the coefficient of variability (COV) method, the average value of the LST tends to increase. The mean values through the reference periods (1961–1990, 1971–2000, and 1981–2010) were more dependable due to the low value of the COV (−0.43, −0.42, and −0.01, respectively). Power spectrum analysis of LST time series and periodic behavior revealed peaks at 2.2, 2.54, and 13.2 years (significant at the 95% confidence level). Consequently, the quasi-biennial oscillation (2.2 and 2.54 years) and sunspots (13.2 years) may affect the LST. Correlation analysis was used to determine the relationship between the temperature of lower stratosphere and troposphere. A remarkably inverse relationship ( 99% confidence level) between LST and ST was found in the Arabian Peninsula during the winter season. Lead–lag cross-correlation was used to investigate the physical mechanisms between time series [35]. Lead–lag cross correlations between LST and the ST demonstrate that the correlation coefficient is −0.50 at zero lag. Many previous studies, e.g., [51,53,54,55,56,57], have pointed out that the stratosphere and troposphere were related to each other in wintertime. According to [2], stratospheric cooling in association with surface temperature warming is due to the role of greenhouse gases.
Author Contributions
H.M.H. introduced the idea, methodology and wrote the paper, and A.H.L. introduced the computer calculation, Fortran program and draw the figures.
Funding
This research did not received any external funding.
Conflicts of Interest
The authors declare no conflict of interest.
References
- IPCC Climate Change. The Scientific Basis. Contribution of Working Group I to the Third Assessment Report of the Intergovernmental Panel on Climate Change; Houghton, J.T., Ding, Y., Griggs, D.J., Noguer, M., van der Linden, P.J., Dai, X., Maskell, K., Johnson, C.A., Eds.; Cambridge University Press: Cambridge, UK; New York, NY, USA, 2001. [Google Scholar]
- IPCC Climate Change. The Physical Science Basis. Contribution of Working Group I to the Fourth Assessment Report of the IPCC; Solomon, S., Qin, D., Manning, M., Chen, Z., Marquis, M., Averyt, K.B., Tignor, M., Miller, H.L., Eds.; Cambridge University Press: Cambridge, UK; New York, NY, USA, 2007. [Google Scholar]
- Climate Change Science Program (CCSP). Temperature Trends in the Lower Atmosphere: Steps for Understanding and Reconciling Differences; Karl, T.R., Hassol, S.J., Miller, C.D., Murray, W.L., Veasey, S.W., McKay, E.E., Mahoney, J.R., Schultz, P.A., Glackin, M.M., Koblinsky, C.J., Eds.; CCSP: Washington, DC, USA, 2006. [Google Scholar]
- Randel, W.J.; Shine, K.P.; Austin, J.; Barnett, J.; Claud, C.; Gillett, N.P.; Keckhut, P.; Langematz, U.; Lin, R.; Long, C.; et al. An update of observed stratospheric temperature trends. J. Geophy. Res. 2009, 114, D02107. [Google Scholar] [CrossRef]
- Pawson, S.; Labitzke, K.; Leder, S. Stepwise changes in stratospheric temperature. Geophy. Res. Lett. 1998, 25, 2157–2160. [Google Scholar] [CrossRef] [Green Version]
- IPCC Climate Change. The Physical Science Basis. Contribution of Working Group I to the Fifth Assessment Report of the Intergovernmental Panel on Climate Change; Stocker, T.F., Qin, D., Plattner, G.-K., Tignor, M., Allen, S.K., Boschung, J., Nauels, A., Xia, Y., Bex, V., Midgley, P.M., Eds.; Cambridge University Press: Cambridge, UK; New York, NY, USA, 2013. [Google Scholar]
- Manabe, S.; Strickler, R.F. Thermal equilibrium of the atmosphere with a convective adjustment. J. Atmos. Sci. 1964, 21, 361–385. [Google Scholar] [CrossRef]
- Solomon, S.; Rosenlof, K.; Portmann, R.; Daniel, J.; Davis, S.; Sanford, T.; Plattner, G. Contributions of stratospheric water vapor to decadal changes in the rate of global warming. Science 2010, 327, 1219–1223. [Google Scholar] [CrossRef]
- Simmons, A.J.; Willett, K.M.; Jones, P.D.; Thorne, P.W.; Dee, D.P. Low frequency variations in surface atmospheric humidity, temperature, and precipitation: Inferences from reanalyses and monthly gridded observational data sets. J. Geophys. Res. Atmos. 2010, 115, D01110. [Google Scholar] [CrossRef]
- Shine, K.P.; Bourqui, M.S.; PM de FForster Hare, S.H.E.; Langematz, U.; Braesicke, P.; Grewe, V.; Ponater, M.; Schnadt, C.; Smith, C.A.; Haigh, J.D.; et al. A comparison of model-simulated trends in stratospheric temperatures. Q. J. R. Meteorol. Soc. 2003, 129, 1565–1588. [Google Scholar] [CrossRef] [Green Version]
- Ramaswamy, V.; Schwarzkopf, M.D.; Randel, W.J.; Santer, B.D.; Soden, B.J.; Stenchikov, G.L. Anthropogenic and natural influences in the evolution of lower stratospheric cooling. Science 2006, 311, 1138–1141. [Google Scholar] [CrossRef] [PubMed]
- Ramaswamy, V.M.-L.; Chanin, J.; Angell, J.; Barnett, D.; Gaffen, M.; Gelman, P.; Keckhut, Y.; Koshelkov, K.; Labitzke, J.-J.R.; Lin, A.; et al. Stratospheric temperature trends: Observations and model simulations. Rev. Geophys. 2001, 39, 71–122. [Google Scholar] [CrossRef] [Green Version]
- World Meteorological Organization (WMO). Scientific Assessment of Ozone Depletion; Rep. 47; WMO: Geneva, Switzerland, 2006. [Google Scholar]
- Holton, J.R.; Tan, H.C. The influence of the Equatorial Quasi-Biennial Oscillation on the global circulation at 50 mb. J. Atmos. Sci. 1980, 37, 2200–2208. [Google Scholar] [CrossRef]
- Krishna Murthy, B.V.; Parameswaran, K.; Rose, K.O. Temporal variations of the tropical tropopause characteristics. J. Atmos. Sci. 1986, 43, 914–922. [Google Scholar] [CrossRef]
- Randel, W.J.; Wu, F.; Gaffen, D.J. Interannual variability of the tropical tropopause derived from radiosonde data and NCEP reanalyses. J. Geophys. Res. 2000, 105, 15509–15523. [Google Scholar] [CrossRef] [Green Version]
- Hood, L.L.; Soukharev, B.E. Quasi-Decadal Variability of the Tropical Lower Stratosphere: The Role of Extratropical Wave Forcing. J. Atmos. Sci. 2003, 60, 2389–2403. [Google Scholar] [CrossRef] [Green Version]
- Labitzke, K. On the interannual variability of the middle stratosphere during the northern winters. J. Met. Soc. Jpn. 1982, 60, 124–139. [Google Scholar] [CrossRef]
- Labitzke, K. Sunspots, the QBO and the stratospheric temperatures in the north polar regions. Geophys. Res. Lett. 1987, 14, 535–537. [Google Scholar] [CrossRef]
- Matthes, K.; Kuroda, Y.; Kodera, K.; Langematz, U. The transfer of the solar signal from the stratosphere to the troposphere: Northern winter. J. Geophys. Res. 2006, 111. [Google Scholar] [CrossRef]
- Crooks, S.A.; Gray, L.J. Characterization of the 11-year solar signal using a multiple regression analysis of the ERA-40 dataset. J. Clim. 2005, 18, 996–1015. [Google Scholar] [CrossRef]
- Camp, C.D.; Tung, K.-K. The influence of the solar cycle and QBO on the Late-Winter stratosphere polar vortex. J. Atmos. Sci. 2007, 64, 1267–1283. [Google Scholar] [CrossRef]
- Kodera, K.; Yamazaki, K.; Chiba, M.; Shibata, K. Downward propagation of upper stratospheric mean zonal wind perturbation to the troposphere. Geophys. Res. Lett. 1990, 9, 1263–1266. [Google Scholar] [CrossRef]
- Coughlin, K.; Tung, K.-K. QBO Signal found at the extratropical surface through Northern Annular Modes. Geophys. Res. Lett. 2001, 28, 4563–4566. [Google Scholar] [CrossRef]
- Thompson, D.W.J.; Baldwin, M.P.; Wallace, J.M. Stratospheric connection to northern hemisphere wintertime weather: Implications for prediction. J. Clim. 2002, 15, 1421–1428. [Google Scholar] [CrossRef]
- Rind, D.; Lean, J.; Lerner, J.; Lonergan, P.; Leboissitier, A. Exploring the stratospheric/tropospheric response to solar forcing. J. Geophys. Res. 2008, 113, D24103. [Google Scholar] [CrossRef]
- Ineson, S.; Scaife, A.A. The role of the stratosphere in the European climate response to El Niño. Nat. Geosci. 2009, 2, 32–36. [Google Scholar] [CrossRef]
- Garfinkel, C.I.; Waugh, D.W.; Oman, L.D.; Wang, L.; Hurwitz, M.M. Temperature trends in the tropical upper troposphere and lower stratosphere: Connections with sea surface temperatures and implications for water vapor and ozone. J. Geophys. Res. Atmos. 2013, 118, 9658–9672. [Google Scholar] [CrossRef] [Green Version]
- Holloway, C.E.; Neelin, D.J. The convective cold top and quasi equilibrium. J. Atmos. Sci. 2007, 64, 1467–1487. [Google Scholar] [CrossRef]
- Kistler, R.; Kalnay, E.; Collins, W.; Saha, S.; White, G.; Woollen, J.; Chelliah, M.; Ebisuzaki, W.; Kanamitsu, M.; Kousky, V.; et al. The NCEP-NCAR 50-year reanalysis: Monthly means CD-ROM and documentation. Bull. Am. Meteorol. Soc. 2001, 82, 247–268. [Google Scholar] [CrossRef]
- Kalnay, E.; Kanamitsu, M.; Kistler, R.; Collins, W.; Deaven, D.; Gandin, L.; Iredell, M.; Saha, S.; White, G.; Woollen, J.; et al. The NCEP/NCAR 40-year reanalysis project. Bull. Am. Meteorol. Soc. 1996, 77, 437–471. [Google Scholar] [CrossRef]
- Hasanean, H.M. Tropical Meteorology—Middle East Meteorology; Encyclopedia of Life Support Systems (EOLSS): Paris, France, 2011. [Google Scholar]
- Wilks, D.S. Statistical Methods in the Atmospheric Sciences; Academic Press: New York, NY, USA, 2006; 627p. [Google Scholar]
- Hasanean, H.M. Variability of the North Atlantic subtropical high and associations with tropical sea surface temperature. Int. J. Climatol. 2004, 24, 945–957. [Google Scholar] [CrossRef]
- Nigam, S. In Teleconnection: In “Encyclopedia of Atmospheric Science”; Holton, J.R., Pyle, J., Curry, J.A., Eds.; Academic Press, Elsevier Science Ltd.: Amsterdam, The Netherlands, 2003. [Google Scholar]
- Koutroulis, A.G.; Grillakis, M.G.; Tsanis, I.K.; Kotroni, V.; Lagouvardos, K. Lightning activity, rainfall and flash flooding—Occasional or interrelated events? A case study in the island of Crete. Nat. Hazards Earth Syst. Sci. 2012, 12, 881–889. [Google Scholar] [CrossRef]
- Broersen, P.M.T. Automatic Autocorrelation and Spectral Analysis; Springer: Delft, The Netherlands, 2006; 298p, ISBN 9781846283284. [Google Scholar]
- Priestley, M.B. Spectral Analysis and Time Series Analysis; Academic Press: London, UK, 1981. [Google Scholar]
- Mitchell, J.M.; Dzerdzeevskii, B.; Flohn, H.; Hofmery, W.L. Climatic Change; WMO Technical Note, 79. WMO No. 195. TP-100; World Meteorological Organization (WMO): Geneva, Switzerlands, 1966. [Google Scholar]
- Liebmann, B.; Dole, R.; Jones, C.; Bladé, I.; Allured, D. Influence of choice of time period on global surface temperature trend estimates. Bull. Am. Meteorol. Soc. 2010, 91, 1485–1492. [Google Scholar] [CrossRef]
- Angell, J.K. Stratospheric warming due to Agung, El Chichon, and Pinatubo taking into account the quasi-biennial oscillation. J. Geophys. Res. 1997, 102, 9479–9485. [Google Scholar] [CrossRef]
- Self, S.; Zhao, J.; Holasek, R.E.; Torres, R.C.; King, A.J. The atmospheric impact of the 1991 Mount Pinatubo eruption. In FIRE and MUD: Eruptions and Lahars of Mount Pinatubo, Philippines; University of Washington: Washington, WA, USA, 1997. [Google Scholar]
- Salby, R.S.A.; Callaghan, P.F. Systematic changes of stratospheric temperature: Relationship between the tropics and extratropics. J. Geophys. Res. 1996, 108, D3. [Google Scholar] [CrossRef]
- World Meteorological Organization (WMO). Scientific Assessment of Ozone Depletion: 1998, Rep. 44, NASA; Office of the Mission to Planet Earth: Washington, DC, USA, 1999.
- Yu, Z.; Li-Bo, Z. Quasi-biennial oscillation signal detected in the stratospheric zonal wind at 55–65° N. Atmos. Ocean. Sci. Lett. 2016, 9, 147–152. [Google Scholar]
- Anstey, J.A.; Shepherd, T.G.; Scinocca, J.F. Influence of the Quasi-Biennial Oscillation on the Extratropical Winter Stratosphere in an Atmospheric General Circulation Model and in Reanalysis Data. J. Atmos. Sci. 2010, 67, 1402–1419. [Google Scholar] [CrossRef]
- Huesmann, A.S.; Hitchman, M.H. The stratospheric quasibiennial oscillation in the NCEP reanalyses: Climatological structures. J. Geophys. Res. 2001, 106, 859–874. [Google Scholar] [CrossRef]
- Kuai, L.; Shia, R.-L.; Jiang, X.; Tung, K.K.; Yung, Y.L. Modulation of the Period of the Quasi-Biennial Oscillation by the Solar Cycle. J. Atmos. Sci. 2009, 66, 2418–2428. [Google Scholar] [CrossRef] [Green Version]
- Haigh, J.D. The impact of solar variability on climate. Science 1996, 272, 981–984. [Google Scholar] [CrossRef]
- Haigh, J.D. A GCM study of climate change in response to the 11-year solar cycle. Q. J. R. Meteorol. Soc. 1999, 125, 871–892. [Google Scholar] [CrossRef]
- Hoyt, D.V.; Schatten, K.H. The Role of the Sun in Climate Change; Oxford University Press: New York, NY, USA, 1997. [Google Scholar]
- Mohanakumar, K. Stratosphere Troposphere Interactions: An Introduction; Springer: Berlin, Germany, 2008. [Google Scholar] [CrossRef]
- Quanliang, C.; Lingxiao, W. Relationship of Temperature Variation between in the Stratosphere and the Troposphere. Procedia Environ. Sci. 2012, 12, 666–671. [Google Scholar] [CrossRef] [Green Version]
- Hartley, D.E.; Villarin, J.T.; Black, R.X.; Davis, C.A. A new perspective on the dynamical link between the stratosphere and troposphere. Nature 1998, 391, 471–474. [Google Scholar] [CrossRef]
- Black, R.X. Stratospheric forcing of surface climate in the Arctic oscillation. J. Clim. 2002, 15, 268–277. [Google Scholar] [CrossRef]
- Kunz, T.; Greatbatch, R.J. On the Northern Annular Mode surface signal associated with stratospheric variability. J. Atmos. Sci. 2013, 70, 2103–2118. [Google Scholar] [CrossRef]
- Boville, B.A. The influence of the polar night jet on the tropospheric circulation in a GCM. J. Atm. Sci. 1984, 41, 1132–1142. [Google Scholar] [CrossRef]
- Perlwitz, J.; Graf, H. The statistical connection between tropospheric and stratospheric circulation of the northern hemisphere in winter. J. Clim. 1995, 8, 2281–2295. [Google Scholar] [CrossRef]
- Domeisen, D.I.V. Stratosphere Troposphere Interaction during Stratospheric Sudden Warming Events. Ph.D. Thesis, Massachusetts Institute of Technology, Cambridge, MA, USA, 2012. [Google Scholar]
- Angell, J.K. Comparison of surface and tropospheric temperature trends estimated from a 63-station radiosonde network, 1958–1998. Geophys. Res. Lett. 1999, 26, 2761–2764. [Google Scholar] [CrossRef]
- Hurrell, J.W.; Brown, S.J.; Trenberth, K.E.; Christy, J.R. Comparison of troospheric temperatures from radiosondes and satellites: 1979–1998. Bull. Am. Met. Soc. 2000, 81, 2165–2177. [Google Scholar] [CrossRef]
- Brown, S.J.; Parker, D.E.; Folland, C.K.; Macadam, I. Decadal variability in the lower-tropospheric lapse rate. Geophys. Res. Lett. 2000, 27, 997–1000. [Google Scholar] [CrossRef] [Green Version]
- Pielke Sr, R.A.; Eastman, J.; Chase, T.N.; Knaff, J.; Kittel, T.G.F. Errata to 1973–1996 Trends in depth-averaged tropospheric temperature. J. Geophys. Res. 1998, 103, 16927–16933. [Google Scholar] [CrossRef]
- Pielke Sr, R.A.; Eastman, J.; Chase, T.N.; Knaff, J.; Kittel, T.G.F. 1973–1996 Trends in depth-averaged tropospheric temperature. J. Geophys. Res. 1998, 103, 28909–28912. [Google Scholar] [CrossRef]
- Stendel, M.; Christy, J.R.; Bengtsson, L. Assessing levels of uncertainty in recent temperature time series. Clim. Dyn. 2000, 16, 587–601. [Google Scholar] [CrossRef]
- Thorne, P.W.; Brohan, P.; Titchner, H.A.; McCarthy, M.P.; Sherwood, S.C.; Peterson, T.C.; Haimberger, L.; Parker, D.E.; Tett, S.F.; Santer, B.D.; et al. A quantification of uncertainties in historical tropical tropospheric temperature trends from radiosondes. J. Geophys. Res. Atmos. 2011, 116, D12116. [Google Scholar] [CrossRef]
- Seidel, D.J.; Gillett, N.P.; Lanzante, J.R.; Shine, K.P.; Thorne, P.W. Stratospheric temperature trends: Our evolving understanding. Clim. Chang. 2011, 2, 592–616. [Google Scholar] [CrossRef]
- Haimberger, L.; Tavolato, C.; Sperka, S. Homogenization of the global radiosonde temperature dataset through combined comparison with reanalysis background series and neighboring stations. J. Clim. 2012, 25, 8108–8131. [Google Scholar] [CrossRef]
- Thompson, D.W.; Seidel, D.J.; Randel, W.J.; Zou, C.Z.; Butler, A.H.; Mears, C.; Osso, A.; Long, C.; Lin, R. The mystery of recent stratospheric temperature trends. Nature 2012, 491, 692–697. [Google Scholar] [CrossRef] [PubMed]
- Wang, L.K.; Zou, C.Z.; Qian, H.F. Construction of stratospheric temperature data records from Stratospheric Sounding Units. J. Clim. 2012, 25, 2931–2946. [Google Scholar] [CrossRef]
- Christy, J.R.; Parker, D.E.; Brown, S.J.; Macadam, I.; Stendel, M.; Norris, W.B. Differential trends in tropical sea surface and atmospheric temperatures. Geophys. Res. Lett. 2001, 28, 183–186. [Google Scholar] [CrossRef]
- Gaffen, D.J.; Santer, B.D.; Boyle, J.S.; Christy, J.R.; Graham, N.E.; Ross, R.J. Multidecadal changes in the vertical structure of the tropical troposphere. Science 2000, 287, 1242–1245. [Google Scholar] [CrossRef]
- Karl, T.R.; Hassol, S.J.; Miller, C.D.; Murray, W.L. (Eds.) Temperature Trends in the Lower Atmosphere: Steps for Understanding and Reconciling Differences; U.S. Climate Change Science Program and the Subcommittee on Global Change Research Synthesis and Assessment Product 1.1; U.S. Climate Change Science Program and the Subcommittee on Global Change Research: Washington, DC, USA, 2006; p. 164.
- Kolstad, E.W.; Breiteig, T.; Scaife, A.A. The association between stratospheric weak polar vortex events and cold air outbreaks in the Northern Hemisphere. Q. J. R. Meteorol. Soc. 2010, 136, 886–893. [Google Scholar] [CrossRef] [Green Version]
- Sigmond, M.; Scinocca, J.F.; Kushner, P.J. Impact of the stratosphere on tropospheric climate change. Geophys. Res. Lett. 2008, 35, L12706. [Google Scholar] [CrossRef]
- Scaife, A.A.; Spangehi, T.; Cubasch, U.; Langematz, U.; Akiyoshi, H.; Bekki, S.; Butchart, N.; Chipperfield, M.P.; Gettelman, A.; Hardiman, S.C.; et al. Climate change projections and stratosphere–troposphere interaction. Clim. Dyn. 2012, 38, 2089–2097. [Google Scholar] [CrossRef]
- Polvani, L.M.; Waugh, D.W.; Correa, G.J.P.; So, S.-W. Stratospheric ozone depletion: The main driver of twentieth-century atmospheric circulation changes in the southern hemisphere. J. Clim. 2011, 24, 795–812. [Google Scholar] [CrossRef]
- Karpechko, A.Y.; Manzini, E. Stratospheric influence on tropospheric climate change in the Northern Hemisphere. J. Geophys. Res. 2012, 117, D05133. [Google Scholar] [CrossRef]
- Fereday, D.R.; Maidens, A.; Arribas, A.; Scaife, A.A.; Knight, J.R. Seasonal forecasts of Northern Hemisphere winter 2009/10. Environ. Res. Lett. 2012, 7, 034031. [Google Scholar] [CrossRef]
- Greatbatch, R.J.; Gollan, G.; Jung, T.; Kunz, T. Tropical origin of the severe European winter of 1962/1963. Q. J. R. Meteorol. Soc. 2015, 141, 153–165. [Google Scholar] [CrossRef]
- Labitzke, K.; McCormick, M.P. Stratospheric temperature increases due to Pinatubo aerosols. Geophys. Res. Lett. 1992, 19, 207–210. [Google Scholar] [CrossRef]
- Young, R.E.; Houben, H.; Toon, O.B. Radiatively forced dispersion of the Mt. Pinatubo volcanic cloud and induced temperature perturbations in the stratosphere during the first few months following the eruption. Geophys. Res. Lett. 1994, 21, 369–372. [Google Scholar] [CrossRef]
- Soden, B.J.; Wetherald, R.T.; Stenchikov, G.L.; Robock, A. A Global cooling after the eruption of Mount Pinatubo: A test of climate feedback by water vapor. Science 2002, 296, 727–730. [Google Scholar] [CrossRef] [PubMed]
Figure 1.
A map representing the study domain of the Arabian Peninsula.

Figure 2.
The distribution pattern of the lower stratospheric temperature time series at 50 hPa lower stratospheric temperature (LST) in wintertime in the period 1951–2016. The average value for the whole period (black dotted line), the trends displayed for the whole period (blue line color), the first half period 1951–1992 (red dotted line), and the second half period 1992–2016 (green dotted line) are also shown. The two upward pointing arrows are the warmest years, 1982 and 1992.

Figure 3.
Spectral analysis of lower stratospheric temperature at 50 hPa (LST) at the Arabian Peninsula (solid curve), and a 95% confidence level (dashed curve).
Figure 3.
Spectral analysis of lower stratospheric temperature at 50 hPa (LST) at the Arabian Peninsula (solid curve), and a 95% confidence level (dashed curve).

Figure 4.
The distribution pattern of quasi-biennial oscillation (QBO) and LST time series. The CC represents the correlation coefficient at one lag, which is significant at the 95% confidence level.
Figure 4.
The distribution pattern of quasi-biennial oscillation (QBO) and LST time series. The CC represents the correlation coefficient at one lag, which is significant at the 95% confidence level.

Figure 5.
The distribution pattern of the sunspot number and LST time series. The CC represents the correlation coefficient at zero lag, which is significant at the 95% confidence level.
Figure 5.
The distribution pattern of the sunspot number and LST time series. The CC represents the correlation coefficient at zero lag, which is significant at the 95% confidence level.

Figure 6.
The distribution pattern of the ST and LST time series. The CC represents the correlation coefficient at zero lag, which is significant at the 95% confidence level.
Figure 6.
The distribution pattern of the ST and LST time series. The CC represents the correlation coefficient at zero lag, which is significant at the 95% confidence level.


Table 1.
The correlation coefficient between the Arabian Peninsula LST and the North Hemisphere LST (0°–90° N), tropical LST (0°–23.5° N), subtropical LST (23.5°–40° N), mid-latitude LST (40°–60° N), and polar regions LST (60°–90° N).
Table 1.
The correlation coefficient between the Arabian Peninsula LST and the North Hemisphere LST (0°–90° N), tropical LST (0°–23.5° N), subtropical LST (23.5°–40° N), mid-latitude LST (40°–60° N), and polar regions LST (60°–90° N).
| CC | North Hemisphere LST (0°–90° N) | Tropical LST (0°–23.5° N) | Subtropical LST (23.5°–40° N) | Mid-Latitude LST (40°–60° N) | Polar LST (60°–90° N) |
|---|---|---|---|---|---|
| Arabian Peninsula LST | 0.08 | 0.60 ** | 0.80 ** | 0.37 ** | −0.46 ** |
** 99% significance level.
© 2019 by the authors. Licensee MDPI, Basel, Switzerland. This article is an open access article distributed under the terms and conditions of the Creative Commons Attribution (CC BY) license (http://creativecommons.org/licenses/by/4.0/).
Share and Cite
MDPI and ACS Style
M. Hasanean, H.; H. Labban, A. Study of the Lower Stratospheric Temperature over the Arabian Peninsula. Climate 2019, 7, 54. https://0-doi-org.brum.beds.ac.uk/10.3390/cli7040054
AMA Style
M. Hasanean H, H. Labban A. Study of the Lower Stratospheric Temperature over the Arabian Peninsula. Climate. 2019; 7(4):54. https://0-doi-org.brum.beds.ac.uk/10.3390/cli7040054
Chicago/Turabian StyleM. Hasanean, Hosny, and Abdulhaleem H. Labban. 2019. "Study of the Lower Stratospheric Temperature over the Arabian Peninsula" Climate 7, no. 4: 54. https://0-doi-org.brum.beds.ac.uk/10.3390/cli7040054
Note that from the first issue of 2016, this journal uses article numbers instead of page numbers. See further details here.