Defining Crop–Climate Departure in West Africa: Improved Understanding of the Timing of Future Changes in Crop Suitability


Climate System Analysis Group (CSAG), Department of Environmental and Geographical Science, University of Cape Town, Private Bag X3, Rondebosch, Cape Town 7701, South Africa
*
Author to whom correspondence should be addressed.
Climate 2019, 7(9), 101; https://0-doi-org.brum.beds.ac.uk/10.3390/cli7090101
Submission received: 20 May 2019
/
Revised: 10 August 2019
/
Accepted: 16 August 2019
/
Published: 21 August 2019
(This article belongs to the Special Issue Sustainable Agriculture for Climate Change Adaptation)
Abstract
:The future climate is projected to change rapidly with potentially severe consequences for global food security. This study aims to improve the understanding of future changes in the suitability of crop growth conditions. It proposes a definition of crop realization, of the climate departure from recent historical variability, or crop–climate departure. Four statistically downscaled and bias-corrected Global Climate Models (GCMs): CCCMA, CNRM5, NOAA-GFDL, and MIROC5 performed simulations for the period 1960–2100 under the Representative Concentration Pathway RCP8.5 scenario to compute 20 year moving averages at 5-year increments. These were used to drive a crop suitability model, Ecocrop, for eight different crops across the three Food and Agriculture Organizations (FAO) AgroEcological Zones (AEZs) of West Africa (Guinea, Sahel, and Savanna). Simulations using historical climate data found that all crops except maize had a suitability index value (SIV) ≥0.50 outside the Sahel region, equivalent to conditions being suitable or strongly suitable. Simulations of future climate reveal that warming is projected to constrain crop growth suitability for cassava and pineapple in the Guinea zone. A potential for the northward expansion of maize is projected by the end of the century, suggesting a future opportunity for its growth in the southern Sahel zone. Crop growth conditions for mango and pearl millet remain suitable across all three AEZs. In general, crops in the Savanna AEZ are the most sensitive to the projected changes in climate. The changes in the crop–climate relationship suggests a future constraint in crop suitability, which could be detrimental to future food security in West Africa. Further studies to explore associated short- and long-term adaptation options are recommended.
1. Introduction
The livelihood and economies of most Sub Saharan African (SSA) countries are driven by rainfed agriculture [1,2,3]. About 96% of agricultural lands in SSA are rainfed [1,4]. Agriculture employs over 65% of the active labour force of the region, the majority of whom are practicing subsistence rainfed farming [5]. The agricultural sector is also responsible for 75% of SSA domestic trade [6,7]. It adds significantly to the economy of the region by contributing up to 15–20% to the Gross Domestic Product (GDP) [1,4,8,9]. In 2000, about 80% of the cereals consumed in SSA were domestically produced locally [4]. However, West Africa has been identified as one of the most vulnerable regions of the world owing to its low adaptive capacity and a fast-growing population, with many citizens whom are faced with malnourishment [1,10,11,12]. An adverse change in the climate over West Africa, both spatially and temporally, coupled with inadequate institutional and economic capacity to cope or adapt to its impact could become a determinant threat to agricultural production. Thus, food security and socio-economic activities across the region may be affected [13,14,15,16,17].
Climate strongly affects rainfed agriculture with direct consequences on food security [18,19,20]. This has resulted in different studies focusing on the response of crops and agriculture to the impact of increased greenhouse gas emissions across different regions of SSA owing to malnutrition and the need to improve food security [1,11,20,21,22]. Extreme changes in climate are projected to increase [23], translating into increased occurrence of both droughts and floods, which already account for 70% of economic losses through soil erosion and drought in West Africa [24,25]. The fifth Intergovernmental Panel on Climate Change (IPCC) assessment reported a projected warming across the different seasons over SSA to be larger than the global annual mean temperature increase [23]. The projected warming (1.5–4 °C by 2100) is likely to affect the agricultural sector by a reduction of up to 50% in crop yield and 90% in revenue across the region by the end of the century [7,23]. However, this may be further aggravated in regions like West Africa where the climate is warming faster and may lead to a radical departure from the regions’ historical variability [26].
The definition of departure varies across disciplines. Broadly, a departure refers to a deviation or variation from a norm, standard rule, or behaviour. It can also mean starting out on a new course of action. In climate science, climate departure can be defined as a shift in the climate pattern of a region outside the range of historical variability and may be described in terms of mean local temperature exceeding historical highs [27,28,29]. Mora et al. [29] described climate departure as the year in which the average temperature of the coldest year after 2005 was warmer than the historic hottest year at a given location. Here we have defined climate departure as a deviation from the historical mean and/or variance of the local climate of an area or region induced by global warming [30].
The projected global warming level and the timing over the continent may intensify the impact of climate change on crop suitability. Severe temperature fluctuations and other extreme weather conditions such as droughts and floods may also threaten crop suitability thresholds. They vary spatially, resulting in potential yield declines where crop growth conditions are currently suitable and possible yield increases in other areas [31,32]. Challinor et al. [33], for instance, projected a future decline in crop yield of up to 5% for every degree of warming above the historical level in Africa.
Given the current state of climate departure research and the direct impact of climate on crop production systems (particularly rainfed), we are interested in the climate change induced crop realizations when climate departs from historical variability, which we term crop–climate departure. This study explores and proposes the information value of a comprehensive definition of crop–climate departure as “a departure from historical crop suitability threshold, whether in terms of variability, mean or both, due to warming of the climate over a location both in space and time resulting from climate change whether of radical climatic nature or not”. This is in the context of recent climate historical variability and future climate projections using three West African weather stations, within three Food and Agriculture Organizations (FAO) Agro-Ecological Zones (AEZs). Mora et al. [29] suggests that West Africa will experience a climate departure with a mean temperature about two decades (2029) earlier than the global mean temperature (2047). Thus, we use the region as our proof of concept and to examine any likely large-scale crop suitability consequent changes the region may already be experiencing. Section 2 describes the data and methods used. Results from the study are outlined in Section 3. The discussion of the results and concluding remarks and recommendations for future are in Section 4 and Section 5, respectively.
2. Data and Methods
2.1. Study Area
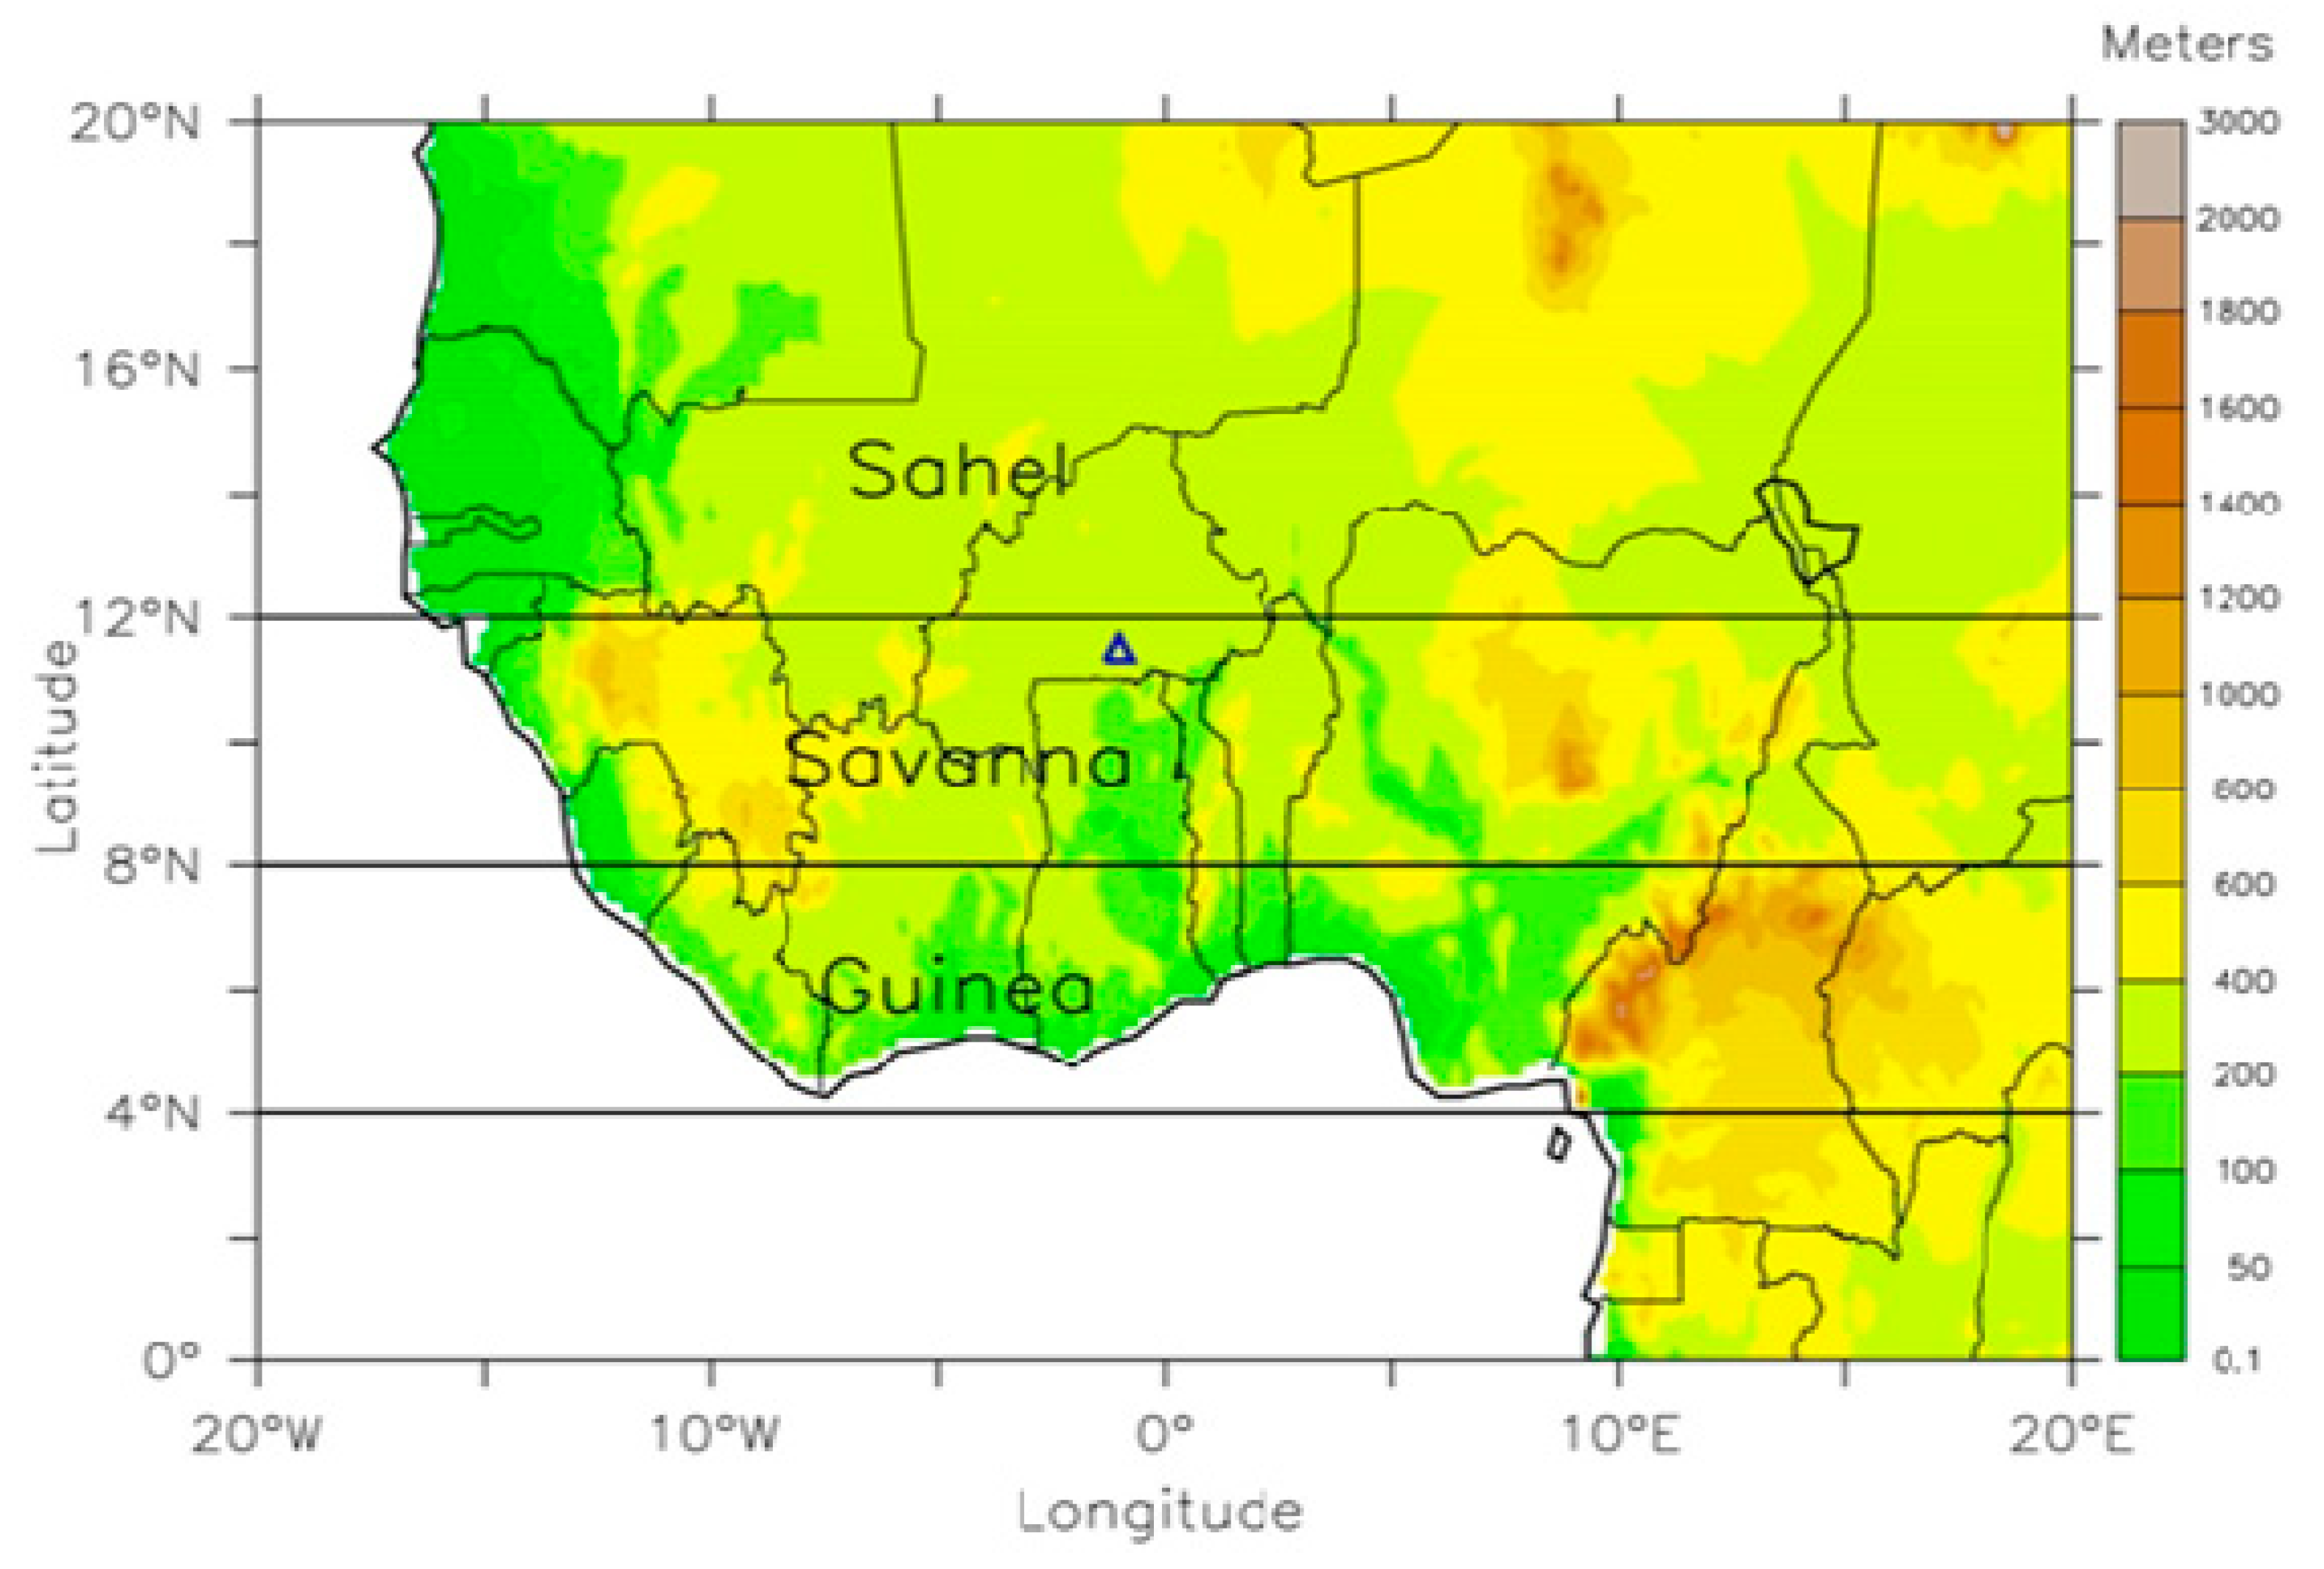
The demonstration area for this work is West Africa (Figure 1), which has rainfed agriculture as its mainstay economy. It is located at latitude 4–20° N and 16° W–20° E. The region comprises of 15 countries namely Benin, Burkina Faso, Gambia, Ghana, Guinea Bissau, Guinea, Ivory Coast, Liberia, Mali, Mauritania, Niger, Nigeria, Senegal, Sierra Leone, and Togo. It is divided into three FAO AEZs: Guinea (4–8° N), Savanna (8–12° N), and the Sahel (12–20° N) [25,34]. The temperature increases to the north of the region, while precipitation increases towards the south [25,34,35]. The Sahel zone is the warmest and driest, while the Guinea zone is the coolest and wettest of the three AEZs in West Africa. The climate of the region is mainly controlled by the West African Monsoon (WAM) which accounts for about 70% of the annual rainfall [20,34]. The WAM is an important and dynamic characteristic of the West African climate during the summer period [36]. It is produced from the reversal of the land and ocean differential heating and dictates the seasonal pattern of rainfall over West Africa between latitudes 9° and 20° N. The WAM is characterized by winds that blow south–westerly during the warmer months (June–September) and north-easterly during the cooler months (January–March) of the year [25,36]. It is the major system that influences the onset, variability, and pattern of rainfall over West Africa [3,37]. This affects rainfall producing systems with an impact on rainfed agriculture, which influences crop growth suitability and consequently food production in the region.
Different crops are grown in various parts of West Africa. Some of the major crops grown in the region are cassava, groundnut, millet, maize, sorghum, yam, plantain, cocoa, rice, and cowpea [20,38,39,40]. Millet and sorghum accounted for 64% of cereal production within the region in the year 2000, making them among the more important staple crops in West Africa [20,41]. Cassava is also an important staple food crop in terms of production in West Africa owing to its high resilience to drought [20,40,42]. This also applies to yam production, which accounts for about 91% of the world’s production [20,41,43]. Maize provides about 20% of the calorie intake in West Africa and is adjudged the most important staple food overall in SSA [20,41]. Other crops such as cocoa and plantain, to mention a few, contribute significantly to the economy of the region.
2.2. Data
This study used three dataset types: observational weather station data, climate modelled data (statistically downscaled at the weather station level), and crop suitability data. The observed weather station data validated the mean monthly temperature and total monthly rainfall across the three AEZs. The crop suitability time series were simulated based on output from the Ecocrop suitability model [43] and the modelled climate data.
2.2.1. Climatic Variables
Temperatures (minimum and mean) and rainfall are important climate variables used in determining the impacts of climate change at subcontinental to global scales [44,45]. These two climate variables also have a significant effect on crop yield [46]. While rainfall affects the crop production in relation to its photosynthesis activities and leaf area, temperature affects the length of the crop growing season [47,48]. For this study, we used mean monthly minimum temperature (t-min) and mean monthly temperature (t-mean) and total monthly precipitation (prec.) of weather station data from Tabou, Ivory Coast; Sokode, Togo; Magaria, Niger. These weather stations each lie in three AEZs, Guinea, Savanna, and Sahel, respectively over West Africa. For the study, we used four statistically downscaled and bias corrected Global Climate Models (GCMs) in our analysis (CCCMA, CNRM5, GFDL, and MIROC) under a high-end climate change emission scenario (no adaptation), RCP8.5 (See Table 1 below for a description of the model). The GCMs were statistically downscaled using the Conditional Interpolation method as described in Hewitson and Crane [49]. The Conditional Interpolation downscaling method calculates the local phase relationships (PMI) for each weather station and each synoptic state combination. The bias relationship (BSI) between the weather station and its surroundings is then calculated. The method estimates the spatial extent of precipitation accurately and derives spatially referenced values representative of the area average. Overall, the interpolation conditioned by the synoptic state appears to better estimate realistic gridded values appropriate for use with model simulation output. For the temperature variable, the conditional interpolation employs the information content of the source data coupled with additional assumptions that may be physically justified (such as lapse-rate effects). The climate data were sourced from the Climate Information Portal (CIP) of the Climate System Analysis Group (CSAG), University of Cape Town (http://www.csag.uct.ac.za/climate-services/cip/). Data from this portal are at the station scale and weather stations in each AEZ are representative of that area.
2.2.2. Crop Thresholds to Suitability
The results of field experiments apply globally. A database of crop thresholds that translate into climate suitability has been collected and used in many locations to describe the suitability range of many plant and crop species using prec., t-min, t-mean, and the length of the growing season [43,50]. The climate threshold hosted by FAO dataset was obtained from the “dismo” package of the cran R software [51] (https://cran.r-project.org/web/packages/dismo/index.html). It was used in computing the climate suitability of each crop evaluated. It is acknowledged that thresholds will vary depending on finer resolution of the species (e.g., different varieties) or location (e.g., different soil, different rain distribution). However, the concept of crop suitability and the general validation of the thresholds makes this a useful tool to assess the impact of climate change and the emergence of novel regional climates on crop suitability over large areas examining the concept of crop–climate departure. The Ecocrop suitability model assessed four broad crop types and eight crops in total: cereals (pearl millet and maize); horticultural crops (tomato and pineapple); root and tuber crops (plantain and cassava) and fruit crops (mango and orange), using Ecocrop. The crop thresholds are listed in Table 2.
2.2.3. Model Description
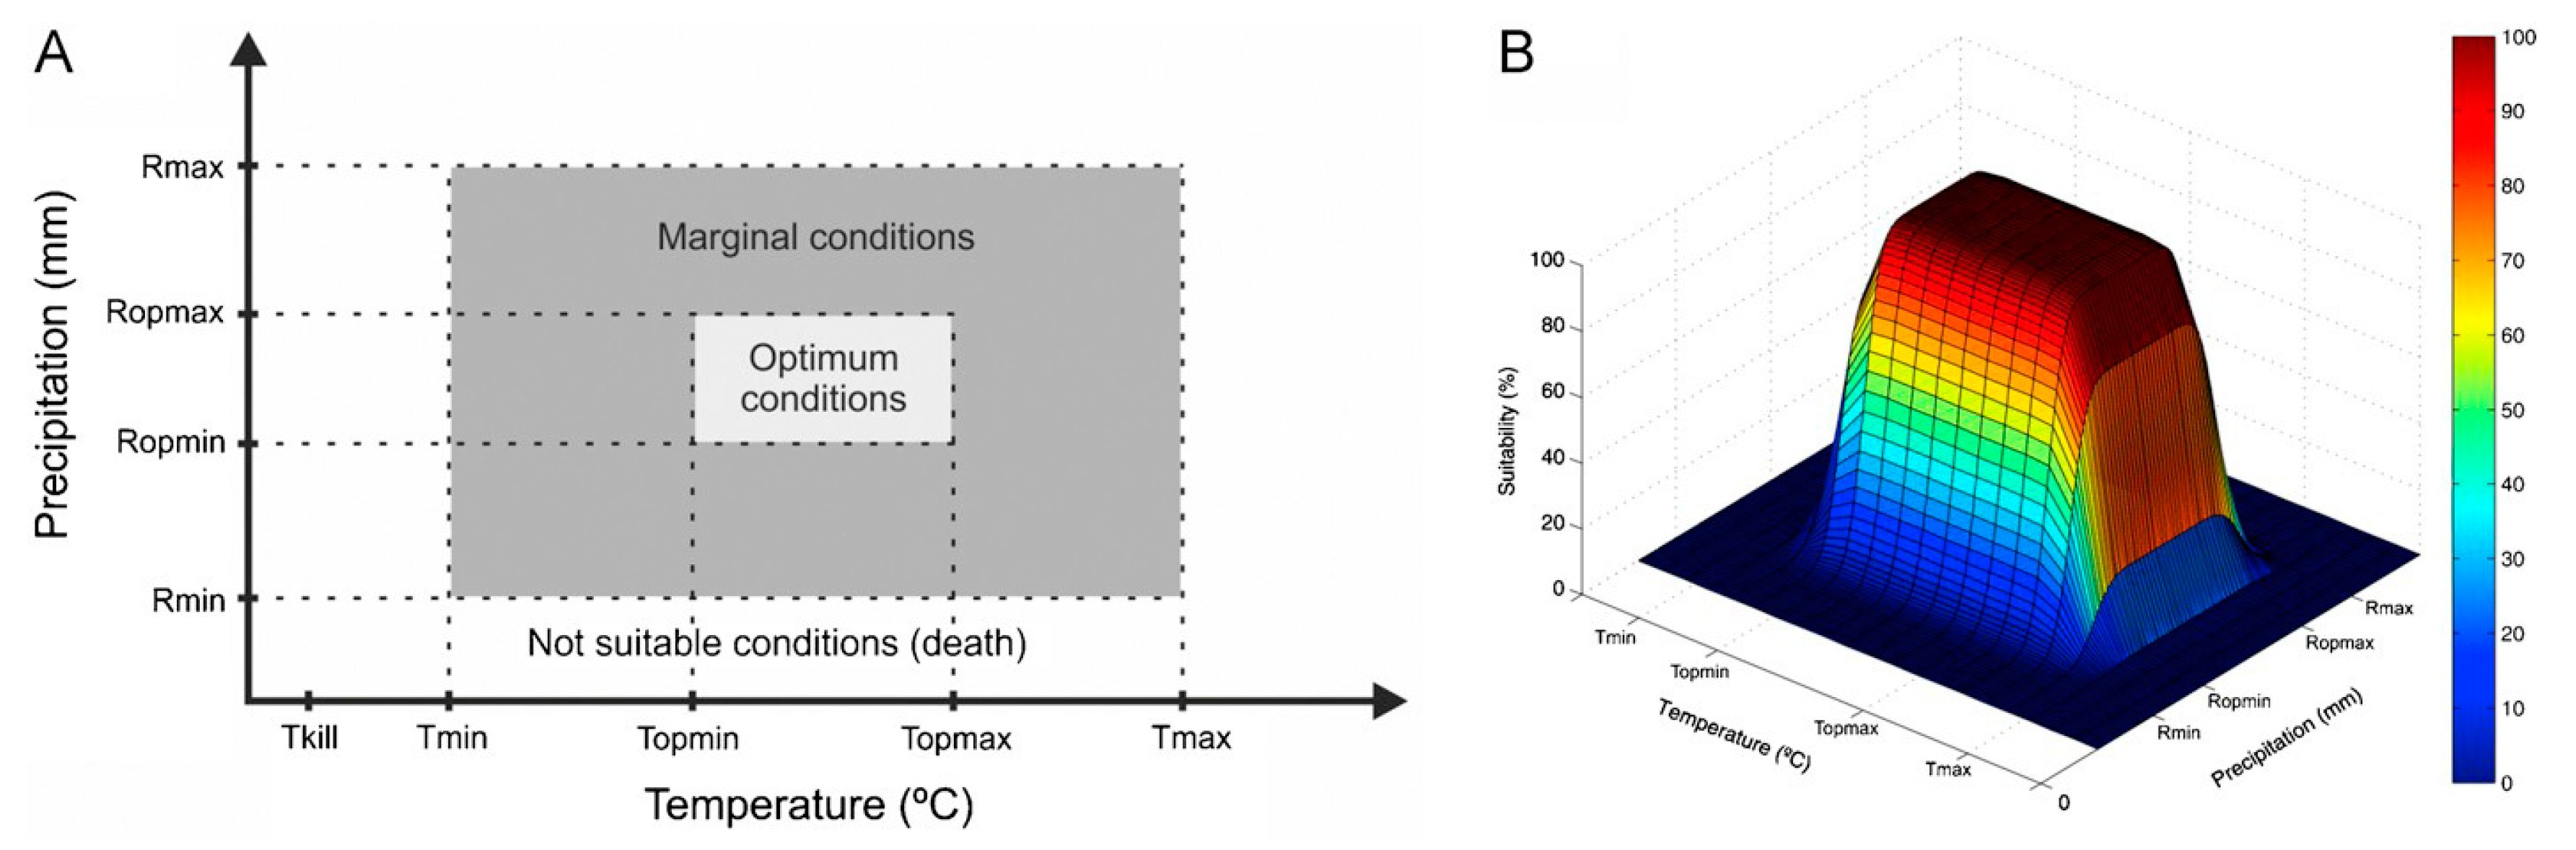
The Ecocrop model is a crop suitability model. It uses a crop growth suitability threshold dataset hosted by the FAO [43]. It is an empirical model originally developed by Hijmans et al. [43] and based on the FAO-Ecocrop database [50] (Figure 2). The computation of optimal, suboptimal, and non-optimal conditions based on these datasets allows for the simulation of the suitability of crops in response to 12-month climate via t-min, t-mean, and prec. [43] (Figure 2). The Ecocrop model evaluates the relative suitability of crops in response to a range of climates including rainfall, temperature, and the growing season for optimal crop growth. A suitability index is generated as follows: 0 < 0.25 (not suitable), 0.25 < 0.5 (marginally suitable), 0.5 < 0.75 (suitable), and 0.75 < (highly suitable) [50,52]. The default Ecocrop parameters were assumed. Although those thresholds may vary with different geographical and/or climatic conditions, previous studies report a close correlation between the Ecocrop model and the climate change impact projections from other crop models [16,27,33,50]. A paucity of data over regions of interest like SSA limits the validation of these processes [53]. Nevertheless, the method contributes to the demand for regional scale assessment of crop response to future climate projections. The 12 coloured lines observed for the Ecocrop climate suitability simulations in Figure 2a,b below represents 12 months. Each describes the most suitable conditions for the crop under consideration in any given month. A highly seasonal crop (e.g., maize) has suitable growth conditions for a limited number of months. The conditions for non-seasonal crops are suitable throughout the year. Crops with a growing cycle longer than a year (e.g., pineapple and plantain) are represented by a single 12-month period.
2.3. Method
Four GCMs for the period 1960–2100 under the RCP8.5 scenario computed a 20-year moving average at 5 year time increments. It generated one mean 12-month value per 20-year window period for t-min, tmean, and prec. The mean 12-month climate value informed the crop suitability model, Ecocrop, for each GCM based on the methodologies described in Ramirez-Villegas, Jarvis, and Läderbach [50] for eight crops across the three AEZs of West Africa. The Ecocrop model simulated crop suitability indices characterized the crop–climate relationship and the impact global warming has on this relationship for each AEZ both spatially and temporally for each climate window. The suitability index scores were calculated for a range of climate variables for the period 1980–2000 using observed weather station data. This was used as a baseline to evaluate the downscaled GCM results spanning 1960–2100 at the three West African weather stations. It assessed the crop growth suitability in the zone for past climate conditions in reference to the published literature. Present day climate data was used as the preference for this zone owing to the constraint and paucity of weather station data and this data being the best available data to overlap with the Ecocrop model for the zone in the given study period.
3. Results
3.1. Evaluation of the GCMs in Simulating Rainfall and Temperature over West Africa
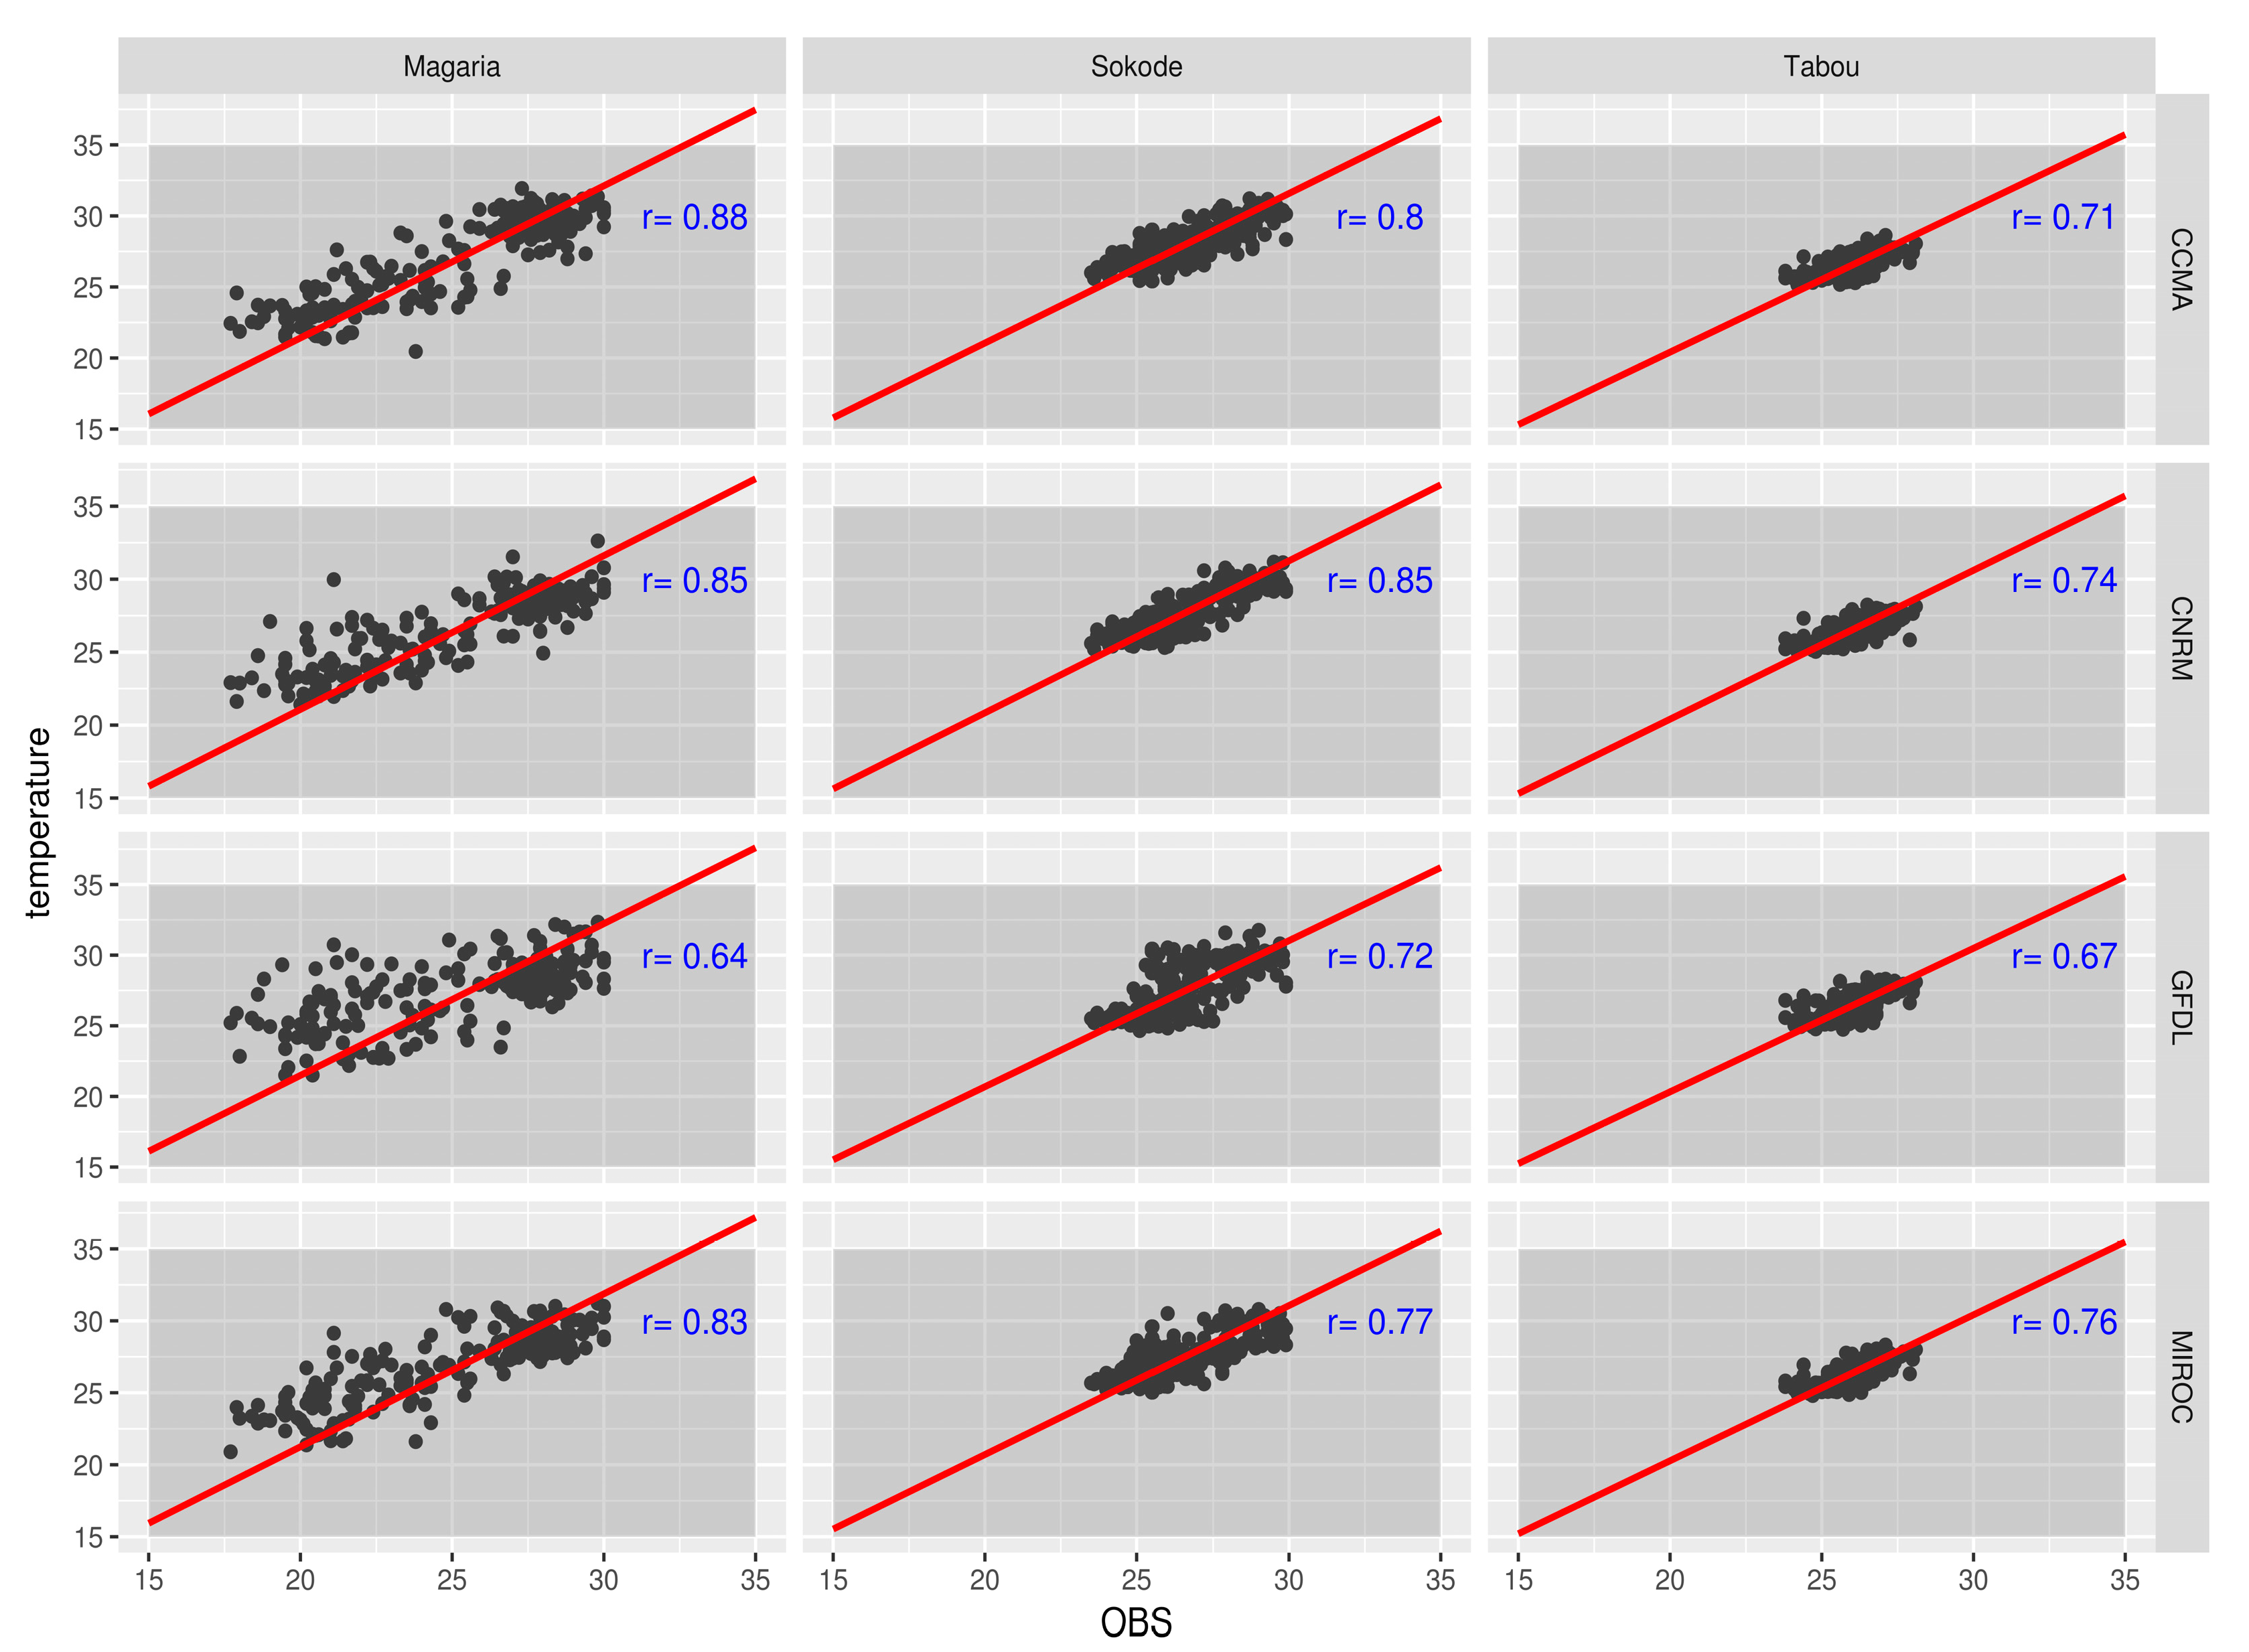
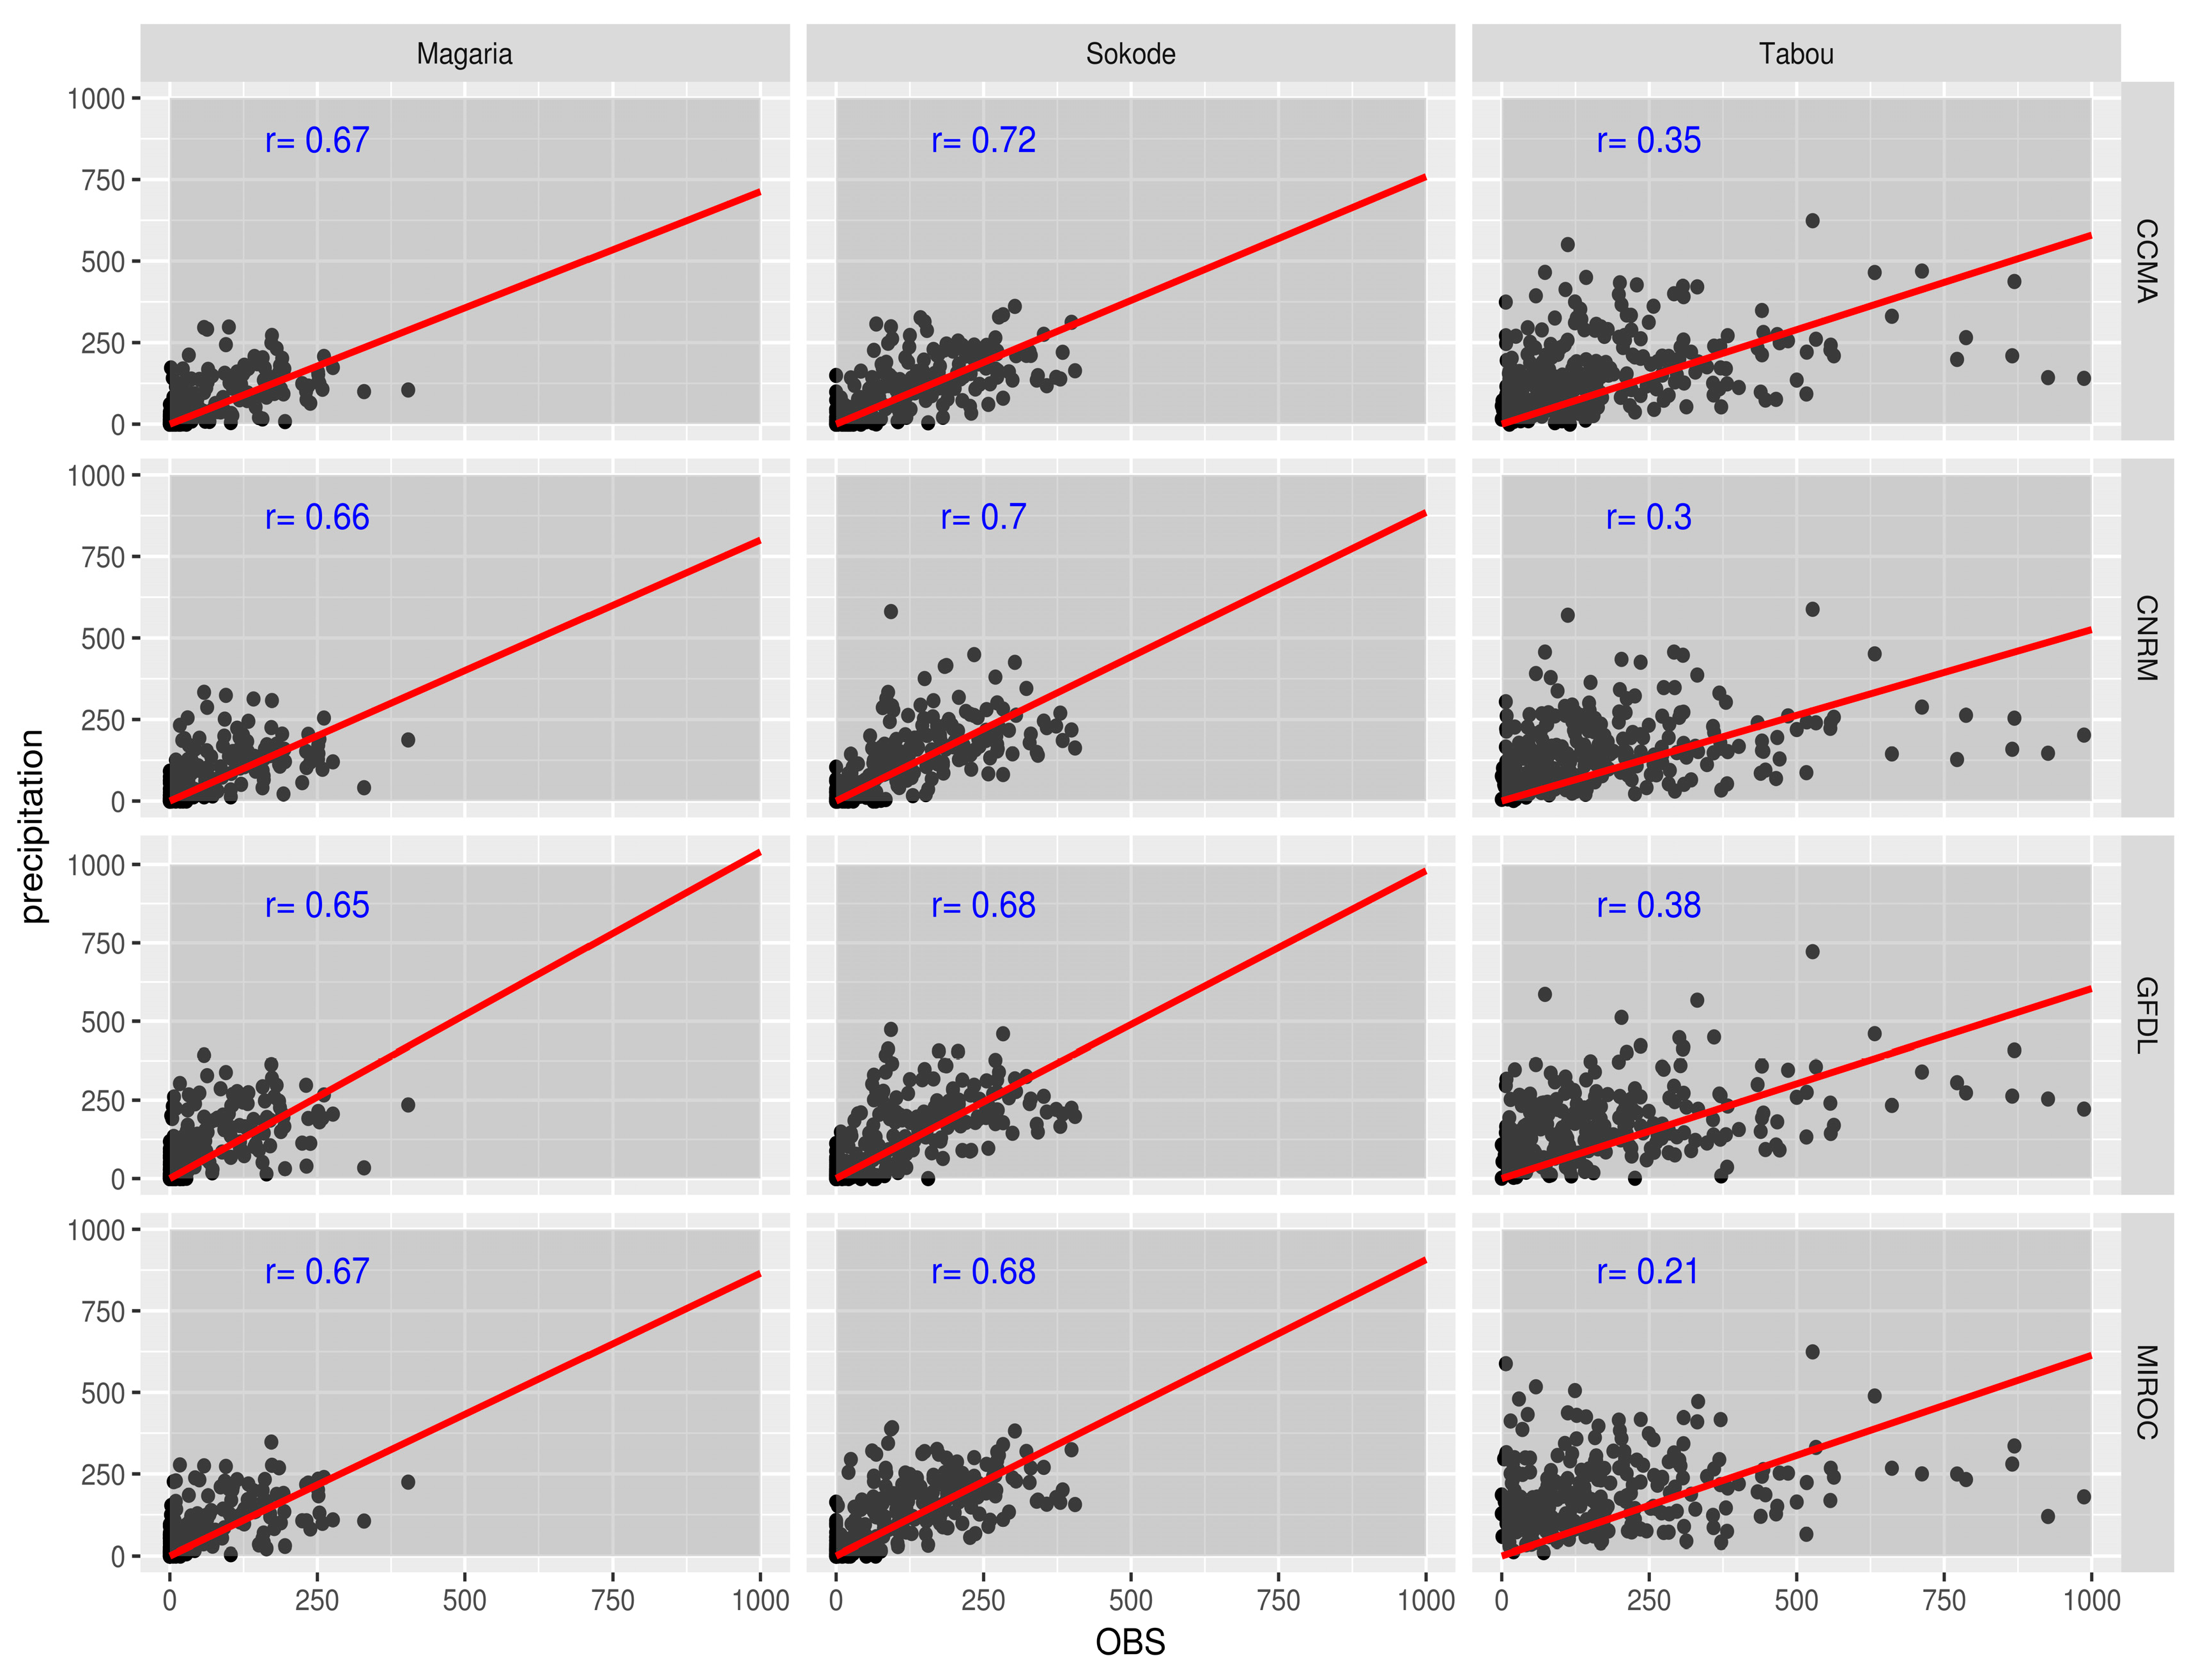
The downscaled climate data was firstly validated with the observed weather station data. Where missing records occurred, the corresponding month in the model’s data were removed before computing the relationship between the datasets. Each GCM was correlated with the observed data for prec. and t-mean over the three weather stations, despite some discrepancy in precipitation over the Guinea zone (Figure 3 and Figure 4). For temperature, the four models were correlated (r ≥0.6) with the observed t-mean across the three AEZs of West Africa with the highest correlation (r = 0.9) over Magaria. The models were also correlated (r ≥0.6) with the observed prec. in the Savanna and Sahel AEZs. A moderate correlation (r ≥0.3) with observed weather station data was evident in the Guinea AEZ. This weak correlation may be due to the low resolution of the GCMs in capturing the total monthly rainfall in the Guinea zone. The validated GCM data was then input into the Ecocrop model.
3.2. GCMs Representation of AEZs, Seasons, and Suitability over West Africa AEZs
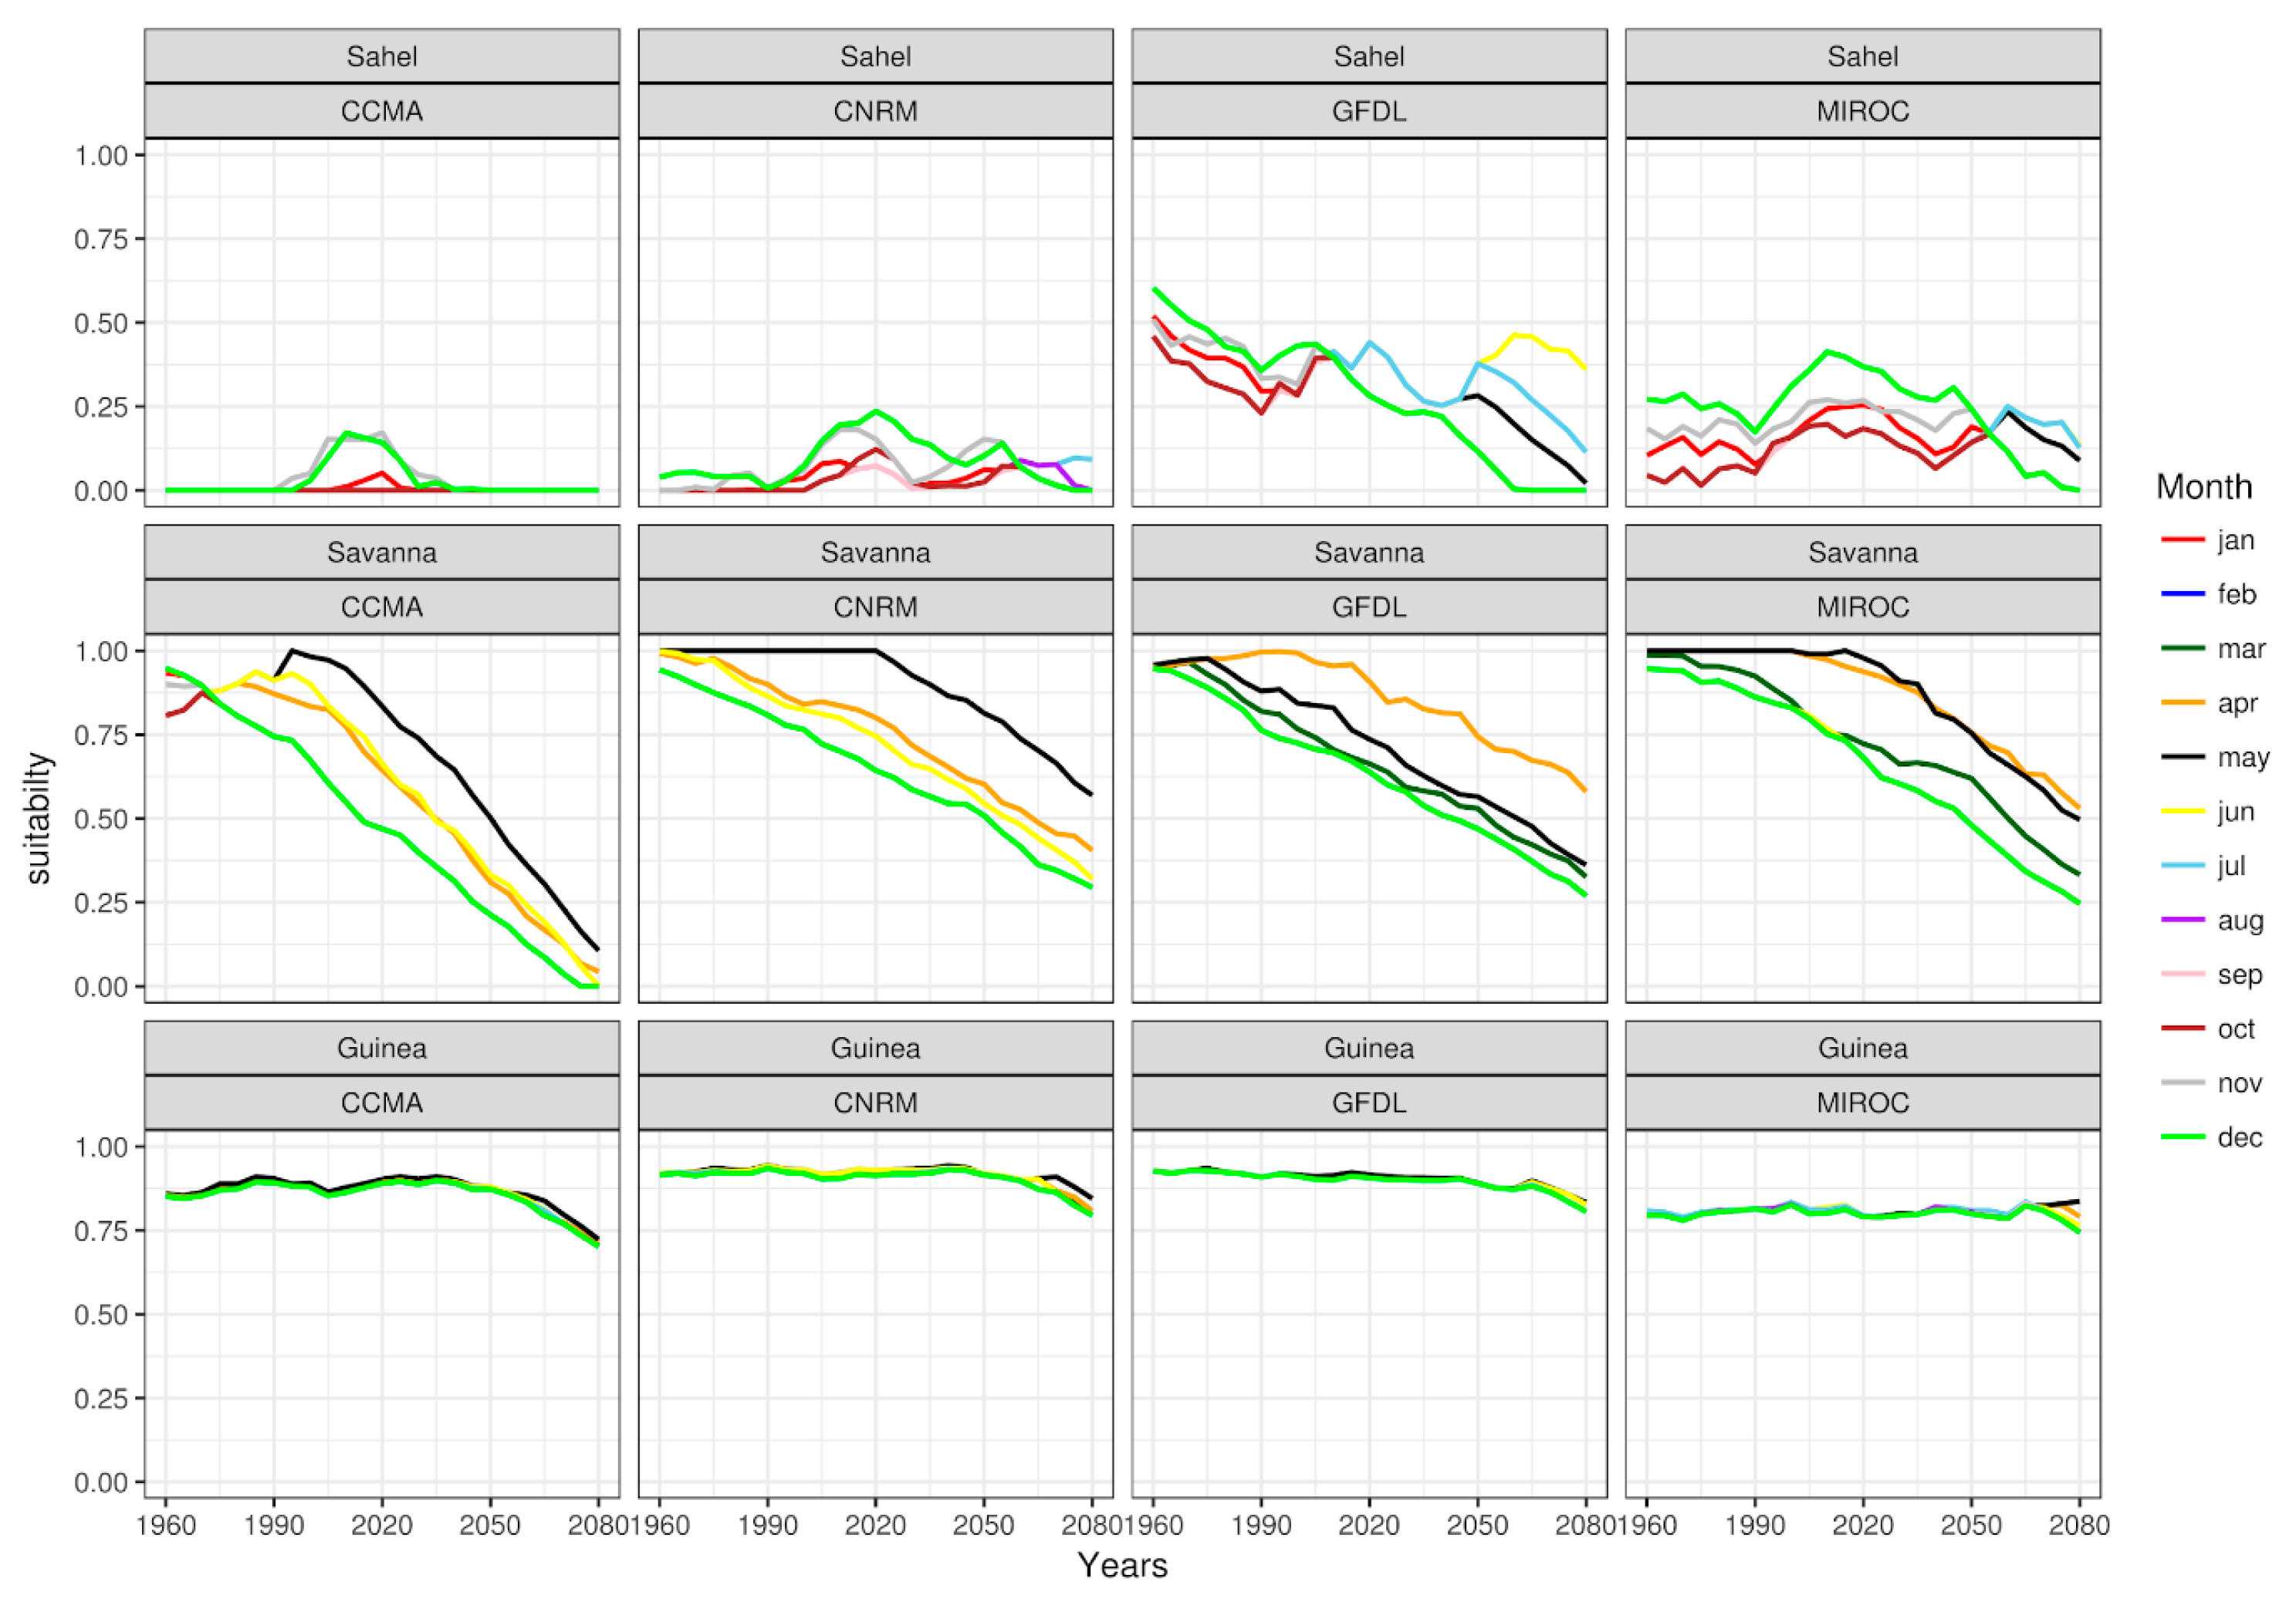
A correlation exists between the Ecocrop suitability model simulated with climate inputs from four GCMs, CCMA, CNRM, GFDL, and MIROC (hereafter Eco-GCMs), although with minor variations in amplitude and time. However, it is worth stating that the variation in simulated suitability by the four GCMs may be attributed to the inter-annual variability of the GCMs or the GCMs parametrization scheme. Nevertheless, Eco-GCMs simulated crop suitability is similar across the three AEZs over West Africa for the eight crops considered in the study. For example, cassava shows a similar suitability pattern across the AEZs (Figure 5). It is unsuitable (Eco-CCMA and CNRM) to marginally suitable (Eco-GFDL and MIROC) for cassava crop growth in the Sahel AEZ. In the Savanna AEZ, it is currently highly suitable for cassava, but this is predicted to decline in the future to become marginally unsuitable. The Guinea AEZ suitability for cassava does not change. The variability in crop growth suitability curves may be attributed to the variation in yield and production of cassava across the region due to the impact of climate change, corroborating previous studies [8,38].
Variability in the suitability of the month of planting for cassava crops in response to both AEZ and time increment is observed across the GCMs (Figure 5). The Guinea AEZ is currently the most suitable AEZ in which to grow cassava and is predicted to remain so. Suitable planting months in the Savanna AEZ as identified by all four models includes April–June and December, however a notable decline is observed, consistent for all four GCMs. Suitability declines from just below 1.0 to below 0.5 by 2050 in most cases. Conditions in the Sahel are presently and remain of low suitability. The simulation of the cassava crop growing season and period of planting across the three AEZs: Guinea (January–July and September–December), Savanna (April–November), and the Sahel (May/June–November) corroborates with previous findings with respect to the planting period and growing season in West Africa [54,55,56].
The concept of crop–climate departure allows for a consolidation of climate outputs from an ensemble of four GCMs into simulated crop suitability indices. Despite the marginal scale differences, the four GCMs consistently represent the unsuitability of cassava in the Sahel AEZ, its fast-declining suitability in the Savanna AEZ, as well as the high suitability of the Guinea AEZ. The cassava growing season is 12 months. Due to the predicted decline in the suitability of growth conditions, it is expected that it will become seasonal i.e., the suitability remains subject to appropriate seasonal planting, but conditions will then become unsuitable in the Savanna AEZ. Farmers will be required to adapt their practices in this AEZ. There is no reason at this stage to prefer one over the other GCMs, thus we use GCMs ensemble data as future climate scenario to simulate crop suitability in the subsequent sections of the paper plots of crop suitability from the Eco-GCMs. As seen from Figure 5, the ensemble suitability plots give a good representation of the Eco-GCMs model simulated suitability across the AEZs over West Africa. It shows the non-suitability of cassava in the Sahel, the fast-declining suitability and the observed seasonality in the Savanna AEZ, and high suitability in the Guinea zone. Thus, the crops ensemble suitability simulations are used in the results and discussion in the subsequent sections of this paper. A summary of crop suitability index values are given in Table 3.
3.3. Crop Suitability Response with Past Climate
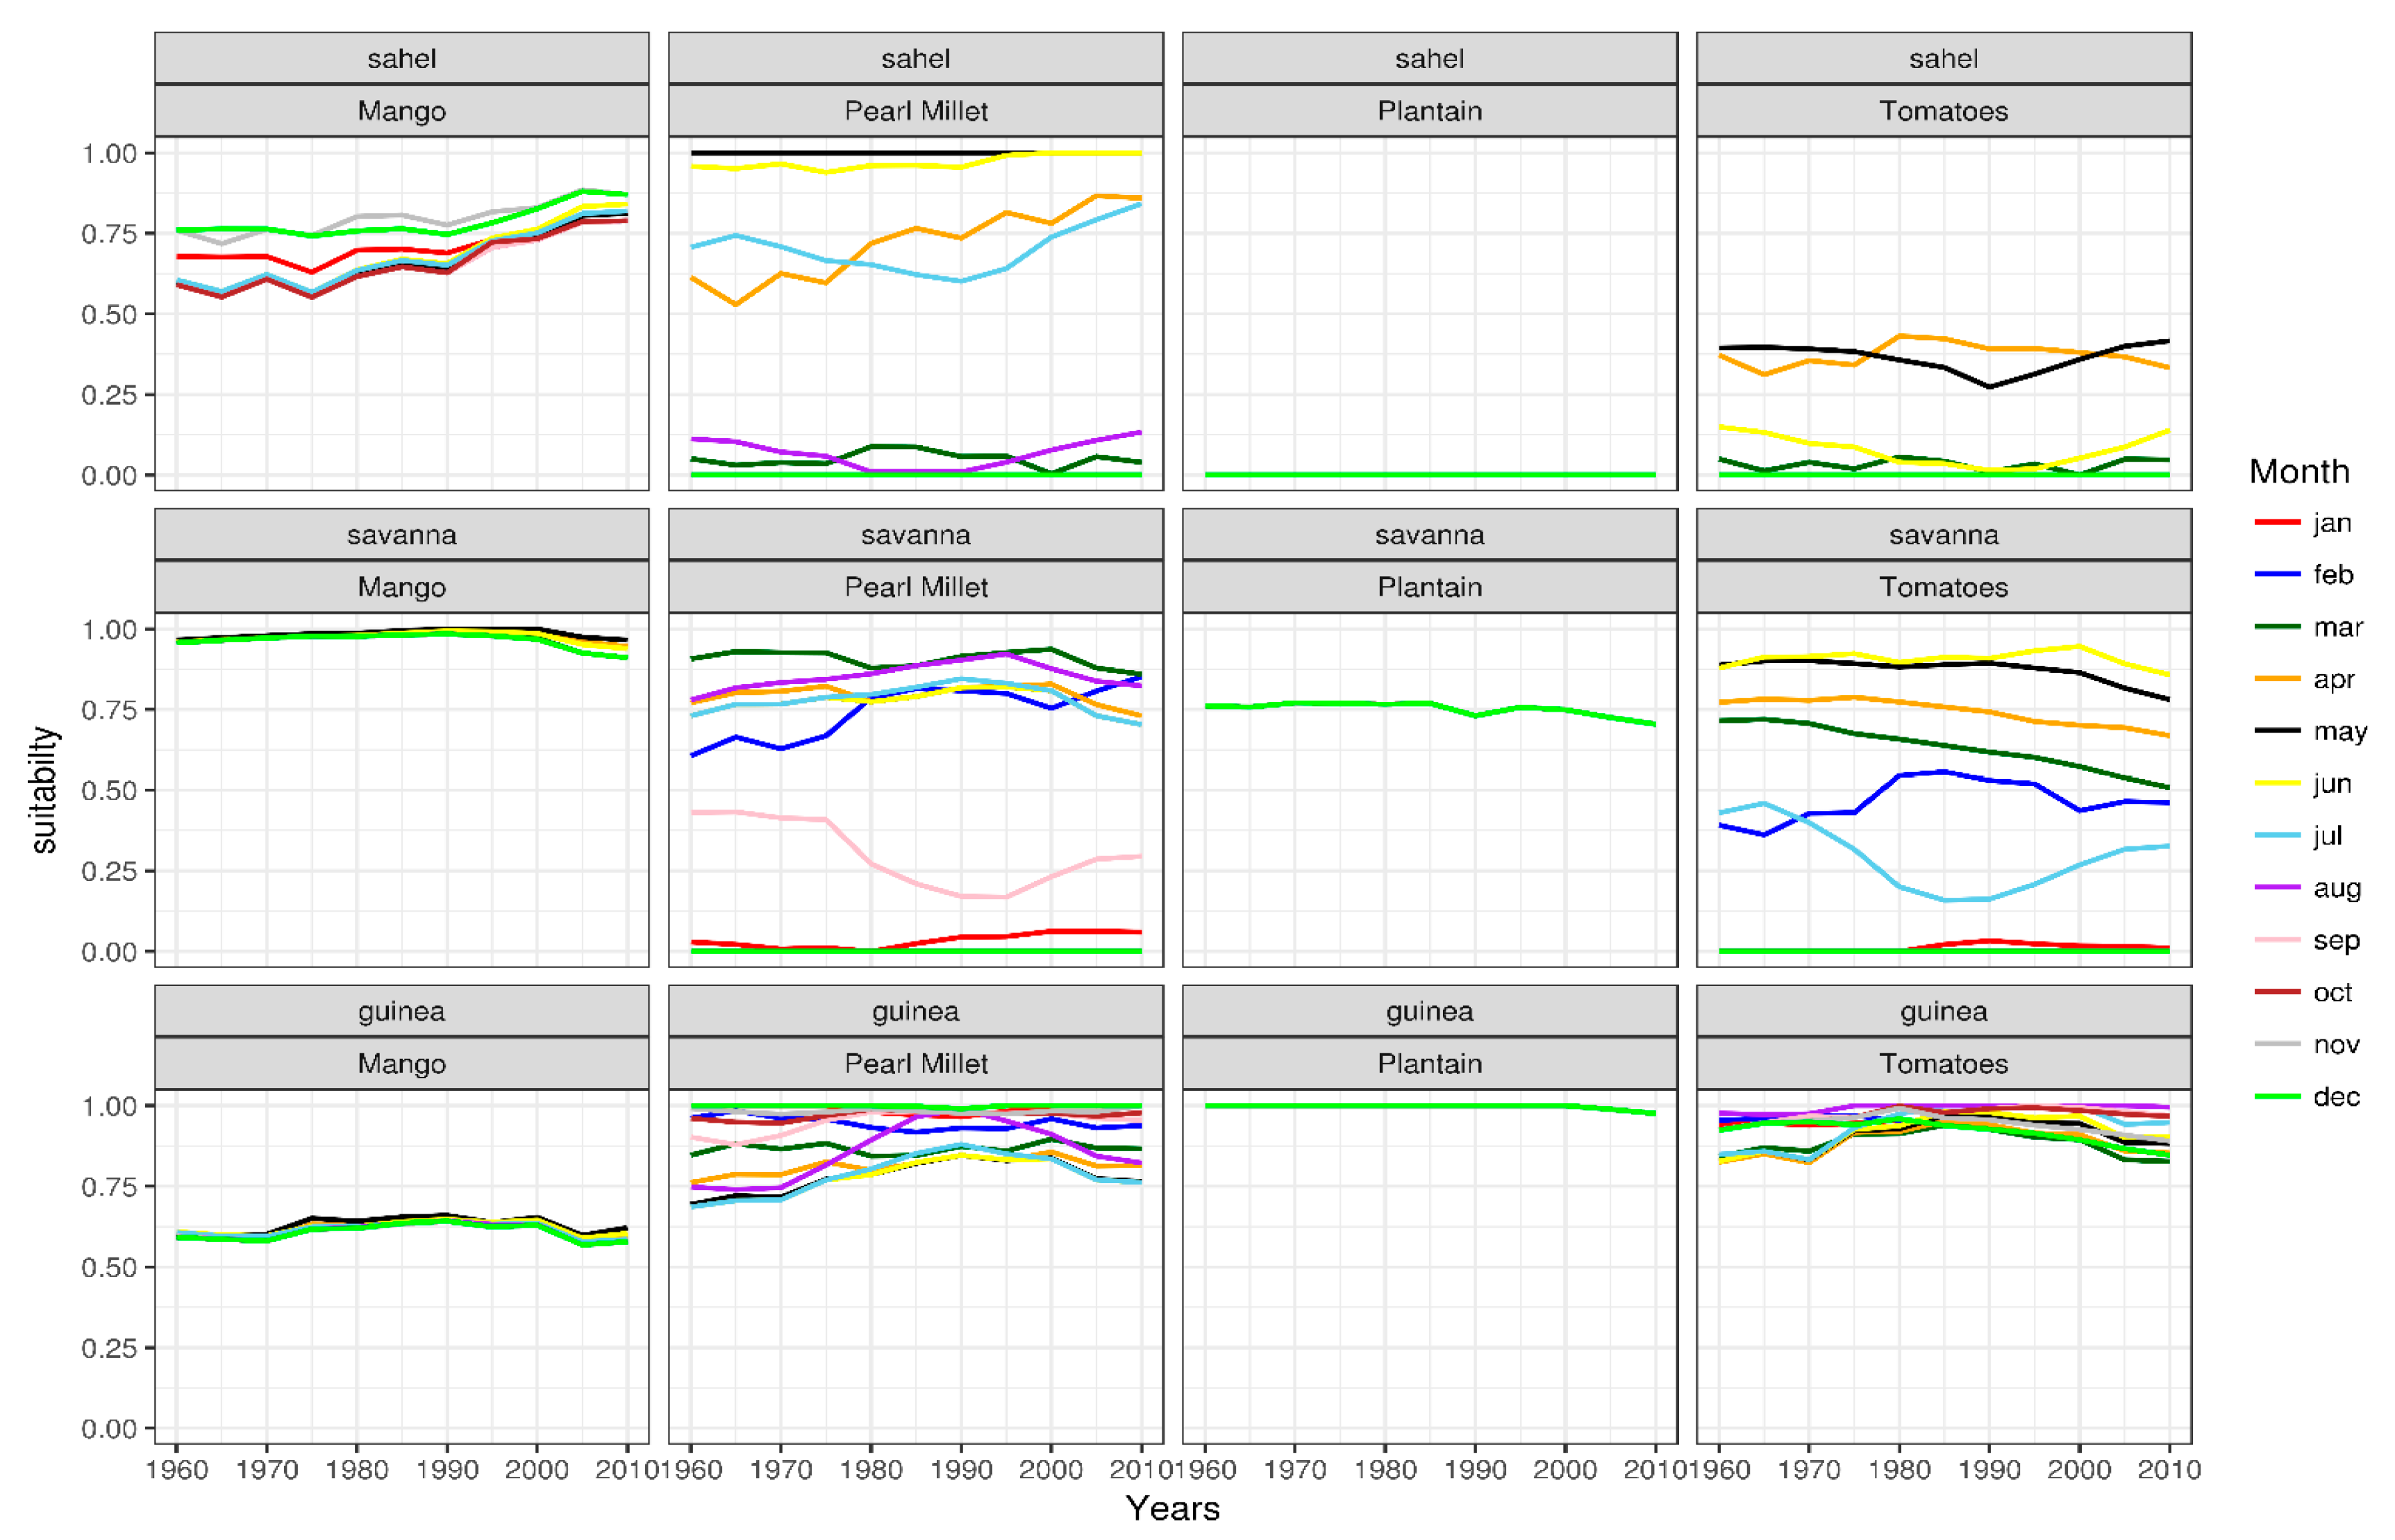
Past climatic conditions (1960–2010) indicate that a crop growth suitability gradient existed from south to north across the three AEZs for each crop type considered. A Suitability Index Value (SIV) (0.75–1.00) is observed for each crop type in the Guinea and Savanna zones throughout the year (Figure 6 and Figure 7). An exception is the cereal crop maize. Maize is marginally suitable (0.25–0.50) in the Guinea AEZ, suitable (0.50–0.75) for planting in May, September, and December in the Savanna AEZ, and January–February in the Sahel AEZ. The suitability increases (0.75–1.00) in 2050 (Figure 6). In the Sahel AEZ, other cereals and mango are suitable (above 0.50). Crop growth suitability increased for pineapple crops in this AEZ.
The Ecocrop simulations of crop growth suitability for the period 1960–2010 and the crop types evaluated corroborate previous findings with respect to the type of crops actually grown in the region. Cereals and root and tuber crops were the principal agricultural commodities in the region during this period [57,58]. Cassava and maize crops demonstrated modest yield increases of 6.3 to 10.3 and 1.1 to 1.8 tons ha−1, respectively in the last 40 years [58,59]. The historical suitability of growth conditions for maize across the region (although marginal in the Guinea zone) highlights its importance as a staple crop here, accounting for almost 20% of the calorie intake for the population of West Africa [20,41]. The large area grown and high yield of pearl millet between 1960 and 2010 can be linked to the high suitability indices across the AEZs of West Africa over this period, contributing considerably to the livelihoods and economies of the countries in this region [60,61]. Increased productivity has also been witnessed in crops such as orange, mango, pineapple, and tomatoes in the last 40 years, again correlating with the high crop growth suitability indices identified for these crops [62,63]. Given the importance of these crops in the regional economy, a key question is, how is the projected change in climate predicted to impact on the crop growth suitability of these key crops in West Africa?
3.4. Projected Changes in Crop Suitability and Time of Planting over West Africa
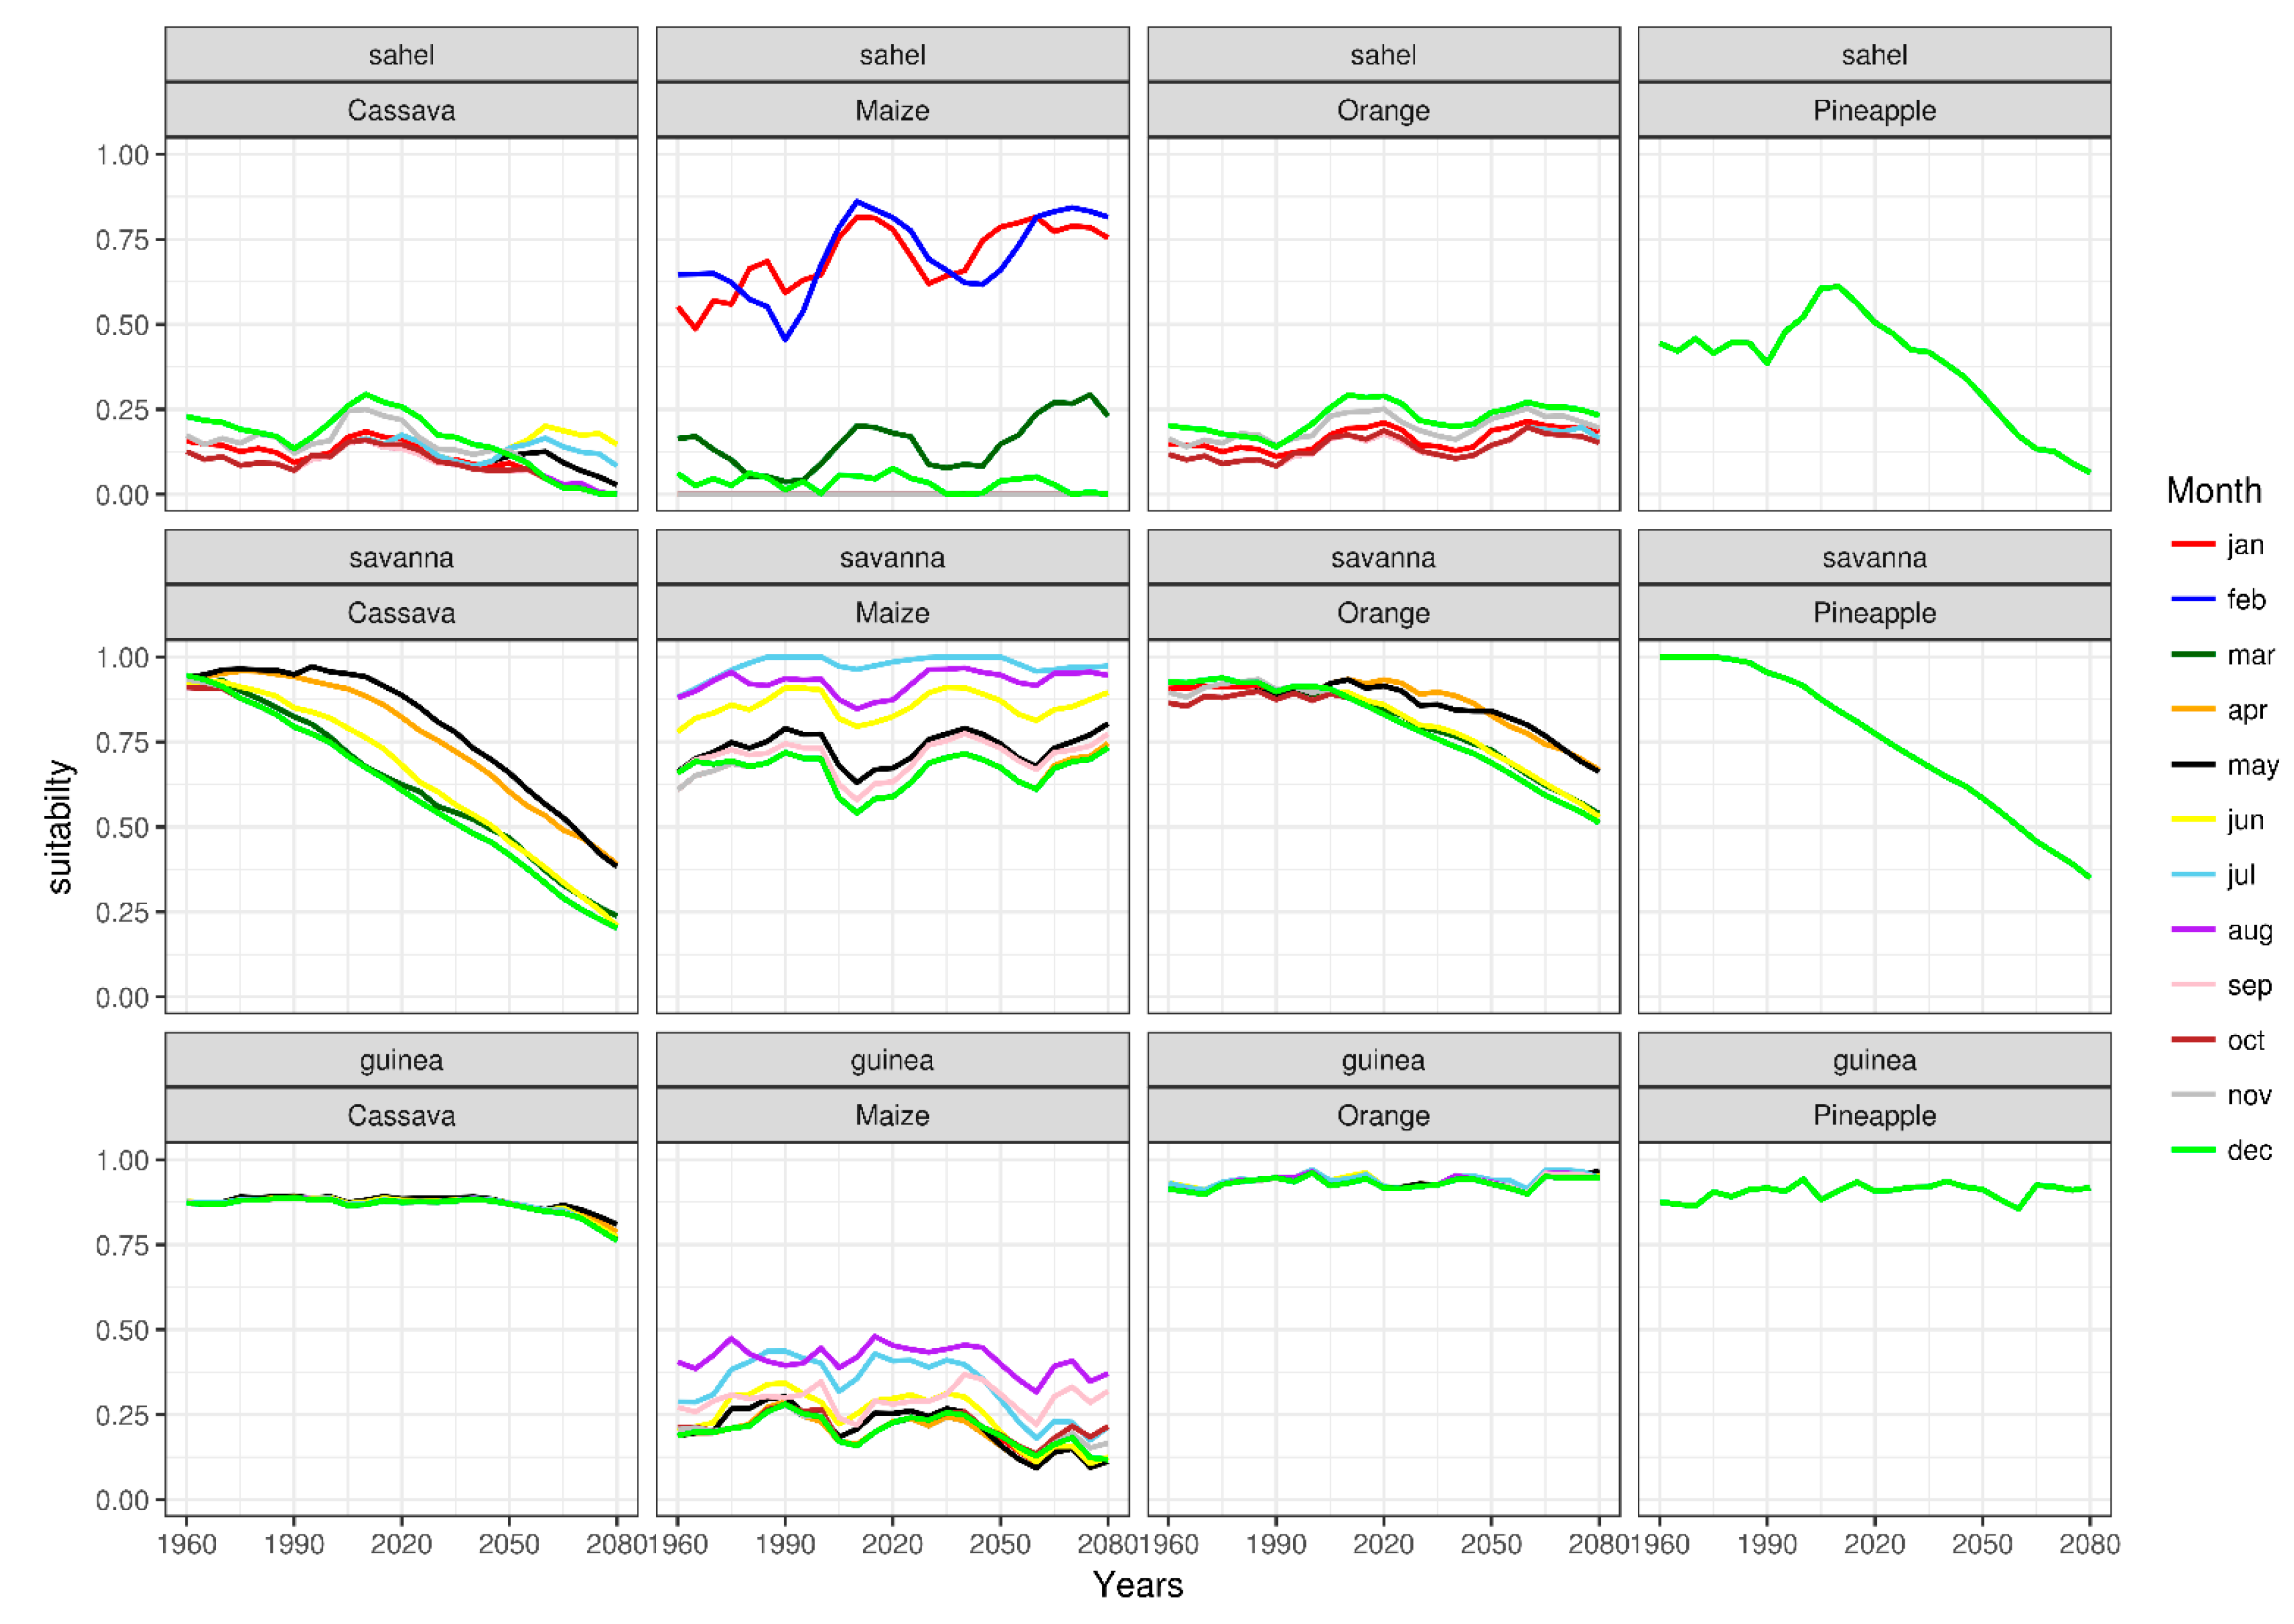
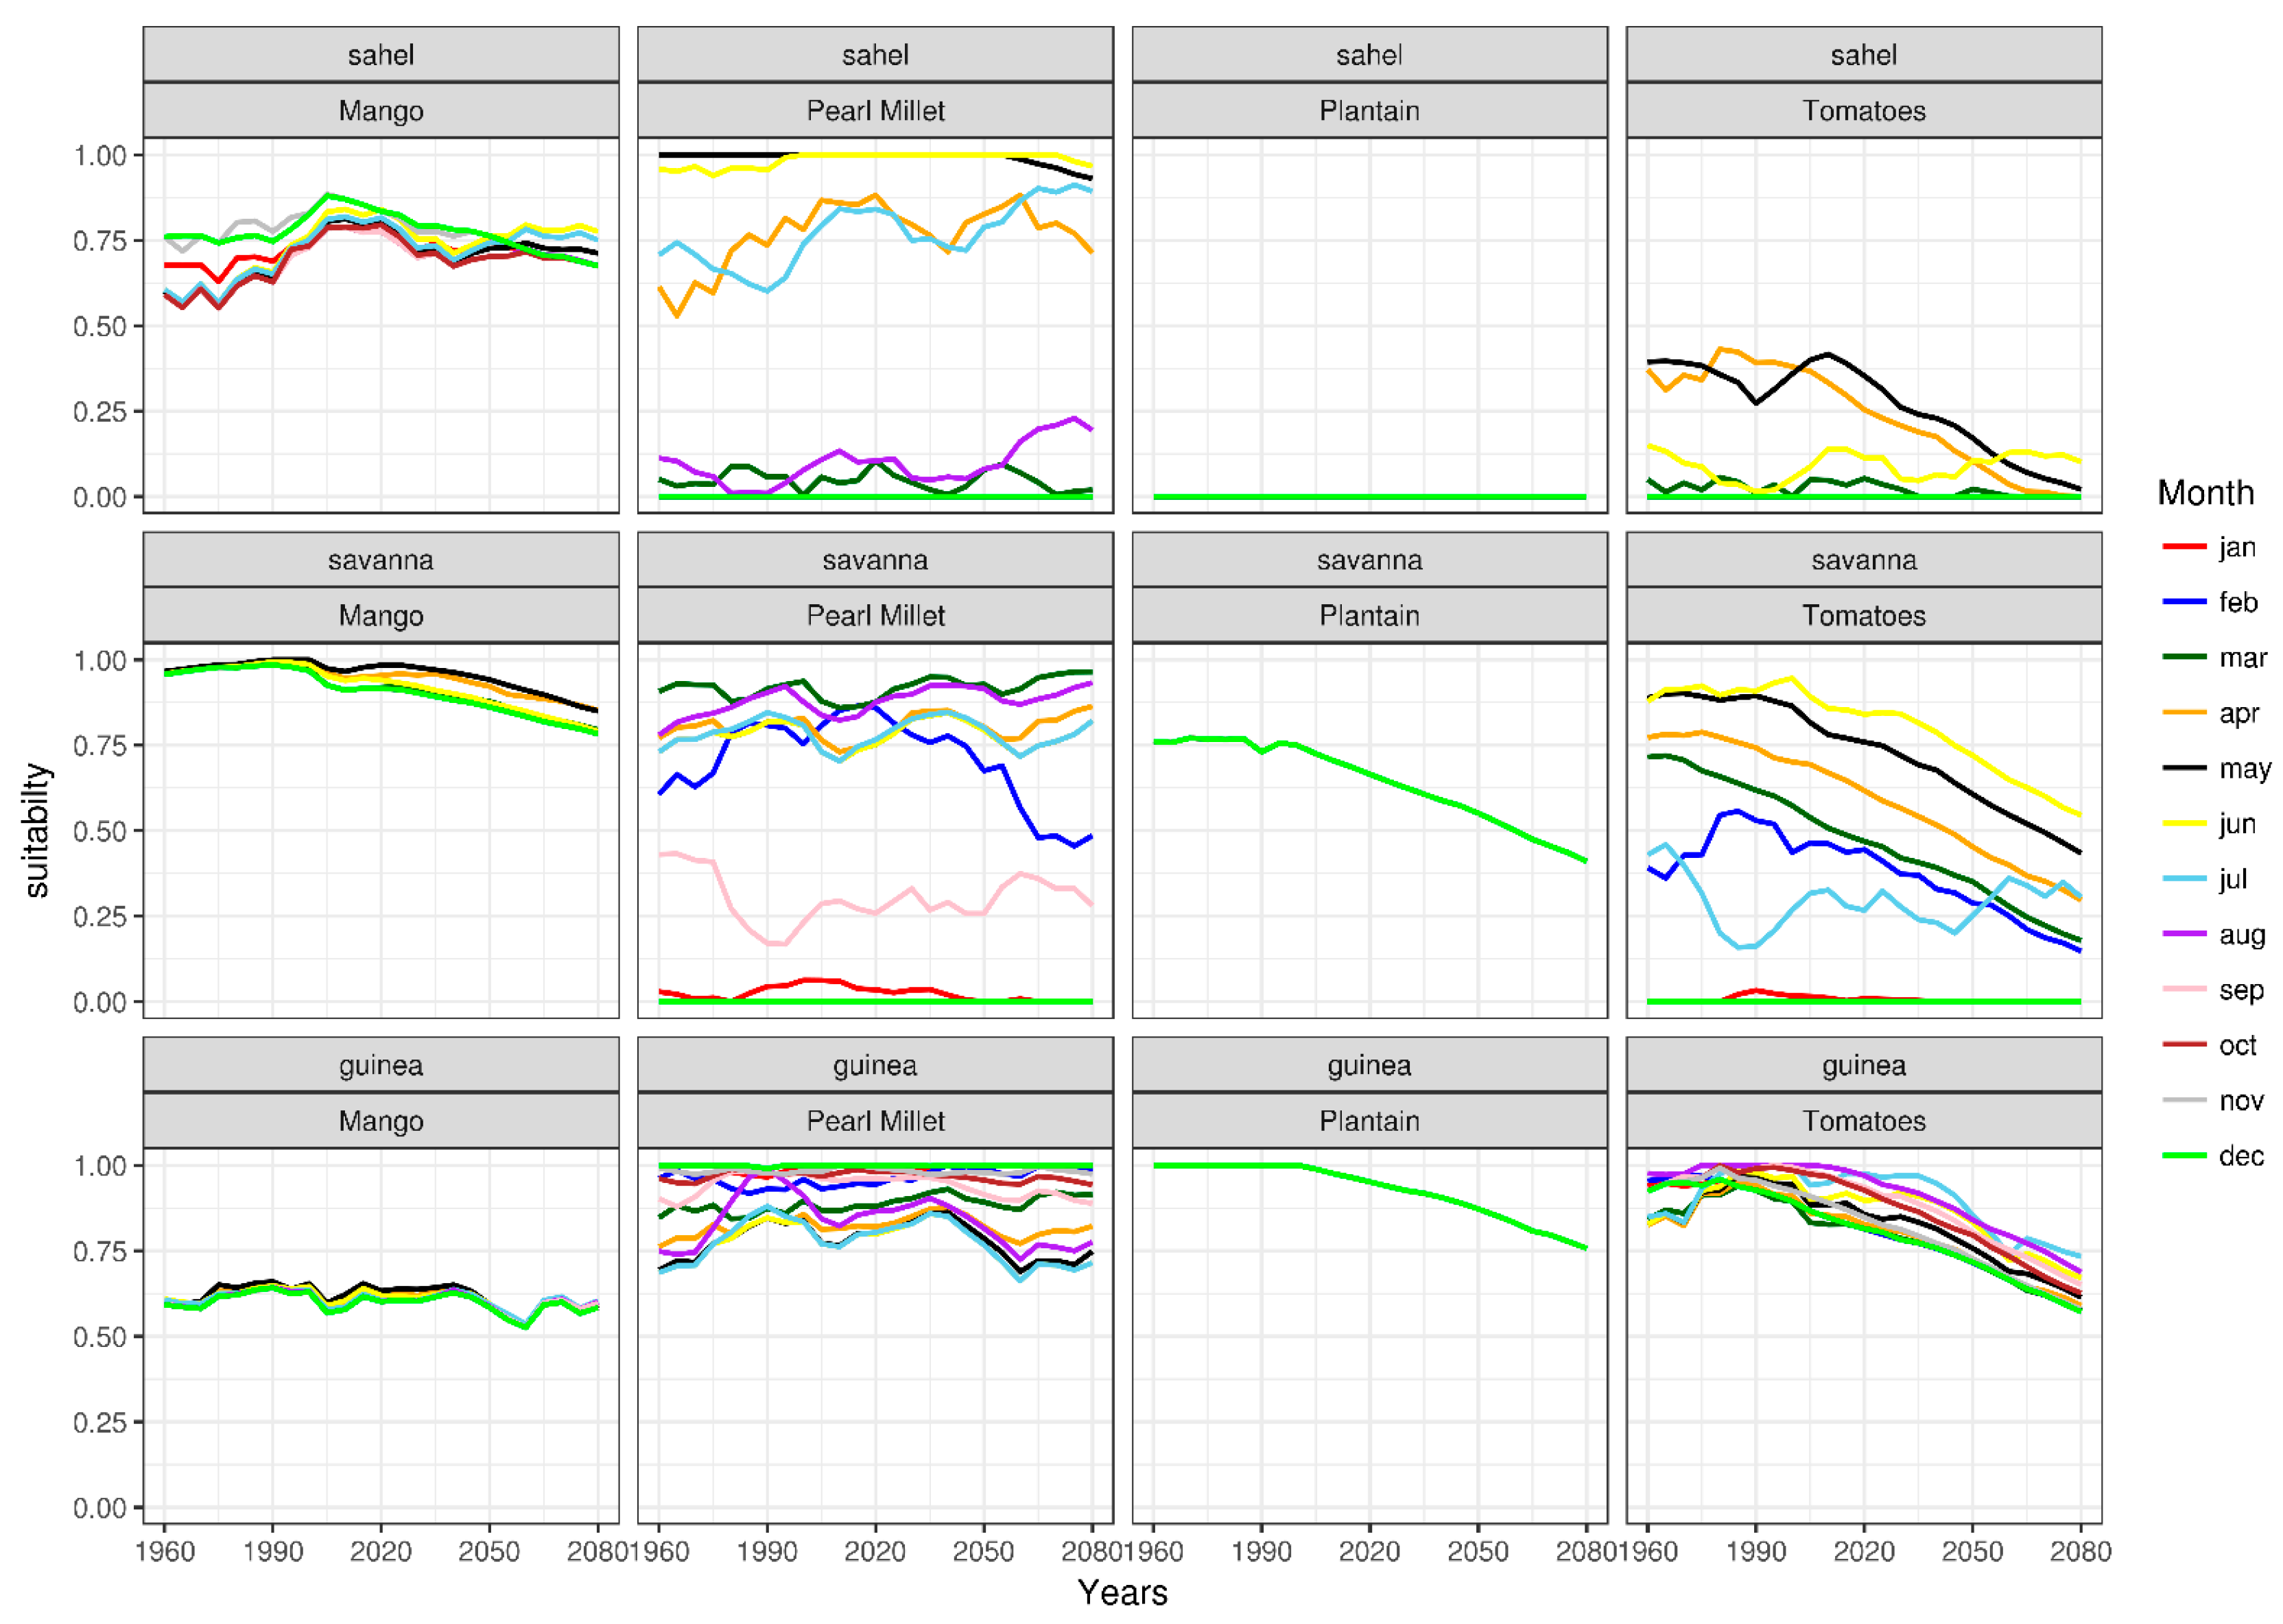
The projected increase in global temperature is predicted to have a varied impact on crop growth suitability in West Africa (Figure 8 and Figure 9). The Guinea AEZ remains largely unchanged with respect to crop growth suitability, evidently a more resilient area. Drastic declines are predicted for multiple crops in the Savanna AEZ including for cassava, orange, and pineapple. The main staple crop, maize, remains stable with an SIV of 0.5–1.0. It is interesting to note that the SIV for maize in the Sahel AEZ is projected to increase, shifting from suitable in 2020 to highly suitable by 2050 (Figure 7). Conditions for pearl millet will remain highly suitable (Figure 9), although the SIV for mango will decline post 2020.
The impact of future warming will affect crop seasonality, i.e the suitability of the time of planting. For root and tuber crops and cassava, in the months of April and May, they will become marginally suitable for cultivation by mid-century in the Savanna AEZ. Conditions will be unsuitable if planted in March, June, or December, which are currently optimal seasons. No change is predicted for cereal crops mango or orange.
4. Discussion
4.1. From Climate Departure to Crop–climate Departure
The impact of global warming on the crop–climate relationship in the three AEZs of West Africa varies depending on the crop grown. The combination of a changing climate and crop growth suitability thresholds results in a projected deviation for the SIV from historical data. This may be a predicted increase in SIV, as observed for maize, or a decline as noted for crops such as cassava. A further variable is the AEZ itself. The predicted increase in SIV for maize in the Sahel zone by 2100 results from the projected increase in temperature and precipitation in this location. The decline in SIV forecast for cassava and pineapple in the Savanna AEZ decreases the suitability of the SSA region for these crops, spatially constraining suitable areas to the Guinea AEZ by 2100. The warming climate also influences the suitability of the month of planting of many crops. A potential cause for concern is the timing of crop–climate departure in the Savanna AEZ, which is already evident in root and tuber, cassava, and pineapple crops, and projected for orange crops by 2100. The diversity of crops grown in this AEZ may be diminished in the future.
The projected shifts in suitability and the variation of suitability between different crops and AEZ due to global warming highlights the importance of local climatic conditions in determining the extent of crop growth, development, and yield in response to climate suitability thresholds [31,64]. The above characteristics observed from the crop–climate relationship of different crops in the three AEZs of West Africa supports our proposed crop–climate departure definition of “a departure/shift from a historical crop suitability threshold, whether in terms of variability, mean or both, resulting from climate change whether of radical climatic nature or not due to warming of the climate over a location both in space and time”. This definition can be used to inform adaptation responses to impacts resulting from climate change that will influence crop suitability, especially in a vulnerable region with low adaptive capacity like West Africa. Cultivating crops with high suitability as projected by the models such as cassava in the Guinea and maize in the southern Sahel may be the best solution. However, with improved/hybrid seedlings of the crop projected to decline that can withstand the variability in climate, this improved suitability may be considered another option.
4.2. Crop–Climate Departure and the Spatio-Temporal Variability of Crop-Suitability in West Africa
The temporal and spatial targeting of adaptation measures under an increasing global temperature will be crucial in maintaining and improving food security in the future. Identifying the timing and location of changes in crop growth suitability due to climate change can play a potentially key role in addressing the challenge of food production [16,33]. This is particularly relevant for the crops of vital importance in the West African region assessed here. The projected decrease in growth suitability conditions for cassava crops in the Savanna AEZ between 2020 and 2050, for example, depends on the time of planting or season. This projected departure is critical for the Savanna region as it may impact negatively on both the economy and livelihoods within the region. The improved understanding of crop–climate departure timing may permit timely adaptation plans such as modification to crop management regimes that account for this change in crop seasonality. If this were to be included in combination with increased use of key varietal traits, e.g., drought resistance, it will greatly assist in improving the adaptive capacity of such crops and mitigating the future impacts of a warmer climate to increase the resilience of current cropping systems within the region [16,65]. Improvements to the underlying knowledge base can therefore potentially improve both crop yield and crop quality.
In AEZs where the continued growing of given crop types is no longer possible, a further adaptation strategy is a shift to other more resilient crop species [66], or the substitution of existing crops with crops not previously grown within a given AEZ. Maize, for example, is projected to increase in yield by up to 7% in comparison to non-adapted crops under future climate change scenarios in SSA [33]. An increase in the planting area of crops such as maize further northwards into the southern Sahel AEZ due to the projected rainfall increase in this AEZ [31], or a shift of cassava or pineapple cropping into the Guinea AEZ due to reduced rainfall and the crops ability to withstand drought [16,31,65,67] represent further opportunities. A spatio-temporal projection of potential crop growth suitability can help provide information on future opportunities and constraints that will arise from shifts in the location of suitable crop lands within each AEZ [65]. Adaptation measures may then be prioritized for individual countries in response to the predicted changes [31,32], resulting in the maximum utilization of suitable areas for specific crop types, which will greatly assist in mitigating the future impacts from a warmer climate.
5. Summary and Conclusion
In order to improve the understanding of climatic impacts on agriculture, we conceptualized and explored the notion of crop–climate departure from historical variability in West Africa. We used four downscaled CMIP5 GCMs (CCMA CNRM5, GFDL, and MIROC) for the period 1960–2100 under RCP8.5 emission scenario and a crop suitability model, Ecocrop, across three weather stations representative of the Guinea, Savanna, and Sahel AEZs. In summary, all four GCMs correlate with observed weather station data in their simulation of monthly mean temperature and total monthly rainfall in the Savanna and Sahel zones, but moderately over the Guinea zone. It is recommended that future simulations acquire data from additional weather stations and utilize additional CMIP5 GCMs such as CSIRO, ICHEC, HADGEM, IPSL, MPI etc. In terms of crop rotations, the current climate is suitable for maize in the Savanna and Sahel AEZs, while future projections predict a potential for the expansion of maize further into the Sahel zone. The Guinea zone remains less suitable for maize but provides the correct climate both currently and in the future for crops such as cassava and pineapple. The predicted range for pearl millet and mango will remain stable in all three AEZs. Importantly, the Savanna AEZ, given its current cropping regime, is the most sensitive to climate change and shows the least resilience of the three AEZs considered. Climate change adaptation strategies will require prioritization in this zone. The climate-departure concept has been used to characterize crop–climate relationships i.e., crop–climate departure with increased warming and how it can, with appropriately planned adaptation and mitigation strategies, increase food security in the future.
Author Contributions
T.S.E. was responsible for developing the initial content of the manuscript, including literature search and data analysis. O.C. and C.L. were the supervisors for the research and provided guidance in terms of the article structure, data analysis, and finalization of the manuscript.
Funding
This research was supported with funding from National Research Foundation (NRF, South Africa), Alliance Centre for Climate and Earth Systems Science (ACCESS, South Africa), JW Jagger Centenary Scholarship, and Sari Johnson scholarship from the Postgraduate Funding Office, University of Cape Town, South Africa. Interpretation of the findings and the conclusion drawn from the study were the responsibilities of the authors and not on any part of NRF, ACCESS, JW Jagger Centenary Scholarship, and the Sari Johnson scholarship.
Acknowledgments
This study was supported with bursaries from the National Research Foundation (NRF, South Africa), Alliance Centre for Climate and Earth Systems Science (ACCESS, South Africa), and the JW Jagger Centenary Scholarship and Sari Johnson scholarship from the Postgraduate Funding Office, University of Cape Town, South Africa. We also acknowledge the anonymous reviewers and editor for their constructive comments which helps improve the quality of the study.
Conflicts of Interest
The authors declare that they have no financial or personal relationships that may have inappropriately influenced them in writing this article.
Abbreviations
| ACCESS | Alliance for Collaboration for Climate and Earth System Sciences |
| AEZs | AgroEcological Zones |
| CCCMA | Canadian Centre for Climate Modelling and Analysis |
| CIP | Climate Information Portal |
| CMIP5 | Coupled Model Intercomparison Project (Phase 5) |
| CNRM5 | Centre National de Recherches Meteorolo-Giques |
| CSAG | Climate System Analysis Group |
| FAO | Food and Agriculture Organisation |
| GCMs | Global Climate Models |
| GFDL | Geophysical Fluid Dynamic Laboratory |
| MIROC | Japan agency for Marine-Earth Science and Technology Model |
| NRF | National Research Foundation |
| SSA | sub Saharan Africa |
| Declarations | |
| Ethics approval and consent to participate | Not applicable |
| Consent for publication | Not applicable |
| Availability of data and materials | Not applicable |
References
- Roudier, P.; Sultan, B.; Quirion, P.; Berg, A. The impact of future climate change on West African crop yields: What does the recent literature say? Glob. Environ. Chang. 2011, 21, 1073–1083. [Google Scholar] [CrossRef] [Green Version]
- Diasso, U.; Abiodun, B.J. Drought modes in West Africa and how well CORDEX RCMs simulate them. Theor. Appl. Climatol. 2017, 128, 223–240. [Google Scholar] [CrossRef]
- Omotosho, J.B.; Abiodun, B.J. A numerical study of moisture build-up and rainfall over West Africa. Meteorol. Appl. 2007, 14, 209–225. [Google Scholar] [CrossRef]
- World Bank. Making Development Climate Resilient. A World Bank Strategy for Sub-Saharan Africa. Report No. 46947-AFR. 2009, p. 144. Available online: http://siteresources.worldbank.org/INTAFRICA/Resources/ClimateChange-StrategyReport2010-Full_vNoImages.pdf (accessed on 21 August 2019).
- Blein, R.; Soulé, B.G.; Dupaigre, B.F.; Yérima, B. Agricultural Potential of West Africa. Available online: http://www.fondation-farm.org/IMG/pdf/potentialites_rapport_ang_mp.pdf (accessed on 21 August 2019).
- McCarthy, J.; Canziani, O.; Leary, N.; Dokken, D.; White, C. Climate Change 2001: Impacts, Adaptation, and Vulnerability. Available online: https://library.harvard.edu/collections/ipcc/docs/27_WGIITAR_FINAL.pdf (accessed on 21 August 2019).
- World Bank. World Development Report 2013: Jobs; License: Creative Commons Attribution CC BY 3.0; World Bank: Washington, DC, USA, 2012. [Google Scholar] [CrossRef]
- Benhin, J.K.A. South African crop farming and climate change: An economic assessment of impacts. Glob. Environ. Chang. 2008, 18, 666–678. [Google Scholar] [CrossRef]
- Schlenker, W.; Lobell, D.B. Robust negative impacts of climate change on African agriculture. Environ. Res. Lett. 2010, 5, 014010. [Google Scholar] [CrossRef]
- Slingo, J.M.; Challinor, A.J.; Hoskins, B.J.; Wheeler, T.R. Introduction: Food crops in a changing climate. Philos. Trans. R. Soc. B Biol. Sci. 2005, 360, 1983–1989. [Google Scholar] [CrossRef] [PubMed]
- Knox, J.; Hess, T.; Daccache, A.; Wheeler, T. Climate change impacts on crop productivity in Africa and South Asia. Environ. Res. Lett. 2012, 7, 034032. [Google Scholar] [CrossRef]
- Abatan, A.A. West African Extreme Daily Precipitation in Observations and Stretched-grid Simulations by CAM-EULAG. Available online: https://www.researchgate.net/publication/241809235_West_African_extreme_daily_precipitation_in_observations_and_stretched-grid_simulations_by_CAM-EULAG (accessed on 21 August 2019).
- Grolle, J. Heavy rainfall, famine, and cultural response in the West African Sahel: The ‘Muda’ of 1953–54. GeoJournal 2014, 43, 205–214. [Google Scholar] [CrossRef]
- Tarhule, A.; Woo, M.K. Towards an interpretation of historical droughts in northern Nigeria. Clim. Chang. 1997, 37, 601–616. [Google Scholar] [CrossRef]
- Challinor, A.; Wheeler, T.; Garforth, C.; Craufurd, P.; Kassam, A. Assessing the vulnerability of food crop systems in Africa to climate change. Clim. Chang. 2007, 83, 381–399. [Google Scholar] [CrossRef]
- Rippke, U.; Ramirez-Villegas, J.; Jarvis, A.; Vermeulen, S.J.; Parker, L.; Mer, F.; Diekkrüger, B.; Challinor, A.J.; Howden, M. Timescales of transformational climate change adaptation in sub-Saharan African agriculture. Nat. Clim. Chang. 2016, 6, 605–609. [Google Scholar] [CrossRef]
- Paeth, H.; Hall, N.M.; Gaertner, M.A.; Alonso, M.D.; Moumouni, S.; Polcher, J.; Ruti, P.M.; Fink, A.H.; Gosset, M.; Lebel, T.; et al. Progress in regional downscaling of west African precipitation. Atmos. Sci. Lett. 2011, 12, 75–82. [Google Scholar] [CrossRef]
- Hansen, J.; Sato, M.; Ruedy, R. Perception of climate change. Proc. Natl. Acad. Sci. USA 2012, 109, E2415–E2423. [Google Scholar] [CrossRef] [PubMed] [Green Version]
- Pretty, J.N.; Morison, J.I.L.; Hine, R.E. Reducing food poverty by increasing agricultural sustainability in developing countries. Agric. Ecosyst. Environ. 2003, 95, 217–234. [Google Scholar] [CrossRef]
- Sultan, B.; Gaetani, M. Agriculture in West Africa in the Twenty-First Century: Climate Change and Impacts Scenarios, and Potential for Adaptation. Front. Plant Sci. 2016, 7, 1–20. [Google Scholar] [CrossRef] [PubMed]
- Lobell, D.B.; Burke, M.B.; Tebaldi, C.; Mastrandrea, M.D.; Falcon, W.P.; Naylor, R.L. Prioritizing Climate Change Adaptation Needs for Food Security in 2030 Region. Science 2008, 319, 607–610. [Google Scholar] [CrossRef]
- Zinyengere, N.; Crespo, O.; Hachigonta, S. Crop response to climate change in southern Africa: A comprehensive review. Glob. Planet. Chang. 2013, 111, 118–126. [Google Scholar] [CrossRef] [Green Version]
- IPCC. Summary for Policymakers. In Climate Change 2013: The Physical Science Basis. Contribution of Working Group I to the Fifth Assessment Report of the Intergovernmental Panel on Climate Change; Stocker, T.F., Qin, D., Plattner, G.K., Tignor, M., Allen, S.K., Boschung, J., Nauels, A., Xia, Y., Bex, V., Midgley, P.M., Eds.; Cambridge University Press: Cambridge, UK, 2013. [Google Scholar]
- World Bank. World Development Report 2010: Development and Climate Change; World Bank: Washington, DC, USA, 2010; Available online: https://openknowledge.worldbank.org/handle/10986/4387 (accessed on 30 November 2018).
- Egbebiyi, T.S. Future Changes in Extreme Rainfall Events and African Easterly Waves over West Africa. Master’s Thesis, University of Cape Town, Cape Town, South Africa, 2016. [Google Scholar]
- Sui, Y.; Lang, X.; Jiang, D. Time of emergence of climate signals over China under the RCP4.5 scenario. Nat. Clim. Chang. 2013, 39, 1–5. [Google Scholar]
- Vermeulen, S.J.; Challinor, A.J.; Thornton, P.K.; Campbell, B.M.; Eriyagama, N.; Vervoort, J.M.; Kinyangi, J.; Jarvis, A.; Läderach, P.; Ramirez-Villegas, J.; et al. Addressing uncertainty in adaptation planning for agriculture. Proc. Natl. Acad. Sci. USA 2013, 110, 8357–8362. [Google Scholar] [CrossRef] [Green Version]
- Hawkins, E.; Sutton, R. Time of emergence of climate signals. Geophys. Res. Lett. 2012, 39, 1–6. [Google Scholar] [CrossRef]
- Mora, C.; Frazier, A.G.; Longman, R.J.; Dacks, R.S.; Walton, M.M.; Tong, E.J.; Sanchez, J.J.; Kaiser, L.R.; Stender, Y.O.; Anderson, J.M. The projected timing of climate departure from recent variability. Nature 2013, 502, 183–187. [Google Scholar] [CrossRef]
- Thornes, J.E. IPCC, 2001: Climate change 2001: Impacts, adaptation and vulnerability, Contribution of Working Group II to the Third Assessment Report of the Intergovernmental Panel on Climate Change, edited by J. J. McCarthy, O.F.; Canziani, N.A.; Leary, D.J., Dokken, A. Int. J. Climatol. 2002, 22, 1285–1286. [Google Scholar] [CrossRef]
- Porter, J.R.; Semenov, M.A. Crop responses to climatic variation. Philos. Trans. R. Soc. B Biol. Sci. 2005, 360, 2021–2035. [Google Scholar] [CrossRef]
- Lobell, D.B.; Schlenker, W.; Costa-Roberts, J. Climate trends and global crop production since 1980—Supporting Online Material. Science 2011, 333, 616–620. [Google Scholar] [CrossRef]
- Challinor, A.J.; Watson, J.; Lobell, D.B.; Howden, S.M.; Smith, D.R.; Chhetri, N. A meta-analysis of crop yield under climate change and adaptation. Nat. Clim. Chang. 2014, 4, 287–291. [Google Scholar] [CrossRef]
- Abiodun, B.J.; Adeyewa, Z.D.; Oguntunde, P.G.; Salami, A.T.; Ajayi, V.O. Modeling the impacts of reforestation on future climate in West Africa. Theor. Appl. Climatol. 2012, 110, 77–96. [Google Scholar] [CrossRef]
- Klutse, N.A.; Ajayi, V.O.; Gbobaniyi, E.O.; Egbebiyi, T.S.; Kouadio, K.; Nkrumah, F.; Quagraine, K.A.; Olusegun, C.; Diasso, U.; Abiodun, B.J. Potential impact of 1.5 °C and 2 °C global warming on consecutive dry and wet days over West Africa. Environ. Res. Lett. 2018, 13, 055013. [Google Scholar] [CrossRef]
- Janicot, S.; Caniaux, G.; Chauvin, F.; De Coëtlogon, G.; Fontaine, B.; Hall, N.; Kiladis, G.; Lafore, J.P.; Lavaysse, C.; Lavender, S.; et al. Intraseasonal variability of the West African monsoon. Atmos. Sci. Lett. 2011, 12, 58–66. [Google Scholar] [CrossRef] [Green Version]
- Nicholson, S.E. The West African Sahel: A Review of Recent Studies on the Rainfall Regime and Its Interannual Variability. ISRN Meteorol. 2013, 2013, 1–32. [Google Scholar] [CrossRef]
- Paeth, H.; Capo-Chichi, A.; Endlicher, W. Climate Change and Food Security in Tropical West Africa—A Dynamic-Statistical Modelling Approach. Erdkunde 2008, 2, 101–115. [Google Scholar] [CrossRef]
- Nelson, G.C.; Van Der Mensbrugghe, D.; Ahammad, H.; Blanc, E.; Calvin, K.; Hasegawa, T.; Havlik, P.; Heyhoe, E.; Kyle, P.; Lotze-Campen, H.; et al. Agriculture and climate change in global scenarios: Why don’t the models agree. Agric. Econ. 2014, 45, 85–101. [Google Scholar] [CrossRef]
- Jarvis, A.; Ramirez-Villegas, J.; Campo, B.V.H.; Navarro-Racines, C. Is Cassava the Answer to African Climate Change Adaptation? Trop. Plant Biol. 2012, 5, 9–29. [Google Scholar] [CrossRef]
- FAOSTAT. FAO Statistical Yearbook 2014. 2014. Available online: http://www.fao.org/3/a-i3590e.pdf (accessed on 21 August 2019).
- Srivastava, A.K.; Gaiser, T.; Ewert, F. Climate change impact and potential adaptation strategies under alternate climate scenarios for yam production in the sub-humid savannah zone of West Africa. Mitig. Adapt. Strateg. Glob. Chang. 2016, 21, 955–968. [Google Scholar] [CrossRef]
- Hijmans, R.J.; Guarino, L.; Cruz, M.; Rojas, E. Computer tools for spatial analysis of plant genetic resources data: 1. DIVA-GIS. Plant Genet. Resour. Newsletter 2001, 127, 15–19. [Google Scholar]
- Cong, R.G.; Brady, M. The interdependence between rainfall and temperature: Copula analyses. Sci. World J. 2012, 12. [Google Scholar] [CrossRef]
- IPCC. IPCC Expert Meeting on Climate Change, Food, and Agriculture. Available online: https://www.ipcc.ch/site/assets/uploads/2018/05/Food-EM_MeetingReport_FINAL-1.pdf (accessed on 21 August 2019).
- Medori, M.; Michelini, L.; Nogues, I.; Loreto, F.; Calfapietra, C. The impact of root temperature on photosynthesis and isoprene emission in three different plant species. Sci. World J. 2012, 2012. [Google Scholar] [CrossRef]
- Olesen, J.E.; Bindi, M. Consequences of climate change for European agricultural productivity, land use and policy. Eur. J. Agron. 2002, 16, 239–262. [Google Scholar] [CrossRef]
- Cantelaube, P.; Terres, J.M. Seasonal weather forecasts for crop yield modelling in Europe. Tellus Ser. A Dyn. Meteorol. Oceanogr. 2005, 57, 476–487. [Google Scholar] [CrossRef]
- Hewitson, B.C.; Crane, R.G. Gridded area-averaged daily precipitation via conditional interpolation. J. Clim. 2005, 18, 41–57. [Google Scholar] [CrossRef]
- Ramirez-Villegas, J.; Jarvis, A.; Läderach, P. Empirical approaches for assessing impacts of climate change on agriculture: The EcoCrop model and a case study with grain sorghum. Agric. For. Meteorol. 2013, 170, 67–78. [Google Scholar] [CrossRef]
- Hijmans, A.R.J.; Phillips, S.; Leathwick, J.; Elith, J.; Hijmans, M.R.J.; Hijmans, R.J. Species Distribution Modeling. Available online: https://cran.r-project.org/web/packages/dismo/dismo.pdf (accessed on 21 August 2019).
- Hunter, R.; Crespo, O. Large Scale Crop Suitability Assessment Under Future Climate Using the Ecocrop Model: The Case of Six Provinces in Angola’s Planalto Region; Springer: Cham, Switzerland, 2018. [Google Scholar]
- White, J.W.; Hoogenboom, G.; Kimball, B.A.; Wall, G.W. Methodologies for simulating impacts of climate change on crop production. F. Crop. Res. 2011, 124, 357–368. [Google Scholar] [CrossRef] [Green Version]
- Vrieling, A.; de Leeuw, J.; Said, M.Y. Length of growing period over africa: Variability and trends from 30 years of NDVI time series. Remote Sens. 2013, 5, 982–1000. [Google Scholar] [CrossRef]
- Butt, B.; Turner, M.D.; Singh, A.; Brottem, L. Use of MODIS NDVI to evaluate changing latitudinal gradients of rangeland phenology in Sudano-Sahelian West Africa. Remote Sens. Environ. 2011, 115, 3367–3376. [Google Scholar] [CrossRef]
- Brown, M.E.; de Beurs, K.M. Evaluation of multi-sensor semi-arid crop season parameters based on NDVI and rainfall. Remote Sens. Environ. 2008, 112, 2261–2271. [Google Scholar] [CrossRef]
- Dixon, J.A.; Gibbon, D.P.; Gulliver, A. Farming Systems and Poverty: Improving Farmers’ Livelihoods in a Changing World; FAO & World Bank: Rome, Italy; Washington, DC, USA, 2001. [Google Scholar]
- Alliance for Green Revolution in Africa (AGRA). The Africa Agriculture Status Report 2014: Climate Change and Smallholder Agriculture in Sub-Saharan Africa. Available online: https://ccafs.cgiar.org/publications/africa-agriculture-status-report-2014-climate-change-and-smallholder-agriculture-sub#.XVy0U0G-lPY (accessed on 21 August 2019).
- Bationo, A.; Hartemink, A.E.; Lungo, O.; Naimi, M.; Okoth, P.; Smaling, E.M.A.; Thiombiano, L. African Soils: Their Productivity and Profitability of Fertilizer Use. Available online: https://library.wur.nl/WebQuery/wurpubs/fulltext/26759 (accessed on 21 August 2019).
- Mason, S.C.; Maman, N.; Palé, S. Pearl millet production practices in semi-arid West Africa: A review. Exp. Agric. 2015, 51, 501–521. [Google Scholar] [CrossRef]
- Singh, P.; Boote, K.J.; Kadiyala, M.D.; Nedumaran, S.; Gupta, S.K.; Srinivas, K.; Bantilan, M.C. Science of the Total Environment An assessment of yield gains under climate change due to genetic modi fi cation of pearl millet. Sci. Total Environ. 2017, 601–602, 1226–1237. [Google Scholar] [CrossRef]
- Barrett, H.; Browne, A. Export Horticultural Production in Sub-Saharan Africa: The Incorporation of The Gambia. Geography 1996, 81, 47–56. [Google Scholar]
- Takane, T. Smallholders and nontraditional exports under economic liberalization: The case of pineapples in Ghana. Afr. Study Monogr. 2004, 25, 29–43. [Google Scholar]
- IPCC. Summary for Policymakers. In Climate Change 2007: The Physical Science Basis. Contribution of Working Group I to the Fourth Assessment Report of the Intergovernmental Panel on Climate Change; Solomon, S., Qin, D., Manning, M., Chen, Z., Marquis, M., Ave, K.B., Eds.; Cambridge University Press: Cambridge, UK; New York, NY, USA, 2007. [Google Scholar]
- Wheeler, T.; von Braun, J. Climate change impacts on global food security. Science 2013, 341, 55–60. [Google Scholar] [CrossRef]
- Ramirez-Villegas, J.; Thornton, P.K. Climate Change Impacts on African Crop Production; CCAFS Working Paper No. 119; CGIAR Research Program on Climate Change, Agriculture and Food Security (CCAFS): Copenhagen, Denmark, 2015; 27p. [Google Scholar]
- Ramirez-Villegas, J.; Lau, C.; Hooker, J.; Jarvis, A.; Ann-Kristin, K.; Arnell, N.; Tom, O. Climate Analogues: Finding Tomorrow’s Agriculture Today CGIAR Research Program on Climate Change; Agriculture and Food Security (CCAFS): Copenhagen, Denmark, 2011. Available online: https://ccafs.cgiar.org/publications/climate-analogues-finding-tomorrow%E2%80%99s-agriculture-today-0#.XVy3U0G-lPY (accessed on 21 August 2019).
Figure 1.
West African topography and the three Food and Agriculture Organizations (FAO)- Agro-ecological zones (AEZs): the Guinea, Savanna, and Sahel zones [25,34].

Figure 2.
(a) two dimensional and (b) three dimensional diagram describing climate thresholds and its translation into crop suitability (Adapted from [50]).
Figure 2.
(a) two dimensional and (b) three dimensional diagram describing climate thresholds and its translation into crop suitability (Adapted from [50]).

Figure 3.
Mean monthly temperature (°C) as depicted by station observations and statistically downscaled CMIP5 GCMs (CCMA, CNRM5, GFDL, and MIROC) across the three agro ecological zones, Tabou, Sokode, and Magaria, of West Africa for the period 1980–2000. The top right corner r-values in each panel represent the correlations between the simulated and observed mean monthly temperature.

Figure 4.
Total monthly rainfall (mm/month) as depicted by station observations and statistically downscaled CMIP5 GCMs (CCMA, CNRM5, GFDL, and MIROC) across the three agro ecological zones, Tabou, Sokode, and Magaria, of West Africa for the period 1980–2000. The top right corner r-values in each panel represent the correlations between the simulated and observed mean monthly temperature.

Figure 5.
Cassava planting month suitability plots in the Guinea, Sahel, and Savanna as simulated by the four GCMs (CCMA, CNRM, GFDL, and MIROC) used as climate inputs into the Ecocrop suitability model.
Figure 5.
Cassava planting month suitability plots in the Guinea, Sahel, and Savanna as simulated by the four GCMs (CCMA, CNRM, GFDL, and MIROC) used as climate inputs into the Ecocrop suitability model.

Figure 6.
Ensemble crop suitability plots in the past climate (1960–2010) for cassava, maize, orange, and pineapple.
Figure 6.
Ensemble crop suitability plots in the past climate (1960–2010) for cassava, maize, orange, and pineapple.

Figure 7.
Projected model ensemble suitability over West Africa between 1960–2100 for cassava, maize, orange, and pineapple.
Figure 7.
Projected model ensemble suitability over West Africa between 1960–2100 for cassava, maize, orange, and pineapple.

Figure 8.
Ensemble crop suitability plots in the past climate (1960–2010) for mango, pearl millet, plantain, and tomatoes.
Figure 8.
Ensemble crop suitability plots in the past climate (1960–2010) for mango, pearl millet, plantain, and tomatoes.

Figure 9.
Projected model ensemble suitability over West Africa between 1960–2100 for mango, pearl millet, plantain, and tomatoes.
Figure 9.
Projected model ensemble suitability over West Africa between 1960–2100 for mango, pearl millet, plantain, and tomatoes.


Table 1.
List of statistically downscaled and bias-corrected GCMs used in the study.
| Modelling Institution | Institute ID | Model Name | Resolution |
|---|---|---|---|
| Canadian centre for climate modelling and analysis | CCCMA | CanESM2 | 2.8° × 2.8° |
| Centre National de Recherches Meteorolo-Giques/Centre Europeen de Recherche et Formation Avanceesencalcul scientifique | CNRMCERFACS | CNRM-CM5 | 1.4° × 1.4° |
| National Oceanic and Atmospheric Administration Geophysical Fluid Dynamic Laboratory | NOAAGDFL | GFDL_ESM2M | 2.5° × 2.0° |
| Japan agency for Marine-Earth Science and Technology | MIROC | MIROC5 | 1.4° × 1.4° |
Table 2.
Crop growth thresholds for eight crops as generated by the Ecocrop model.
| Crop Name | Growing Duration (Days) | Temperature (°C) | Rainfall (mm) | ||||||
|---|---|---|---|---|---|---|---|---|---|
| Tmin | Topmin | Topmax | Tmax | Rmin | Ropmin | Ropmax | Rmax | ||
| Pearl millet | 60–120 | 12 | 25 | 35 | 40 | 200 | 400 | 900 | 1700 |
| Maize | 65–365 | 10 | 18 | 33 | 47 | 400 | 600 | 1200 | 1800 |
| Cassava | 180–365 | 10 | 20 | 29 | 35 | 500 | 1000 | 1500 | 5000 |
| Plantain | 365 | 16 | 23 | 28 | 38 | 1000 | 1300 | 2000 | 5000 |
| Pineapple | 330–365 | 10 | 21 | 30 | 36 | 550 | 800 | 2500 | 3500 |
| Tomato | 70–150 | 7 | 20 | 27 | 35 | 400 | 600 | 1300 | 1800 |
| Orange | 180–365 | 13 | 20 | 38 | 38 | 450 | 1200 | 2000 | 2700 |
| Mango | 150–365 | 8 | 24 | 30 | 48 | 300 | 600 | 1500 | 2600 |
Where Tmin, Topmin, Topmax, and Tmax represents monthly minimum temperature, minimum optimum temperature, maximum optimum temperature, and maximum temperature, respectively; Rmin, Ropmin, Ropmax, and Rmax represents total monthly minimum rainfall, minimum optimum total monthly rainfall, maximum optimum total monthly rainfall, and maximum total monthly rainfall, respectively; optimum values represent the most suitable period for crop planting.
Table 3.
Ecocrop simulated crop Suitability Index Value (SIV) for the eight (8) different crops across the three Agro-ecological zones (AEZs) of West Africa.
Table 3.
Ecocrop simulated crop Suitability Index Value (SIV) for the eight (8) different crops across the three Agro-ecological zones (AEZs) of West Africa.
| Years | 1960 | 1990 | 2020 | 2050 | 2080 | ||||||||||
|---|---|---|---|---|---|---|---|---|---|---|---|---|---|---|---|
| Crops/AEZs | GUI | SAV | SAH | GUI | SAV | SAH | GUI | SAV | SAH | GUI | SAV | SAH | GUI | SAV | SAH |
| Cassava | >0.75 | >0.75 | <0.25 | >0.75 | >0.75 | <0.25 | >0.75 | >0.50 | <0.25 | >0.75 | ≤0.50 | <0.25 | >0.75 | <0.50 | <0.25 |
| Maize | ≤0.50 | ≥0.50 | <0.75 | ≤0.50 | ≥0.50 | 0.50–0.75 | <0.50 | >0.50 | >0.50 | <0.50 | >0.50 | >0.50 | <0.50 | >0.75 | >0.75 |
| Mango | 0.50–0.75 | 1.00 | ≤0.75 | 0.50–0.75 | 1.00 | ≤0.75 | 0.50–0.75 | >0.75 | >0.75 | 0.50–0.75 | >0.75 | 0.75 | 0.50–0.75 | >0.75 | 0.75 |
| Orange | >0.75 | >0.75 | <0.25 | >0.75 | >0.75 | <0.25 | >0.75 | >0.75 | >0.25 | >0.75 | 0.50–0.75 | <0.25 | >0.75 | 0.50–0.75 | <0.25 |
| Pearl millet | >0.75 | >0.50 | >0.50 | >0.75 | >0.50 | >0.50 | >0.75 | >0.50 | >0.50 | >0.75 | >0.50 | >0.50 | >0.75 | >0.50 | >0.50 |
| Pineapple | >0.75 | >0.75 | <0.5 | >0.75 | <0.50 | <0.50 | >0.75 | >0.75 | 0.50 | >0.75 | 0.50–0.75 | <0.50 | >0.75 | <0.50 | <0.50 |
| Plantain | 1.00 | >0.75 | 0.00 | 1.00 | >0.75 | 0.00 | >0.75 | <0.75 | 0.00 | >0.75 | <0.75 | 0.00 | >0.75 | <0.50 | 0.00 |
| Tomato | >0.75 | >0.25 | <0.5 | >0.75 | >0.50 | <0.5 | >0.75 | >0.50 | <0.5 | <0.75 | <0.50 | <0.25 | <0.75 | <0.50 | <0.25 |
GUI—Guinea AEZ, SAV—Savanna AEZ, SAH—Sahel AEZ. Ecocrop suitability Index: 0.0–0.25—Unsuitable/No suitability, 0.25–0.50—Marginally suitable, 0.50–0.75—Suitable, 0.75–1.00—Highly suitable.
© 2019 by the authors. Licensee MDPI, Basel, Switzerland. This article is an open access article distributed under the terms and conditions of the Creative Commons Attribution (CC BY) license (http://creativecommons.org/licenses/by/4.0/).
Share and Cite
MDPI and ACS Style
Egbebiyi, T.S.; Crespo, O.; Lennard, C. Defining Crop–Climate Departure in West Africa: Improved Understanding of the Timing of Future Changes in Crop Suitability. Climate 2019, 7, 101. https://0-doi-org.brum.beds.ac.uk/10.3390/cli7090101
AMA Style
Egbebiyi TS, Crespo O, Lennard C. Defining Crop–Climate Departure in West Africa: Improved Understanding of the Timing of Future Changes in Crop Suitability. Climate. 2019; 7(9):101. https://0-doi-org.brum.beds.ac.uk/10.3390/cli7090101
Chicago/Turabian StyleEgbebiyi, Temitope S., Olivier Crespo, and Chris Lennard. 2019. "Defining Crop–Climate Departure in West Africa: Improved Understanding of the Timing of Future Changes in Crop Suitability" Climate 7, no. 9: 101. https://0-doi-org.brum.beds.ac.uk/10.3390/cli7090101
Note that from the first issue of 2016, this journal uses article numbers instead of page numbers. See further details here.