Perception of Wind in Open Spaces


1
School of Property, Construction and Project Management, RMIT University, Melbourne 3000, Australia
2
Sustainable Building Innovation Lab, School of Property, Construction and Project Management, RMIT University, Melbourne 3000, Australia
*
Author to whom correspondence should be addressed.
Climate 2019, 7(9), 106; https://0-doi-org.brum.beds.ac.uk/10.3390/cli7090106
Submission received: 26 July 2019
/
Revised: 23 August 2019
/
Accepted: 27 August 2019
/
Published: 2 September 2019
Abstract
:Dense urbanization influences the livability of cities. Changes in local meteorological conditions can be adverse for human health and well-being. In urban open spaces, it is widely known that changes in building density and configuration in cities influence wind speed (Va). This influence modifies latent heat flux between the human body and surrounding environment and thereby affecting the thermal comfort conditions in open spaces between buildings. Several studies have demonstrated the significant effect of wind speed on outdoor thermal comfort. Melbourne’s Central Business District (CBD) has recently experienced dense urbanization and this pattern of development has instigated noticeable changes in meteorological conditions. Some evidence has suggested that the patterns of wind flow induce thermal discomfort during cool seasons. Conversely, the wind is most welcomed during warm seasons. This study was conducted to assess outdoor users’ responses to Va in three open spaces of an educational precinct in Melbourne’s CBD. The open spaces studied are different in terms of design and function. Users’ responses and meteorological conditions were examined through a series of field measurements and questionnaire surveys from November 2014 to May 2015. This study used three perceptual scales to analyze participants’ experience of Va during field surveys: “Bedford preference”, “thermal sensation” and “personal acceptability”. Analytical results yielded the wind perceptual comfort thresholds for different seasons as well as the entire study period. The results suggested that in addition to the geometry of the urban open space, the function of place could influence people’s perceptions of Va. The research findings contribute to developing thermally comfortable outdoor environments.
1. Introduction
Dense urbanization influences the livability of cities. Among other consequences, changes in local meteorological conditions are more severe for human health and well-being. As such, people’s attendance and behavior patterns can be significantly affected. Gaitani, et al. [1] maintained that micrometeorological conditions through people’s thermal perceptions determine attendance and human activities in outdoor spaces. They also argued that the level of activities hinges on the extent of satisfaction under the given thermal conditions. Thermal satisfaction in open space is typically assessed by thermal comfort. Thermal comfort by definition is “…that condition of mind that expresses satisfaction with the thermal environment” [2]. Technically, assessment of thermal comfort is based on the calculation of the collective effect of four meteorological variables including air temperature (Ta), relative humidity (RH), wind speed (Va) and mean radiant temperature (Tmrt) on thermal perceptions of a large group of people [2]. These parameters are known to have the most impact on human thermoregulation system [3]. The research on thermal comfort has substantially grown over the last decade [4]. Among the factors that significantly influence people’s thermal comfort, wind speed (Va) was found to play a key role in cities and particularly in densely built-up areas and between buildings [5,6].
Research on wind comfort perception is underpinned by four major methods: software simulations, field tests, wind tunnel tests and questionnaire survey [6]. Questionnaire survey on people’s feeling about wind speed is believed to provide accurate, comprehensive and cost-effective method. Since this method evaluates the impact of four parameters (Ta, RH, Va, and Tmrt) it is possible to gain an insight into the impact of Va in comparison with the other three parameters. Several studies have demonstrated the significant effect of Va on outdoor thermal comfort [7,8,9]. For instance, the study by Walton, Dravitzki and Donn [7] revealed that gustiness and Va were the most significant factors in shaping outdoor thermal satisfaction. The results of a questionnaire survey in Hong Kong [9] showed that participants were highly sensitive to Va fluctuations. In urban open spaces, it is widely known that recent drastic changes in the design of building density and configuration in cities influence Va profile [5,10,11,12]. This modifies latent heat flux between human body and the surrounding environment and thereby affecting the thermal comfort conditions in open spaces between buildings. However, seasonality can make this influence pleasant or unwelcome as follows.
In hot weather conditions, the correct design of open spaces will direct wind into an air corridor which can reduce the duration of thermal discomfort [13]. The positive role of wind corridors in creating an acceptable outdoor thermal environment has been well researched [14,15,16,17,18,19] and is recommended as a thermal adaptive strategy for many climate conditions [6,20]. Conversely, in cool seasons, strong wind blows induce thermal discomfort which can be mitigated by windbreakers or shields [21]. Consequently, the proper design of open spaces has a critical role in the formation of local wind environment and thermal comfort [19,22,23]. Blocken and Carmeliet [5] and later Abd Razak, et al. [24] have conducted reviews on literature studying the link between design and pedestrians’ wind environment.
Capital cities in Australia have undergone significant changes in the last three decades [25]. Particularly, the Melbourne Central Business District (CBD) has experienced dense urbanization characterized by the construction of multiple high-rise buildings over a small area [26]. This pattern of development has instigated noticeable changes in meteorological conditions causing urban heat island effects and human thermal discomfort [27]. Some evidence has suggested that wind chill sometimes is the source of thermal discomfort in cool seasons [28]. This wind chill factor makes the “real feel” temperature much cooler than the actual meteorological readings. Conversely, this wind is most welcomed during warm seasons when it can lessen the number of hours of thermal discomfort.
The research on wind comfort perceptions in Australian capital cities is limited [29,30,31]. Melbourne [31] was a pioneer in the investigation of wind speed on people in Australia which resulted in the development of Melbourne’s wind acceptability criteria. GWTS [30] conducted a study to understand people’s sensitivity against changes in wind speed. Sadeghi, de Dear, Wood and Samali [29] simulated the comfort cooling effect of wind in Sydney and developed a wind rose biometeorological data visualization tool. The tool integrates the thermal comfort dimension into the conventional climatology wind rose visualization.
Thermal comfort research in Australia is typically not well- focused on wind comfort [32,33,34,35]. However, the significant role of proper wind flow to human thermal comfort is underlined in these studies. Sharifi, Sivam and Boland [33] for instance indicated that wind flow is a critical element in public outdoor living, in the case of Adelaide, especially during summer. Furthermore, currently, there are only two urban planning-related policies that consider the issues of urban design and wind in Australia [36,37].
This study has provided the opportunity to better understand the relationship between wind speed and people’s perception in Melbourne CBD in different seasons. Determination of wind comfort perceptions can inform urban planning guidelines and help to create better and sustainable outdoor spaces. For this reason, comprehensive meteorological data was collected as part of a research project evaluating the thermal perception of an educational precinct. On this basis, the following are the main objectives of this research study:
- (1)
- Determine people’s wind perception in different seasons;
- (2)
- Examining the impact of spatial configuration on people’s wind perceptions;
- (3)
- Determining the wind sensitivity thresholds for two seasons (cool and warm);
- (4)
- Comparing the impact of meteorological parameters on people’s perceptions in different seasons.
2. Methodology
2.1. Study Sites
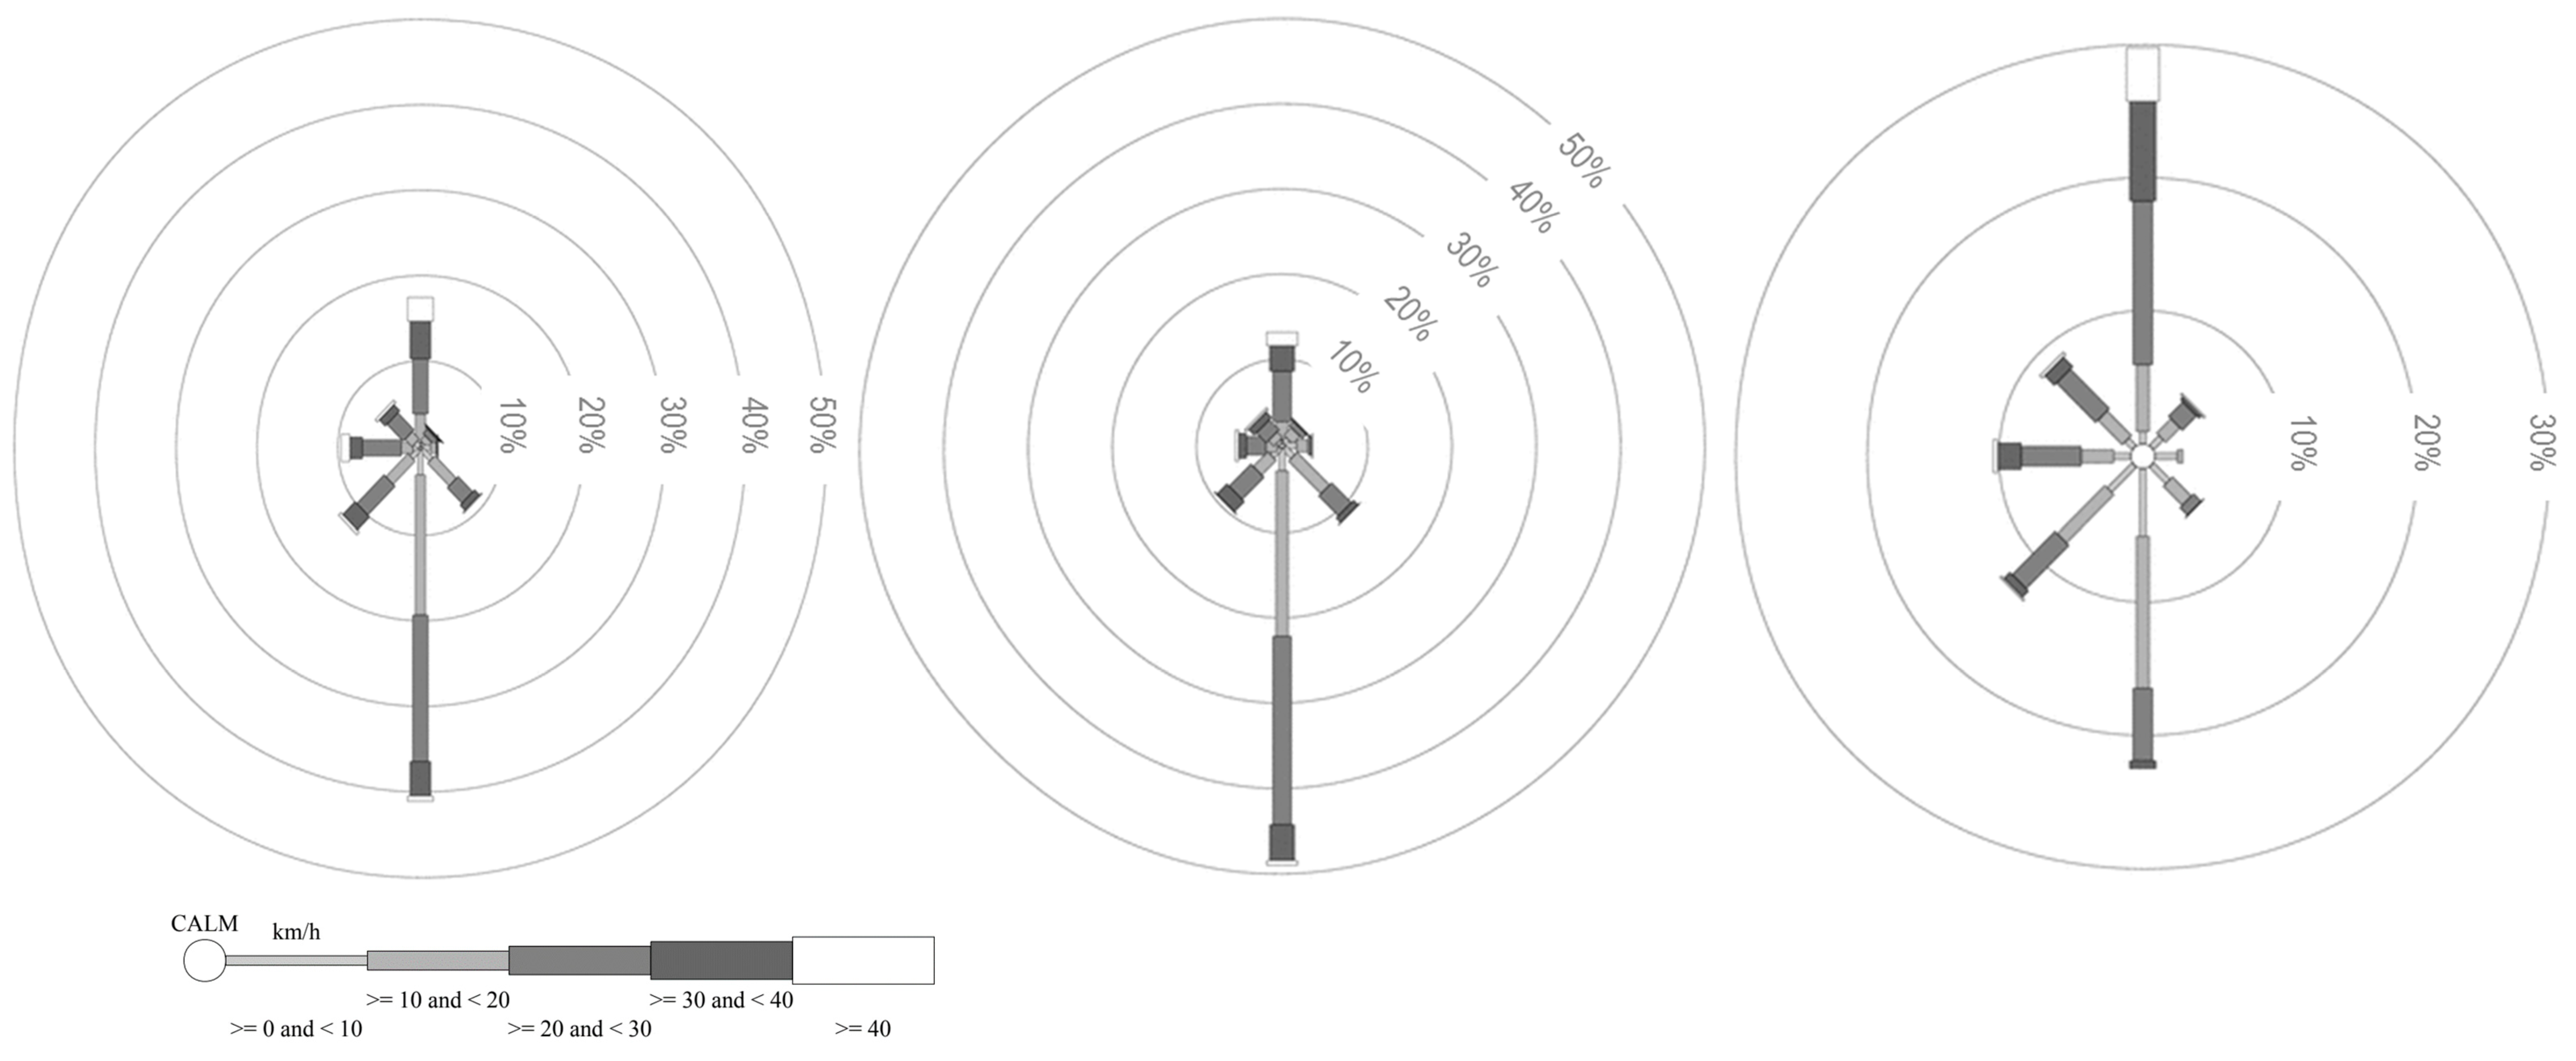
This study was conducted in Melbourne, which has an oceanic temperate climate (Cfb) according to Köppen-Geiger classification [38]. Melbourne is known for its unpredictable weather conditions where one may experience totally different micrometeorological conditions from one day to the next [39]. In summer, the minimum and maximum average air temperature reach 16.8 ˚C and 31.9 ˚C and RH ranges from 47% (3:00 PM) up to 64.3% (9:00 AM). In autumn, these values are 12 ˚C and 20.5 ˚C for minimum and maximum average air temperature, respectively and RH averages 67.2% [40]. The thermal variability is greatest in spring and summer months due to the formation of cold fronts from the northwest, west, and south. The cold fronts are the cause of all the types of harsh weather conditions ranging from gales to severe thunderstorms and hail, torrential rain and sharp drops in temperature. When a cold front passes through Melbourne, the temperature rapidly falls within the space of a few minutes and causes a shift in the direction of the wind to south-westerly. This shift is attributed to cumulus clouds and showers and the cycle starts again; often cycles such as these recur on an almost weekly basis with one day or two of clear skies occurring on same days each week. To better understand wind conditions in Melbourne, historical wind speed values (between 1970–2015) and directions in Melbourne were extracted from the Australia Bureau of Meteorology (BOM) database [41], Melbourne Airport Station (ID: 086282, elevation: 113 m above sea level). The following wind rose diagrams (Figure 1) display the seasonal wind characteristics in Melbourne at 3:00 PM in three months: November, February, and May representing three seasons of spring, summer, and autumn. As can be seen, the dominant wind pattern in May (autumn) is noticeably different from the two other months in terms of magnitude and direction.
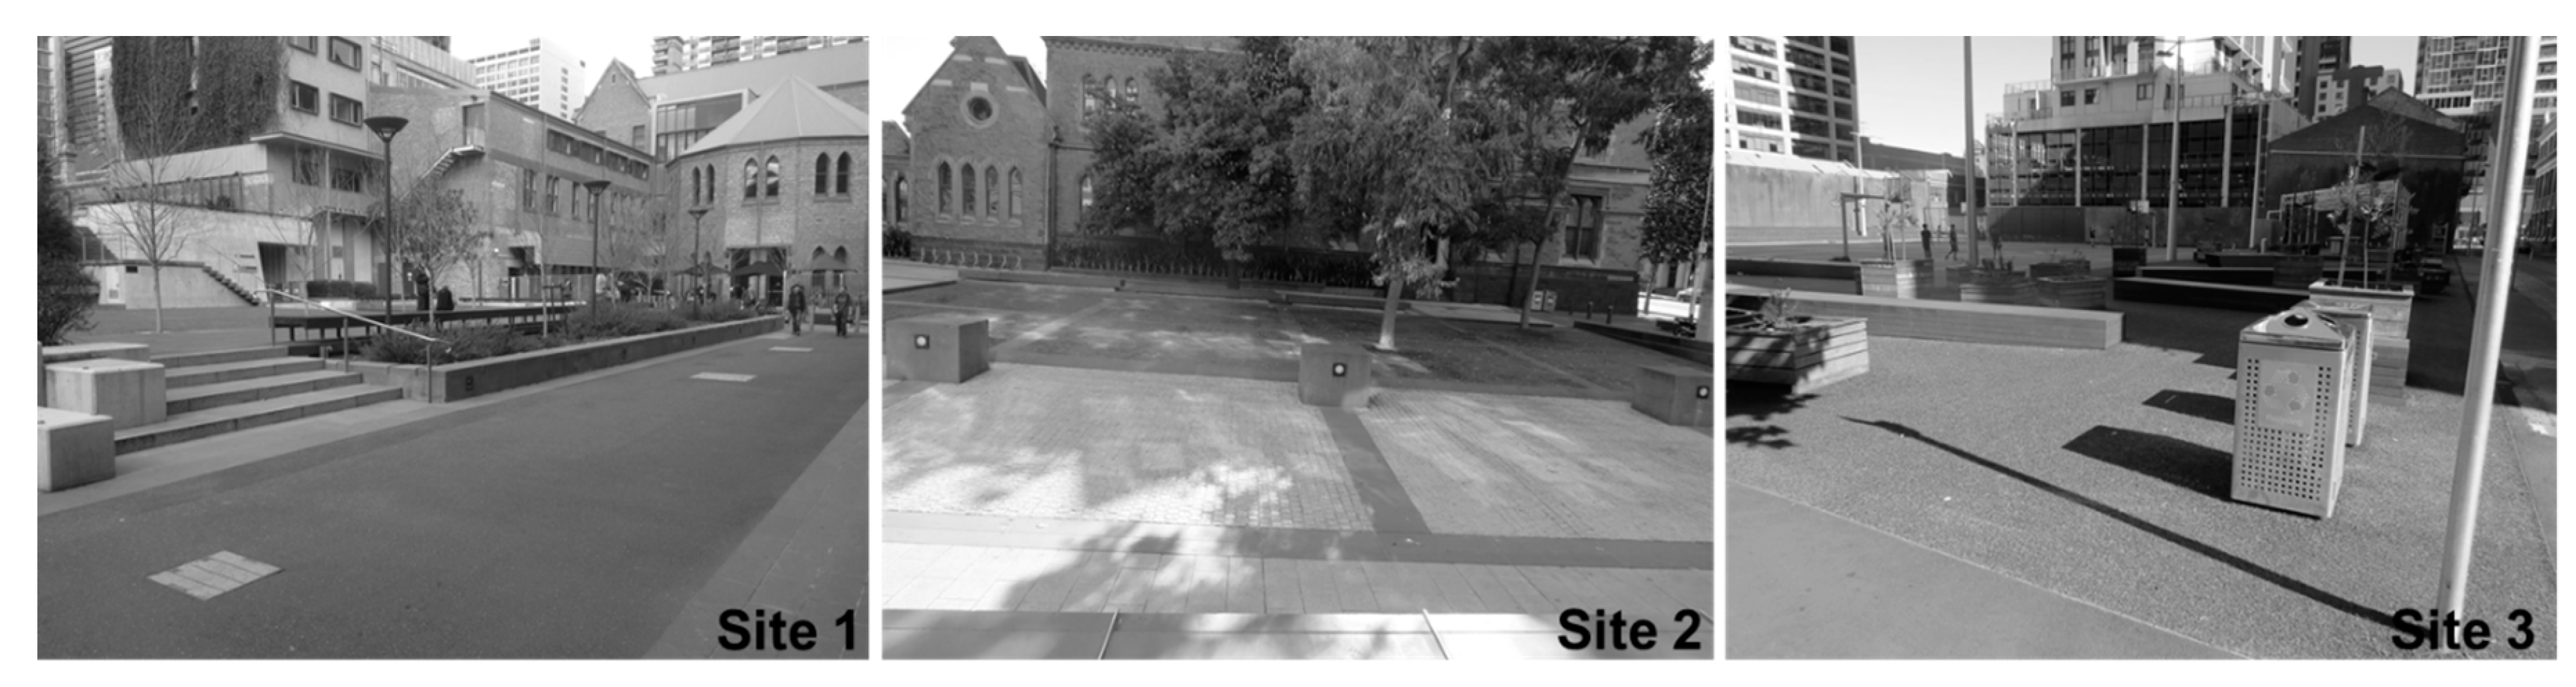
Three sites that are located in Melbourne’s CBD were selected as the case study sites (Figure 2). These three sites are the premises of RMIT University City Campus and represent the typical urban spaces in the Australian capital city centers. The potential users were mostly among the university students and staff who often spend most of their time indoors and semi indoors. Below is the description of study sites.
Site 1: RMIT’s University Lawn which was used as recreational space by university students and staff. Due to its compact design, a relatively prevalent form in Melbourne’s built-up areas, this space was an appropriate symbol of inner-city Melbourne’s recreational outdoor spaces. This site has a 1473 m2 area and contained several urban elements including shading device in a café, timber deck and benches, water features, natural green space, and an artificially turfed area which generated varying micrometeorological conditions. The café served visitors both inside and outside and it was fitted with shading devices.
Site 2: RMIT’s Ellis court was used for different purposes: as the main passageway to other parts of the campus, and a venue for outdoor activities and social events. This site has a 1302 m2 area and accommodated a range of urban settings (e.g., large patches of artificial grass, trees, and small garden beds), which potentially created an outdoor space with varying local micrometeorological conditions. The full description of different covering materials and the extent of their usage in the three sites was presented before [42]. Like Site 1, this site had buildings that were heritage listed by the Heritage Council of Victoria. Due to its particular location, this site was largely frequented by students and staff during teaching hours; it was also partly occupied by them in break times. Many on-campus events are conducted at Bowen Street. Some visitors from neighboring offices routinely used the space to relax, eat or drink, or walk through to reach other streets.
Site 3: RMIT A’Beckket Urban Square was a 2800 m2 recreational project, which provided multi-functional courts for outdoor activities, spare modern green spaces, a large artificially turfed area, and shading features. This site represented many outdoor settings in Melbourne’s inner city and was designed to serve a wide range of visitors, mainly university students, staff and other visitors. A few restaurants and cafés were near this site on Stewart Street. Building 80 was the closest educational building and students and staff from schools located in this building were typically the main visitors of facilities in this site.
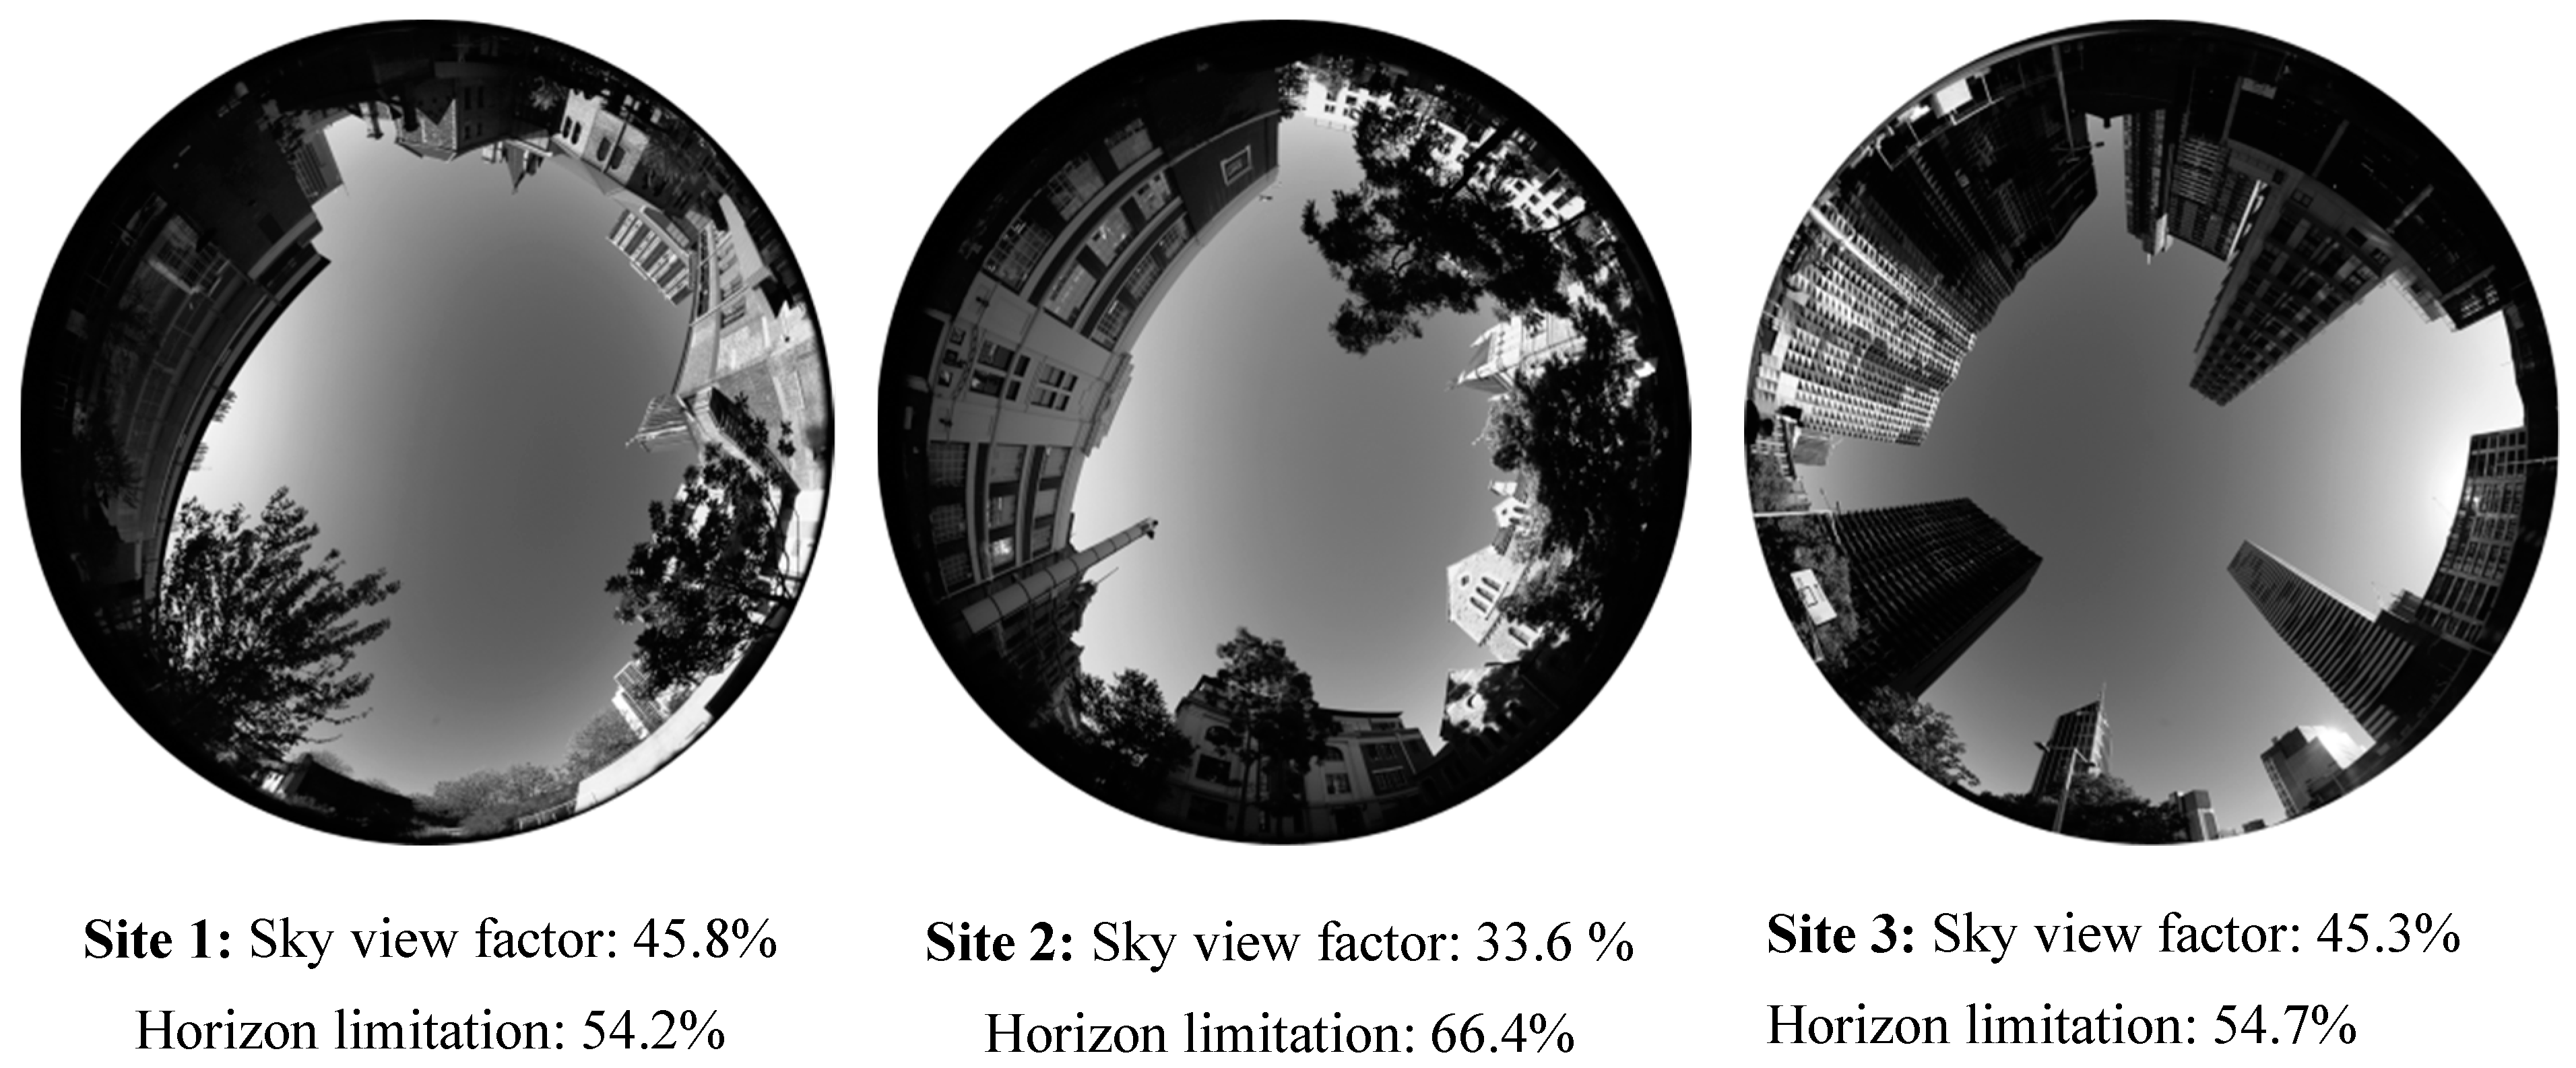
Figure 3 shows the variations in the design of these three sites using sky view factors (SVF) as a design descriptor [43,44]. The SVF was quantified by calculations of the ratio between obstacles and total vertical horizon using 180° fish-eye images. The images were taken using a Canon EOS 6D SLR camera which was fitted with a Canon EF 8e15 mm f/4 L Fisheye USM lens. The SVF percentages were calculated through Rayman Software [45]. As shown in Figure 3, among the study sites, Site 3 has the largest value of horizon limitation followed by that in Site 2 and Site 1. The limited horizon signifies the occurrence of longer duration of shade in an outdoor space, which may also influence wind sensitivity of outdoor users.
2.2. Field Survey
This study used a questionnaire survey concurrent to on-site measurement to understand people’s wind comfort perception. The field surveys were conducted in three seasons: Spring (November 2014), summer (February 2015) and autumn (May 2015). A portable measurement equipment (Testo 480 IAQ Pro Measurement Kit) was used to monitor the values of four major micrometeorological parameters: Ta, Va, RH, and globe temperature (Tg) (Figure 4).
The anemometer (TESTO COMFORT probe 0628 0143) registered Va values ranging from 0.01 m/s to 5 m/s. A data logger was set to record the data at five-minute intervals. The Tg, RH and Va sensors in the portable device were mounted at around 1 m height. Additionally, the solar radiation intensity (Sr), was measured using a Silicon Smart HOBO S-LIB-M003 sensor, mounted at 95 cm height on a separate tripod, in the proximity of the portable device. The above-mentioned devices were placed close to participants, within a radius of 2 m, to measure immediate thermal conditions to the human body’s core. The full specification of instruments devised in this study including their measuring accuracy is presented in Table 1.
Structured according to universal thermal comfort standards [46,47], a questionnaire survey during 9 days elicited information about people’s thermal perceptions including wind comfort perceptions. Three scales used include “Bedford preference” (i.e., weaker, no change and stronger), “thermal sensation” (i.e., hot, warm, moderately warm, neutral, slightly cool, moderately cool, cold), and “personal acceptability” (i.e., acceptable and unacceptable). As stated before, the study population consisted of university students, staff and others using these spaces at the time of the survey. The questionnaire surveys were conducted close to the portable device (TESTO IAQ probe), while this device was recording surrounding micrometeorological conditions with five-minute intervals. On average, the questionnaire surveys took less than five minutes to complete, and participants had been briefed prior to taking surveys about the objectives of the study.
In total, 1059 questionnaires were collected over the three seasons: spring (368), summer (413) and autumn (278) across the three sites. The survey population consisted of male (N = 704, 66.5%) and female participants (N = 355, 33.5%) who were mostly from the age group of 18–30 (60.5%). The majority of participants were students (62.7%) who were mostly born somewhere other than Melbourne (65%). The respondents were present in the outdoor environments predominantly for a short time period (5–10 min) and in most cases less than 5 min (39%).
2.3. Data Processing and Analysis
This study employed both descriptive and inferential methods to analyze wind and comfort data. Following data screening, the frequency distribution of comfort data was determined for different seasons and sites. Regression model and probit analysis [48] were also applied to comfort data to shed light on the characteristics of people’s perceptions of Va values. The probit analysis was conducted based on the ratio between the number of those who preferred weaker Va values to the entire number of participants. For the purposes of analysis, comfort votes were averaged and compared against measured Va. Furthermore, Spearman’s rank correlation was used to compare the impact of four environmental parameters on participants’ thermal sensations. Microsoft Excel Spreadsheets V. 2010 and SPSS V.25 were used to screen and analyze the collected data. The following sections present the outcome of data analysis in this study.
3. Results
3.1. Micrometeorological Measurements
The results of on-site measurements showed differences in outdoor meteorological conditions in different seasons (Table 2). On average, except for Site 1 in which spring was slightly warmer, the participants experienced higher mean Ta values in summer (25.2°C) than spring (22°C) and autumn (16.4°C) in the study open spaces. Similarly, in the case of mean Tg, summer ranked the highest (29.7°C) followed by spring (26.2°C) and autumn (18.1°C). However, except in Site 2, the greatest values of Sr occurred in spring, followed by summer and autumn. In terms of Va, on average, the study seasons had experienced similar values. The greatest and lowest Va values were recorded in autumn in Site 3 (2.3 m/s) and Site 1 (1.1 m/s) respectively which is representative of highly variable microclimate in Melbourne. Analysis of meteorological conditions among the study sites and SVF indicated that people in Site 3 were less exposed to solar radiation (Tg and Sr) and therefore, had experienced relatively cooler conditions during field surveys.
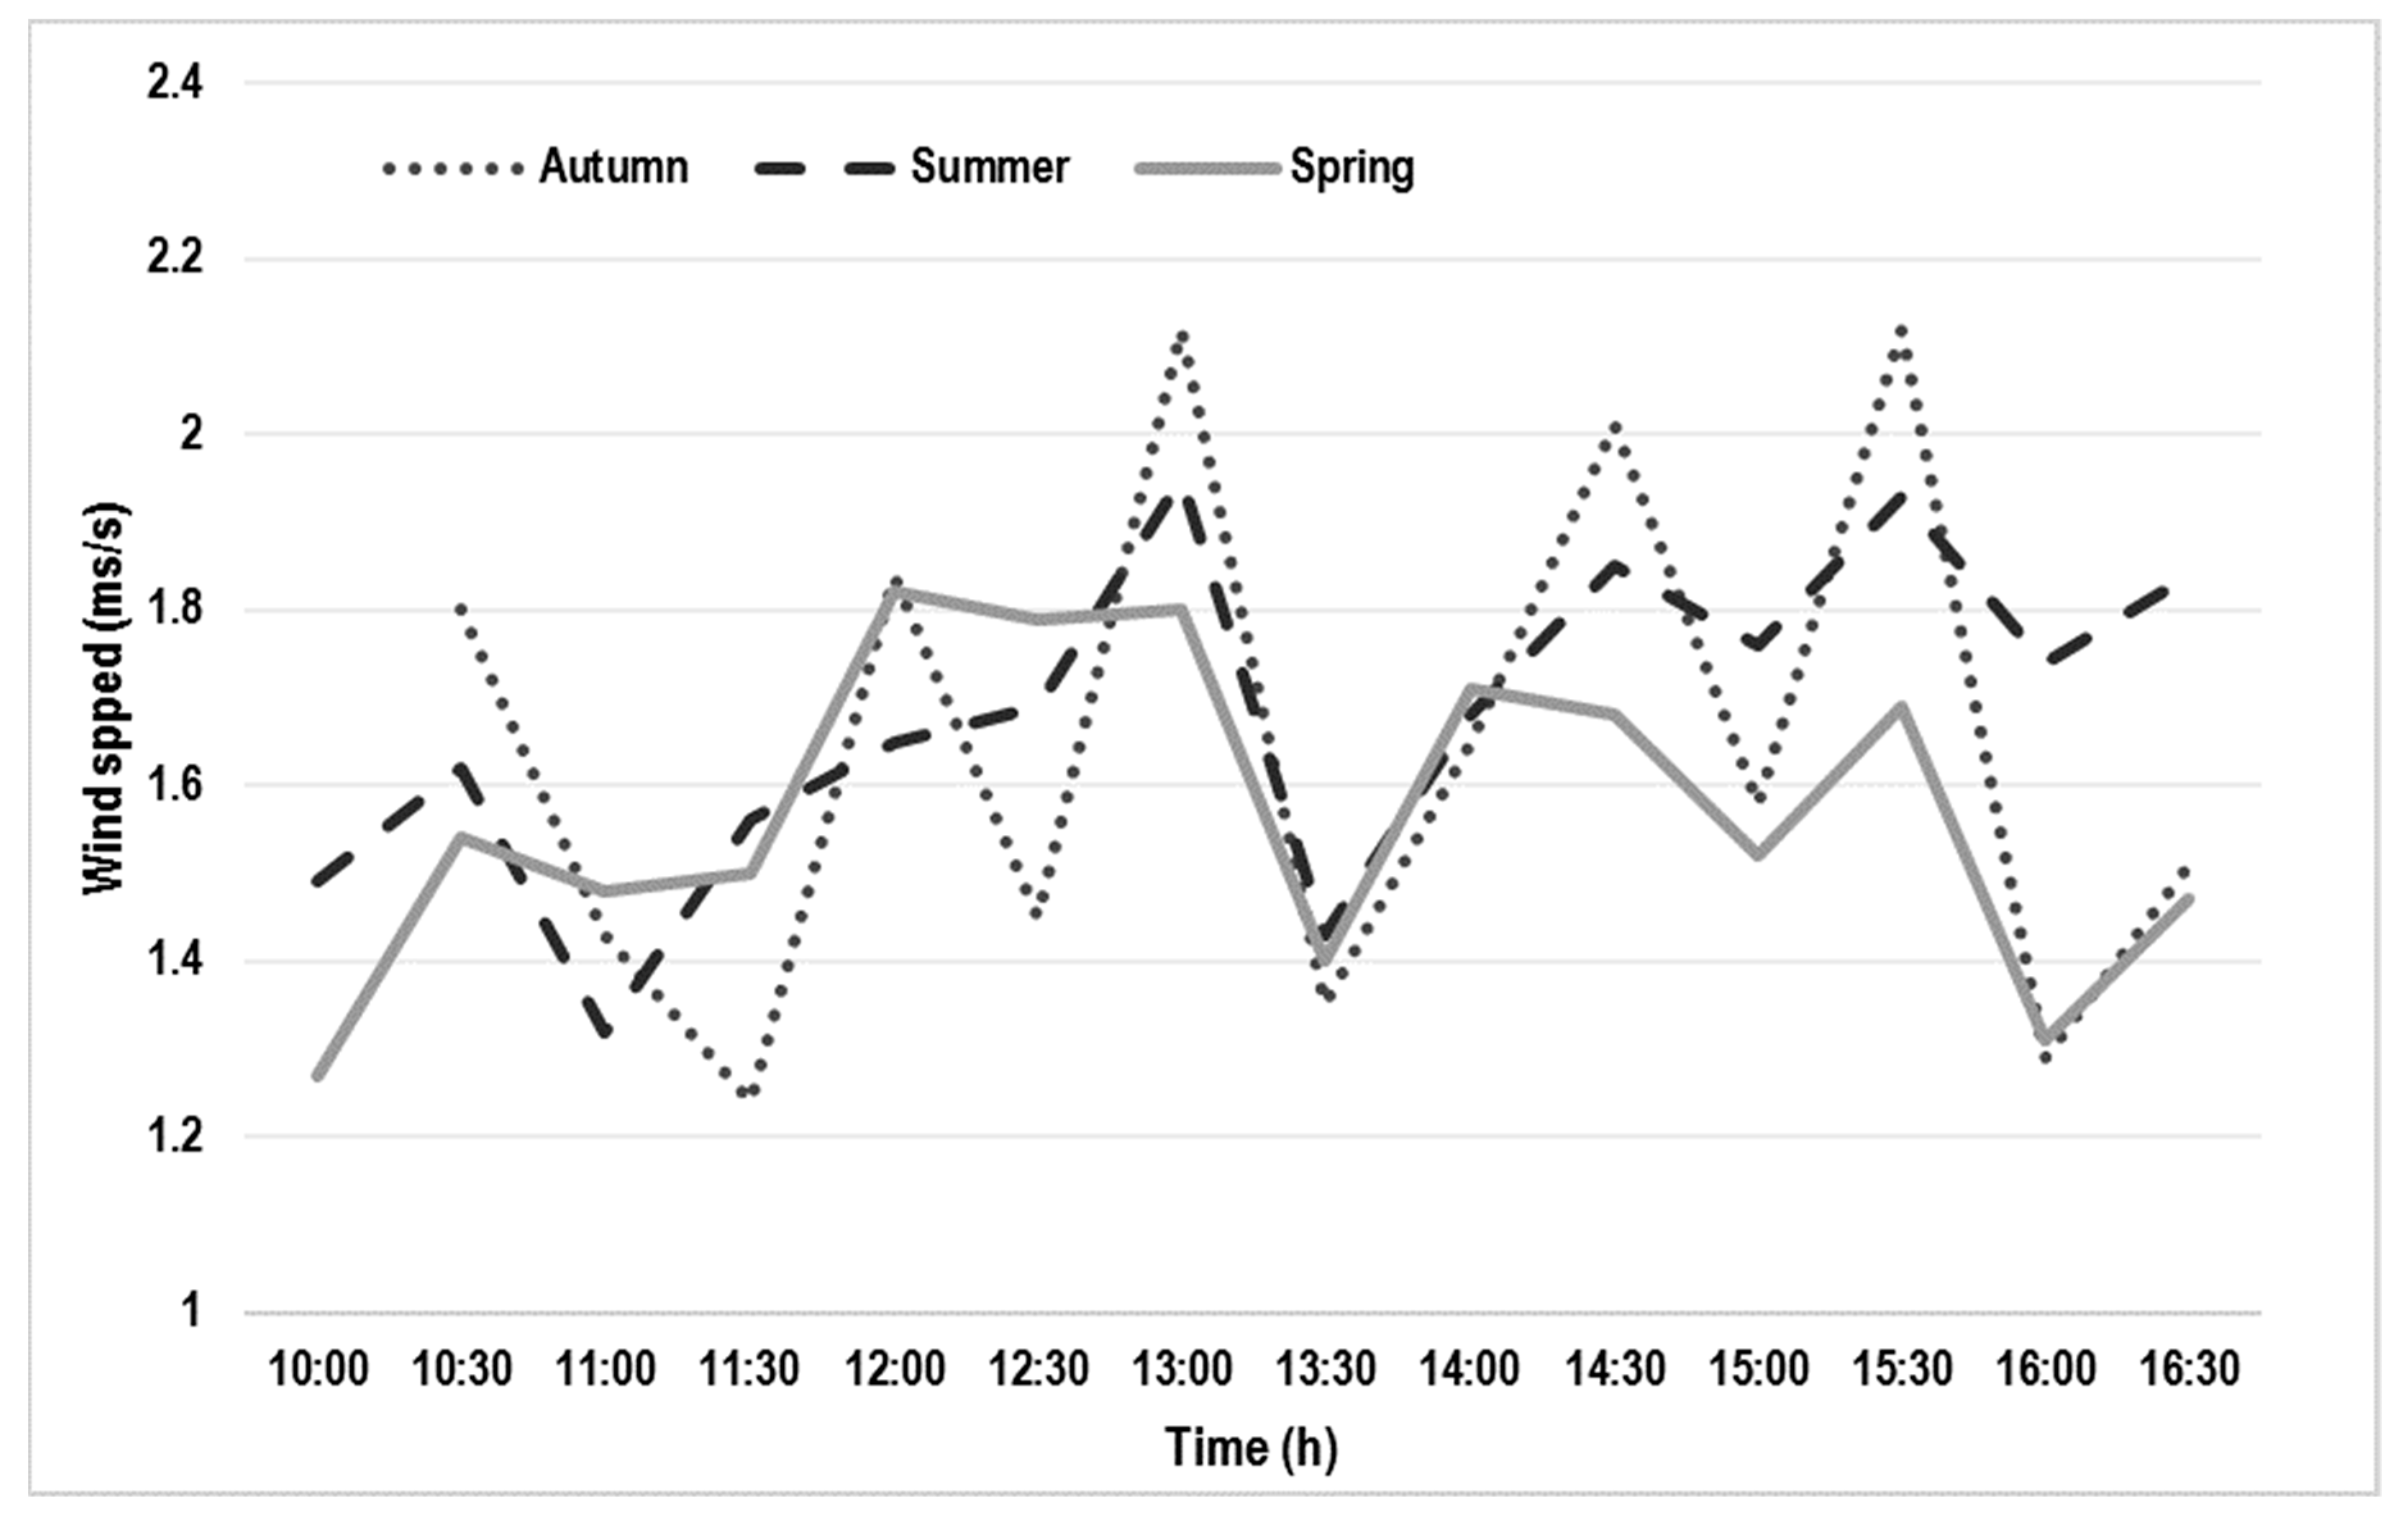
Furthermore, to better understand wind conditions during the survey time (10:00 AM–16:00 PM), the average hourly wind speed values for each season and all study sites are presented in Figure 5. As it can be seen in Figure 5, Va values in autumn showed a greater fluctuation over the period of survey and had several spikes.
3.2. Wind Perceptions in Different Seasons
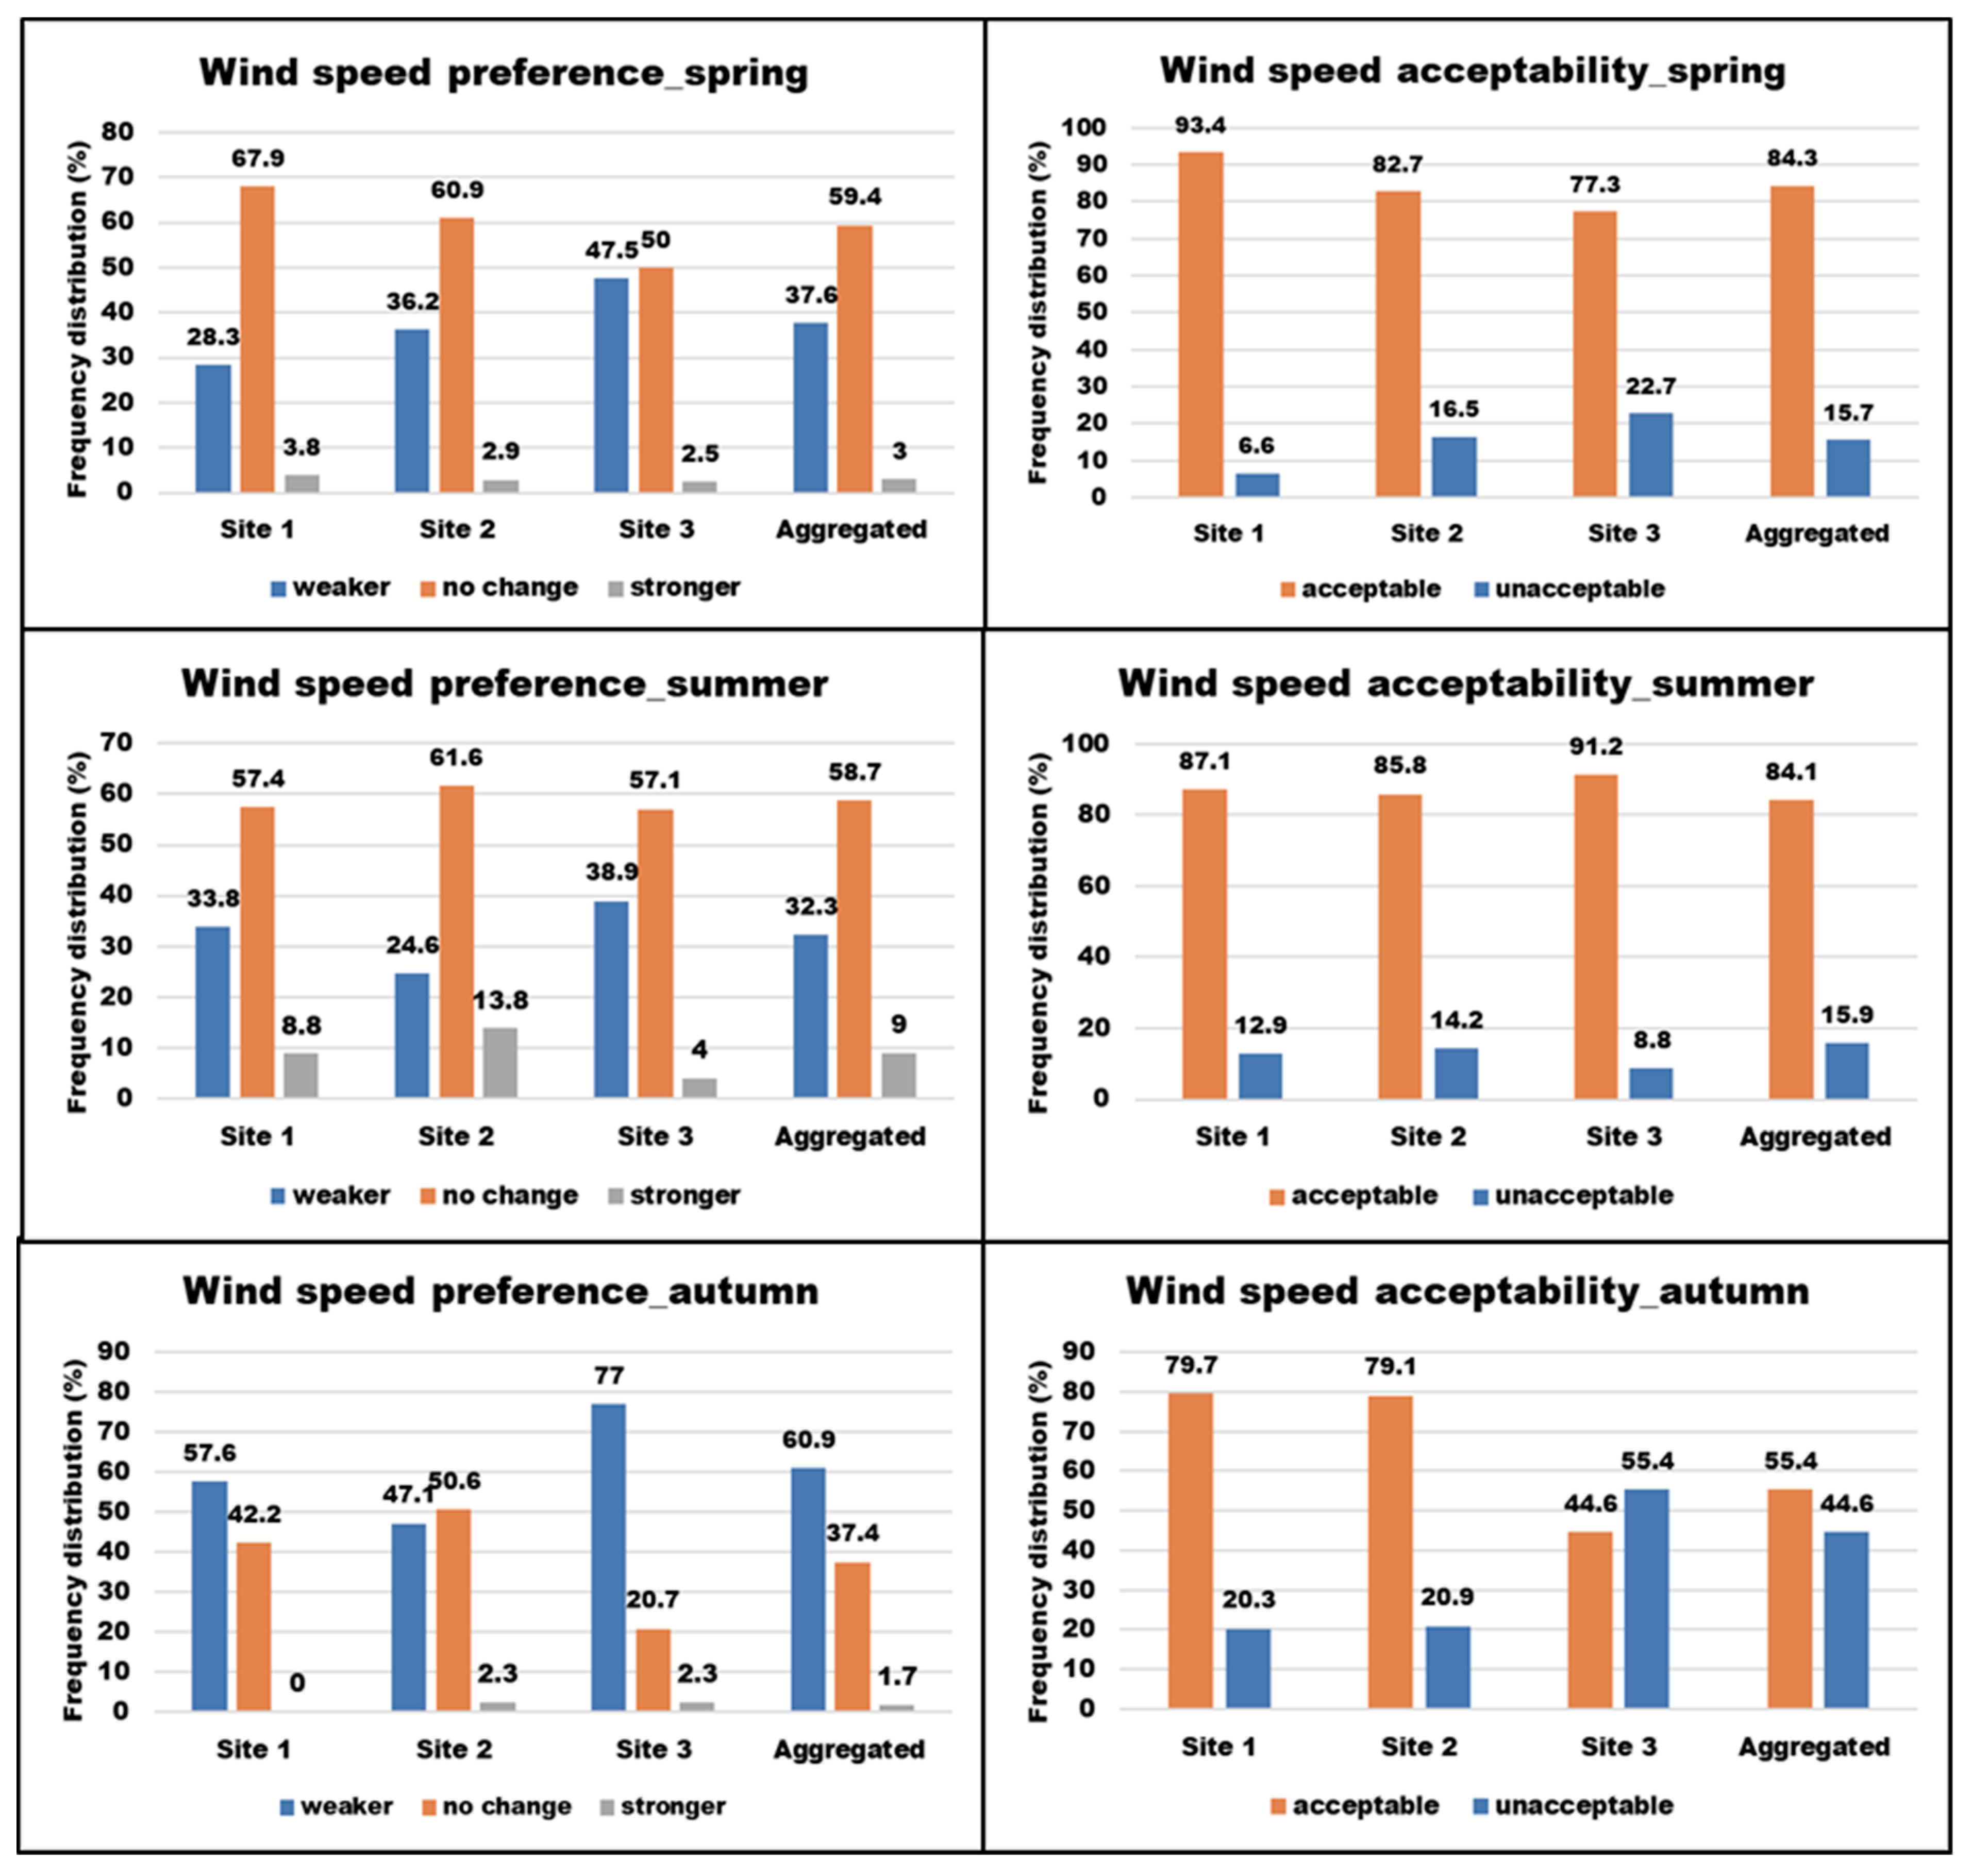
Participants’ by season and by site wind preference and acceptability votes were collected (Figure 6). The overall results showed that in the warm months (spring and summer), on average 59% of people required “no change” in Va values, whereas, in autumn this percentage declined to 37.4%. Furthermore, among the seasons the request for lower Va in autumn (60.9%) was much higher than it was in spring (37.6%) and summer (32.3%). Hence, the demand for stronger winds accounted for very small fractions of total votes (i.e., spring: 3%, summer: 9% and autumn: 1.7%). Va values were perceived equally acceptable in spring and summer with about 84% of people expressed their acceptance with current conditions. Wind acceptability in autumn, however, was found to be lower by around 29%. Figure 6 illustrates the frequency distribution of wind comfort perception votes.
3.3. Wind Perceptions in Different Sites
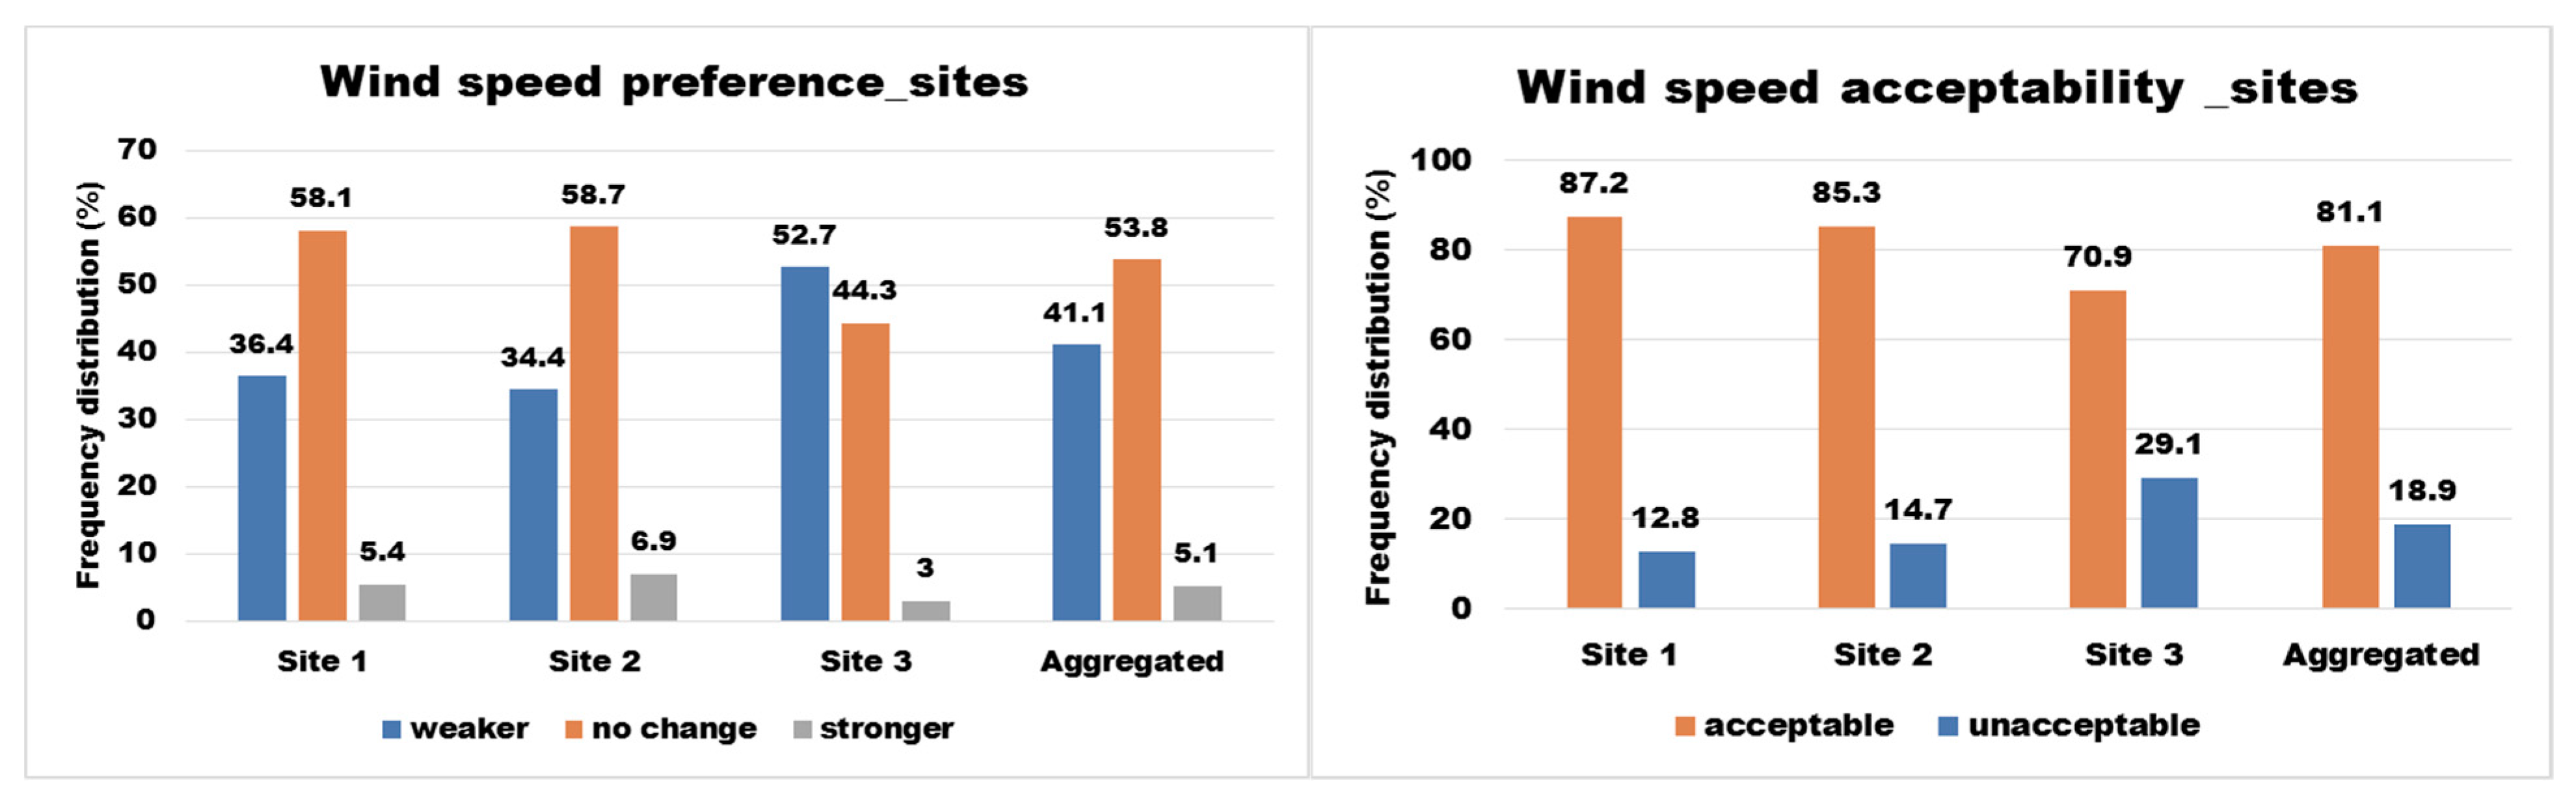
A closer analysis in each site showed varying and interesting patterns of wind comfort perceptions. It seems that among the study sites, Site 3 had the lowest percentages of “no change” votes in all seasons (Figure 7). Correspondingly, in Site 3 more people required weaker Va than they did in Sites 1 and 2. For instance, the requests for weaker Va between Sites 3 and 2 differed between 11.3% and 29.3% in spring and autumn, respectively. In terms of Va acceptability, Site 3 had comparatively the greatest frequency of votes for wind acceptability in general (29.1%; Figure 7), in spring (22.7%; Figure 6) and in autumn (55.4%: Figure 6).
3.4. Association between Wind Perceptions and Va
To understand the association between people’s responses (wind preference) and Va values, a quadratic regression model was applied to individual and aggregated wind comfort data. For analysis purposes, the Va values were binned to 0.26 m/s intervals that generates a better distribution of comfort data; the average of votes within each interval was calculated. As presented in Table 4, the results showed notable variations in this association in different seasons and sites. Among the seasons, Va values in spring (R2 = 0.82, p < 0.01) and autumn (R2 = 0.85, p < 0.01) had the largest degree of association with people’s preference votes. Site analysis showed that on average people in Site 3 were most sensitive to Va values (R2 = 0.83), followed by people in Site 2 (R2 = 0.66) and then Site 1 (R2 = 0.20).
To determine wind sensitivity thresholds, probit analysis was applied to seasonal preference data using SPSS. SPSS produces a range that contains three values: an optimum (preferred) point, lower and upper bounds. The preferred point (Va) indicates a Va value where respondents neither want a stronger nor weaker wind speeds. As shown in Table 5, the preferred Va values range from 1.2 m/s in autumn to 2.04 m/s in spring, and to 4.51 m/s in summer. Furthermore, wind preference data were used to determine sensitivity ranges. These include 1.76–2.49 m/s (spring), 3.11 m/s and above (summer), and 0.94–1.4 m/s (autumn).
3.5. Comparative Analysis of Thermal Perception and Environmental Parameters in Different Seasons
It is critical to understand the individual impact of environmental parameters on people’s thermal perceptions to explain the patterns of thermal comfort requirements. Spearman’s rank correlation analysis served to explore the association between the study environmental parameters and people’s thermal judgment in different seasons. The Spearman’s rank correlation test is appropriate for examining the relationship between an independent variable and a categorical (ordinal) dependent variable [49]. For comparison purposes, only peoples’ thermal sensation votes (TSV) were used as an indicator of thermal perceptions. Table 6 compares the correlation between meteorological parameters and TSV.
Generally, the results revealed that among the environmental parameters, Ta and Tg had the highest correlation with people’s TSV throughout the study period (r = 71, p < 0.01). The general trend of the Va association, in particular, showed a negative relationship with people’s thermal judgments. The seasonal comparison, however, demonstrated a varied impact of wind speed on people’s TSV. The strongest association was found in autumn (r = 27, p < 0.01) when it had an almost similar impact as RH and Sr did. On this basis, it can be speculated that this association would have been greater if data collection had been performed in winter. In warm seasons, the Va impact was not as great as other parameters. Moreover, the absolute values for RH and Sr are similar, but they have opposite sign, indicating that those variables have opposite effect on TSV.
4. Discussion
4.1. Meteorological Conditions and Wind Comfort Perception
Although the results of people’s wind comfort perceptions of both scales (preference and acceptability) indicated generally similar trends (Figure 6), further examinations revealed the conceptual differences in the behavior of these two scales. When thermal acceptability is considered, out of nine occasions (three study sites and three seasons), only one occasion (Site 3 in autumn) was found to be rated unacceptable. Indeed, the frequency of acceptable votes substantially outweighed the unacceptable ones in the other eight occasions. However, when their preferences for wind conditions were compared, more people in autumn were found to prefer weaker Va values. As such, the difference between the frequency of preference votes for “no change” and “weaker/stronger” was comparatively much lesser in all study sites in different seasons than it was in the case of thermal acceptability. As reflected in its definition, the main aim of thermal comfort assessment is to determine the degree of satisfaction of a group of people with their thermal conditions. Thermal satisfaction is traditionally assumed to be synonymous to “no change” and “acceptability” in preference and personal acceptability scales, respectively. However, some studies have provided evidence that violates this assumption [50,51,52]. Brager et al. (1993) pointed out that the three concepts of thermal perceptions are qualitatively very different and, cannot equate to thermal acceptability. Therefore, care must be taken when interpreting comfort data obtained from different scales.
Geometry and Wind Perceptions
The findings from the site analysis implied the importance of urban geometry on people’s wind comfort perceptions. A factor that seemed to have an impact on people was the degree of exposure to solar radiation (Table 2). For instance, in Site 3, participants were found to experience relatively lower Tg values than in the other two sites. As such, more people on this site required weaker Va values. Furthermore, in the case of personal acceptability except for the summer, more people in Site 3 perceived wind conditions unacceptable (Figure 6). This may attribute to the urban geometry, as the open spaces are surrounded by high-rise buildings (Figure 3). These surrounding tall buildings block solar radiation from reaching the open space and also induce stronger Va through wind funneling effect. On the same line of reasoning, lower Ta occurred in this site in all seasons (Table 2) which further impacted people’s wind acceptability.
The other factor that might have impacted people’s wind perceptions in different sites is the wind direction in different seasons. As evident in the wind rose diagrams for Melbourne (Figure 1), the seasonal direction and strength of prevalent wind significantly differ between autumn and two warmer seasons (summer and spring). This seasonal difference together with the changes in urban geometry could contribute to varied microclimate conditions and thus people’s perceptions of wind.
GWTS [30] has proposed several design options to engineer wind flow for better thermal comfort in Melbourne CBD. Additionally, the adoption of lift-up design for the densely built-up area with high rise buildings is advocated recently by several researchers around the world [11,22,53,54] and this applies to Melbourne’s CBD conditions. They have demonstrated that this design can favorably influence thermal comfort at the pedestrian level.
It was also found that among the study seasons, wind preference votes in summer were rather less subject to Va values. Furthermore, among the study sites, there was a better match between Va values and their preference for no change/change in Site 3 than other sites. This could be probably related to the occurrence of lower solar radiation values that amplified the impact of Va on outdoor visitors.
4.2. Wind Comfort Sensitivity Thresholds
The threshold for wind speed is a relative and arbitrary criterion [55] that differs significantly. In this study, probit analysis was used to develop wind comfort sensitivity thresholds for the three seasons as well as the entire study period. Since there are some disparities in the information provided through the two scales used, this study calculated thresholds for people’s sensitivity against Va values (Table 6) using people’s wind preference votes. It seems that wind conditions in the warm seasons were rather acceptable to more people partook in the field surveys (Figure 4) and accordingly stronger preferred Va values are recorded in spring (2.04 m/s) and summer (4.51 m/s). In the cool season, however, while people generally rated the wind conditions acceptable, they preferred weaker Va values and therefore their preferred Va is calculated as 1.25 m/s. It is worthwhile to compare the wind sensitivity thresholds found in this study with those in previous studies. Table 7 presents these comparisons within different contexts.
In many of these studies and reports, the wind speed thresholds are provided according to the type of activity and for all year round. However, reporting a single sensitivity threshold that is specific to all-year-round can be problematic due to the impact of seasonality on the specified thresholds. As the findings of this research showed, each season has a quite different sensitivity threshold. The result of the comparison showed that the thresholds calculated in this study conform to what previous studies reported. Particularly, these thresholds calculated in this study do not seem to contradict with wind comfort criteria guideline developed for Melbourne CBD before [30]. The guideline that is based on Melbourne Wind Criteria [31] advised that for different postures, Va values should not be greater than 3 m/s for sitting, 4 standing and 5 m/s for walking individuals. Overall, it is valuable that future wind comfort assessments provide sensitivity thresholds that are based on season and type of activity.
5. Conclusions
This study conducted a series of outdoor thermal comfort field surveys in three seasons (spring, summer, and autumn) in three open spaces of an educational precinct in Melbourne, Australia. The research aim was to explore outdoor users’ wind comfort perceptions and determine seasonal wind comfort sensitivity thresholds. People’s wind comfort perceptions were evaluated using “Bedford preference” and “personal acceptability” scales. The results showed that while a large proportion of people perceived wind conditions acceptable in most of the times, their preferences for Va varied in different seasons and sites (preference). This difference is attributed to the conceptual differences between these two scales resulting in discrepancies in people’s wind comfort perceptions. Furthermore, this study determined seasonal wind sensitivity thresholds for open spaces in Melbourne CBD.
Designers and urban planners can use these findings to make an informed decision about outdoor spaces in urbanized areas. In addition, wind engineers who aim to manipulate wind flows in cities in the quest of providing better thermal conditions will benefit from the research findings. However, the results should be used with this caveat in mind that the majority of respondents were students. Therefore, it will be useful if further research is undertaken to quantify wind perception for other populations. Lastly, it is recommended that further studies consider wind conditions in wintertime during which people’s thermal comfort is expected to be profoundly influenced by Va values.
Author Contributions
S.S. and P.R. contributed to conceptualization, methodology, validation, formal analysis, investigation, resources, date curation, writing-original draft preparation, writing-review and editing, and visualization.
Funding
This research received no external funding.
Acknowledgments
Authors would like to thank the RMIT Property Services for providing technical assistance with equipment installation and maintenance.
Conflicts of Interest
The authors declare no conflict of interest.
References
- BOM. Victoria Weather and Warnings. Available online: http://www.bom.gov.au/vic/?ref=hdr (accessed on 2 May 2019).
- Gaitani, N.; Mihalakakou, G.; Santamouris, M. On the use of bioclimatic architecture principles in order to improve thermal comfort conditions in outdoor spaces. Build. Environ. 2007, 42, 317–324. [Google Scholar] [CrossRef]
- ASHRAE 55. Thermal Environmental Conditions for Human Occupancy. In Standard 55-2010; American Society of Heating, Refrigerating and Air-conditioning Engineers: Atlanta, GA, USA, 2017; p. 7. [Google Scholar]
- Fanger, O.P. Thermal Comfort. Analysis and Applications in Environmental Engineering; Danish Technical Press: Copenhagen, Denmark, 1970; p. 244. [Google Scholar]
- Potchter, O.; Cohen, P.; Lin, T.-P.; Matzarakis, A. Outdoor human thermal perception in various climates: A comprehensive review of approaches, methods and quantification. Sci. Total Environ. 2018, 631–632, 390–406. [Google Scholar] [CrossRef] [PubMed]
- Blocken, B.; Carmeliet, J. Pedestrian wind environment around buildings: Literature review and practical examples. J. Therm. Envel. Build. Sci. 2004, 28, 107–159. [Google Scholar] [CrossRef]
- Zhen, M.; Zhou, D.; Bian, G.; Yang, Y.; Liu, Y. Wind environment of urban residential blocks: A research review. Archit. Sci. Rev. 2018, 62, 66–73. [Google Scholar] [CrossRef]
- Walton, D.; Dravitzki, V.; Donn, M. The relative influence of wind, sunlight and temperature on user comfort in urban outdoor spaces. Build. Environ. 2007, 42, 3166–3175. [Google Scholar] [CrossRef]
- Cheng, V.; Ng, E.; Chan, C.; Givoni, B. Outdoor thermal comfort study in a sub-tropical climate: A longitudinal study based in Hong Kong. Int. J. Biometeorol. 2012, 56, 43–56. [Google Scholar] [CrossRef]
- Xie, Y.; Huang, T.; Li, J.; Liu, J.; Niu, J.; Mak, C.M.; Lin, Z. Evaluation of a multi-nodal thermal regulation model for assessment of outdoor thermal comfort: Sensitivity to wind speed and solar radiation. Build. Environ. 2018, 132, 45–56. [Google Scholar] [CrossRef]
- Al-Sallal, K.A.; Al-Rais, L. Outdoor airflow analysis and potential for passive cooling in the modern urban context of Dubai. Renew. Energy 2012, 38, 40–49. [Google Scholar] [CrossRef]
- Du, Y.; Mak, C.M.; Liu, J.; Xia, Q.; Niu, J.; Kwok, K.C. Effects of lift-up design on pedestrian level wind comfort in different building configurations under three wind directions. Build. Environ. 2017, 117, 84–99. [Google Scholar] [CrossRef]
- Soligo, M.J.; Irwin, P.A.; Williams, C.J.; Schuyler, G.D. A comprehensive assessment of pedestrian comfort including thermal effects. J. Wind Eng. Ind. Aerodyn. 1998, 77, 753–766. [Google Scholar] [CrossRef]
- Rajagopalan, P.; Lim, K.C.; Jamei, E. Urban heat island and wind flow characteristics of a tropical city. Sol. Energy 2014, 107, 159–170. [Google Scholar] [CrossRef]
- Oliveira, S.; Andrade, H. An initial assessment of the bioclimatic comfort in an outdoor public space in Lisbon. Int. J. Biometeorol. 2007, 52, 69–84. [Google Scholar] [CrossRef] [PubMed]
- Wong, M.S.; Nichol, J.E.; To, P.H.; Wang, J. A simple method for designation of urban ventilation corridors and its application to urban heat island analysis. Build. Environ. 2010, 45, 1880–1889. [Google Scholar] [CrossRef]
- Ghali, K.; Ghaddar, N.; Bizri, M. The influence of wind on outdoor thermal comfort in the city of Beirut: A theoretical and field study. HvacR Res. 2011, 17, 813–828. [Google Scholar]
- Kato, S.; Hiyama, K. Ventilating Cities: Air-Flow Criteria for Healthy and Comfortable Urban Living; Springer Science & Business Media: Berlin, Germany, 2012. [Google Scholar]
- Hsieh, C.-M.; Huang, H.-C. Mitigating urban heat islands: A method to identify potential wind corridor for cooling and ventilation. Comput. Environ. Urban Syst. 2016, 57, 130–143. [Google Scholar] [CrossRef]
- Du, Y.; Mak, C.M.; Kwok, K.; Tse, K.-T.; Lee, T.-c.; Ai, Z.; Liu, J.; Niu, J. New criteria for assessing low wind environment at pedestrian level in Hong Kong. Build. Environ. 2017, 123, 23–36. [Google Scholar] [CrossRef] [Green Version]
- Shooshtarian, S.; Rajagopalan, P.; Sagoo, A. A comprehensive review of thermal adaptive strategies in outdoor spaces. Sustain. Cities Soc. 2018, 41, 647–665. [Google Scholar] [CrossRef]
- Shahidan, M.F.; Jones, P. 179: Plant Canopy Design in Modifying Urban Thermal Environment: Theory and Guidelines. In Proceedings of the 25th Conference on Passive and Low Energy Architecture-(PLEA), Dublin, Irland, 22–24 October 2008. [Google Scholar]
- Tse, K.-T.; Zhang, X.; Weerasuriya, A.U.; Li, S.; Kwok, K.C.; Mak, C.M.; Niu, J. Adopting ‘lift-up’building design to improve the surrounding pedestrian-level wind environment. Build. Environ. 2017, 117, 154–165. [Google Scholar] [CrossRef]
- Kubota, T.; Miura, M.; Tominaga, Y.; Mochida, A. Wind tunnel tests on the relationship between building density and pedestrian-level wind velocity: Development of guidelines for realizing acceptable wind environment in residential neighborhoods. Build. Environ. 2008, 43, 1699–1708. [Google Scholar] [CrossRef]
- Abd Razak, A.; Hagishima, A.; Sa, A.; Abidin, Z.; Zaki, S.A. Progress in wind environment and outdoor air ventilation at pedestrian level in urban area. In Applied Mechanics and Materials; Trans Tech Publications: Zurich, Switzerland, 2016; pp. 236–240. [Google Scholar]
- Coffee, N.T.; Lange, J.; Baker, E. Visualising 30 years of population density change in Australia’s major capital cities. Aust. Geogr. 2016, 47, 511–525. [Google Scholar] [CrossRef]
- Holdsworth, S.; Kenny, D.; Cooke, J.; Matfin, S. Are We Living with Our Heads in the Clouds? Perceptions of Liveability in the Melbourne High-Rise Apartment Market. In Energy Performance in the Australian Built Environment; Springer: Berlin, Germany, 2019; pp. 181–198. [Google Scholar]
- Chapman, S.; Watson, J.; McAlpine, C. Large seasonal and diurnal anthropogenic heat flux across four Australian cities. J. South. Hemisph. Earth Syst. Sci. 2016, 66, 342–360. [Google Scholar]
- Jacobs, S.J.; Pezza, A.B.; Barras, V.; Bye, J. A new ‘bio-comfort’perspective for Melbourne based on heat stress, air pollution and pollen. Int. J. Biometeorol. 2014, 58, 263–275. [Google Scholar] [CrossRef] [PubMed]
- Sadeghi, M.; de Dear, R.; Wood, G.; Samali, B. Development of a bioclimatic wind rose tool for assessment of comfort wind resources in Sydney, Australia for 2013 and 2030. Int. J. Biometeorol. 2018, 62, 1963–1972. [Google Scholar] [CrossRef] [PubMed]
- GWTS. Central City Built Form Review Wind Assessments; GWTS: Melbourne, Australia, 2016; p. 107. [Google Scholar]
- Melbourne, W. Criteria for environmental wind conditions. J. Wind Eng. Ind. Aerodyn. 1978, 3, 241–249. [Google Scholar] [CrossRef]
- Lam, C.K.C.; Loughnan, M.; Tapper, N. Visitors’ perception of thermal comfort during extreme heat events at the Royal Botanic Garden Melbourne. Int. J. Biometeorol. 2018, 62, 97–112. [Google Scholar] [CrossRef]
- Sharifi, E.; Sivam, A.; Boland, J. Resilience to heat in public space: A case study of Adelaide, South Australia. J. Environ. Plan. Manag. 2016, 59, 1833–1854. [Google Scholar] [CrossRef]
- Spagnolo, J.; de Dear, R. A field study of thermal comfort in outdoor and semi-outdoor environments in subtropical Sydney Australia. Build. Environ. 2003, 38, 721–738. [Google Scholar] [CrossRef] [Green Version]
- Coutts, A.M.; White, E.C.; Tapper, N.J.; Beringer, J.; Livesley, S.J. Temperature and human thermal comfort effects of street trees across three contrasting street canyon environments. Theor. Appl. Climatol. 2015, 124, 55–68. [Google Scholar] [CrossRef]
- Department of Sustainability and Environment (Ed.) Guidelines for Higher Density Residential Development Environment; Department of Sustainability and Environment: Victoria, Australia, 2004. [Google Scholar]
- Department of Infrastructure and Planning (Ed.) Multiple Dwelling Code. Planning; Department of Infrastructure and Planning: Brisbane, Australia, 2015. [Google Scholar]
- Kottek, M.; Grieser, J.; Beck, C.; Rudolf, B.; Rubel, F. World map of the Köppen-Geiger climate classification updated. Meteorol. Z. 2006, 15, 259–263. [Google Scholar] [CrossRef]
- Peel, M.C.; Finlayson, B.L.; McMahon, T.A. Updated world map of the Köppen-Geiger climate classification. Hydrol. Earth Syst. Sci. 2007, 11, 1633–1644. [Google Scholar] [CrossRef]
- BoM. Climate Statistics for Australian Locations; BoM.: Melbourne, Australia, 1981–2010, 2019. [Google Scholar]
- Shooshtarian, S.; Rajagopalan, P. Daytime thermal performance of different urban surfaces: A case study in educational institution precinct of Melbourne. Archit. Sci. Rev. 2018, 61, 29–47. [Google Scholar] [CrossRef]
- Grimmond, C.; Potter, S.; Zutter, H.; Souch, C. Rapid methods to estimate sky-view factors applied to urban areas. Int. J. Climatol. 2001, 21, 903–913. [Google Scholar] [CrossRef]
- Watson, I.; Johnson, G. Graphical estimation of sky view-factors in urban environments. J. Climatol. 1987, 7, 193–197. [Google Scholar] [CrossRef]
- Matzarakis, A.; Rutz, F.; Mayer, H. Modelling radiation fluxes in simple and complex environments—application of the RayMan model. International Journal of Biometeorology 2007, 51, 323–334. [Google Scholar] [CrossRef] [PubMed]
- ISO 7730. Moderate Thermal Environments—Determination of the PMV and PPD Indices and Specifications of the Conditions for Thermal Comfort; International Organization for Standardization (ISO): Geneva, Switzerland, 2006. [Google Scholar]
- ISO 10551. Ergonomics of the Thermal Environment—Assessment of the Influence of the thermal Environment Using Subjective Judgement Scales; International Organization for Standardization: Geneva, Switzerland, 1995. [Google Scholar]
- Ballantyne, E.; Hill, R.; Spencer, J. Probit analysis of thermal sensation assessments. Int. J. Biometeorol. 1977, 21, 29–43. [Google Scholar] [CrossRef] [PubMed]
- Foster, J.J. Data Analysis Using SPSS for Windows Versions 8–10: A Beginner’s Guide; Sage Publication: London, UK, 2001; p. 252. [Google Scholar]
- Brager, G.; Fountain, M.; Benton, C.; Arens, E.A.; Bauman, F. A Comparison of Methods for Assessing Thermal Sensation and Acceptability in the Field. In Thermal Comfort: Past, Present and Future; Building Research Establishment: Watford, UK, 1993; pp. 16–39. [Google Scholar]
- Zhang, Y.; Zhao, R. Relationship between thermal sensation and comfort in non-uniform and dynamic environments. Build. Environ. 2009, 44, 1386–1391. [Google Scholar] [CrossRef]
- Lai, D.; Guo, D.; Hou, Y.; Lin, C.; Chen, Q. Studies of outdoor thermal comfort in northern China. Build. Environ. 2014, 77, 110–118. [Google Scholar] [CrossRef]
- Xia, Q.; Liu, X.P.; Niu, J.L.; Kwok, K.C.S. Effects of building lift-up design on the wind environment for pedestrians. Indoor Built Environ. 2017, 26, 1214–1231. [Google Scholar] [CrossRef]
- Liu, J.; Niu, J.; Mak, C.M.; Xia, Q. Detached eddy simulation of pedestrian-level wind and gust around an elevated building. Build. Environ. 2017, 125, 168–179. [Google Scholar] [CrossRef]
- Willemsen, E.; Wisse, J.A. Design for wind comfort in The Netherlands: Procedures, criteria and open research issues. J. Wind Eng. Ind. Aerodyn. 2007, 95, 1541–1550. [Google Scholar] [CrossRef]
- City of Montreal (Ed.) Ville de Montréal—Master Plan—Part III—Complementary Document—1/6. Montreal; City of Montreal: Montreal, QC, Canada, 2003. [Google Scholar]
- Szűcs, Á. Wind comfort in a public urban space—Case study within Dublin Docklands. Front. Archit. Res. 2013, 2, 50–66. [Google Scholar] [CrossRef]
- Shi, X.; Zhu, Y.; Duan, J.; Shao, R.; Wang, J. Assessment of pedestrian wind environment in urban planning design. Landsc. Urban Plan. 2015, 140, 17–28. [Google Scholar] [CrossRef]
Figure 1.
Wind rose diagrams for (from left to right) November, February and May. 3:00 pm. Adapted from Australia Bureau of Meteorology [41].
Figure 1.
Wind rose diagrams for (from left to right) November, February and May. 3:00 pm. Adapted from Australia Bureau of Meteorology [41].

Figure 2.
Three open spaces in Melbourne CBD under study.

Figure 3.
The percentage of level of sky clearness among the study sites.

Figure 4.
Measurement equipment.

Figure 5.
Seasonal wind conditions in the study sites during the survey time.

Figure 6.
Distribution of seasonal wind comfort perceptions in different sites.

Figure 7.
Distribution of annual wind comfort perceptions in different sites.


Table 1.
Technical specifications of instruments used in this study.
| Measured Parameter | Logger | Specifications | Measuring Range | Accuracy and Resolution | Unit |
|---|---|---|---|---|---|
| Air temperature (Ta) | TESTO IAQ probe 0632 1543 | IAQ probe for analysing indoor air quality, CO2, humidity, temperature and absolute pressure measurement | 0 to 50 | ±0.5 (at 22); 0.1 | °C |
| Relative humidity (RH) | TESTO IAQ probe 0632 1543 | IAQ probe | 0 to +100 (non-condensing) | ±(1.8 +0.7 of meas. val.) and ±0.03 RH/K (based on 25 °C); 0.1 | % |
| Globe temperature (Tg) | TESTO Globe thermometer 0602 0743 | Black painted Globe probe Ø 150mm, TC Type K, made of copper | 0 to +120 | Class 1 (−40 to +1000); 0.1 | °C |
| Air velocity (Va) | TESTO COMFORT probe 0628 0143 | Omni-directional Comfort probe for the degree of turbulence measurement according to EN 13779 | 0 to 5 | 0.5 ±(0.03 + 4% of meas. val.); 0.01 | m/s |
Table 2.
Seasonal meteorological conditions in different sites.
| Site 1 | Site 2 | Site 3 | ||||||||||
|---|---|---|---|---|---|---|---|---|---|---|---|---|
| Parameter Unit of Measurement | Ta (°C) | Tg (°C) | Sr (W/m2) | Va (m/s) | Ta (°C) | Tg (°C) | Sr (W/m2) | Va (m/s) | Ta (°C) | Tg (°C) | Sr (W/m2) | Va (m/s) |
| Spring | 22.8 | 26.4 | 644 | 1.4 | 23.8 | 28.7 | 443 | 1.7 | 19.3 | 23.6 | 486 | 1.6 |
| Summer | 22.2 | 27.3 | 502 | 1.9 | 29.1 | 34.6 | 517 | 1.5 | 24.3 | 27.2 | 352 | 1.5 |
| Autumn | 17.4 | 20.5 | 204.3 | 1.1 | 16.7 | 18.2 | 129.6 | 1.2 | 15.1 | 15.8 | 64.8 | 2.3 |
| Aggregated | 22.0 | 24.5 | 516 | 1.6 | 25.2 | 29.8 | 461 | 1.5 | 16.6 | 17.5 | 320 | 1.6 |
Table 3.
Statistics related to seasonal wind conditions during the survey time.
| N | Minimum | Maximum | Mean | Std. Deviation | |
|---|---|---|---|---|---|
| Spring | 368 | 0 | 4 | 1.59 | 0.657 |
| Summer | 413 | 0 | 5 | 1.67 | 0.735 |
| Autumn | 242 | 0 | 6 | 1.64 | 1.090 |
Table 4.
Quadratic regression between people’s wind preference and different Va values.
| Season | Site 1 R2 | Site 2 R2 | Site 3 R2 | Total R2 |
|---|---|---|---|---|
| Spring | 0.44 | 0.70 | 0.37 | 0.82 |
| Summer | 0.09 | 0.28 | 0.82 | 0.45 |
| Autumn | 0.46 | 0.33 | 0.39 | 0.85 |
| Total | 0.20 | 0.66 | 0.83 |
Table 5.
Probit analysis for preferred Va and the associating lower and upper bounds.
| Measure Unit of Measurement Season | Preferred Va (m/s) | Lower Bound (m/s) | Upper Bound (m/s) |
|---|---|---|---|
| Spring | 2.04 | 1.76 | 2.49 |
| Summer | 4.51 | >3.11 | |
| Autumn | 1.2 | 0.94 | 1.4 |
| Collective | 2.35 | 2.05 | 2.86 |
Table 6.
Regression between thermal sensation vote and various meteorological parameters.
| Variable | TSV (Spring) | TSV (Summer) | TSV (Autumn) | TSV (Pooled) |
|---|---|---|---|---|
| Ta | 58 ** | 58 ** | 43 ** | 71 ** |
| Tg | 47 ** | 62 ** | 42 ** | 70 ** |
| Va | −8 | −11 ** | −27 ** | −10 ** |
| RH | −47 ** | −45 ** | −26 ** | −36 ** |
| Sr | 29 ** | 37 ** | 23 ** | 48 ** |
** Correlation is significant at the 0.01 level.
Table 7.
Comparison of wind sensitivity thresholds (at the pedestrian level) between different cities.
Table 7.
Comparison of wind sensitivity thresholds (at the pedestrian level) between different cities.
| City/Country/Province | Spring m/s | Summer m/s | Autumn m/s | Winter m/s | All Year Round m/s | |
|---|---|---|---|---|---|---|
| This study | Melbourne | 2.04 (1.76–2.49) | 4.51 (>3.11) | 1.25 (0.94–1.4) | NA | 2.53 (entire study period) (2.05–2.86) |
| City of Montreal [56] | Montreal, Canada | NA | 6.11< | NA | 4.15< | NA |
| Willemsen and Wisse [55] | Netherland | NA | NA | NA | NA | Traversing: <10 (good), 10–20 (moderate), >20 (poor) Strolling: <5 (good), 5–10 (moderate), >10 (poor) Sitting: <2.5 (good), 2.5–5 (sitting), >5 (poor) |
| Szűcs [57] | Dublin | NA | NA | NA | NA | Walking: <5.4 Standing: <3.9 Sitting: <2.6 |
| Shi, et al. [58] | Jiangsu, China | NA | NA | NA | NA | Walking: < 5 Standing: <3.9 Sitting: 2.5 |
| GWTS [30] | Melbourne | NA | Sitting: ≤3 Standing: ≤4 Walking: ≤5 | NA | NA | NA |
© 2019 by the authors. Licensee MDPI, Basel, Switzerland. This article is an open access article distributed under the terms and conditions of the Creative Commons Attribution (CC BY) license (http://creativecommons.org/licenses/by/4.0/).
Share and Cite
MDPI and ACS Style
Shooshtarian, S.; Rajagopalan, P. Perception of Wind in Open Spaces. Climate 2019, 7, 106. https://0-doi-org.brum.beds.ac.uk/10.3390/cli7090106
AMA Style
Shooshtarian S, Rajagopalan P. Perception of Wind in Open Spaces. Climate. 2019; 7(9):106. https://0-doi-org.brum.beds.ac.uk/10.3390/cli7090106
Chicago/Turabian StyleShooshtarian, Salman, and Priyadarsini Rajagopalan. 2019. "Perception of Wind in Open Spaces" Climate 7, no. 9: 106. https://0-doi-org.brum.beds.ac.uk/10.3390/cli7090106
Note that from the first issue of 2016, this journal uses article numbers instead of page numbers. See further details here.