Evaluation of Moisture Level Using Precipitation Indices as a Landslide Triggering Factor—A Study of Coonoor Hill Station

Centre for Advanced Research in Environment, School of Civil Engineering, SASTRA University, Thanjavur 613 401, India
*
Authors to whom correspondence should be addressed.
Climate 2019, 7(9), 111; https://0-doi-org.brum.beds.ac.uk/10.3390/cli7090111
Submission received: 27 July 2019
/
Revised: 20 August 2019
/
Accepted: 11 September 2019
/
Published: 13 September 2019
Abstract
:Extreme heavy rainfall events in the hilly region pose a great threat to public safety and causes dangerous landslides in the region. Several factors contribute to a landslide and, hence, it is essential to analyze the causes of such related incidents in all possible ways. Though rainfall is the major triggering factor for most of the landslides in the Western Ghats, the long period antecedent moisture level prevailing in the soil of a hilly terrain cannot be ignored. Few of the drought assessing and monitoring indices available in literature can be adopted to predict the degree of wetness from long-term precipitation data of the region. In the present work, three moisture level assessment indices, namely, standardized precipitation index (SPI), China Z-index (CZI), and statistical Z-Score (SZS) index are used to categorize the antecedent moisture level of Coonoor station. Monthly rainfall data for a period of 81 years is used for the study. It is evident from the study that higher level of moisture followed by heavy rainfall triggers medium- to large-scale landslides. Further, from the study it is inferred that an early warning for a landslide can be given once cumulative rainfall exceeds 300 mm during continuous storm periods.
1. Introduction
Landslides due to rainfall infiltration along the slope of the hilly terrain and cut slopes is one of the important research areas in landslide investigations, for which short-duration rainfall data is essential [1]. It is scientifically important to predict the spatial and temporal occurrence of landslides triggered by rainfall due to its severe threat on human life and property [2]. Detailed landslide inventory of the region can help in getting an insight on the nature of landslides, mechanisms, temporal occurrence, and its frequency [3]. High-quality landslide inventories can be created with accurate spatial locations for quantitative landslide hazard and risk assessments [4]. The hill and mountainous terrains of India are experiencing more landslides due to rapid population growth [5]. Using daily rainfall to assess the antecedent moisture condition prior to landslide events is very common in the absence of short-duration rainfall data. Evaluation of wet and dry conditions can be made using drought indices where the range for extreme drought to extreme wet is defined from rainfall data. Such indices can be adapted for five days, weekly, monthly, seasonally, and annually for better correlation with landslide events. The standardized precipitation index (SPI) is commonly used to assess the moisture level of a station or region and it requires only rainfall data. Though most of the drought indices are generally used to assess the dryness of a place that leads to different degrees of drought severity, SPI, China Z-index, and statistical Z-score give ranges for moisture level in wet conditions too. Hence, these three drought indices are used to assess the moisture level of the hilly terrain. There is not much work carried out to relate moisture level calculated using drought indices with landslide events. The present study aims to understand rainfall as a triggering mechanism due to antecedent moisture condition and to establish a rainfall threshold using moisture level indices.
Understanding the relationship between rainfall and landslide occurrences has invited several researchers to investigate this hydro-geological phenomenon and, also, it is to be noted that rainfall is the most common landslide-triggering factor in many regions in the world [6]. Several studies confirm that rainfall contributes to the instability of hilly slopes due to infiltration of rain water that could result either in the decrease of soil suction by a moving wetting front or increase of pore pressure by a rising water table. Kawagoe et al. [7] indicated that landslides in Japan are closely associated with its rainfall exceeding threshold values of precipitation. It is to be noted from various literatures that cumulative rainfall, antecedent rainfall, rainfall intensity, and rainfall duration are the most commonly investigated rainfall parameters for landslide initiation. Investigations by Chowdhury and Flent Je [8] states that landslides triggered by rainfall needs complete understanding of the association between the parameters—landslide, frequency of landslides, frequency of heavy rainfall event, subsurface shear movement, and magnitude of pore pressure at the existing landslide locations—and the study of characteristics of rainfall magnitude that causes landslides. Jaiswal [9] indicated that landslides in the selected area of Western Ghats is mostly in the form of debris slides or debris flow triggered by high-intensity or prolonged rainfall.
Coonoor station receives rainfall during both the monsoon periods of Tamilnadu state. But, rainfall during the northeast monsoon is found to be very strong and often happens for longer durations, which brings several consecutive rainfall events during this monsoon season. Coonoor station is connected with the plain area by few roads, in which the Coonoor–Mettupalayam highway has a high traffic volume and is the main connecting corridor for passengers and goods carriers. Hence, a detailed analysis of moisture condition of a segment of this area is essential to predict and understand the landslide and debris flow occurrences in the mountainous region. Intense rainfalls of short durations usually occur within longer-duration storms rather than as isolated events. Several such events build up moisture in the hill soil, which could be one of the potential triggering factors for landslides.
2. Study Area
Coonoor Town (Lat: 11°21′0.7488″ N and Long: 76°47′45.9744″ E) is the second largest hill station in the Nilgiris district of Tamilnadu State, India (Figure 1), and also it is a most preferred tourist destination of the region. Areas surrounding the town are most affected by landslides. It is located at an altitude of 1850 m above MSL and has a population of about 45,494 people according to the 2011 census. The climate falls under the sub-tropical highland type according to the Köppen classification system. Charnockite is the most prevalent bedrock material, covered with laterite, which forms an irregular soil horizon, and rocks are of metamorphic origin. Thick yellowish to reddish brown soil can be seen in the region, which would have resulted due to the sub-tropical climate and intense physical and chemical weathering [5]. Tea plantations and tourism are the prime activities of the region and are the source of economy of the town. This town receives heavy rainfall during northeast monsoon periods and brings a lot of landslides during the active monsoon period. Increased occurrences of landslides in Nilgris have been noticed in the past three decades [10]. As intense rainfall occurrence is witnessed around the globe, it is important to study the prospect of rainfall that has a triggered several landslides.
3. Standardized Precipitation Index (SPI)
Precipitation anomalies are a chronic feature of the global climate and it affects various components of the hydrologic cycle to produce droughts and floods. SPI considers only precipitation data of a station for its computation to represent abnormal wetness and dryness. SPI basically represents the difference of precipitation from the mean divided by the standard deviation. The mean and standard deviation should be determined from past continuous records, preferably a minimum of 30 years of data. Using this, anomalies of rainfall can be standardized. This standard value can be used to assess the moisture level of the region. McKee et al. [11] developed the SPI to assess the climate variability using precipitation data alone. It is well known that rainfall data could be best fitted by Gamma distribution. SPI normalize the rainfall data by fitting into Gamma distribution and transform the data to have zero mean and standard deviation of one. It is interesting to note that SPI value can be calculated for different time scales like one-month, three-month, six-month, twelve-month, and twenty-four month to assess status of soil moisture, seasonal estimation of precipitation, ground water level, stream flow, and reservoir storage. Further, SPI time scale of one to three-month, three to six-month, and six to 12-month are used mainly to ascertain meteorological, agricultural, and hydrological drought analyses and applications [12]. The cumulative probability using Gamma distribution is found as follows:
where α—the shape parameter, β—the scale parameter, x—the precipitation value, and τ(α)—Gamma function.
The α and β values can be determined using the maximum likelihood method (Thom, 1966) as follows:
where n—number of precipitation observations and mean of precipitation.
As the gamma distribution is not defined for zero, Equation (1) cannot be used for zero values. Thom (1966) suggested a method to handle zero values as follows:
where q—probability of having zero precipitation,
m—number of days having zero precipitation in the series.
4. China Z-Index (CZI)
The China Z-index was first introduced by the National Climate Centre of China to determine wet and dry periods, assuming that precipitation follows a Pearson type III distribution and it is related to the Wilson–Hilferty cube root transformation. The only input required to evaluate the index is monthly precipitation [13]. The China Z-index is expressed as below:
- Cs—co-efficient of skewness
- Zi—statistical Z-score of month i.
5. Statistical Z-Score Index (SZS)
It is customary to standardize precipitation of a station by dividing the difference in precipitation from the mean for a specific time period with its standard deviation, and it is generally called statistical Z-score. Several researchers used statistical Z-score as SPI [14,15]. The main advantage of this approach is that it does not require any probability distribution like Gamma or Pearson Type III to adjust the data. Jain et al. [16] indicated SPI calculation by statistical Z-score is found to be better in comparison with SPI which uses Gamma distribution. In the present study, a statistical Z-score-based SPI is used and it is calculated as follows:
where x—monthly rainfall data; —mean rainfall; σ—standard deviation of monthly data.
Table 1 presents the various level of moisture for different ranges of SPI, China Z-index, and statistical Z-index.
6. Moisture Severity Index (MSI)
When monthly moisture level is assessed by drought indices, it is commonly observed that some months fall in wet and some in dry conditions. This may happen consecutively, some months in dry and then wet, vice versa, or it may happen alternately and also randomly. The effect of wetness or dryness of one month carries itself forward to subsequent months based on its intensity. Hence, collective indication over a year on moisture level needs to be represented based on monthly value moisture level rather than arriving at moisture level based on annual data. In the present work, moisture severity index is defined as ratio between sum of positive monthly moisture index values and the sum of negative moisture index values. This value can vary from zero to infinity. If MSI is zero for a year, it indicates that the year does not have any wet periods and if it is infinity, then the year has no dry period.
The proposed moisture severity index may address the average annual moisture level, but it cannot be used for correlating with landslide events. Although, it can be used to assess surface water and ground water levels.
7. Antecedent Precipitation Index (API)
Kohler and Linsley [17] presented the antecedent precipitation index (API) which was used in rainfall–runoff modelling and Heggen [18] formulated normalized antecedent precipitation index by modifying the API to include the antecedent precipitation prior to the event day, and normalizing the station mean and antecedent series length. Build-up of moisture over consecutive rainfall events is considered as an important triggering factor. Hence, its evaluation for a specific storm provides the contributing time series rainfall within the longer time series.
where j is the number of antecedent days; K is decay constant and it depends on watershed and seasonal parameters. Viessman and Lewis [19] suggested that K lies between 0.8 and 0.98. It is possible to evaluate which consecutive part of rainfall could have been the triggering rainfall when API is applied for different time series of rainfall data prior to the landslide event. Giannecchini et al. [20] correlated and compared with storm rainfall that triggered shallow landslides in the Serchio River valley, Tuscany, Italy with antecedent rainfalls of three, seven, 15, and 30 days’ time intervals. The study has shown that three to seven days cumulative rainfall will be the main triggering factor for shallow landslides.
8. Results and Discussion
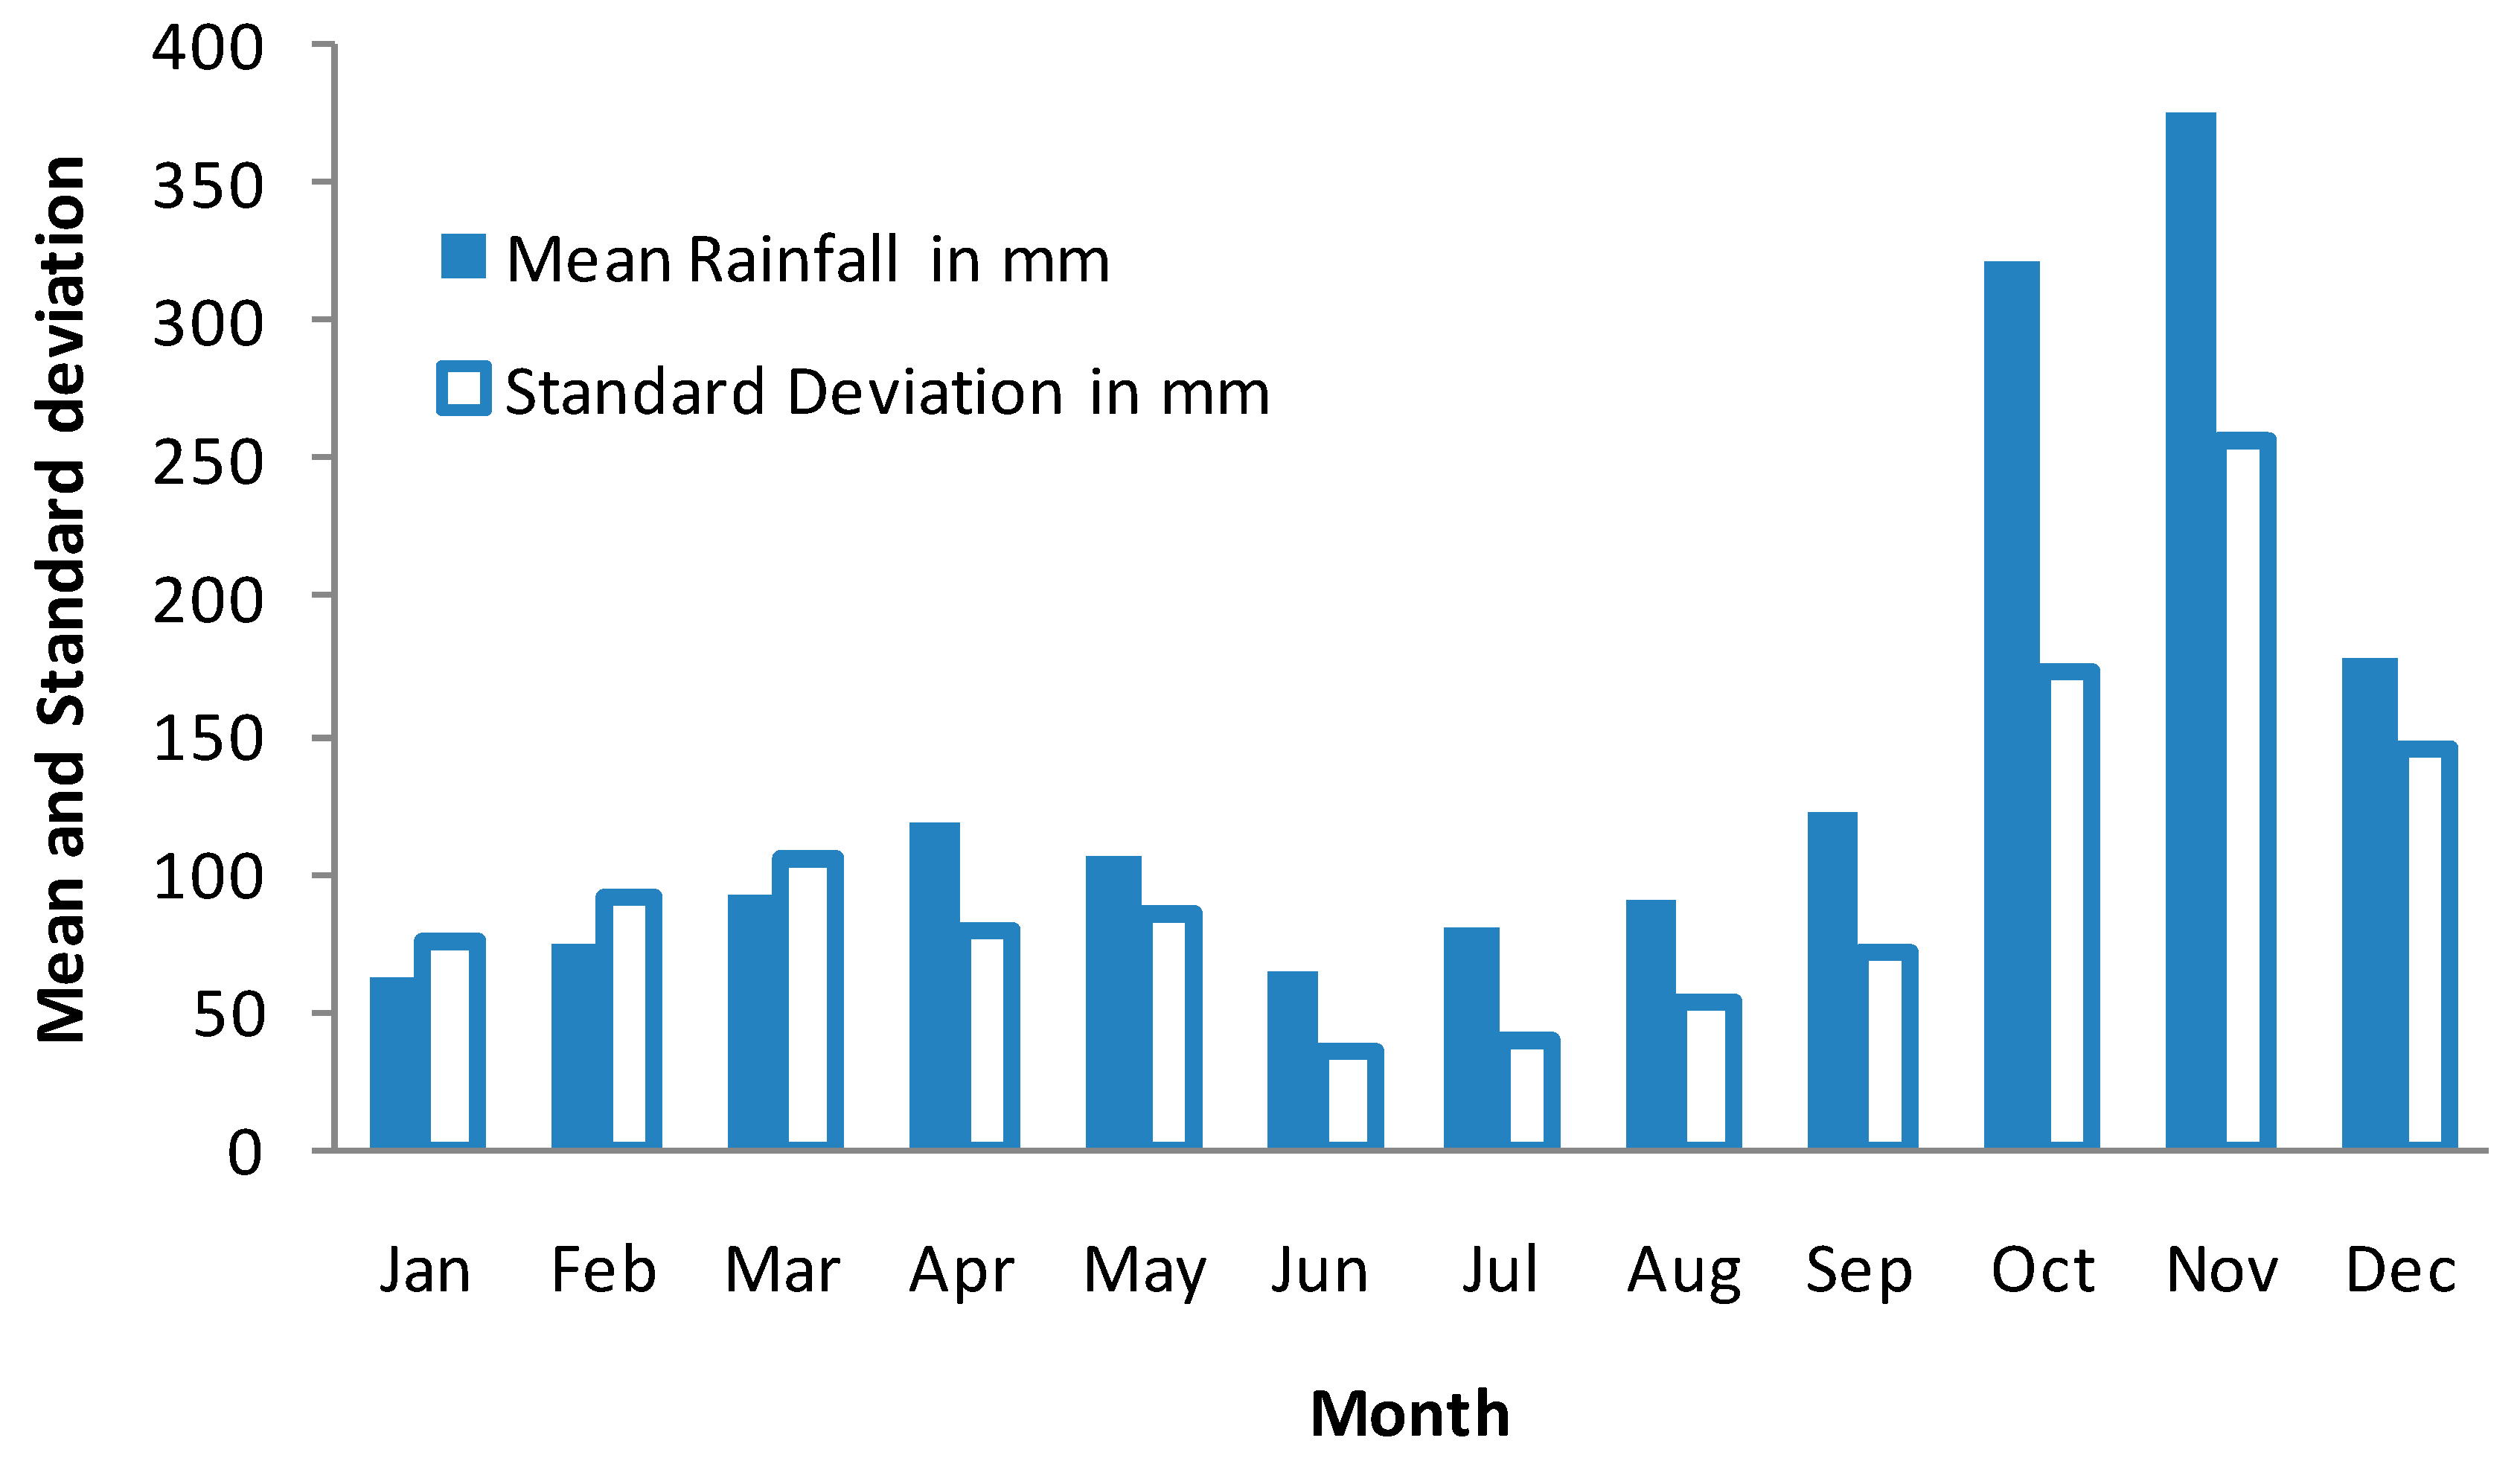
Using the available 81 years of rainfall data of Coonoor station, its monthly mean, annual mean, standard deviation, frequency of occurrence of various range of monthly rainfall, standardized precipitation index, China Z- index, and statistical Z-score were computed. Figure 2 shows the mean monthly rainfall and its standard deviation. It can be noticed that standard deviations of January, February, and March are higher than its mean value. It indicates the high variability and erratic nature of rainfall. Mean rainfall of October and November months are exceeding 300 mm and these two months witnessed most of the moderate to severe landslides in the region. In general, in the present study area, mean monthly rainfall of six months falls below 100 mm and the remaining six months exceeds 100 mm rainfall. From Figure 2, it is evident that this part of the region of the Nilgris district receives more rainfall during the northeast monsoon season than the southwest monsoon season.
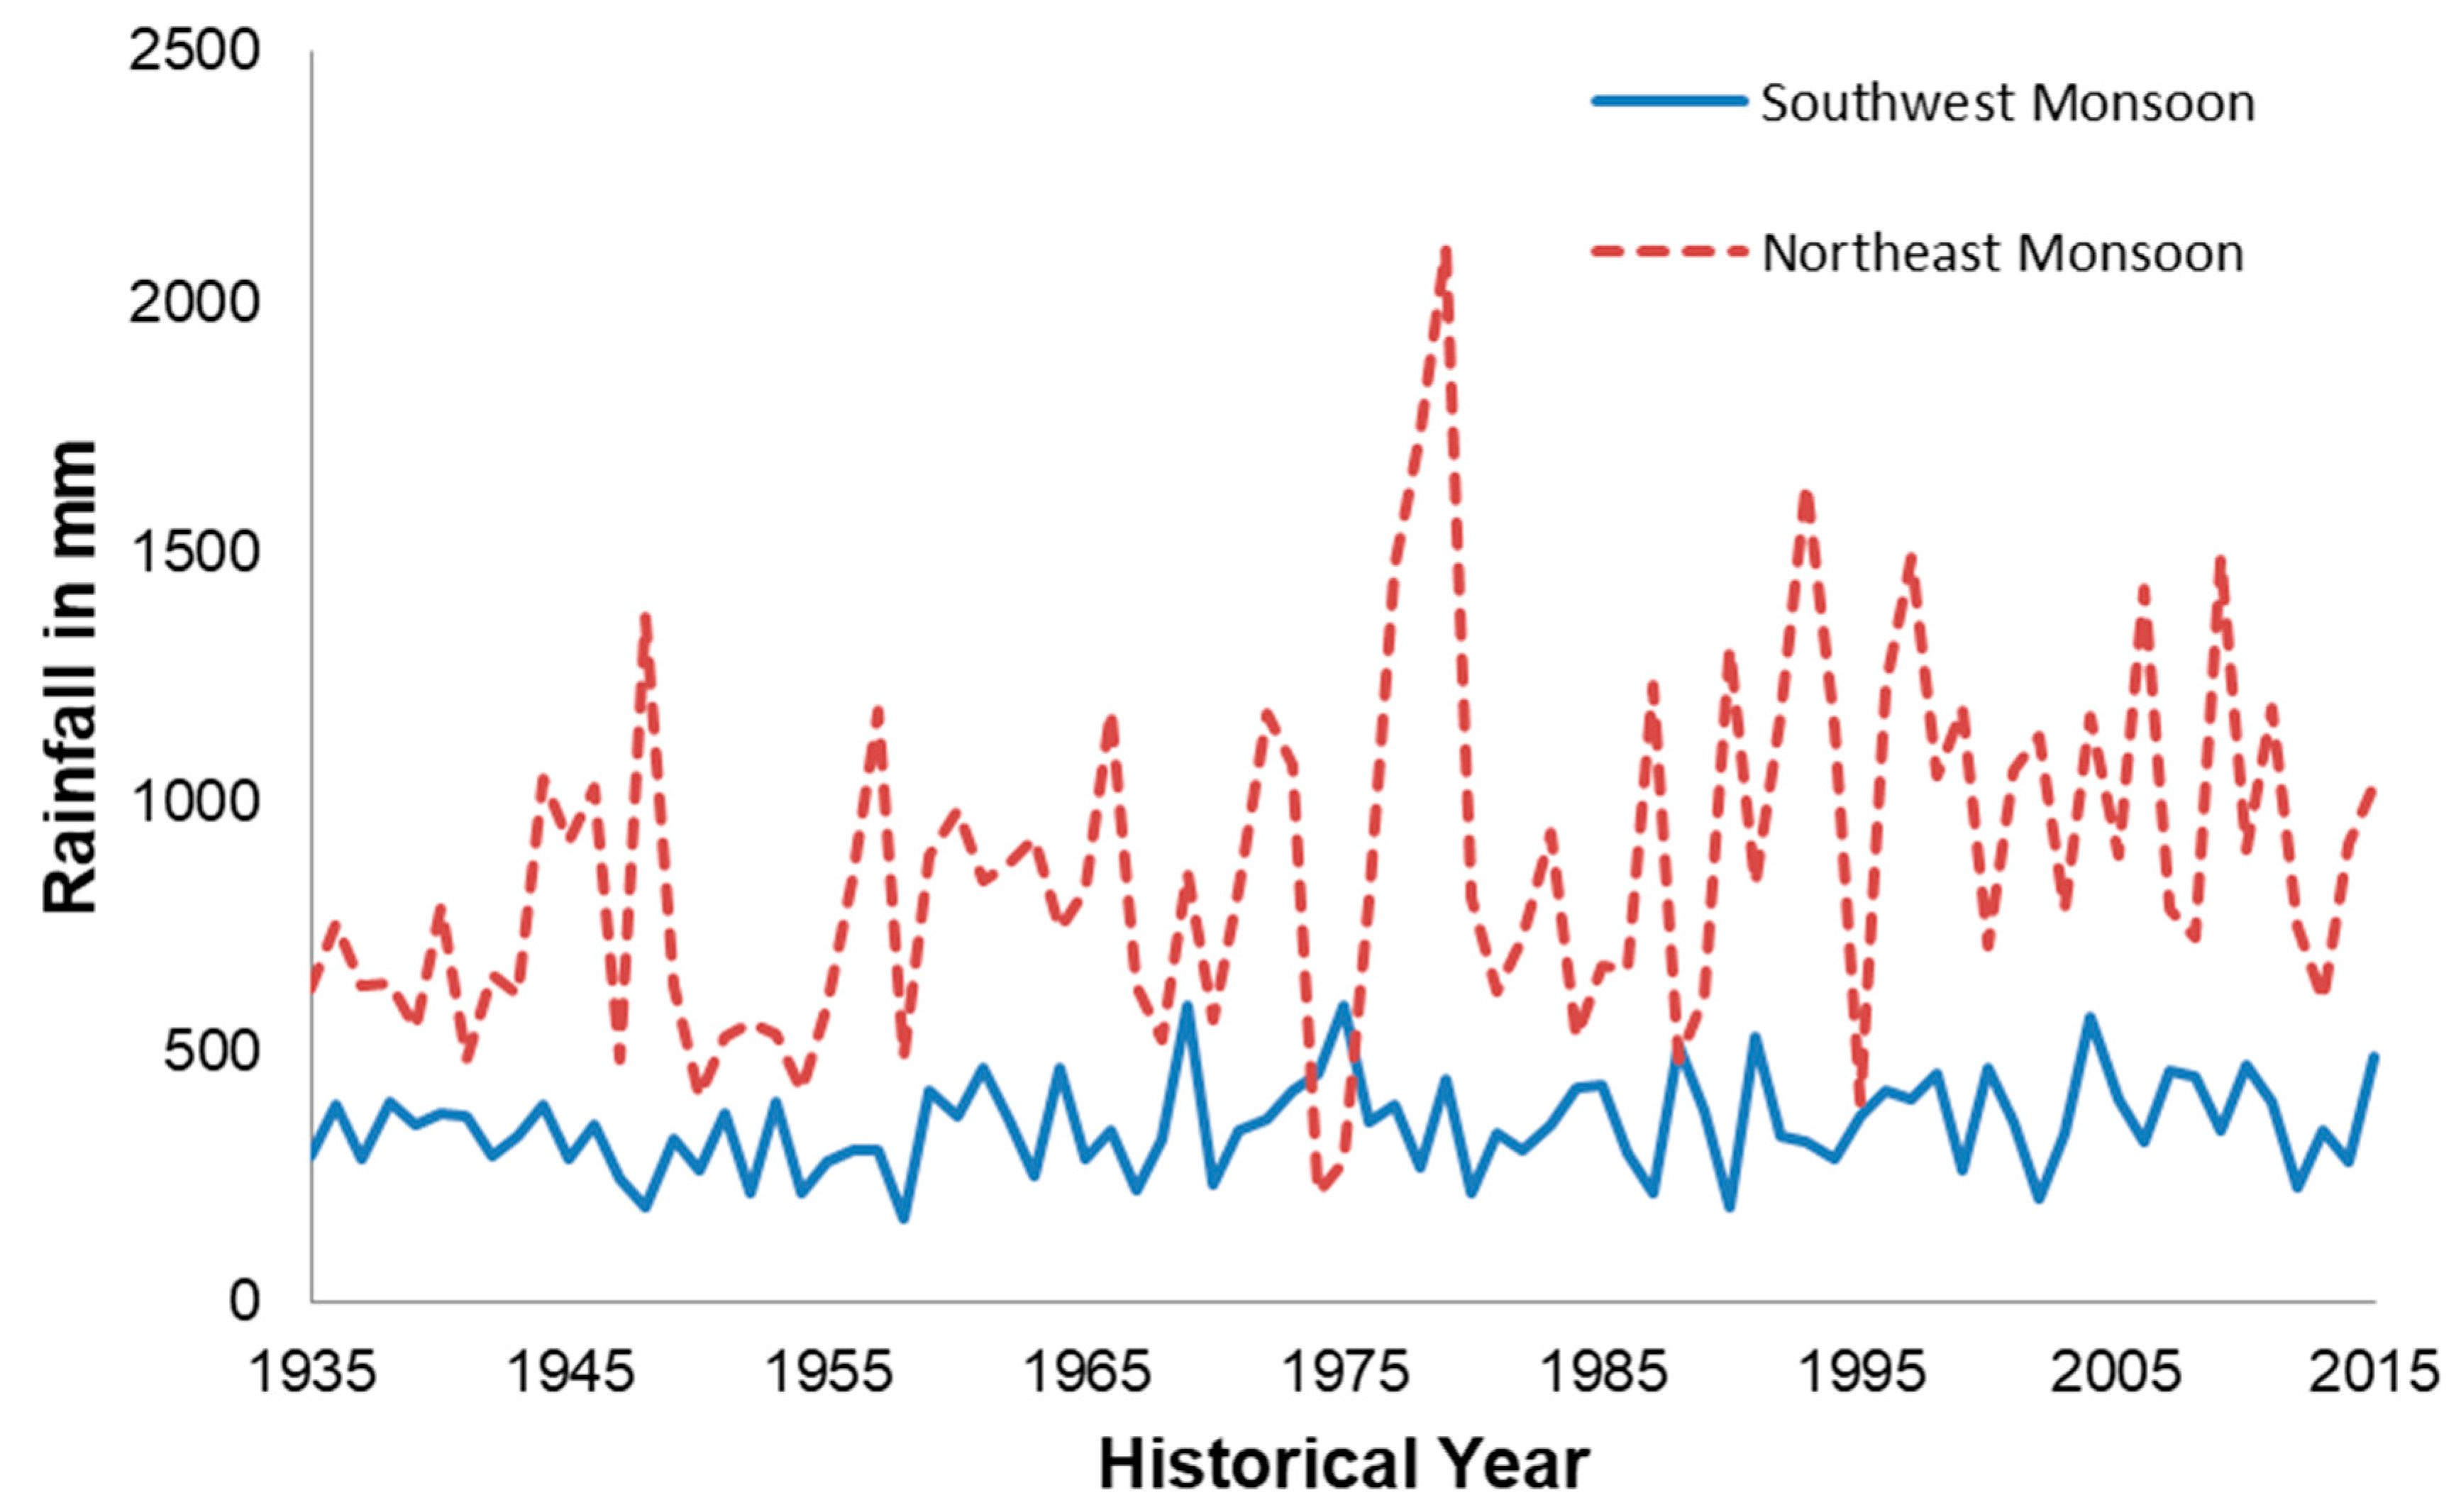
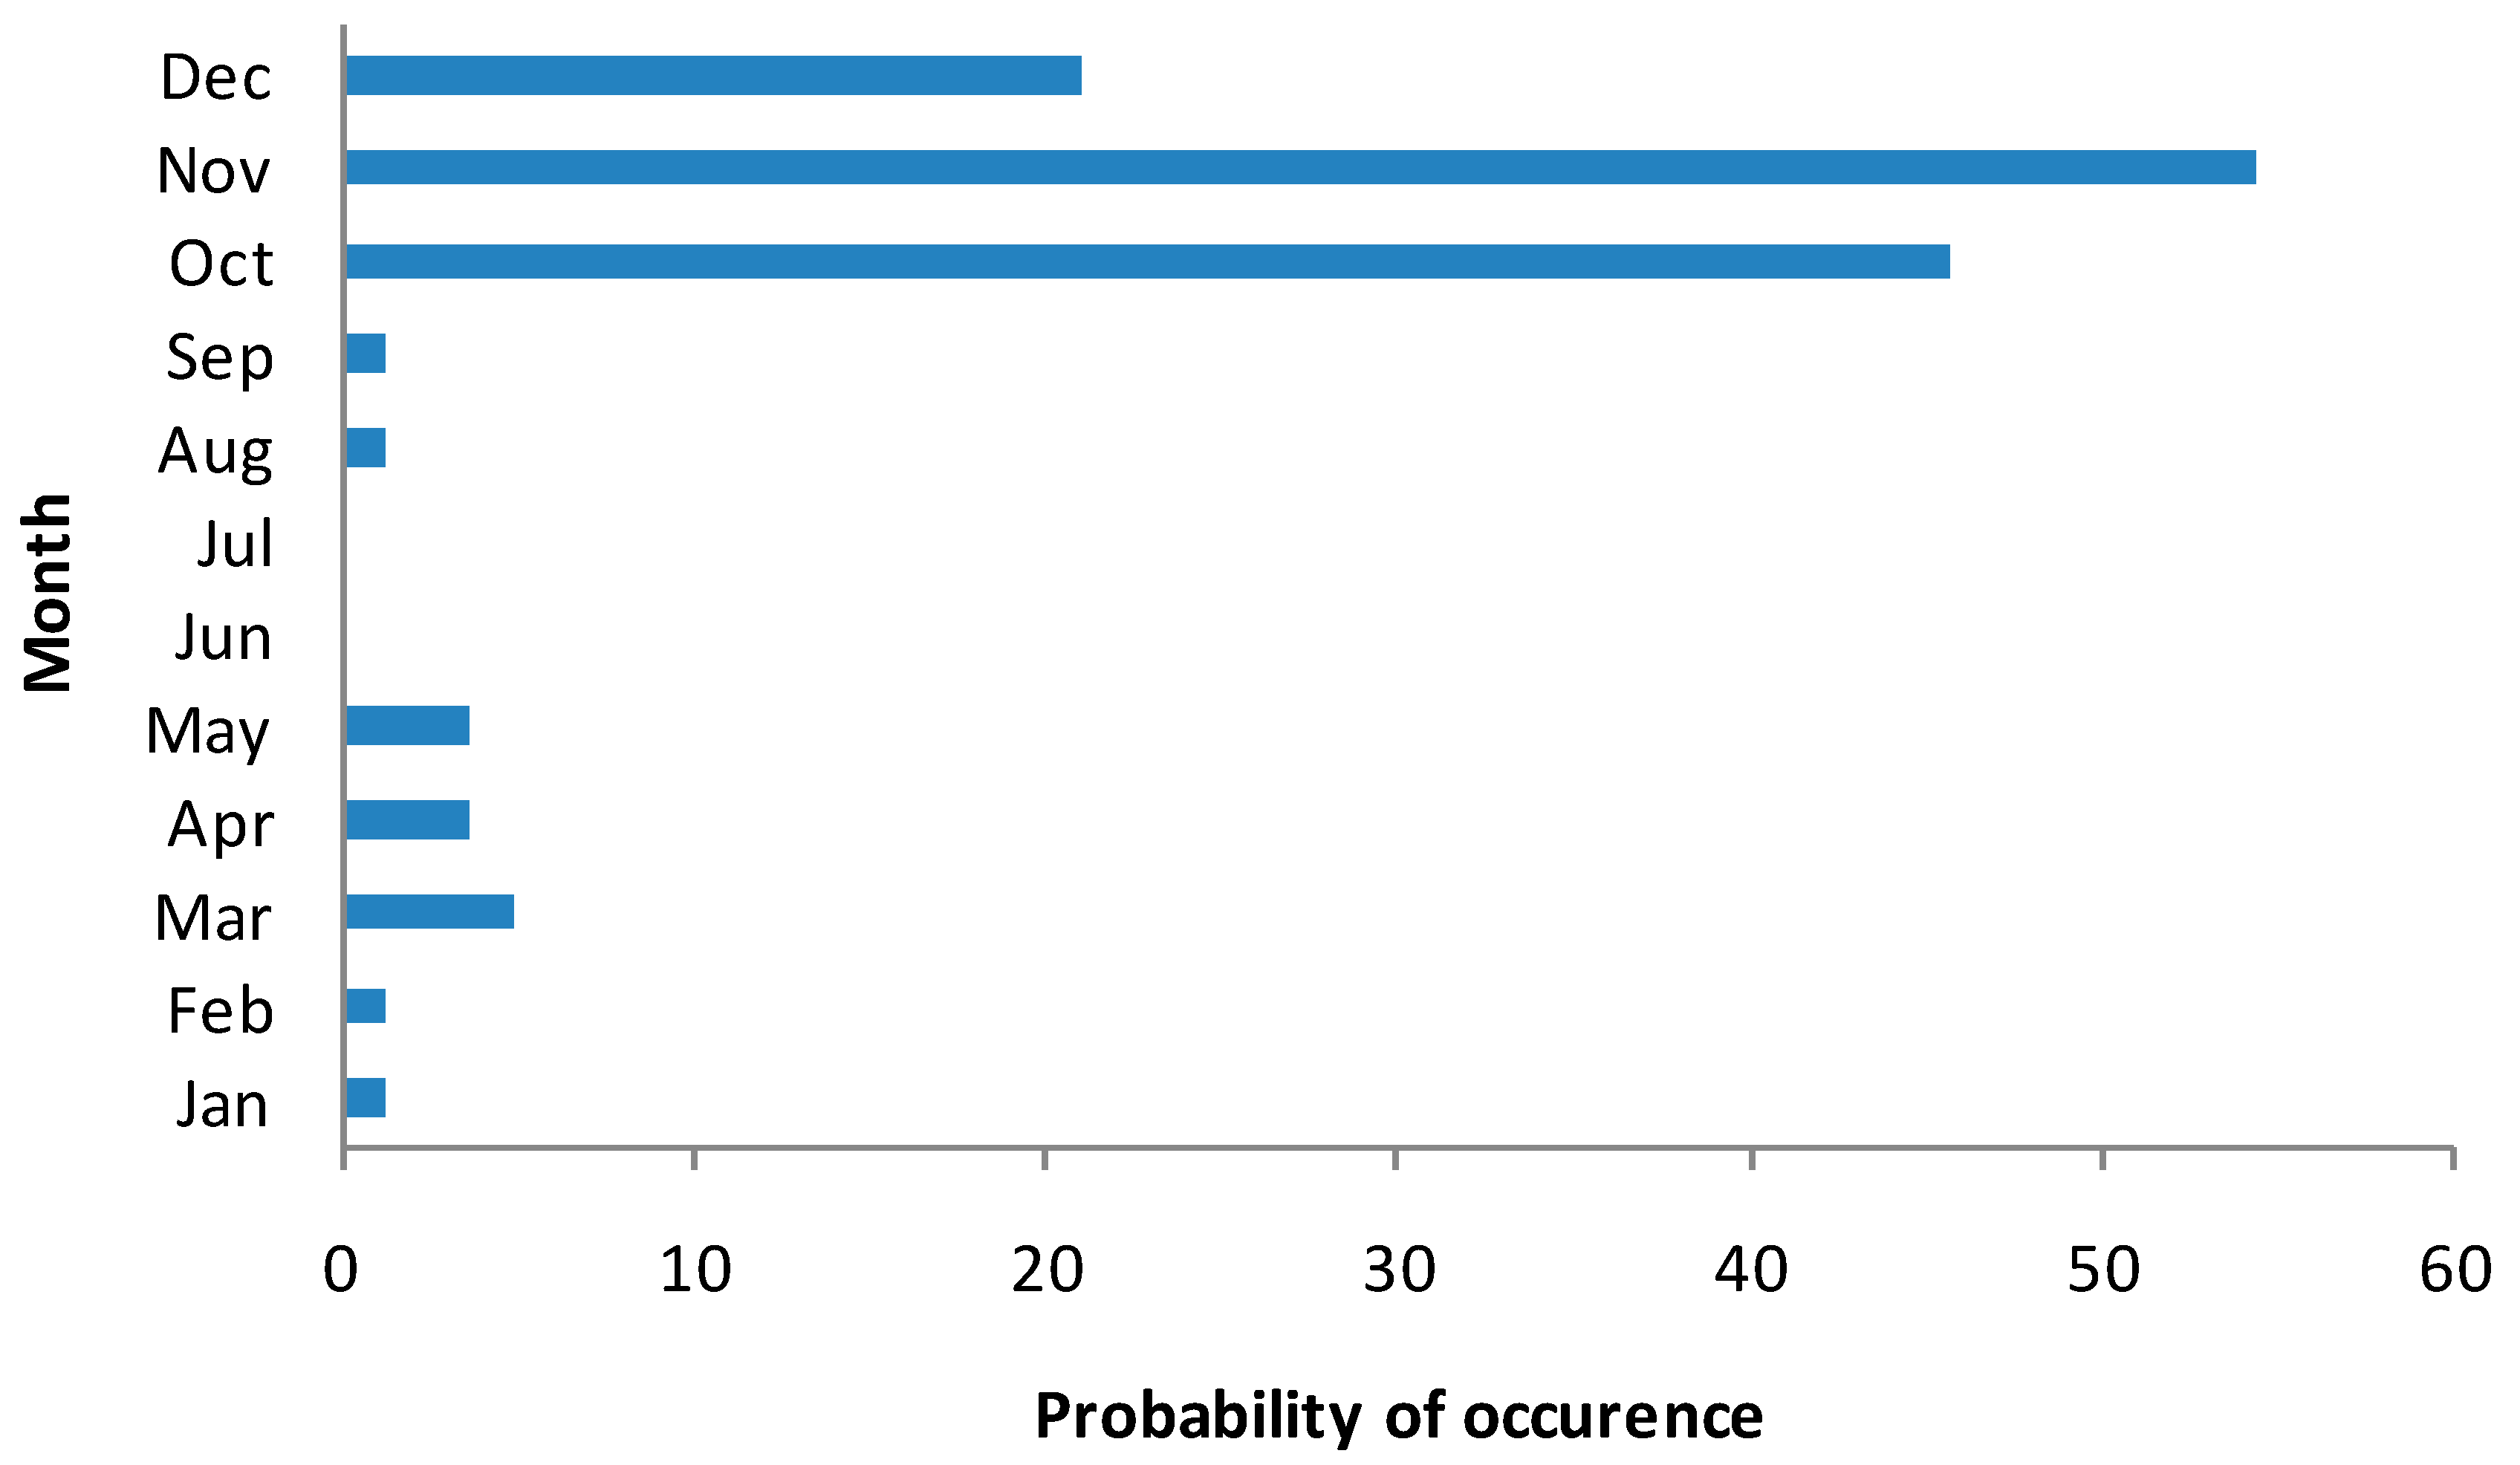
Table 2 presents the probability of occurrence of different ranges of rainfall in a month. Higher probability for the less than 20 mm rainfall category is reported during January, February, and March months. The above 300 mm of rainfall category is more common only in the months of October and November. The cumulative quantity of the rainfall of these two months over continuous periods will be useful in evaluating threshold rainfall that triggers landslides. April to September months receives moderate monthly rainfall of 50 to 150 mm that covers a six month period and is followed by two heavy rainfall months. Consistent moisture availability for about six months prior to the any landslide occurrence exists in the region according to the monthly rainfall data. As the terrain also has a moderate slope gradient, quicker surface flow can take place, which gives little opportunity to infiltrate the soil in-depth. Hence, consecutive rainfall events can trigger landslides. Figure 3 shows annual rainfall variation over the historical year. The 81-year mean rainfall is worked out as 1674.8 mm, with annual standard deviation of 398.4 mm. It can be observed from Figure 3 that, in the recent past, the annual rainfall exceeds the long-term mean for several years. Figure 4 presents the variation of the southwest and northeast monsoons rainfall over the historical years. It is to be noted that whenever the southwest monsoon rainfall is recorded as less, the northeast monsoon rainfall is found to be more in most of the years except a few. It can be recorded from this observation of rainfall seasonal variation that failure in one monsoon brings abundance in the other monsoon in most of the years. The mean and standard deviation of the southwest and northeast monsoons are 353 and 94.71 mm and 872.09 and 348.11 mm, respectively. The co-efficient of variation (CV) of both the southwest and northeast monsoons are 0.26 and 0.40 respectively. Since CV is less than one, it is generally considered as low-variance. The variation of the northeast monsoon is significantly higher than the southwest monsoon. The CV for the first three months of the year exceeds one and it signifies that inter-monthly variability of rainfall is higher for these three months. Next to these three months, the May and December months possess higher value of CV (around 0.8) and these two months are the hottest and coldest months of the region.
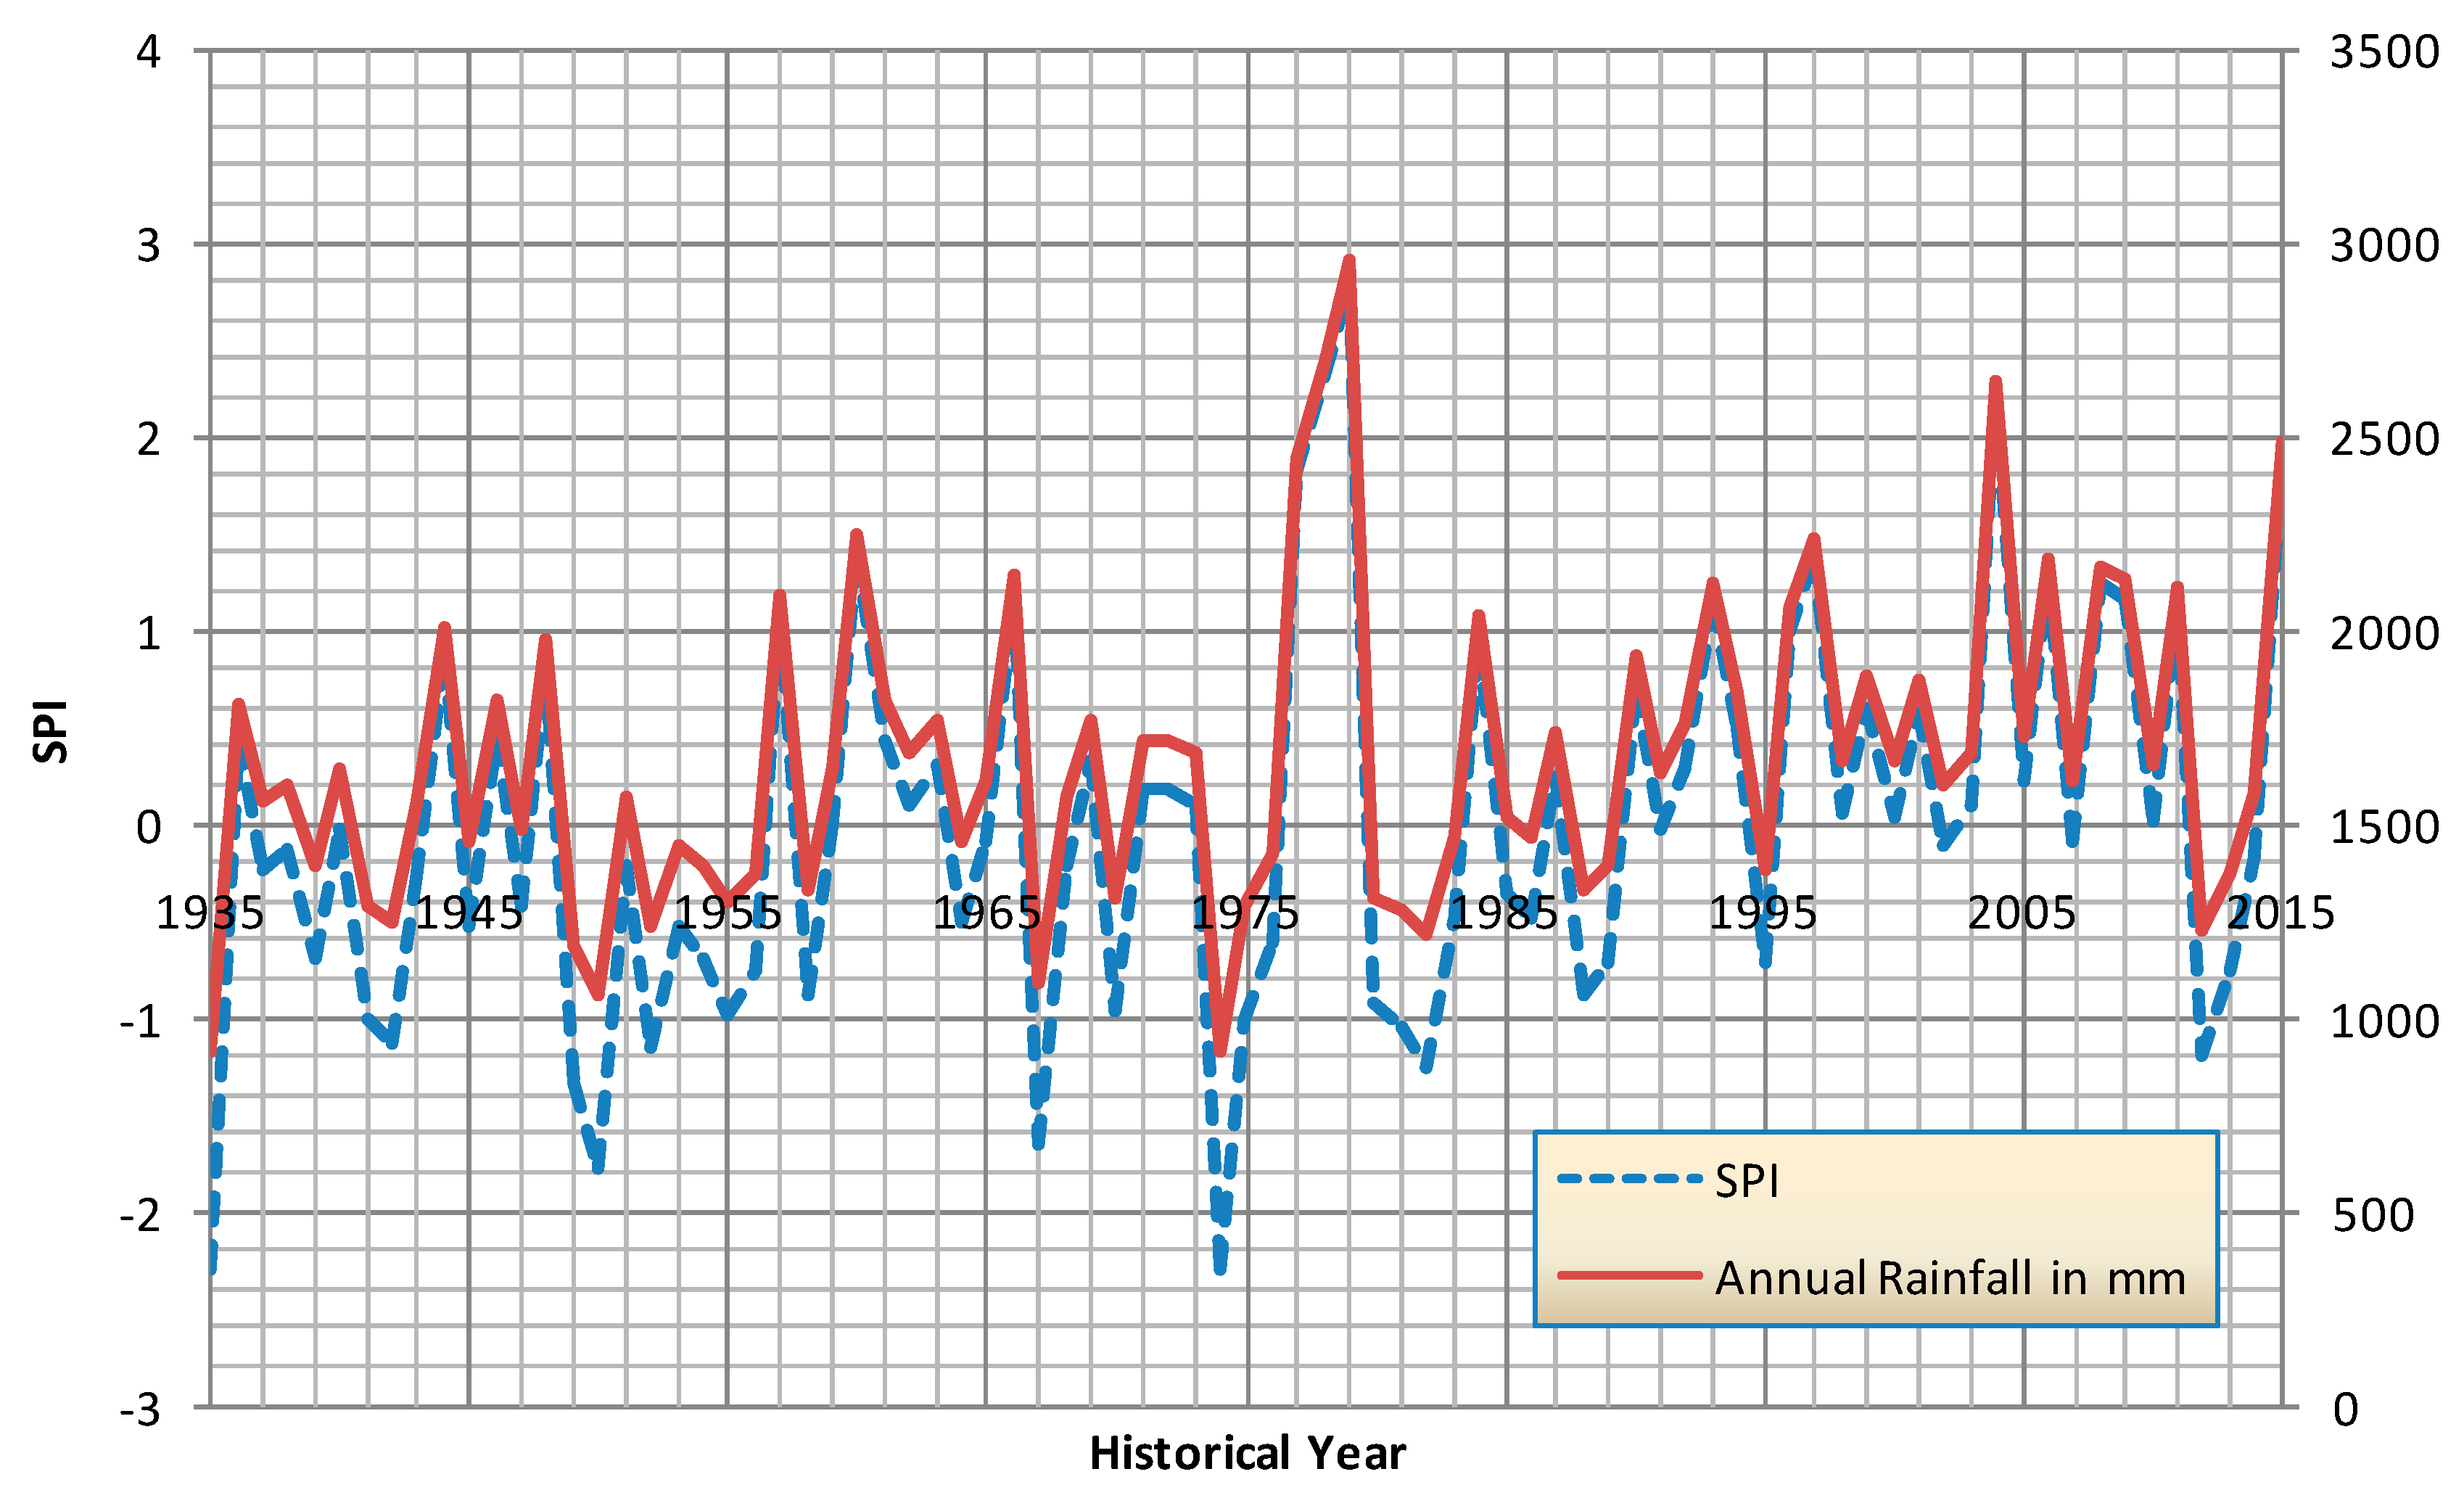
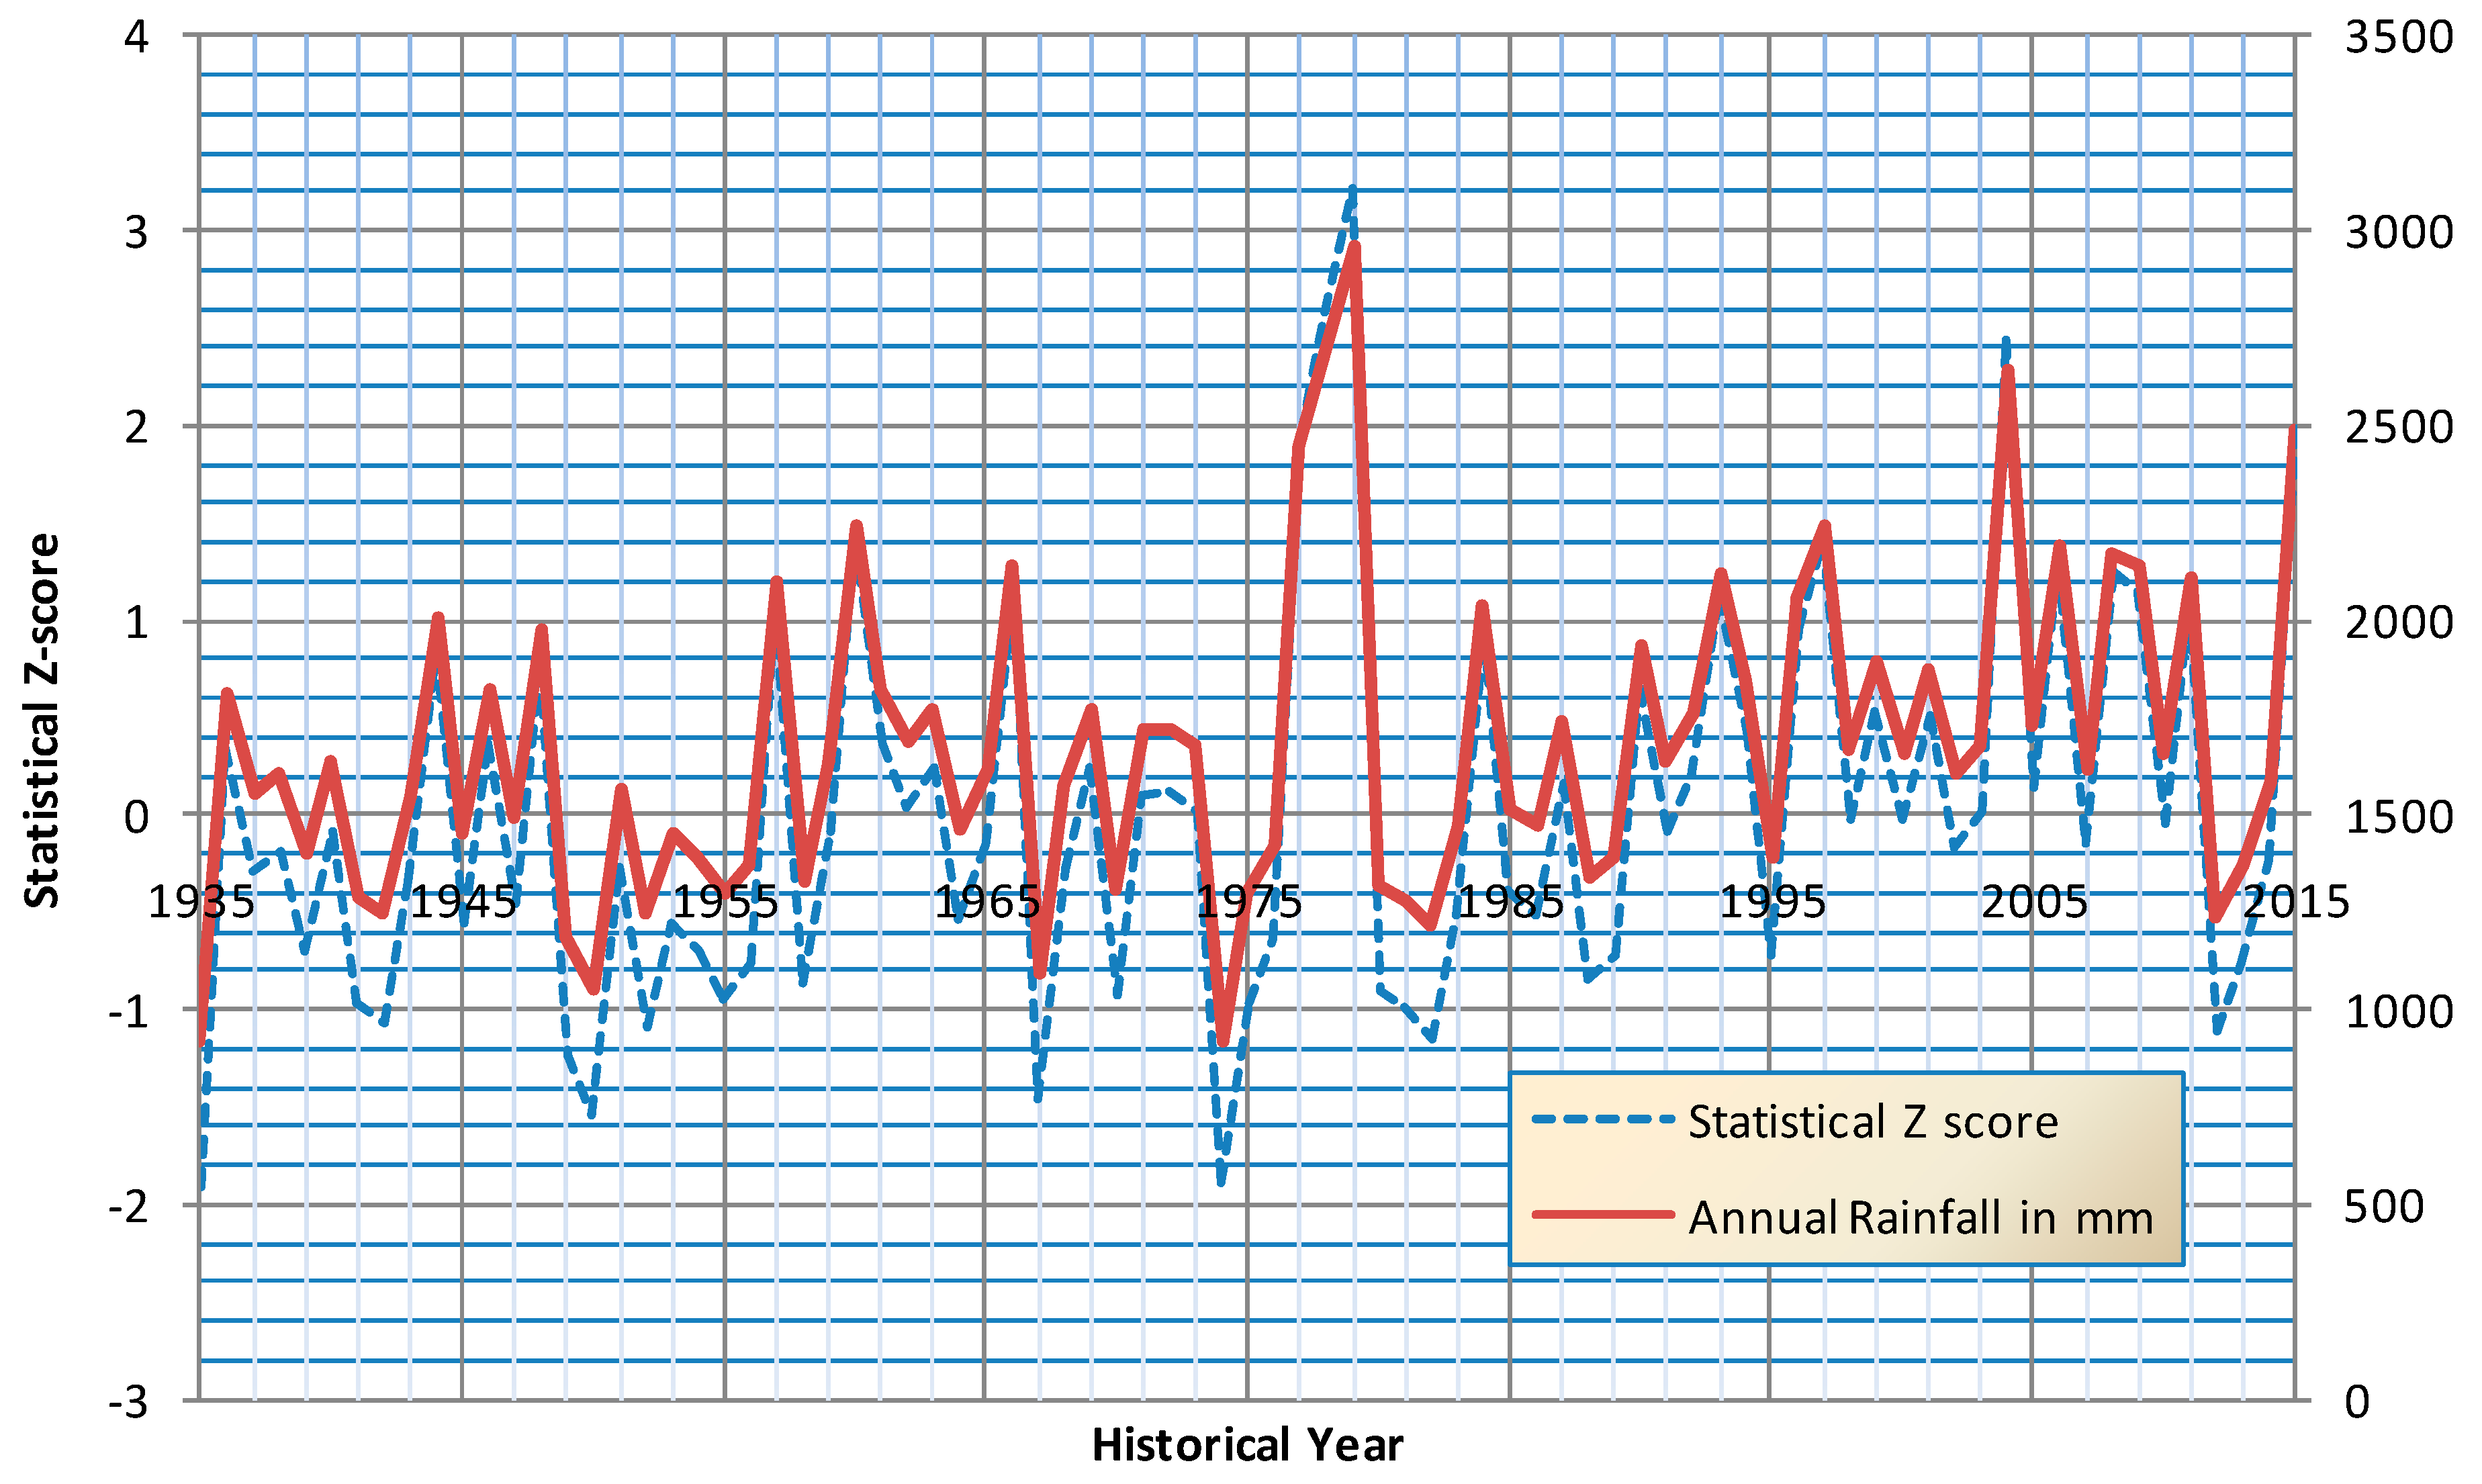
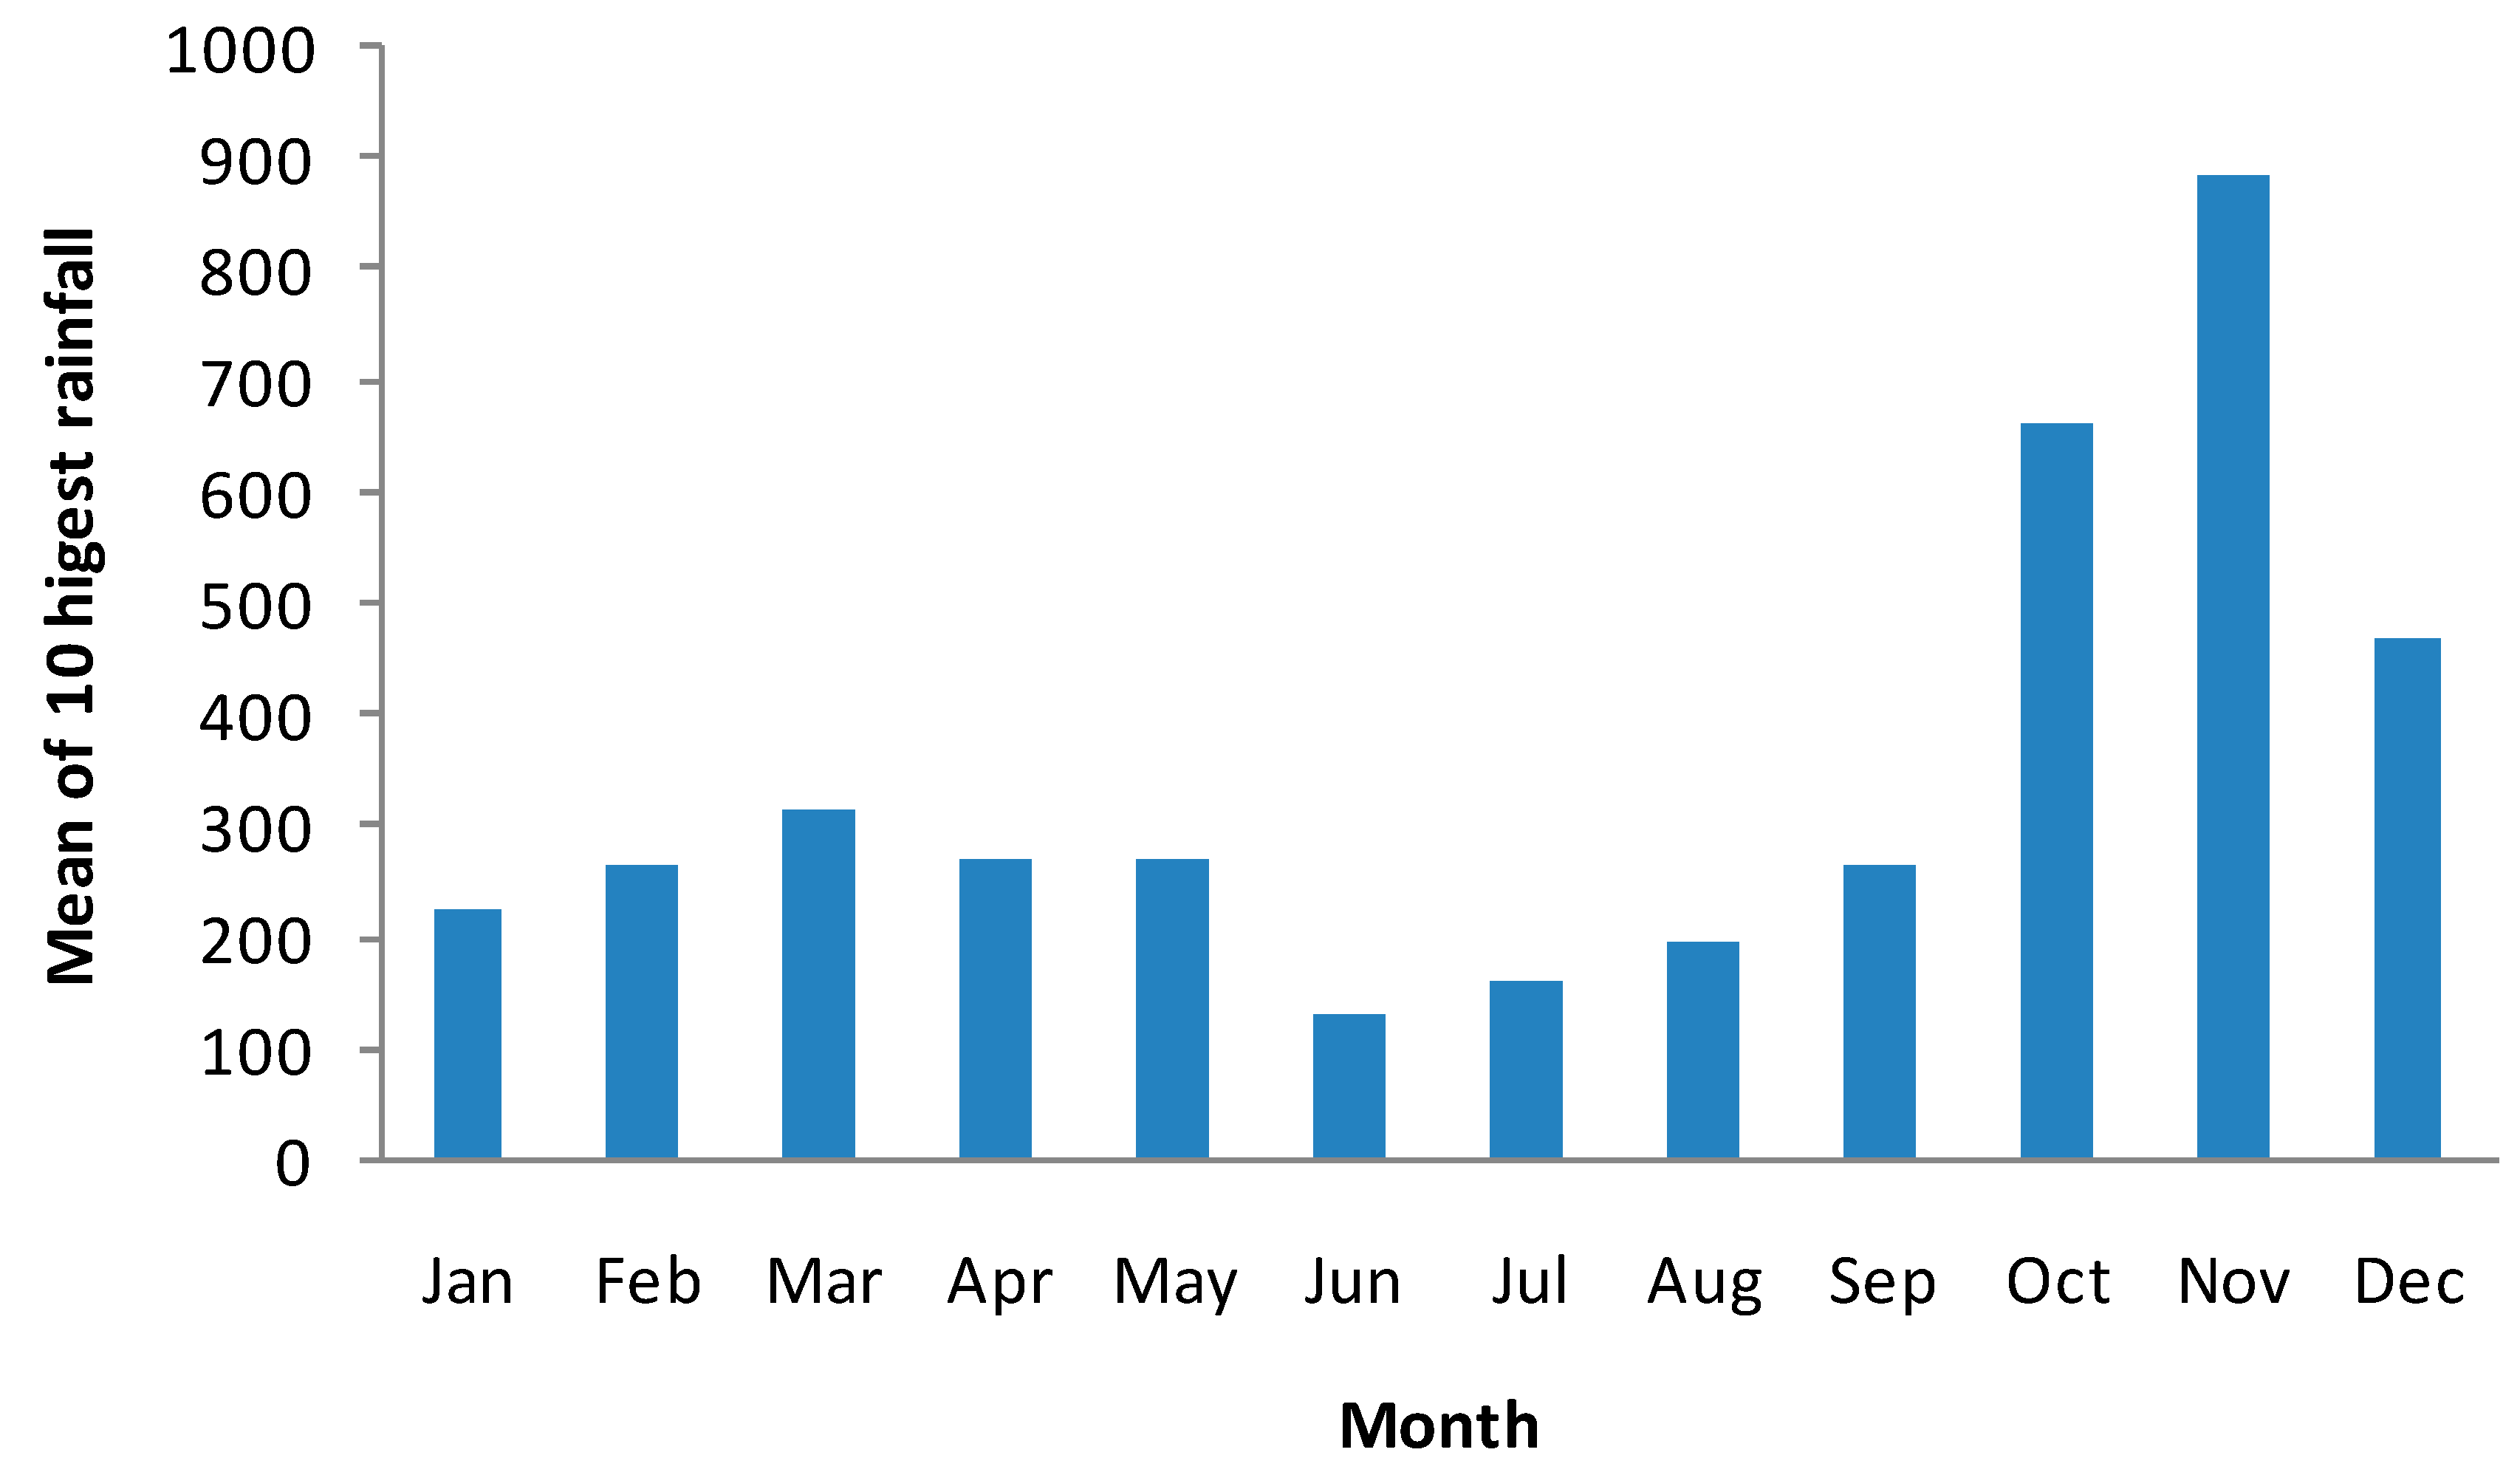
Monthly, seasonal, and annual SPI, China Z-index, and statistical Z-score were calculated using 81 years of monthly data. Figure 5, Figure 6 and Figure 7 present the variation of moisture indices over historical years and the corresponding variation of annual rainfall. It is to be noted that all these three indices exactly follow the annual rainfall variation. On observation of annual variation of indices, it depicts that the frequency of various dry levels are seldom. A greater number of years falls in the normal moisture category and only a few years are identified above moderately wet. Table 3 presents the probability of occurrence of different moisture levels at the monthly scale obtained using three indices. CZI and SZS predict higher probability of occurrence of normal moisture levels than as per SPI for all the months of a year. Due to this variation, these two indices show that a fewer number of months fall in the dry category. Whereas SPI predicts higher percentage of moderate wet periods comparing with CZI and SZS. Normalization of precipitation data according to SPI is more effectively seen than the other two indices. Table 4 presents the inventory on the major landslides that occurred in the Coonoor region [21,22]. It can be seen from Table 4 that the moisture category during landslide events falls in moderate to extreme wet categories, except one event on November 2006. Around 10% of years go above the normal moisture category and they can be recorded as major landslide event periods. Further, two more plots are prepared to estimate probability of occurrence of monthly rainfall exceeding 300 mm (Figure 8 and Figure 9) and mean of the ten highest monthly rainfalls. Probability of occurrence of 300 mm and above monthly rainfall for months October, November, and December are estimated as 45%, 54%, and 21%, respectively, whereas in the remaining months its probability of occurrence is insignificant. All major landslides are witnessed whenever monthly rainfall exceeds 500 mm and above according to Table 4. When observing the means of the highest 10 monthly rainfalls over the 81-year period, it is to be noted that the rainfall of the October, November, and December months exceeded 400 mm. These events normally have continuous rainfall of more than five days, as it is part of monsoon rainfall. In order to examine the consecutive day rainfall, the daily rainfall data for year 2009 is investigated. Table 5 presents the details of consecutive rainfall day events in each month for year 2009.
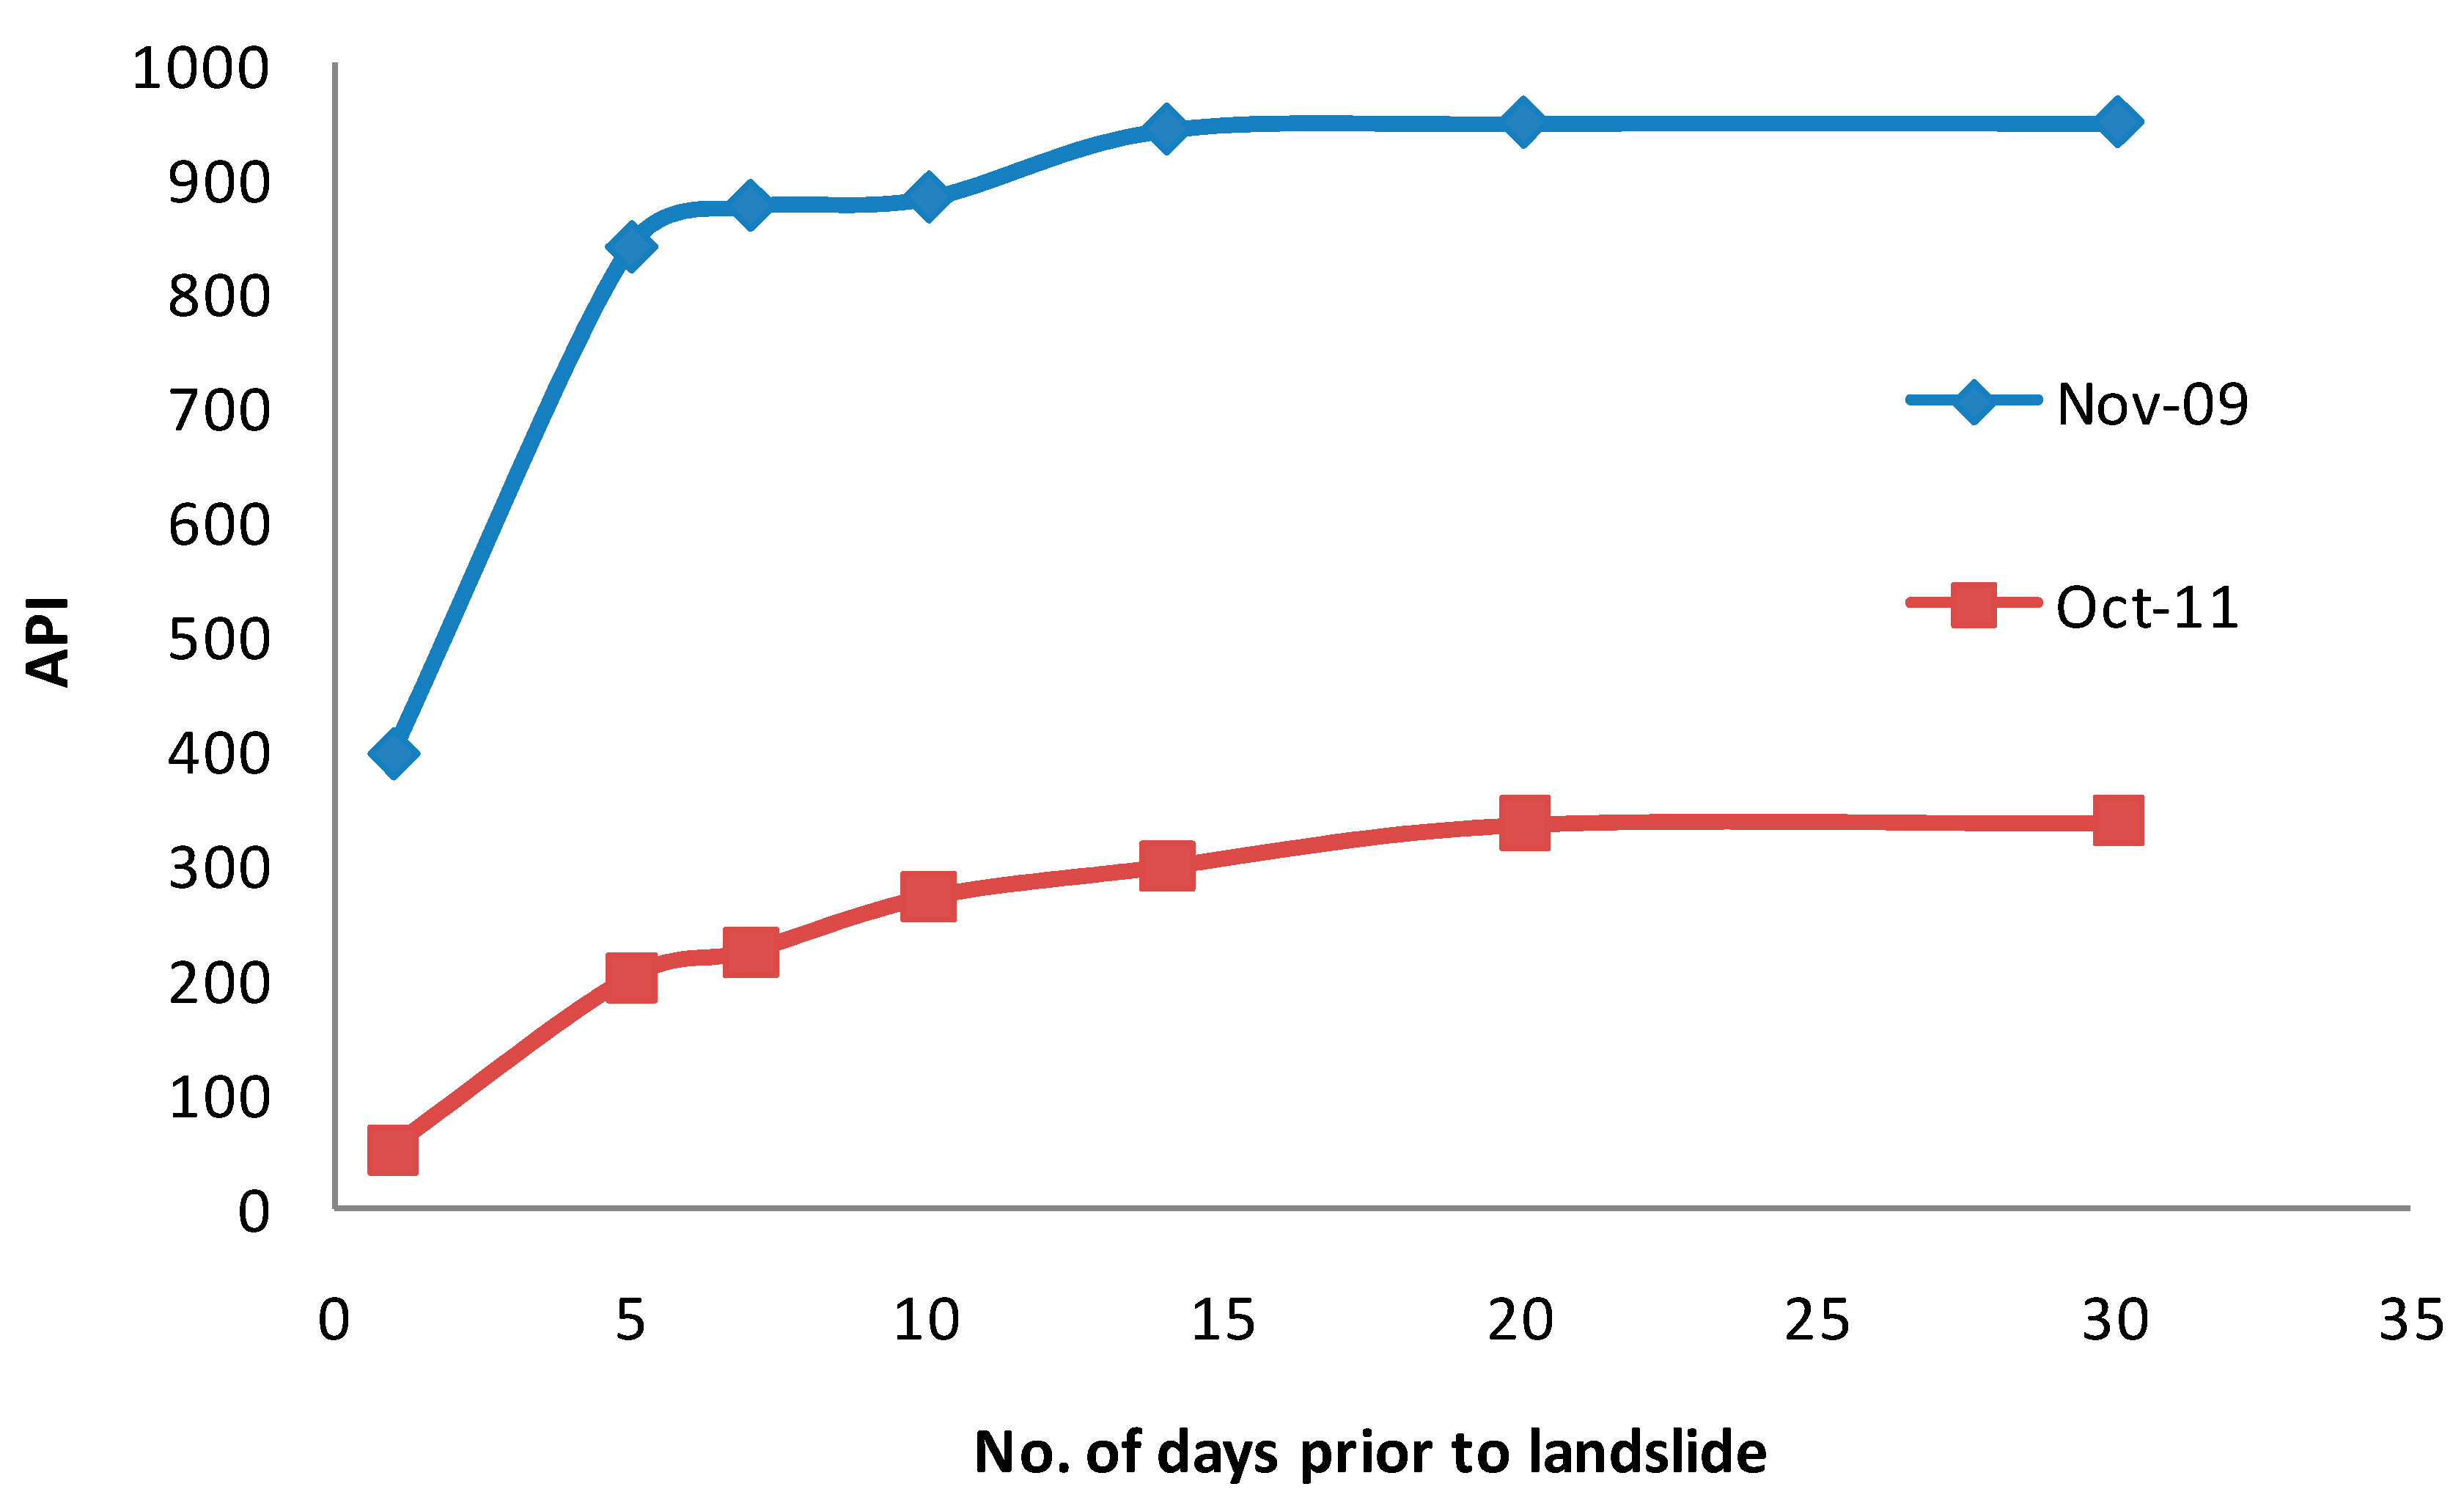
There were six incidents of more than five days of consecutive rainfall events. Among six events, rainfall in November had a high rainfall; 395 mm within nine days continuous rainfall. 9, 10, and 11 November had 141.2, 363.0, and 395 mm rainfall, respectively, and triggered a massive landslide on 11 November 2009. It is clear that such heavy rainfall created full saturation of soil mass before initialization of the landslide. Kothari [23] established an equation (T = R1 + 0.491R30 − 51.293) to find a 30-day minimum rainfall threshold value (T) by correlating the 30-day rainfall amount (R30) and the rainfall amount on the landslide day (R1) of the Alaknanada river catchment located in Uttaranchal State, India. In order to get the monthly threshold rainfall value for the study area, the same equation is employed to match with the present study area. The 30-day cumulative rainfall (R30) for 11 November 2009 of 1221.7 mm and R1 rainfall of 395 mm gives the minimum threshold rainfall value of 943.56 mm. Accordingly, the mean of the ten maximum monthly rainfall data of November is found to be close to the threshold value obtained using Kothari’s monthly rainfall threshold equation. Though the study areas are different, the rainfall-triggered landslides due to such heavy rainfall can be used in comparison. The antecedent precipitation index is a measure for how rainfall occurrence in the prior days influences the runoff that gets generated from the watershed. Debris flow in the hilly terrain that continues over time can be a potential factor for major and minor landslides in the study area. From the available daily rainfall data of November 2009 and October 2014, API is calculated for two incidents of landslides. It can be seen from Figure 10 that both the landslides occurred due to five days of antecedent precipitation, as there is very heavy rainfall prior to the landslide. Though there are long periods of wet spells, the rainfall that occurred five days prior to the landslides could be a driving factor for both the events. The frequent cycles of saturation of the soil pores, the movement of subsurface flow underlying bedrock, and soil depth make the flow path on hill slope ends emerge wherever abrupt changes in slope are witnessed. This could establish a saturated slope circle and reduces the shear stress along the path due to consecutive rainfalls. The soil moves suddenly once it loses its shear strength to retain equilibrium under highly saturated conditions. This kind of incident is commonly found along cut slopes.
9. Conclusions
In the Coonoor town of the Nilgiri district of Tamilnadu, India, precipitation and related phenomena, like soil moisture and pore pressure, are the main triggering factors for the occurrence of landslides. Past incidents of large-scale landslide events depict that high-intensity rainfall within consecutive days of rainfall events, and month with above normal moisture levels, could be the main cause for massive landslides in the region. Coincidence of historical landslides with monthly moisture level, monthly cumulative rainfall, and also daily rainfall indicate that whenever the moisture levels of months exceeds normal levels, moderate to tragic landslide events occurred. Further, it is confirmed from the study that the northeast monsoon rainfall in this region triggers landslides due to development of antecedent moisture whenever cumulative rainfall exceeds 500 mm. According to 81 years of monthly rainfall data, though there were 40 months in which monthly rainfall exceeded 500 mm, landslides are reported in a few months only. High-intensity rainfall within 24 h could be the main triggering factor for continuous rainfall periods. Early warning can be given whenever a cumulative amount of rainfall of an event during the northeast monsoon season exceeds 300 mm. This magnitude of rainfall can be treated as a threshold rainfall for landslides of large magnitude, which could initiate in the region when other parameters such as soil type, soil porosity, soil moisture, hill slope, and area of drainage catchment are kept constant. A scientific and complete landslide inventory of this region is needed, as it could provide very valuable information on points of landslides, such as type, date of occurrence, intensity, causality, and damage.
Author Contributions
C.R.S. carried out computation of various moisture level indices. E.R.S. was involved in analysis of the obtained results and checking the incidents of landslides reported in the respective periods. Both authors made equal contributions in writing the manuscript.
Funding
This study was supported by DST-NRDMS (155/18-2015).
Acknowledgments
This study was supported by DST-NRDMS (155/18-2015). The authors would like to acknowledge with thanks the financial support rendered by NRDMS, DST for the research.
Conflicts of Interest
The authors declare no conflict of interest.
References
- Iverson, R.M. Landslide triggering by rain infiltration. Water Resour. Res. 2000, 36, 1897–1910. [Google Scholar] [CrossRef] [Green Version]
- Brocca, L.; Ponziami, F.; Moramarco, T.; Melone, F.; Berni, N.; Wagner, W. Improving landslide forecasting using ASCAT-Derived soil moisture data: A case study of the Torgiovannetto landslide in Central Italy. Remote Sens. 2012, 4, 1232–1244. [Google Scholar] [CrossRef]
- Rosi, A.; Tofani, V.; Tanteri, L.; Taccom Stefanelli, C.; Agostini, A.; Catani, F.; Casagli, N. The new landslide inventory of Tuscany (Italy) updated with PS-INSAR: Geomorphological features and landslide distribution. Landslides 2018, 15, 5–19. [Google Scholar] [CrossRef]
- Rosser, B.; Dellow, S.; Haubrock, S.; Glassy, P. New Zealand’s National Landslide database. Landslides 2017, 14, 1949–1959. [Google Scholar] [CrossRef]
- Wasten, C.J.V.; Jaiswal, P.; Ghosh, S.; Martha, T.R.; Kuriakose, S.L. Landslide inventory, Hazard and risk assessment in India. In Terrigenous Mass Movement; Springer: Berlin/Heidelberg, Germany, 2012; Chapter 9; pp. 239–282. [Google Scholar]
- Corominas, J. Landslides and Climate. In Keynote Lectures, Proceedings of the 8th International Symposium on Landslides, Cardiff, UK, 26–30 June 2000; Bromhead, E., Dixon, N., Ibsen, M.L., Eds.; Thomas Telford: London, UK, 2001. [Google Scholar]
- Kawagoe, S.; Kazama, S.; Sarukkalige, P.R. Probabilistic modelling of rainfall induced landslide hazard assessment. Hydrol. Earth Syst. Sci. 2010, 14, 1047–1061. [Google Scholar] [CrossRef] [Green Version]
- Robin, C.; Phil, F. Uncertainties in rainfall induced landslide hazard. Q. J. Eng. Geol. Hydrogeol. 2002, 35, 61–70. [Google Scholar]
- Pankaj, J. Landslide Risk Quantification along Transportation Corridors Based on Historical Information. Ph.D. Thesis, Faculty of Geo-Information Science and Earth observation, University of Twente, Enschede, The Netherlands, 2011. [Google Scholar]
- Chandrasekaran, S.S.; Senthilkumar, V.; Maji, V.B. Landslides in Nilgiris: Casual factors and Remedial measures. In Proceedings of the Indian Geotechnical Conference, IGC 2016, Chennai, India, 15–17 December 2016; pp. 1–7. [Google Scholar]
- Mckee, T.B.; Doesken, N.J.; Kleist, J. The relationship of drought frequency and duration to time scales. In Proceedings of the 8th Conference on Applied Climatology, Anaheim, CA, USA, 17–22 January 1993; pp. 179–184. [Google Scholar]
- Li, X.; Zhang, Q.; Ye, X. Dry/wet conditions monitoring based on TRMM rainfall data and its reliability validation over Poyang lake Basin, China. Water 2013, 5, 1848–1864. [Google Scholar] [CrossRef]
- World Meteorological Organization (WMO); Global Water Partnership (GWP). Handbook of Drought Indicators and Indices; Integrated Drought Management Tools and Guidelines Series 2; Svoboda, M., Fuchs, B.A., Eds.; Integrated Drought Management Programme (IDMP): Geneva, Switzerland, 2016. [Google Scholar]
- Bhuiyan, C.; Singh, R.P.; Kogan, F.N. Monitoring drought dynamics in the Aravalli region (India) using different indices based on ground and remote sensing data. Int. J. Appl. Earth Obs. Geoinf. 2006, 8, 289–302. [Google Scholar] [CrossRef]
- Khan, S.; Gabriel, H.F.; Rana, T. Standardized precipitation index to track drought and assess impact of rainfall on water tables in irrigation areas. Irrig. Drain. Syst. 2008, 22, 159–177. [Google Scholar] [CrossRef]
- Jain, V.K.; Pandey, R.P.; Jain, M.K.; Byun, H. Comparison of drought indicies for appraisal of drought characteristics in the Ken River Basin. Weather Clim. Extrem. 2015, 8, 1–11. [Google Scholar] [CrossRef]
- Kohler, M.A.; Linsley, R.K., Jr. Predicting Runoff from Storm Rainfall; Research Paper 34; U.S. Weather Bureau: Washington, DC, USA, 1951.
- Heggen, R.J. Normalized antecedent precipitation index. J. Hydrol. Eng. 2001, 6, 377–381. [Google Scholar] [CrossRef]
- Viessman, W., Jr.; Lewis, G.L. Introduction to Hydrology, 4th ed.; Harper Collins: New York, NY, USA, 1996. [Google Scholar]
- Giannecchini, R.; Galanti, Y.; Avanzi, G.D.A. Critical rainfall thresholds for triggering shallow landslides in Serchio River Valley (Tuscany, Italy). Nat. Hazards Earth Syst. Sci. 2012, 12, 829–842. [Google Scholar] [CrossRef]
- Ganapathy, G.P.; Mahendran, K.; Sekar, S.K. Need and urgency of landslide risk planning for Nilgiri district, Tamil Nadu State, India. Int. J. Geomat. Geosci. 2010, 1, 29–40. [Google Scholar]
- Ramani, S.E.; Suribabu, C.R. Rainfall Analyses of Coonoor Hill Station of Nilgiris District for Landslide Studies. IOP Conf. Ser. Earth Environ. Sci. 2017, 80, 012066. [Google Scholar] [Green Version]
- Kuthari, S. Establishing Precipitation Thresholds for Landslide Initiation along with Slope Characterisation Using GIS-Based Modelling. Master’s Thesis, International Institute for Geo-Information Science and Earth Observation, Enschede, The Netherlands, Indian Institute of Remote Sensing, Dehradun, India, 2007. [Google Scholar]
Figure 1.
Location of the study area.

Figure 2.
Monthly mean rainfall and its standard deviation in mm.

Figure 3.
Time series of annual rainfall over historical year (1935–2015).

Figure 4.
Time series of southwest and northeast monsoons rainfall over historical years.

Figure 5.
Variation of annual SPI values for historical years.

Figure 6.
Variation of annual China Z-index for historical years.

Figure 7.
Variation of annual statistical Z-score for historical years.

Figure 8.
Probability of occurrence of monthly rainfall exceeding 300 mm.

Figure 9.
Mean of the ten highest monthly rainfalls.

Figure 10.
Antecedent precipitation index for two storm events.


Table 1.
Ranges of SPI, China Z-index, and statistical Z-score for drought categorization.
| Index | Moisture Category |
|---|---|
| >2.0 | Extremely wet (EW) |
| 1.50 to 1.99 | Very wet (VW) |
| 1.00 to 1.49 | Moderately wet (MW) |
| −0.99 to 0.99 | Normal (N) |
| −1.49 to −1.0 | Moderately dry (MD) |
| −1.99 to −1.5 | Severely dry (SD) |
| ≤−2.0 | Extremely dry (ED) |
Table 2.
Frequency of occurrence of various ranges of monthly rainfall (in percent).
| Rainfall Ranges | January | February | March | April | May | June | July | August | September | October | November | December |
|---|---|---|---|---|---|---|---|---|---|---|---|---|
| <20 | 39.5 | 40.7 | 33.3 | 7.4 | 2.5 | 8.6 | 2.5 | 3.7 | 0.0 | 0.0 | 1.2 | 7.4 |
| 20–50 | 19.8 | 21.0 | 12.3 | 16.0 | 16.0 | 34.6 | 24.7 | 16.0 | 16.0 | 0.0 | 2.5 | 14.8 |
| 51–100 | 14.8 | 11.1 | 21.0 | 22.2 | 40.7 | 34.6 | 48.1 | 45.7 | 29.6 | 3.7 | 6.2 | 13.6 |
| 101–150 | 17.3 | 6.2 | 11.1 | 24.7 | 25.9 | 21.0 | 18.5 | 23.5 | 24.7 | 14.8 | 8.6 | 14.8 |
| 151–200 | 1.2 | 8.6 | 7.4 | 13.6 | 8.6 | 1.2 | 4.9 | 7.4 | 17.3 | 6.2 | 7.4 | 17.3 |
| 201–250 | 3.7 | 4.9 | 7.4 | 9.9 | 0.0 | 0.0 | 1.2 | 2.5 | 6.2 | 13.6 | 12.3 | 3.7 |
| 251–300 | 2.5 | 6.2 | 2.5 | 2.5 | 2.5 | 0.0 | 0.0 | 0.0 | 4.9 | 16.0 | 7.4 | 7.4 |
| >300 | 1.2 | 1.2 | 4.9 | 3.7 | 3.7 | 0.0 | 0.0 | 1.2 | 1.2 | 45.7 | 54.3 | 21.0 |
Table 3.
Probability of occurrence of various moisture categories using drought indices.
| Index | Moisture Category | January | February | March | April | May | June | July | August | September | October | November | December |
|---|---|---|---|---|---|---|---|---|---|---|---|---|---|
| SPI | EW | 0.0 | 0.0 | 0.0 | 0.0 | 2.5 | 1.2 | 2.5 | 2.5 | 1.2 | 3.7 | 1.2 | 1.2 |
| VW | 4.9 | 4.9 | 4.9 | 2.5 | 3.7 | 4.9 | 3.7 | 3.7 | 7.4 | 3.7 | 3.7 | 4.9 | |
| MW | 13.6 | 16.0 | 11.1 | 11.1 | 3.7 | 16.0 | 8.6 | 9.9 | 4.9 | 8.6 | 4.9 | 6.2 | |
| N | 61.7 | 56.8 | 67.9 | 75.3 | 81.5 | 63.0 | 71.6 | 70.4 | 66.7 | 65.4 | 77.8 | 76.5 | |
| MD | 1.2 | 1.2 | 3.7 | 4.9 | 6.2 | 6.2 | 7.4 | 6.2 | 8.6 | 11.1 | 7.4 | 3.7 | |
| SD | 18.5 | 21.0 | 1.2 | 3.7 | 0.0 | 6.2 | 3.7 | 3.7 | 8.6 | 6.2 | 3.7 | 4.9 | |
| ED | 0.0 | 0.0 | 11.1 | 2.5 | 1.2 | 2.5 | 2.5 | 3.7 | 2.5 | 1.2 | 1.2 | 2.5 | |
| CZI | EW | 3.7 | 1.2 | 4.9 | 2.5 | 1.2 | 1.2 | 2.5 | 1.2 | 1.2 | 3.7 | 3.7 | 2.5 |
| VW | 4.9 | 7.4 | 2.5 | 3.7 | 4.9 | 4.9 | 4.9 | 3.7 | 7.4 | 6.2 | 3.7 | 3.7 | |
| MW | 4.9 | 12.3 | 8.6 | 11.1 | 8.6 | 16.0 | 7.4 | 11.1 | 4.9 | 6.2 | 2.5 | 9.9 | |
| N | 86.4 | 79.0 | 84.0 | 64.2 | 64.2 | 63.0 | 71.6 | 70.4 | 67.9 | 65.4 | 74.1 | 67.9 | |
| MD | 0.0 | 0.0 | 0.0 | 12.3 | 0.0 | 11.1 | 8.6 | 3.7 | 12.3 | 14.8 | 8.6 | 16.0 | |
| SD | 0.0 | 0.0 | 0.0 | 6.2 | 2.5 | 3.7 | 2.5 | 1.2 | 6.2 | 3.7 | 3.7 | 0.0 | |
| ED | 0.0 | 0.0 | 0.0 | 0.0 | 18.5 | 0.0 | 2.5 | 8.6 | 0.0 | 0.0 | 3.7 | 0.0 | |
| SZS | EW | 7.4 | 7.4 | 4.9 | 4.9 | 3.7 | 3.7 | 3.7 | 3.7 | 4.9 | 4.9 | 4.9 | 6.2 |
| VW | 1.2 | 2.5 | 2.5 | 3.7 | 2.5 | 3.7 | 6.2 | 2.5 | 6.2 | 6.2 | 3.7 | 2.5 | |
| MW | 2.5 | 9.9 | 7.4 | 7.4 | 0.0 | 14.8 | 4.9 | 7.4 | 2.5 | 4.9 | 1.2 | 3.7 | |
| N | 88.9 | 80.2 | 85.2 | 65.4 | 91.4 | 63.0 | 72.8 | 76.5 | 70.4 | 65.4 | 76.5 | 76.5 | |
| MD | 0.0 | 0.0 | 0.0 | 18.5 | 2.5 | 13.6 | 9.9 | 9.9 | 16.0 | 18.5 | 13.6 | 11.1 | |
| SD | 0.0 | 0.0 | 0.0 | 0.0 | 0.0 | 1.2 | 2.5 | 0.0 | 0.0 | 0.0 | 0.0 | 0.0 | |
| ED | 0.0 | 0.0 | 0.0 | 0.0 | 0.0 | 0.0 | 0.0 | 0.0 | 0.0 | 0.0 | 0.0 | 0.0 |
Table 4.
Coonoor region landslide inventory and estimated moisture indices.
| Month and Year | Corresponding Monthly Rainfall (in mm) | Moisture Indices Value | ||
|---|---|---|---|---|
| SPI | China Z-Index | Statistical Z-Index | ||
| November, 1978 | 832 | 1.4 | 1.56 | 1.78 |
| November, 1979 | 1348 | 2.26 | 2.57 | 3.78 |
| October, 1990 | 807.7 | 2.21 | 2.26 | 2.82 |
| November, 1993 | 1060.2 | 1.81 | 2.05 | 2.66 |
| December 2001 | 502 | 1.18 | 1.29 | 1.35 |
| November 2006 | 578.6 | 0.85 | 0.95 | 0.79 |
| November 2009 | 1181 | 1.98 | 2.24 | 3.07 |
| November 2015 | 676 | 1.07 | 1.18 | 1.17 |
Table 5.
Consecutive rainfall statistics for the year 2009.
| Month | Total Amount in mm | No. of Rainy Days | No. of Consecutive Rainy Days | Amount of Rainfall | Maximum Daily Rainfall (mm) |
|---|---|---|---|---|---|
| January | 10.2 | 2 | 4.6 | ||
| February | 0.0 | 0 | |||
| March | 84.7 | 4 | 3 | 80.2 | 49.6 |
| April | 20 | 1 | 20 | ||
| May | 86.2 | 7 | 3 | 53.2 | 25 |
| June | 39.8 | 3 | 3 | 36.4 | 23.2 |
| July | 74 | 9 | 7 | 36.4 | 10 |
| August | 147.6 | 9 | 8 | 118 | 43.2 |
| September | 110.8 | 8 | 8 | 104 | 39 |
| October | 138.3 | 11 | 5 | 74.4 | 27 |
| November | 1181 | 15 | 9 | 991.2 | 395 |
| December | 190 | 10 | 5 | 130.2 | 48.6 |
| Total | 2081.8 | 79 | Year Maximum | 991.2 | 395 |
(Source: Sujatha and Suribabu, [22]).
© 2019 by the authors. Licensee MDPI, Basel, Switzerland. This article is an open access article distributed under the terms and conditions of the Creative Commons Attribution (CC BY) license (http://creativecommons.org/licenses/by/4.0/).
Share and Cite
MDPI and ACS Style
Suribabu, C.R.; Sujatha, E.R. Evaluation of Moisture Level Using Precipitation Indices as a Landslide Triggering Factor—A Study of Coonoor Hill Station. Climate 2019, 7, 111. https://0-doi-org.brum.beds.ac.uk/10.3390/cli7090111
AMA Style
Suribabu CR, Sujatha ER. Evaluation of Moisture Level Using Precipitation Indices as a Landslide Triggering Factor—A Study of Coonoor Hill Station. Climate. 2019; 7(9):111. https://0-doi-org.brum.beds.ac.uk/10.3390/cli7090111
Chicago/Turabian StyleSuribabu, C. R., and Evangelin Ramani Sujatha. 2019. "Evaluation of Moisture Level Using Precipitation Indices as a Landslide Triggering Factor—A Study of Coonoor Hill Station" Climate 7, no. 9: 111. https://0-doi-org.brum.beds.ac.uk/10.3390/cli7090111
Note that from the first issue of 2016, this journal uses article numbers instead of page numbers. See further details here.