The Association between Air Temperature and Mortality in Two Brazilian Health Regions


1
Centro de Investigação em Saúde Pública, Escola Nacional de Saúde Pública, Universidade NOVA de Lisboa, 1600-560 Lisboa, Portugal
2
Universidade de Pernambuco, Campus Petrolina, Curso de Graduação em Enfermagem, Petrolina-Pernambuco CEP 56328-900, Brazil
3
Instituto Dom Luiz (IDL), Faculdade de Ciências, Universidade de Lisboa, 1749-016 Lisboa, Portugal
4
Instituto Nacional de Saúde Doutor Ricardo Jorge, Avenida Padre Cruz, Lumiar, 1649-016 Lisboa, Portugal
*
Author to whom correspondence should be addressed.
Climate 2020, 8(1), 16; https://0-doi-org.brum.beds.ac.uk/10.3390/cli8010016
Submission received: 4 December 2019
/
Revised: 11 January 2020
/
Accepted: 17 January 2020
/
Published: 19 January 2020
Abstract
:Air temperature, both cold and hot, has impacts on mortality and morbidities, which are exacerbated by poor health service and protection responses, particularly in under-developed countries. This study was designed to analyze the effects of air temperature on the risk of deaths for all and specific causes in two regions of Brazil (Florianopolis and Recife), between 2005 and 2014. The association between temperature and mortality was performed through the fitting of a quasi-Poisson non-linear lag distributed model. The association between air temperature and mortality was identified for both regions. The results showed that temperature exerted influence on both general mortality indicators and specific causes, with hot and cold temperatures bringing different impacts to the studied regions. Cerebrovascular and cardiovascular deaths were more sensitive to cold temperatures for Florianopolis and Recife, respectively. Based on the application of the very-well documented state-of-the-art methodology, it was possible to conclude that there was evidence that extreme air temperature influenced general and specific deaths. These results highlighted the importance of consolidating evidence and research in tropical countries such as Brazil as a way of understanding climate change and its impacts on health indicators.
1. Introduction
Several studies show that air temperature extremes (TE), both hot and cold, have impacts on mortality rates [1,2,3,4], as well as morbidities [5,6]. These impacts are exacerbated when there are poor health service and protection responses [1,7]. Particularly, when local health services are not aware or are not prepared to support the most vulnerable population groups, this deficiency of action is exacerbated, especially in economically underdeveloped countries [8,9].
As a result of climatic changes, extreme temperature events are expected to continue to increase [10,11,12,13]. In this scenario, several studies attempt to measure the association between these extremes and human adaptability [14,15], as abrupt changes can trigger processes of imbalance in the human physiological pattern, leading to the emergence of acute conditions [16,17,18]. Among these conditions, we highlight acute myocardial infarction, which, due to factors such as stress, vasoconstriction, and the elevation of blood pressure [19], is one of the diseases that may have its rates modified due to the occurrence of climatic extremes [20,21,22].
Nevertheless, it should be noted that the occurrence of extreme temperatures also exacerbates many other diseases. Thus, cold spells and heat waves are of vital relevance within the context of Public Health, particularly to certain risk groups (e.g., children, elderly, poorer, and people with previous cardiovascular and respiratory conditions) [23,24,25,26], by their economic and/or physiological conditions. It is also important to highlight the fact that economically vulnerable populations have access to poorer housing and working environment infrastructure when dealing with extreme temperatures, and thus, they are more prone to the emergence of diseases and related comorbidities [5,6]. However, it is known that these effects tend to be more prolonged when associated with cold spells due to its comorbidities than with heatwaves, where the effects are perceptible and short term [21,26,27]. Thus, to account for the magnitude and strength of these events. It is fundamental to understand the risk and exposure to which populations are subjected [8,28,29].
Temperature extremes increase the risk of cardiovascular deaths, which in turn may be affected by several associated factors, including geographic features such as location within the same territory (country) or even within the municipality itself [30,31], as well as an individual’s occupation where extensive urbanization areas can create heat islands. Moreover, specific population groups, such as the elderly, may be affected in different ways and have different adaptive responses to temperature extremes [30,31,32,33].
A distinct reality exists regarding the amount and scientific soundness of studies on the effects of temperatures on mortality carried out in developed and developing countries. Developed countries have a higher and more thorough record (e.g., References [27,34,35,36]). Nevertheless, a few recent multi-city studies from developing countries have recently been published, focusing on the effects of temperatures on mortality (e.g., References [26,36]). Moreover, some studies related to heatwaves were published focusing on countries in Latin America, namely the cities of São Paulo (Brazil), Santiago (Chile), and Mexico City (Mexico). They showed an association between air temperature extremes and mortality, as well as addressing the consequences of these health indicators and the social determinants associated with these occurrences [37,38,39].
In the case of Brazil, studies measuring the association between mortality and temperature are scarce, but some research has already been conducted as part of multi-country studies. The studies included 18 Brazilian cities, and they showed a positive association between temperature and all and cause-specific deaths [38,39,40]. Nevertheless, more studies on the association between temperature and mortality in tropical or subtropical countries are needed to support public health policies and interventions.
Studies on the relationship between temperature and human mortality have been conducted exhaustively in temperate countries, where the results focus on the importance of understanding this factor as a determinant in mortality and morbidity indicators. Understanding these impacts in tropical and subtropical countries, such as Brazil, is a challenge that increases due to climate change. Thus, it is essential to build scientific evidence that can guide and give more robust public policies to meet this new challenge [27,30].
This study was designed to analyze how temperatures can affect human lives in two different parts of Brazil (Recife and Florianópolis), which are characterized by completely different climatic conditions. To accomplish the proposed objective, we performed the association between extremes of temperature (cold and heat) and general and specific deaths in the health regions of Florianópolis (Santa Catarina, SC) and Recife (Pernambuco, PE), Brazil, between 2005 and 2014 by applying a quasi-Poisson approach. The research is expected to improve our knowledge of the impact of extreme climatic phenomena related to temperature on mortality indicators in regions considered tropical and subtropical. The research will also provide scientific evidence to bridge the gap of existing studies on the impacts of climate change on health in countries considered underdeveloped or developing.
2. Materials and Methods
2.1. Case Study
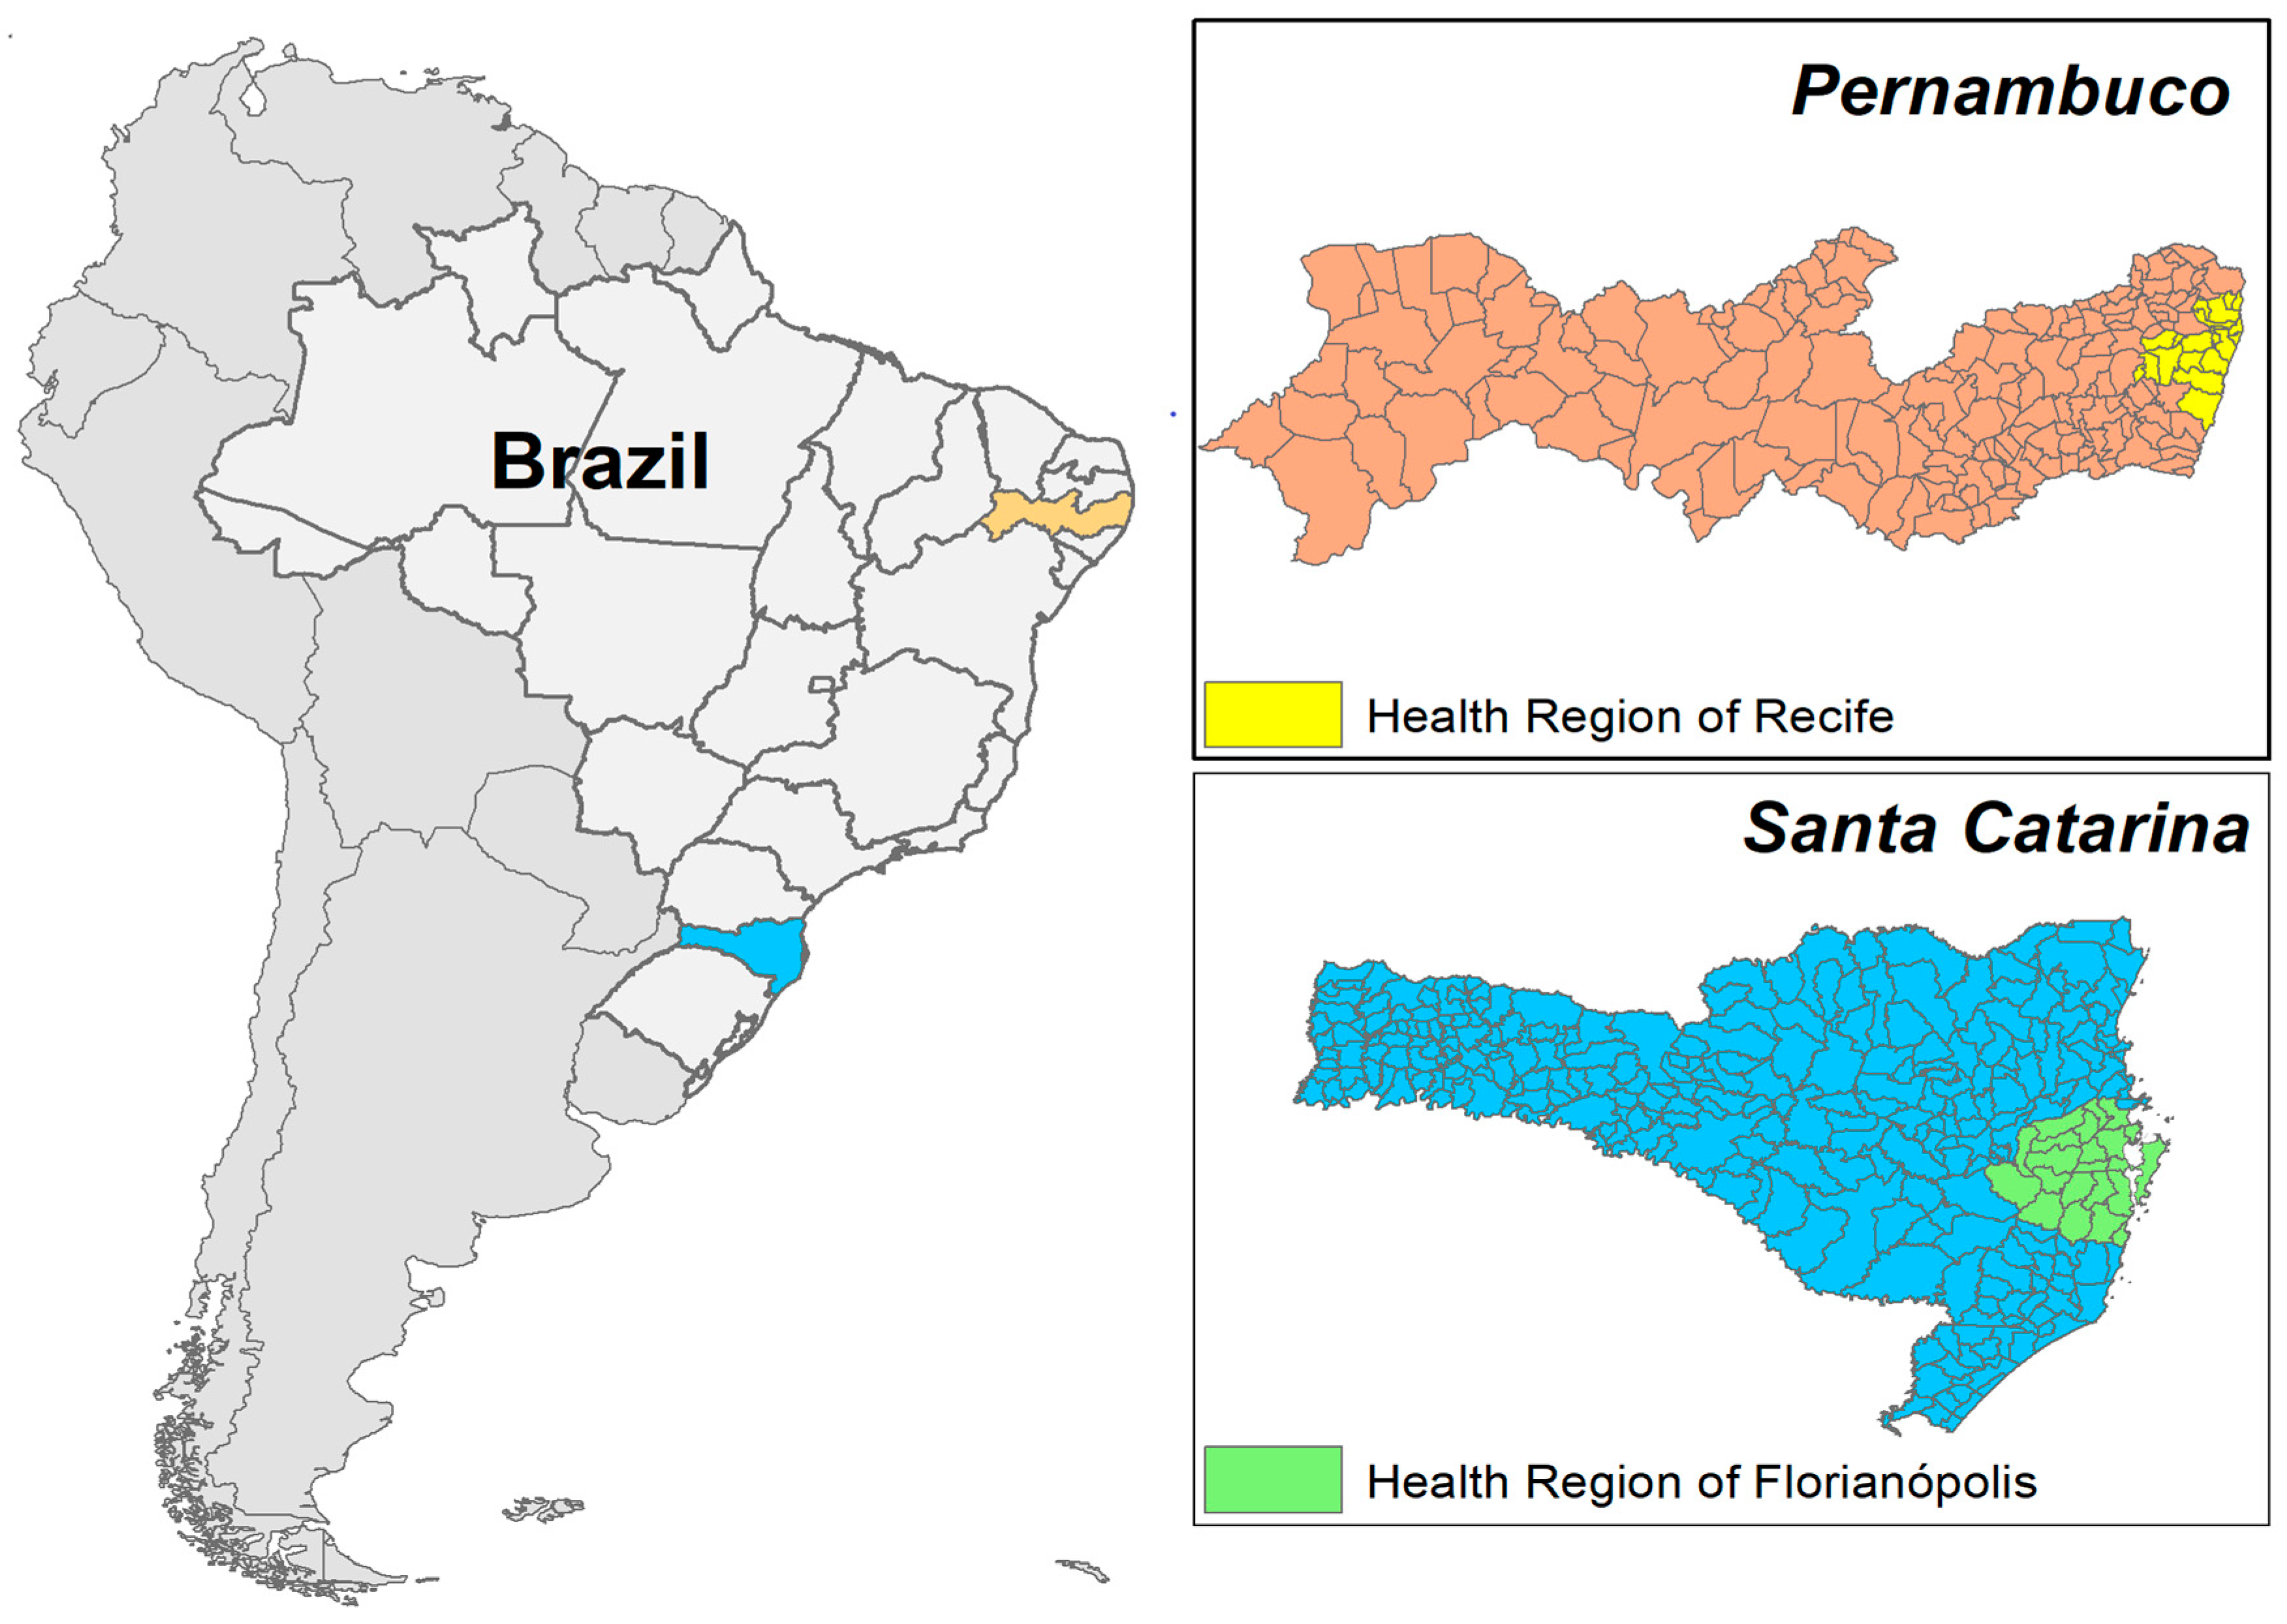
The present study was developed for two Brazilian health regions Recife (Pernambuco, Northeast) and Florianópolis (Santa Catarina, Southern Region), which are geographic areas defined according to the Unified Health System (SUS) of the Brazilian Ministry of Health ( MS), Brazil (Figure 1), for the period between 2005 and 2014. These areas are bounded by the municipal boundaries, where health services are allocated with the function of organizing the decentralized and planned supply of services. These regions show cultural and socioeconomic similarities [41].
The Florianópolis (FL) and Recife (RF) study areas are composed of 20 and 22 municipalities, with an estimated population of 3,908,757 inhabitants and 1,027,271 inhabitants (IBGE, 2010), respectively. Both areas have mixed occupancies, with some municipalities characterized by a dense urban area and other municipalities with strong rural characteristics. Moreover, there are 8 (FL) and 3 (RF) cities with a population above 100,000 inhabitants.
In addition to environmental characteristics, the state of Santa Catarina is ranked 3rd in the HDI-M indices (0.808) among Brazilian states, with longevity and education rates considered high by the UN. In contrast, the state of Pernambuco is 18th in the same ranking (0.727) (37).
The two health regions present important disparities that may influence the behavior or the response to some health situations, namely poverty and education levels.
It is also important to point out that Brazil has an aging population, with an increase in people with chronic degenerative diseases [42,43]. In this context, proximity and access to health services become essential for the control and monitoring of this vulnerable portion of the population [22,37,44].
2.2. Temperatures Data
Climate data were derived from the monitoring of meteorological stations located in the study areas. Data were provided by the Santa Catarina Environmental and Hydrometeorological Information Center of Santa Catarina (CIRAM-SC), and the Meteorological Database for Teaching and Research (BDMEP) of the National Institute of Meteorology (INMET) [40]. The data referring to the average maximum and minimum daily temperatures were obtained from 2005 to 2014. The maximum and minimum data were used to calculate the mean daily temperatures.
Given that in some periods no daily temperatures were recorded (average, maximum, and minimum), it was not possible to record the dew temperature and relative humidity for the purposes of applying the model in some periods of analysis. Moreover, the non-existent values corresponded to less than 0.5% of the total number of days analyzed. These days were not continuous, and this inconsistency does not interfere with the analysis and interpretation of the data, and cannot translate bias for this investigation [45].
2.3. Mortality Data
Mortality data were provided by the General Coordination of Information and Epidemiological Analysis (CGIAE) of the Department of Surveillance of Diseases and Noncommunicable Diseases and Health Promotion (DANTPS) of the Health Surveillance Secretariat of the Ministry of Health (SVS/MS) of Brazil. The data used included the daily number of deaths by all causes, and deaths categorized by the International Code of Diseases (ICD10), deaths by non-accidental mortality (ICD-10: A00-R99), respiratory and circulatory (ICD10 I-J), cerebrovascular (ICD10 I60-69), and cardiovascular (ICD10 I20-25.9), for the 2005 to 2014 research period. The deaths of fetuses less than 1-year-old and of women related to childbirth or puerperium were excluded from the analysis. In Brazil, the classification of deaths by external causes (ICD10 Groups V01 to Y98) is considered for statistical purposes. These data on all-cause deaths were available for this research. However, these groups of deaths were excluded in the data treatment because they were not directly related to the proposed association with extreme temperatures [46].
2.4. Statistical Analysis
To measure the association between mean daily air temperature and the risk of death, we fitted a quasi-Poisson to daily mortality in both regions, adjusting for the day of the week (categorical), secular trends, and seasonality, using a natural cubic spline with 8 degrees of freedom per year. As a way of adapting to the model proposed by Gasparrini et al. (2014) [47], a historical series of data was elaborated, including the data of the period under analysis, in addition to the daily data on temperature.
The association between daily mean temperature and mortality was modeled with a distributed nonlinear model, assuming that the effect of air temperature could last up to 20 days for the health region of Florianópolis, due to its higher thermal variability and 14 days for the health region of Recife due to the low thermal variability. To define these values, we used the QAIC test, and this number of days presented the lowest QAIC and the best possibility of data interpretation. This value has also been used in previous investigations in countries with a tropical climate (Table 1, Figure 2). The confidence intervals (CI) were calculated for the exposure-response curves using the Monte Carlo method, assuming a multivariate normal distribution of the best linear unbiased predictions of the reduced coefficients. This statistical modeling approach has been used previously to study the effect of air temperature on mortality in several cities and countries through a multicentric investigation [27,40,48,49]. Based on this methodologic approach, which was made available in an R package of routines by Gasparrini et al. (2014) [47], it was possible to increase the comparability of our results with other published studies.
The minimum mortality temperatures (MMT, [50]), which was considered the temperature with the lowest mortality risk, were calculated for each health region and cause of death. Each MMT value obtained was then used as a reference to measure the increased risk of death at the air temperature percentile 1% (extreme cold) and 99% (extreme heat) [27,40,50,51].
An approximate parametric bootstrap estimator was used to describe the confidence intervals for the MMTs, which were described and made available by Tobias et al. (2017) [50]. The remaining relative risk analyses were performed with the widely used and validated “R dlnm” software packages, which are documented in detail in research papers with similar analyses [40,47,52]. We used for MMT confidence intervals an approximate parametric bootstrap estimator [50,53].
All the deaths attributed to non-optimal temperatures were quantified by summing the daily temperature predicted deaths contained in the historical series. Assignment calculations were performed for cold and hot temperatures for each health region and general and specified causes of death [47]. As a way of investigating the possible relationship to the occurrence of extremely cold or hot days, we also determined temperatures below and above the temperature percentiles of 2.5% and 97.5%, respectively. These were considered cold and hot temperature extremes. Moreover, a three-day lag period was also used, following Gasparrini et al. (2015) [40].
3. Results
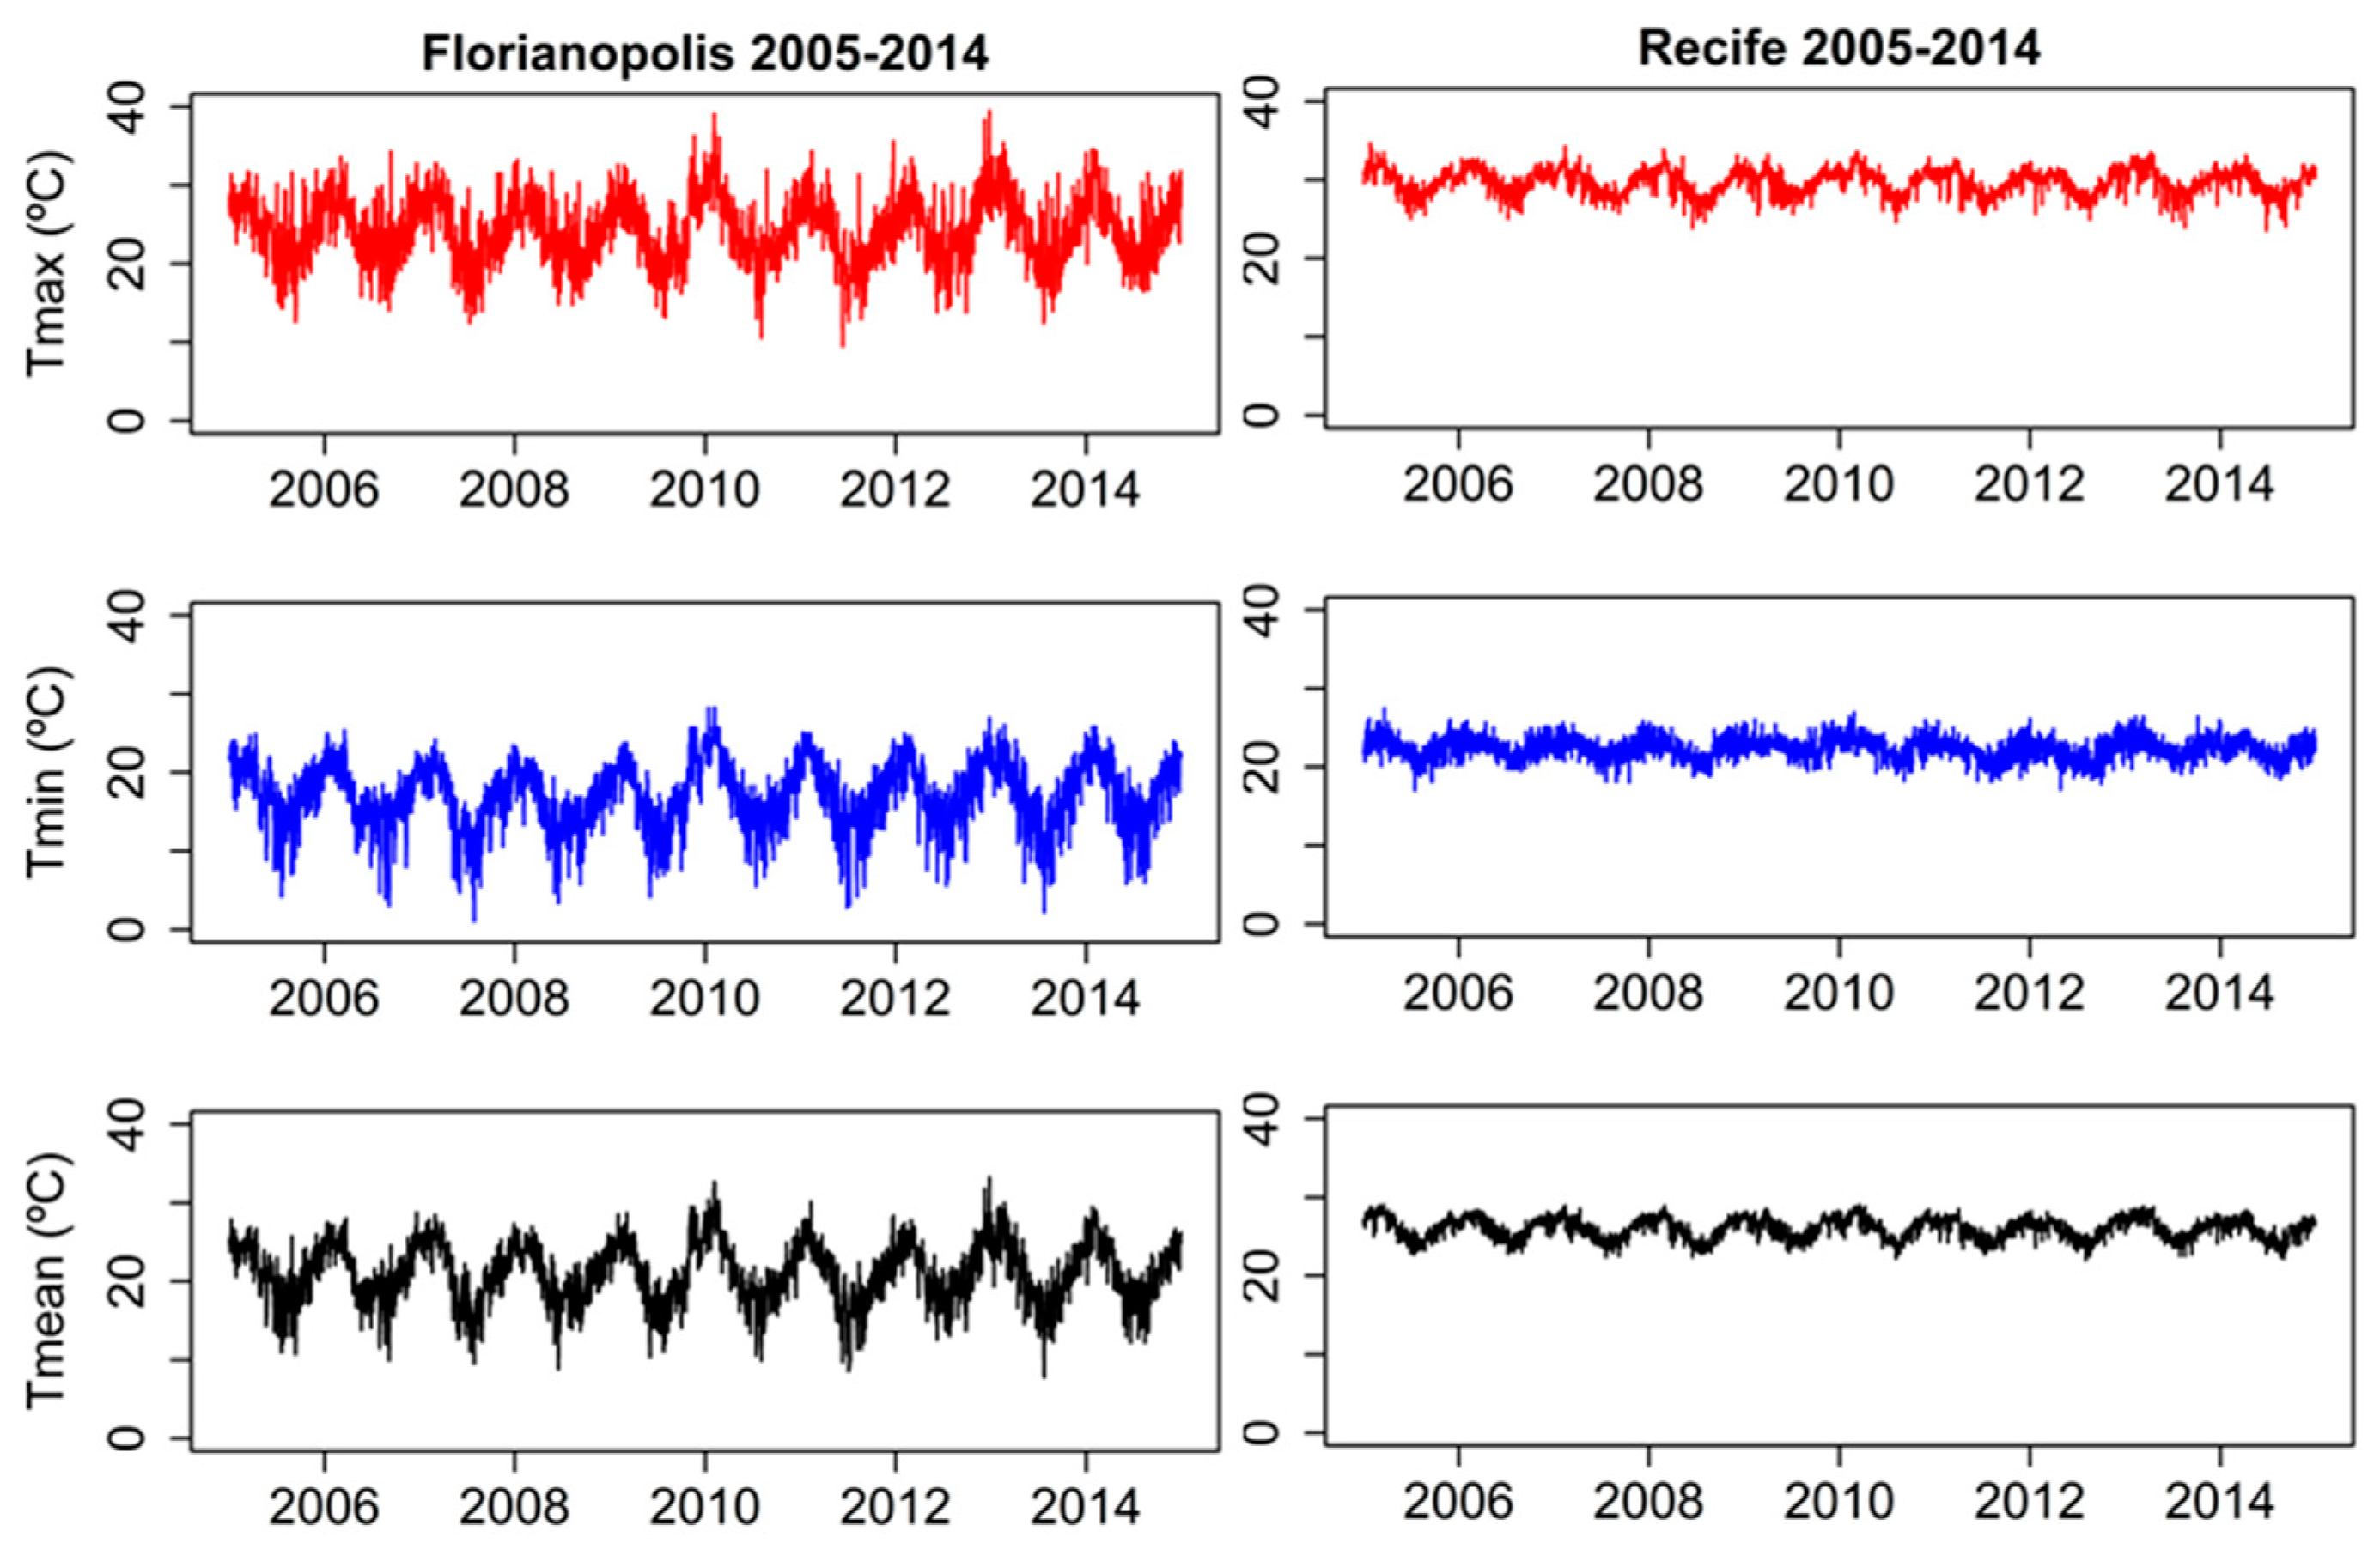
The health region of Recife was classified according to the climatic classification of Koppen as an ‘As’ climate (hot and humid tropical climate and rainy winter), besides presenting low thermal variability with average temperatures for the seasons between 17.0 °C and 34.7 °C (Figure 1, Table 1). Conversely, the Florianópolis health region, located in the southern region of the country, has a temperate, tropical climate, presenting ‘Cfa’ climatic (humid subtropical climate is a zone of climate characterized by hot and humid summers, and cool to mild winters) characteristics, with average temperatures ranging between 1.1 °C and 39.5 °C (Figure 1, Table 1).
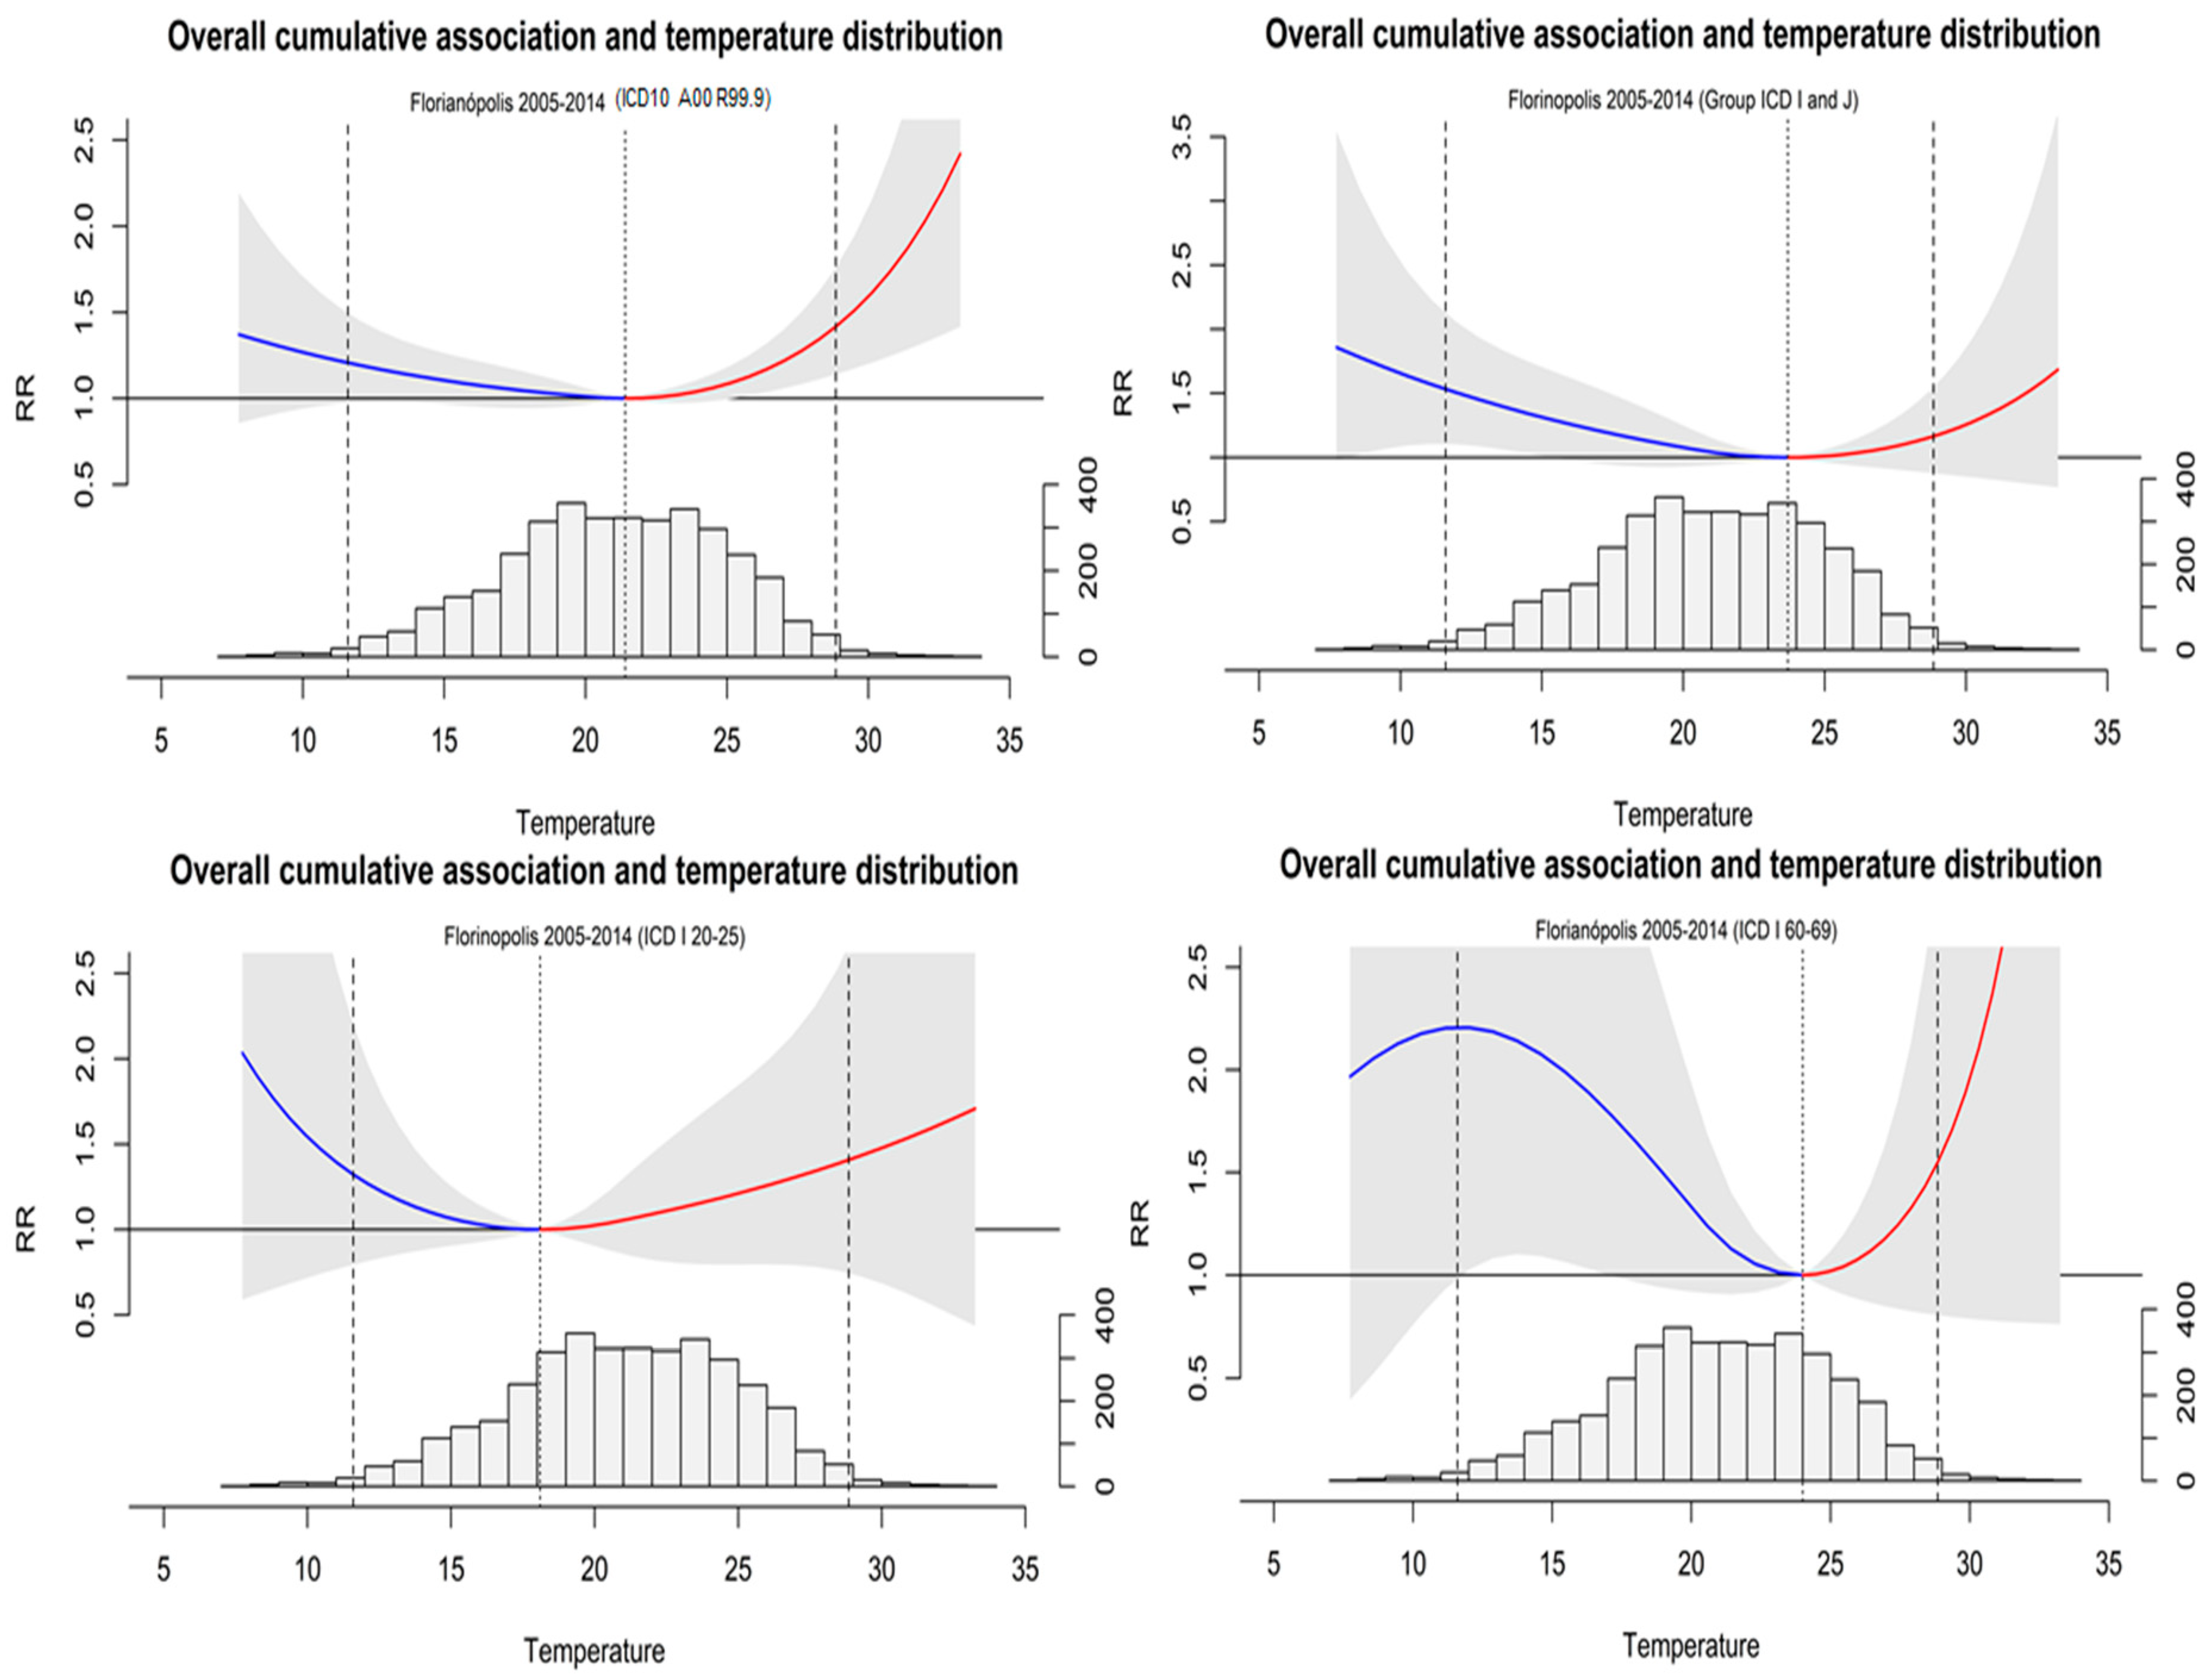
The exposure-response curves over the Florianópolis health region showed a clear ’U’ pattern, with a high risk of death for both high and low temperatures. It is also possible to see that cerebrovascular and cardiovascular deaths presented a higher variation in the exposure-response curves (Figure 3).
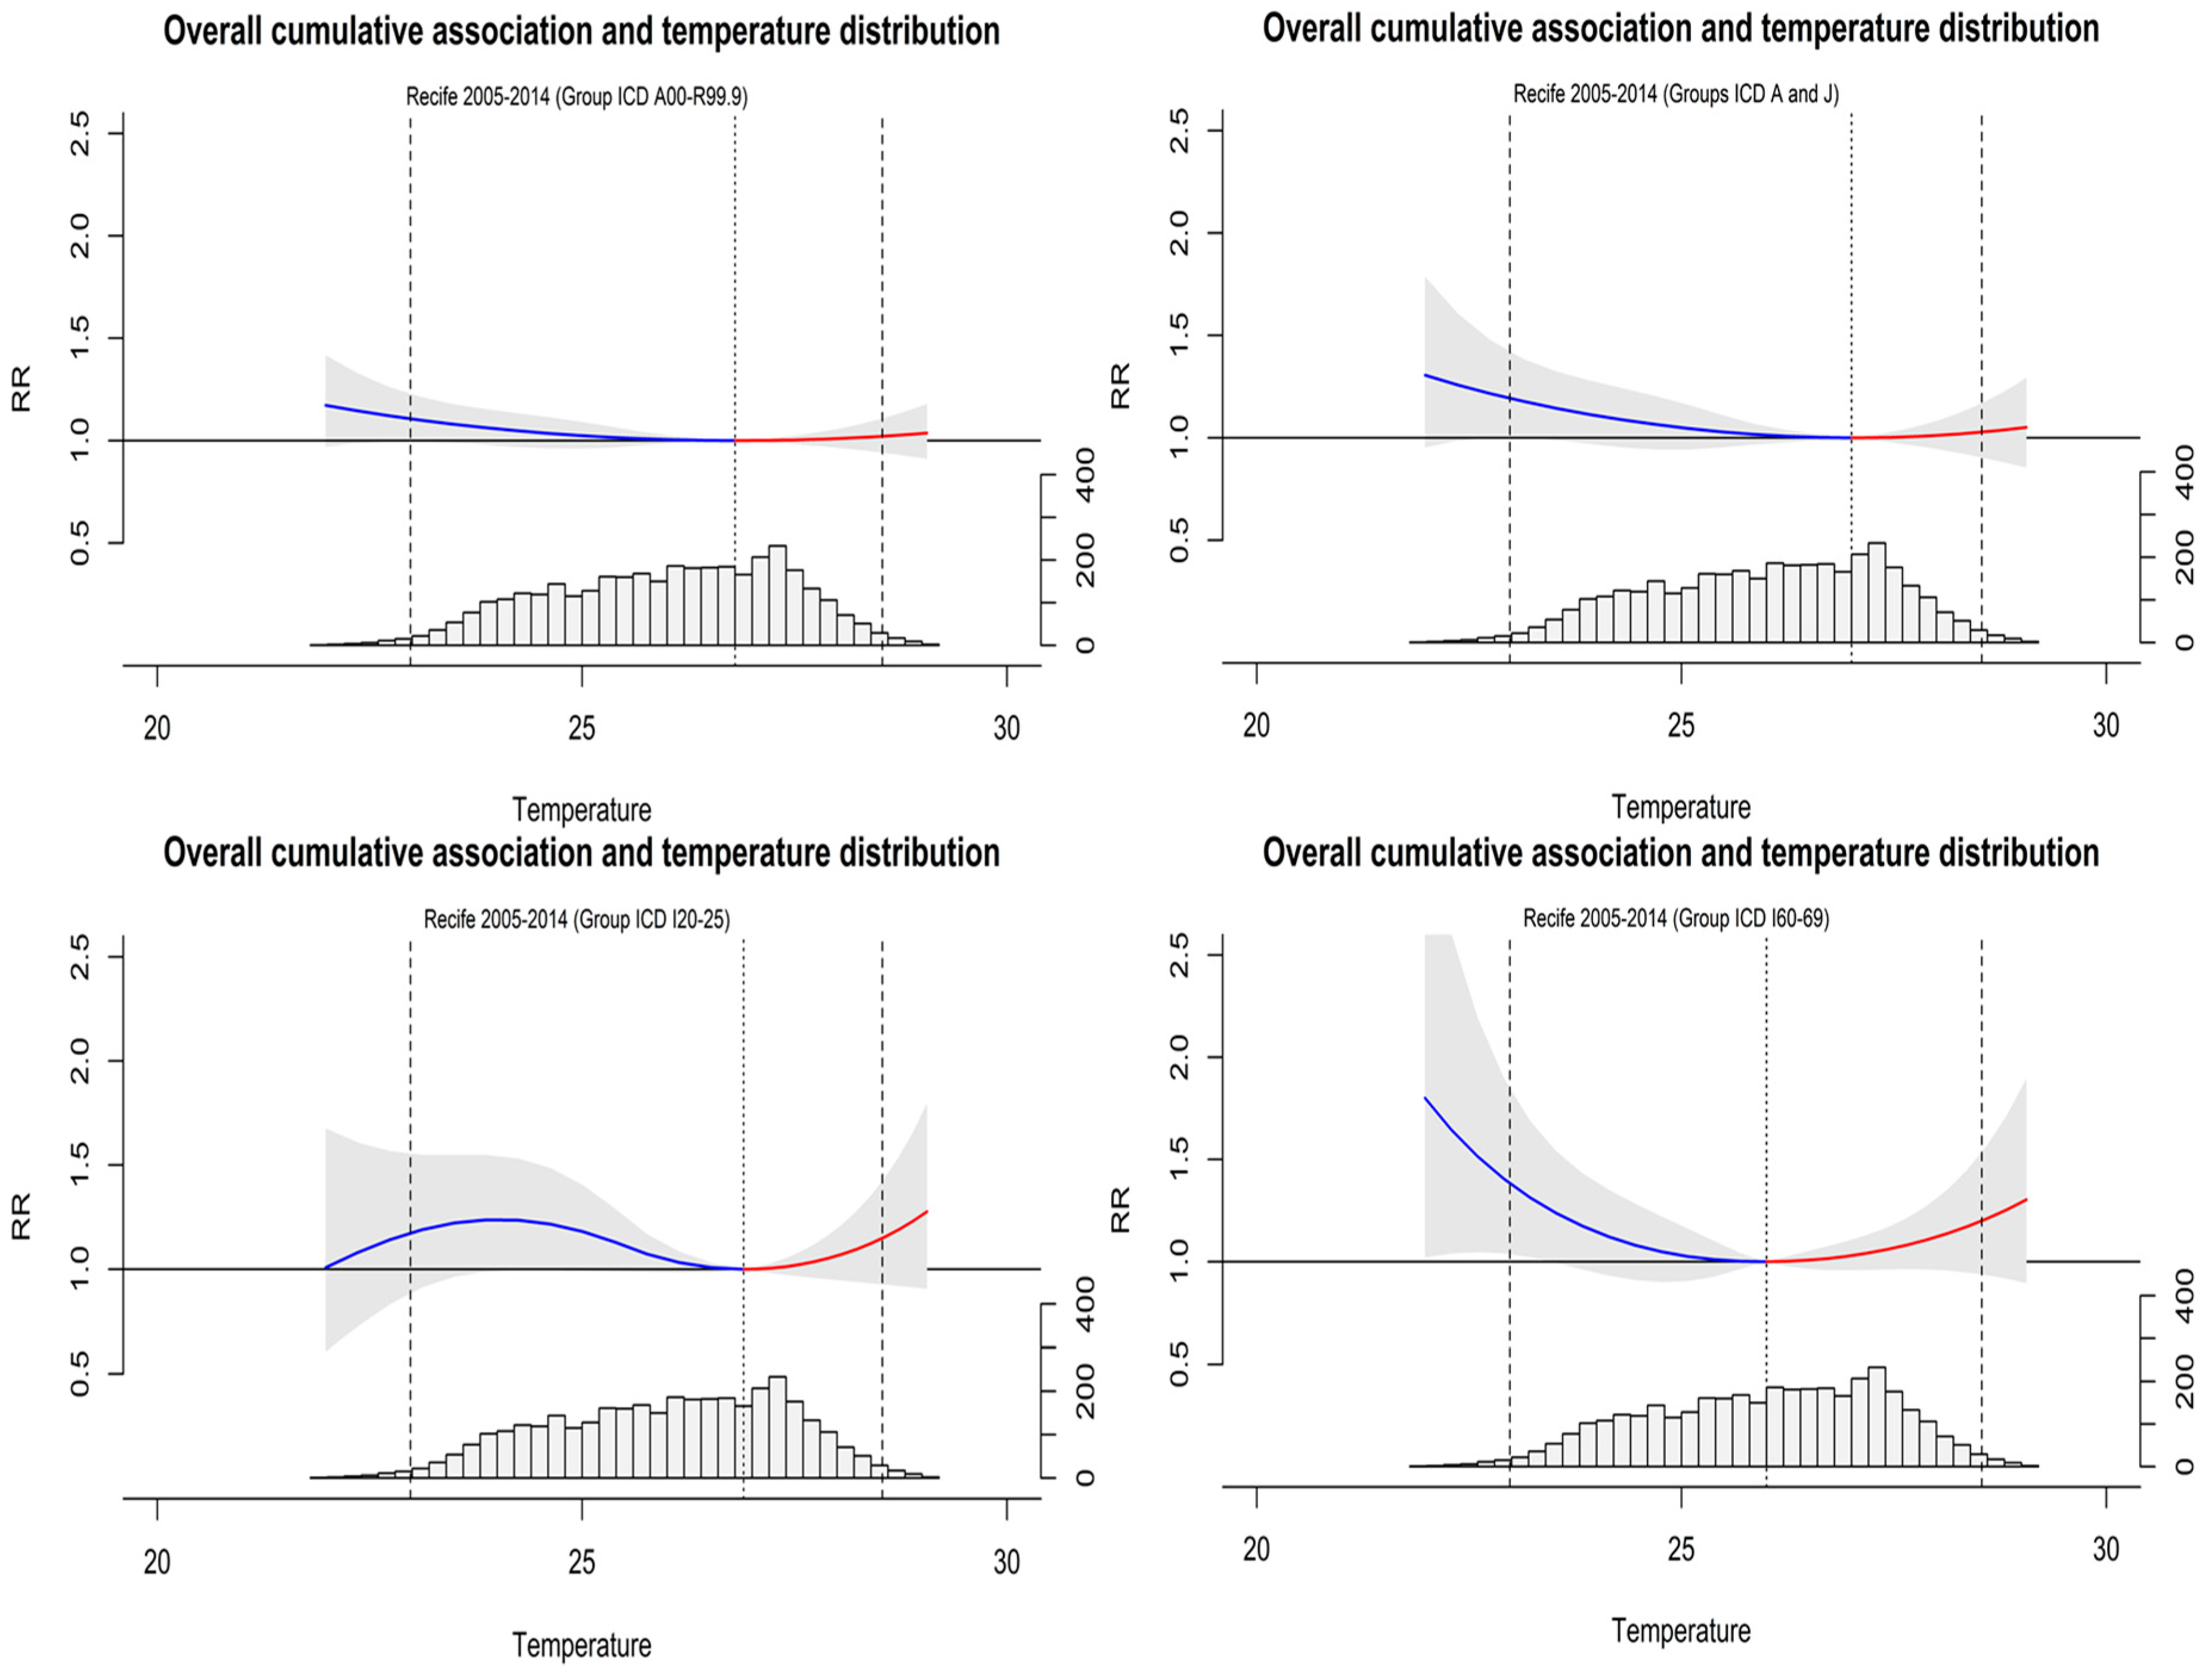
Concerning the health region of Recife, the curves of exposure-response showed a ’U’ curve with elongated characteristics, for deaths by non-accidental mortality, which presented low influence on low or high temperatures. However, for cardiovascular and cerebrovascular deaths, a clear ‘U’ shaped curve was observed, with a risk for cold and heat extremes for cerebrovascular, and with a higher risk for extremes of cold in cardiovascular deaths (Figure 4).
The percentage of deaths by non-accidental mortality (ICD-10: A00-R99) attributed to air temperature extreme cold and heat in Florianópolis (5.80%) was higher than the fraction of all-cause deaths attributable to air temperatures in the Recife region (1.8%). For the specific causes, differences in circulatory and respiratory systems’ deaths were observed, with 8.90% and 3.30% of deaths attributable to temperature, respectively, for Florianopolis and Recife. On the other hand, for cardiovascular diseases’ deaths, only a minor difference was observed between Florianopolis (8.70%) and Recife (8.08%). Regarding cerebrovascular diseases, the fraction of deaths attributable to temperature in Florianopolis reached 23.3%, with cold temperatures being the main driving factor. Although Recife also presented a significant air temperature attributable fraction of deaths by cerebrovascular causes, the faction was not so high as the value of Florianopolis, reaching 5.57% for both hot and cold temperatures, where heat events accounted for of 2.42% and cold for 2.95%.
Considering the health region of Florianopolis, an increased risk of death for both high and low temperatures was observed. The relative risk of death due to low temperatures, was 2.20, 1.53, and 1.32, respectively, for cerebrovascular diseases (CI 0.98–4.95), respiratory/circulatory groups (CI 1,11–2,20), and cardiovascular diseases (CI 0.79–2.20). Considering the high temperatures, we observed the most pronounced effect for cerebrovascular deaths and cardiovascular diseases, respectively, with an RR of 1.55 (CI 0.80–2.99) and 1.41 (CI 0.74–2.68) (Table 2).
The health region of Recife presented minimal variation in the MMT values, but higher than the values observed in Florianopolis. The relative risk of death was higher for cerebrovascular deaths for both cold and hot temperatures with relative risk estimates of 1.38 and 1.20 (Table 2). A smallest, but significant, increased risk associated with low temperatures, was also observed for circulatory and respiratory deaths (RR = 1.19).
4. Discussion
This study showed that, in both regions, air temperatures played a significant role over all-cause deaths (ICD10 A00-R99), but with different magnitudes, that may be related to the climatic characteristics [1,40,54] or the mortality profile of each region [54,55]. These results show that, even in countries considered tropical with small temperature amplitudes, a fraction of deaths is estimated to be attributable to extreme air temperatures [27,39,40]. Brazil, in its territorial dimension, has in its regions marked climatological differences, which present different responses to the extremes of temperature [56,57].
When we analyzed the relative risk of temperature-related mortality to specific causes, we observed that in the health region of Florianopolis, which has a subtropical climate, temperatures have a different impact on the causes of mortality. Cold temperatures increase the risk of death for circulatory and respiratory diseases (ICD10 I and J), and the cerebrovascular group (ICD10 I 60-69). Hot temperatures, in turn, increased the risk of death for cardiovascular diseases (ICD10 I 20-25) [30].
In the analysis of the health region of Recife, which presents a tropical climate with low climatic variability, cold temperatures had an impact on the attributable mortality in all the investigated causes of death. However, for the cerebrovascular group (ICD10 I 60-69), there was only a small difference between the risks attributable to cold and hot temperatures. Cold temperature extremes have a higher impact on this cause of death [39,58,59,60], which has also been found in other studies that have shown an association between cold and risk-related deaths due to cerebrovascular diseases [60,61,62,63].
Moreover, whereas for Florianopolis, hot temperatures showed a higher impact on this cause of death, Recife showed higher risks associated with the cold temperatures.
Furthermore, deaths associated with low temperatures are more important in the cerebrovascular group, for the health region of Florianópolis, reaching a very high percentage of the number of attributable deaths (20.94%) by this group. The aging of the population and the lack of the kind of public-health action measures that are useful in the case of heat might account for this increase in mortality associated with low temperatures [64,65].
Looking at the exposure-response (ER) curves, we see that the behaviour of deaths is different in each region for the group deaths by non-accidental mortality (ICD10 A00-R99). Several factors may contribute to this discrepancy, such as the physiological conditions of adaptation, socioeconomic conditions, among other factors [66]. It is also worth highlighting the different climatic conditions which usually occur in each region. An important conditioning factor in the case of Florianopolis lies in the fact that temperatures present a large thermal amplitude, where people better support the effects of extreme temperatures. Conversely, for Recife, where only small thermal variations are present, cold extremes tend to develop acute responses of greater intensity [67,68].
The findings of this research are comparable to the results from other studies showing the existence, as a result of climate change, of a tendency to increase the effects of temperatures on general and specific deaths [40,69]. Countries in South America are more sensitive to temperature extremes, and the comorbidities present as a risk factor when associated with the occurrence of extremely hot or cold days, also contributing to increasing the risk of mortality by certain groups of diseases [27,40,70,71]. In this line, our results are in accordance with previous studies [20,39,54,63,72], some of them carried out for the municipality of Recife [40,69]. Moreover, is important to say that other studies carried out in cities located in the north-eastern region of Brazil showed that, in almost all cities investigated, the cold component stands out as the main influencer in all-cause deaths without external causes associated with temperature, which corroborates our findings in this research. We would also like to point out that we did not only evaluate the municipality of Recife but extended our research to the totality of municipalities that make up the Recife health region. Similar results of the attributable mortality burden of death by cold temperatures were in tropical Thailand [27,40,69,73].
The association of temperature with other aspects, such as the epidemiological profile of the studied population, as well as physiological factors of adaptation to the extremes of temperature, may exacerbate a negative response to climatic stress. Moreover, the impact of temperature on mortality is also influenced by the socio-economic conditions of the affected population [39,74,75], namely through the access to air conditioning systems [76,77]. Apart from that, other factors may also contribute to reducing the influence of temperature events on mortality like the existence of public-health intervention programs [78,79]. Above all, improvements in health-care services have advanced appreciably more in the treatment of cardiovascular than respiratory problems [80,81,82]. Nevertheless, they still lack in most regions in Brazil.
In another perspective, the health services should be able to respond to these situations through the mapping of situations of vulnerability, in the monitoring and control of extreme situations. They should also develop actions that can mitigate the effects of people with pre-existing comorbidities. It is important to highlight the existence in Brazil of environmental disaster monitoring services and extreme climatic events. However, regarding extreme temperature events, there is no public policy to minimize these effects for the most vulnerable population [32,37,83,84,85,86].
Therefore, the relevance of this research to public health is highlighted here. The proposed approach empowers the health services with evidence that may help consolidate public policies, to support actions aimed at understanding the impact of extreme temperatures in general and specific death causes of the population and its vulnerable groups. Namely, as observed in other studies, the population groups that are more susceptible to these diseases, such as the elderly, people with associated comorbidities (hypertension, cardiopathies, etc.). These can exacerbate the effects of extreme temperatures when associated with conditions of unfavorable thermal comfort [16,31,83,85,87,88].
This research presents some limitations, namely because it is an ecological study aimed at understanding the population groups and territories, and not individually. It is also important to stress that the temperatures were estimated using the meteorological station of the headquarters of the health region, in this case, Florianopolis and Recife, due to the lack of temperature data for all the municipalities that made up each health region.
Nevertheless, this study provides a basis for analysis and comparison, which enables policymakers to establish health-promoting guidelines for vulnerable populations in these contexts. It is a precursory study of comparative analysis between singular health regions carried out in Brazilian territory, evidencing the impact of temperatures and their extremes on mortality.
5. Conclusions
The research becomes relevant when it begins to construct evidence of the impacts of temperature on general and specific causes of deaths, with the change of the epidemiological profile and age of the Brazilian population [37,39]. These findings contribute to understanding this phenomenon and its impact on health indicators from a population that goes through the transition from its causes to deaths, from infectious causes to chronic-degenerative diseases [39,71,72,89].
We conclude from the findings of this study that (1) temperature exerts an influence on both general mortality indicators and specific causes; (2) hot and cold extremes bring different impacts to the studied regions; (3) cerebrovascular deaths present greater sensitivity to cold extremes in the region of Florianópolis; however, this association should be investigated further.
We also would like to emphasize that there are few studies on the association of temperature and mortality in countries with a tropical and subtropical climate, especially for those in the southern hemisphere, which makes it difficult to compare the results found. It should be pointed out that, because there is no evidence, there are few actions in terms of thermal comfort at the domestic level (residence), as well as at the social level through public policies that reduce the impact of climatic extremes. In this way, the most exposed population groups are more susceptible to this problem.
Author Contributions
The contributions of each author to this work were the following: Conceptualization, W.E.P., B.N., and A.R.; methodology, W.E.P., B.N., A.R., and A.F.S.R.; formal analysis W.E.P., B.N., A.R., and A.F.S.R.; investigation, W.E.P., B.N., and A.R; writing—original draft preparation, W.E.P., and A.R.; writing—review and editing, W.E.P., B.N., and A.R. All authors have read and agree to the published version of the manuscript.
Funding
This research was partially funded by Fundação para a Ciência e Tecnologia grant SFRH/BPD/99757/2014 (AR).
Acknowledgments
We are grateful for the contributions to this work regarding the availability of the University of Pernambuco/Brazil. The university allowed the immersion of one of the researchers in the investigation.
Conflicts of Interest
The authors declare no conflict of interest.
References
- Guo, Y.; Gasparrini, A.; Armstrong, B.; Li, S.; Tawatsupa, B.; Tobias, A.; Lavigne, E.; de Sousa Zanotti Stagliorio Coelho, M.; Leone, M.; Pan, X.; et al. Global variation in the effects of ambient temperature on mortality: A systematic evaluation. Epidemiology 2014, 25, 781–789. [Google Scholar] [CrossRef] [PubMed] [Green Version]
- Green, D.; Bambrick, H.; Tait, P.; Goldie, J.; Schultz, R.; Webb, L.; Alexander, L.; Pitman, A. Differential effects of temperature extremes on hospital admission rates for respiratory disease between indigenous and non-indigenous Australians in the Northern territory. Int. J. Environ. Res. Public Health 2015, 12, 15352–15365. [Google Scholar] [CrossRef] [PubMed]
- Lowe, R.; García-Díez, M.; Ballester, J.; Creswick, J.; Robine, J.-M.; Herrmann, F.; Rodó, X.; Lowe, R.; García-Díez, M.; Ballester, J.; et al. Evaluation of an early-warning system for heat wave-related mortality in Europe: Implications for sub-seasonal to seasonal forecasting and climate services. Int. J. Environ. Res. Public Health 2016, 13, 206. [Google Scholar] [CrossRef] [PubMed]
- Hales, S.; Kovats, S.; Lloyd, S.; Campbell-Lendrum, D. Quantitative Risk Assessment of the Effects of Climate Change on Selected Causes of Death, 2030s and 2050s; World Health Organization: Geneva, Switzerland, 2014; ISBN 978-9-24-150769-1. [Google Scholar]
- Ye, X.; Wolff, R.; Yu, W.; Vaneckova, P.; Pan, X.; Tong, S. Ambient temperature and morbidity: A review of epidemiological evidence. Environ. Health Perspect. 2012, 120, 19–28. [Google Scholar] [CrossRef] [Green Version]
- Li, M.; Gu, S.; Bi, P.; Yang, J.; Liu, Q. Heat waves and morbidity: Current knowledge and further direction: A comprehensive literature review. Int. J. Environ. Res. Public Health 2015, 12, 5256–5283. [Google Scholar] [CrossRef] [Green Version]
- Basu, R. High ambient temperature and mortality: A review of epidemiologic studies from 2001 to 2008. Environ. Health 2009, 8, 40. [Google Scholar] [CrossRef] [Green Version]
- Ebi, K.L. Resilience to the health risks of extreme weather events in a changing climate in the United States. Int. J. Environ. Res. Public Health 2011, 8, 4582–4595. [Google Scholar] [CrossRef] [Green Version]
- Van Der Linden, S.L.; Leiserowitz, A.A.; Feinberg, G.D.; Maibach, E.W. The scientific consensus on climate change as a gateway belief: Experimental evidence. PLoS ONE 2015, 10, e0118489. [Google Scholar] [CrossRef] [Green Version]
- Coumou, D.; Rahmstorf, S. A decade of weather extremes. Nat. Clim. Chang. 2012, 2, 491–496. [Google Scholar] [CrossRef]
- Bitencourt, D.P.; Fuentes, M.V.; Maia, P.A.; Amorim, F.T. Frequência, duração, abrangência espacial e intensidade das ondas de calor no Brasil. Rev. Bras. Meteorol. 2016, 31, 506–517. [Google Scholar] [CrossRef] [Green Version]
- Ceccherini, G.; Russo, S.; Ameztoy, I.; Romero, C.P.; Carmona-Moreno, C. Magnitude and frequency of heat and cold waves in recent decades: The case of South America. Nat. Hazards Earth Syst. Sci. 2016, 16, 821–831. [Google Scholar] [CrossRef] [Green Version]
- IPCC. Managing the Risks of Extreme Events and Disasters to Advance Climate Change Adaptation: Special Report of the Intergovernmental Panel on Climate Change; Field, C., Barros, V., Stocker, T., Qin, D., Dokken, D., Ebi, K., Mastrandrea, M., Mach, K., Plattner, G.-K., Allen, S., et al., Eds.; Intergovernmental Panel on Climate Change: Cambridge, UK, 2012; ISBN 9781139177245. [Google Scholar]
- Bellard, C.; Bertelsmeier, C.; Leadley, P.; Thuiller, W.; Courchamp, F. Impacts of climate change on the future of biodiversity. Ecol. Lett. 2012, 15, 365–377. [Google Scholar] [CrossRef] [PubMed] [Green Version]
- Klein, R.J.; Huq, S.; Denton, F.; Downing, T.E.; Richels, R.G.; Robinson, J.B.; Toth, F.L. Inter-relationships between adaptation and mitigation. In Climate change 2007: Impacts, Adaptation and Vulnerability: Contribution of Working Group II to the Fourth Assessment Report of the Intergovernmental Panel on Climate Change; Parry, M.L., Canziani, O.F., Palutikof, J.P., van der Linden, P.J., Hanson, C.E., Eds.; IPCC; Cambridge University Press: Cambridge, UK, 2007; pp. 745–777. [Google Scholar]
- Conlon, K.C.; Rajkovich, N.B.; White-Newsome, J.L.; Larsen, L.; O’Neill, M.S. Preventing cold-related morbidity and mortality in a changing climate. Maturitas 2011, 69, 197–202. [Google Scholar] [CrossRef] [PubMed] [Green Version]
- Schwartz, J.; Samet, J.M.; Patz, J.A. Hospital admissions for heart disease. Epidemiology 2004, 15, 755–761. [Google Scholar] [CrossRef] [PubMed]
- Rivero, E.U.; Bolufé, A.; Ortiz, J.; Rodríguez, P.L.; Reyes, Y.; Cristina, M.; Rivero, A.; Bolufé, J.; Ortiz, P.L.; Rodríguez, Y.; et al. Medical education cooperation with Cuba influence of climate variability on acute myocardial infarction mortality in Havana. MEDICC Rev. 2015, 17, 14–19. [Google Scholar]
- Sharovsky, R.; César, L.A.M. Increase in mortality due to myocardial infarction in the Brazilian city of São Paulo during winter. Arq. Bras. Cardiol. 2002, 78, 106–109. [Google Scholar] [CrossRef]
- Vasconcelos, J.; Freire, E.; Almendra, R.; Silva, G.L.; Santana, P. The impact of winter cold weather on acute myocardial infarctions in Portugal. Environ. Pollut. 2013, 183, 14–18. [Google Scholar] [CrossRef]
- Madrigano, J.; Mittleman, M.A.; Baccarelli, A.; Goldberg, R.; Melly, S.; von Klot, S.; Schwartz, J. Temperature, myocardial infarction, and mortality: Effect modification by individual- and area-level characteristics. Epidemiology 2013, 24, 439–446. [Google Scholar] [CrossRef]
- Kwon, B.; Lee, E.; Lee, S.; Heo, S.; Jo, K.; Kim, J.; Park, M. Vulnerabilities to temperature effects on acute myocardial infarction hospital admissions in South Korea. Int. J. Environ. Res. Public Health 2015, 12, 14571–14588. [Google Scholar] [CrossRef] [Green Version]
- Hajat, S.; Kovats, R.S.; Lachowycz, K. Heat-related and cold-related deaths in England and Wales: Who is at risk? Occup. Environ. Med. 2007, 64, 93–100. [Google Scholar] [CrossRef] [Green Version]
- Mazdiyasni, O.; AghaKouchak, A.; Davis, S.J.; Madadgar, S.; Mehran, A.; Ragno, E.; Sadegh, M.; Sengupta, A.; Ghosh, S.; Dhanya, C.T.; et al. Increasing probability of mortality during Indian heat waves. Sci. Adv. 2017, 3, e1700066. [Google Scholar] [CrossRef] [PubMed] [Green Version]
- Pomatto, L.C.D.; Davies, K.J.A. The role of declining adaptive homeostasis in ageing. J. Physiol. 2017, 595, 7275–7309. [Google Scholar] [CrossRef] [PubMed] [Green Version]
- Ma, W.; Zeng, W.; Zhou, M.; Wang, L.; Rutherford, S.; Lin, H.; Liu, T.; Zhang, Y.; Xiao, J.; Zhang, Y.; et al. The short-term effect of heat waves on mortality and its modifiers in China: An analysis from 66 communities. Environ. Int. 2015, 75, 103–109. [Google Scholar] [CrossRef] [PubMed]
- Scovronick, N.; Sera, F.; Acquaotta, F.; Garzena, D.; Fratianni, S.; Wright, C.Y.; Gasparrini, A. The association between ambient temperature and mortality in South Africa: A time-series analysis. Environ. Res. 2018, 161, 229–235. [Google Scholar] [CrossRef]
- Luber, G.; Prudent, N. Climate change and human health. Trans. Am. Clin. Climatol. Assoc. 2009, 120, 113–117. [Google Scholar]
- Curtis, S.; Fair, A.; Wistow, J.; Val, D.V.; Oven, K. Impact of extreme weather events and climate change for health and social care systems. Environ. Health 2017, 16, 128. [Google Scholar] [CrossRef] [Green Version]
- De Castro Martins Ferreira, L.; Nogueira, M.C.; de Britto Pereira, R.V.; de Farias, W.C.M.; de Souza Rodrigues, M.M.; Teixeira, M.T.B.; Carvalho, M.S. Ambient temperature and mortality due to acute myocardial infarction in Brazil: An ecological study of time-series analyses. Sci. Rep. 2019, 9. [Google Scholar] [CrossRef]
- Gronlund, C.J.; Sullivan, K.P.; Kefelegn, Y.; Cameron, L.; O’Neill, M.S. Climate change and temperature extremes: A review of heat- and cold-related morbidity and mortality concerns of municipalities. Maturitas 2018, 114, 54–59. [Google Scholar] [CrossRef]
- Yang, J.; Hu, L.; Wang, C. Population dynamics modify urban residents’ exposure to extreme temperatures across the United States. Sci. Adv. 2019, 5, eaay3452. [Google Scholar] [CrossRef] [Green Version]
- Achebak, H.; Devolder, D.; Ballester, J. Trends in temperature-related age-specific and sex-specific mortality from cardiovascular diseases in Spain: A national time-series analysis. Lancet Planet. Health 2019, 3, e297–e306. [Google Scholar] [CrossRef] [Green Version]
- Mertz, O.; Halsnæs, K.; Olesen, J.E.; Rasmussen, K. Adaptation to Climate Change in Developing Countries. Environ. Manag. 2009, 43, 743–752. [Google Scholar] [CrossRef] [PubMed] [Green Version]
- Campbell-Lendrum, D.; Corvalán, C. Climate change and developing-country cities: Implications for environmental health and equity. J. Urban Health 2007, 84, i109–i117. [Google Scholar] [CrossRef] [PubMed] [Green Version]
- Yang, J.; Yin, P.; Sun, J.; Wang, B.; Zhou, M.; Li, M.; Tong, S.; Meng, B.; Guo, Y.; Liu, Q. Heatwave and mortality in 31 major Chinese cities: Definition, vulnerability and implications. Sci. Total Environ. 2019, 649, 695–702. [Google Scholar] [CrossRef]
- Gouveia, N.; Hajat, S.; Armstrong, B. Socioeconomic differentials in the temperature–mortality relationship in São Paulo, Brazil. Int. J. Epidemiol. 2003, 32, 390–397. [Google Scholar] [CrossRef] [PubMed] [Green Version]
- Bell, M.L.; O’Neill, M.S.; Ranjit, N.; Borja-Aburto, V.H.; Cifuentes, L.A.; Gouveia, N.C. Vulnerability to heat-related mortality in Latin America: A case-crossover study in Sao Paulo, Brazil, Santiago, Chile and Mexico City, Mexico. Int. J. Epidemiol. 2008, 37, 796–804. [Google Scholar] [CrossRef] [PubMed] [Green Version]
- Son, J.-Y.; Gouveia, N.; Bravo, M.A.; de Freitas, C.U.; Bell, M.L. The impact of temperature on mortality in a subtropical city: Effects of cold, heat, and heat waves in São Paulo, Brazil. Int. J. Biometeorol. 2016, 60, 113–121. [Google Scholar] [CrossRef] [PubMed] [Green Version]
- Gasparrini, A.; Guo, Y.; Hashizume, M.; Lavigne, E.; Zanobetti, A.; Schwartz, J.; Tobias, A.; Tong, S.; Rocklöv, J.; Forsberg, B.; et al. Mortality risk attributable to high and low ambient temperature: A multicountry observational study. Lancet 2015, 386, 369–375. [Google Scholar] [CrossRef]
- Santos, L. Healthcare regions and their care networks: An organizational-systemic model for SUS. Cienc. Saude Colet. 2017, 22, 1281–1289. [Google Scholar] [CrossRef] [Green Version]
- Divo, M.J.; Martinez, C.H.; Mannino, D.M. Ageing and the epidemiology of multimorbidity. Eur. Respir. J. 2014, 44, 1055–1068. [Google Scholar] [CrossRef] [Green Version]
- Nunes, B.P.; Batista, S.R.R.; de Andrade, F.B.; de Souza Junior, P.R.B.; Lima-Costa, M.F.; Facchini, L.A.; Facchini, L.A. Multimorbidity: The Brazilian Longitudinal Study of Aging (ELSI-Brazil). Rev. Saude Publica 2018, 52 (Suppl. 2), 10s. [Google Scholar] [CrossRef] [Green Version]
- Frumkin, H.; Hess, J.; Luber, G.; Malilay, J.; McGeehin, M. Climate change: The public health response. Am. J. Public Health 2008, 98, 435–445. [Google Scholar] [CrossRef] [PubMed]
- Madley-Dowd, P.; Hughes, R.; Tilling, K.; Heron, J. The proportion of missing data should not be used to guide decisions on multiple imputation. J. Clin. Epidemiol. 2019, 110, 63–73. [Google Scholar] [CrossRef] [Green Version]
- de Andrade-Barbosa, T.L.; Xavier-Gomes, L.M.; de Andrade Barbosa, V.; Caldeira, A.P. Mortalidade masculina por causas externas em Minas Gerais, Brasil. Cienc. Saude Colet. 2013, 18, 711–719. [Google Scholar] [CrossRef] [PubMed]
- Gasparrini, A.; Leone, M. Attributable risk from distributed lag models. BMC Med. Res. Methodol. 2014, 14, 55. [Google Scholar] [CrossRef] [PubMed] [Green Version]
- Tobias, A.; Armstrong, B.; Zuza, I.; Gasparrini, A.; Linares, C.; Diaz, J. Mortality on extreme heat days using official thresholds in Spain: A multi-city time series analysis. BMC Public Health 2012, 12, 133. [Google Scholar] [CrossRef] [Green Version]
- Lavigne, E.; Gasparrini, A.; Wang, X.; Chen, H.; Yagouti, A.; Fleury, M.D.; Cakmak, S. Extreme ambient temperatures and cardiorespiratory emergency room visits: Assessing risk by comorbid health conditions in a time series study. Environ. Health 2014, 13, 5. [Google Scholar] [CrossRef] [Green Version]
- Tobías, A.; Armstrong, B.; Gasparrini, A. Investigating uncertainty in the minimum mortality temperature: Methods and application to 52 Spanish cities. Epidemiology 2017, 28, 72–76. [Google Scholar] [CrossRef]
- Gasparrini, A.; Armstrong, B.; Kenward, M.G. Multivariate meta-analysis for non-linear and other multi-parameter associations. Stat. Med. 2012, 31, 3821–3839. [Google Scholar] [CrossRef] [Green Version]
- Gasparrini, A. Distributed lag linear and non-linear models in R: The package DLNM. J. Stat. Softw. 2011, 43, 1–20. [Google Scholar] [CrossRef] [Green Version]
- Lee, W.; Kim, H.; Hwang, S.; Zanobetti, A.; Schwartz, J.D.; Chung, Y. Monte Carlo simulation-based estimation for the minimum mortality temperature in temperature-mortality association study. BMC Med. Res. Methodol. 2017, 17, 137. [Google Scholar] [CrossRef] [Green Version]
- Cox, B.; Gasparrini, A.; Catry, B.; Delcloo, A.; Bijnens, E.; Vangronsveld, J.; Nawrot, T.S. Mortality related to cold and heat. What do we learn from dairy cattle? Environ. Res. 2016, 149, 231–238. [Google Scholar] [CrossRef] [PubMed] [Green Version]
- Gasparrini, A.; Armstrong, B. The impact of heat waves on mortality. Epidemiology 2011, 22, 68–73. [Google Scholar] [CrossRef] [PubMed] [Green Version]
- World Bank. World Development Indicators 2017; World Bank: Washington, DC, USA, 2017. [Google Scholar]
- Silva, I.C.; Restarepo-Mendez, M.C.; Costa, J.C.; Ewerling, F.; Hellwig, F.; Ferreira, L.Z.; Ruas, L.P.; Joseph, G.; Barros, A.J. Mensuração de desigualdades sociais em saúde: Conceitos e abordagens metodológicas no contexto brasileiro. Epidemiol. e Serviços Saúde 2018, 27, e000100017. [Google Scholar] [CrossRef] [PubMed] [Green Version]
- McGregor, G.; Bessemoulin, P.; Ebi, K.; Menne, B. Heatwaves and Health: Guidance on Warning-System Development; World Meteorological Organization, World Health Organization: Geneva, Switzerland, 2013; ISBN 978-0-7695-5111-1. [Google Scholar]
- Lane, K.; Ito, K.; Johnson, S.; Gibson, E.; Tang, A.; Matte, T. Burden and risk factors for cold-related illness and death in New York city. Int. J. Environ. Res. Public Health 2018, 15, 632. [Google Scholar] [CrossRef] [PubMed] [Green Version]
- Lim, J.-S.; Kwon, H.-M.; Kim, S.-E.; Lee, J.; Lee, Y.-S.; Yoon, B.-W. Effects of temperature and pressure on acute stroke incidence assessed using a Korean nationwide insurance database. J. Stroke 2017, 19, 295–303. [Google Scholar] [CrossRef] [Green Version]
- Zhang, Y.; Li, S.; Pan, X.; Tong, S.; Jaakkola, J.J.; Gasparrini, A.; Guo, Y.; Wang, S. The effects of ambient temperature on cerebrovascular mortality: An epidemiologic study in four climatic zones in China. Environ. Health 2014, 13, 24. [Google Scholar] [CrossRef] [Green Version]
- Kim, S.-H.; Jo, S.-N.; Myung, H.-N.; Jang, J.-Y. The effect of pre-existing medical conditions on heat stroke during hot weather in South Korea. Environ. Res. 2014, 133, 246–252. [Google Scholar] [CrossRef]
- Yang, J.; Yin, P.; Zhou, M.; Ou, C.-Q.; Li, M.; Li, J.; Liu, X.; Gao, J.; Liu, Y.; Qin, R.; et al. The burden of stroke mortality attributable to cold and hot ambient temperatures: Epidemiological evidence from China. Environ. Int. 2016, 92–93, 232–238. [Google Scholar] [CrossRef]
- Díaz, J.; Carmona, R.; Mirón, I.J.; Ortiz, C.; Linares, C. Comparison of the effects of extreme temperatures on daily mortality in Madrid (Spain), by age group: The need for a cold wave prevention plan. Environ. Res. 2015, 143, 186–191. [Google Scholar] [CrossRef]
- Green, H.; Bailey, J.; Schwarz, L.; Vanos, J.; Ebi, K.; Benmarhnia, T. Impact of heat on mortality and morbidity in low and middle income countries: A review of the epidemiological evidence and considerations for future research. Environ. Res. 2019, 171, 80–91. [Google Scholar] [CrossRef]
- Esperón-Rodríguez, M.; Bonifacio-Bautista, M.; Barradas, V.L. Socio-economic vulnerability to climate change in the central mountainous region of eastern Mexico. Ambio 2016, 45, 146–160. [Google Scholar] [CrossRef] [PubMed] [Green Version]
- Liu, C.; Yavar, Z.; Sun, Q. Cardiovascular response to thermoregulatory challenges. Am. J. Physiol. Circ. Physiol. 2015, 309, H1793–H1812. [Google Scholar] [CrossRef] [PubMed] [Green Version]
- Huang, C.; Barnett, A.G.; Xu, Z.; Chu, C.; Wang, X.; Turner, L.R.; Tong, S. Managing the health effects of temperature in response to climate change: Challenges ahead. Environ. Health Perspect. 2013, 121, 415–419. [Google Scholar] [CrossRef] [Green Version]
- Gasparrini, A.; Guo, Y.; Sera, F.; Vicedo-Cabrera, A.M.; Huber, V.; Tong, S.; de Sousa Zanotti Stagliorio Coelho, M.; Nascimento Saldiva, P.H.; Lavigne, E.; Matus Correa, P.; et al. Projections of temperature-related excess mortality under climate change scenarios. Lancet Planet. Health 2017, 1, e360–e367. [Google Scholar] [CrossRef]
- Hashim, J.H.; Hashim, Z. Climate change, extreme weather events, and human health implications in the Asia Pacific Region. Asia Pac. J. Public Health 2016, 28, 8S–14S. [Google Scholar] [CrossRef] [PubMed]
- Patz, J.A.; Campbell-Lendrum, D.; Holloway, T.; Foley, J.A. Impact of regional climate change on human health. Nature 2005, 438, 310–317. [Google Scholar] [CrossRef]
- Wang, Y.; Shi, L.; Zanobetti, A.; Schwartz, J.D. Estimating and projecting the effect of cold waves on mortality in 209 US cities. Environ. Int. 2016, 94, 141–149. [Google Scholar] [CrossRef] [Green Version]
- Egondi, T.; Kyobutungi, C.; Rocklöv, J. Temperature variation and heat wave and cold spell impacts on years of life lost among the urban poor population of Nairobi, Kenya. Int. J. Environ. Res. Public Health 2015, 12, 2735–2748. [Google Scholar] [CrossRef]
- Zhang, Y.; Yu, C.; Bao, J.; Li, X. Impact of temperature on mortality in Hubei, China: A multi-county time series analysis. Sci. Rep. 2017, 7, 45093. [Google Scholar] [CrossRef] [Green Version]
- Chan, E.Y.Y.; Goggins, W.B.; Kim, J.J.; Griffiths, S.M. A study of intracity variation of temperature-related mortality and socioeconomic status among the Chinese population in Hong Kong. J. Epidemiol. Community Health 2012, 66, 322–327. [Google Scholar] [CrossRef] [Green Version]
- Ostro, B.; Lipsett, M.; Reynolds, P.; Goldberg, D.; Hertz, A.; Garcia, C.; Henderson, K.D.; Bernstein, L. Long-term exposure to constituents of fine particulate air pollution and mortality: Results from the California Teachers Study. Environ. Health Perspect. 2010, 118, 363–369. [Google Scholar] [CrossRef] [PubMed] [Green Version]
- Bobb, J.F.; Peng, R.D.; Bell, M.L.; Dominici, F. Heat-related mortality and adaptation to heat in the United States. Environ. Health Perspect. 2014, 122, 811–816. [Google Scholar] [CrossRef] [PubMed]
- Michelozzi, P. Temperature and summer mortality: Geographical and temporal variations in four Italian cities. J. Epidemiol. Community Health 2006, 60, 417–423. [Google Scholar] [CrossRef] [PubMed] [Green Version]
- Morabito, M.; Crisci, A.; Moriondo, M.; Profili, F.; Francesconi, P.; Trombi, G.; Bindi, M.; Gensini, G.F.; Orlandini, S. Air temperature-related human health outcomes: Current impact and estimations of future risks in Central Italy. Sci. Total Environ. 2012, 441, 28–40. [Google Scholar] [CrossRef] [PubMed]
- Jiménez-Candil, J.; Díaz-Castro, Ó.; Barrabés, J.A.; García de la Villa, B.; Bodí Peris, V.; López Palop, R.; Fernández-Ortiz, A.; Martínez-Sellés, M. Actualización en cardiopatía isquémica y cuidados críticos cardiológicos. Rev. Española Cardiol. 2013, 66, 198–204. [Google Scholar] [CrossRef]
- Arós, F.; Heras, M.; Vila, J.; Sanz, H.; Ferreira-González, I.; Permanyer-Miralda, G.; Cuñat, J.; López-Bescós, L.; Cabadés, A.; Loma-Osorio, A.; et al. Reducción de la mortalidad precoz y a 6 meses en pacientes con IAM en el periodo 1995-2005. Datos de los registros PRIAMHO I, II y MASCARA. Rev. Española Cardiol. 2011, 64, 972–980. [Google Scholar] [CrossRef]
- Puymirat, E. Association of changes in clinical characteristics and management with improvement in survival among patients with ST-elevation myocardial infarction. Jama 2012, 308, 998. [Google Scholar] [CrossRef]
- Ebi, K.L.; Bowen, K. Extreme events as sources of health vulnerability: Drought as an example. Weather Clim. Extrem. 2016, 11, 95–102. [Google Scholar] [CrossRef] [Green Version]
- Medina-Ramón, M.; Zanobetti, A.; Cavanagh, D.P.; Schwartz, J. Extreme temperatures and mortality: Assessing effect modification by personal characteristics and specific cause of death in a multi-city case-only analysis. Environ. Health Perspect. 2006, 114, 1331–1336. [Google Scholar] [CrossRef]
- Wang, X.; Li, G.; Liu, L.; Westerdahl, D.; Jin, X.; Pan, X. Effects of extreme temperatures on cause-specific cardiovascular mortality in China. Int. J. Environ. Res. Public Health 2015, 12, 16136–16156. [Google Scholar] [CrossRef] [Green Version]
- Zhao, Q.; Li, S.; Coelho, M.S.Z.S.; Saldiva, P.H.N.; Hu, K.; Huxley, R.R.; Abramson, M.J.; Guo, Y. The association between heatwaves and risk of hospitalization in Brazil: A nationwide time series study between 2000 and 2015. PLoS Med. 2019, 16. [Google Scholar] [CrossRef] [PubMed] [Green Version]
- Xiao, J.; Spicer, T.; Jian, L.; Yun, G.Y.; Shao, C.; Nairn, J.; Fawcett, R.J.B.; Robertson, A.; Weeramanthri, T.S. Variation in population vulnerability to heat wave in Western Australia. Front. Public Health 2017, 5, 64. [Google Scholar] [CrossRef] [PubMed] [Green Version]
- Bi, P.; Williams, S.; Loughnan, M.; Lloyd, G.; Hansen, A.; Kjellstrom, T.; Dear, K.; Saniotis, A. The effects of extreme heat on human mortality and morbidity in Australia: Implications for public health. Asia Pac. J. Public Health 2011, 23, 27S–36S. [Google Scholar] [CrossRef] [PubMed]
- Arbuthnott, K.; Hajat, S.; Heaviside, C.; Vardoulakis, S. Changes in population susceptibility to heat and cold over time: Assessing adaptation to climate change. Environ. Health 2016, 15, S33. [Google Scholar] [CrossRef] [PubMed] [Green Version]
Figure 1.
Geographic distribution of the case study health regions.

Figure 2.
Daily variation of maximum (Tmax, red), mean (Tmean, black) and minimum temperatures (Tmin, blue) for the health regions of Florianópolis/SC and Recife/PE for the years 2005 to 2014.
Figure 2.
Daily variation of maximum (Tmax, red), mean (Tmean, black) and minimum temperatures (Tmin, blue) for the health regions of Florianópolis/SC and Recife/PE for the years 2005 to 2014.

Figure 3.
Grouped results for exposure-response curves for daily deaths by non-accidental mortality (ICD-10: A00-R99), groups ICD-10 diseases of the circulatory system and respiratory system (ICD-10: Groups I and J), diseases of cerebrovascular (I60-69), diseases of cardiovascular (I20-25), and histograms with the air temperature distribution for the health region of Florianopolis between the years 2005 to 2014. The red line represents values below the MMT and the blue line represents values above the MMT.

Figure 4.
Grouped results for exposure-response curves for daily deaths by non-accidental mortality (ICD-10: A00-R99), groups ICD-10 diseases of the circulatory system and respiratory system (ICD-10: Groups I and J), diseases of cerebrovascular (I60-69), diseases of cardiovascular (I20-25), and histograms with the air temperature distribution for the health region of Recife between the years 2005 to 2014. The red line represents values below the MMT and the blue line represents values above the MMT.


Table 1.
Statistical analysis (mean, minimum, maximum, and standard deviation (SD)) of the mean (TMean.), maximum (TMax.), and minimum (TMin.) temperatures for the health regions of Florianópolis, SC and Recife, PE between the years 2005–2014.
Table 1.
Statistical analysis (mean, minimum, maximum, and standard deviation (SD)) of the mean (TMean.), maximum (TMax.), and minimum (TMin.) temperatures for the health regions of Florianópolis, SC and Recife, PE between the years 2005–2014.
| Health Regions | Temp. (°C) | STATISTIC | |||
|---|---|---|---|---|---|
| TMean (°C) | TMin. (°C) | TMax (°C) | SD | ||
| Florianopolis | TMax. | 24.28 | 9.49 | 39.5 | 4.23 |
| TMin. | 17.06 | 1.05 | 28.28 | 4.30 | |
| TMean. | 21.01 | 7.74 | 33.25 | 3.87 | |
| Recife | TMax. | 29.76 | 23.5 | 34.7 | 1.56 |
| TMin. | 22.35 | 17 | 27.5 | 1.45 | |
| TMean. | 26.00 | 21.98 | 29.06 | 1.36 | |
Table 2.
The number of deaths attributed to high and low temperatures by cause of death, minimum mortality temperature (MMT), and relative risks at select temperature percentiles (1% and 99%) compared to the MMT.
Table 2.
The number of deaths attributed to high and low temperatures by cause of death, minimum mortality temperature (MMT), and relative risks at select temperature percentiles (1% and 99%) compared to the MMT.
| TIPO/CAUSE GROUP | DEATHS A | DEATHS B | RELATIVE RISK (95% CI) | |||||
|---|---|---|---|---|---|---|---|---|
| Total | % | MMT C (°C) | % Cold | % Heat | 1st Perc. | 99th Perc. | ||
| FLORIANÓPOLIS | NON-ACCIDENTAL MORTALITY | 2.490 | 5.80 | 21.4 | 2.40 | 3.40 | 1.20 (0.97–1.49) | 1.41 (1.14–1.76) |
| RESPIRATORY AND CIRCULATORY | 1853 | 8.90 | 23.7 | 8.03 | 0.91 | 1.53 (1.11–2.20) | 1.16 (0.87–1.54) | |
| CEREBROVASCULAR | 780 | 23.30 | 24 | 20.94 | 2.37 | 2.20 (0.98–4.95) | 1.55 (0.80–2.99) | |
| CARDIOVASCULAR | 602 | 8.70 | 18.1 | 1.20 | 7.50 | 1.32 (0.79–2.20) | 1.41 (0.74–2.66) | |
| RECIFE | NON-ACCIDENTAL MORTALITY | 3773 | 1.8 | 26.8 | 1.53 | 0.16 | 1.10 (1.00–1.22) | 1.02 (0.94–1.10) |
| RESPIRATORY AND CIRCULATORY | 2470 | 3.30 | 27 | 2.95 | 0.18 | 1.19 (1.01–1.41) | 1.02 (0.91–1.17) | |
| CEREBROVASCULAR | 1289 | 5.57 | 26 | 2.96 | 2.42 | 1.38 (1.03–1.84) | 1.20 (0.93–1.54) | |
| CARDIOVASCULAR | 2319 | 8.08 | 26.9 | 7.15 | 0.97 | 1.17 (0.89–1.55) | 1.14 (0.92–1.42) | |
A Deaths attributed to temperature, B % of deaths attributed to temperature C Minimum Mortality Temperature.
© 2020 by the authors. Licensee MDPI, Basel, Switzerland. This article is an open access article distributed under the terms and conditions of the Creative Commons Attribution (CC BY) license (http://creativecommons.org/licenses/by/4.0/).
Share and Cite
MDPI and ACS Style
Péres, W.E.; Ribeiro, A.F.S.; Russo, A.; Nunes, B. The Association between Air Temperature and Mortality in Two Brazilian Health Regions. Climate 2020, 8, 16. https://0-doi-org.brum.beds.ac.uk/10.3390/cli8010016
AMA Style
Péres WE, Ribeiro AFS, Russo A, Nunes B. The Association between Air Temperature and Mortality in Two Brazilian Health Regions. Climate. 2020; 8(1):16. https://0-doi-org.brum.beds.ac.uk/10.3390/cli8010016
Chicago/Turabian StylePéres, Wolmir Ercides, Andreia F. S. Ribeiro, Ana Russo, and Baltazar Nunes. 2020. "The Association between Air Temperature and Mortality in Two Brazilian Health Regions" Climate 8, no. 1: 16. https://0-doi-org.brum.beds.ac.uk/10.3390/cli8010016
Note that from the first issue of 2016, this journal uses article numbers instead of page numbers. See further details here.