Assessing the Adaptive Capacity of Households to Climate Change in the Central Rift Valley of Ethiopia


1
Department of Environmental Science, College of Forestry and Natural Resources, Hawassa University, P.O. Box 05, Hawassa, Ethiopia
2
Center for Environment and Development, College of Development Studies, Addis Ababa University, P.O. Box 56649, Addis Ababa, Ethiopia
3
Department of Natural Resource Economics and Policy, College of Forestry and Natural Resources, Hawassa University, P.O. Box 05, Hawassa, Ethiopia
4
CGIAR Research Program on Climate Change, Agriculture, and Food Security (CCAFS), International Livestock Research Institute (ILRI), P.O. Box 30709-00100, Nairobi, Kenya
5
Institute of Plant Science and Microbiology, Hamburg University, Ohnhorststr. 18, 22609 Hamburg, Germany
*
Author to whom correspondence should be addressed.
Climate 2020, 8(10), 106; https://0-doi-org.brum.beds.ac.uk/10.3390/cli8100106
Submission received: 7 August 2020
/
Revised: 9 September 2020
/
Accepted: 11 September 2020
/
Published: 29 September 2020
Abstract
:This paper explores the different components of the adaptive capacity of households in the Central Rift Valley (CRV) of Ethiopia and quantifies their relative contributions. The data were derived from a survey of 413 households randomly selected from four Kebeles (the smallest government administrative units) in the CRV. The adaptive capacity of the households was assessed using the Local Adaptive Capacity (LAC) framework and measured in terms of both aggregate and composite indices, with sixty indicators distributed across five major components and subcomponents. The index score for major components shows that intangible variables such as institutions and entitlements, knowledge and information, and innovation contributed to adaptive capacity better than decision–making and governance and asset–base. The composite indices for sub–components showed that the contribution of woodlands to adaptive capacity was positive and superior to other natural assets. Grazing land was the next best contributor, while farmland and water resources made a much lower contribution. The findings of this study are useful to better understand the nature of adaptive capacity and its components at the household level. This study suggests the need for an integrated assessment and enhancement of adaptive capacity with all its components rather than focusing only on asset possession as an indicator of adaptive capacity.
1. Introduction
The ability to adapt to social and environmental change is central to human wellbeing. Indeed, adaptation to environmental change has been part of human experience throughout history [1,2,3,4]. Nevertheless, the scope of challenges posed by environmental disturbances is now unprecedented, and more measures are needed to reduce the adverse impacts of the changes in the near and long–term [5,6,7].
Increasing awareness and a growing concern about the impacts of climate change has led to a rise of scholarly interest in climate change issues, particularly since the first report of the Intergovernmental Panel on Climate Change (IPCC) was published in 1990. The focus of earlier responses to climate change was on mitigation rather than adaptation [3,6,8]. Initially, the scientific research necessary for encouraging climate change adaptation had been largely disregarded [9].
However, with some degree of climate change now recognized as inevitable even under the most stringent mitigation scenarios, research and policy debate on adaptation have emerged in recent years [6,7,10]. The concept of adaptation is closely associated with the concepts of vulnerability and adaptive capacity [11,12,13]. Adaptation is a manifestation of adaptive capacity that is inherent in a system and represents ways of reducing vulnerability [12,14,15]. Consequently, the success or failure of adaptation is determined by the system’s adaptive capacity, which describes the ability of a system to mobilize resources to prepare for and respond to current or perceived stresses. The capacity to adapt is, therefore, a critical element of adaptation [7,12,15,16].
Conversely, adaptive capacity is a latent property of an individual, community, or social–ecological system and is activated in response to a crisis or opportunity [15]. It is, therefore, necessary to understand, assess, and increase the individual’s or community’s adaptive capacity to facilitate adaptive action and moderate the effects of climate change [13,17,18].
Despite recent attempts to conceptualize and evaluate adaptive capacity at various levels, efforts to assess adaptive capacity are in their relative infancy [2,15,17,19]. Little research and analysis have been done on adaptive capacity particularly at the household level, despite influential decisions affecting local and system vulnerability being made at this level [17,20]. Most studies are either macro in scope or regional level and hence they cannot capture the unique nature of local–level adaptation as well as hindrances to adaptation. Magnan [21] observes that there is a little understanding of adaptive capacity at the household level. Scientific knowledge, especially on the dimensions of adaptive capacity, is not sufficiently developed [19,20,21]. Likewise, there are only a few frameworks available for studying the processes and determinants of adaptive capacity in detail at the local level [17,21].
This study, therefore, addresses the above–mentioned research gaps by assessing the adaptive capacity at the household level and the factors that contribute to the adaptive capacity. Specifically, this paper identifies the different components and quantifies their relative contributions to adaptive capacity in four selected sites of the Central Rift Valley (CRV) of Ethiopia, which is one of the most vulnerable geographical areas to climate change in the country.
2. Material and Methods
2.1. The Study Area
2.1.1. Location
The study was conducted in the Arsi Negelle district of the West Arsi Zone of the CRV of Ethiopia from March to June 2015 (Figure 1) [22,23]. The altitude varies from 1560 m a. s. l. at the Lake Shalla shoreline to 2061 m a. s. l. at the peak of Mount Fiqe, which is found between Lake Abijata and Lake Shalla.
2.1.2. Climate
The study area is characterized by a semi–arid climate [24,25], and experiences the annual movement of the Intertropical Convergence Zone (ITCZ) within the Ethiopian section of the East African rift valley [24,26]. The climate of Ethiopia is controlled by the seasonal migration of the ITCZ and its associated atmospheric circulations as well as by the complex physical geography and the differences in the elevation of the different parts of the country [27]. Altitude plays a significant role in Ethiopia’s climate, translating to less rain and warmer temperatures in the lowlands and more rain and cooler temperatures in the highlands [27,28,29,30,31,32]. The study area has seasonal rainfall distribution and hence alternating wet and dry seasons during the summer and winter periods, respectively. It has a bimodal rainfall pattern with the main rainy season, locally termed as Kiremt, starting from June and extending up to September followed by a long dry season (Bega) that stretches from October to January, and then the short rainy season (Belg) starts from February and extends up to May.
The mean annual evapotranspiration rate of 1700 mm [33] and the 40% coefficient of variability in rainfall are high, further exacerbating the erratic and often well–below long–term average precipitation, making crop production a challenge [30,32,34]. Recurrent drought associated with low rainfall is posing climate–related challenges [34] in the Arsi Negelle district.
2.1.3. Geomorphology, Geology, Soils, and Vegetation
The study area is part of the central region of the Main Ethiopian Rift (MER) and makes up the northernmost part of the Great East African Rift Valley [26,35,36,37]. This study focuses on the CRV, the main portion of the MER. The CRV in the MER consists of four major hydrologically interconnected lakes: Ziway, Langano, Abijata, and Shalla [25,38,39]. Three lakes—Langano, Abijata, and Shalla—are close to each other, while Lake Ziway is relatively far and separated from its nearest lake, Langano, by a dormant volcanic mountain range [40].
The geological setting of the MER involves the volcanization, rifting, fluctuation of Quaternary lake levels, and deposition of fluvial and volcano–lacustrine sediments [41]. The central sector of the MER and its flanks are made up of Tertiary to Quaternary volcanites and pyroclastic rocks. Most of the rift floor is covered by upper Quaternary volcano–lacustrine, lacustrine, fluvio–lacustrine, and colluvial deposits [24,26,42]. The study site, in particular, is covered by volcanic and volcaniclastic rocks, such as Plio–Pleistocene Rhyolitic ignimbrites, basalts, and lava flows, and sedimentary deposits, including early–mid and late Holocene fluvio–lacustrine palustrine and upper Pleistocene–Holocene colluvial and alluvial deposits [24,38].
The major soil type of the study area is classified as Andosol [43,44]. In some places, these soils are found mixed with Vertisols forming Vitric Andosols and the clay content tends to increase with distance from the lakes [43]. The soils are characterized by low bulk density and weaker structure, making them vulnerable to wind, water erosion [44] and drought [33]. The soils are also susceptible to surface capping once the protective cover of the Acacia woodlands has been removed [34,45]. Furthermore, the soils are less fertile with low levels of organic matter, moderate moisture retention capacity, and deficiencies in plant nutrients, particularly phosphorus [40,46].
The area is characterized by the open Acacia woodland vegetation. The dominant Acacia species are Acacia tortilis, Acacia senegal, and Acacia seyal, respectively. Mesfin et al. [23] provide a detailed description of the natural vegetation of the study area.
2.1.4. Livelihood and Farming Systems
Livestock keeping is the most common source of livelihood, although subsistence crop production is progressively expanding. The major livestock types are cattle and goats raised on the free–range grazing system. The major crops grown in the area include maize (Zea mays), teff (Eragrostis tef), sorghum (Sorghum vulgare), and haricot beans (Phaseolus vulgaris). Crop production is primarily rain–fed and hence sensitive to drought and rainfall variability. The most common coping strategies used by farmers in times of hardship are selling livestock and charcoal. Wood extraction from woodlands, either for charcoal production or fuel, has contributed to the degradation of the once dense acacia woodlands of the area. Productive Safety Net Programs (PSNPs) and drought relief are also common in the area as it often experiences recurrent drought.
2.2. Conceptual Framework of the Study
Several studies, geared towards understanding adaptive capacity, have explored the IPCC’s categorization of the determinants of adaptive capacity. These categories are economic resources, technology, information and skills, infrastructure, institutions, and equity [47]. The IPCC report identified adaptive capacity as a component of vulnerability. However, no distinction was made between the determinants at the national and local levels. Appropriate determinants and indicators must be tailored to each case [13]. National–level indicators generally fail to capture many of the processes and contextual factors that influence adaptive capacity at the local level [48]. It is not possible to apply a national–level index into a smaller scale of analysis [19]. Smit and Wandel [12], for instance, reported that the conditions that interact to shape adaptive capacities, and hence create opportunities for adaptation, are community–specific.
Besides, the indicators enumerated in most studies are generally based on assets and resources that reflect the sustainable livelihood framework [14,20,49,50]. The ‘function–based approach’ followed by the World Resources Institute [51] and the outcome–based approaches reported by Siders [52] are notable exceptions. While asset–based approaches are useful in helping us to understand the resources at the disposal of a system to cope with and adapt to changing environments, they typically mask the role of processes and functions in supporting adaptive capacity [17,20,53]. The various intangible processes, which are far harder to measure, play an integral part in determining the ability of a system to adapt to shocks and stresses [17]. Recent assessments also argue that the underlying social and institutional factors such as social capital and governance that create capacity have been underplayed in earlier studies [20,53,54]. This entails the need to move away from simply looking at what a system has, to recognizing what it does to enable it to adapt [51]. Thus, several scholars have defined and treated adaptive capacity differently since the Third Assessment Report (TAR) of the IPCC and have subsequently expanded on and redefined the initial characterization [15,52,53,55].
We adapted a conceptual framework based on Jones et al. [17] who developed the Local Adaptive Capacity (LAC) framework to better understand adaptive capacity at the local level. The framework envisages that adaptation response to counteract the adverse impacts of climate change and exploit opportunities depends on the capacity to adapt. The capacity to adapt at the local level, in turn, depends on asset base, innovation, knowledge and information, institutions and entitlements, and flexible and forward–thinking decision–making and governance. We conceptualized that these components form an integrated and systematic part of the adaptive capacity of households, determining the degree to which a community or a household is resilient and responsive to climate–related changes [17]. The components can be related to each other across a range of spatial and temporal scales and the processes that shape them are very much interdependent [17,56]. One component can facilitate, strengthen, or hinder the contribution of the other. For example, Jones et al. [17] highlighted that accurate and applicable knowledge and information facilitate flexible forward–looking decision–making while effective and supportive institutions mediate access to and control of assets and drive successful innovation. Nevertheless, each component serves a very important and distinct role in enhancing the adaptive capacity of rural households to climate–related hazards.
The conceptual framework goes beyond asset–based approaches to adaptive capacity. Here, assets are considered as a major component of adaptive capacity. The five assets include human, physical, natural, financial, and social. Figure 2 provides a pictorial representation of the conceptual framework, emphasizing the different components addressed in this study.
2.3. Sampling Design and Sampling Procedure
This research covered a wide range of issues from socioeconomic to biophysical aspects and needed both quantitative and qualitative data. We adopted a convergent parallel mixed–methods design, where both quantitative and qualitative data are collected at about the same time and converged to provide a comprehensive analysis of the problem.
The survey followed a multistage sampling procedure. The first stage involved the selection of the study site. The study site in the CRV was purposely selected because it is one of the most vulnerable areas to climate change and variability in Ethiopia [30,32,57,58]. Other reasons for the selection that included it being an environmentally fragile ecosystem typical of a rapidly changing landscape and having undergone deforestation over the years are given in Mesfin et al. [23]. The second stage involved the selection of the Kebeles (the smallest government administrative units) in the study area. This study area covers 416 km2 and 12 Kebeles. Four representative Kebeles, namely, Dakka Hore Qello, Shalla Billa, Keraru, and Gale Qello, were purposely selected for the household survey. The final stage was the selection of the desired number of households from the respective Kebeles. Before selecting sample households, the list of households in each Kebele was revised and updated to form a sampling frame. Then, the sample size was determined using the following equation adapted from Watson [59].
where, n is the sample size required, N is the total number of households, p is estimated variance in population as a decimal (0.5 for 50–50), e is precision desired, expressed as a decimal (0.05 for 5%), Z is the value of the statistic based on the confidence level (1.96 for 95% confidence), and R is estimated response rate, as a decimal (0.8 in this survey).
The equation provided a sample size of 414 households selected from a sampling frame of 2380 households. The sample size was then increased to 420 to compensate for more nonresponses and/or incomplete information. We managed to reach 413 households in the survey (17.4% of the total households). Samples were proportionally allocated to the number of households per Kebele. Households in each Kebele were given numbers and samples were selected randomly with the help of the “Randbetween” function in Microsoft Excel. The function was used instead of manually drawing lots as it simplifies the selection process by drawing numbers randomly from a range of numbers given to households in each Kebele. The random selection of samples was done due to the assumption that households within the Kebele exhibit similar characteristics concerning their adaptive capacity to the changing climate. Accordingly, 101, 125, 118, and 69 households were selected from Dakka Hore Qello, Shalla Billa, Keraru, and Gale Qello, respectively.
2.4. Data Collection and Analysis
A questionnaire was administered through face–to–face interviews. It had been developed in such a way that it gathered information on the different components of adaptive capacity.
2.4.1. Analysis of Dimensions and Indicators of Adaptive Capacity
The five livelihood assets i.e., natural, physical, financial, human, and social assets form an integral part of adaptive capacity in the existing literature [19,20,49,50]. However, assessments based only on livelihood assets have been criticized for their failure to capture the important contextual information [60] and the underlying social and institutional processes that create capacity [20]. This study included four other dimensions in addition to the livelihood assets, as depicted in the conceptual framework (Figure 2).
Relevant indicators have been included to assess each dimension and provide a more complete picture of adaptive capacity at the local level. Sixty representative indicators distributed across five major components and associated subcomponents were used (Table 1).
The indicators are not necessarily specific to climate–related hazards only but also relevant in addressing other challenges such as food insecurity. In a nutshell, they do assist the households to build their capacity and overcome the impacts of climate–related hazards through either risk pooling and distribution or as a buffer during extreme climatic conditions. A detailed description of how each of the components was interpreted against the framework and the relevance of each indicator in enhancing the adaptive capacity of households in the face of a changing climate is provided in the sections below.
Asset Base
The capacity of households to cope with and respond to changes in climate depends heavily on access to, and control over, key assets [49]. The asset base is considered as one of the five major dimensions of adaptive capacity. Availability and access to these assets will allow the system to respond to evolving circumstances. The indicators used to measure each asset type and their descriptions are presented below.
- (i)
- Natural Assets
The natural asset is represented by four sub–components: farmland, grazing land, woodland, and water resources. The productivity of farmland rather than mere size is used as an indicator of farmland assets as it implies crop productivity for the households. A higher share of more productive farmland means the production of more food and ultimately better adaptive capacity. Thus, households having a higher share of productive farmland compared to those possessing a higher share of less productive farmland will suffer less from climate–related hazards.
Livestock is another important asset in the area. Availability and access to grazing land are therefore important aspects considered in the analysis. Grassland and wooded grassland are considered grazing lands although savannah woodlands are also used for grazing. This is intentionally done to avoid duplication whereby assets considered as woodlands are treated separately. Similarly, access to woodlands and the size of woodland owned were considered in the analysis as the lives of the local people are intimately associated with woodlands. Lastly, water is a critical resource in the study area both for domestic consumption and agriculture. Hence, access to water resources and the quality of water for household use is assessed as one of the important natural assets.
- (ii)
- Physical Assets
Indicators for the physical assets include the type of house, ownership of mobile phone and radio, access to electricity, agricultural tools, walking distance to the nearest road, and irrigated land. Possession of a better–quality house, besides being used as an indicator of socioeconomic status, will improve the capacity of households to withstand the risks from extreme climate conditions. Ownership of mobile phones and radio increases adaptive capacity by creating access to the market, weather, and climate–related information. Access to electricity, among many other benefits, allows better functioning of radios and mobile phones, thereby improving access to information relevant for the livelihoods of households. Better information will enable households to make informed decisions, particularly on their farming activities and to take proactive adaptation measures against climate–related risks.
Distance to the nearest road is associated with many other services such as extension service and a market for livestock, crops, and other commodities. For example, households living far from the main road or market centers will find it difficult to sell livestock and they often compromise the price because of the distance factor. They also have less chance of generating income from alternative sources such as non–farm labor, which is important in securing livelihood, particularly during periods of crop failure or drought. Additionally, such households have poor access to extension service and agricultural inputs such as fertilizer and improved seed. Greater distance from main roads also means limited travel and hence limited access to information as marketplaces are also informal gathering places for information exchange. Hence, walking distance from the main road is assumed to be inversely related to the adaptive capacity of households because far distances will put them in a disadvantageous position. Higher possession of agricultural tools is associated with more secured and higher agricultural production. Likewise, a bigger share of irrigated land means more secured production and lesser dependence on natural rain, which is becoming more unreliable with climate change.
- (iii)
- Financial Assets
Indicators of financial assets include gross annual income per capita, livelihood diversification index, remunerative income sources, household savings, loans received, and ownership of livestock. Gross annual income is derived from both cash and non–cash income sources. Higher gross annual income per capita implies greater availability of resources at disposal to overcome adversities and make a better living. Along with the amount of annual income, it is imperative to consider the sources from which these incomes are derived because some economic activities are more sensitive to climate–related events such as drought or shortage of rain. For example, if much of the income is derived from only farming activities, then annual income will be adversely affected during unfavorable years. Conversely, if income is derived from many sources, then the risk will be distributed among the sources and allow households to benefit from the diverse economic activities when needed. This aspect of income is captured by constructing the Livelihood Diversification Index (LDI). Higher LDI means more options to switch from one activity to another and adapt better to the challenges posed by climate change. The Herfindahl index of diversification is used to calculate the LDI of households using the following formulae [61].
where Dk is the diversification index, i is the specific livelihood activity, N is the total number of activities being considered, k is the particular household, and Si,k is the share of ith activity to the household income for the kth household.
LDI indicates how diversified the livelihood sources are. However, it does not elucidate the nature of diversification, i.e., whether the diversification is within farming activities or goes far beyond farming (non–farming activities). For example, households whose income sources depend more on natural resource–related activities such as agriculture and livestock will bear the greater risk to climate vagaries compared to those who depend on salaried jobs as one of their income sources.
Therefore, remunerative income sources that include salaried jobs, skilled non–farm jobs, remittance, and safety net transfers were considered as one of the indicators of the financial asset. Incomes from these sources are less affected by climate change and hence improve the capacity to adapt to climate risks. Besides income at disposal, savings and loans obtained from various sources can be used to make productive investments that in turn are important to build their adaptive capacity in the long run and use it as a buffer during times of need. For households in the CRV, livestock is an important source of cash income. They keep them as a buffer to sell during times of stress, to generate income to make productive investments, or to pay back loans. Thus, available livestock is converted into Tropical Livestock Units (TLUs) and considered as one of the financial assets.
- (iv)
- Human Assets
The highest educational qualification in the household, the number of training events attended by household members, the health status of the household, and the dependency ratio represented the human assets. While health status directly influences the productivity of households, formal education and training sharpen up their thinking and skill to be more creative and get involved in different activities including non–farming activities, which are less sensitive to climate risks. This enables them to diversify their livelihood portfolios and increase their income, which in turn is important to buffer and avert climate risks. The dependency ratio implies the available productive labor force in the household. A higher ratio implies more burdens on the earning members, thereby reducing their capacity to adapt to the impacts of climate change and vice versa.
- (v)
- Social Assets
Indicators for the social assets are considered to represent both structural (organizational density, networks, and mutual support organizations, exclusion, and previous collective action) and cognitive (solidarity, trust and cooperation, and conflict resolution) assets. As a result, a total of ten indicators were identified. These include the membership size of community–based organizations (CBOs), presence of networks and mutual support organizations that organize work together in dealing with problems affecting their village, access to credit through social contacts, presence of exclusion if any, the number of collective actions taken to address a common issue during the past year, getting support from the community when needed (when suffering from shocks or stresses), trust among one another in matters of borrowing and lending, looking out for the welfare of one another, tradition of cooperation in farming activities, and the presence of people or institutions resolving the dispute.
An overall positive outcome from these indicators improves the adaptive capacity of households. For example, the membership size in CBOs improves household social networks and access to information through their contacts with different stakeholders during meetings. There are also public wells, public stand–pipe waters, and communal woodlands managed jointly by the members of the CBOs who can pool resources across the households in the community. Access to credit through social contacts helps households cope with seasonal food shortages or make some productive investments. The credit could be either in kind or in cash or both. It is often repaid by selling livestock, woodland products, or crop products. It is important in rural areas where formal credit and saving institutions are not easily accessible. So, better access to credit implies better adaptive capacity. Other indicators of the social asset will also have a similar impact on adaptive capacity.
In the aggregate, as Woolcock and Narayan [62] stated, the common aphorism "it’s not what you know, it’s who you know" sums up much of the conventional wisdom regarding social capital and its role in adaptive capacity. It is wisdom born of experience that when people encounter difficult times, they are aware it is other people whom they know well and are close to (friends, families, neighbors, and associates) that constitute the final safety net to rescue them. Intuitively, social capital constitutes an important asset that can be relied upon during adversities, enjoyed for its own sake, and leveraged for material gain [62].
Institutions and Entitlements
The existence of an appropriate and evolving institutional environment that ensures fair and equitable access, as well as entitlement to key resources and assets, is a fundamental feature of adaptive capacity. Access to and control of assets is mediated mainly through local institutions and entitlements, or claims [17]. Therefore, the presence of local institutions and informal organizations that ensures equitable access and entitlement to key resources, active participation in the decision–making process, empowerment, and voice to generate opportunities as a basis for adaptation are key elements of the characteristic. There were a number of considerations to capture these aspects of the dimension. They include the number of the most important formal and informal local organizations that the livelihood of the household depends on, the number of local institutions relied upon during times of climate hazard, equitable access provided by local institutions in times of climate hazard, regulation of access to key resources, the fairness of access to key resources, dependence on outside support from local institutions, and the existence of restraining local rules and norms from undergoing adaptation strategies.
Knowledge and Information
For households to properly respond to climate–related changes, they need to have the necessary knowledge and information. The ability of a system to collect, analyze, and disseminate knowledge and information in support of adaptation activities is, therefore, an important feature of adaptive capacity. Thus, knowledge and information on adaptation strategies, adequacy of knowledge and information, and availability of systems for data gathering, information analysis, and dissemination about climate–related hazards relevant to the area were assessed.
Innovation
The system’s ability to foster innovation, support new practices, and take risks is a key characteristic of adaptive capacity. An enabling environment that fosters innovations, experimentation, and the ability to explore niche solutions to take advantage of new opportunities is essential to enhance adaptive capacity. Therefore, adoption of new practices, taking risks and exploiting new opportunities, ability and willingness to adapt, and access to new and improved technology, were pulled together to assess the innovative ideas and practices of households.
Flexible and Forward–Looking Decision–Making and Governance
The anticipation, incorporation and response to changes with regards to governance structures and future planning are important aspects of adaptive capacity. Accordingly, informed decision–making, transparency, and prioritization each form key elements of adaptive capacity at the local level. Ten indicators were identified to capture all these aspects of decision–making and governance. These include formal organizations’ access to relevant climate–related information in guiding policy and decision–making, their capacity to deal with climate–related challenges, provision of support to households to adapt to any observed changes in climate, developing plans to help households deal with the changes, learning from experience in making decisions, taking the right measures, flexibility in decision–making processes in responding to new threats posed by climate–related changes, systems for reviewing and adjusting priorities, transparency in decision–making, and availability and implementation of regulations to protect natural resources and enhance their contributions to the livelihood of households.
2.4.2. Measuring Adaptive Capacity
While identifying the resources underlying adaptive capacity is relatively straightforward, devising measurements or indicators for their variables is a major challenge [16,19]. Although controversial, one popular tool for empirically assessing adaptive capacity is the construction of indices [19]. Indicators and indices are useful for encapsulating a complex reality into simple terms and allowing comparisons across space and/or time [63]. Doing so requires that the individual indicators for each determinant are aggregated to a determinant value and then the determinant values are aggregated into an overall index of adaptive capacity. The main hurdle in this exercise, however, is that each indicator that makes up the determinant has disparate units. These values need to be normalized to make valid comparisons [63,64,65,66].
There are many ways for normalizing values of disparate units including the one used by the United Nations Development Program (UNDP) to annually report the Human Development Index [63,64], albeit normalization is often done by subtracting the mean from the observed value and dividing by standard deviation for each indicator using the following Equation (3):
Constructing the adaptive capacity index requires that weights be assigned to each indicator, which is mainly done in three different ways: equal weighting, expert judgment, and Principal Component Analysis (PCA) [19,67]. Some researchers follow equal weighting [63,68,69], i.e., each indicator within a determinant is considered to be of equal importance. However, this method of assigning weights may be too arbitrary and lead to either overweighting of some less important indicators or underweighting of the more important ones.
Assigning weights can also be done based on expert judgment [7,19], though this approach is often criticized for being too subjective. It is also constrained by the availability of subject matter specialists or lack of consensus among the experts conducting the analysis [65]. Lately, following Filmer and Pritchett [70], many researchers preferred to use PCA to assign weights [65,66,67,71]. However, this approach is also not free of critiques, with the primary one being that it breaks down every category into dummy variables and the use of these dummy variables in the PCA is not justified, as PCA “as is” is only suitable for continuous data [72]. Moreover, it is found to be inferior to other methods for analyzing discrete data.
Hence, this study, in addition to the normal PCA, which was used whenever it was found appropriate, used a variant of PCA techniques such as Polychoric PCA and Factor Analysis for Mixed Data (FAMD) to handle the vexing problem of assigning appropriate weights to the indicators of adaptive capacity. PCA is one of the oldest and popular statistical methods in multivariate data analysis used to aggregate several indicators into a single measure [72]. It was introduced in the early 20th century for aggregating data [73,74]. Initially, it was designed to reduce the dimension of multivariate continuous data, which follows a multivariate normal probability distribution. However, since its application in social science in recent years (such as generating the index and assigning weights for different variables, which are often designed to measure latent variables), different approaches have been proposed, as most of the social science data are mixed, i.e., they are composed of both categorical and continuous variables.
One of the approaches is changing the categorical variables into dummy variables and treating the data as normal data and running PCA, as used by Filmer and Pritchett [70]. The method was quickly accepted and used by the World Bank as a vital means of assessing the socio–economic status of a household based on their assets such as electricity, radio, television, telephone, refrigerator, bicycle, motorcycle, car, and facilities such as the source of drinking water, source of heat for cooking, toilet type, materials used for flooring, walls, and roofing [75].
However, the Filmer and Pritchett [70] method has challenges regarding the technicality behind PCA when the variable has more than two factors, i.e., more than one dummy variable per categorical factor is created. This introduces a lot of spurious correlations, i.e., the dummy variables created from the same variable are negatively correlated although the strength of the dependency declines with the number of categories. While PCA is suitable for this kind of data, there is a debate on whether the main source of common variation is due to the correlation with the variables or due to the correlation among the variables that are created based on the same categorical variable. Moreover, it loses all of the ordinal information, if there were any [72].
The second approach involves using either polychoric correlation coefficients or the specific scaling of Factorial Analysis for Mixed Data (FAMD) to assign weights. The polychoric correlation coefficient is a measure of association for ordinal variables, which rests upon an assumption of an underlying joint continuous distribution. It was first proposed by Karl Pearson in 1900 [76] and although its computation was complicated, it is gaining importance in recent years with the application of software programs.
This study used a polychoric correlation coefficient when all variables were ordinal. The correlation matrix was then used to fit the PCA. When the data were mixed (quantitative and qualitative), there were two cases. The first case was when the categorical variables in the mixed dataset were dummy variables, the usual PCA was fitted. The second case was when the categorical variables in the mixed dataset were not dummy variables, the categorical variables were transformed into a disjunctive data table through a system called crisp coding and then scaled using the specific scaling of Factorial Analysis for Mixed Data (FAMD). The analysis was done using the psych, FactoMineR, and missMDA packages of the R programming language. Since the first principal component always explains much of the variation, our first principal component was used for index generation.
Accordingly, the index for asset base was produced based on the respective weights of natural, financial, physical, human, and social assets. The index for the natural asset was generated from four indicators, namely, farmland, grazing land, woodland, and water resources. The value of farmland was estimated using two quantitative variables. The usual PCA was then used to generate the index for farmland. Grazing land and woodland used quantitative and categorical measures. Hence, FAMD was used to estimate their respective indices. The availability and quality of water resources were assessed using ordinal measures. PCA was then run by calculating the polychoric correlation coefficients of the respective variables.
The dataset used to generate the index for the physical asset was mixed (categorical and quantitative) and hence the FAMD function of the FactoMineR package was used to generate the index. The dataset used for the financial asset, on the other hand, was all quantitative. Hence, the default PCA was run to generate the index. FAMD was also employed to calculate the index for human and social assets, as they used a mixed dataset.
Indicators used to measure the index for institutions and entitlements were both quantitative and qualitative. The FAMD function was then used to generate the index. The rest of the components (knowledge and information, innovation, and flexible and forward–looking decision–making) used categorical variables, and hence polychoric PCA was used to generate their respective indices.
2.4.3. Steps Followed to Generate the Adaptive Capacity Index
The first PCA was performed for the innermost components to produce indices for farmland, grazing land, woodland, and water resources. The loadings from these four categories were used in the second PCA to generate an index for the natural asset. Similarly, indices for financial, physical, human, and social assets were generated independently. As a third step, the results of the five assets were used to generate an index for one of the five principal components, the asset base. The index of the asset base was computed by using the loadings of the five sub–components (natural, financial, physical, human, and social assets). In the fourth round of analysis, PCA was used to generate an index for the other four principal components, namely, entitlement and institution, knowledge and information, innovation, and flexible and forward–looking decision–making and governance. Once indices for the five principal components, i.e., asset base, entitlement and institution, knowledge and information, innovation, and flexible and forward–looking decision making and governance were generated, the final PCA (outermost PCA) was run to generate an index for the overall adaptive capacity. The entire process is shown in Figure 3.
The loadings from the first principal component were used as weights for the respective indicators. The weights obtained from the first round of PCA were used to generate the index for the next round of indicators and the process continued until the overall index was constructed. The loadings for each indicator varied between –1 and +1 and the sign denoted the direction of the relationship with other indicators used to construct the index. The magnitude of the loadings describes the relative contribution of each indicator to the value of the index. The index for overall adaptive capacity was calculated using the weights (loadings) obtained from the previous PCA run for the five major components. The normalized values of the indicators with quantitative datasets were multiplied with the assigned weights to construct the index using the following index formulae Equation (4):
where ‘I’ is the Index Score, ‘b’ is the loading from the first principal component to be taken as weights for respective indicators, ‘a’ is the indicator value, ‘x’ is the mean indicator value, and ‘s’ is the standard deviation of the indicators.
A higher value of the index indicates the higher adaptive capacity and vice versa. However, a negative value of the index does not mean that the household has no adaptive capacity at all, as the index does not give the absolute measurement of adaptive capacity. It is a relative measure and hence gives rather a comparative ranking of adaptive capacity among the sampled households. Indices for indicators with only qualitative or mixed datasets are taken care of by the appropriate technique itself.
3. Results and Discussion
3.1. Components of Adaptive Capacity of Households and Their Contributions
The major components of adaptive capacity and their contributions are presented in Figure 4, while the overall structure in which the adaptive capacity of households was measured is presented in Table 2. The five major components, sub–components, and indicators, as described in Table 1, were populated with scores obtained from the household data using various PCA techniques. The figures in parenthesis represent weights for the respective components or indicators and signify their relative contribution to the aggregate adaptive capacity index. Positive (negative) weights show positive (negative) relationships with the other variables used to represent each component or sub–component. The index developed in this study used both aggregate and composite indices. Thus, based on the loadings of the five major components, an aggregate value of the adaptive capacity index was found while maintaining the transparency in the composite make–up of that value. Composite indices showed the relative contribution of sub–components or indicators.
The analysis showed that three major components had a positive contribution to adaptive capacity, while the other two had negative contributions (Figure 4). Institutions and entitlements (0.61) had the highest influence on adaptive capacity followed by knowledge and information (0.50) and innovation (0.43). On the other hand, flexible and forward–looking decision–making, and governance and asset base, made the least contributions with a weight of −0.17 and −0.40, respectively. The proportion of variation explained by the first principal components out of all the five components collectively for the overall adaptive capacity index was 42 percent.
This study paves the way for a wider and more comprehensive analysis that stretches far beyond analyzing adaptive capacity based only on the five livelihood assets. Including dimensions other than the commonly used asset base sounds more logical as adaptive capacity is multidimensional and determined by complex inter–relationships of many factors at different scales, as reported by Vincent [19]. Such considerations will open up more rooms for making improvements in overall adaptive capacity.
However, care must be taken not to underestimate the role of assets as they represent the sine qua non of adaptive capacity [16]. Adaptive capacity is dependent on access to resources [77,78] and their availability forms a fundamental platform on which to pursue further understanding of the process of adaptation [16]. Indeed, many studies have adopted assets as direct indicators of adaptive capacity at local levels [16,19,55,66,67,69,79,80]. They are useful in helping us to understand the resources at the disposal of a system to cope with and adapt to changing environments.
Nevertheless, studies based only on assets mask the role of intangible processes and functions in supporting adaptive capacity [17,20]. Assets are so essential that they must not only exist in adequate quantities but the system requiring assets must also be able to mobilize them effectively in the pursuit of adaptation [13,16]. Thus, solely looking at the household’s asset base is unlikely to give a complete picture of a system’s adaptive capacity. For example, access to and control of assets is mediated through institutions and entitlement [17]. It is therefore apparent that asset–based assessments need to be supplemented with the assessment of the intangible processes that play an integral part in determining the ability of a system to adapt to shocks and stresses. The findings of this study demonstrate exactly that.
The analysis also highlights the importance of multiple perspectives in assessing adaptive capacity. It provides a new perspective both in terms of the scope of analysis and information regarding adaptive capacity at the local level. While these results support the arguments of WRI [51], Ludi, Jones [81], and Elrick-Barr, Preston [20], it is difficult to make a direct comparison with the findings of asset–based assessments, which has been virtually the norm in previous studies. In this study, the asset base, which includes the five livelihood assets, is just one of the five principal components used to analyze adaptive capacity. Thus, it can still be possible to make a comparison of the results of other studies with the results of only one of the components of this study, but not directly with the adaptive capacity scores of this study that includes four other major components.
Looking into the PCA results, the first and foremost focus for households that has a policy implication within the CRV should be to further improve the utilization of components with positive contributions as they are the ones contributing better to the adaptive capacity of households than other components. However, this does not imply that the remaining components are not that important. It rather means that their contributions at the moment are lower and that they should be improved by taking the right measures. Components such as asset base and decision–making and governance do even influence adaptive capacity negatively. This calls for massive efforts to turn them into positive contributors.
Therefore, the analysis suggests that actions should be taken to improve the utilization of components that are not contributing much to the households. The system as a whole functioning in an integrated manner has greater capability to improve adaptive capacity than either one or more components in isolation. It is, therefore, critical that all components and indicators form an integrated and systematic part of the adaptive capacity of households. Moreover, the adaptive capacity index shows only the current potential to adapt yet it changes with time. Thus, a proactive and flexible position should be envisaged to improve the overall adaptive capacity of households in the CRV.
3.2. Role of Woodlands in the Adaptive Capacity of Households
To discern the role of woodlands in the adaptive capacity of households, it is necessary to look into the structure of the adaptive capacity index itself. The adaptive capacity index in this study was constructed based on the five principal components that included the asset base. The score of the asset base, in turn, was derived based on the loadings of the five assets: natural, physical, financial, human, and social assets. The weight of natural assets was also derived from the respective weights of farmland, grazing land, woodland, and water resources. Hence, it is here that we see the contribution of woodland to adaptive capacity via natural assets and the asset base in general.
The composite indices derived from the PCA showed that the relative contribution of woodlands to the natural asset was the highest with a weight of 0.70. It was followed by a positive contribution from grazing land (0.49). However, farmland and water resources made negative contributions to the natural asset with a weight of −0.43 and −0.30, respectively.
Ownership of more productive land had a higher impact in determining the contribution of farmland, while a higher share of less productive land decreased the contribution of farmland to the natural asset. Likewise, the score of water resources was affected by a lack of water resources both for agricultural production and domestic use rather than the quality of water already available. This response reflects the fact that water is a critical resource in the CRV because it is semi–arid with unreliable precipitation. The positive response for the quality of water is largely associated with the water being supplied through the recently installed public stand–pipes that crisscrossed most of the study area.
Concerning grazing land, it appears that its productivity in terms of providing the required services rather than its size was a constraint because the size of grazing land received the highest weight. For the woodlands, both indicators, i.e., ownership of woodland and size of woodland, had equal positive weights and contributed better than any of the other three resources to the natural asset. This meant that woodlands have a higher impact on determining the contribution of the natural asset to the overall asset base and ultimately to the adaptive capacity of households. Moreover, it implied that woodlands are providing the goods and services expected of them better than the other natural resources considered.
In the analysis, it was observed that woodlands can play an important role in enhancing the adaptive capacity of households. This high rating of the woodlands’ contribution to adaptive capacity can be associated with the multitude of benefits it provides to these households. Woodlands provide goods and services to the local communities facing climate threats. Almost all households (99%) used woodland products for various purposes. Considering only the direct role of woodlands, they provided important safety nets, livelihood diversification, and integral income sources for households.
The safety net function of woodlands is linked with the role they play during periods of hardship such as crop failure due to drought or temporary need for extra income, i.e., when households face unexpected income shortfalls or urgent need for money. While their safety net role is considered as a coping strategy (i.e., in reaction to stress), their role in the diversification of livelihoods constitutes part of the adaptation strategies of households (i.e., in an anticipation of stress) [82,83].
The role of woodlands in livelihood diversification has already been accounted for in the calculation of adaptive capacity in the form of LDI. It is achieved mainly through the collection of firewood, construction wood, charcoal, timber, fodder, fruits, and traditional medicine. Only the first three major woodland products (firewood, construction wood, and charcoal) were considered for the LDI calculation even though more products were mentioned by the households. For instance, the leaves, twigs, and seed pods of acacia trees are an important source of feed for livestock, particularly during long dry spells where grasses are either less or no longer available (Figure 5). Similarly, the income contribution of woodlands was accounted for with the calculation of gross annual income per capita. These functions of woodlands make them relevant for building the adaptive capacity of households.
4. Conclusions
Analysis of adaptive capacity of households using the LAC framework confirmed that adaptive capacity is not only determined by the availability of assets, but also by the processes and functions needed to mobilize these resources. The analysis shows not only components that are contributing better than the others but also those that hamper adaptive capacity. The availability of strong institutions and entitlements to key resources contributed better than knowledge and information on climate–related issues and adaptation strategies, as well as innovation. On the other hand, decision–making and governance and asset base showed negative influences on adaptive capacity.
Two important lessons can be drawn from the findings of this research. First, more attention has to be paid to improve the contribution of the low–scoring components such as asset base and decision–making. Second, dimensions other than the asset base need to get enough recognition in local–level adaptive capacity assessments, as demonstrated by components that made positive contributions. Moreover, it is helpful to identify dimensions that are contributing better as well as those that are hampering adaptive capacity.
This analysis of adaptive capacity at the household level based on the selected components sheds some important insights that are relevant for policy development. Firstly, it promotes the need for a wider and more comprehensive analysis of adaptive capacity. Secondly, it helps to guide efforts aimed at enhancing adaptive capacity by providing clues about the relative contribution of components and by indicating where adaptive capacity might be strong or lagging. In this regard, the immediate policy focus should be geared towards improving the contribution of institutions and entitlements as well as households’ knowledge and information on climate–related matters, and innovation, because they are currently making positive contributions.
However, in the long–run, there is a need to put in place concerted efforts to improve the contribution of the low–scoring components since overall adaptive capacity is influenced by the proper functioning of all the components as a system rather than each component as a separate unit. Striking the right balance between the components is very crucial. The capacity to adapt is also dynamic and influenced by a range of factors. Ultimately, emphasis should be placed on consistently improving the ability of the system as a whole to overcome the impacts of climate change and to exploit the opportunities presented by the same. Carrying out continuous assessments would also help monitor household progress in terms of their ability to adapt to challenges brought about by climate change.
Moreover, the results of the composite indices provide further information to stakeholders including policy–makers, researchers, and development actors on which sub–component(s) they should focus on, and which improvements to undertake by unveiling their relative importance to the respective principal components. Each component or sub–component plays a role in adaptive capacity. Physical, financial, and natural assets made a positive contribution to the asset base, while human and social assets made a negative one. Furthermore, woodlands made the highest contribution to natural assets, followed by grazing land. This indicates the important role that woodlands play in the adaptive capacity of the households living in and around the CRV of Ethiopia by improving the contribution of natural assets and then asset base in the aggregate.
The high rating of woodlands is also a reflection of their role in providing important safety nets, livelihood diversification, and integral income sources for the households. These roles were arrived at by considering only the direct and main services and do not include regulatory and mitigation roles. Thus, policy and development interventions should take into consideration the invaluable roles that woodlands play in the CRV and take the necessary measures to ensure that they are sustainably managed and continue providing vital products and services to the local community as well as the environment.
Overall, the findings of this paper help stakeholders to better understand the nature of adaptive capacity and its determinants at the household level. This helps address the various dimensions of adaptation to climate change and design appropriate adaptation strategies.
Finally, it is also believed that this study will provide inputs to the methodological aspects of assessing adaptive capacity at the local level, particularly about indicator selection and methods of analysis. Although a wide range of variables and indicators are addressed, there are no limits to the number of variables and indicators that can be included in a given study. Researchers can select a suite of variables and indicators depending on the context of the locality under investigation, since it is not possible to provide a list of off–the–shelf indicators to capture universal determinants of adaptive capacity at the local level. Thus, the indicators listed in this study may not be replicated exactly for other rural households, albeit the logic behind their selection can. Variants of PCA techniques employed in this study, such as assigning weights through the polychoric correlation coefficient and FAMD, can be useful tools, particularly for social science studies where the data are mostly of a mixed nature, i.e., both qualitative and quantitative.
Author Contributions
Conceptualization, D.M., B.S., A.B., J.W.R., and U.S. Methodology, D.M., and B.S. Original draft, D.M. Editing, and writing, D.M., A.B., J.W.R., B.S., and U.S. Funding acquisition, A.B., D.M., and U.S. Data curation, D.M., and A.B. All authors have read and agreed to the published version of the manuscript.
Funding
This research was financially supported by the Volkswagen Foundation project (Ref. No. I/83 735) and by the Department for International Development (DfID) and the Climate Impact Research Capacity and Leadership Enhancement (CIRCLE) program, grant number (201871).
Acknowledgments
We would like to thank the field assistants who were involved in the study, and community people who were interviewed for their time. Our appreciation also goes to Hawassa University, Wondo Genet College of Forestry and Natural Resources for their logistic support during data collection.
Conflicts of Interest
The authors declare no conflict of interest
References
- Demenocal, P.B. Cultural responses to climate change during the late Holocene. Science 2001, 292, 667–673. [Google Scholar] [CrossRef] [PubMed] [Green Version]
- Wilbanks, T.J.; Kates, R.W. Beyond adapting to climate change: Embedding adaptation in responses to multiple threats and stresses. Ann. Assoc. Am. Geogr. 2010, 100, 719–728. [Google Scholar] [CrossRef]
- Munroe, R.; Roe, D.; Doswald, N.; Spencer, T.; Möller, I.; Vira, B.; Reid, H.; Kontoleon, A.; Giuliani, A.; Castelli, I.; et al. Review of the evidence base for ecosystem–based approaches for adaptation to climate change. Environ. Evid. 2012, 1, 13. [Google Scholar] [CrossRef] [Green Version]
- Boko, M.; Niang, I.; Nyong, A.; Vogel, A.; Githeko, A.; Medany, M.; Osman-Elasha, B.; Tabo, R.; Yanda, P.Z. Africa. In Climate change: Impacts, Adaptation and Vulnerability. Contribution of Working Group II to the Fourth Assessment Report of the Intergovernmental Panel on Climate Change; Parry, M.L., Canziani, O., Palutikof, J., Linden, P.v.d., Hanson, C., Eds.; Cambridge University Press: Cambridge, UK, 2007; pp. 433–467. [Google Scholar]
- World Bank. Convenient Solutions to an Inconvenient Truth: Ecosystem–Based Approaches to Climate Change; The World Bank: Washington DC, WA, USA, 2009. [Google Scholar]
- Pachauri, R.K.; Allen, M.R.; Barros, V.R.; Broome, J.; Cramer, W.; Christ, R.; Church, J.A.; Clarke, L.; Dahe, Q.; Dasgupta, P.; et al. Climate Change 2014: Synthesis Report. Contribution of Working Groups I, II and III to the Fifth Assessment Report of the Intergovernmental Panel on Climate Change; IPCC: Geneva, Switzerland, 2014; p. 151. [Google Scholar]
- Adger, W.N.; Vincent, K. Uncertainty in adaptive capacity. Comptes Rendus Geosci. 2005, 337, 399–410. [Google Scholar] [CrossRef]
- Locatelli, B. Facing an Uncertain Future: How Forest and People Can Adapt to Climate Change; CIFOR: Bogor, Indonesia, 2008; Volume 5. [Google Scholar]
- Burton, I.; Huq, S.; Lim, B.; Pilifosova, O.; Schipper, E.L. From impacts assessment to adaptation priorities: The shaping of adaptation policy. Clim. Policy 2002, 2, 145–159. [Google Scholar] [CrossRef] [Green Version]
- Adger, W.N.; Barnett, J. Four reasons for concern about adaptation to climate change. Environ. Plan. A Econ. Space 2009, 41, 2800–2805. [Google Scholar] [CrossRef]
- Simane, B.; Zaitchik, B.F.; Foltz, J.D. Agroecosystem specific climate vulnerability analysis: Application of the livelihood vulnerability index to a tropical highland region. Mitig. Adapt. Strat. Glob. Chang. 2014, 21, 39–65. [Google Scholar] [CrossRef] [Green Version]
- Smit, B.; Wandel, J. Adaptation, adaptive capacity and vulnerability. Glob. Environ. Chang. 2006, 16, 282–292. [Google Scholar] [CrossRef]
- Brooks, N.; Adger, W.N. Assessing and enhancing adaptive capacity. In Adaptation Policy Frameworks for Climate Change: Developing Strategies, Policies and Measures; Cambridge University Press: Cambridge, UK, 2005; pp. 165–181. [Google Scholar]
- Brooks, N.; Adger, W.N.; Kelly, P.M. The determinants of vulnerability and adaptive capacity at the national level and the implications for adaptation. Glob. Environ. Chang. 2005, 15, 151–163. [Google Scholar] [CrossRef]
- Engle, N.L. Adaptive capacity and its assessment. Glob. Environ. Chang. 2011, 21, 647–656. [Google Scholar] [CrossRef]
- Wall, E.; Marzall, K. Adaptive capacity for climate change in Canadian rural communities. Local Environ. 2006, 11, 373–397. [Google Scholar] [CrossRef]
- Jones, L.; Ludi, E.; Levine, S. Towards a Characterisation of Adaptive Capacity: A Framework for Analysing Adaptive Capacity at the Local Level; Overseas Development Institute: London, UK, 2010. [Google Scholar]
- Nantui, F.M.; Bruce, S.D.; Yaw, O.-A. Adaptive capacities of farmers to climate change adaptation strategies and their effects on rice production in the Northern region of Ghana. Russ. J. Agric. Socio–Econ. Sci. 2012, 11, 9–17. [Google Scholar]
- Vincent, K. Uncertainty in adaptive capacity and the importance of scale. Glob. Environ. Chang. 2007, 17, 12–24. [Google Scholar] [CrossRef]
- Elrick-Barr, C.; Preston, B.; Thomsen, D.C.; Smith, T. Toward a new conceptualization of household adaptive capacity to climate change: Applying a risk governance lens. Ecol. Soc. 2014, 19, 12. [Google Scholar] [CrossRef] [Green Version]
- Magnan, A. For a Better Understanding of Adaptive Capacity to Climate Change: A Research Framework; IDDRI Analysis; IDIRI: Paris, France, 2010; Volume 2. [Google Scholar]
- Belay, A.; Recha, J.W.; Woldeamanuel, T.; Morton, J.F. Smallholder farmers’ adaptation to climate change and determinants of their adaptation decisions in the Central Rift Valley of Ethiopia. Agric. Food Secur. 2017, 6, 381. [Google Scholar] [CrossRef] [Green Version]
- Mesfin, D.; Simane, B.; Belay, A.; Recha, J.W.; Taddese, H. Woodland cover change in the Central Rift Valley of Ethiopia. Forests 2020, 11, 916. [Google Scholar] [CrossRef]
- Sagri, M.; Bartolini, C.; Billi, P.; Ferrari, G.; Benvenuti, M.; Carnicelli, S.; Barbano, F. Latest Pleistocene and Holocene river network evolution in the Ethiopian Lakes Region. Geomorphology 2008, 94, 79–97. [Google Scholar] [CrossRef] [Green Version]
- Yohannes, H.; Mohammed, A.; Elias, E. Land use/land cover dynamics and its impact on biodiversity resources in the Abijata Shalla National Park, Central Rift Valley Lakes region, Ethiopia. Environ. Sci. Ind. J. 2017, 13, 152. [Google Scholar]
- Benvenuti, M.; Carnicelli, S.; Belluomini, G.; Dainelli, N.; Di Grazia, S.; Ferrari, G.; Iasio, C.; Sagri, M.; Ventra, D.; Atnafu, B.; et al. The Ziway–Shala lake basin (main Ethiopian rift, Ethiopia): A revision of basin evolution with special reference to the Late Quaternary. J. Afr. Earth Sci. 2002, 35, 247–269. [Google Scholar] [CrossRef]
- Fazzini, M.; Bisci, C.; Billi, P. The climate of Ethiopia. In Landscapes and Landforms of Ethiopia; Springer: Ferrara, Italy, 2015; pp. 65–87. [Google Scholar]
- Itanna, F. Sulfur distribution in five Ethiopian Rift Valley soils under humid and semi–arid climate. J. Arid. Environ. 2005, 62, 597–612. [Google Scholar] [CrossRef]
- Ayenew, T. Water management problems in the Ethiopian rift: Challenges for development. J. Afr. Earth Sci. 2007, 48, 222–236. [Google Scholar] [CrossRef]
- Jansen, H.C.; Hengsdijk, H.; Legesse, D.; Ayenew, T.; Hellegers, P.; Spliethoff, P.C. Land and Water Resources Assessment in the Ethiopian Central Rift Valley: Project: Ecosystems for Water, Food and Economic Development in the Ethiopian Central Rift Valley; Alterra: Wageningen, The Netherlands, 2007. [Google Scholar]
- McSweeney, C.; New, M.; Lizcano, G. UNDP Climate Change Profile for Ethiopia. Bull. Am. Meteorol. Soc. 2010, 91, 157–166. [Google Scholar] [CrossRef] [Green Version]
- Meshesha, T.D.; Tsunekawa, A.; Tsubo, M. Continuing land degradation: Cause–effect in Ethiopia’s Central Rift Valley. Land Degrad. Dev. 2012, 23, 130–143. [Google Scholar] [CrossRef]
- Biazin, B.; Stroosnijder, L.; Temesgen, M.; Abdulkedir, A.; Sterk, G. The effect of long–term Maresha ploughing on soil physical properties in the Central Rift Valley of Ethiopia. Soil Tillage Res. 2011, 111, 115–122. [Google Scholar] [CrossRef]
- Biazin, B. Rainwater Harvesting for Dryland Agriculture in the Rift Valley of Ethiopia; Wageningen University: Wageningen, The Netherlands, 2012. [Google Scholar]
- Acocella, V.; Korme, T.; Salvini, F. Formation of normal faults along the axial zone of the Ethiopian Rift. J. Struct. Geol. 2003, 25, 503–513. [Google Scholar] [CrossRef]
- Abebe, B.; Acocella, V.; Korme, T.; Ayalew, D. Quaternary faulting and volcanism in the Main Ethiopian Rift. J. Afr. Earth Sci. 2007, 48, 115–124. [Google Scholar] [CrossRef]
- Fubelli, G.; Dramis, F. Geo-hazard in Ethiopia. In Landscapes and landforms of Ethiopia; Springer: Ferrara, Italy, 2015; pp. 351–368. [Google Scholar]
- Benvenuti, M.; Carnicelli, S.; Ferrari, G.; Sagri, M. Depositional processes in latest Pleistocene and Holocene ephemeral streams of the Main Ethiopian Rift (Ethiopia). Fluv. Sedimentol. VII 2009, VII, 277–294. [Google Scholar] [CrossRef]
- Benvenuti, M.; Carnicelli, S. The geomorphology of the Lake Region (Main Ethiopian Rift): The record of paleohydrological and paleoclimatic events in an active volcano–tectonic setting. World Geomorphol. Landsc. 2015, 289–305. [Google Scholar] [CrossRef]
- Temesgen, H.; Nyssen, J.; Zenebe, A.; Haregeweyn, N.; Kindu, M.; Lemenih, M.; Haile, M. Ecological succession and land use changes in a lake retreat area (Main Ethiopian Rift Valley). J. Arid. Environ. 2013, 91, 53–60. [Google Scholar] [CrossRef] [Green Version]
- Ayenew, T.; Gebreegziabher, M. Morphometric characteristics and hydrology of selected Ethiopian Rift lakes. In Landscapes and Landforms of Ethiopia; Springer: New York, NY, USA; London, UK, 2015; pp. 275–287. [Google Scholar]
- Billi, P. Geomorphological landscapes of Ethiopia. In Landscapes and Landforms of Ethiopia; Springer: New York, NY, USA; London, UK, 2015; pp. 3–32. [Google Scholar]
- Muzein, B.S. Remote Sensing & GIS for Land Cover, Land Use Change Detection and Analysis in the Semi–natural Ecosystems and Agriculture Landscapes of the Central Ethiopian Rift Valley. Ph.D. Thesis, Technische Universität Dresden Fakultät Forst Geo und Hydrowissenschaften Institut für Photogrammetrie und Fernerkundung, Dresden, Germany, 2006. [Google Scholar]
- Nyssen, J.; Temesgen, H.; Lemenih, M.; Zenebe, A.; Haregeweyn, N.; Haile, M. Spatial and temporal variation of soil organic carbon stocks in a lake retreat area of the Ethiopian Rift Valley. Geoderma 2008, 146, 261–268. [Google Scholar] [CrossRef]
- Eshete, G. Assessment of Fuelwood Resources in Acacia Woodlands in the Rift Valley of Ethiopia: Towards the Development of Planning Tools for Sustainable Management; Swedish University of Agricultural Sciences: Umea, Sweden, 1999. [Google Scholar]
- Makin, M.J.; Kingham, T.J.; Waddams, A.E.; Birchall, C.J.; Teferra, T. Development Prospects in the Southern Rift Valley, Ethiopia. Land Resources Study; Land Resource Division, Ministry of Overseas Development: Surrey, UK, 1975. [Google Scholar]
- Smit, B.; Pilifosova, O.; Burton, I.; Challenger, B.; Huq, S.; Klein, R.; Yohe, G. Adaptation to climate change in the context of sustainable development and equity. In Climate Change–2001: Impacts, Adaptation and Vulnerability. Contribution of Working Group III to the 3rd IPCC Assessment; Carthy, J.J.M., Canziani, O.F., Leary, N.A., Eds.; Cambridge University Press: Cambridge, UK, 2001. [Google Scholar]
- Eriksen, S.H.; Kelly, P.M. Developing credible vulnerability indicators for climate adaptation policy assessment. Mitig. Adapt. Strat. Glob. Chang. 2006, 12, 495–524. [Google Scholar] [CrossRef]
- Daze, A.; Ambrose, K.; Erhart, C. Climate Vulnerability and Capacity Analysis Handbook; CARE International: Geneva, Switzerland, 2009.
- Dulal, H.; Brodnig, G.; Onoriose, C.; Thakur, H. Capitalizing on Assets: Vulnerability and Adaptation to Climate Change in Nepal; The World Bank: Washington, DC, USA, 2010. [Google Scholar]
- WRI. The National Adaptive Capacity Framework: Pilot Draft; World Resources Institute: Washington, DC, USA, 2009. [Google Scholar]
- Siders, A. Adaptive capacity to climate change: A synthesis of concepts, methods, and findings in a fragmented field. Wiley Interdiscip. Rev. Clim. Chang. 2019, 10, e573. [Google Scholar] [CrossRef]
- Mortreux, C.; Barnett, J. Adaptive capacity: Exploring the research frontier. Wiley Interdiscip. Rev. Clim. Chang. 2017, 8, e467. [Google Scholar] [CrossRef]
- Parry, M.; Parry, M.L.; Canziani, O.; Palutikof, J.; Van der Linden, P.; Hanson, C. Climate Change 2007-Impacts, Adaptation and Vulnerability: Working Group II Contribution to the Fourth Assessment Report of the IPCC; Cambridge University Press: Cambridge, UK, 2007; Volume 4. [Google Scholar]
- Abdul-Razak, M.; Kruse, S. The adaptive capacity of smallholder farmers to climate change in the Northern Region of Ghana. Clim. Risk Manag. 2017, 17, 104–122. [Google Scholar] [CrossRef]
- Sietchiping, R. Applying an index of adaptive capacity to climate change in north–western Victoria, Australia. Appl. GIS 2006, 2, 16.1–16.28. [Google Scholar] [CrossRef]
- Kassie, B.T.; Rötter, R.P.; Hengsdijk, H.; Asseng, S.; Van Ittersum, M.K.; Kahiluoto, H.; Van Keulen, H.; Van Ittersum, M. Climate variability and change in the Central Rift Valley of Ethiopia: Challenges for rainfed crop production. J. Agric. Sci. 2013, 152, 58–74. [Google Scholar] [CrossRef]
- MEFCC. Release Note. 2016; Ministry of Forest, Environment and Climate Change (MEFCC): Addis Ababa, Ethiopia, 2016. [Google Scholar]
- Watson, J. How to Determine A Sample Size: Tipsheet# 60; Penn State Cooperative Extension: University Park, PA, USA, 2001. [Google Scholar]
- Park, S.; Marshall, N.; Jakku, E.; Dowd, A.; Howden, M.; Mendham, E.; Fleming, A. Informing adaptation responses to climate change through theories of transformation. Glob. Environ. Chang. 2012, 22, 115–126. [Google Scholar] [CrossRef]
- Kimenju, C.S.; Tschirley, D.L. Agriculture and Livelihood Diversification in Kenyan Rural Households; Tegemeo Institute of Agricultural Policy and Development: Nairobi, Kenya, 2009. [Google Scholar]
- Woolcock, M.; Narayan, D. Social capital: Implications for development theory, research, and policy. World Bank Res. Obs. 2000, 15, 225–249. [Google Scholar] [CrossRef] [Green Version]
- Vincent, K. Creating an Index of Social Vulnerability to Climate Change for Africa; Working Paper 56; Tyndall Center for Climate Change Research: Norwich, UK, 2004. [Google Scholar]
- Swanson, D.; Hiley, J.C.; Venema, H.D.; Grosshans, R. Indicators of Adaptive Capacity to Climate Change for Agriculture in the Prairie Region of Canada: An Analysis Based on Statistics Canada’s Census of Agriculture (Working Paper for the Prairie Climate Resilience Project); International Institute for Sustainable Development: Winnipeg, MB, Canada, 2007. [Google Scholar]
- Gbetibouo, G.A.; Ringler, C. Mapping South African Farming Sector Vulnerability to Climate Change and Variability: A Subnational Assessment; Citeseer: Washington, DC, USA, 2009. [Google Scholar]
- Nelson, R.; Kokic, P.; Crimp, S.; Martin, P.; Meinke, H.; Howden, M.; De Voil, P.; Nidumolu, U. The vulnerability of Australian rural communities to climate variability and change: Part II—Integrating impacts with adaptive capacity. Environ. Sci. Policy 2010, 13, 18–27. [Google Scholar] [CrossRef]
- Piya, L.; Maharjan, K.L.; Joshi, N.P. Comparison of adaptive capacity and adaptation practices in response to climate change and extremes among the Chepang households in rural Mid–Hills of Nepal. J. Int. Dev. Coop. 2012, 18, 55–75. [Google Scholar]
- Nelson, R.; Kokic, P.; Elliston, L.; King, J.A. Structural adjustment: A vulnerability index for Australian broadacre agriculture. Australian Commodities. Forecast. Issues 2005, 12, 171. [Google Scholar]
- Swanson, D.; Hiley, J.C.; Venema, H.D.; Grosshans, R. Indicators of Adaptive Capacity to Climate Change for Agriculture in the Prairie Region of Canada: Comparison with Field Observations (Working Paper for the Prairie Climate Resilience Project); International Institute for Sustainable Development: Winnipeg, MB, Canada, 2009. [Google Scholar]
- Filmer, D.; Pritchett, L.H. Estimating wealth effects without expenditure data—Or tears: An application to educational enrollments in states of India. Demography 2001, 38, 115–132. [Google Scholar] [PubMed] [Green Version]
- Cutter, S.L.; Boruff, B.J.; Shirley, W.L. Social Vulnerability to Environmental Hazards. Soc. Sci. Q. 2003, 84, 242–261. [Google Scholar] [CrossRef]
- Kolenikov, S.; Angeles, G. The Use of Discrete Data in PCA: Theory, Simulations, and Applications to Socioeconomic Indices. Chapel Hill Carol. Popul. Cent. Univ. N. Carol. 2004, 20, 1–59. [Google Scholar]
- Pearson, K.; LIII. On lines and planes of closest fit to systems of points in space. Lond. Edinb. Dublin Philos. Mag. J. Sci. 1901, 2, 559–572. [Google Scholar] [CrossRef] [Green Version]
- Hotelling, H. Analysis of a complex of statistical variables into principal components. J. Educ. Psychol. 1933, 24, 417. [Google Scholar] [CrossRef]
- Gwatkin, D.R.; Rutstein, S.; Johnson, K.; Suliman, E.; Wagstaff, A.; Amouzou, A. Socio–economic differences in health, nutrition, and population within developing countries: An overview. Niger. J. Clin. Pr. 2007, 10, 287. [Google Scholar]
- Pearson, K.I. Mathematical contributions to the theory of evolution. VII. On the correlation of characters not quantitatively measurable. Philos. Trans. R. Soc. Lond. Ser. A Contain. Pap. Math. Phys. Character 1900, 195, 1–47. [Google Scholar] [CrossRef] [Green Version]
- Easterling, W.E.; Hurd, B.H.; Smith, J.B. Coping with Global Climate Change: The Role of Adaptation in the United States; Pew Center on Global Climate Change: Arlington, VA, USA, 2004; Volume 40. [Google Scholar]
- Adger, W.N.; Brooks, N.; Bentham, G.; Agnew, M.; Eriksen, S. New Indicators of Vulnerability and Adaptive Capacity; Tyndall Centre for Climate Change Research: Norwich, UK, 2004; Volume 122. [Google Scholar]
- Osman-Elasha, B.; Elhassan, N.G.; Ahmed, H.; Zakieldin, S. Sustainable Livelihood Approach for Assessing Community Resilience to Climate Change: Case Studies from Sudan; AIACC Working Paper No.17. 2005; Assessments of Impacts and Adaptations to Climate Change (AIACC): Washington, DC, USA, 2005. [Google Scholar]
- Deressa, T.; Hassan, R.; Ringler, C. Measuring Ethiopian Farmers’ Vulnerability to Climate Change across Regional States; IFPRI: Washington, DC, USA, 2008. [Google Scholar]
- Ludi, E.; Jones, L.; Levine, S. Changing focus? How to take adaptive capacity seriously. SSRN Electron. J. 2012, 71. [Google Scholar] [CrossRef]
- Vedeld, P.; Angelsen, A.; Bojö, J.; Sjaastad, E.; Berg, G.K. Forest environmental incomes and the rural poor. For. Policy Econ. 2007, 9, 869–879. [Google Scholar] [CrossRef]
- Pramova, E.; Locatelli, B.; Djoudi, H.; Somorin, O.A. Forests and trees for social adaptation to climate variability and change. Wiley Interdiscip. Rev. Clim. Chang. 2012, 3, 581–596. [Google Scholar] [CrossRef] [Green Version]
Figure 1.
Map of the study area in the Central Rift Valley (CRV) of Ethiopia.

Figure 2.
Conceptual framework for assessing the adaptive capacity of households. Source: Adapted from Jones et al. [17]. Arrows indicate direct effects, while the broken circle depicts secondary or indirect relationships between the components.
Figure 2.
Conceptual framework for assessing the adaptive capacity of households. Source: Adapted from Jones et al. [17]. Arrows indicate direct effects, while the broken circle depicts secondary or indirect relationships between the components.

Figure 3.
Principal Component Analysis (PCA) steps for generating the index at the household level. Sources: Authors’ conceptualization.
Figure 3.
Principal Component Analysis (PCA) steps for generating the index at the household level. Sources: Authors’ conceptualization.

Figure 4.
Relative weights (contributions) of the major components. Sources: Authors’ conceptualization.
Figure 4.
Relative weights (contributions) of the major components. Sources: Authors’ conceptualization.

Figure 5.
(a) A farmer shaking acacia trees with a hooked long stick to drop seed pods; (b) the seeds and pods; (c) feeding cattle with the seeds and pods; (d) camels feeding acacia trees. Source: Authors.
Figure 5.
(a) A farmer shaking acacia trees with a hooked long stick to drop seed pods; (b) the seeds and pods; (c) feeding cattle with the seeds and pods; (d) camels feeding acacia trees. Source: Authors.


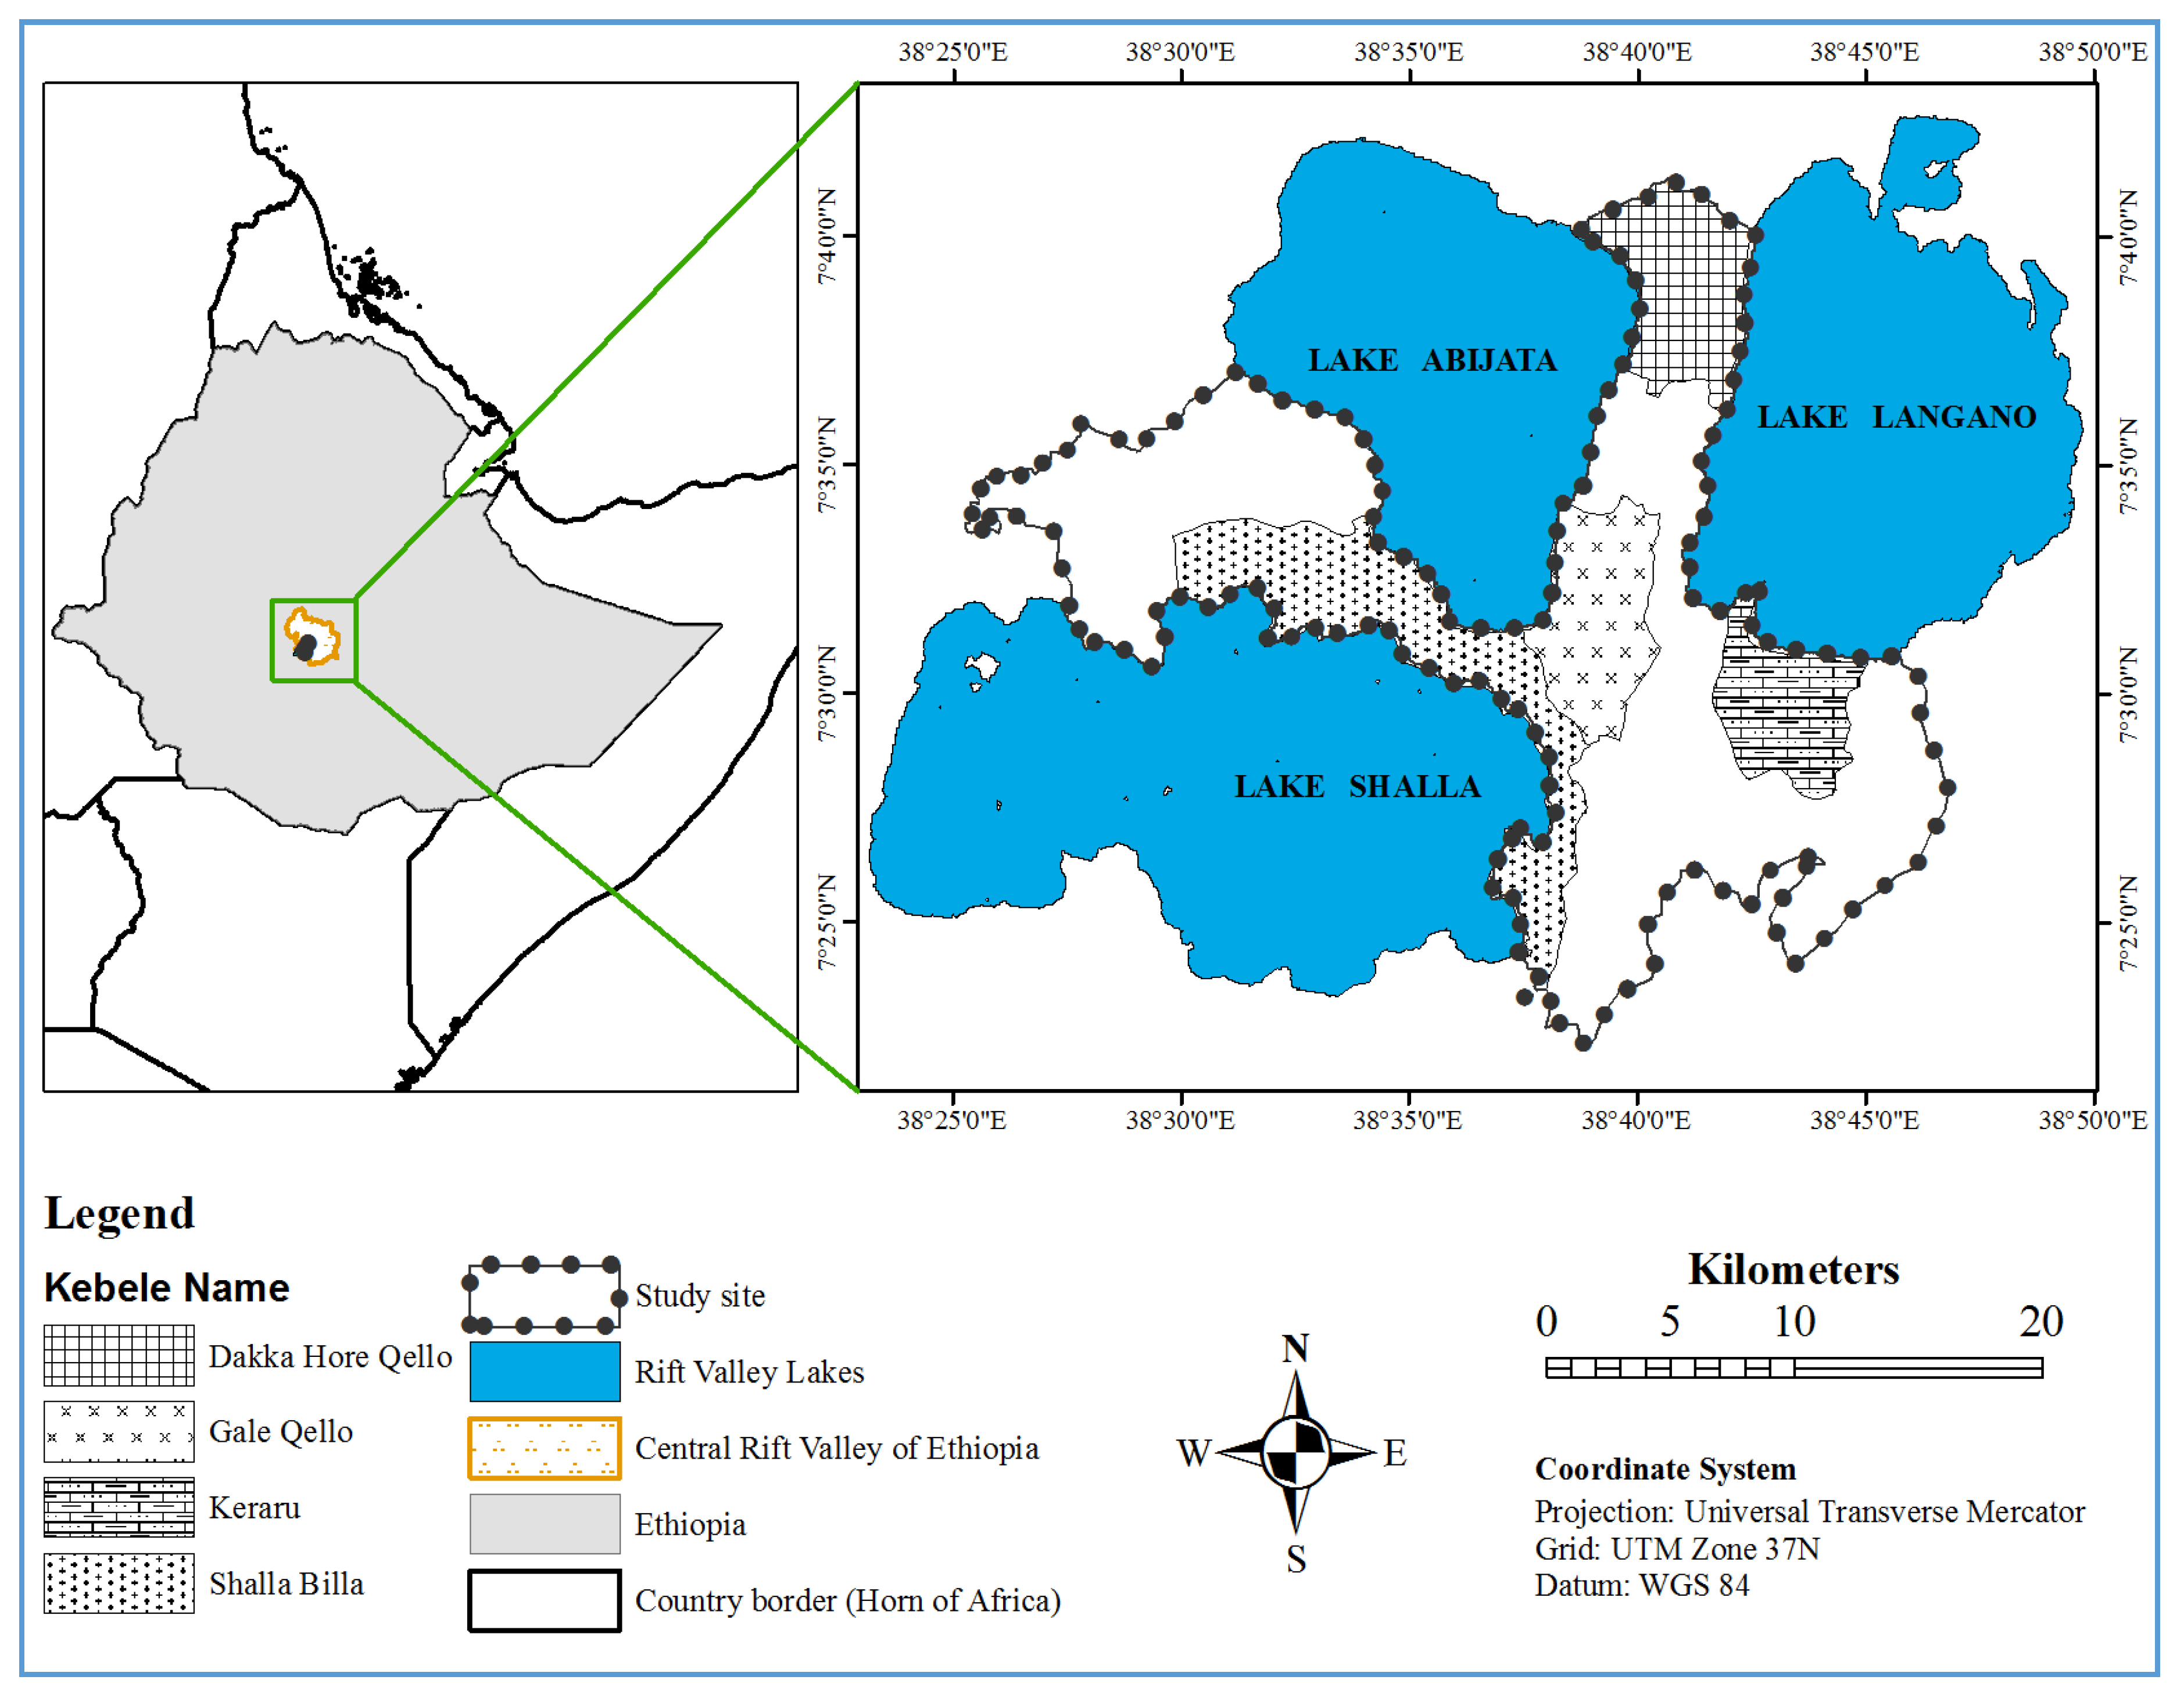
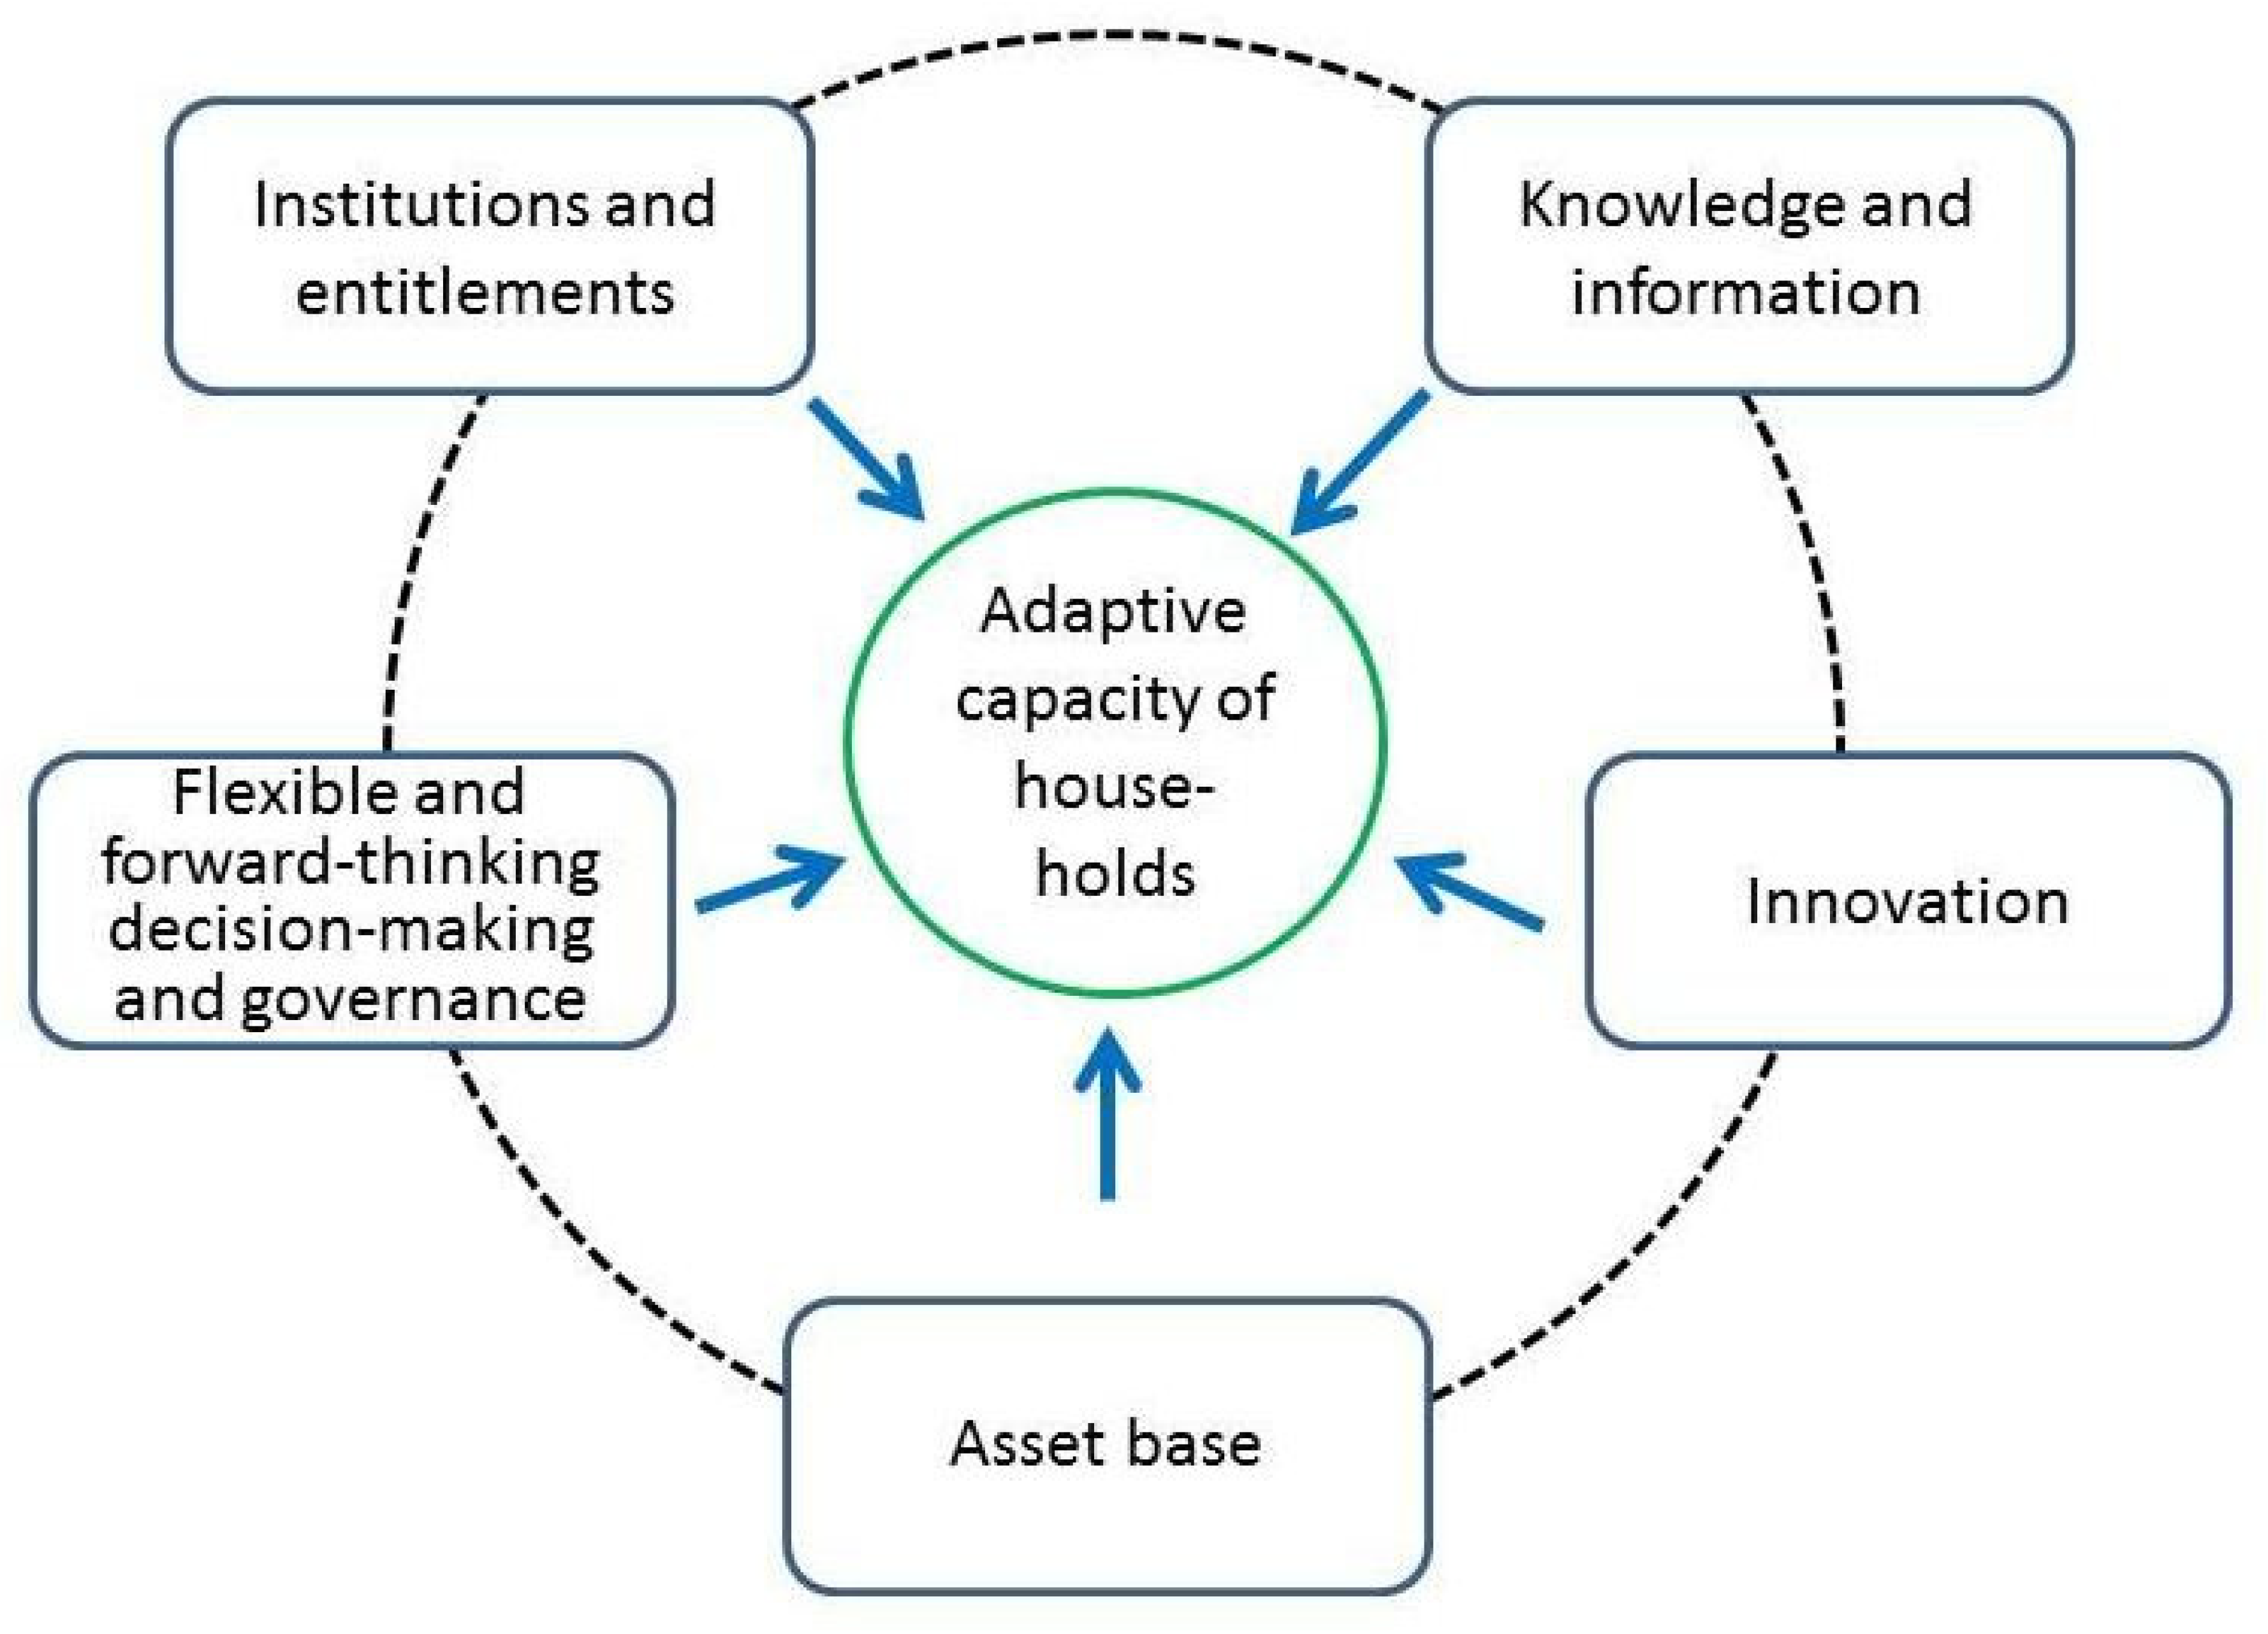
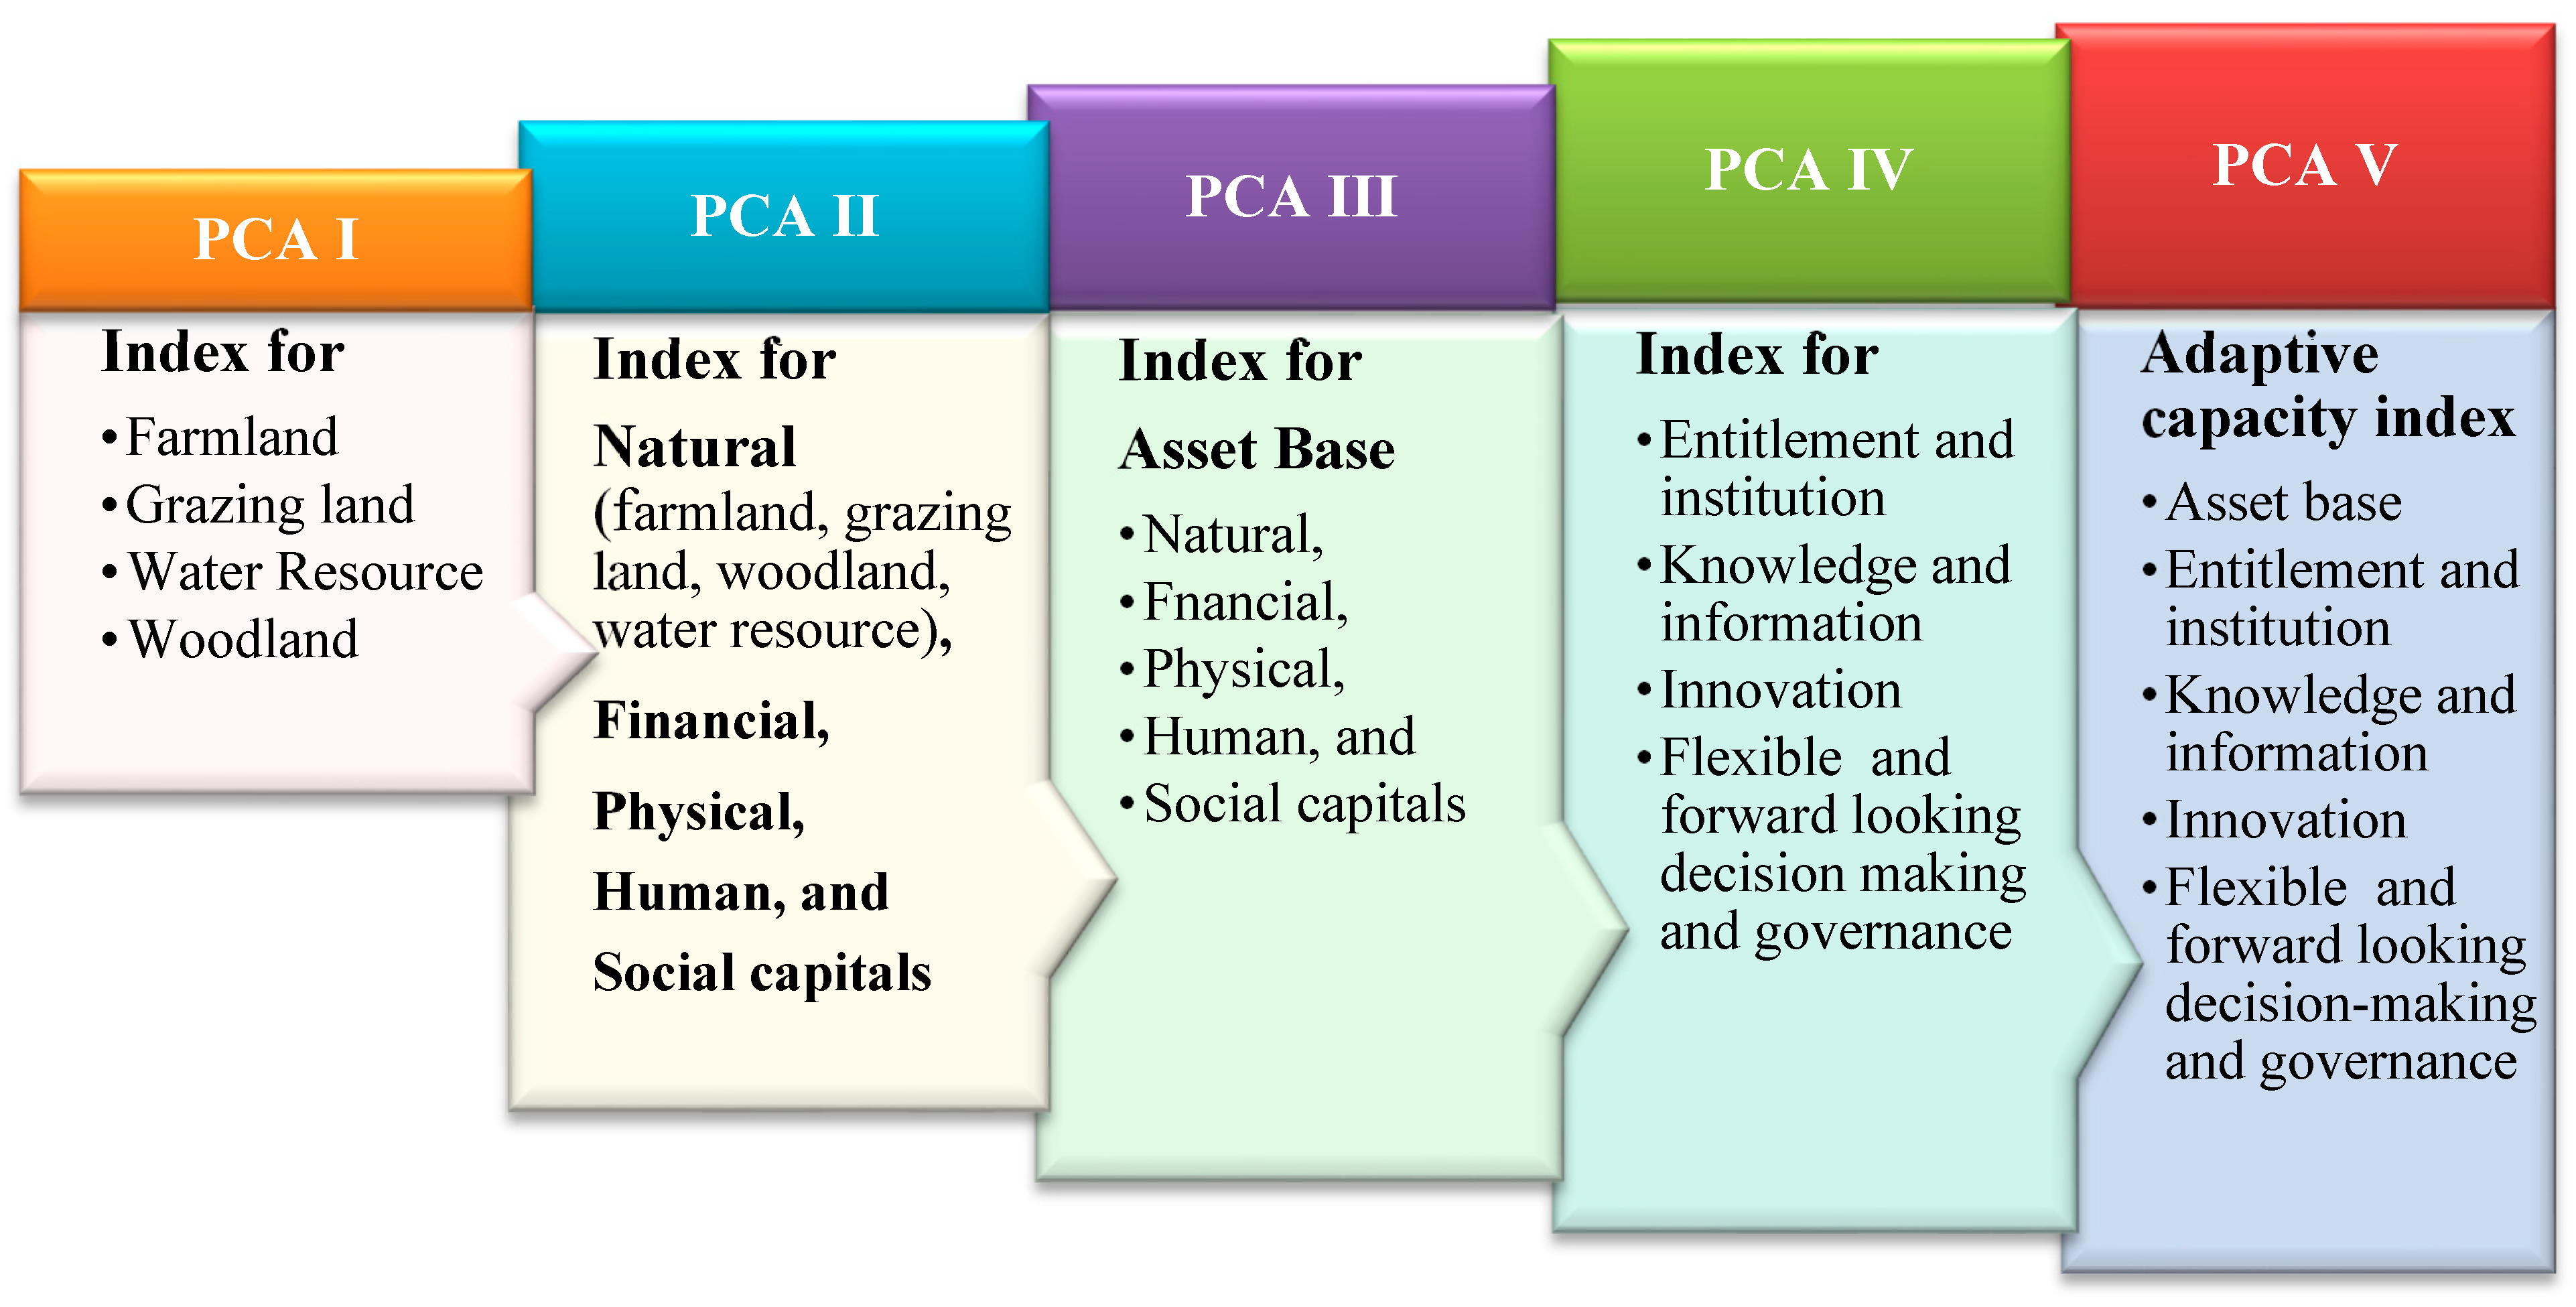
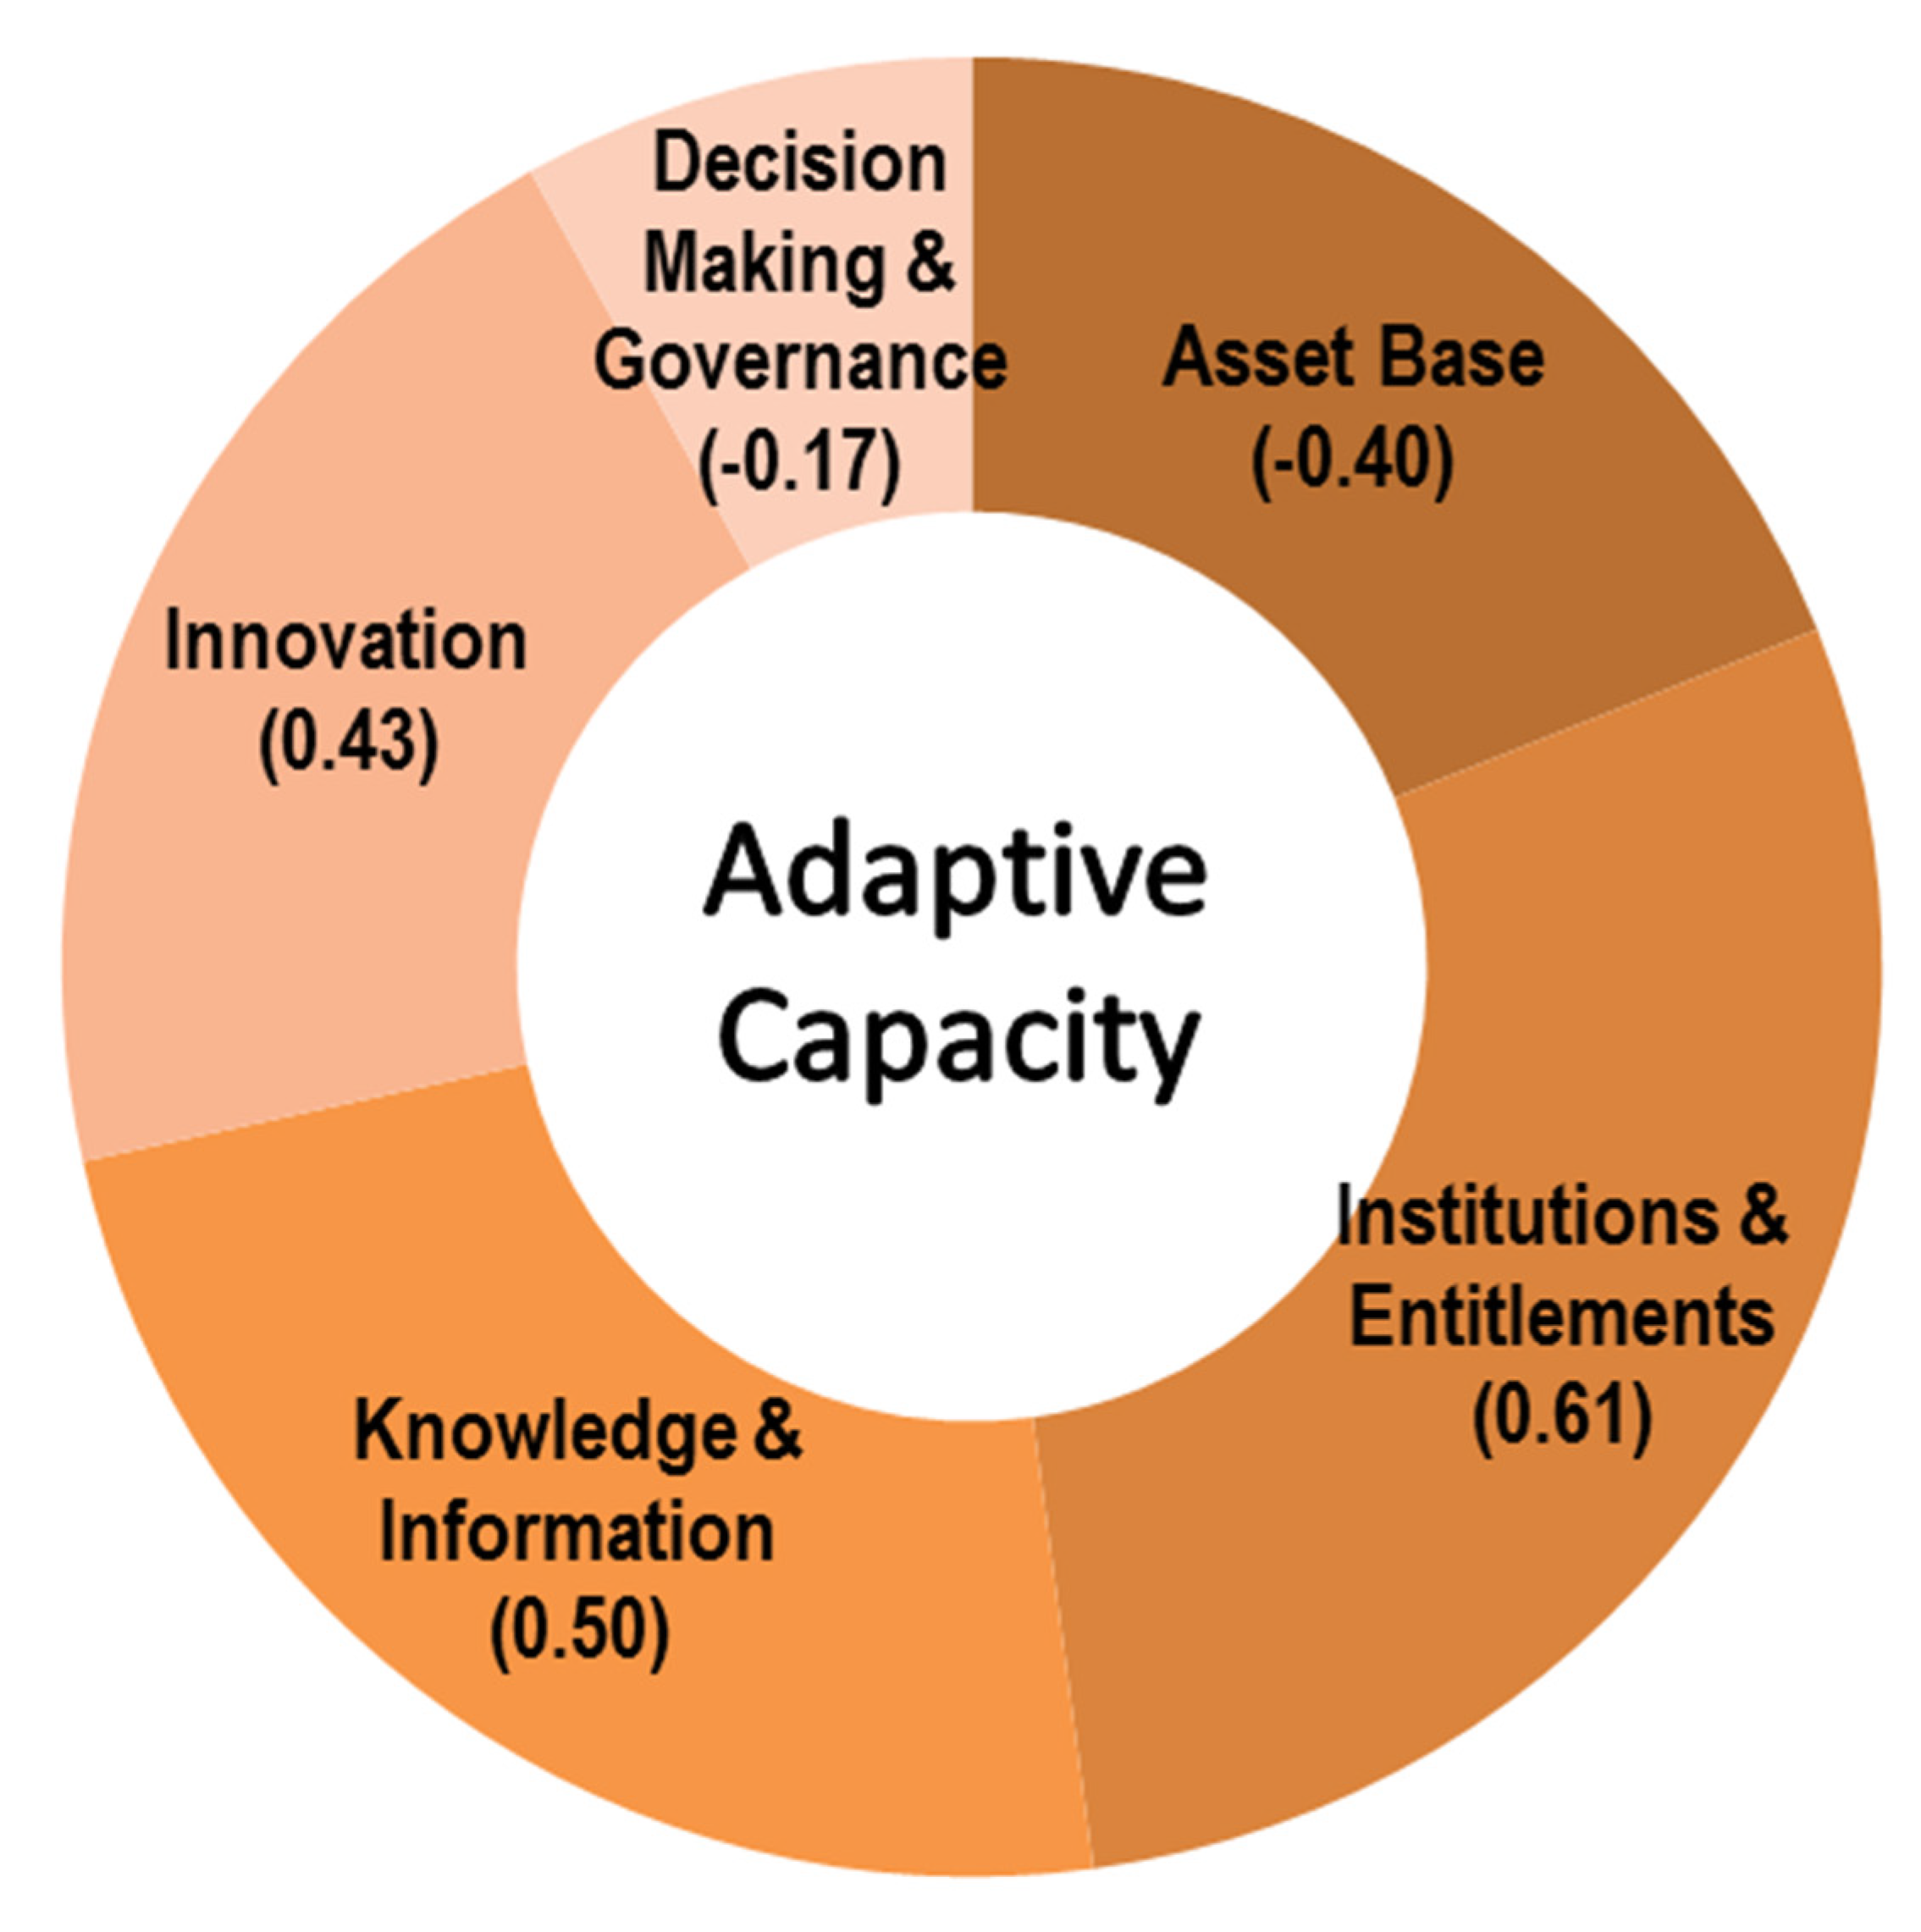
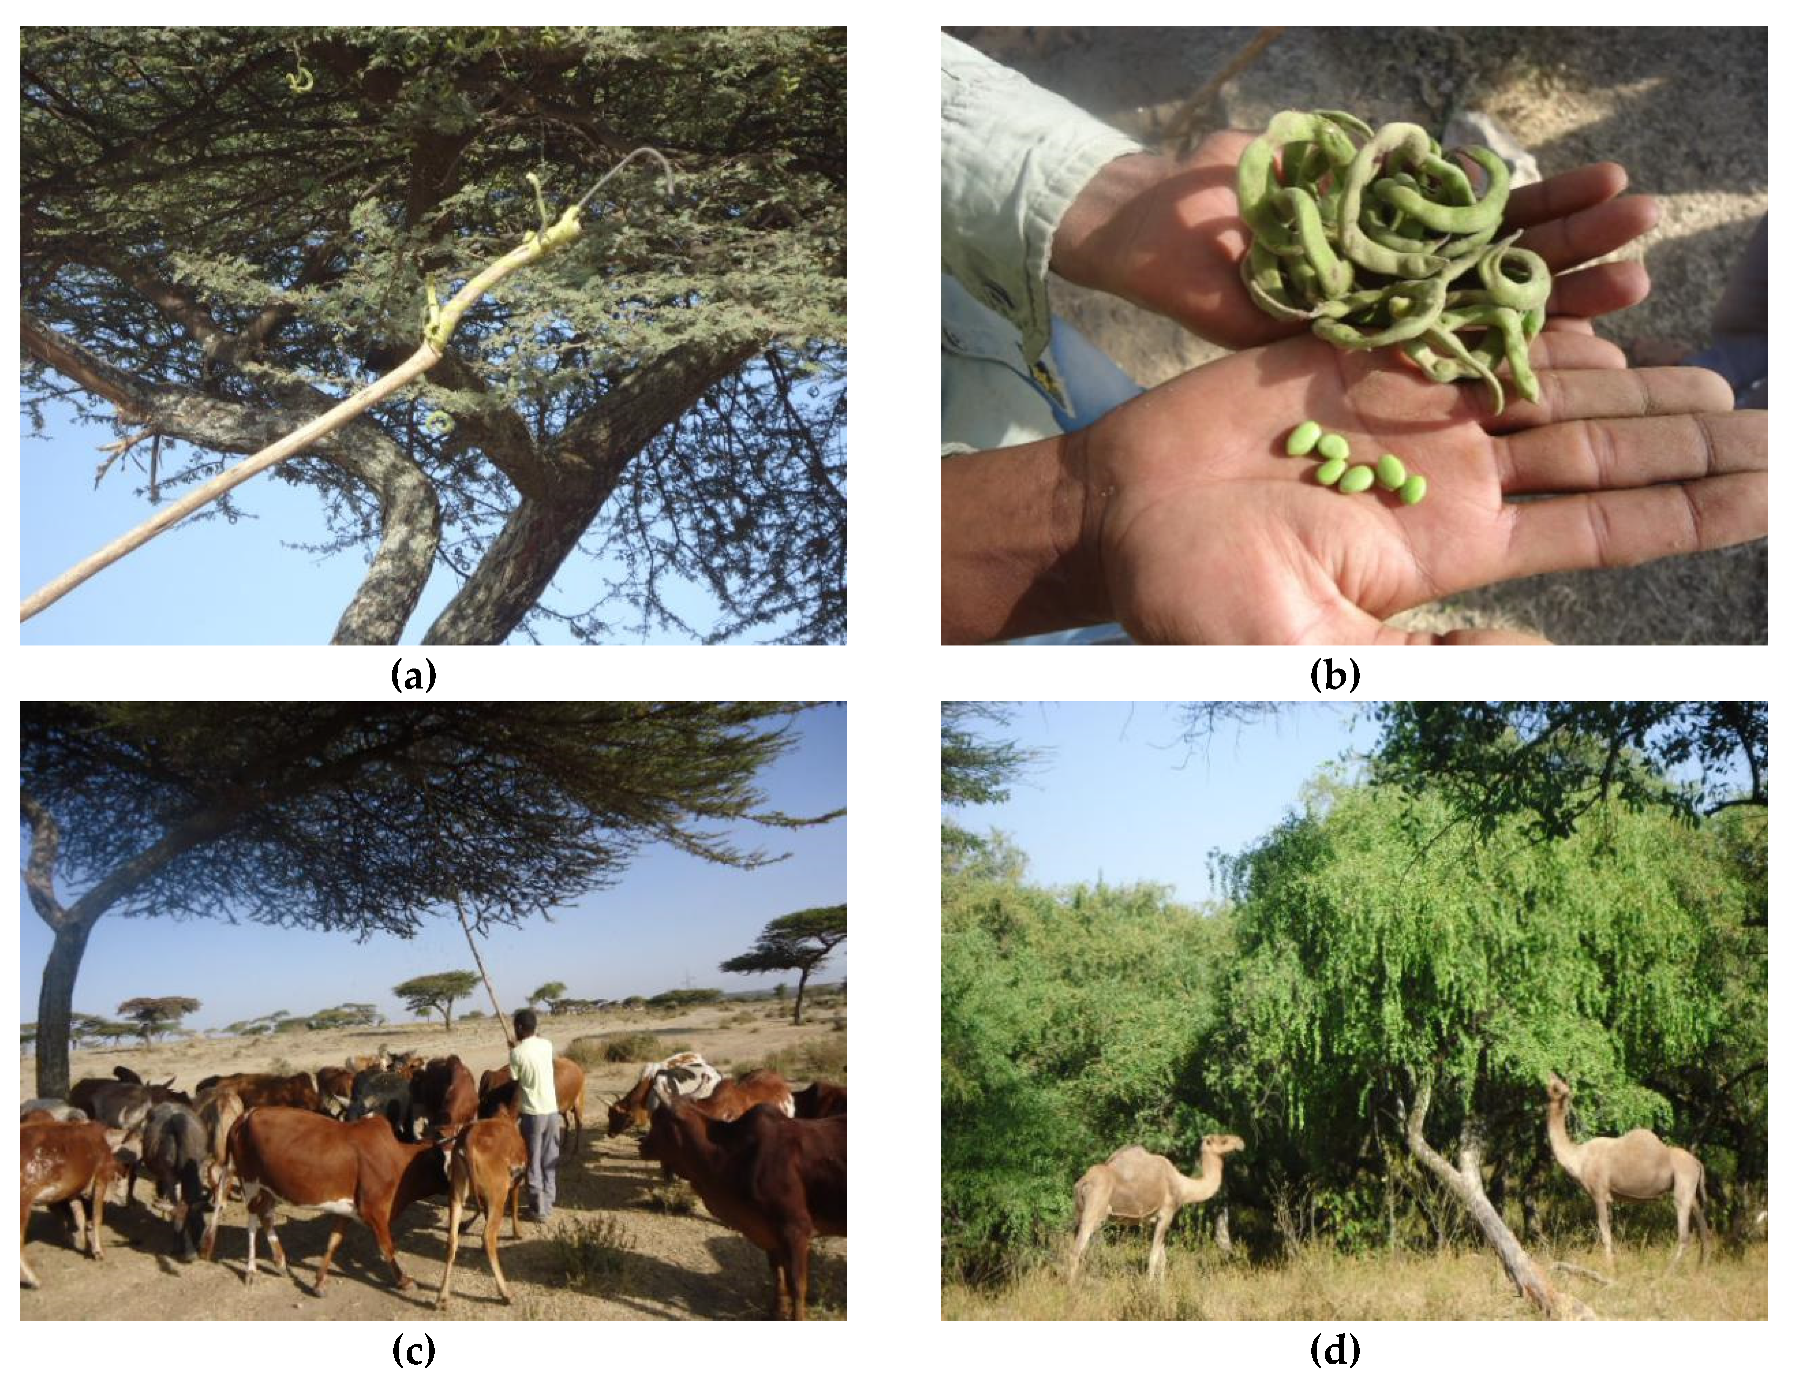
Table 1.
Dimensions and indicators of adaptive capacity.
| Component Indicators | Description of the Indicators | Measure | Hypothesized Relation | |
|---|---|---|---|---|
| Asset Base | Natural assets | |||
| Share of more productive land possessed | % of the total | + | |
| Share of less productive land possessed | % of the total | − | ||
| Access to grazing (yes/no) | Categorical | + | |
| Size of grazing land | Number | + | ||
| Ownership of woodland (yes/no) | Categorical | + | |
| Size of woodland | Number | + | ||
| Access to water resources (1. Very scarce 2. Inadequate 3. Adequate 4. Very adequate 5. Plenty) | Ordinal | + | |
| Quality of water (1. Very poor 2. Poor 3. Medium 4. Good 5. Very good) | Ordinal | + | ||
| Physical asset | Type of house (1 = rent/no house; 2 = thatch roof; 3 = tin roof; 4 = both thatch roof and tin roof | Ordinal | + | |
| Have radio (yes/no) | Categorical | + | ||
| Have a mobile phone (yes/no) | Categorical | + | ||
| Have access to electricity (yes/no) | Categorical | + | ||
| Walking distance to the nearest road | Hours | − | ||
| Agricultural tools | Birr | + | ||
| Irrigated land | % of the total | + | ||
| Financial asset | Gross annual income per capita | Birr | + | |
| Livelihood Diversification Index (LDI) | Number | + | ||
| Remunerative income sources | Birr | + | ||
| Total household savings | Birr | + | ||
| Total loan received by the household | Birr | + | ||
| Ownership of livestock | Tropical Livestock Unit (TLU) | + | ||
| Human asset | Highest qualification in the household | Years | + | |
| Training attended by the household members | Number | + | ||
| Health status of the household (1. Very poor 2. Poor 3. Fair 4. Good 5. Excellent) | Ordinal | + | ||
| Dependency ratio | Number | − | ||
| Social asset | Memberships in community-based organizations (CBO’s) | Number | + | |
| Network and mutual support organizations (yes/no) | Categorical | + | ||
| Access to credit through social contacts (1. I need but no access, 2. I do not need credit, 3. I use credit) | Categorical | + | ||
| Exclusion (1. Not at all 2. Somewhat 3. Very much) | Ordinal | − | ||
| Collective action (1. Never, 2. Once, 3. Twice, 4. Frequently) | Ordinal | + | ||
| Support from the community (yes/no) | Categorical | + | ||
| Trust in matters of borrowing and lending (1. Do trust 2. Do not trust) | Categorical | + | ||
| Looking out for the welfare of one another (Strongly disagree 2. Disagree 3. Neither agree nor disagree 4. Agree 5. Strongly agree) | Ordinal | + | ||
| Cooperation in farming activities (yes/no) | Categorical | + | ||
| Resolving dispute (1. No one; people work it out between themselves, 2. Partly with the help of other people 3. With the help of other people) | Categorical | + | ||
| Institutions and entitlements | Formal local organizations | Number | + | |
| Informal local organizations | Number | + | ||
| Local institutions relied upon for support during times of climate hazard | Number | + | ||
| Equitability of access to the support provided by local institutions (yes/no) | Categorical | + | ||
| Regulating access to key resources during times of climate hazard (yes/no) | Categorical | + | ||
| Equitability of access to key resources (yes/no) | Categorical | + | ||
| Dependence on outside support from local institutions (yes/no) | Categorical | − | ||
| Restraining local rules and norms (yes/no) | Categorical | − | ||
| Knowledge and information | Knowledge and information on adaptation strategies (yes/no) | Categorical | + | |
| Adequacy of knowledge and information (yes/no) | Categorical | + | ||
| Systems for data gathering, information analysis, and dissemination (yes/no) | Categorical | + | ||
| Innovation | Adoption of new practices (yes/no) | Categorical | + | |
| Taking risks and exploiting new opportunities (yes/no) | Categorical | + | ||
| Ability and willingness to adjust (yes/no) | Categorical | + | ||
| Access to new and improved technology (yes/no) | Categorical | + | ||
| Flexible and forward-looking Decision-making | Access to climate information (yes/no) | Categorical | + | |
| Capacity to deal with hazards (yes/no) | Categorical | + | ||
| Provision of support (yes/no) | Categorical | + | ||
| Developing plans (yes/no) | Categorical | + | ||
| Learning from experience (yes/no) | Categorical | + | ||
| Taking the right measures (yes/no) | Categorical | + | ||
| Flexibility in decision making (yes/no) | Categorical | + | ||
| Systems for reviewing and adjusting priorities (yes/no) | Categorical | + | ||
| Transparency in decision making (yes/no) | Categorical | + | ||
| Regulations to protect natural resources (yes/no) | Categorical | + | ||
Source: Authors’ conceptualization.
Table 2.
Overall structure of the aggregate adaptive capacity index, composite sub–indices, and component indicators.
Table 2.
Overall structure of the aggregate adaptive capacity index, composite sub–indices, and component indicators.
| AC | Asset Base (−0.40) | Natural Asset (0.32) | Farmland (−0.43) | More productive land (0.70) |
| Less productive land (−0.70) | ||||
| Grazing land (0.49) | Access to grazing (0.03) | |||
| Size of grazing land (1.00) | ||||
| Woodland (0.70) | Woodland ownership (0.56) | |||
| Size of woodland (0.56) | ||||
| Water resource (−0.30) | Access to water (−0.80) | |||
| Quality of water (0.80) | ||||
| Physical Asset (0.42) | House type (0.49) | Distance to the road (0.06) | ||
| Mobile phone (0.40) | Irrigated land (0.02) | |||
| Radio (0.35) | Agricultural tools (0.29) | |||
| Electricity (0.23) | ||||
| Financial Asset (0.35) | Annual income/capita (0.68) | Remunerative income (0.59) | ||
| LDI (−0.12) | Loan (−0.13) | |||
| Saving (0.05) | Livestock in TLUs (0.39) | |||
| Human Asset (−0.37) | Education (0.48) | Health status (0.34) | ||
| Training (0.56) | Dependency Ratio (0.00) | |||
| Social Asset (−0.68) | Membership in CBOs (0.49) | Trust in borrowing and lending (0.43) | ||
| Networks (0.07) | Trust in welfare (0.02) | |||
| Access to credit (0.51) | Cooperation (0.05) | |||
| Exclusion (0.11) | Solidarity (0.05) | |||
| Collective action (0.09) | Conflict resolution (0.01) | |||
| Inst. and Ent. (0.61) | Formal organizations (0.65) | Informal organizations (0.51) | Reliable local institutions during hazards (0.04) | |
| Equitability of support (0.30) | Regulation of resources (0.73) | Equitability of access to key resources (0.12) | ||
| Dependence on outside support (0.03) | Restraining rules and norms (0.34) | |||
| K&I (0.50) | Knowledge and information provision (0.28) | Adequacy of information and knowledge (0.90) | Systems for data gathering, analysis and dissemination (0.95) | |
| Innovation (0.43) | Adoption of new practices (0.83) | Taking risks and exploiting new opportunities (0.62) | Ability and willingness to adapt (0.80) | |
| Access to new and improved technologies (−0.16) | ||||
| Decision- making (−0.17) | Access to information (0.72) | Capacity to deal with the challenges (0.84) | Provision of support (0.50) | |
| Developing plans (0.84) | Learning from experience (0.76) | Taking the right measures (0.82) | ||
| Flexibility in decision-making (0.72) | Systems for adjusting priorities (0.80) | Transparency in decision-making (0.70) | ||
| Regulations to protect natural resources (0.58) | ||||
Source: Authors’ analysis based on the household survey.
© 2020 by the authors. Licensee MDPI, Basel, Switzerland. This article is an open access article distributed under the terms and conditions of the Creative Commons Attribution (CC BY) license (http://creativecommons.org/licenses/by/4.0/).
Share and Cite
MDPI and ACS Style
Mesfin, D.; Simane, B.; Belay, A.; Recha, J.W.; Schmiedel, U. Assessing the Adaptive Capacity of Households to Climate Change in the Central Rift Valley of Ethiopia. Climate 2020, 8, 106. https://0-doi-org.brum.beds.ac.uk/10.3390/cli8100106
AMA Style
Mesfin D, Simane B, Belay A, Recha JW, Schmiedel U. Assessing the Adaptive Capacity of Households to Climate Change in the Central Rift Valley of Ethiopia. Climate. 2020; 8(10):106. https://0-doi-org.brum.beds.ac.uk/10.3390/cli8100106
Chicago/Turabian StyleMesfin, Demamu, Belay Simane, Abrham Belay, John W. Recha, and Ute Schmiedel. 2020. "Assessing the Adaptive Capacity of Households to Climate Change in the Central Rift Valley of Ethiopia" Climate 8, no. 10: 106. https://0-doi-org.brum.beds.ac.uk/10.3390/cli8100106
Note that from the first issue of 2016, this journal uses article numbers instead of page numbers. See further details here.