Characteristics of Climate Change in the Lancang-Mekong Sub-Region


1
Key Laboratory of Land Surface Pattern and Simulation, Institute of Geographic Sciences and Natural Resources Research, Chinese Academy of Sciences, Beijing 100101, China
2
College of Resources and Environment, University of Chinese Academy of Sciences, Beijing 100049, China
*
Author to whom correspondence should be addressed.
Climate 2020, 8(10), 115; https://0-doi-org.brum.beds.ac.uk/10.3390/cli8100115
Submission received: 19 September 2020
/
Revised: 6 October 2020
/
Accepted: 7 October 2020
/
Published: 10 October 2020
Abstract
:The Lancang-Mekong River is an important international river in Southeastern Asia. In recent years, due to climate change, natural disasters, such as drought and flooding, have frequently occurred in the region, which has a negative effect on the sustainable development of the social economy. Due to the lack of meteorological monitoring data in the six countries across the region, the study of the characteristics of climate change in this area is still scarce. In this paper, we analyze the characteristics of climate change in the Lancang-Mekong sub-region (LMSR) during 2020–2100 based on the climatic data of CMIP5, using the linear trend rate method, cumulative anomaly method, the Mann–Kendall test, and Morlet wavelet analysis. The results showed that the annual mean temperature and annual precipitation in the LMSR increased significantly. The annual average temperature in this area increased at a rate of 0.219 °C/10a (p < 0.05) and 0.578 °C/10a (p < 0.05) in the RCP4.5 and RCP8.5 scenarios, respectively; the annual precipitation in the area was 29.474 mm/10a (p < 0.05) and 50.733 mm/10a (p < 0.05), respectively. The annual average temperature in the region changed abruptly from low to high temperatures in 2059 for the RCP4.5 scenario and 2063 for RCP8.5. The annual precipitation in the area changed from less to more in 2051 for the RCP4.5 scenario and 2057 for RCP8.5. The results of wavelet analysis showed that the annual mean temperature in the LMSR had no significant change period at the 95% confidence level under the scenario of RCP4.5 and RCP8.5. Under the scenario of RCP4.5 and RCP8.5, the annual precipitation had a significant 3.5-year and 2.5-year periodicity, respectively. Extreme climate events tended to increase against the background of global warming, especially in high emission scenarios.
1. Background
In this paper, a special transboundary basin, the Lancang-Mekong sub-region (LMSR), is studied. At present, there are about 263 international watersheds in the region, accounting for 60% of the global freshwater flow [1]. China and five Southeast Asian countries (Kingdom of Cambodia, Thailand, Laos, Myanmar, Vietnam) organize the political, economic, and social life along the Mekong River. Where boundaries are crossed, the use of international rivers and basins will directly or indirectly affect use by other countries [2]. Therefore, the international watershed has become one of the root causes of cooperation and disputes among international politics [3,4]. Since 2000, China has worked with five other countries in Southeast Asia in various ways [5,6]. In November of 2015, the ministers of foreign affairs of six countries crossed by the Mekong River announced the start of the Lancang-Mekong Mekong cooperation in Yunnan and identified five areas of priority, including interconnection, productivity cooperation, cross-border economic cooperation, water resource cooperation, agriculture, and poverty reduction cooperation [7,8]. The LMSR is China’s land bridge connecting Southeast and South Asia. It is an important node in the “One Belt and One Road” initiative, and its geographical location is very important. International cooperation in the LMSR has reached a new height.
The impact of climate change on the LMSR is long-term and complex. The LMSR is located in the monsoon active area. Every year, it experiences typhoons and rainstorms of various intensities, causing floods, droughts, landslides, mudslides, and other disasters. Social and economic development and people’s lives and property are under great threat. These challenges often have a potential social and political impact, causing social unrest. For example, increasing poverty caused by disasters, frequent occurrence of diseases, and increasing social pressure caused by competition for resources will have a potential impact on national relations and regional security and stability. In 2010, climate abnormal change caused severe drought in southwest China and the Mekong River basin. The water level of the Mekong River fell to its lowest level in the past 50 years, exacerbating tensions between China and downstream countries. In the same year, China began to build the Lancang River Dam. Some downstream countries have linked the drought with China’s dam construction, and a strong public opinion offensive broke out. It can be said that the current and potential climate problems and risks pose a serious challenge to the sustainable development of the LMSR. There is a consensus in the LMSR to strengthen cooperation on climate change and build a comprehensive risk prevention mechanism. This paper analyzes the characteristics of future climate change in the LMSR to provide support for the assessment of natural disasters in the region.
2. Introduction
Climate change has become a major issue affecting the sustainable development of human society. The fifth assessment report of the Intergovernmental Panel on Climate Change (IPCC) highlighted how from 1880 to 2012, the average temperature of the Earth’s surface has increased by 0.85 °C, and the heating rate has accelerated [9]. Climate change has had many negative effects on human health and safety. Climate change generally affects the development of the social economy through the two characteristics of mean fluctuation and extreme climate. The analysis of these two characteristics requires more detailed monitoring data. However, for some areas where meteorological monitoring data are rather scarce, it is difficult to analyze the characteristics of climate change. The emergence of climate models provides reliable surrogate data for the analysis of regional climate change characteristics where meteorological monitoring station data are lacking, especially regarding future climate change research [10]. The fifth phase of the Coupled Model Intercomparison Project (CMIP5) provides important basic data for the fifth assessment report of the IPCC [11]. In the fifth assessment report of the IPCC, researchers used the CMIP5 climate model and the new emission scenarios (namely the typical concentration path RCP, including RCP2.6, RCP 4.5, RCP 6.0, and RCP 8.5 scenarios) to predict future climate system changes and achieved good results [12].
The most important manifestation of climate change is in changes in temperature and precipitation. At present, a great deal of research has been carried out in the analysis of the characteristics of temperature and precipitation. These studies have discussed the trend and periodicity of temperature and precipitation in different regions. Existing research methods include linear trend regression and a five-year moving average [13,14]. In addition, researchers have used the Mann–Kendall test to detect abrupt changes in temperature and precipitation in time series [15,16,17,18,19,20]. To analyze the periodic variations of temperature and precipitation, Zhang et al. [21] and Xu et al. [22] used wavelet analysis to quantitatively describe the periodicity of temperature and precipitation in China and the Tianshan Mountains. Based on the existing time-series data, the Hurst index is often used to predict future climate change [23]. In the study of temperature and precipitation changes, researchers often combine the above methods to study the characteristics of climate change. In terms of precipitation change, Sharm et al. [24] used the Mann–Kendall and the Theil Sen slope method to study the long-term spatial and temporal variations of annual and seasonal runoff during 1901–2013 over Damodar River basin. Using the Mann–Kendall and the modified Mann–Kendall method, the temporal and spatial patterns of annual precipitation and seasonal precipitation in Pakistan during 1961–2010 were analyzed [25]. Using a linear fitting model, the Mann–Kendall and Shannon entropy method, the temporal and spatial pattern of precipitation trend in the Yellow River basin during 1960–2006 has been studied [26].
Researchers have also combined the study of precipitation with air temperature to investigate the climate change characteristics of a region. For example, based on the historical precipitation and temperature data of West Anatolia in Turkey, Partal et al. [27] used the Mann–Kendal and Pettitt methods to analyze the data variation trend. Meng et al. [28] used linear regression, five-year moving average, the Mann–Kendall test, cumulative variance analysis, and Pettitt to test changes in temperature and precipitation in the Hexi Corridor, Northwest China’s Gansu province. Using various statistical methods, temporal and spatial characteristics, trends, and abrupt points, the annual variation periods of temperature and precipitation in the Yangtze River basin of China have been analyzed [29]. In addition, based on available data, researchers can analyze future trends of temperature and precipitation. For example, based on the observation data of 118 meteorological stations in the Yellow River basin in China during 1957–2015, Ma et al. [30] analyzed the spatial and temporal variations of temperature and precipitation using the Mann–Kendall test, Pettitt test, and Hurst index. Using the Mann–Kendall and inverse distance weighted (IDW) interpolation, the temporal and spatial trends of climate change in Xinjiang, China, can be revealed. And by calculating the Hurst index, future climate change in Xinjiang, China can be predicted [31].
At present, the study of the Lancang-Mekong sub-region (LMSR) mainly focuses on water resources, ecology, and so on [32,33,34,35]. Due to the lack of meteorological monitoring stations, fewer studies on climate change have been carried out. Fragmentary research on regional climate change has mostly been carried out by the six countries in the LMSR individually, and rarely involves the whole LMSR. In terms of climate change research, Shi and Chen [36] analyzed the temporal trend and spatial distribution of temperature and precipitation between 1961 and 2011 in the Yunnan province of China based on the observation data from 22 meteorological stations and discussed their relationship with land cover change. Nguyen et al. [37] analyzed the rainfall and temperature changes in Vietnam during 1971–2010. The average temperature in Vietnam was found to have increased by 0.26 °C every ten years since the 1970s, which is about two times the rate of global warming in the same period. Currently, most studies of extreme climate research have focused on extreme precipitation and extreme high temperature. For example, based on the daily observations of 28 meteorological stations between 1958 and 2013, Xu [38] analyzed the temporal and spatial characteristics of extreme precipitation and extreme air temperature in Yunnan. At the same time, the Mann–Kendall method was used to study the trend of extreme precipitation and air temperature. In addition, Sein [39] used RCLIMDEX 1.1 software to study the extreme temperature and precipitation patterns in Myanmar during 1981–2015, and Sharma [40] analyzed the trend of extreme daily temperature and rainfall during 1961–2002 in Western Thailand using linear regression to estimate the trend of change. Thoeun and Chan [41] analyzed the future climate change of Cambodia and described the trend of maximum and minimum temperature and rainfall during 2008–2099 by linking global and regional climate change.
Climate change has become a hot issue of global environmental change research. With the in-depth development of economic globalization, different countries are increasingly infiltrating and interdependent in economy, politics, society, and culture worldwide. For LMSR cooperation, the risk caused by climate change has threatened the sustainable development of the LMSR. Although the countries in the LMSR have independently carried out studies related to climate change, under the new background of international cooperation, it is necessary to discern the overall climate change in the LMSR. Thus, our research can contribute to filling the knowledge gap of the lack of climate change panorama in the region. Furthermore, our research also provides valuable information for the assessment of the impact of climate change and the prevention and response of climate change risks. The research method of climate change characteristics has been widely used in global and regional climate change analyses, such as linear trend analysis and cumulative anomaly method. With the development of science and technology, new research methods, such as Mann–Kendall mutation detection and wavelet analysis, have been gradually applied in climate change analysis. Differently from the previous studies which focus on historical climate change analysis, this paper emphasizes the future characteristics’ analysis of climate change in the LMSR using CMIP5 climate model data. In specific, this paper aims to analyze: (1) the trend of temperature and precipitation in the LMSR; (2) abrupt change and cycle change in temperature and precipitation in the LMSR; (3) the extreme climate change characteristics in the LMSR. The remainder of this paper is arranged as follows. In Section 3, a brief description of the study area, dataset, and methods are provided, respectively. Section 4 presents the results of climate change in the LMSR. The discussion and conclusions are given in Discussion (Section 5) and Conclusions (Section 6), respectively.
3. Materials and Methods
3.1. Study Area
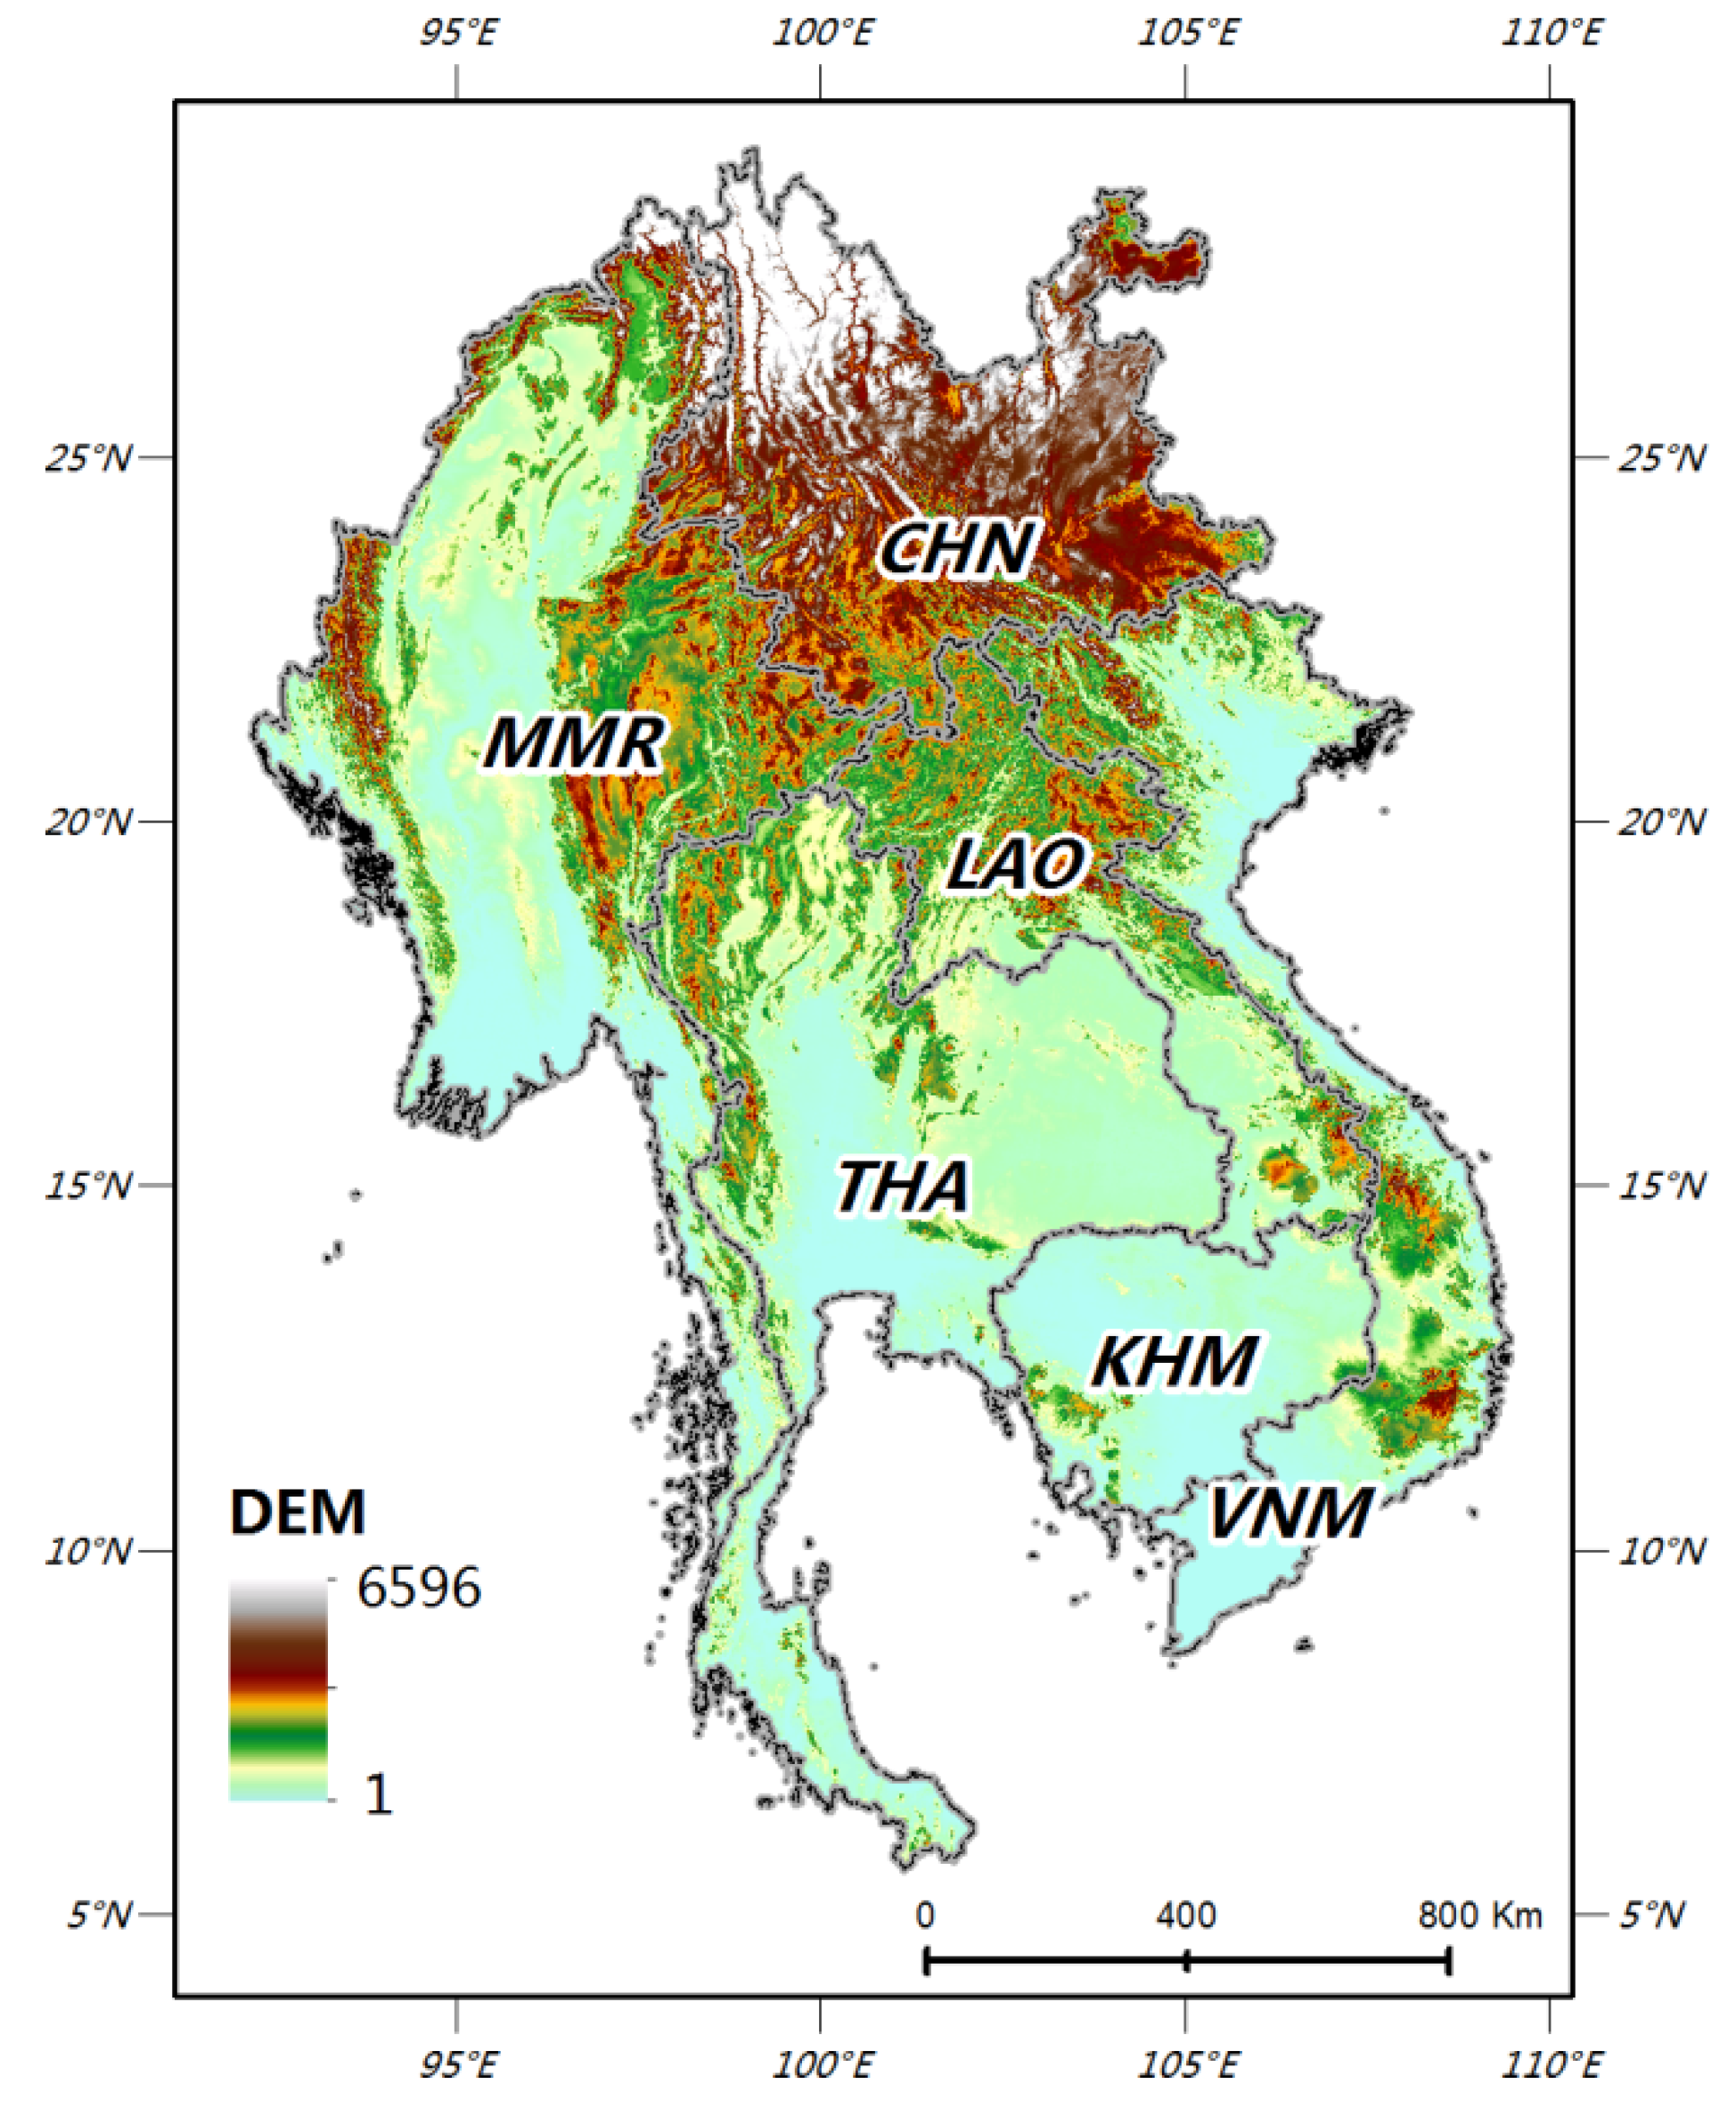
The study area in this paper consists of the six countries through which the Lancang-Mekong River flows (Figure 1); Kingdom of Cambodia, Vietnam, Laos, Myanmar, Thailand, and Yunnan, China. The geographical location of the region is roughly northern latitude 5°36′ to 29°14′, and east longitude 92°10′ to 114°22′. The south and north span is nearly 24°, and the east and west span is nearly 22°. In 2018, the total area of this region was 2,568,600 km2, with a total population of about 320 million and a GDP of 11,163 billion dollars. The Lancang-Mekong River is an important international river. It originates in Tanggula Mountain, Qinghai, China, and flows into the South China Sea near Hu Zhiming, Vietnam. Along the way, the river flows through Tibet, China, and then comes out of the southern Xishuangbanna of Yunnan to Myanmar, Laos, Thailand, Kingdom of Cambodia, and Vietnam. In China, the Lancang-Mekong River is called the Lancang River, while outside of China, it is called the Mekong River. The total length of the Lancang-Mekong River is 4880 km; it is 2130 km long in China, 777 km in Laos, and 502 km in Kingdom of Cambodia. It covers many climatic areas, such as the cold temperate zone, temperate zone, subtropical zone, and tropical zone. Moreover, the region has many geographical features, such as glaciers, alpine mountains, highland meadows, deep mountain canyons, hilly hills, alluvial plains, and estuarine deltas, with great economic potential and development value.
3.2. Data Sources
CMIP5 provides important basic data for the fifth assessment report of the IPCC. The spatial resolution of most climate models is low, and different climate models have different simulation accuracy for future climate. In this study, the CMCC-cm model of CMIP5 was selected, which is an atmosphere–ocean atmosphere circulation model developed by the Euro-Mediterranean Centre for Climate Change. The data were downloaded from the CMIP5 official website [42]. This model data has been used in many applications and has the outstanding advantage of high spatial resolution. Zhi et al. [43] discussed the super ensemble hindcast of the surface air temperature over East Asia and its surroundings based on the CMIP5 runs of 15 climate system models. The results show that the CMCC-cm model has the best return effect on the main modes of temperature change. To assess the reliability of future climate change research, the accuracy of CMCC-CM model data was analyzed. Due to the lack of observational data, monthly mean temperature and precipitation data were obtained from the latest version of CRU-TS 4.0 [44] from 1980 to 2015 as validation data. The dataset has been widely used to evaluate global climate models [45]. Furthermore, Wen et al. [46] evaluated the CRU data in China, which showed that the CRU data could be used with high confidence. The spatial resolution of the data is 0.5° × 0.5°. The data of CMCC-cm and CRU from 1980 to 2015 were statistically calculated and analyzed. Under RCP4.5 and RCP8.5 emission scenarios, the annual average accuracy of the annual mean temperature was 97.11% and 96.94%, and the annual precipitation accuracy was 71.14% and 69.38%, respectively. The accuracy is reflected by 1- relative error. The above shows that the CMCC-CM model data can reflect reality within the acceptable error range. The accuracy of temperature was better than that of precipitation. Based on this, we selected the data on daily and monthly precipitation and temperature during 2020–2100 under RCP4.5 and RCP8.5 emission scenarios. This was used to analyze climate change and extreme climate change in the LMSR.
3.3. Research Methods
In this paper, the annual and interdecadal variations of temperature and precipitation in the LMSR were analyzed. Trend analysis and cumulative anomaly analysis were used to analyze the trend of time series. At the same time, we used the Mann–Kendall test to detect abrupt changes in climatic elements. We used the Morlet wavelet analysis to extract the cycle of climatic elements. Finally, we calculated the extreme high temperature and extreme precipitation index, and then analyzed the extreme climate events in the LMSR.
3.3.1. Unary Linear Trend Analysis
The change trend of climatic elements is generally described by one linear regression model. It is used to quantitatively analyze the linear trend of climatic element change. In the formula, we use yi to represent a climatic variable with a sample size of N, and use xi to express the time corresponding to yi, and finally establish a linear regression between xi and yi [47,48]:
The regression coefficient b indicates the trend tendency of climate variable y; the trend change rate b is obtained by the least square method; 10b is the climate tendency rate, and the unit is h/10a. At the same time, we calculated the correlation coefficient R and carried out the significance test.
3.3.2. Cumulative Anomaly Method
The variation of the cumulative anomaly curve can be used as a method of climate trend analysis. It can be used to describe the average variation of interdecadal variability quantitatively. For sequence x, the cumulative anomaly of t at a certain time is expressed as [29]:
This study used a cumulative distance curve to judge the stage of the change. When the curve showed an upward trend, it indicated that the meteorological elements were in the high stage. Alternately, when the curve showed a downward trend, it indicated that the meteorological elements were in the low stage. In the cumulative anomaly curve, the increase indicated that the cumulative anomaly value increased. The slight variation of the curve can indicate the change in the precipitation anomaly, while the long-term curve reflects the long-term trend of precipitation.
3.3.3. Mann–Kendall Mutation Detection
We use the Mann–Kendall nonparametric test to analyze the abrupt change of temperature and precipitation. The advantage of this method is that it does not require samples to follow a certain distribution, and it is not disturbed by a few abnormal values [49]. Therefore, this method is the most effective method to test the abrupt change of time series, and it can identify the starting time of mutation [50]. The basic principle of the Mann–Kendall test is that the climate sequence is x (x1, x2,…, xn); mi denotes the cumulative number of number i samples xi greater than xj (1 ≤ j ≤ i), which is used to define a statistic:
Under the assumption of random independence of the original sequence, the mean and variance of dk are:
Standardize dk.
UFk is a standard distribution, and its probability a1 = prob (|U| > |UFk|) can be obtained through computation or look-up table. Under the condition of giving a significant level a (a = 0.05, u0.05 = 1.96), if it is |UF| > u0, it shows that the climate sequence presents a significant trend of change.
According to the inverse sequence of x (xn, xn−1, …, x1), repeating the above process, and making |UBk| = −UFk, k = n, n − 1, …, UB1 = 0, if the UF value is greater than 0, this indicates that the sequence is on the rise. If less than 0, it shows a downward trend. When it exceeds the confidence level, it shows that the trend of the rise (decrease) is significant. If the two curves of UF and UB appear at an intersection point, and the intersection point is in the confidence interval, the corresponding point of intersection is the time of mutation initiation.
3.3.4. Wavelet Analysis
Wavelet analysis is a breakthrough in Fourier analysis. In the analysis of meteorological sequence, Fourier transform can show the relative contribution of meteorological time series at different time scales, and wavelet transform can not only show the scale of meteorological change, but also show the time and location of change [51,52,53]. In this paper, the periodic variation of annual mean temperature and annual precipitation in the LMSR is studied using complex Morlet wavelet analysis.
For the time series function f(t), the wavelet transform is defined as:
In the formula, Wf (a, b) is the wavelet coefficient, a is the expansion factor, determining the width of the wavelet; b is the translation factor, a parameter reflecting the movement of the wavelet; ψ is the conjugate function of ψ*.
The cone of influence (COI) represents the wavelet spectrum region and the corresponding edge effect. At the edge of COI, the wavelet value will decrease by e−2 [52]. The background power spectrum is tested by red noise, and the first-order autoregressive equation is used for the red noise test process. The background red noise power spectrum is:
In the formula, α is the correlation coefficient of the autoregressive equation in the red noise power spectrum; k is the Fourier frequency coefficient.
Wavelet variance [51]:
At a certain time-scale, the variance of wavelet represents the strength of periodic fluctuations in the time series. The variance process of wavelet variance can reflect the characteristics of time scales (periodicity) and their intensity (energy size) in time series, and the corresponding scale at the peak is the main time scale of the sequence, that is, the main cycle.
3.3.5. Extreme Climate Index
In meteorology, the number of days with a maximum daily temperature above 35 °C is usually referred to as the number of days of high temperature. This temperature will have adverse effects on human life and the ecological environment. Therefore, this paper took the number of days with a maximum daily temperature of more than or equal to 35 °C as the characteristic index of high temperature. A daily precipitation of more than 50 mm was selected as the extreme precipitation index [15].
4. Results
4.1. Interannual Variability of Temperature and Precipitation
Under the RCP4.5 scenario (Figure 2), the annual mean temperature change in the LMSR during 2020–2100 was between 22.95 °C and 25.69 °C. The minimum value appeared in 2022, and the maximum value appeared in 2091. During this period, the regional average annual air temperature gradually increased in the fluctuation, and the climate tendency rate was 0.219 °C/10a (p < 0.05). Under the RCP8.5 scenario (Figure 2), the regional average annual temperature change was between 22.55 °C and 27.94 °C, with the minimum value appearing in 2022, and the maximum value in 2091. The annual mean temperature of the area increased gradually during the fluctuation, and the climate tendency rate was 0.578 °C/10a (p < 0.05). Under the scenario of RCP4.5 or RCP8.5, the annual average temperature in the LMSR will gradually increase in the future, which is consistent with the global warming phenomenon. Compared with the two temperature changes, we found that the climate tendency rate of the annual mean temperature in the LMSR under the RCP8.5 scenario was 0.359 °C/10a higher than that of RCP4.5. Therefore, under the RCP8.5 scenario, the annual temperature rise in the LMSR will change more rapidly.
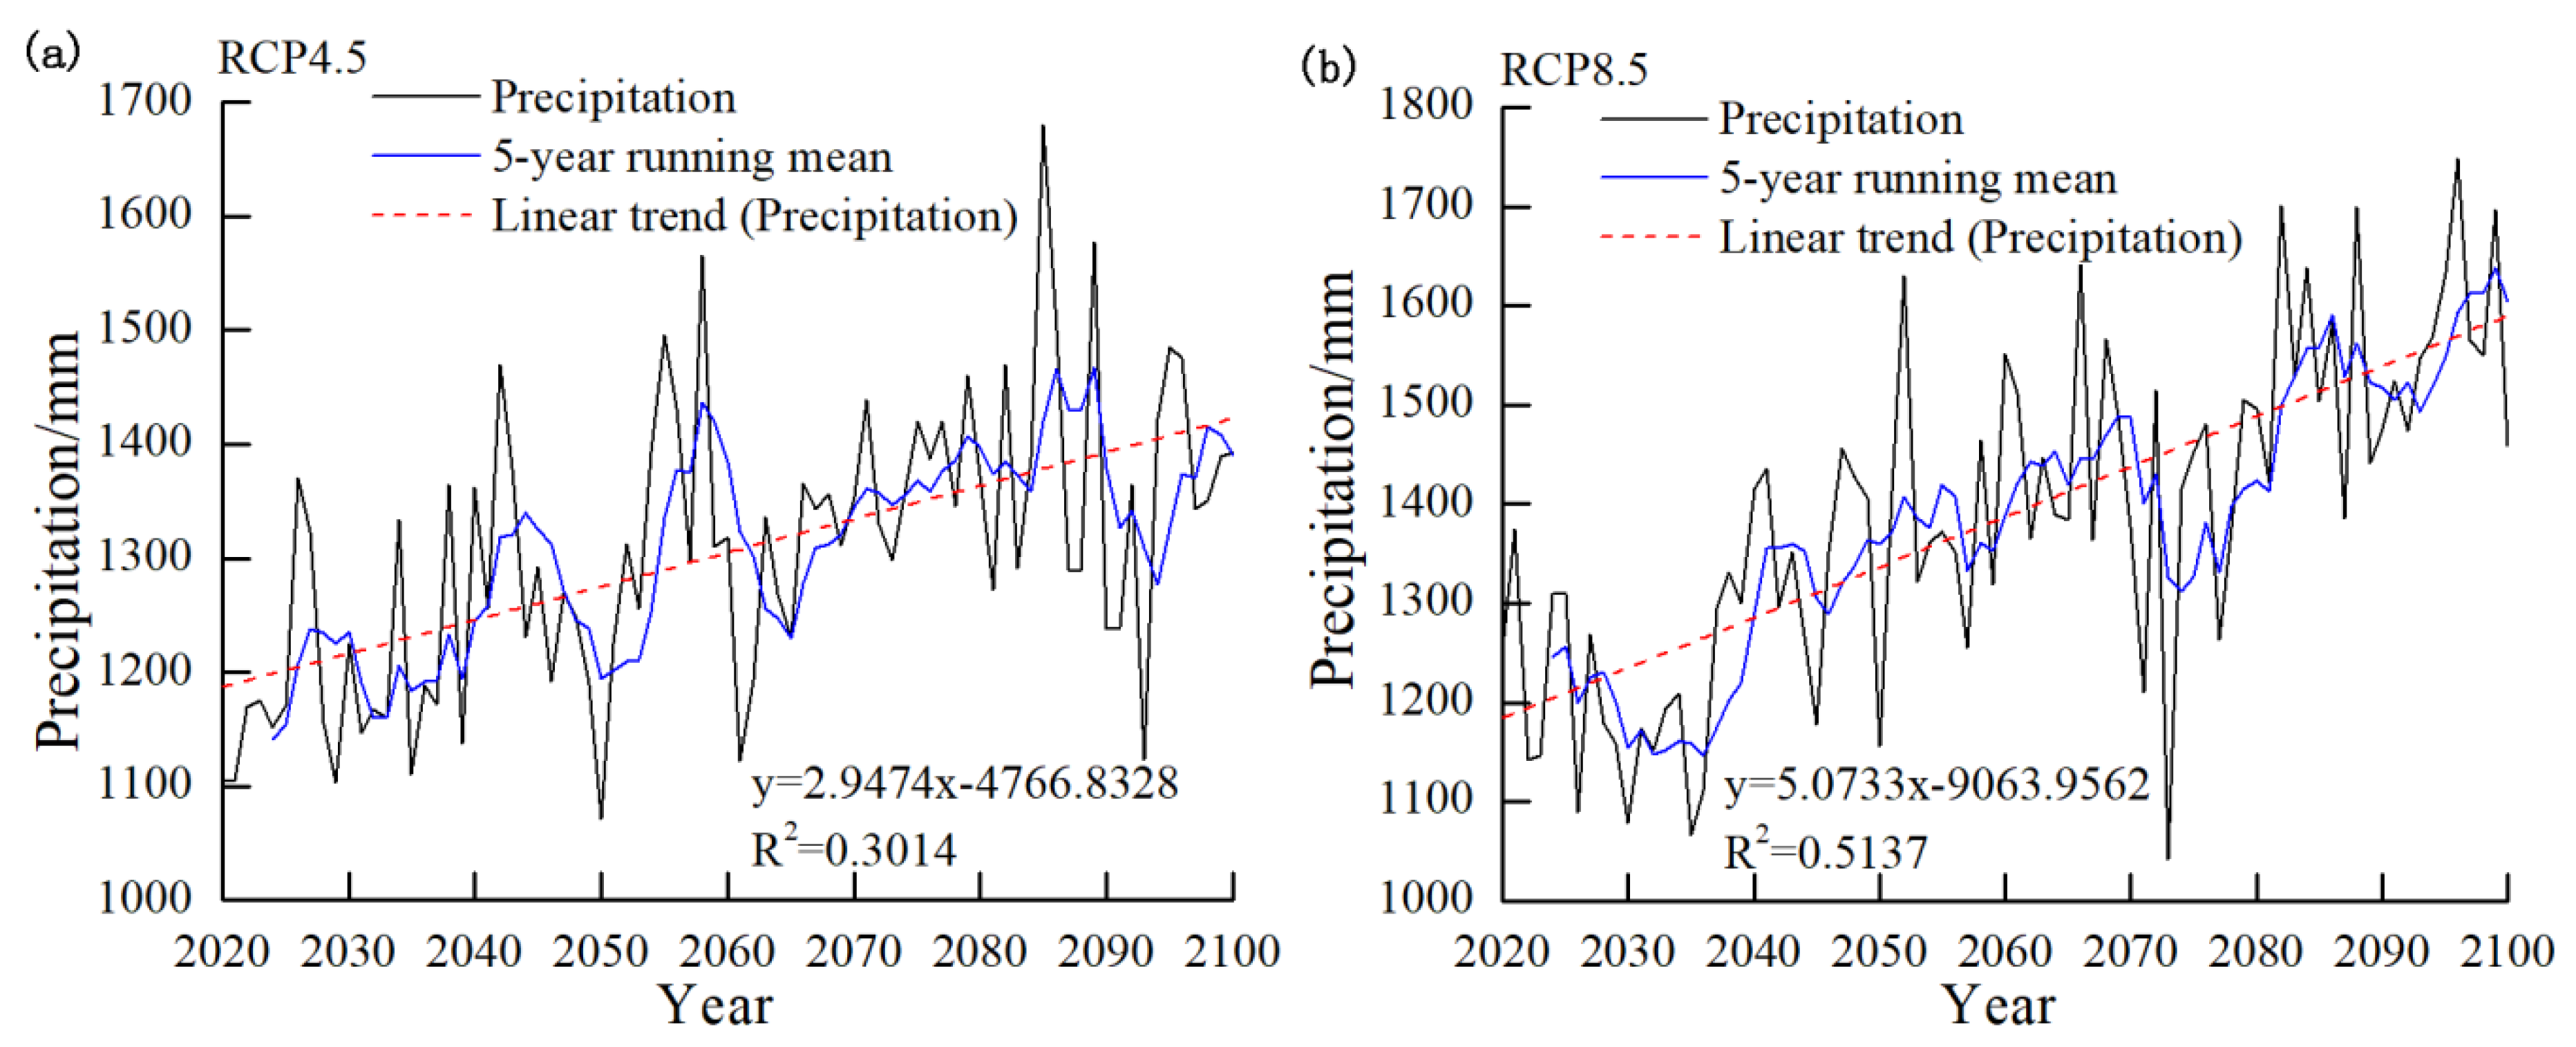
Under the RCP4.5 scenario (Figure 3), the precipitation change in the LMSR during 2020–2100 was between 1071.22 and 1680.57 mm; the minimum value appeared in 2050, and the maximum value appeared in 2085. During this period, the annual precipitation in the area showed an upward trend, and the climate tendency rate was 29.474 mm/10a (p < 0.05). Under the RCP8.5 scenario (Figure 3), the annual precipitation change in the area was between 1041.56 and 1748.49 mm, with the minimum value appearing in 2073. The maximum value appeared in 2096. In general, the annual precipitation in the region was significantly increased, and the climate tendency rate was 50.733 mm/10a (p < 0.05). Under the two climate scenarios, the precipitation in the area will show an obvious upward trend in the future. Within this, the climate tendency rate under the RCP8.5 scenario was larger than that of RCP4.5, so under the RCP8.5 scenario, the change of annual precipitation in the LMSR will be quicker. According to the analysis of annual mean temperature change, we can see that under the RCP8.5 scenario, the change of temperature and precipitation in the LMSR was more significant than that in RCP4.5.
4.2. Abrupt Test of Mean Temperature and Annual Precipitation
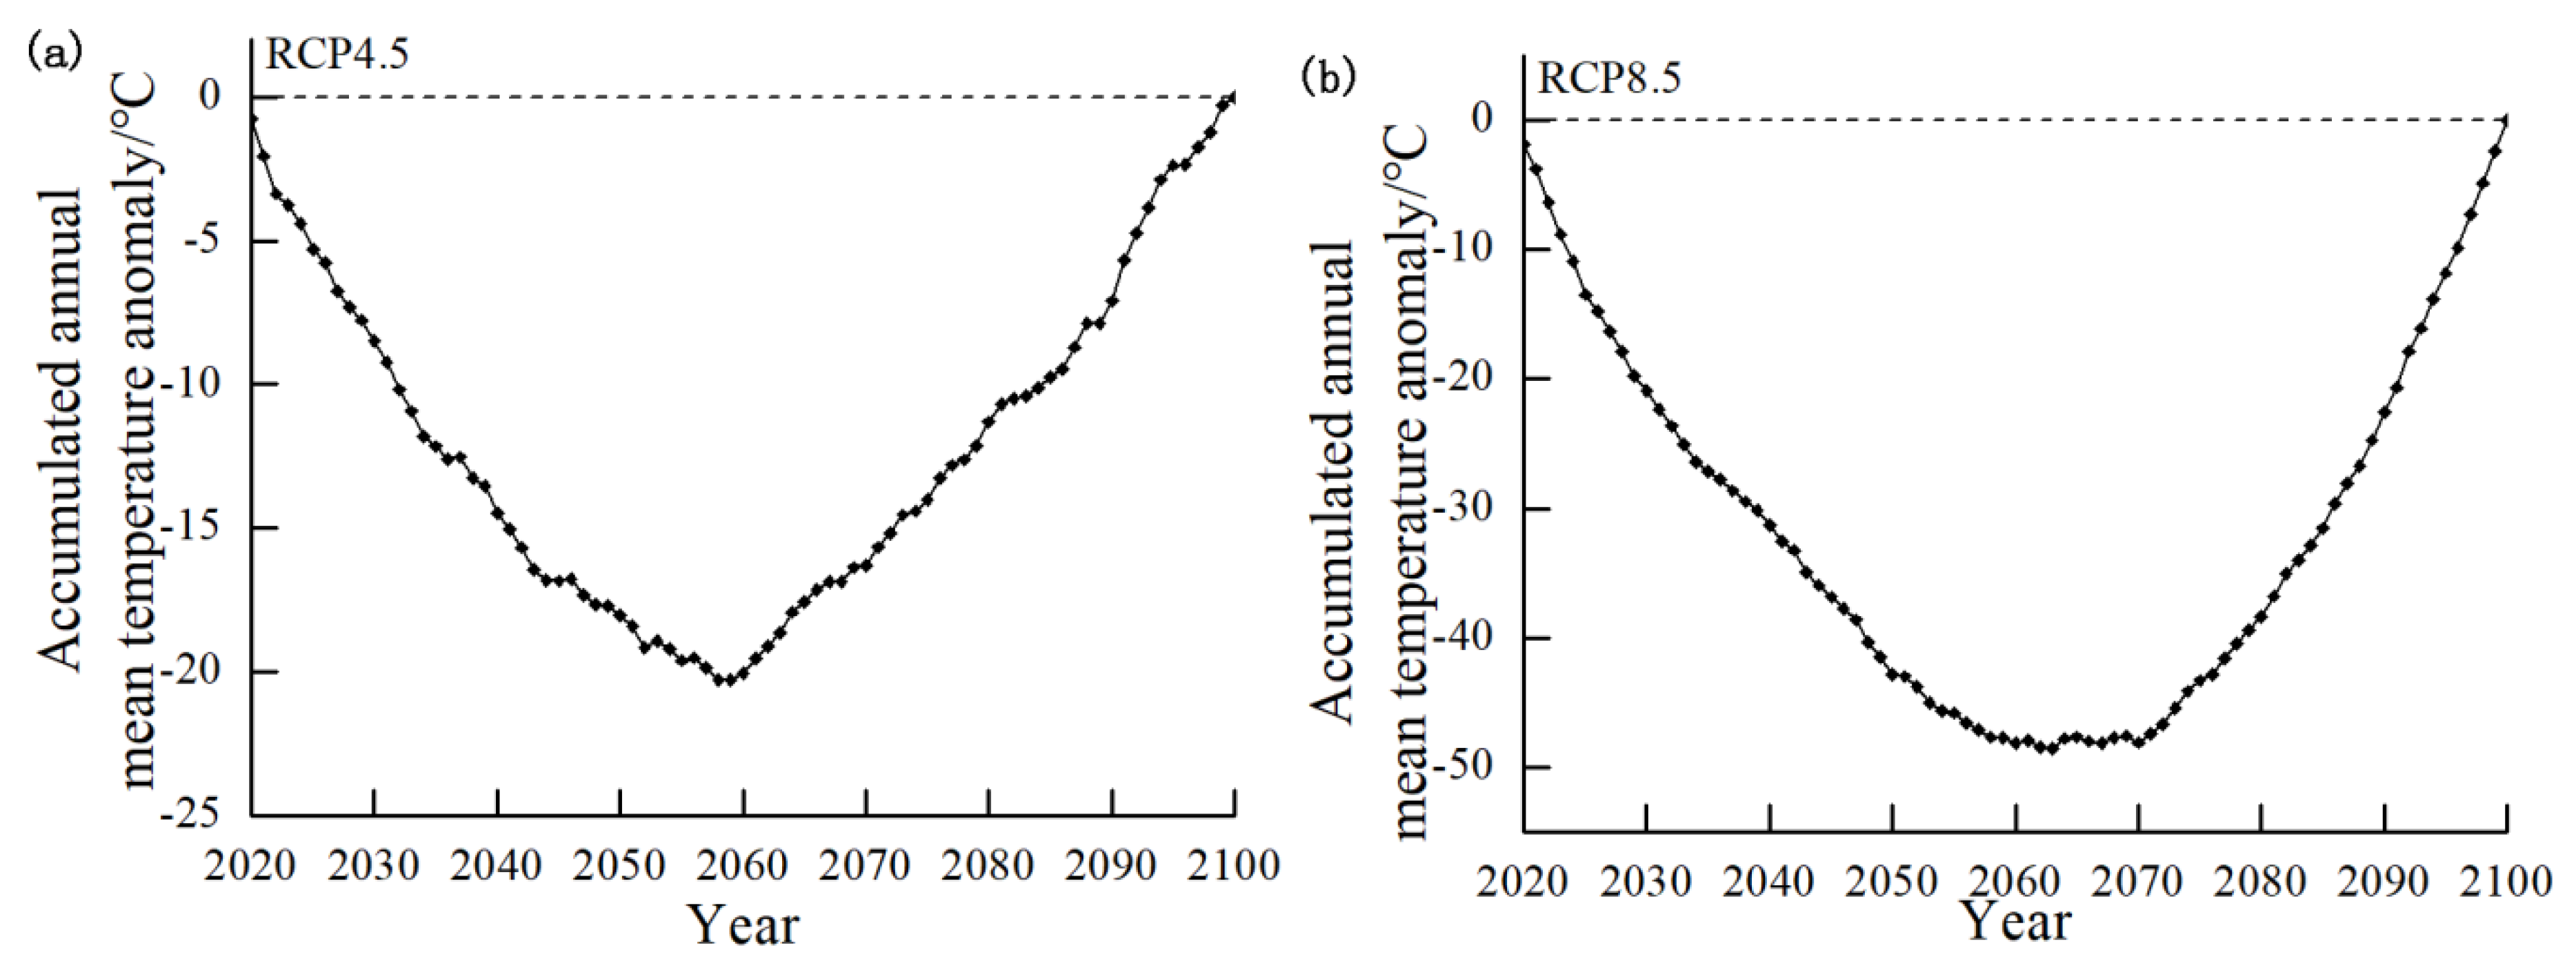
We used the Mann–Kendall method to analyze the annual mean temperature of the LMSR (Figure 4). According to the M-K (Mann–Kendall) curve, the value of UF was basically greater than 0 under the RCP4.5 and RCP8.5 scenarios. It shows that the average mean temperature of the LMSR has an increasing trend from 2020. Under the RCP4.5 scenario, the UF curve was higher than the 0.05 significance level line after 2045, indicating that the temperature will increase more significantly after this year. Under the RCP8.5 scenario, the UF curve exceeded the significance line after 2032, indicating that the annual mean temperature increase is significant. There was no intersection between the UF curve and the UB curve in the confidence interval. It is uncertain when the abrupt change of temperature begins, but it can be seen that the annual mean temperature will increase significantly in the future. The cumulative average of the annual mean temperature under the two climate scenarios presented a “V” character trend, which first decreased and then increased (Figure 5) under the RCP4.5 scenario. The precipitation in the LMSR during 2020–2059 showed a downward trend, and 2059–2100 showed an upward trend. Under the RCP8.5 scenario, the precipitation during 2020–2063 in the LMSR showed a downward trend, while during 2063–2100, it showed an upward trend, and the annual average temperature experienced a downward trend. Combining the above two analyses, we found that although there was no intersection point between the UF curve and the UB curve between 2020 and 2100, the mutation time could not be obtained in the mutation test analysis. However, from the results of the cumulative anomaly analysis, we can infer that in the RCP4.5 scenario, the LMSR experienced a mutation from a low to a high temperature around 2059, and under the RCP8.5 scenario, the mutation occurred from a low temperature to a high temperature around 2063.
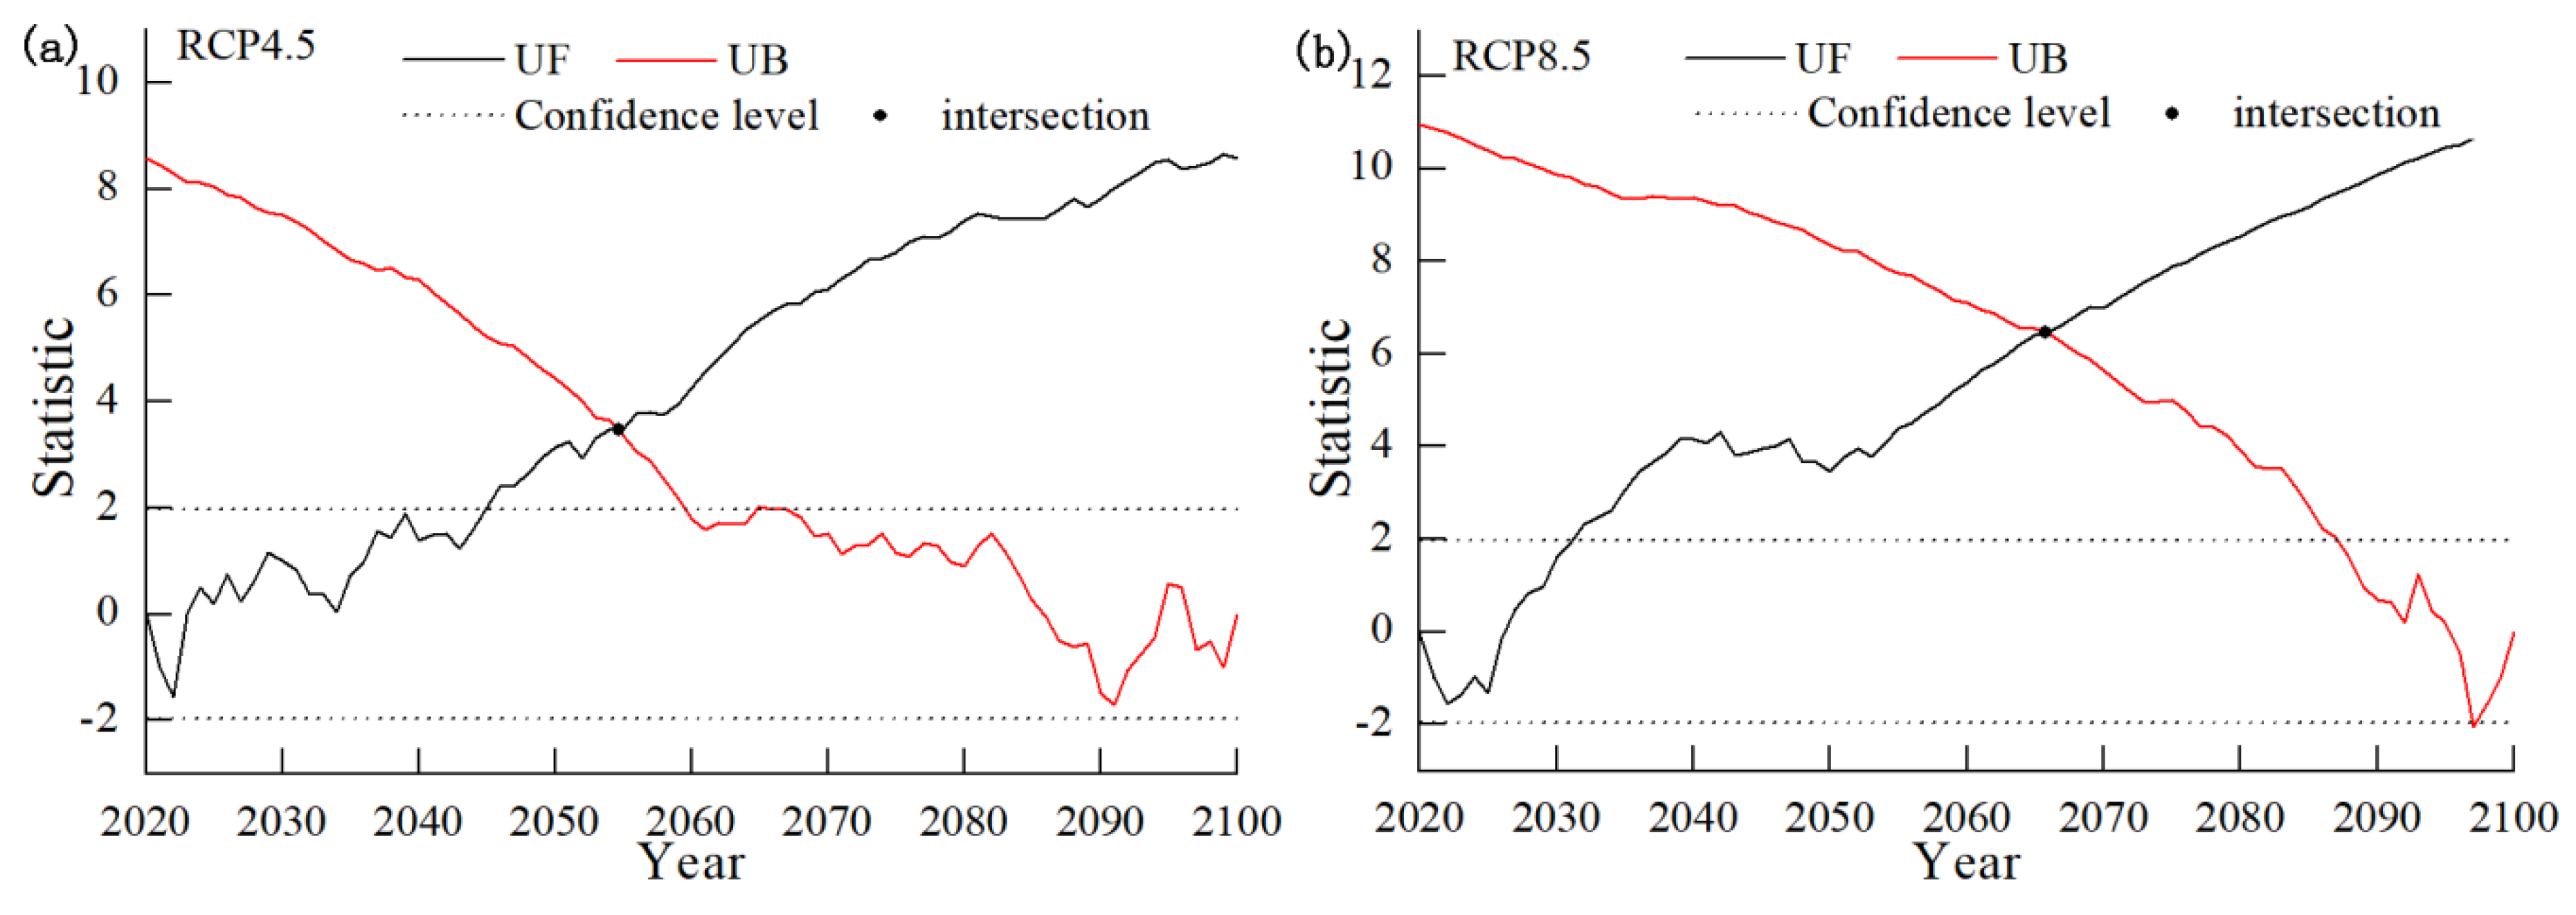
In the scenario of RCP4.5, we conducted the Mann–Kendall test on annual precipitation (Figure 6). The value of UF was basically greater than 0 under the RCP4.5 and RCP8.5 scenarios. It shows that the average precipitation has an increasing trend. We found three intersections between the UF line and the UB line, with one intersection in the confidence interval (during 2050–2051). The UF curve exceeded the significance line after 2050, indicating that the annual precipitation increase is more significant after this year. Under the RCP8.5 scenario, the UF line had no intersection point with the UB line in the confidence interval. The UF curve exceeded the significance line after 2048. The cumulative anomaly analysis showed (Figure 7) that, during 2020–2100, the precipitation in the LMSR has undergone a distinct process of rising and falling. Under the RCP4.5 scenario, the annual rainfall in the LMSR decreased significantly during 2020–2039, the rainfall during 2040–2043 slowly increased, the rainfall during 2044–2053 decreased significantly, the precipitation in 2053 dropped to the lowest level, the rainfall during 2054–2060 continued to rise, and the rainfall in 2061–2065 gradually decreased. During 2066–2100, the precipitation of the LMSR showed an upward trend. It is concluded that in 2039, 2053, and 2060, the annual precipitation of the LMSR is likely to be abrupt. Under the RCP8.5 scenario, the rainfall during 2020–2057 in the LMSR showed a significant downward trend, dropping to a minimum in 2057, and during 2058–2100, rainfall continued to rise. It can be induced that the LMSR experienced an abrupt change of precipitation in 2057. Combined with the analysis results of the two methods, we found that the precipitation in the LMSR changed from less to more in 2051. Under the RCP8.5 scenario, although the mutation time cannot be obtained in the Mann–Kendall test results, it can be deduced from the results of the cumulative anomaly analysis that the precipitation in the LMSR changed from less to more in 2057.
4.3. Analysis of Annual Variation of Mean Temperature and Annual Precipitation
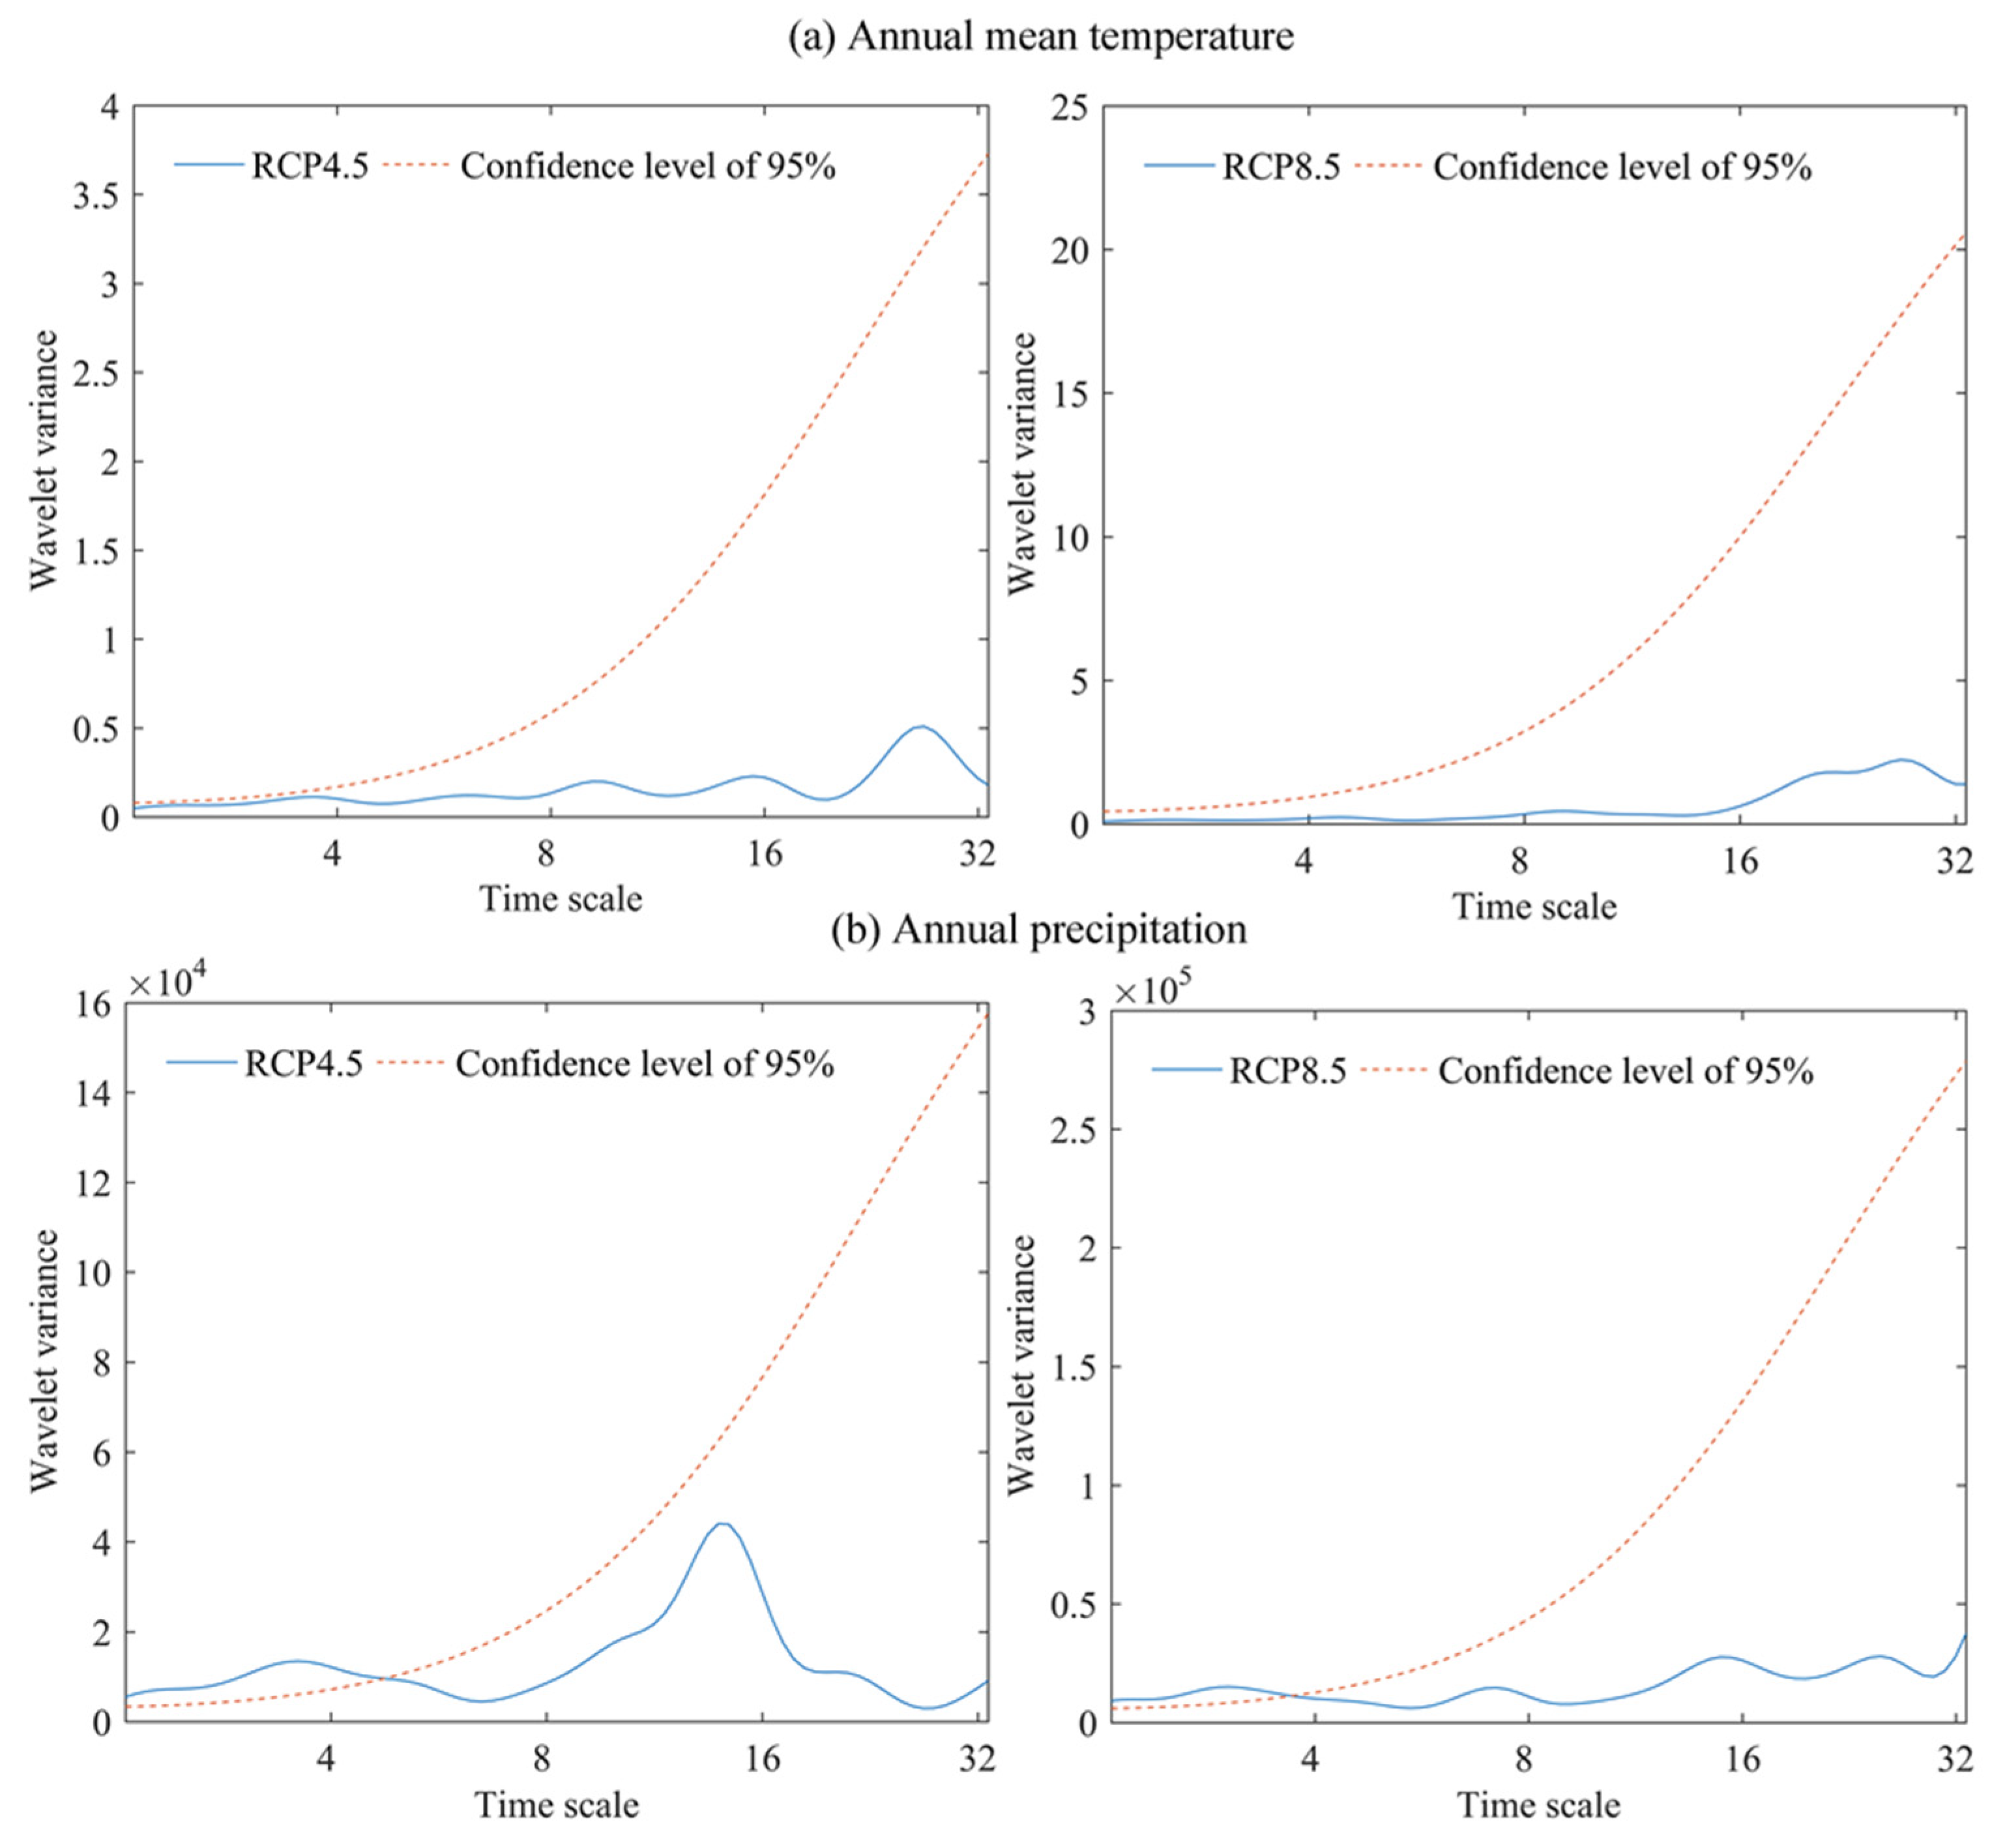
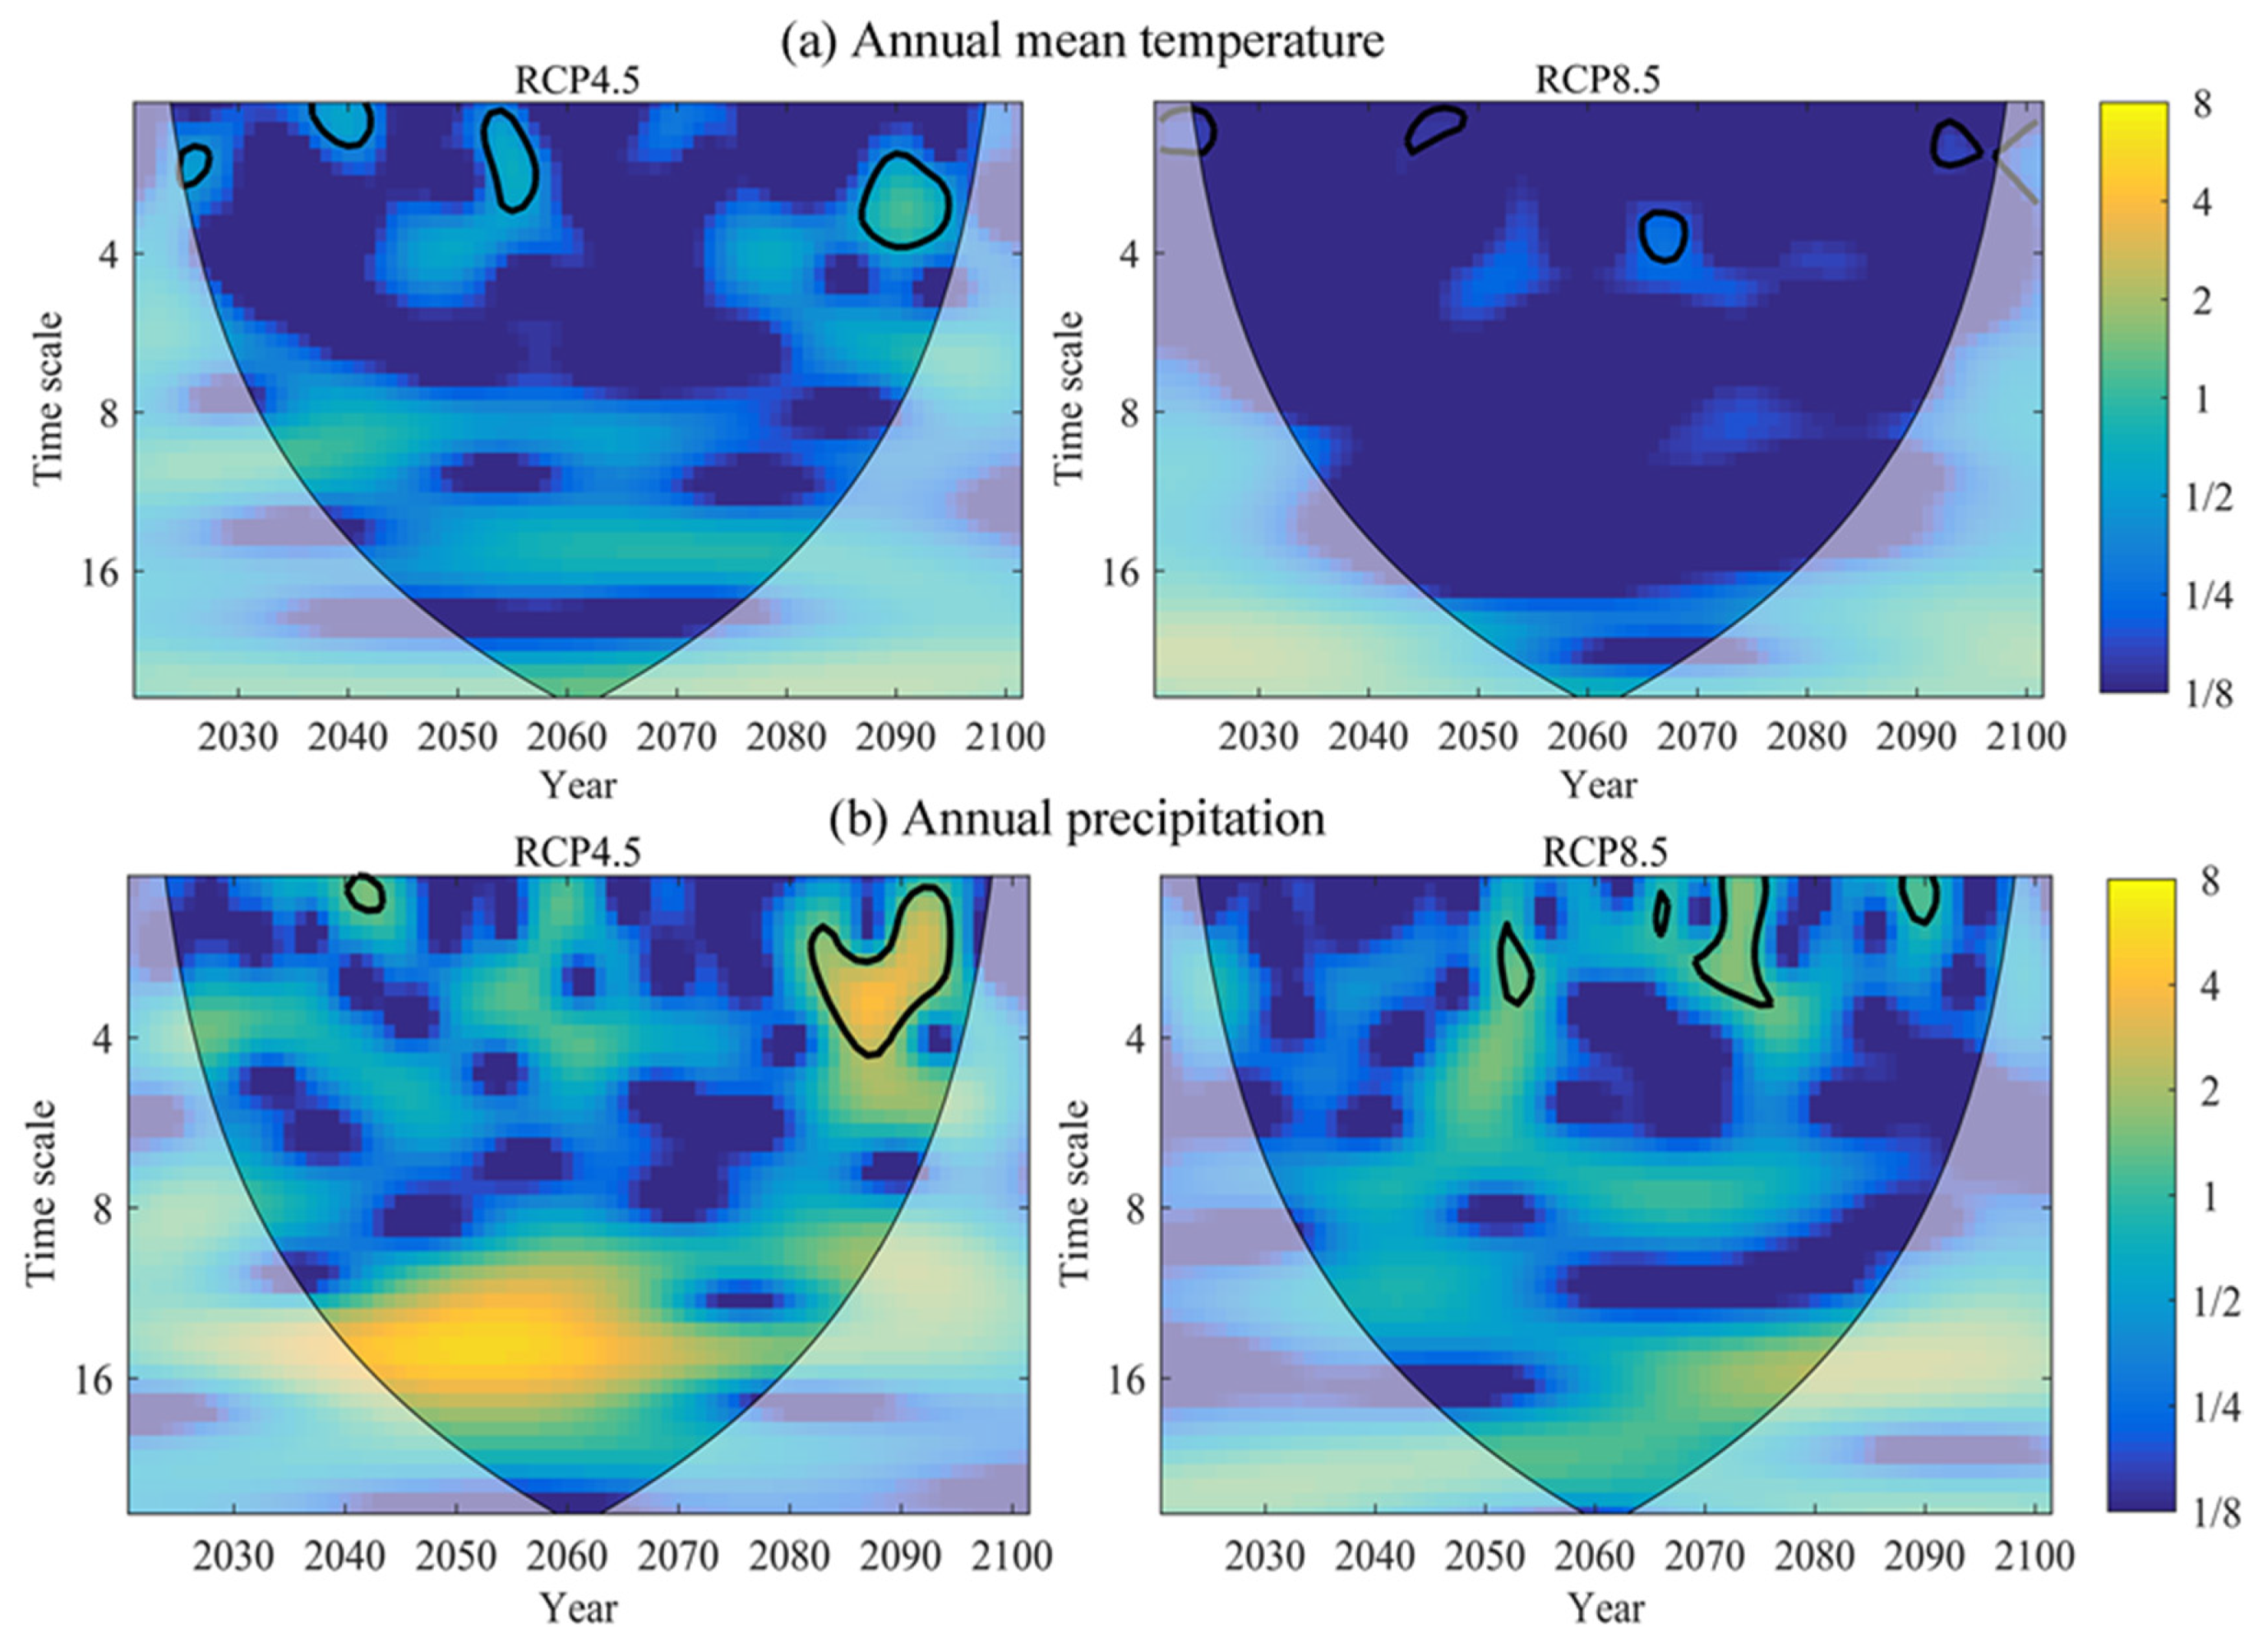
The Morlet wavelet can reveal the periodicity of annual mean temperature and precipitation, used to analyze the phase change and the periodic intensity on different time scales. We obtained the wavelet variance spectrum and continuous power wavelet spectrum of annual precipitation and annual mean temperature in the LMSR from 2020 to 2100 (Figure 8 and Figure 9). For the wavelet variance spectrum, the standard spectrum of red noise with α = 0.05 was used as the background spectrum to test the significance. When the test line is lower than the wavelet variance curve, it indicates that the corresponding period passes the significance level test with confidence of 95%. In the continuous wavelet power spectrum, yellow and blue, respectively, represent the peak and valley values of energy density. The shade of color indicates the relative change in energy density. The black thin solid line is the Cone of Influence boundary. The energy spectrum outside the curve is not considered because of the boundary effect. The black solid line is the boundary of a 95% confidence interval and indicates that it passes the red noise test.
The wavelet variance analysis of annual mean temperature and annual precipitation was obtained and is shown in Figure 8. Under the scenario of RCP4.5, the wavelet variance for annual mean temperature in the LMSR showed the main periods of 10-year, 15-year, and 28-year, which did not pass the wavelet red-noise test at a confidence level of 95%. Under the scenario of RCP8.5, the wavelet variance for annual mean temperature presented the main periods of 22-year and 28-year, which also did not pass the wavelet red-noise test. Under the scenario of RCP4.5, the wavelet variance for annual precipitation had a significant 3.5-year periodicity based on the wavelet red-noise at a confidence level of 95%. Besides, the main periods of 15-year were also shown, which did not pass the confidence level of 95%. According to the continuous wavelet power spectrum at a confidence level of 95%, the most significant periodic fluctuation had a 3.5-year period and occurred during 2080–2095 (Figure 9b). Under the scenario of RCP8.5, the wavelet variance for annual precipitation presented the main periods of 2.5-year, 7-year, 15-year, and 26-year. Only the 2.5-year period passed the wavelet red-noise at a confidence level of 95%. According to the continuous wavelet power spectrum, the most significant periodic fluctuation had a 2.5-year period and occurred during 2068–2075 (Figure 9b). Based on the above analysis, it can be inferred that the annual mean temperature in the LMSR has no significant change period at the 95% confidence level under the scenario of RCP4.5 and RCP8.5. Under the scenario of RCP4.5 and RCP8.5, the annual precipitation has a significant 3.5-year and 2.5-year periodicity, respectively.
4.4. Extreme High Temperature and Extreme Precipitation Change
Under the climate scenarios of RCP4.5 and RCP8.5, we calculated the extreme high temperature index of different countries in the LMSR (Figure 10). We can see that the extreme high temperature index of Thailand and Kingdom of Cambodia was higher than that of other countries. Myanmar, Laos, and Vietnam were second, China was the lowest, and the number of extreme high temperatures was the least. This phenomenon may be related to the topography of the region. Whether it was the RCP4.5 or RCP8.5 climate scenario, the trend of linear regression was higher than 0 (p < 0.05) (Table 1). In the RCP4.5 scenario, the trend of change in China was the largest (0.0222), and Laos was the smallest (0.0137). In the RCP8.5 scenario, the trend of change in Myanmar was the largest (0.0545), and Laos was the smallest (0.0175). In general, extreme high temperature was more obvious in the RCP8.5 scenario than in the RCP4.5 scenario.
Under the climate scenarios of RCP4.5 and RCP8.5, we analyzed the change of extreme precipitation index in different countries in the LMSR (Figure 11). The study found that the extreme precipitation index of Myanmar was obviously higher than that of the other countries. The main reason may be that Myanmar is geographically located in the western Indian Ocean. In summer, a large amount of water vapor is obtained from the Indian Ocean. The overall fluctuation characteristics of the extreme precipitation index in the six countries of the LMSR were relatively consistent and had some instability. As in the extreme high temperature index changes, the extreme precipitation in the six countries rose and fluctuation and the linear regression trend rates were all greater than 0 (p < 0.05) (Table 2). Under the RCP4.5 scenario, the trend of extreme precipitation in Vietnam was the largest (0.4220), while that of China was the smallest (0.0821). Under the RCP8.5 scenario, the trend of extreme precipitation in Kingdom of Cambodia was the largest (1.2722), while the smallest was in China (0.3379). Compared to the RCP4.5 scenario, the regional extreme precipitation index rose rapidly under the RCP8.5 scenario, and under the RCP8.5, the extreme climate risk was even greater.
5. Discussion
5.1. Trends of Mean Annual Temperature and Precipitation in the LMSR
In this study, the temperature and precipitation in the LMSR showed a significant upward trend during 2020–2100. Under the scenarios of RCP4.5 and RCP8.5, the annual mean temperature of the region increased by 0.219 °C/10a (p < 0.05) and 0.578 °C/10a (p < 0.05), respectively, and the annual precipitation increased at the rate of 29.474 mm/10a (p < 0.05) and 50.733 mm/10a (p < 0.05), respectively. This result is similar to the previous studies on the variation trend of temperature and precipitation in historical years, showing a rising trend in China’s Yunnan Province [36], Vietnam [37], Myanmar [39], Thailand [40]. In addition, Thoeun and Chan [41] analyzed the future climate change of Cambodia. It was found that the annual mean temperature and annual precipitation from 2008 to 2099 shows an increasing trend, which is consistent with the results of our research. In the future, the significant increase in temperature and precipitation will aggravate the development trend of warming and humidification in the LMSR. In addition, the rising trend of temperature and precipitation under the RCP8.5 scenario was more significant than under the RCP4.5 scenario because of the differences in scenario design. By 2100, the radiative forcing will rise to 8.5 W/m2, and the CO2 emission concentration will reach 1370 mL/m3 in RCP8.5 scenario. However, the radiative forcing level of RCP4.5 stabilized at 4.5 W/m2 before 2100 and the CO2 emission concentration will reach 850 mL/m3. The changes in radiative forcing comes from the changes in CO2 concentration in the atmosphere. Therefore, the increasing trend of temperature in RCP8.5 scenario was more obvious than that in RCP4.5 scenario.
5.2. The Necessity of LMSR Cooperation
Global climate change, characterized by warming, has greatly threatened the world’s sustainable development and human security. The trend change rate of extreme high temperature and extreme precipitation index in the region was greater than 0 (p < 0.05). It indicates that the risk of extreme climate will increase in the future. The economic development and people’s lives and property will be more challenged due to the increasing risks of climate change. The six countries in the LMSR, i.e., China, Cambodia, Laos, Myanmar, Thailand, and Vietnam, are geographically close to each other and are closely linked by the Lancang-Mekong River. At present, the six countries in the LMSR are facing the challenges of frequent floods and droughts and the uncertainty caused by climate change. The “Sendai framework for disaster risk reduction during 2015–2030” links disaster risk reduction with climate change. The countries in the LMSR are all developing countries, with relatively weak scientific and technological foundations, and limited information sharing for disaster impact and assessment, which limits the improvement of the region’s disaster response capabilities. These situations limit the improvement of the region’s ability for disaster response. The LMSR countries should build a comprehensive disaster risk prevention system through cooperation. It will improve the ability of disaster warning and take timely measures to reduce economic losses and protect people’s safety. In the future, the change trend of extreme high temperature and precipitation index varies greatly among different countries due to regional differences. The extreme high temperature index of Thailand and Kingdom of Cambodia is higher than that of other countries, while the extreme precipitation index of Myanmar is obviously higher than the other countries. The LMSR countries share the development opportunities of the river basin, and they should also share the responsibility for river basin development.
6. Conclusions
Based on the analysis of climate change characteristics under RCP4.5 and RCP8.5 climate scenarios, we found that temperature and precipitation in the LMSR showed a significant upward trend during 2020–2100. The climate showed a general trend of warming and humidification and responded significantly to global warming. Moreover, the annual mean temperature and annual precipitation in the LMSR increased significantly. Under the scenarios of RCP4.5 and RCP8.5, the annual mean temperature of the region increased by 0.219 °C/10a (p < 0.05) and 0.578 °C/10a (p < 0.05), respectively, and the annual precipitation increased at the rate of 29.474 mm/10a (p < 0.05) and 50.733 mm/10a (p < 0.05), respectively. Under the scenarios of RCP4.5 and RCP8.5, the annual temperature of the region changed abruptly from a low to high temperature in 2059 and 2063, respectively, while the annual precipitation in the region changed from less to more in 2051 and 2057.
The results of the Morlet wavelet analysis showed that the annual mean temperature in the LMSR has no significant change period at the 95% confidence level under the scenario of RCP4.5 and RCP8.5. Under the scenario of RCP4.5 and RCP8.5, the annual precipitation has a significant 3.5-year and 2.5-year periodicity, respectively.
The risk of extreme climate in the LMSR will increase in the future; the trend change rate of extreme high temperature and extreme precipitation index in the region is greater than 0 (p < 0.05). Comparing the two scenarios, we can see that under the RCP8.5 scenario, the extreme climate index in the LMSR is rising rapidly, and the risk of climate change is larger than that in the RCP4.5 scenario.
Author Contributions
Conceptualization, W.S.; Methodology, H.L., W.S.; Formal analysis, H.L.; Investigation, H.L.; Resources, W.S.; Writing—original draft preparation, H.L.; Writing—review and editing, W.S. and H.L.; Supervision, W.S. All authors have read and agreed to the published version of the manuscript.
Funding
This research was funded by the Strategic Priority Research Program of the Chinese Academy of Sciences (Grant No. XDA20040201), the Second Tibetan Plateau Scientific Expedition and Research (Grant No. 2019QZKK0603), the National Natural Science Foundation of China (Grant Nos. 41671177 and 42071233), the Key Research and Development Program of China (Grant Nos. 2016YFA0602402 and 2018YFC1508801), and the Project from Development Research Center of State Administration for Market Regulation, China (entitled Research on the Analysis Framework on Quality Safety Situation).
Conflicts of Interest
The authors declare no conflict of interest.
References
- Caballero-Anthony, M.; Cook, A.D. Non-Traditional Security in Asia: Issues, Challenges and Framework for Action; Institute of Southeast Asian Studies: Singapore, 2013; ISBN 9814414417. [Google Scholar]
- Boer, B.; Hirsch, P.; Johns, F.; Saul, B.; Scurrah, N. The Mekong: A Socio-legal Approach to River Basin Development; Routledge: Abingdon, UK, 2015; ISBN 1317657799. [Google Scholar]
- Gleick, P.H. Water and conflict: Fresh water resources and international security. Int. Secur. 1993, 18, 79–112. [Google Scholar] [CrossRef]
- Song, W.; Pijanowski, B.C. The effects of China’s cultivated land balance program on potential land productivity at a national scale. Appl. Geogr. 2014, 46, 158–170. [Google Scholar] [CrossRef]
- Han, H. China, an upstream hegemon: A destabilizer for the governance of the Mekong river? Pac. Focus 2017, 32, 30–55. [Google Scholar] [CrossRef] [Green Version]
- Song, W.; Deng, X. Land-use/land-cover change and ecosystem service provision in China. Sci. Total Environ. 2017, 576, 705–719. [Google Scholar] [CrossRef]
- Guangsheng, L. China Seeks to Improve Mekong Sub-Regional Cooperation: Causes and Policies. Available online: http://hdl.handle.net/11540/6512 (accessed on 10 November 2019).
- Zhang, Y.; Li, X.; Song, W. Determinants of cropland abandonment at the parcel, household and village levels in mountain areas of China: A multi-level analysis. Land Use Policy 2014, 41, 186–192. [Google Scholar] [CrossRef]
- Stocker, T.F.; Qin, D.; Plattner, G.-K.; Tignor, M.M.; Allen, S.K.; Boschung, J.; Nauels, A.; Xia, Y.; Bex, V.; Midgley, P.M. Climate Change 2013: The Physical Science Basis. Contribution of Working Group I to the Fifth Assessment Report of IPCC the Intergovernmental Panel on Climate Change; Cambridge University Press: Cambridge, UK; New York, NY, USA, 2014; ISBN 9781107415324. [Google Scholar]
- Hellström, C.; Chen, D.; Achberger, C.; Räisänen, J. Comparison of climate change scenarios for Sweden based on statistical and dynamical downscaling of monthly precipitation. Clim. Res. 2001, 19, 45–55. [Google Scholar] [CrossRef]
- Taylor, K.E.; Stouffer, R.J.; Meehl, G.A. An overview of CMIP5 and the experiment design. Bull. Am. Met. Soc. 2012, 93, 485–498. [Google Scholar] [CrossRef] [Green Version]
- Van Vuuren, D.P.; Edmonds, J.; Kainuma, M.; Riahi, K.; Thomson, A.; Hibbard, K.; Hurtt, G.C.; Kram, T.; Krey, V.; Lamarque, J.-F. The representative concentration pathways: An overview. Clim. Chang. 2011, 109, 5. [Google Scholar] [CrossRef]
- Chenkova, N.; Nikolova, N. Air temperature and precipitation variability in northeastern Bulgaria on the background of climate change. Therm. Sci. 2015, 19, 381–390. [Google Scholar] [CrossRef]
- Zhang, Y.; Wei, W.; Jiang, F.; Liu, M.; Wang, W.; Bai, L.; Li, K. Brief communication “Assessment of change in temperature and precipitation over Xinjiang, China”. Nat. Hazards Earth Syst. Sci. 2012, 12, 1327–1331. [Google Scholar] [CrossRef] [Green Version]
- Su, B.; Jiang, T.; Jin, W. Recent trends in observed temperature and precipitation extremes in the Yangtze River basin, China. Theor. Appl. Climatol. 2006, 83, 139–151. [Google Scholar] [CrossRef]
- Chen, Y.; Deng, H.; Li, B.; Li, Z.; Xu, C. Abrupt change of temperature and precipitation extremes in the arid region of Northwest China. Quat. Int. 2014, 336, 35–43. [Google Scholar] [CrossRef]
- Abolverdi, J.; Ferdosifar, G.; Khalili, D.; Kamgar-Haghighi, A.; Abdolahipour, M. Recent trends in regional air temperature and precipitation and links to global climate change in the Maharlo watershed, Southwestern Iran. Meteorol. Atmos. Phys. 2014, 126. [Google Scholar] [CrossRef]
- Wang, Q.-X.; Wang, M.-B.; Fan, X.-H.; Zhang, F.; Zhu, S.-Z.; Zhao, T.-L. Trends of temperature and precipitation extremes in the Loess Plateau Region of China, 1961–2010. Theor. Appl. Climatol. 2017, 129, 949–963. [Google Scholar] [CrossRef]
- Gavrilov, M.B.; Marković, S.B.; Janc, N.; Nikolić, M.; Valjarević, A.; Komac, B.; Zorn, M.; Punišić, M.; Bačević, N. Assessing average annual air temperature trends using the Mann–Kendall test in Kosovo. Acta Geogr. Slov. 2018, 58, 7–25. [Google Scholar] [CrossRef] [Green Version]
- Gavrilov, M.B.; Tošić, I.; Marković, S.B.; Unkašević, M.; Petrović, P. Analysis of annual and seasonal temperature trends using the Mann-Kendall test in Vojvodina, Serbia. Időjárás 2016, 120, 183–198. [Google Scholar]
- Zhang, Q.; Xu, C.-Y.; Zhang, Z.; Chen, Y.; Liu, C.-L. Spatial and temporal variability of precipitation over China, 1951–2005. Theor. Appl. Climatol. 2009, 95, 53–68. [Google Scholar] [CrossRef]
- Xu, M.; Kang, S.; Wu, H.; Yuan, X. Detection of spatio-temporal variability of air temperature and precipitation based on long-term meteorological station observations over Tianshan Mountains, Central Asia. Atmos. Res. 2018, 203, 141–163. [Google Scholar] [CrossRef]
- Kumar, S.; Merwade, V.; Kinter, J.L., III; Niyogi, D. Evaluation of temperature and precipitation trends and long-term persistence in CMIP5 twentieth-century climate simulations. J. Clim. 2013, 26, 4168–4185. [Google Scholar] [CrossRef]
- Sharma, S.; Saha, A.K. Statistical analysis of rainfall trends over Damodar River basin, India. Arab. J. Geosci. 2017, 10, 319. [Google Scholar] [CrossRef]
- Ahmed, K.; Shahid, S.; Chung, E.-S.; Ismail, T.; Wang, X.-J. Spatial distribution of secular trends in annual and seasonal precipitation over Pakistan. Clim. Res. 2017, 74, 95–107. [Google Scholar] [CrossRef]
- Liu, Q.; Yang, Z.; Cui, B. Spatial and temporal variability of annual precipitation during 1961–2006 in Yellow River Basin, China. J. Hydrol. 2008, 361, 330–338. [Google Scholar] [CrossRef]
- Partal, T. Multi-annual analysis and trends of the temperatures and precipitations in West Anatolia. J. Water Clim. Chang. 2017, 8, 456–473. [Google Scholar] [CrossRef]
- Meng, X.; Zhang, S.; Zhang, Y.; Wang, C. Temporal and spatial changes of temperature and precipitation in Hexi Corridor during 1955–2011. J. Geogr. Sci. 2013, 23, 653–667. [Google Scholar] [CrossRef]
- Xiao, Z.; Shi, P.; Jiang, P.; Hu, J.; Qu, S.; Chen, X.; Chen, Y.; Dai, Y.; Wang, J. The spatiotemporal variations of runoff in the Yangtze River basin under climate change. Adv. Meteorol. 2018, 2018. [Google Scholar] [CrossRef] [Green Version]
- Ma, L.; Xia, H.; Sun, J.; Wang, H.; Feng, G.; Qin, F. Spatial–Temporal Variability of Hydrothermal Climate Conditions in the Yellow River Basin from 1957 to 2015. Atmosphere 2018, 9, 433. [Google Scholar] [CrossRef] [Green Version]
- Li, Q.; Chen, Y.; Shen, Y.; Li, X.; Xu, J. Spatial and temporal trends of climate change in Xinjiang, China. J. Geogr. Sci. 2011, 21, 1007. [Google Scholar] [CrossRef]
- Feng, Y.; Wang, W.; Suman, D.; Yu, S.; He, D. Water Cooperation Priorities in the Lancang-Mekong River Basin Based on Cooperative Events Since the Mekong River Commission Establishment. Chin. Geogr. Sci. 2019, 29, 58–69. [Google Scholar] [CrossRef] [Green Version]
- Li, J.; Dong, S.; Peng, M.; Yang, Z.; Liu, S.; Li, X.; Zhao, C. Effects of damming on the biological integrity of fish assemblages in the middle Lancang-Mekong River basin. Ecol. Indic. 2013, 34, 94–102. [Google Scholar] [CrossRef]
- Zhang, Y.; Gao, F.; He, D.; Li, S. Comparison of spatial-temporal distribution characteristics of water temperatures between Lancang River and Mekong River. Chin. Sci. Bull. 2007, 52, 141–147. [Google Scholar] [CrossRef]
- Zhang, B.; Zhang, L.; Guo, H.; Leinenkugel, P.; Zhou, Y.; Li, L.; Shen, Q. Drought impact on vegetation productivity in the Lower Mekong Basin. Int. J. Remote Sens. 2014, 35, 2835–2856. [Google Scholar] [CrossRef]
- Shi, H.; Chen, J. Characteristics of climate change and its relationship with land use/cover change in Yunnan Province, China. Int. J. Climatol. 2018, 38, 2520–2537. [Google Scholar] [CrossRef]
- Nguyen, D.Q.; Renwick, J.; McGregor, J. Variations of surface temperature and rainfall in Vietnam from 1971 to 2010. Int. J. Climatol. 2014, 34, 249–264. [Google Scholar] [CrossRef]
- Xu, Z.; Yang, X.; Zuo, D.; Chu, Q.; Liu, W. Spatiotemporal characteristics of extreme precipitation and temperature: A case study in Yunnan Province, China. Proc. Int. Assoc. Hydrol. Sci. 2015, 369, 121–127. [Google Scholar] [CrossRef] [Green Version]
- Sein, K.; Chidthaisong, A.; Oo, K. Observed trends and changes in temperature and precipitation extreme indices over Myanmar. Atmosphere 2018, 9, 477. [Google Scholar] [CrossRef] [Green Version]
- Sharma, D.; Babel, M.S. Trends in extreme rainfall and temperature indices in the western Thailand. Int. J. Climatol. 2014, 34, 2393–2407. [Google Scholar] [CrossRef]
- Thoeun, H.C. Observed and projected changes in temperature and rainfall in Cambodia. Weather Clim. Extrem. 2015, 7, 61–71. [Google Scholar] [CrossRef] [Green Version]
- CMIP5 Project Data. Available online: https://esgf-node.llnl.gov/projects/cmip5/ (accessed on 20 October 2019).
- Zhi, X.; Zhao, H.; Zhu, S.; Ge, F. Superensemble hindcast of surface air temperature using CMIP5 multimodel data. Trans. Atmos. Sci. 2016, 39, 64–71. (In Chinese) [Google Scholar] [CrossRef]
- Harris, I.; Osborn, T.J.; Jones, P.; Lister, D. Version 4 of the CRU TS monthly high-resolution gridded multivariate climate dataset. Sci. Data 2020, 7, 109. [Google Scholar] [CrossRef] [PubMed] [Green Version]
- Miao, C.; Duan, Q.; Sun, Q.; Huang, Y.; Kong, D.; Yang, T.; Ye, A.; Di, Z.; Gong, W. Assessment of CMIP5 climate models and projected temperature changes over Northern Eurasia. Environ. Res. Lett. 2014, 9, 055007. [Google Scholar] [CrossRef]
- Wen, X.; Wang, S.; Zhu, J.; David, V. An overview of China climate change over the 20th century using UK UEA/CRU high resolution grid data. Chin. J. Atmos. Sci. 2006, 30, 894–904. [Google Scholar] [CrossRef]
- Wu, S.; Yin, Y.; Zheng, D.; Yang, Q. Climatic trends over the Tibetan Plateau during 1971–2000. J. Geogr. Sci. 2007, 17, 141–151. [Google Scholar] [CrossRef]
- Tang, B.; Tong, L.; Kang, S.; Zhang, L. Impacts of climate variability on reference evapotranspiration over 58 years in the Haihe river basin of north China. Agric. Water Manag. 2011, 98, 1660–1670. [Google Scholar] [CrossRef]
- Jaagus, J. Climatic changes in Estonia during the second half of the 20th century in relationship with changes in large-scale atmospheric circulation. Theor. Appl. Climatol. 2006, 83, 77–88. [Google Scholar] [CrossRef]
- Hao, X.-M.; Chen, Y.-N.; Li, W.-H. Impact of anthropogenic activities on the hydrologic characters of the mainstream of the Tarim River in Xinjiang during the past 50 years. Environ. Geol. 2009, 57, 435–445. [Google Scholar] [CrossRef]
- Torrence, C.; Compo, G.P. A practical guide to wavelet analysis. Bull. Am. Met. Soc. 1998, 79, 61–78. [Google Scholar] [CrossRef] [Green Version]
- Grinsted, A.; Moore, J.C.; Jevrejeva, S. Application of the cross wavelet transform and wavelet coherence to geophysical time series. Nonlinear Process. Geophys. 2004, 11, 561–566. [Google Scholar] [CrossRef]
- Ling, H.; Xu, H.; Fu, J. High and low flow variations in annual runoff and their response to climate change in the headstreams of the Tarim River, Xinjiang, China. Hydrol. Process. 2013, 27, 975–988. [Google Scholar] [CrossRef]
Figure 1.
Distribution of the Lancang-Mekong sub-region (Notes: CHN: China, LAO: Laos, MMR: Myanmar, THA: Thailand, VNM: Vietnam, KHM: Kingdom of Cambodia).
Figure 1.
Distribution of the Lancang-Mekong sub-region (Notes: CHN: China, LAO: Laos, MMR: Myanmar, THA: Thailand, VNM: Vietnam, KHM: Kingdom of Cambodia).

Figure 2.
Variation of the annual temperature in the Lancang-Mekong sub-region under the RCP4.5 (a) and the RCP8.5 (b).
Figure 2.
Variation of the annual temperature in the Lancang-Mekong sub-region under the RCP4.5 (a) and the RCP8.5 (b).

Figure 3.
Variation of the annual precipitation in the Lancang-Mekong sub-region under the RCP4.5 (a) and the RCP8.5 (b).
Figure 3.
Variation of the annual precipitation in the Lancang-Mekong sub-region under the RCP4.5 (a) and the RCP8.5 (b).

Figure 4.
Mann–Kendall test of annual mean temperature in the Lancang-Mekong sub-region under the RCP4.5 (a) and the RCP8.5 (b).
Figure 4.
Mann–Kendall test of annual mean temperature in the Lancang-Mekong sub-region under the RCP4.5 (a) and the RCP8.5 (b).

Figure 5.
Accumulated annual mean temperature anomaly in the Lancang-Mekong sub-region under the RCP4.5 (a) and the RCP8.5 (b).
Figure 5.
Accumulated annual mean temperature anomaly in the Lancang-Mekong sub-region under the RCP4.5 (a) and the RCP8.5 (b).

Figure 6.
Mann–Kendall test of annual precipitation in the Lancang-Mekong River subregion under the RCP4.5 (a) and the RCP8.5 (b).
Figure 6.
Mann–Kendall test of annual precipitation in the Lancang-Mekong River subregion under the RCP4.5 (a) and the RCP8.5 (b).

Figure 7.
Accumulated annual precipitation anomaly in the Lancang-Mekong River subregion under the RCP4.5 (a) and the RCP8.5 (b).
Figure 7.
Accumulated annual precipitation anomaly in the Lancang-Mekong River subregion under the RCP4.5 (a) and the RCP8.5 (b).

Figure 8.
Wavelet analyses of the annual mean temperature and precipitation under the RCP4.5 and the RCP8.5.
Figure 8.
Wavelet analyses of the annual mean temperature and precipitation under the RCP4.5 and the RCP8.5.

Figure 9.
Continuous wavelet power spectrum of annual precipitation (a) and annual temperature (b) under the RCP4.5 and the RCP8.5.
Figure 9.
Continuous wavelet power spectrum of annual precipitation (a) and annual temperature (b) under the RCP4.5 and the RCP8.5.

Figure 10.
Variation of the number of days with extreme temperature in the Lancang-Mekong River subregion under the RCP4.5 (a) and the RCP8.5 (b).
Figure 10.
Variation of the number of days with extreme temperature in the Lancang-Mekong River subregion under the RCP4.5 (a) and the RCP8.5 (b).

Figure 11.
Variation of the number of days with extreme precipitation in the Lancang-Mekong sub-region under the RCP4.5 (a) and the RCP8.5 (b).
Figure 11.
Variation of the number of days with extreme precipitation in the Lancang-Mekong sub-region under the RCP4.5 (a) and the RCP8.5 (b).


Table 1.
Trends in the indices for temperature extremes.
| MMR | CHN | VNM | LAO | THA | KHM | |
|---|---|---|---|---|---|---|
| RCP4.5 | 0.0197 | 0.0222 | 0.0172 | 0.0137 | 0.0125 | 0.0207 |
| RCP8.5 | 0.0545 | 0.0462 | 0.0235 | 0.0175 | 0.0272 | 0.0278 |
Notes: MMR is Myanma; CHN is China; VNM is Vietnam; LAO is Laos; THA is Thailand; KHM is Kingdom of Cambodia; Values were statistically significant at the p < 0.05 level.
Table 2.
Trends in the precipitation extremes indices.
| MMR | CHN | VNM | LAO | THA | KHM | |
|---|---|---|---|---|---|---|
| RCP4.5 | 0.3602 | 0.0821 | 0.4220 | 0.4151 | 0.3945 | 0.3747 |
| RCP8.5 | 0.9435 | 0.3379 | 1.1836 | 1.1493 | 1.2213 | 1.2722 |
Notes: MMR is Myanmar; CHN is China; VNM is Vietnam; LAO is Laos; THA is Thailand; KHM is Kingdom of Cambodia; Values were statistically significant at the p < 0.05 level.
© 2020 by the authors. Licensee MDPI, Basel, Switzerland. This article is an open access article distributed under the terms and conditions of the Creative Commons Attribution (CC BY) license (http://creativecommons.org/licenses/by/4.0/).
Share and Cite
MDPI and ACS Style
Li, H.; Song, W. Characteristics of Climate Change in the Lancang-Mekong Sub-Region. Climate 2020, 8, 115. https://0-doi-org.brum.beds.ac.uk/10.3390/cli8100115
AMA Style
Li H, Song W. Characteristics of Climate Change in the Lancang-Mekong Sub-Region. Climate. 2020; 8(10):115. https://0-doi-org.brum.beds.ac.uk/10.3390/cli8100115
Chicago/Turabian StyleLi, Han, and Wei Song. 2020. "Characteristics of Climate Change in the Lancang-Mekong Sub-Region" Climate 8, no. 10: 115. https://0-doi-org.brum.beds.ac.uk/10.3390/cli8100115
Note that from the first issue of 2016, this journal uses article numbers instead of page numbers. See further details here.