Next Issue
Volume 9, January
Previous Issue
Volume 8, November


Climate, Volume 8, Issue 12 (December 2020) – 13 articles

Cover Story (view full-size image): 
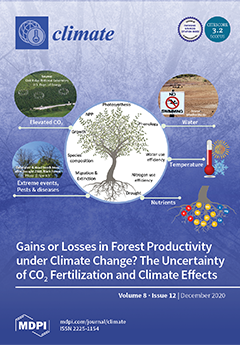
Considerable uncertainties remain regarding the impacts and interplay of temperature, precipitation, and elevated atmospheric CO2 (eCO2) on forest growth and productivity—especially due the long lifespans of trees. Other uncertainties stem from the different responses of forest ecosystems and underlying ecophysiological processes. The NPP of beech and fir was notably to be stimulated by eCO2 until 2035–2060. This stimulation was gradually cancelled out by climate effects (temperature increase and precipitation decrease) accompanied by increased mortality. Forest management (FM) may still be possible in the more climate-risky sub-mountainous belt of the Black Forest, but major losses in productivity can be expected. Under the most pessimistic scenario, FM may become critical where a substantial transition on the ecological and economic levels becomes inevitable. View this paper.
  • Issues are regarded as officially published after their release is announced to the table of contents alert mailing list.
  • You may sign up for e-mail alerts to receive table of contents of newly released issues.
  • PDF is the official format for papers published in both, html and pdf forms. To view the papers in pdf format, click on the "PDF Full-text" link, and use the free Adobe Reader to open them.
Order results
Result details
Section
Select all
Export citation of selected articles as:
20 pages, 1593 KiB  
Article
Modeling the Soil Response to Rainstorms after Wildfire and Prescribed Fire in Mediterranean Forests
by Manuel Esteban Lucas-Borja, Giuseppe Bombino, Bruno Gianmarco Carrà, Daniela D’Agostino, Pietro Denisi, Antonino Labate, Pedro Antonio Plaza-Alvarez and Demetrio Antonio Zema
Climate 2020, 8(12), 150; https://0-doi-org.brum.beds.ac.uk/10.3390/cli8120150 - 17 Dec 2020
Cited by 26 | Viewed by 2755
Abstract
The use of the Soil Conservation Service-curve number (SCS-CN) model for runoff predictions after rainstorms in fire-affected forests in the Mediterranean climate is quite scarce and limited to the watershed scale. To validate the applicability of this model in this environment, this study [...] Read more.
The use of the Soil Conservation Service-curve number (SCS-CN) model for runoff predictions after rainstorms in fire-affected forests in the Mediterranean climate is quite scarce and limited to the watershed scale. To validate the applicability of this model in this environment, this study has evaluated the runoff prediction capacity of the SCS-CN model after storms at the plot scale in two pine forests of Central-Eastern Spain, affected by wildfire (with or without straw mulching) or prescribed fire and in unburned soils. The model performance has been compared to the predictions of linear regression equations between rainfall depth and runoff volume. The runoff volume was simulated with reliability by the linear regression only for the unburned soil (coefficient of Nash and Sutcliffe E = 0.73–0.89). Conversely, the SCS-CN model was more accurate for burned soils (E = 0.81–0.97), also when mulching was applied (E = 0.96). The performance of this model was very satisfactory in predicting the maximum runoff. Very low values of CNs and initial abstraction were required to predict the particular hydrology of the experimental areas. Moreover, the post-fire hydrological “window-of-disturbance” could be reproduced only by increasing the CN for the storms immediately after the wildfire. This study indicates that, in Mediterranean forests subject to the fire risk, the simple linear equations are feasible to predict runoff after low-intensity storms, while the SCS-CN model is advisable when runoff predictions are needed to control the flooding risk. Full article
(This article belongs to the Special Issue Application of Climatic Data in Hydrologic Models)
Show Figures

Figure 1

21 pages, 4711 KiB  
Article
Local Institutions and Climate Change Adaptation: Appraising Dysfunctional and Functional Roles of Local Institutions from the Bilate Basin Agropastoral Livelihood Zone of Sidama, Southern Ethiopia
by Firew Bekele, Degefa Tolossa and Teshale Woldeamanuel
Climate 2020, 8(12), 149; https://0-doi-org.brum.beds.ac.uk/10.3390/cli8120149 - 15 Dec 2020
Cited by 5 | Viewed by 3413
Abstract
This study aimed to appraise the role of local institutions in adaptation to changing climate at the local level in the Bilate Basin Agropastoral Livelihood Zone of Ethiopia. Thirty-one years of climate data were analyzed by employing the Mann–Kendall trend and Sen’s slope [...] Read more.
This study aimed to appraise the role of local institutions in adaptation to changing climate at the local level in the Bilate Basin Agropastoral Livelihood Zone of Ethiopia. Thirty-one years of climate data were analyzed by employing the Mann–Kendall trend and Sen’s slope test techniques. The survey was conducted on 400 households that were systematically randomized from 7066 households, while community-level data were collected through the participatory rural appraisal (PRA) technique. The entire analysis was framed by a tetragonal model. The results of the analysis indicated that temperature exhibited a significantly increasing trend, while rainfall, which is statistically related to temperature, showed a decreasing trend, resulting in lingering droughts and human and animal diseases. Major livestock declined by 69%. As a response, while Sidama indigenous institutions were well-functioning and nurtured through local knowledge, and the governmental and civic ones were entrenched with various limitations. Contextual fitness and compatibility, interplay, inclusiveness, and sustainability of their operations in temporal and spatial scales were some of their limitations. Therefore, federal and local governments should focus on monitoring, evaluating, and learning aspects of their grand strategies, review general education, farmers’ credit, and civic institutions’ governance policies and strengthen the synergy of civic, government, and indigenous institutions. Full article
(This article belongs to the Special Issue Cultural Landscape Approaches and Climate Change Policy)
Show Figures

Figure 1

14 pages, 4099 KiB  
Article
Evaluation of Daily Precipitation from the ERA5 Global Reanalysis against GHCN Observations in the Northeastern United States
by Caitlin C. Crossett, Alan K. Betts, Lesley-Ann L. Dupigny-Giroux and Arne Bomblies
Climate 2020, 8(12), 148; https://0-doi-org.brum.beds.ac.uk/10.3390/cli8120148 - 15 Dec 2020
Cited by 28 | Viewed by 4344
Abstract
Precipitation is a primary input for hydrologic, agricultural, and engineering models, so making accurate estimates of it across the landscape is critically important. While the distribution of in-situ measurements of precipitation can lead to challenges in spatial interpolation, gridded precipitation information is designed [...] Read more.
Precipitation is a primary input for hydrologic, agricultural, and engineering models, so making accurate estimates of it across the landscape is critically important. While the distribution of in-situ measurements of precipitation can lead to challenges in spatial interpolation, gridded precipitation information is designed to produce a full coverage product. In this study, we compare daily precipitation accumulations from the ERA5 Global Reanalysis (hereafter ERA5) and the US Global Historical Climate Network (hereafter GHCN) across the northeastern United States. We find that both the distance from the Atlantic Coast and elevation difference between ERA5 estimates and GHCN observations affect precipitation relationships between the two datasets. ERA5 has less precipitation along the coast than GHCN observations but more precipitation inland. Elevation differences between ERA5 and GHCN observations are positively correlated with precipitation differences. Isolated GHCN stations on mountain peaks, with elevations well above the ERA5 model grid elevation, have much higher precipitation. Summer months (June, July, and August) have slightly less precipitation in ERA5 than GHCN observations, perhaps due to the ERA5 convective parameterization scheme. The heavy precipitation accumulation above the 90th, 95th, and 99th percentile thresholds are very similar for ERA5 and the GHCN. We find that daily precipitation in the ERA5 dataset is comparable to GHCN observations in the northeastern United States and its gridded spatial continuity has advantages over in-situ point precipitation measurements for regional modeling applications. Full article
(This article belongs to the Section Climate and Environment)
Show Figures

Figure 1

18 pages, 1143 KiB  
Article
Impacts of Agroclimatic Variability on Maize Production in the Setsoto Municipality in the Free State Province, South Africa
by Abubakar Hadisu Bello, Mary Scholes and Solomon W. Newete
Climate 2020, 8(12), 147; https://0-doi-org.brum.beds.ac.uk/10.3390/cli8120147 - 14 Dec 2020
Cited by 7 | Viewed by 4401
Abstract
The majority of people in South Africa eat maize, which is grown as a rain-fed crop in the summer rainfall areas of the country, as their staple food. The country is usually food secure except in drought years, which are expected to increase [...] Read more.
The majority of people in South Africa eat maize, which is grown as a rain-fed crop in the summer rainfall areas of the country, as their staple food. The country is usually food secure except in drought years, which are expected to increase in severity and frequency. This study investigated the impacts of rainfall and minimum and maximum temperatures on maize yield in the Setsoto municipality of the Free State province of South Africa from 1985 to 2016. The variation of the agroclimatic variables, including the Palmer stress diversity index (PSDI), was investigated over the growing period (Oct–Apr) which varied across the four target stations (Clocolan, Senekal, Marquard and Ficksburg). The highest coefficients of variance (CV) recorded for the minimum and maximum temperatures and rainfall were 16.2%, 6.2% and 29% during the growing period. Non-parametric Mann Kendal and Sen’s slope estimator were used for the trend analysis. The result showed significant positive trends in minimum temperature across the stations except for Clocolan where a negative trend of 0.2 to 0.12 °C year−1 was observed. The maximum temperature increased significantly across all the stations by 0.04–0.05 °C year−1 during the growing period. The temperature effects were most noticeable in the months of November and February when leaf initiation and kernel filling occur, respectively. The changes in rainfall were significant only in Ficksburg in the month of January with a value of 2.34 mm year−1. Nevertheless, the rainfall showed a strong positive correlation with yield (r 0.46, p = < 0.05). The overall variation in maize production is explained by the contribution of the agroclimatic parameters; the minimum temperature (R2 0.13–0.152), maximum temperature (R2 0.214–0.432) and rainfall (R2 0.17–0.473) for the growing period across the stations during the study period. The PSDI showed dry years and wet years but with most of the years recording close to normal rainfall. An increase in both the minimum and maximum temperatures over time will have a negative impact on crop yield. Full article
(This article belongs to the Special Issue Climate Change and Food Insecurity)
Show Figures

Figure 1

18 pages, 3429 KiB  
Article
Long-Term Rainfall Trends and Their Variability in Mainland Portugal in the Last 106 Years
by Maria Manuela Portela, Luis Angel Espinosa and Martina Zelenakova
Climate 2020, 8(12), 146; https://0-doi-org.brum.beds.ac.uk/10.3390/cli8120146 - 10 Dec 2020
Cited by 17 | Viewed by 4429
Abstract
This study addresses the long-term rainfall trends, their temporal variability and uncertainty over mainland Portugal, a small country on the most western European coast. The study was based on monthly, seasonal and annual rainfall series spanning for a period of 106 years, between [...] Read more.
This study addresses the long-term rainfall trends, their temporal variability and uncertainty over mainland Portugal, a small country on the most western European coast. The study was based on monthly, seasonal and annual rainfall series spanning for a period of 106 years, between October 1913 and September 2019 (herein after referred to as global period), at 532 rain gauges evenly distributed over the country (c.a. 6 rain gauges per 1000 km2). To understand the rainfall behavior over time, an initial sub-period with 55 years and a final sub-period with 51 years were also analyzed along with the global period. The trends identification and the assessment of their magnitude were derived using the nonparametric Mann-Kendall (MK) test coupled with the Sen’s slope estimator method. The results showed that after the initial sub-period with prevailing increasing rainfall, the trends were almost exclusively decreasing. They were also so pronounced that they counterbalanced the initial rainfall increase and resulted in equally decreasing trends for the global period. The study also shows that approximately from the late 1960s on, the rainy season pattern has changed, with the last months prior to the dry season showing a sustained decrease of their relative contributions to the annual rainfalls. Overall, the results support the hypothesis of less uncertainty on the pronounced decrease of rainfall over mainland Portugal in recent years, which is expected to continue. They also show that the asymmetry between a less wet North, yet still wet, and an arid South is becoming much more marked. Full article
(This article belongs to the Special Issue Climate Variability and Drought Management)
Show Figures

Figure 1

14 pages, 5835 KiB  
Article
The Spatiotemporal Patterns of Climate Asymmetric Warming and Vegetation Activities in an Arid and Semiarid Region
by Tong Heng, Gary Feng, Ying Ouyang and Xinlin He
Climate 2020, 8(12), 145; https://0-doi-org.brum.beds.ac.uk/10.3390/cli8120145 - 10 Dec 2020
Cited by 3 | Viewed by 2638
Abstract
Asymmetric warming was bound to have a major impact on terrestrial ecosystems in arid regions during global warming. Further study was necessary to reveal the spatiotemporal patterns of asymmetric warming in Xinjiang; this study analyzed the climate and normalized difference vegetation index (NDVI) [...] Read more.
Asymmetric warming was bound to have a major impact on terrestrial ecosystems in arid regions during global warming. Further study was necessary to reveal the spatiotemporal patterns of asymmetric warming in Xinjiang; this study analyzed the climate and normalized difference vegetation index (NDVI) data (2000–2020). The change trends of the day and nighttime warming (DNW), seasonal warming, and the diurnal temperature range in northern Xinjiang (S1) and southern Xinjiang (S2) were determined. The findings indicated that the DNW rate showed a significant (p < 0.05) upward trend, especially in winter. The nighttime warming rate (0.65 °C (decade)−1) was faster than the daytime warming rate (0.4 °C (decade)−1), and the diurnal temperature range between daytime and nighttime exhibited a decreasing trend. The diurnal temperature range was the highest in spring and the lowest in winter. Extreme values of the diurnal temperature range appeared in autumn (48.6 °C) and winter (12.3 °C) and both in S1. The Tmin in S1 had an abruption trend in 2006–2017, the Tmax in S2 had an abruption trend in 2005–2011, and the probability of spatial abruption in S1 was higher than that in S2. The partial correlation between the NDVI and Tmin was significantly higher than that between the NDVI and Tmax in the area where the significance test passed; therefore, asymmetric nighttime warming had a greater impact on the NDVI than the asymmetric daytime warming. Full article
Show Figures

Figure 1

9 pages, 826 KiB  
Article
Vulnerability and Risk Factors due to Tropical Cyclones in Coastal Cities of Baja California Sur, Mexico
by Elvia Aida Marín-Monroy, Víctor Hernández-Trejo, Eleonora Romero-Vadillo and Antonina Ivanova-Boncheva
Climate 2020, 8(12), 144; https://0-doi-org.brum.beds.ac.uk/10.3390/cli8120144 - 10 Dec 2020
Cited by 6 | Viewed by 3101
Abstract
Coastal cities have seen an unprecedented growth with regional settlements due to development activities; that is why measures are needed to mitigate risk of adverse events such as tropical cyclones. Baja California Sur, a state known as a relevant ecological and tourist region, [...] Read more.
Coastal cities have seen an unprecedented growth with regional settlements due to development activities; that is why measures are needed to mitigate risk of adverse events such as tropical cyclones. Baja California Sur, a state known as a relevant ecological and tourist region, includes destinations such as Cabo San Lucas and La Paz, impacted yearly by tropical cyclones, so it is important to design contingency plans and provide available information to the residents. Los Cabos municipality has the highest population growth rate and its inhabitants are more susceptible to adverse events; despite this, there were no indicators of social and ecological vulnerability to risk effects of tropical cyclones. The objective of this research is to calculate the socio-environmental vulnerability of households through an index to identify risk factors. We have obtained a classification according to levels of vulnerability, and the results have shown that 74% of the households are high on the vulnerability scale, 21% of households are moderately vulnerable and only the remaining 5% of households are less vulnerable. In conclusion, the devastating effects of hydrometeorological events were mainly due to a lack of knowledge regarding such events among inhabitants. Full article
(This article belongs to the Section Policy, Governance, and Social Equity)
Show Figures

Figure 1

20 pages, 3682 KiB  
Article
Intraseasonal Precipitation Variability over West Africa under 1.5 °C and 2.0 °C Global Warming Scenarios: Results from CORDEX RCMs
by Obed M. Ogega, Benjamin A. Gyampoh and Malcolm N. Mistry
Climate 2020, 8(12), 143; https://0-doi-org.brum.beds.ac.uk/10.3390/cli8120143 - 06 Dec 2020
Cited by 5 | Viewed by 3563
Abstract
This study assessed the performance of 24 simulations, from five regional climate models (RCMs) participating in the Coordinated Regional Climate Downscaling Experiment (CORDEX), in representing spatiotemporal characteristics of precipitation over West Africa, compared to observations. The top five performing RCM simulations were used [...] Read more.
This study assessed the performance of 24 simulations, from five regional climate models (RCMs) participating in the Coordinated Regional Climate Downscaling Experiment (CORDEX), in representing spatiotemporal characteristics of precipitation over West Africa, compared to observations. The top five performing RCM simulations were used to assess future precipitation changes over West Africa, under 1.5 °C and 2.0 °C global warming levels (GWLs), following the representative concentration pathway (RCP) 8.5. The performance evaluation and future change assessment were done using a set of seven ‘descriptors’ of West African precipitation namely the simple precipitation intensity index (SDII), the consecutive wet days (CWD), the number of wet days index (R1MM), the number of wet days with moderate and heavy intensity precipitation (R10MM and R30MM, respectively), and annual and June to September daily mean precipitation (ANN and JJAS, respectively). The performance assessment and future change outlook were done for the CORDEX–Africa subdomains of north West Africa (WA-N), south West Africa (WA-S), and a combination of the two subdomains. While the performance of RCM runs was descriptor- and subregion- specific, five model runs emerged as top performers in representing precipitation characteristics over both WA-N and WA-S. The five model runs are CCLM4 forced by ICHEC-EC-EARTH (r12i1p1), RCA4 forced by CCCma-CanESM2 (r1i1p1), RACMO22T forced by MOHC-HadGEM2-ES (r1i1p1), and the ensemble means of simulations made by CCLM4 and RACMO22T. All precipitation descriptors recorded a reduction under the two warming levels, except the SDII which recorded an increase. Unlike the WA-N that showed less frequency and more intense precipitation, the WA-S showed increased frequency and intensity. Given the potential impact that these projected changes may have on West Africa’s socioeconomic activities, adjustments in investment may be required to take advantage of (and enhance system resilience against damage that may result from) the potential changes in precipitation. Full article
(This article belongs to the Special Issue Climate Change Impacts at Various Geographical Scales)
Show Figures

Figure 1

20 pages, 6101 KiB  
Article
Long-Term Trend Analysis in Annual and Seasonal Precipitation, Maximum and Minimum Temperatures in the Southwest United States
by Koffi Djaman, Komlan Koudahe, Ansoumana Bodian, Lamine Diop and Papa Malick Ndiaye
Climate 2020, 8(12), 142; https://0-doi-org.brum.beds.ac.uk/10.3390/cli8120142 - 02 Dec 2020
Cited by 8 | Viewed by 641503
Abstract
The objective of this study is to perform trend analysis in the historic data sets of annual and crop season [May–September] precipitation and daily maximum and minimum temperatures across the southwest United States. Eighteen ground-based weather stations were considered across the southwest United [...] Read more.
The objective of this study is to perform trend analysis in the historic data sets of annual and crop season [May–September] precipitation and daily maximum and minimum temperatures across the southwest United States. Eighteen ground-based weather stations were considered across the southwest United States for a total period from 1902 to 2017. The non-parametric Mann–Kendall test method was used for the significance of the trend analysis and the Sen’s slope estimator was used to derive the long-term average rates of change in the parameters. The results showed a decreasing trend in annual precipitation at 44.4% of the stations with the Sen’s slopes varying from −1.35 to −0.02 mm/year while the other stations showed an increasing trend. Crop season total precipitation showed non-significant variation at most of the stations except two stations in Arizona. Seventy-five percent of the stations showed increasing trend in annual maximum temperature at the rates that varied from 0.6 to 3.1 °C per century. Air cooling varied from 0.2 to 1.0 °C per century with dominant warming phenomenon at the regional scale of the southwest United States. Average annual minimum temperature had increased at 69% of the stations at the rates that varied from 0.1 to 8 °C over the last century, while the annual temperature amplitude showed a decreasing trend at 63% of stations. Crop season maximum temperature had significant increasing trend at 68.8% of the stations at the rates varying from 0.7 to 3.5 °C per century, while the season minimum temperature had increased at 75% of the stations. Full article
Show Figures

Figure 1

22 pages, 3878 KiB  
Article
Gains or Losses in Forest Productivity under Climate Change? The Uncertainty of CO2 Fertilization and Climate Effects
by Dominik Sperlich, Daniel Nadal-Sala, Carlos Gracia, Jürgen Kreuzwieser, Marc Hanewinkel and Rasoul Yousefpour
Climate 2020, 8(12), 141; https://0-doi-org.brum.beds.ac.uk/10.3390/cli8120141 - 30 Nov 2020
Cited by 18 | Viewed by 4605
Abstract
Global warming poses great challenges for forest managers regarding adaptation strategies and species choices. More frequent drought events and heat spells are expected to reduce growth and increase mortality. Extended growing seasons, warming and elevated CO2 (eCO2) can also positively [...] Read more.
Global warming poses great challenges for forest managers regarding adaptation strategies and species choices. More frequent drought events and heat spells are expected to reduce growth and increase mortality. Extended growing seasons, warming and elevated CO2 (eCO2) can also positively affect forest productivity. We studied the growth, productivity and mortality of beech (Fagus sylvatica L.) and fir (Abies alba Mill.) in the Black Forest (Germany) under three climate change scenarios (representative concentration pathways (RCP): RCP2.6, RCP4.5, RCP8.5) using the detailed biogeochemical forest growth model GOTILWA+. Averaged over the entire simulation period, both species showed productivity losses in RCP2.6 (16–20%) and in RCP4.5 (6%), but productivity gains in RCP8.5 (11–17%). However, all three scenarios had a tipping point (between 2035–2060) when initial gains in net primary productivity (NPP) (6–29%) eventually turned into losses (1–26%). With eCO2 switched off, the losses in NPP were 26–51% in RCP2.6, 36–45% in RCP4.5 and 33–71% in RCP8.5. Improved water-use efficiency dampened drought effects on NPP between 4 and 5%. Tree mortality increased, but without notably affecting forest productivity. Concluding, cultivation of beech and fir may still be possible in the study region, although severe productivity losses can be expected in the coming decades, which will strongly depend on the dampening CO2 fertilization effect. Full article
Show Figures

Graphical abstract

21 pages, 4300 KiB  
Article
Climate Change Risk Assessment for Kurunegala, Sri Lanka: Water and Heat Waves
by Hanna Cho
Climate 2020, 8(12), 140; https://0-doi-org.brum.beds.ac.uk/10.3390/cli8120140 - 27 Nov 2020
Cited by 6 | Viewed by 6326
Abstract
Sri Lanka is experiencing various social and environmental challenges, including drought, storms, floods, and landslides, due to climate change. One of Sri Lanka’s biggest cities, Kurunegala, is a densely populated city that is gradually turning into an economic revitalization area. This fast-growing city [...] Read more.
Sri Lanka is experiencing various social and environmental challenges, including drought, storms, floods, and landslides, due to climate change. One of Sri Lanka’s biggest cities, Kurunegala, is a densely populated city that is gradually turning into an economic revitalization area. This fast-growing city needs to establish an integrated urban plan that takes into account the risks of climate change. Thus, a climate change risk assessment was conducted for both the water and heat wave risks via discussions with key stakeholders. The risk assessment was conducted as a survey based on expert assessment of local conditions, with awareness surveys taken by residents, especially women. The assessment determined that the lack of drinking water was the biggest issue, a problem that has become more serious due to recent droughts caused by climate change and insufficient water management. In addition, the outbreak of diseases caused by heat waves was identified as a serious concern. Risk assessment is integral to developing an action plan for minimizing the damage from climate change. It is necessary to support education and awareness in developing countries so that they can perform risk assessment well and develop both problem-solving and policy-making abilities to adapt to a changing climate. Full article
Show Figures

Figure 1

20 pages, 6071 KiB  
Article
Modeling the Impacts of Climate Change on Crop Yield and Irrigation in the Monocacy River Watershed, USA
by Manashi Paul, Sijal Dangol, Vitaly Kholodovsky, Amy R. Sapkota, Masoud Negahban-Azar and Stephanie Lansing
Climate 2020, 8(12), 139; https://0-doi-org.brum.beds.ac.uk/10.3390/cli8120139 - 25 Nov 2020
Cited by 17 | Viewed by 4799
Abstract
Crop yield depends on multiple factors, including climate conditions, soil characteristics, and available water. The objective of this study was to evaluate the impact of projected temperature and precipitation changes on crop yields in the Monocacy River Watershed in the Mid-Atlantic United States [...] Read more.
Crop yield depends on multiple factors, including climate conditions, soil characteristics, and available water. The objective of this study was to evaluate the impact of projected temperature and precipitation changes on crop yields in the Monocacy River Watershed in the Mid-Atlantic United States based on climate change scenarios. The Soil and Water Assessment Tool (SWAT) was applied to simulate watershed hydrology and crop yield. To evaluate the effect of future climate projections, four global climate models (GCMs) and three representative concentration pathways (RCP 4.5, 6, and 8.5) were used in the SWAT model. According to all GCMs and RCPs, a warmer climate with a wetter Autumn and Spring and a drier late Summer season is anticipated by mid and late century in this region. To evaluate future management strategies, water budget and crop yields were assessed for two scenarios: current rainfed and adaptive irrigated conditions. Irrigation would improve corn yields during mid-century across all scenarios. However, prolonged irrigation would have a negative impact due to nutrients runoff on both corn and soybean yields compared to rainfed condition. Decision tree analysis indicated that corn and soybean yields are most influenced by soil moisture, temperature, and precipitation as well as the water management practice used (i.e., rainfed or irrigated). The computed values from the SWAT modeling can be used as guidelines for water resource managers in this watershed to plan for projected water shortages and manage crop yields based on projected climate change conditions. Full article
(This article belongs to the Special Issue Climate Change Impacts at Various Geographical Scales)
Show Figures

Figure 1

17 pages, 2727 KiB  
Article
The Effect of Statistical Downscaling on the Weighting of Multi-Model Ensembles of Precipitation
by Adrienne M. Wootten, Elias C. Massoud, Agniv Sengupta, Duane E. Waliser and Huikyo Lee
Climate 2020, 8(12), 138; https://0-doi-org.brum.beds.ac.uk/10.3390/cli8120138 - 25 Nov 2020
Cited by 20 | Viewed by 3519
Abstract
Recently, assessments of global climate model (GCM) ensembles have transitioned from using unweighted means to weighted means designed to account for skill and interdependence among models. Although ensemble-weighting schemes are typically derived using a GCM ensemble, statistically downscaled projections are used in climate [...] Read more.
Recently, assessments of global climate model (GCM) ensembles have transitioned from using unweighted means to weighted means designed to account for skill and interdependence among models. Although ensemble-weighting schemes are typically derived using a GCM ensemble, statistically downscaled projections are used in climate change assessments. This study applies four ensemble-weighting schemes for model averaging to precipitation projections in the south-central United States. The weighting schemes are applied to (1) a 26-member GCM ensemble and (2) those 26 members downscaled using Localized Canonical Analogs (LOCA). This study is distinct from prior research because it compares the interactions of ensemble-weighting schemes with GCMs and statistical downscaling to produce summarized climate projection products. The analysis indicates that statistical downscaling improves the ensemble accuracy (LOCA average root mean square error is 100 mm less than the CMIP5 average root mean square error) and reduces the uncertainty of the projected ensemble-mean change. Furthermore, averaging the LOCA ensemble using Bayesian Model Averaging reduces the uncertainty beyond any other combination of weighting schemes and ensemble (standard deviation of the mean projected change in the domain is reduced by 40–50 mm). The results also indicate that it is inappropriate to assume that a weighting scheme derived from a GCM ensemble matches the same weights derived using a downscaled ensemble. Full article
(This article belongs to the Section Climate Dynamics and Modelling)
Show Figures

Figure 1

Previous Issue
Next Issue
Back to TopTop