Article

Vulnerability and Risk Factors due to Tropical Cyclones in Coastal Cities of Baja California Sur, Mexico

by
Elvia Aida Marín-Monroy
1,*,
Víctor Hernández-Trejo
2,
Eleonora Romero-Vadillo
3 and
Antonina Ivanova-Boncheva
2
1
Departamento de Pesquerías, Universidad Autónoma de Baja California Sur, Carreterra al Sur km.5.5 Col. Mezquitito, C.P. 23080 La Paz, Baja California Sur, Mexico
2
Departamento de Economía, Universidad Autónoma de Baja California Sur, Carreterra al Sur km.5.5 Col. Mezquitito, C.P. 23080 La Paz, Baja California Sur, Mexico
3
Departamento Ciencias Marinas y Costeras, Universidad Autónoma de Baja California Sur, Carreterra al Sur km.5.5 Col. Mezquitito, C.P. 23080 La Paz, Baja California Sur, Mexico
*
Author to whom correspondence should be addressed.
Submission received: 2 November 2020 / Revised: 13 November 2020 / Accepted: 18 November 2020 / Published: 10 December 2020
(This article belongs to the Section Policy, Governance, and Social Equity)

Abstract

:
Coastal cities have seen an unprecedented growth with regional settlements due to development activities; that is why measures are needed to mitigate risk of adverse events such as tropical cyclones. Baja California Sur, a state known as a relevant ecological and tourist region, includes destinations such as Cabo San Lucas and La Paz, impacted yearly by tropical cyclones, so it is important to design contingency plans and provide available information to the residents. Los Cabos municipality has the highest population growth rate and its inhabitants are more susceptible to adverse events; despite this, there were no indicators of social and ecological vulnerability to risk effects of tropical cyclones. The objective of this research is to calculate the socio-environmental vulnerability of households through an index to identify risk factors. We have obtained a classification according to levels of vulnerability, and the results have shown that 74% of the households are high on the vulnerability scale, 21% of households are moderately vulnerable and only the remaining 5% of households are less vulnerable. In conclusion, the devastating effects of hydrometeorological events were mainly due to a lack of knowledge regarding such events among inhabitants.

1. Introduction

Coastal populations have been exposed to specific hazards such as coastal flooding and tropical storms due to a reduction in resilience, as well as environmental change and human activities; however, resilient communities are equipped to reduce impacts which affect most vulnerable populations [1,2]. Studies that explore the social aspects of vulnerability to climate change with an examination of the underlying socioeconomic and institutional factors are needed, especially in coastal regions where a higher exposure index to the effects of climate change exists [3]. Other factors that have been studied include social relations, political power, gender, age, and income. This is because vulnerability to climate change and variability is linked to social aspects and economic development [4].
In a study that calculated an index of vulnerability by country, Mexico was ranked in position number 95, obtaining values that showed a medium risk in exposure, vulnerability, susceptibility, and lack of cooperation [5]; however, at a subnational or regional scale, the Pacific coast has been shocked by several hydrometeorological events, mainly tropical cyclones (TCs). TCs are large-scale storms that form over warm ocean waters in tropical regions, bring enormous amounts of humidity and generate heavy rains in short periods. Hurricanes are mature TCs; when faced with mountain barriers, the intensity of the rain is even greater. Another concern is the storm surge, which corresponds to the rise in the mean sea level (more than 1 m) on the coast. This is caused by the wind blowing towards the continental mass, causing damaging flooding due to torrential rainfall; these factors make the hurricane one of the most life threatening and destructive phenomena on earth. Regarding their formation, it is widely accepted that TCs are associated with low-level tropical disturbances and warm sea surface temperatures [6,7].
From 1966 to 2015, a total of 125 tropical cyclones were registered in the northwest Pacific; 53% were intense hurricanes and the state of Baja California Sur has been impacted by 44 hurricanes that made landfall, causing human and economic losses [8]. One of the most devastating in recent decades was hurricane Odile on 14 September 2014, with sustained winds of 205 km/h, reaching up to 250 km/h (category III on the Saffir–Simpson scale), and 173 mm of maximum rainfall. When it made landfall at Baja California Sur (BCS) it caused major financial losses, mainly in the tourist sector, estimated at 10.14 billion Mexican pesos (42% of total) [7]. Conversely, we have found that a positive outcome of such an event could be social learning or new knowledge about resilience. Social learning is defined as the diversity of adaptations, and the promotion of local social cohesion or networks and mechanisms for collective action [1]. In this scenario, communities affected can adopt a higher consciousness about the effects of hydrometeorological events. However, a study concerning the vulnerability of beach tourism to climate change showed that we still have to improve adaptive capacity. On a scale from 1 to 5 (1 being low, 5 high) Mexico’s score was 2.5 in adaptive capacity [8].
Important touristic coastal cities in BCS are Cabo San Lucas, San José del Cabo (Los Cabos corridor), La Paz and Loreto, and their growth rates from 2010 to 2015 were 20.6%, 8.3% and 12.9%, respectively. Los Cabos corridor has the highest growth because as an important tourist center it attracts large investments. In fact, it is the second most important planned center, and most visited in Mexico after Cancun. It is estimated that 82% of the population are dependent on tourist activities, through direct and indirect jobs [9]. These three cities and municipalities have reached a population of 579,294, which is 81% of total population of the state; and population density might prove to be an important indicator of vulnerability [10,11]. Other studies have shown that households residing in coastal areas have greater vulnerability due to a rapidly growing population and their limited ability to cope with naturally occurring disasters. The ability to cope has been defined as a combination of resistance or the ability to absorb the damaging impacts of a hazard and continue functioning, as well as resilience or the ability to recover from losses quickly; these two coping mechanisms are direct opposites [1,2,10,12].
Assessment of resilience in a region is a complex undertaking, even more so when deeply socioeconomic differences among a population exist due to the consequences of tourist activities. It is challenging to understand these multi-causal processes that explain resilience [13]. However, it was found that with the implementation of disaster risk reduction and by using sustainable livelihoods, resilience could be achieved in communities prone to cyclone disasters. In addition, characteristics of resilient communities can be recognized, such as better organization and communication within these communities, having access to infrastructure and health services, more economic opportunities and sustainable management of their resources [2].
Baja California Sur is the Mexican state that is most affected by hydrometeorological events due to their trajectory and formation (mainly tropical storms and hurricanes) in northern Mexico (Figure 1) [14]. However, the analysis or study of its social impacts is scarce, despite the fact that various organizations and experts have warned about climate change effects on the frequency of the formation of these events [15,16]. To address these shortfalls and to contribute to the construction of cities with greater adaptation to this type of phenomena and therefore make them more resilient, the objective of this study is to calculate a socio-environmental vulnerability index in cities with the highest incidence and detect factors to develop strategies to prevent risks from tropical cyclones.

2. Materials and Methods
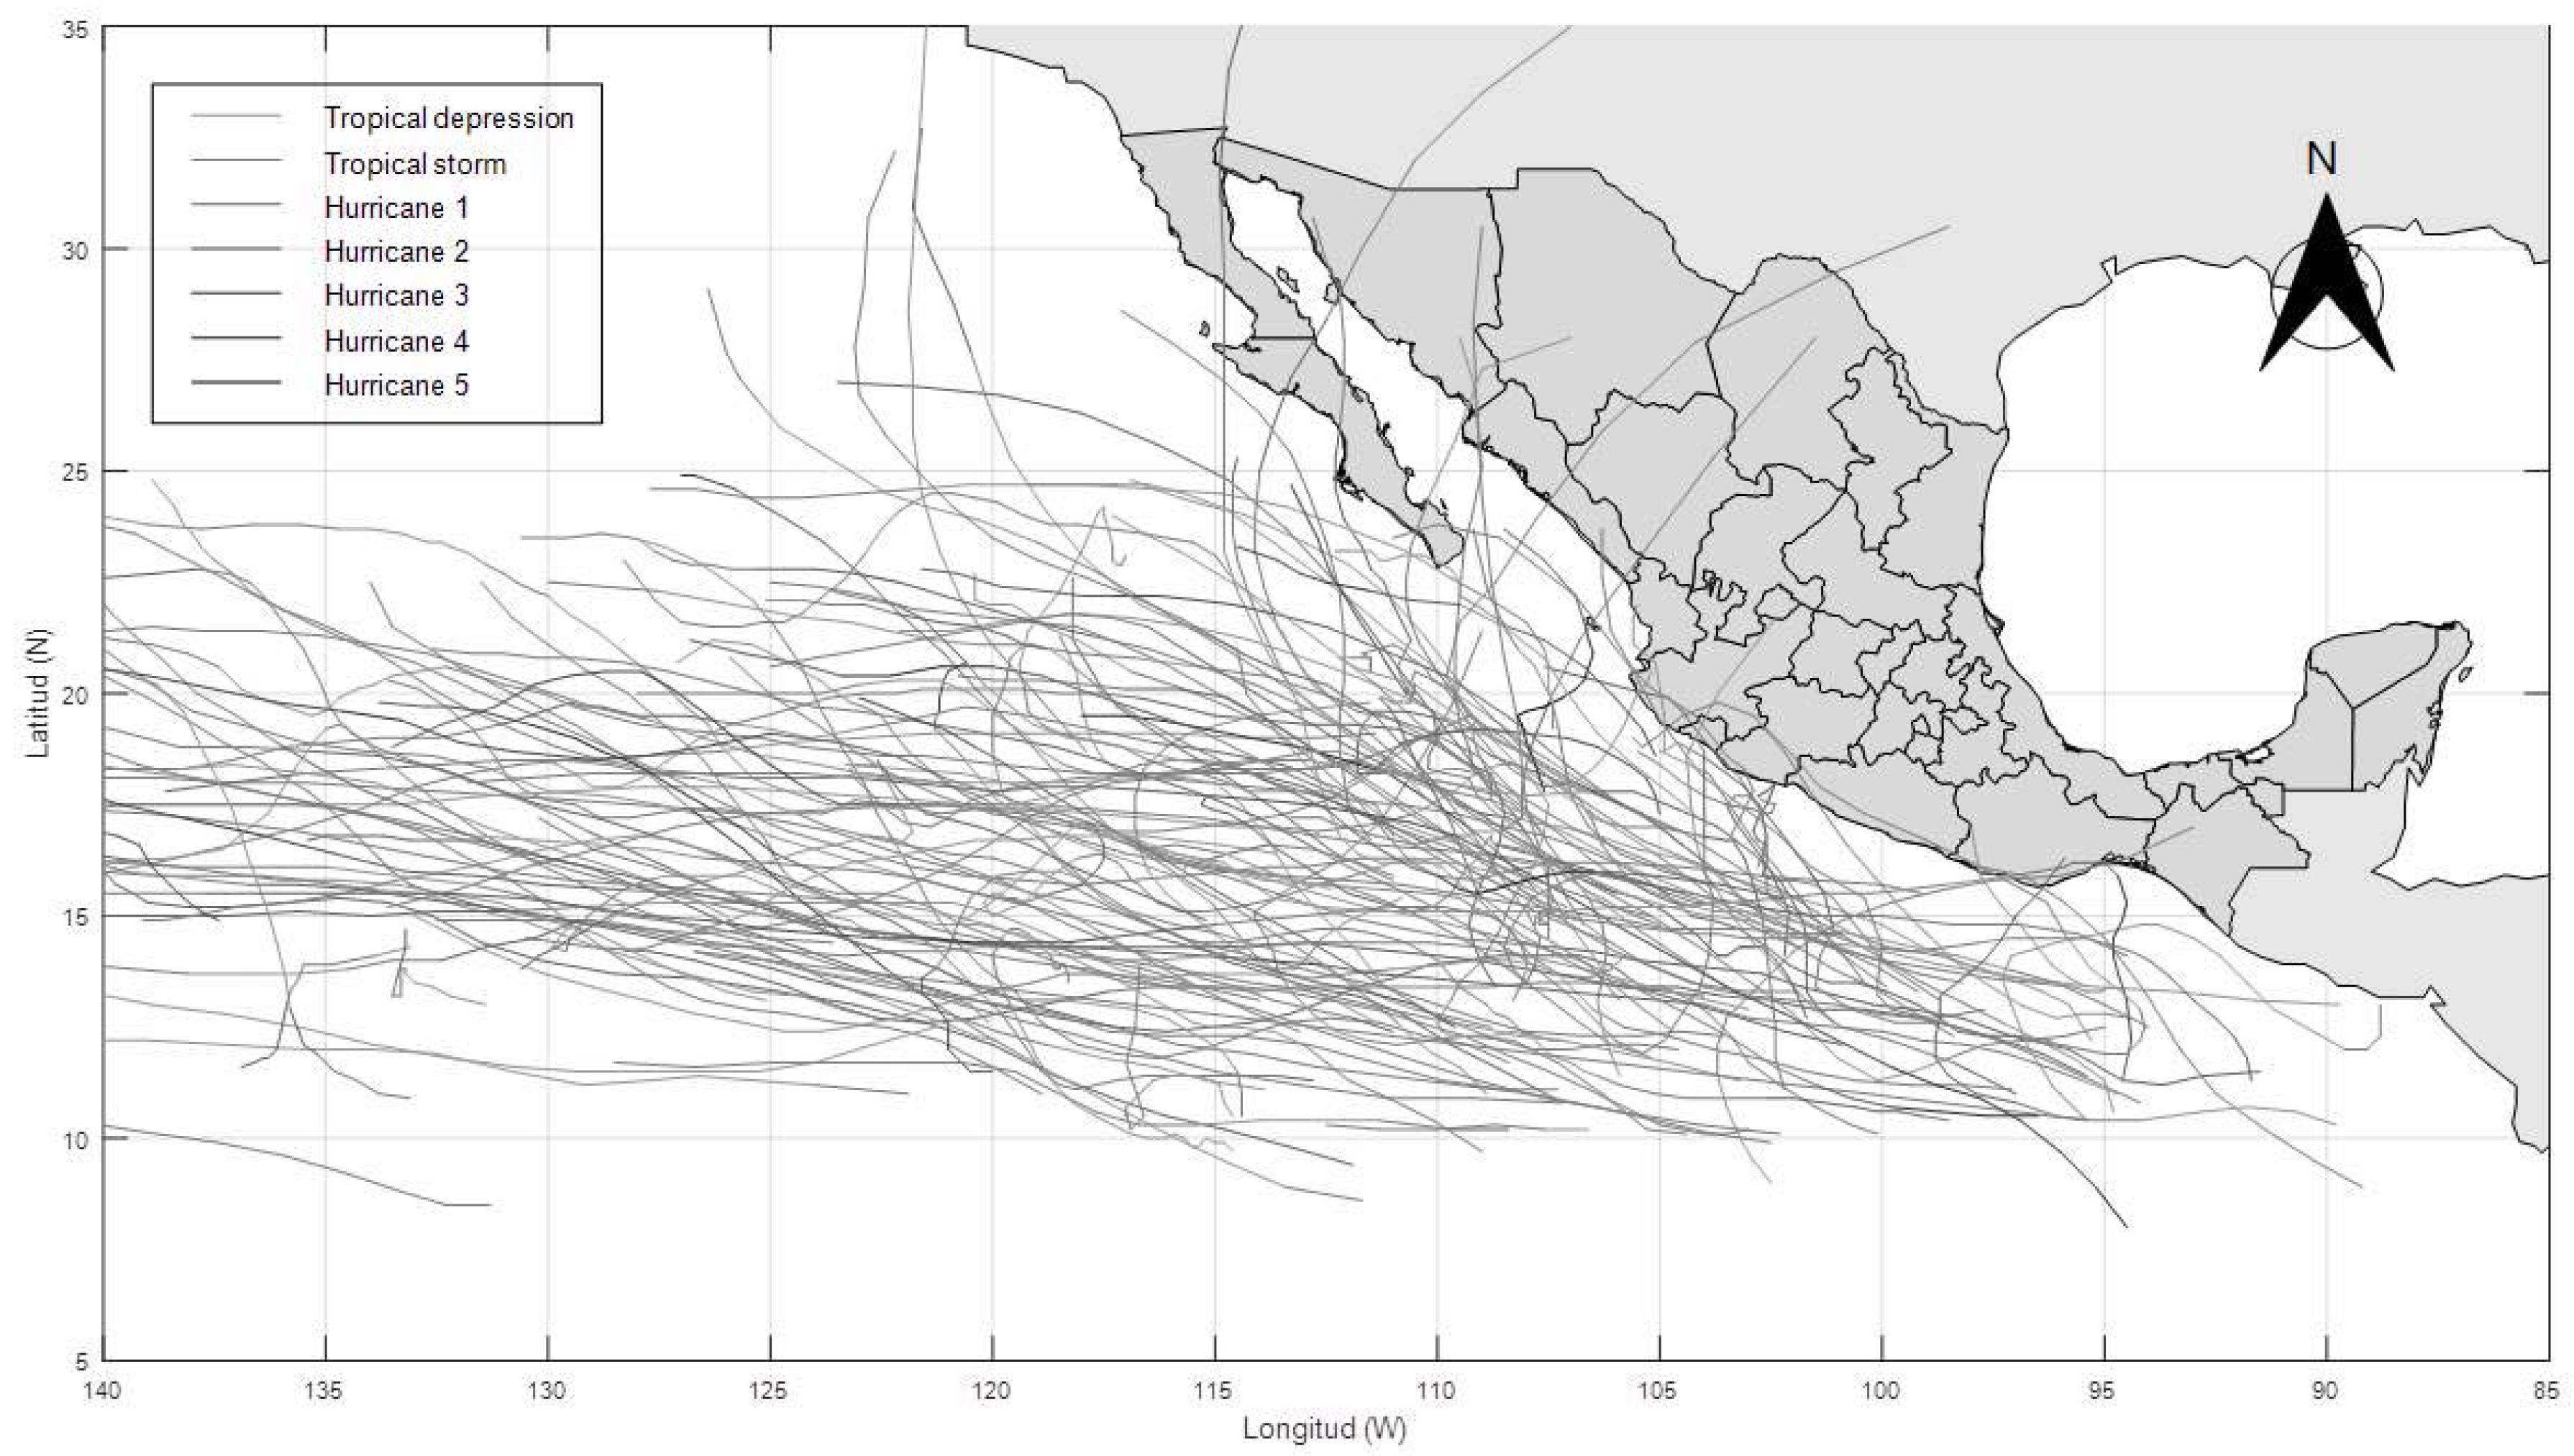
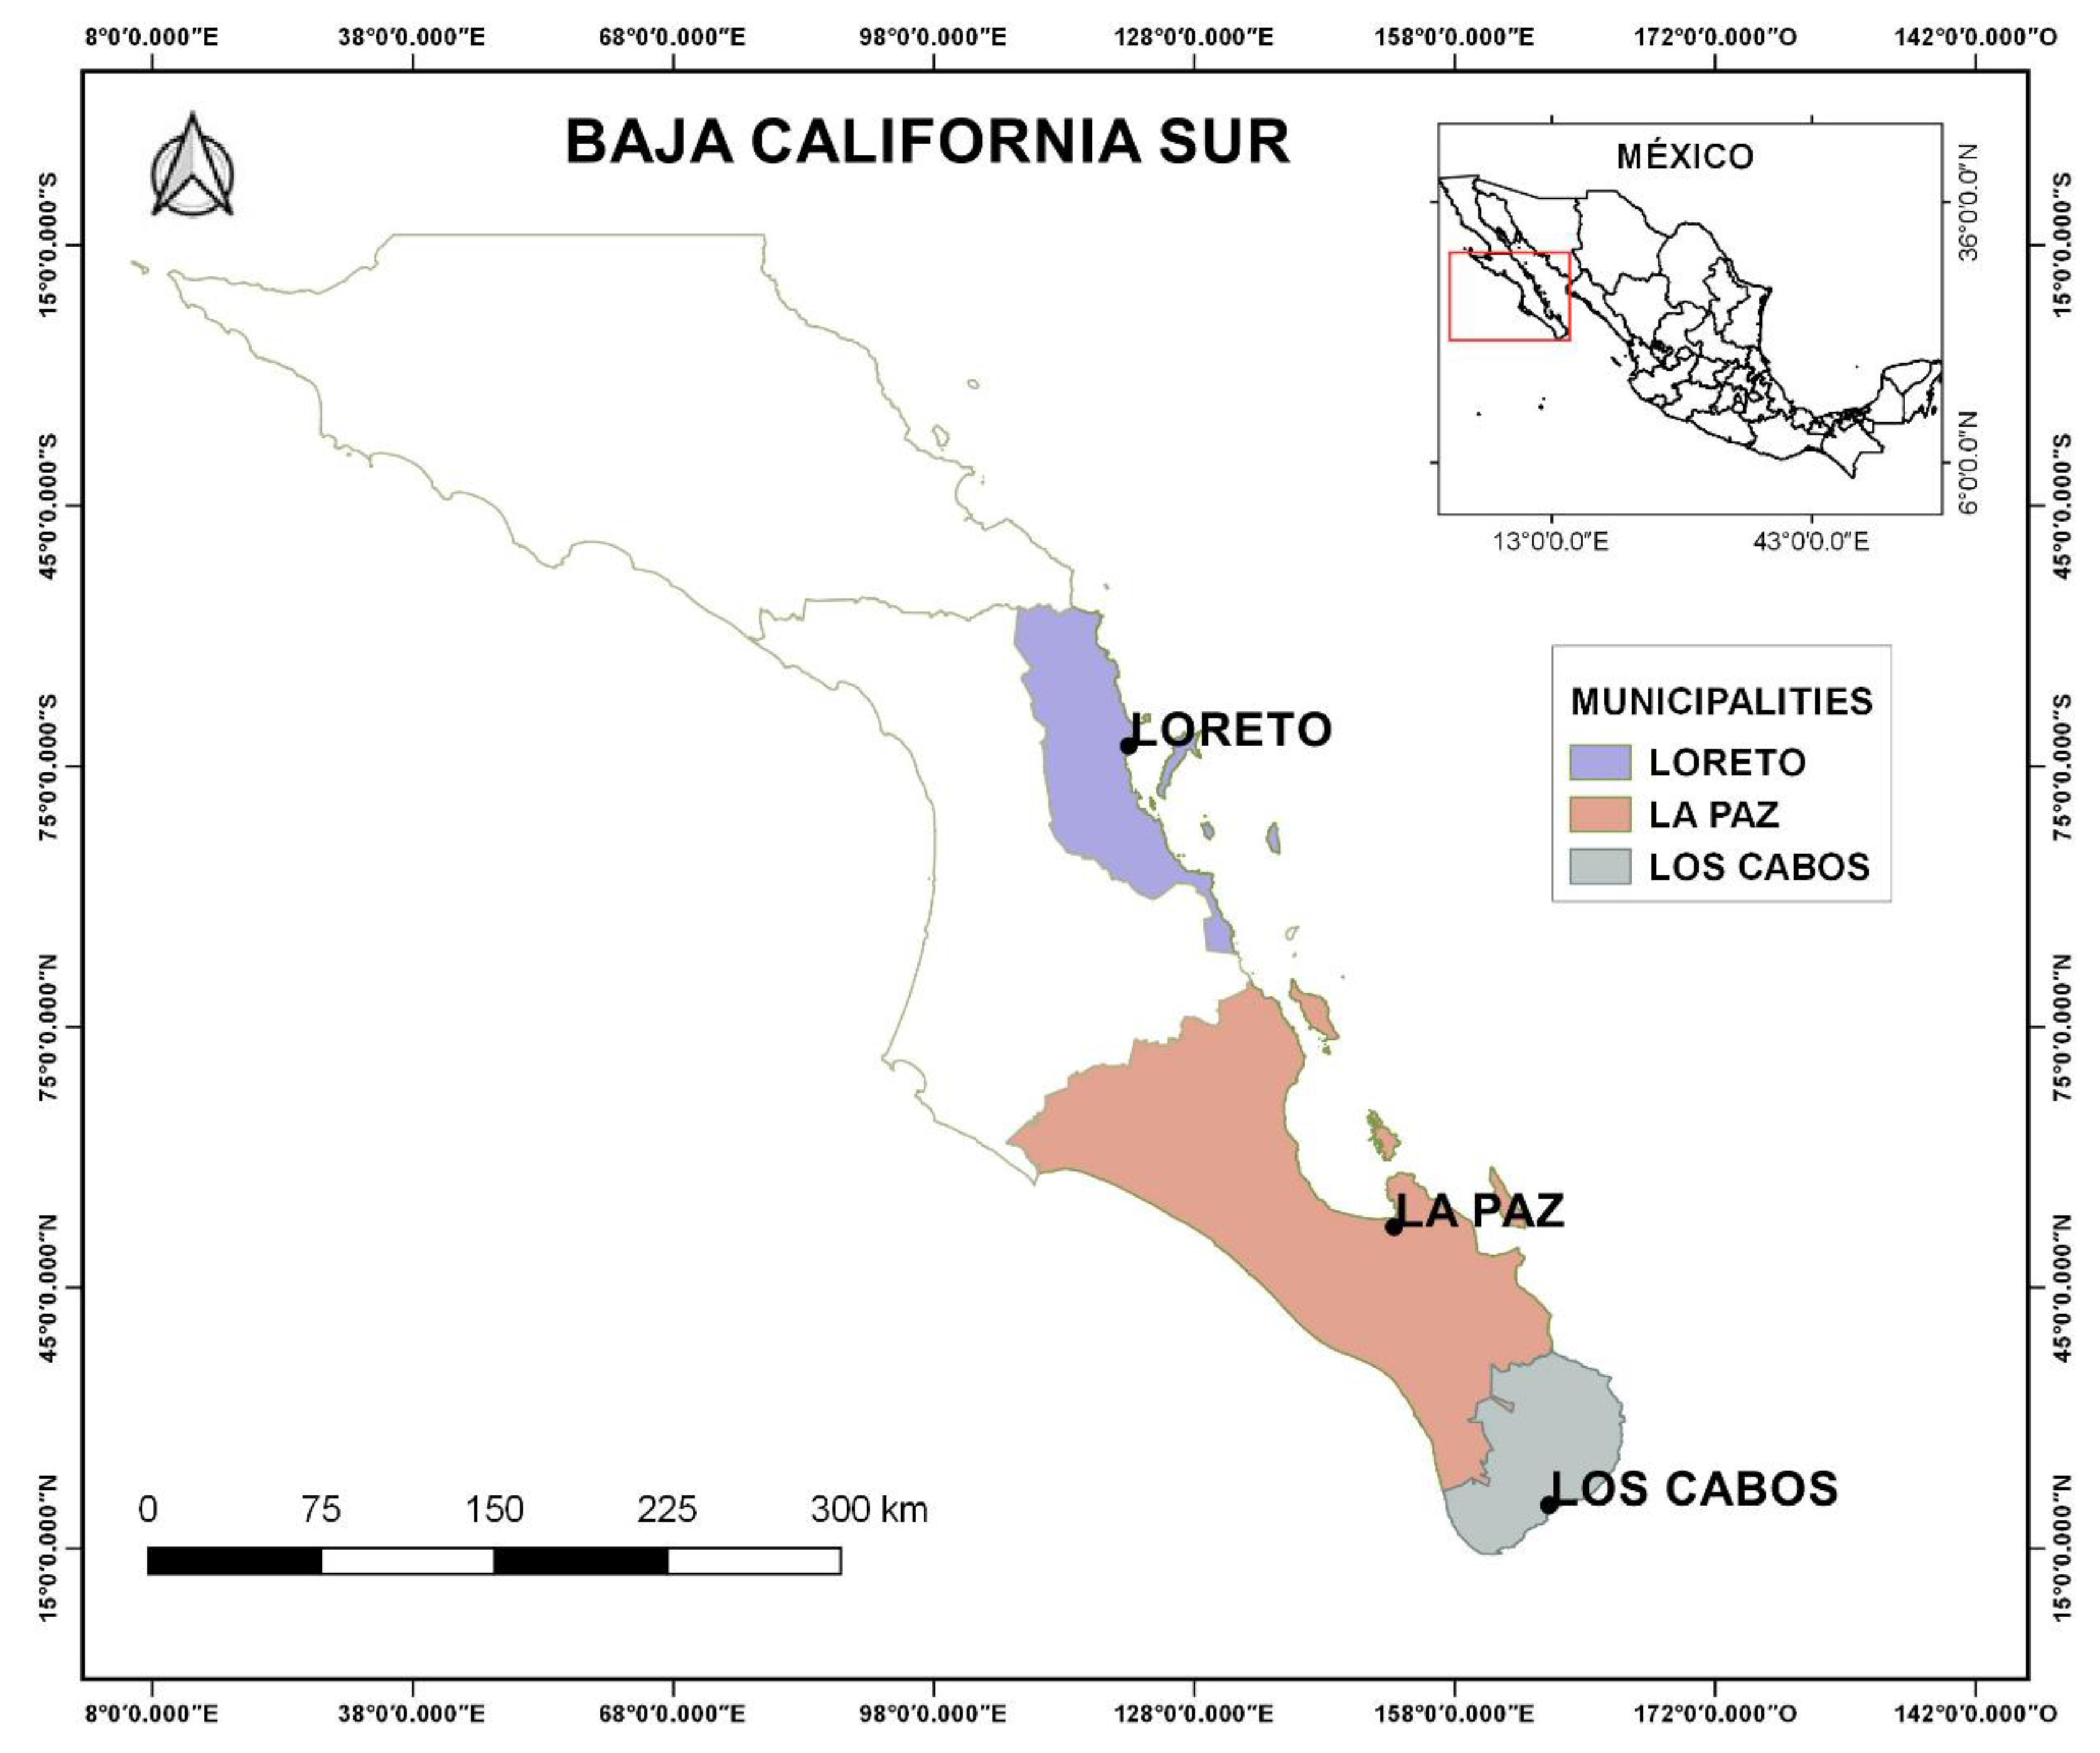
2.1. Study Area

Baja California Sur is in the northwest of Mexico, in the southern part of the peninsula of Baja California. Its borders reach in the north the state of Baja California, in the east the Sea of Cortes and in the south the Pacific Ocean. According to the National Institute of Geography and Statistics, BCS has an area of 73,475 km2 and five municipalities (Los Cabos, La Paz, Comondú, Loreto and Mulegé) (Figure 2) [11]. It is an arid region that has the lowest average rainfall in the country, with many streams, which remain dry most of the time, causing irregular settlements that block stream channels. We selected three of the cities and their municipalities with the highest probability of being impacted by cyclones, which also account for 81 percent of the total state population. Previous studies have shown that La Paz is a municipality with vulnerability to tropical cyclones (TC), due to a greater risk of impact [14]. Los Cabos is the most populated municipality and has registered the highest economic losses by cyclones. In addition, it is one of the largest tourist centers in the country with the important attraction of foreign direct investment as well as real-estate investment [7]. Loreto has the lowest population; however, is a relevant tourist destination, with international connectivity by air [11] and an emerging real state sector. It is important to note that Los Cabos is the second most visited tourist center in Mexico and has a foreign tourism affluence of an average of 73%, providing a sustained contribution to the GDP and becoming a relevant site for economic progress in the state of Baja California Sur [9]. A rapid reactivation and adaptation after an adverse event are priorities in cities such as this in order to reduce negative impacts on highly vulnerable inhabitants.

2.2. Methods

This study used the technique of Principal Component Analysis (PCA) to assess vulnerability according to the Intergovernmental Panel on Climate Change (IPCC) framework; also, we reviewed several indexes, focusing on assessing the perception of socio-environmental vulnerability due to hurricane impacts [17,18,19].
To obtain information to estimate vulnerability, we did primary research in selected municipalities and applied a structured questionnaire to heads of households of 825 houses selected randomly and distributed by municipality: Los Cabos (n = 335), La Paz (n = 252), Loreto (n = 238); sample size was calculated based on finite population sampling with a 95% confidence level. Random selection was used to take into account National Institute of Statistics and Geography municipality maps that include urban basic geostatistical areas (AGEBs). The date of application was July to October in 2017 as a part of the research project “Adaptability and to climate change: a proposal to measure vulnerability and resilience due to impacts of Tropical Cyclones at Baja California Sur”. The questionnaire included four sections: socio-demographic aspects, housing characteristics, level of severity of damages caused by the last hurricane, and level of knowledge about disaster prevention and social capital. We estimated vulnerability according to our previous research through the socio-environmental vulnerability index [20].
We applied the IPCC’s formula, where:
Vulnerability = (Adaptive capacity) − (SensitivityExposure)
The model included ten variables. Adaptive capacity was measured by degree of information on risks (tropical cyclones): degree of information on potential risks (housing), and level of knowledge about Early Warning Systems [21]. Sensitivity variables included were type of roofing and housing construction material, type of housing floor material, and type of housing wall construction material. In addition, exposure variables included perception of the degree of damage caused by flooding, perception of degree of damage caused by landslides, perception of degree of damage caused by storm surges, and perception of the degree of damage caused by floods of streams.
To obtain the vulnerability index, the regression method was used as a criterion from which the standardized coefficients of the linear equation were obtained to generate the vulnerability index by factor or dimension:
  • Exposure of households, through the perception of damage caused by a recent hurricane.
  • Adaptive capacity, through indicators such as social capital and education for the prevention of natural hazards.
  • Sensitivity of households according to their construction materials.
The data obtained on the vulnerability index of each household indicated three possible scenarios: (1) highly vulnerable—households with significantly negative difference between adaptive capacity and sensitivity/exposure; (2) moderately vulnerable—the difference between adaptive capacity and sensitivity/exposure is nearly zero; (3) less vulnerable—with significantly positive difference between adaptive capacity and exposure/sensitivity [19].

3. Results

We obtained a demographic profile by municipality (Table 1). Immigrant populations are located mainly in Los Cabos municipality.
The PCA analysis resulted in a Kaiser–Meyer–Olkin (KMO) value of 7.3 (0.73); this value is considered acceptable for a reduction in data. The data analysis identified three factors that explain the total variance: Factor 1 explains 26.65% of the total; it is related to the exposure of households, through the perception of damage caused by a recent hurricane. Factor 2 explains 21.37% and includes information about adaptive capacity, through indicators such as social capital and education for the prevention of natural hazards. Finally, factor 3 explains 15.75% of the total variance, and it is a measure of the sensitivity of households according to their construction materials. Table 2 shows that the total variance explained by these three factors is 63.78%.
The main findings on socio-environmental vulnerability due to the impact of TCs are in Table 3, and show the correlation analysis and Varimax rotation applied [22]. The results showed the question related to each variable according to type of component: exposure (E), adaptive capacity (AC) and the sensitivity to effects (S).
According to these results and standarizated coeficiens (Table 4), the index of socio-environmental vulnerability shows that 74% of houses in the three municipalities selected are in the highly vulnerable category; 21% are in the moderately vulnerable category; and only 5% are ranked as less vulnerable. High and moderate socio-environmental vulnerability is confirmed by TCs of 95% of the sampled households for the study area.
As we can see, household adaptive capacity is relatively high; this is because the population has an adequate knowledge about TC consequences and stays alert to the early warning system. However, in a review of these results, we can infer that households in main coastal cities of Baja California Sur have very low adaptive capacity to TC; this may be due to high influence of exposure (TC effects) and sensitivity (mainly due to household construction materials).

4. Discussion

The analysis of adaptation options aims to identify preferred measures and vulnerability indices to show relative vulnerability values for countries or communities where the main purpose was to identify adaptation strategies that are feasible and practical [23]. We found that the majority of households (74%) in the main coastal cities of Baja California Sur are in the category of “highly vulnerable” and this could be related to accelerated haphazard settlements due to rapid population growth. As per our studies, we see that coastal populations have a different scale of vulnerability when data is disaggregated. La Paz had 33% high vulnerability [20]; the less populated municipality in BCS, Loreto, showed that 70% of its households have high and moderate vulnerability, whereas remoteness was also identified as triggering more vulnerability [24]. In our sample, Loreto is a municipality with a lower population in a remote area, compared to La Paz and Los Cabos, and according to other studies, less vulnerability may be due to several factors such as an improved early warning system, better infrastructure, and quicker access to external rescue and aid from humanitarian services in urban areas. Remote locations are more disconnected and less accessible. The data suggest a wide variation in municipality vulnerability, and this is quite common in coastal areas in Mexico due to the relatively high exposure of these municipalities to hurricanes and ensuing flood risk [25,26].
We have observed that demographic pressure and the development of new infrastructure will increase human exposure in the coming decades, and we suggest that the principle of caution must be observed and galvanize governments to action [25]. Los Cabos municipality has one of the highest population growth rates in the country; that is why it is critical to provide tools to manage risks to society and social actors [27]. It becomes even more important because the Mexican government will discontinue funding of some aid for extreme events, although the National Disaster Fund (FONDEN; corresponding Spanish acronym), the main fund to face the effects of hazard natural events, will maintain its operation. Studies of impacts on a subnational level have proved that using a geographic scale with higher detail is more accurate in terms of improving the adaptive capacities of communities. A study covering social vulnerability in the Pacific coastal city of Manzanillo showed that 23.5% of its population presented high vulnerability; however, ecological aspects were excluded from the analysis [28]. Our results suggest that municipalities could present differences due to the adaptive capacities of natural features. The La Paz municipality could benefit from the fact that it has a high mangrove density, and its conservation allows a reduction in adverse effects due to intense cyclones and damage in infrastructure and socio-economic activities along the shores [29].
We suggest that a strategy to build resilience in these cities must include an analysis of the spatio-temporal distribution of flooding related to extreme hydrometeorological events, and use risk maps in the municipalities of La Paz, Los Cabos and Loreto. It is important to know which areas and populations are threatened, in order to implement future evacuation plans and routes. The risk of flooding also has been studied in cities of the Gulf of Mexico, where it was found that the exposed population to flooding is 21% of the total population of Tampico in Tamaulipas [30]. In addition, it has been found that 17.6% of houses were vulnerable to flooding in La Paz [20], and in Loreto 27% of houses were affected by flooding [24], and these georeferenced survey results show sensible information for the prevention of losses in the future. Due to the importance of a resilience strategy as a visual tool to maintain awareness of tropical storms, we recommend that future studies assess this indicator and its correlation with different strategies of policy in the field of risk prevention, mainly in Los Cabos municipality, due its growth dynamic and social context.
Finally, growth population dynamics differ among the municipalities studied. Los Cabos has shown higher social vulnerability, and low-income inhabitants are more vulnerable to hurricanes because they live in irregular settlements and far from tourist zones, which are reactivated sooner. This polarization also includes economic sectors and strategies regarding adaptation focused on tourist infrastructure and small businesses [31].

5. Conclusions

According to our results, the main coastal cities in the south of the Baja California Sur peninsula present a high level of socio-ecological vulnerability to the effects of tropical cyclones. The principal component that affects vulnerability index is related to exposure of households. This study takes into account variables about perception of risks to households such as floods, stream floods, landslides and storm surge. In addition, contrary to results from other cities in previous studies, the results suggest that Los Cabos municipality is the most affected due to the fast population growth rate and the irregular settlements. In this context, we recommend the inclusion of a georeferenced analysis of this region in future studies, with an elaboration of risk maps in the cities of Los Cabos, La Paz and Loreto, a useful tool to know which areas and populations are threatened and to implement efficient future evacuation plans.
Therefore, it is very important to increase cities’ resilience through education of the population and risk management in settlements. It should be a central policy strategy to maintain well-being in these localities and have policies aimed at strengthening their adaptive capacity. This index shows a higher risk of disaster if the population has a lack of knowledge about the effects of hydrometeorological events, especially in the case of the migratory population that could underestimate these effects. Finally, the dissemination of information on early warnings must be performed in a multicultural context and in different languages (foreign and native tongues).

Author Contributions

Conceptualization, E.A.M.-M. and V.H.-T.; methodology, E.R.-V. and V.H.-T.; software, V.H.-T.; validation, E.R.-V., V.H.-T. and E.A.M.-M.; formal analysis, V.H.-T.; E.R.-V.; investigation, E.R.-V., A.I.-B.; resources, E.A.M.-M.; data curation, V.H.-T.; E.R.-V.; writing—original draft preparation, E.A.M.-M., V.H.-T.; writing—review and editing, E.A.M.-M.; E.R.-V.; A.I.-B.; visualization, E.A.M.-M.; supervision, E.A.M.-M.; project administration, E.A.M.-M.; funding acquisition, E.A.M.-M. All authors have read and agreed to the published version of the manuscript.

Funding

This research was funded by Consejo Nacional de Ciencia y Tecnología (CONACyT), project number 258536 “Capacidad de adaptación al cambio climático: una propuesta para medir la vulnerabilidad y resiliencia ante el impacto de ciclones tropicales en Baja California Sur”.

Acknowledgments

We thank Nandeesh Shankar and Patricia Daniel for the manuscript review.

Conflicts of Interest

The authors declare no conflict of interest.

References

  1. Adger, W.N.; Hughes, T.P.; Folke, C.; Carpenter, S.R.; Rockstrom, J. Social-Ecological Resilience to Coastal Disasters. Science 2005, 309, 1036. [Google Scholar] [CrossRef] [PubMed] [Green Version]
  2. Ahmed, B.; Kelman, I.; Fehr, H.K.; Saha, M. Community Resilience to Cyclone Disasters in Coastal Bangladesh. Sustainability 2016, 8, 805. [Google Scholar] [CrossRef] [Green Version]
  3. Gbetibouo, G.A.; Ringler, C.; Hassan, R. Vulnerability of the South African farming sector to climate changeand variability: An indicator approach. Nat. Resour. Forum 2010, 34, 175–187. [Google Scholar] [CrossRef]
  4. Wu, S.; Yarnal, B.; Fisher, A. Vulnerability of coastal communities to sea-level rise: A case study of Cape May County, New Jersey, USA. Clim. Res. 2002, 22, 255–270. [Google Scholar] [CrossRef] [Green Version]
  5. Ruhr University Bochum—Institute for International Law of Peace and Armed Conflict. World Risk Report; The Institute for International Law of Peace and Armed Conflict (IFHV) of Ruhr University Bochum: Berlin, Germany, 2019. [Google Scholar]
  6. CENAPRED. Diagnóstico de Peligros e Identificación de Riesgos de Desastres en México; Centro Nacional de Prevención de Desastres: Mexico City, México, 2014. [Google Scholar]
  7. Vila, D.M. El huracán Odile y sus efectos en la infraestructura del sur de la península de Baja California. Ser. Investig. Desarro. 2015, 696, 303. [Google Scholar]
  8. Perch-Nielsen, S.L. The vulnerability of beach tourism to climate change—An index approach. Clim. Chang. 2010, 100, 579–606. [Google Scholar] [CrossRef]
  9. Cruz-Chávez, G.; Hernández-Trejo, V.; Avilés-Polanco, G.; Valdivia, R. Turismo extranjero y crecimiento económico en México. Evidencia empírica para Los Cabos. Econ. Soc. Territ. 2016, 50, 1–38. [Google Scholar] [CrossRef] [Green Version]
  10. Rygel, L.; O’Sullivan, D.; Yarnal, B. A Method for constructing a social vulnerability indez: An application to hurricane storm surges in a developed country. Mitig. Adapt. Strateg. Glob. Chang. 2006, 11, 741–764. [Google Scholar] [CrossRef]
  11. Instituto Nacional de Estadística, Geografía e Informática. Censo de Población y Vivienda; Instituto Nacional de Estadística: Aguascalientes, México, 2010. [Google Scholar]
  12. Yadav, D.K.; Barve, A. Analysis of socioeconomic vulnerability for cyclone-affected communities in coastal Odisha, India. Int. J. Disaster Risk Reduct. 2017, 22, 387–396. [Google Scholar] [CrossRef]
  13. Hernández, M.A.; Vázquez, V.; Palacio, A.G. Expresión territorial de la resiliencia turística ante la ocurrencia de eventos hidrometeorológicos en Los Cabos, Baja California Sur, México. Estud. Perspect. Tur. 2019, 28, 486–506. [Google Scholar]
  14. Romero Vadillo, E.; Romero Vadillo, I.G. Estimación del riesgo en las viviendas de Baja California Sur ante el impacto de ciclones tropicales. In Teoría y Praxis; Universidad de Quintana Roo: Cozumel, Mexico, 2016; pp. 50–73. Available online: http://www.redalyc.org/articulo.oa?id=456147940004 (accessed on 14 October 2019).
  15. IPCC. Climate Change 2014: Synthesis Report. Contribution of Working Groups I, II and III to the Fifth Assessment Report of the Intergovernmental Panel on Climate Change; Pachauri, R.K., Meyer, L.A., Eds.; IPCC: Geneva, Switzerland, 2014; p. 151. [Google Scholar]
  16. Hernández, M.L.; Carreño, M.L.; Castillo, L. Methodologies and tools of risk management: Hurricane risk index (HRi). Int. J. Disaster Risk Reduct. 2018, 31, 926–937. [Google Scholar] [CrossRef]
  17. Pérez-Montero, O.; Milanés-Batista, C. Social perception of coastal risk in the face of hurricanes in the southeastern region of Cuba. Ocean Coast. Manag. 2019, 184, 105010. [Google Scholar] [CrossRef]
  18. Vázquez-González, C.; Moreno-Casasola, P.; Peralta-Peláez, L.A.; Monroy, R.; Espejel, I. The value of coastal wetland flood prevention lost to urbanization on the coastal plain of the Gulf of Mexico: An analysis of flood damage by hurricane impacts. Int. J. Disaster Risk Reduct. 2019, 37, 101180. [Google Scholar] [CrossRef]
  19. Opiyo, F.E.O.; Wasonga, O.R.; Nyangito, M.N. Measuring household vulnerability to climate-induced stresses in pastoral rangeland of Kenya: Implications for resilience programming. Pastor. Res. Policy Pract. 2014, 4, 10. [Google Scholar] [CrossRef] [Green Version]
  20. Marín-Monroy, E.A.; Hernández-Trejo, V.; Ojeda-Ruiz, M.A.; Avilés-Polanco, G.; Núñez, B. Assessment of Socio-Environmental Vulnerability Due to Tropical Cyclones in La Paz, Baja California Sur, Mexico. Sustainability 2020, 12, 1575. [Google Scholar] [CrossRef] [Green Version]
  21. Sistema de Alarma Temprana para Ciclones Tropicales; Secretaría de Gobernación, Gobierno de México: Ciudad de México, Mexico, 2019. Available online: http://proteccioncivil.gob.mx/work/models/ProteccionCivil/Resource/62/1/images/siatctnueva.pdf (accessed on 15 October 2019).
  22. Kaiser, H.F. The varimax criterion for analytic rotation in factor analysis. Psychometrika 1958, 23, 187–200. [Google Scholar] [CrossRef]
  23. Smith, B.; Wandel, J. Adaptation, adaptive capacity and vulnerability. Glob. Environ. Chang. 2006, 16, 182–292. [Google Scholar] [CrossRef]
  24. Avilés-Polanco, G.; Beltrán-Morales, L.F.; Almendarez-Hernández, M. Vulnerabilidad socio-ambiental por impacto de ciclones tropicales en un área natural protegida: Loreto, Baja California Sur, México. In Economía, Manejo y Conservación en Áreas Naturales Protegidas de México; UABCS-UACH, La Paz, Baja California Sur; Elsevier: Amsterdam, The Netherlands, 2019. [Google Scholar]
  25. Peduzzi, P.; Chatenoux, B.; Dao, H.; De Bono, A.; Herold, C.; Kossin, J.; Mounton, F.; Nordbeck, O. Global trends in tropical cyclone risk. Nat. Clim. Chang. 2012, 2, 289–294. [Google Scholar] [CrossRef]
  26. Borja-Vega, C.; de la Fuente, A. Municipal Vulnerability to Climate Change and Climate-Related Events in Mexico; Police Research Working Paper 6417; World Bank: Aguascalientes, Mexico, 2013. [Google Scholar]
  27. Diario Oficial de la Federación. Decreto Por el que se Ordena la Extinción o Terminación de los Fideicomisos Públicos, Mandatos Públicos y Análogos. Available online: https://www.dof.gob.mx/nota_detalle.php?codigo=5591085&fecha=02/04/2020 (accessed on 26 July 2020).
  28. Bohórquez, J.E.T. Evaluación de la vulnerabilidad social ante amenazas naturales en Manzanillo (Colima). Un aporte de método. Investig. Geogr. Boletín Inst. Geogr. 2013, 81, 79–93. [Google Scholar] [CrossRef]
  29. García Benitez, M.; Adame Martínez, S.; Alvarado Granados, A. Urbanización e eimpacto de los ciclones tropicales en la Ciudad de Progreso de Castro, Yucatán. Nova Sci. 2017, 9, 19. [Google Scholar]
  30. Sánchez González, D. Peligrosidad y exposición a los ciclones tropicales en ciudades del Golfo de México: El caso de Tampico. Rev. Geogr. Norte Gd. 2011, 50, 151–170. [Google Scholar] [CrossRef]
  31. Legorreta, A.; Osorio, M.; Palafox, A.; Bringas, N. Medidas de Mitigación y Adaptación ante Peligros Hidrometeorológicos: El caso del sector hotelero en la isla de Cozumel, Quintana Roo, México. Estud. Perspect. Tur. 2015, 24, 336–355. [Google Scholar]
Figure 1. Tropical storms trajectories at Pacific Ocean (1991–2000). (Source: CENAPRED, 2014).
Climate 08 00144 g001
Figure 2. Localization and municipalities included in the study area. Source: Authors’ elaboration.
Climate 08 00144 g002
Table 1. Socio-demographic profile by municipality.
MunicipalitySample Size (n)Average Age of Head of Family% of Women as Head of Family% of Head of Family Immigrant
La Paz3354551.362.4
Los Cabos2525034.530.2
Loreto2384731.122.7
Source: Authors’ elaboration.
Table 2. Matrix of rotated components *.
Explained Variance by Component
ComponentEigenvaluesInitial SolutionRotated Solution
Total% of Variance% CumulativeTotal% of Variance% CumulativeTotal% of Variance% Cumulative
12.70827.07527.0752.70827.07527.0752.66526.65526.655
22.21322.12749.2022.21322.12749.2022.13721.37348.028
31.45814.57963.7811.45814.57963.7811.57515.75363.781
40.7937.92871.710
50.6856.84678.556
60.5565.56484.120
70.4994.99389.113
80.4564.56293.675
90.3363.36497.040
100.2962.960100.000
* Extraction method: Principal components. Source: Authors’ elaboration.
Table 3. Rotate components matrix a.
Num.Question Related to Each VariableComponent
EACS
1What kind of material is most of the roof of your house made of?0.008−0.1010.722
2What kind of material is most of the floor of your house made of?0.0350.0130.753
3What kind of material are the walls of your house made of?0.063−0.0570.669
4How would you rank the damage done to your house due to floods in your street, block, or neighborhood?0.7580.0240.028
5How would you rank the damage done to your house due to landslides or collapse in your street, block, or neighborhood?0.843−0.0110.044
6How would you rank the damage done to your house due to storm surge in your street, block, or neighborhood?0.854−0.0010.000
7How would you rank the damage done to your house due to creek stream flood in your street, block, or neighborhood?0.802−0.0220.077
8How would you rank your knowledge about tropical cyclone formation?−0.0270.784−0.170
9How would you rank your knowledge about the hurricane Sar–Simpson scale and the potential damage due to wind, rain and storm surge?−0.0090.871−0.039
10How would you rank your knowledge about the EarlyWarning System?0.0310.8660.032
a Rotation converges after four iterations. Extraction: Principal components. Rotation: Varimax. Source: Authors’ elaboration. E: Exposure, AC: Adaptive capacity, S: Sensitivity.
Table 4. Matrix of standardized coefficients.
Num.Question Related to Each VariableComponent
EACS
1What kind of material is most of the roof of your house made of?−0.0310.0080.461
2What kind of material is most of the floor of your house made of?−0.0250.0540.482
3What kind of material are the walls of your house made of?−0.0090.0170.435
4How would you rank the damage done to your house due to floods in your street, block, or neighborhood?0.2860.007−0.020
5How would you rank the damage done to your house due to landslides or collapse in your street, block, or neighborhood?0.3170.0000.000
6How would you rank the damage done to your house due to storm surge in your street, block, or neighborhood?0.328−0.003−0.042
7How would you rank the damage done to your house due to creek stream flood in your street, block, or neighborhood?0.305−0.006−0.002
8How would you rank your knowledge about tropical cyclone formation?−0.0010.365−0.046
9How would you rank your knowledge about the hurricane Sar–Simpson scale and the potential damage due to wind, rain and storm surge?−0.0070.4090.036
10How would you rank your knowledge about the EarlyWarning System?0.0090.4120.074
Source: Authors’ elaboration. Extraction: Principal components. Rotation: Varimax with Kaiser.
Publisher’s Note: MDPI stays neutral with regard to jurisdictional claims in published maps and institutional affiliations.

