Assessment of Climate Change Impacts on Sea Surface Temperatures and Sea Level Rise—The Arabian Gulf


1
Geography Department, College of Arts and Social Sciences, Sultan Qaboos University, Muscat, Oman
2
Environmental Sciences Department, Faculty of Science, Damietta University, New Damietta, Egypt
Climate 2020, 8(4), 50; https://0-doi-org.brum.beds.ac.uk/10.3390/cli8040050
Submission received: 1 March 2020
/
Revised: 26 March 2020
/
Accepted: 28 March 2020
/
Published: 30 March 2020
Abstract
:The Arabian Gulf is one of the regions in the world experiencing major changes due to increased economic growth rates and development practices. As a shallow water body within a hot desert, the Gulf is exposed to obvious warming in the sea surface temperatures (SST). Remotely sensed SST data were utilized to estimate decadal change in SST with a focus on coral reef locations. There is a positive trend in monthly time series SSTs, with a maximum value of about 0.7 °C/decade for the western side of the Gulf. This high trend of SST is associated with significant coral reef bleaching and it coincides with major climate/ocean interactions. Most of the Arabian countries along the Gulf have coastal developments at low-land areas of high vulnerability to sea level rise. Digital elevation models showed that there are more than 3100 km2 of coastal areas that occur at 1 m level along the Arabian countries of the Gulf. Coastal protection and conservation measures are crucial to protect low-lying coasts of urban use.
1. Introduction
Global climate change has caused worldwide concern due to its adverse effects on the global ecosystems and society [1]. The sea surface temperature (SST) was observed to increase in the Indian Ocean for the period from 2000 to 2013 in response to the greenhouse gas forcing, with a low increase in the northern part and much high increase in the south of the Indian Ocean [2]. In addition, the Indian Ocean experienced warming in the western side for the period 1960–2004 associated with El Niño events [3]. Moreover, during the period of 2002–2012, the tropical Indian Ocean has shown a continued increase in SST as compared to a cooling trend in the tropical Pacific Ocean ad this warming in the Indian Ocean was triggered by the El Niño events [4]. As a dipole pattern, the Indian Ocean is characterized by two distinct eastern and western zones of SST known as the Indian Ocean Dipole (IOD) [5]. Wang et al., [6] observed that this polarity is influenced by the El Niño/La Niña Southern Oscillation ENSO condition. Relating the ENSO phenomenon to global climate change with particular fluctuations in SST, Varotsos [7] observed that the influence of ENSO signal on the SST field extends in the tropics and subtropics with a tendency to become maximum at around 30° N and 30° S. The increase in SST during 1900–2012 did not occur slowly and gradually, but abruptly in 1925/1926 and 1987/1988 [8]. The ENSO phenomenon is responsible for many global climate-related issue, such as coral bleaching and drought [9]. Recently, the strongest El Niño occurred in 1997/1998 and another moderate event occurred in 2015/2016 [9]. On the other hand, the Intergovernmental Panel on Climate Change [10] in its fifth assessment report provided more clarity on the role of human activities on climate change, where the global temperatures increased by 0.85 °C between 1800 and 2012. By the end of this century, the sea level will rise by 82 cm and about 70–90% of world corals would decline with a warming of 1.5 °C.
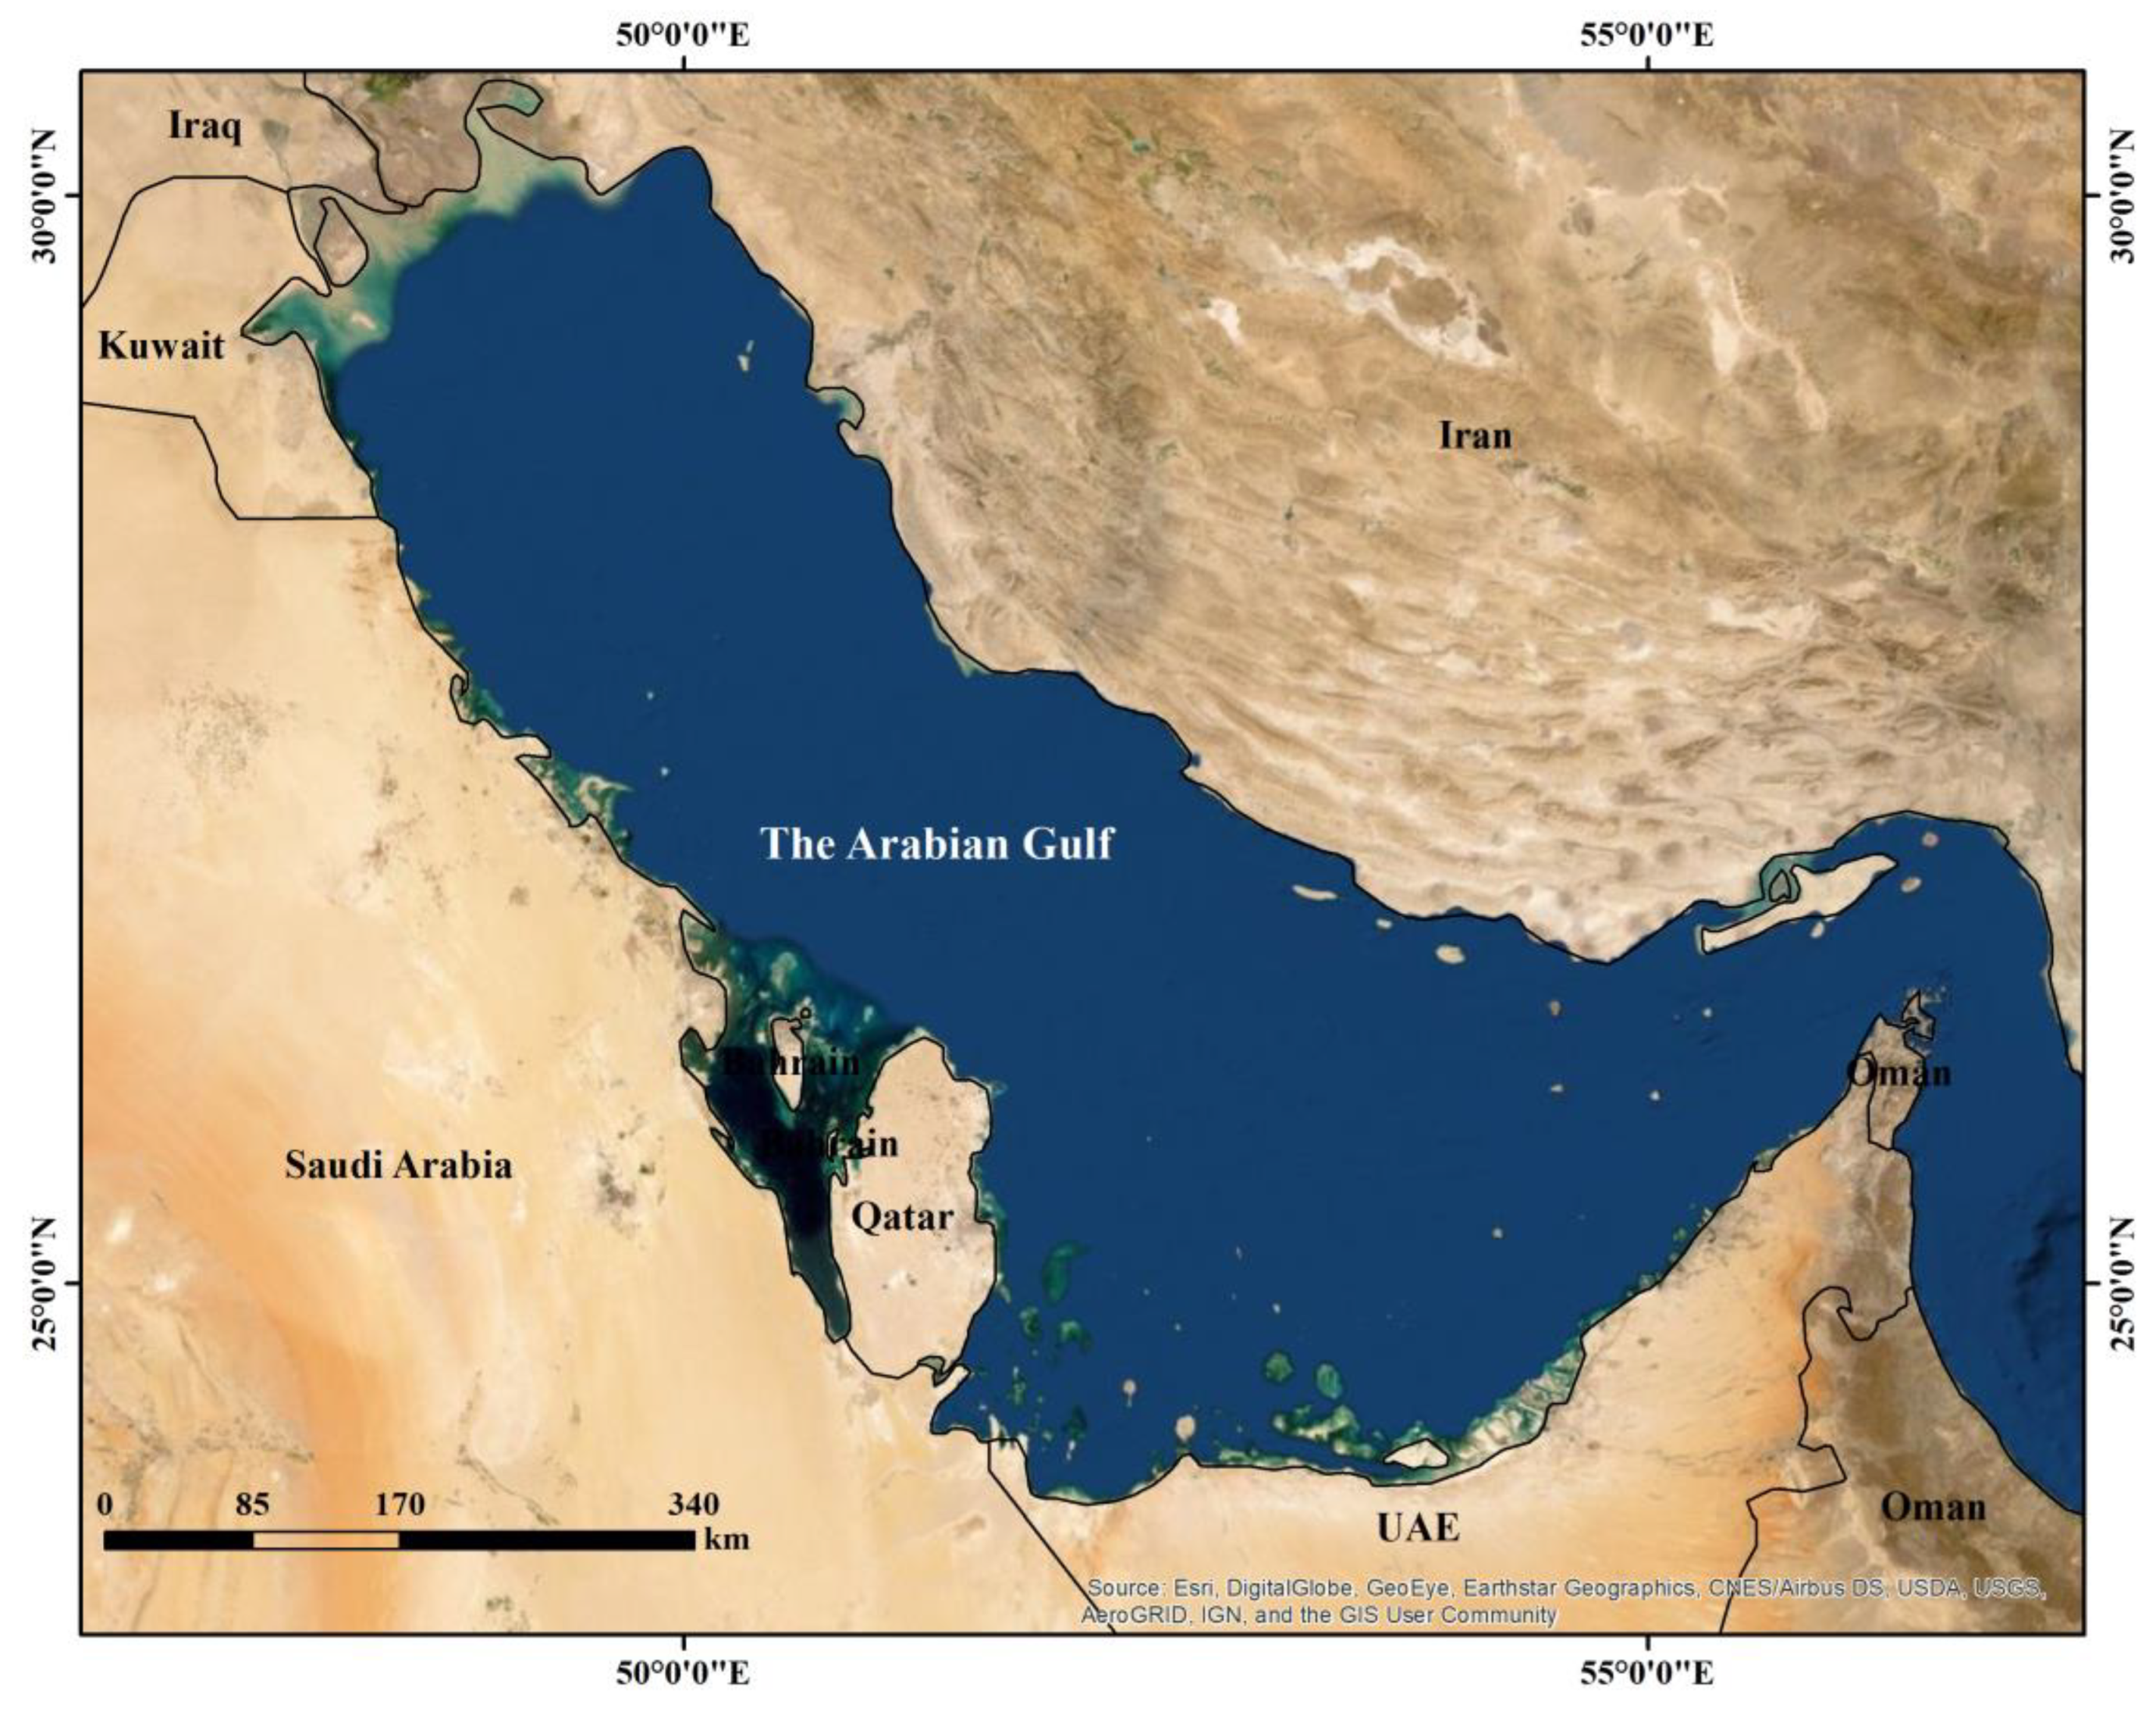
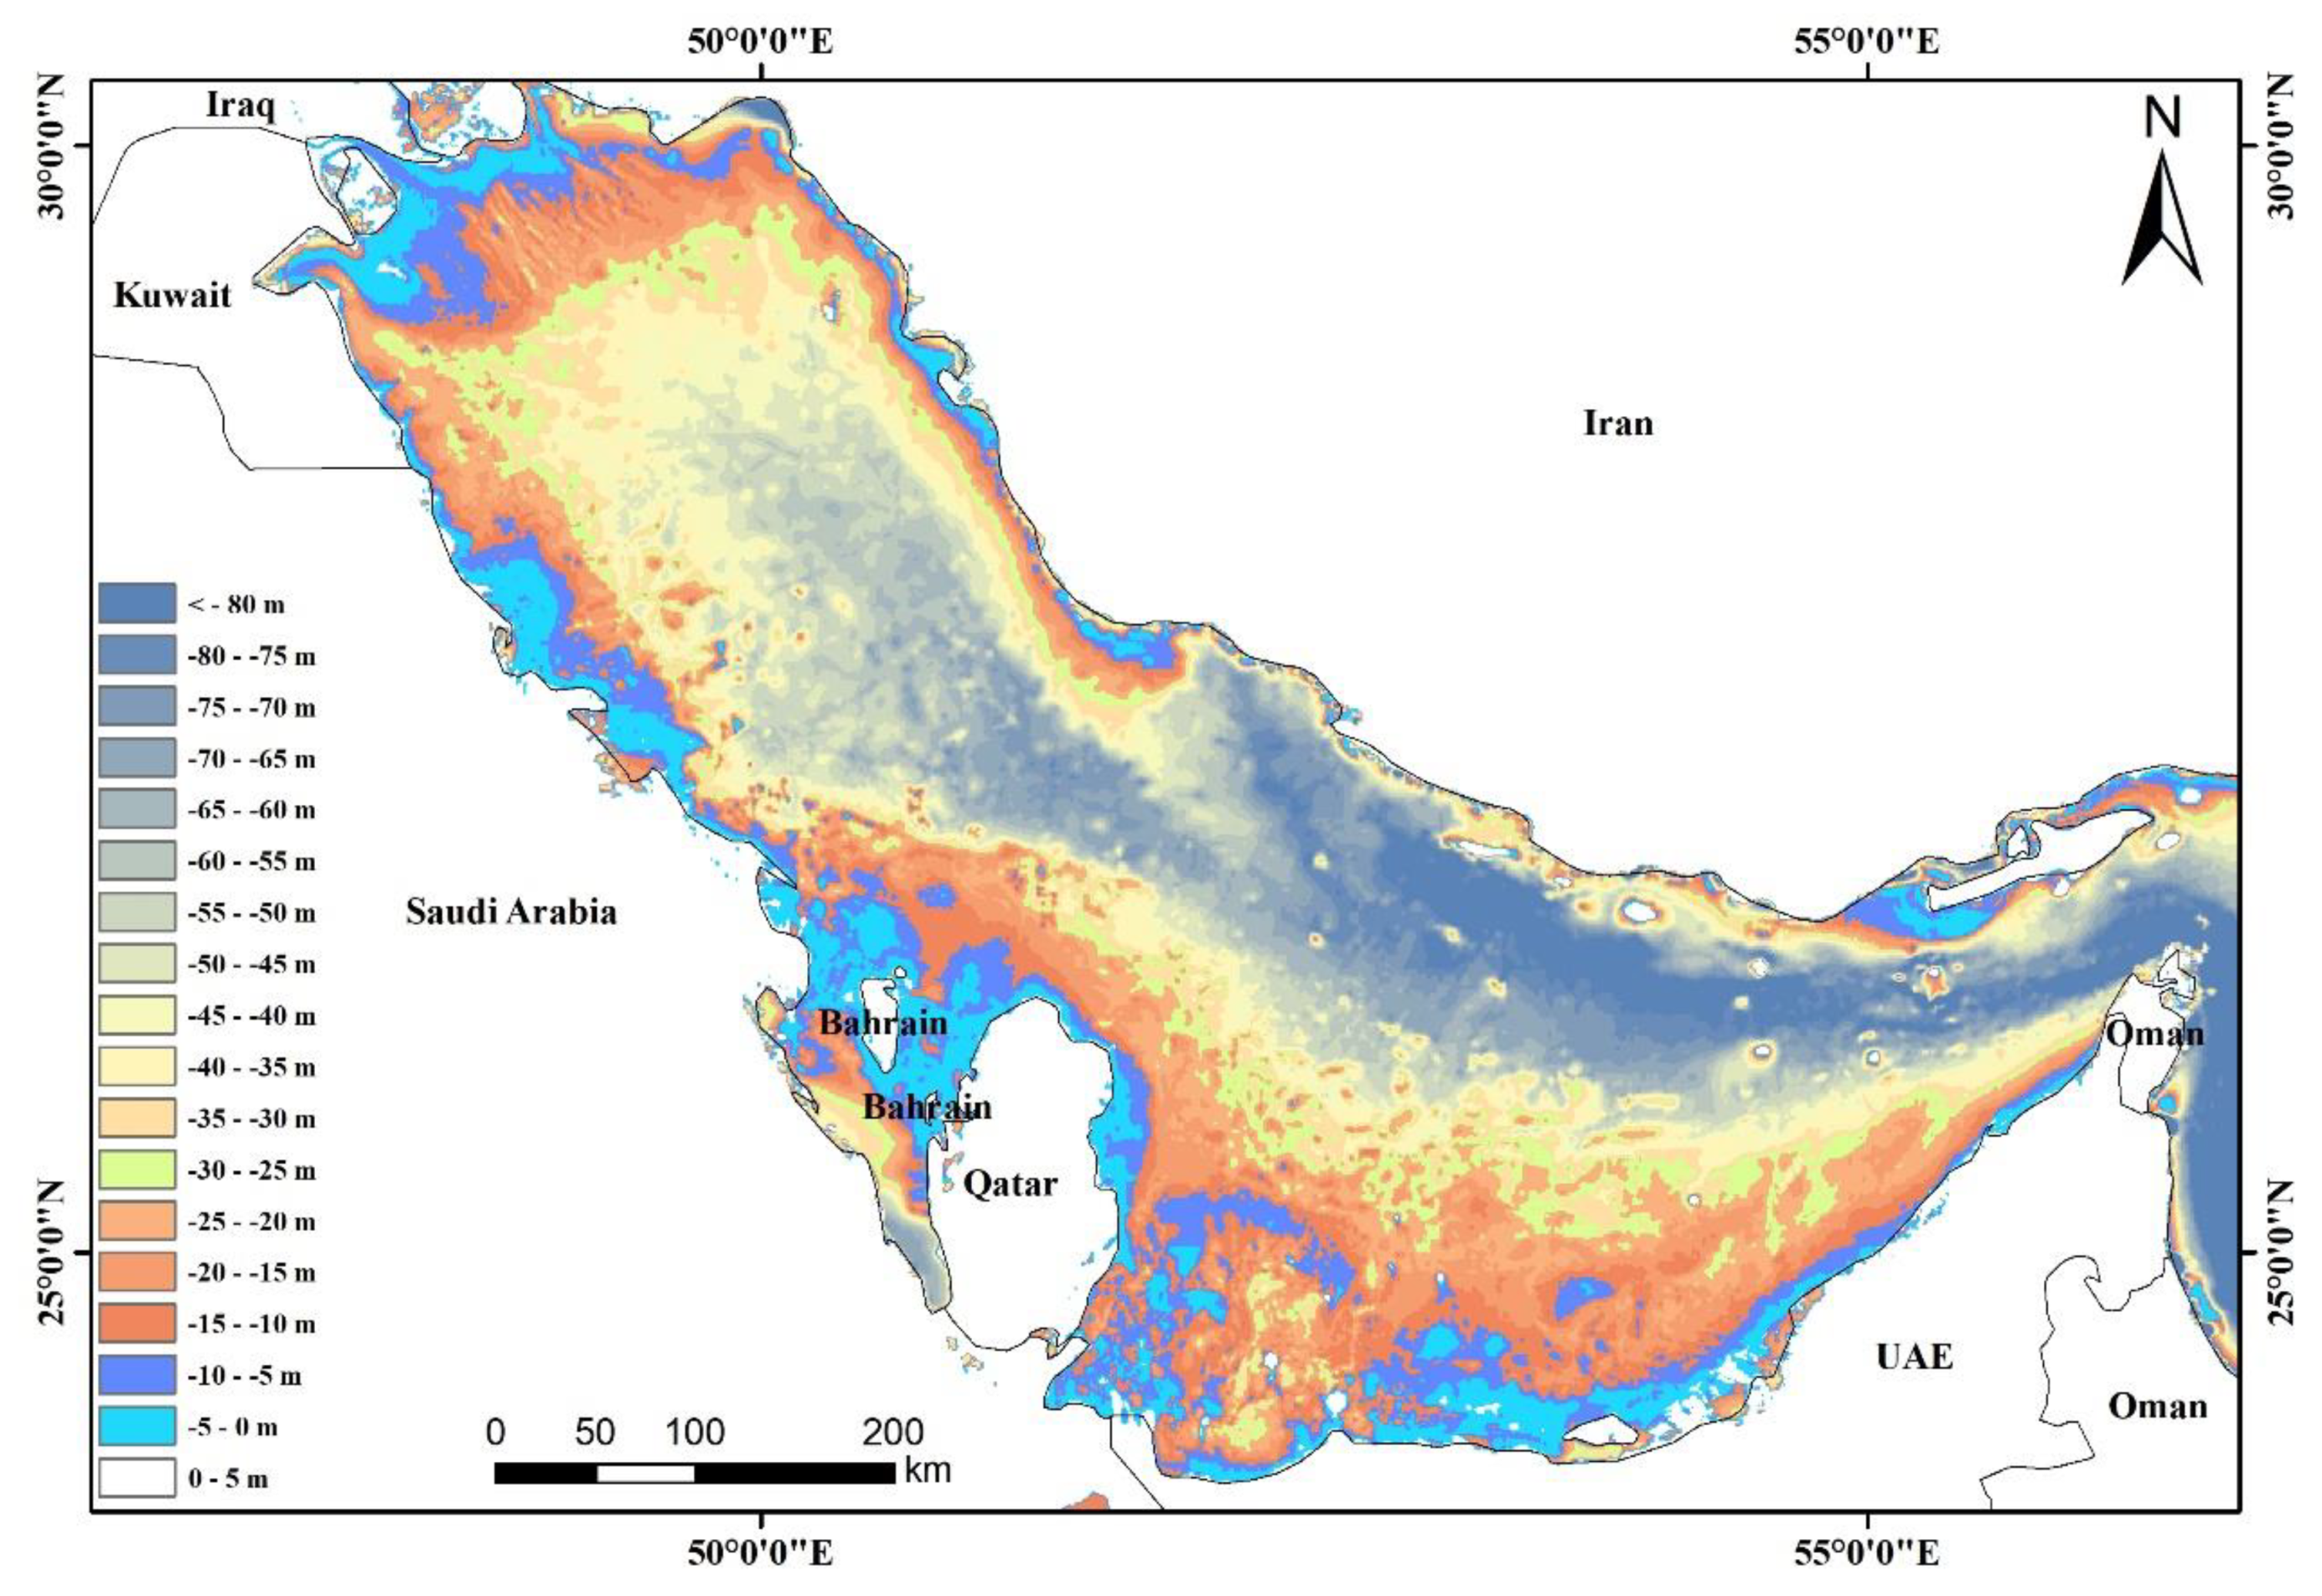
Like many places in the world, the Arabian Gulf (hereafter known as the Gulf) is experiencing environmental degradation due to the severe natural and anthropogenic stressors [11]. The Gulf is an inland sea of an area about 251,000 km2 with its longest axis of 816 km and its width of 250–300 km (Figure 1). The narrowest width of the Gulf is 56 km at the Strait of Hormuz. The Gulf is generally a shallow water body, where its maximum depth is 94 m and its average depth is less than 50 m. The depth in the off-shore zone of the Arabian side does not exceed 40 m. The deepest region is very close to the Iranian side, with a maximum depth of about 80 m. The coastal regions of the Arabian countries are also shallow and they range from 5 to 15 m. The shallowest coastal zone is observed in Bahrain, where the island is surrounded by water of less than 5 m depth. The UAE and Qatar also have extended shallow coastal faces of less than 5 m. The entrance of the Gulf is deeper than 80 m near the Musandam Peninsula of Oman (Figure 2). There are eight countries that share the coasts of the Gulf, namely (in anti-clockwise direction): Iraq, Kuwait, Kingdom of Saudi Arabia (KSA), Bahrain, Qatar, United Arab Emirates (UAE), Oman, and Iran. The Gulf is connected to the Indian Ocean and the Sea of Oman through the Strait of Hormuz. The inputs from river systems, the evaporation, and the water exchange with the Sea of Oman through the Strait of Hormuz influence the water budget in the Gulf. There is an annual water deficit of 416 km3 that is being compensated by the inflow from the Sea of Oman due to the high evaporation rates [12]. The replacement of water occurs through the Strait of Hormuz in surface levels and then passes inwards along the Iranian coast before reaching the Arabian coasts in a broadly anti-clockwise flow [13]. The Gulf is adjacent to the hot desert region of Arabia, where the hot climate is reflected on the high surface water temperatures (up to 34 °C). The Gulf is also characterized by its higher water salinity with an average value that approaches 45 part per thousand (ppt) as compared to the normal seawater salinity of 35 ppt [14].
The Gulf is a habitat for a myriad number of species that adapted to live in harsh environmental stresses in terms of warm and high saline condition. Coral reefs and their associated fish and algal species, mangroves, and seabed grasses are the main ecosystems in this environment [15]. The Gulf’s marine environment is rapidly changing by anthropogenic and natural processes. This includes the coastal developments, coastline alterations, habitat loss, creation of beds of shifting or suspended sediments, and temperature and salinity changes, as well as by climate warming [13]. Additionally, the discharge of the ballast water within the Gulf before filling these tankers with oil could be a significant source of the biological deterioration of the marine life in the Gulf given that the Gulf is as a terminal for the giant ships to transport oil [16]. Hence, many marine creatures are unintentionally brought from different environments with ballasted waters. These creatures may be exotic to the Gulf marine life, as most of them are transported without their associated predators, parasites, or competitors. Consequently, they may negatively affect the creatures in the Gulf and lead to the extinction of many of them.
Coral reefs are one of the important species in the Arabian Gulf. Corals living in symbiosis with unicellular algae are primarily responsible for the formation of tropical shallow water reefs [17]. Corals in the Gulf are the most thermally tolerant in the world, but they live very close to the thresholds of their thermal tolerance [18]. Yet, mass coral bleaching and mortality in 1996 and 1998 were reported in many areas in the Arabian Gulf due to El-Niño related climate change [19]. The effect of the Shamal (northern) winds in modulating SST is reported by [18], where during weak Shamal wind the SST was observed to rise and during strong winds, the SST decreases due to the cooling effect of these winds. Paparella et al., [18] noticed that this weakness occurred in 2012 and 2017. In addition, coral assemblages have been heavily degraded as a result of coastal and marine development activities [20]. The Gulf contains two-thirds of the world’s estimated proven oil reserves and one-third of the world’s estimated proven natural gas reserves. The countries, along its coasts, are experiencing some of the highest rates of economic and population growth, which impose potential levels of environmental stress [13]. The increased urbanization, conversion of seawater to reclaimed land, and the heavy industrial and oil refining processes should impact the energy exchange between the land and the atmosphere, notably promoting a significant warming at the regional scale [21].
Since 1900, the global air temperature of the Earth has risen by about 0.8 °C, and since the 1970s by about 0.5 °C [22]. During that period, i.e., 1900, the global sea surface temperatures increased by 0.6 °C [23]. One of main causes of this global warming is the excess emission of greenhouse gasses, especially CO2 and CH4 by anthropogenic activities. One of the main ramifications of this global temperature change is the sea level rise, either by the thermal expansion of seawater or by the ice melting in the major glaciers. The rate of the global-mean sea level rise was estimated at 3.2 ± 0.4 mm/y between 1993 and 2008. Out of this, 0.7 ± 0.3 mm/y, owing to the thermal expansion in the upper water column and the rest owing to ice melting and deep-ocean warming [24]. On the other hand, it is expected that the rate of thermal expansion is 1.3 ± 0.7 mm/yr during the period 2000 to 2020 [25]. Sea levels would continue to rise for many decades by the forcing of this thermal expansion, even if greenhouse gasses will be stabilized in the near future [26]. The sea level rise from ice melting is evident worldwide. From 1993 to 2007, measurements of sea level that have been made by high precision satellite altimeters reveal global average rising at a rate of 3.36 ± 0.4 mm/yr [27]. The Intergovernmental Panel on Climate Change [10] reported that by the year 2100, the mean sea level rise is likely to reach 0.82 m. Combining the rates of sea level rise by the thermal expansion and by melting of ice, the total amount of sea level rise could approach as much as 0.95 m by the end of this century. However, in some other estimates, the sea level rise could approach 2 m by the end of this century [11,28]. Gloomy assessments predict a sea level rise of up to 5 m in the case of the collapse of the West Atlantic Ice Sheet [29].
The problems that are associated with the climate change are likely much evident for delicate ecosystems, such as coral reefs and along the flat and low-lying coastal areas. Hence, the vulnerability to the sea level rise in the Gulf is likely to be from the global eustatic and isostatic sea level change, which could approach 5 m by the most pessimistic scenarios [29]. Therefore, the present study investigates the change in the sea surface temperatures (SST) in the Gulf as a proxy to the global warming during the last 16 years. Because there is a growing interest in using reef assemblages as a surrogate to climate change [20], the study also addresses the time series trends of SST for the locations of the coral reef assemblages in order to identify those that witnessed most warming in SST. The study finally estimates the coastal zones of the Arabian countries, which are vulnerable to the sea level rise by 1, 2, and 3 m.
2. Materials and Methods
2.1. Sea Surface Temperature
The NASA Ocean color satellite missions allowed for consistent and synoptic observations of global oceans. The Moderate Resolution Imaging Spectroradiometer (MODIS) onboard the Terra and Aqua satellites launched in 2000 and 2002, respectively have provided high quality global sea surface temperatures (SST) for over a decade [30]. Therefore, the MODIS instruments have been a primary source of a continuous stream of products for several Earth science disciplines in physical oceanography [31]. MODIS data incorporate technological features that are highly beneficial for the analysis of SST gradients and they have been processed and calibrated by the NASA technical laboratories using the most recent updates and algorithms [32]. Level 3 (9 km) global monthly SST images, acquired at a wavelength of 11 μm, were utilized. This wavelength was found to be more accurate in acquiring SST than the other shorter wavelength, i.e., 4 μm [31]. Land and cloud masks, as well as L2 flag algorithm, apply to mark SST pixels with low quality. MODIS SST data have high confidence, as they significantly correlate to the in-situ SST measurements [33,34,35]. SST images were downloaded for the period: Jan. 2003 to Dec. 2018 from the NASA Ocean Color web portal (http://oceancolor.gsfc.nasa.gov). The images were processed by the SeaDAS Software, where the study area was clipped in a rectangular area in all images, which total 12 x 16 = 192 images. The subset dataset was then stacked together in ERDAS Imagine Software in order to generate one image containing the individual 192 layers in a chronological order from the oldest to recent in order to create a monthly time series dataset. The monthly and the mean annual SST maps were prepared for the entire Gulf using ArcMap Software.
2.2. Coral Reefs
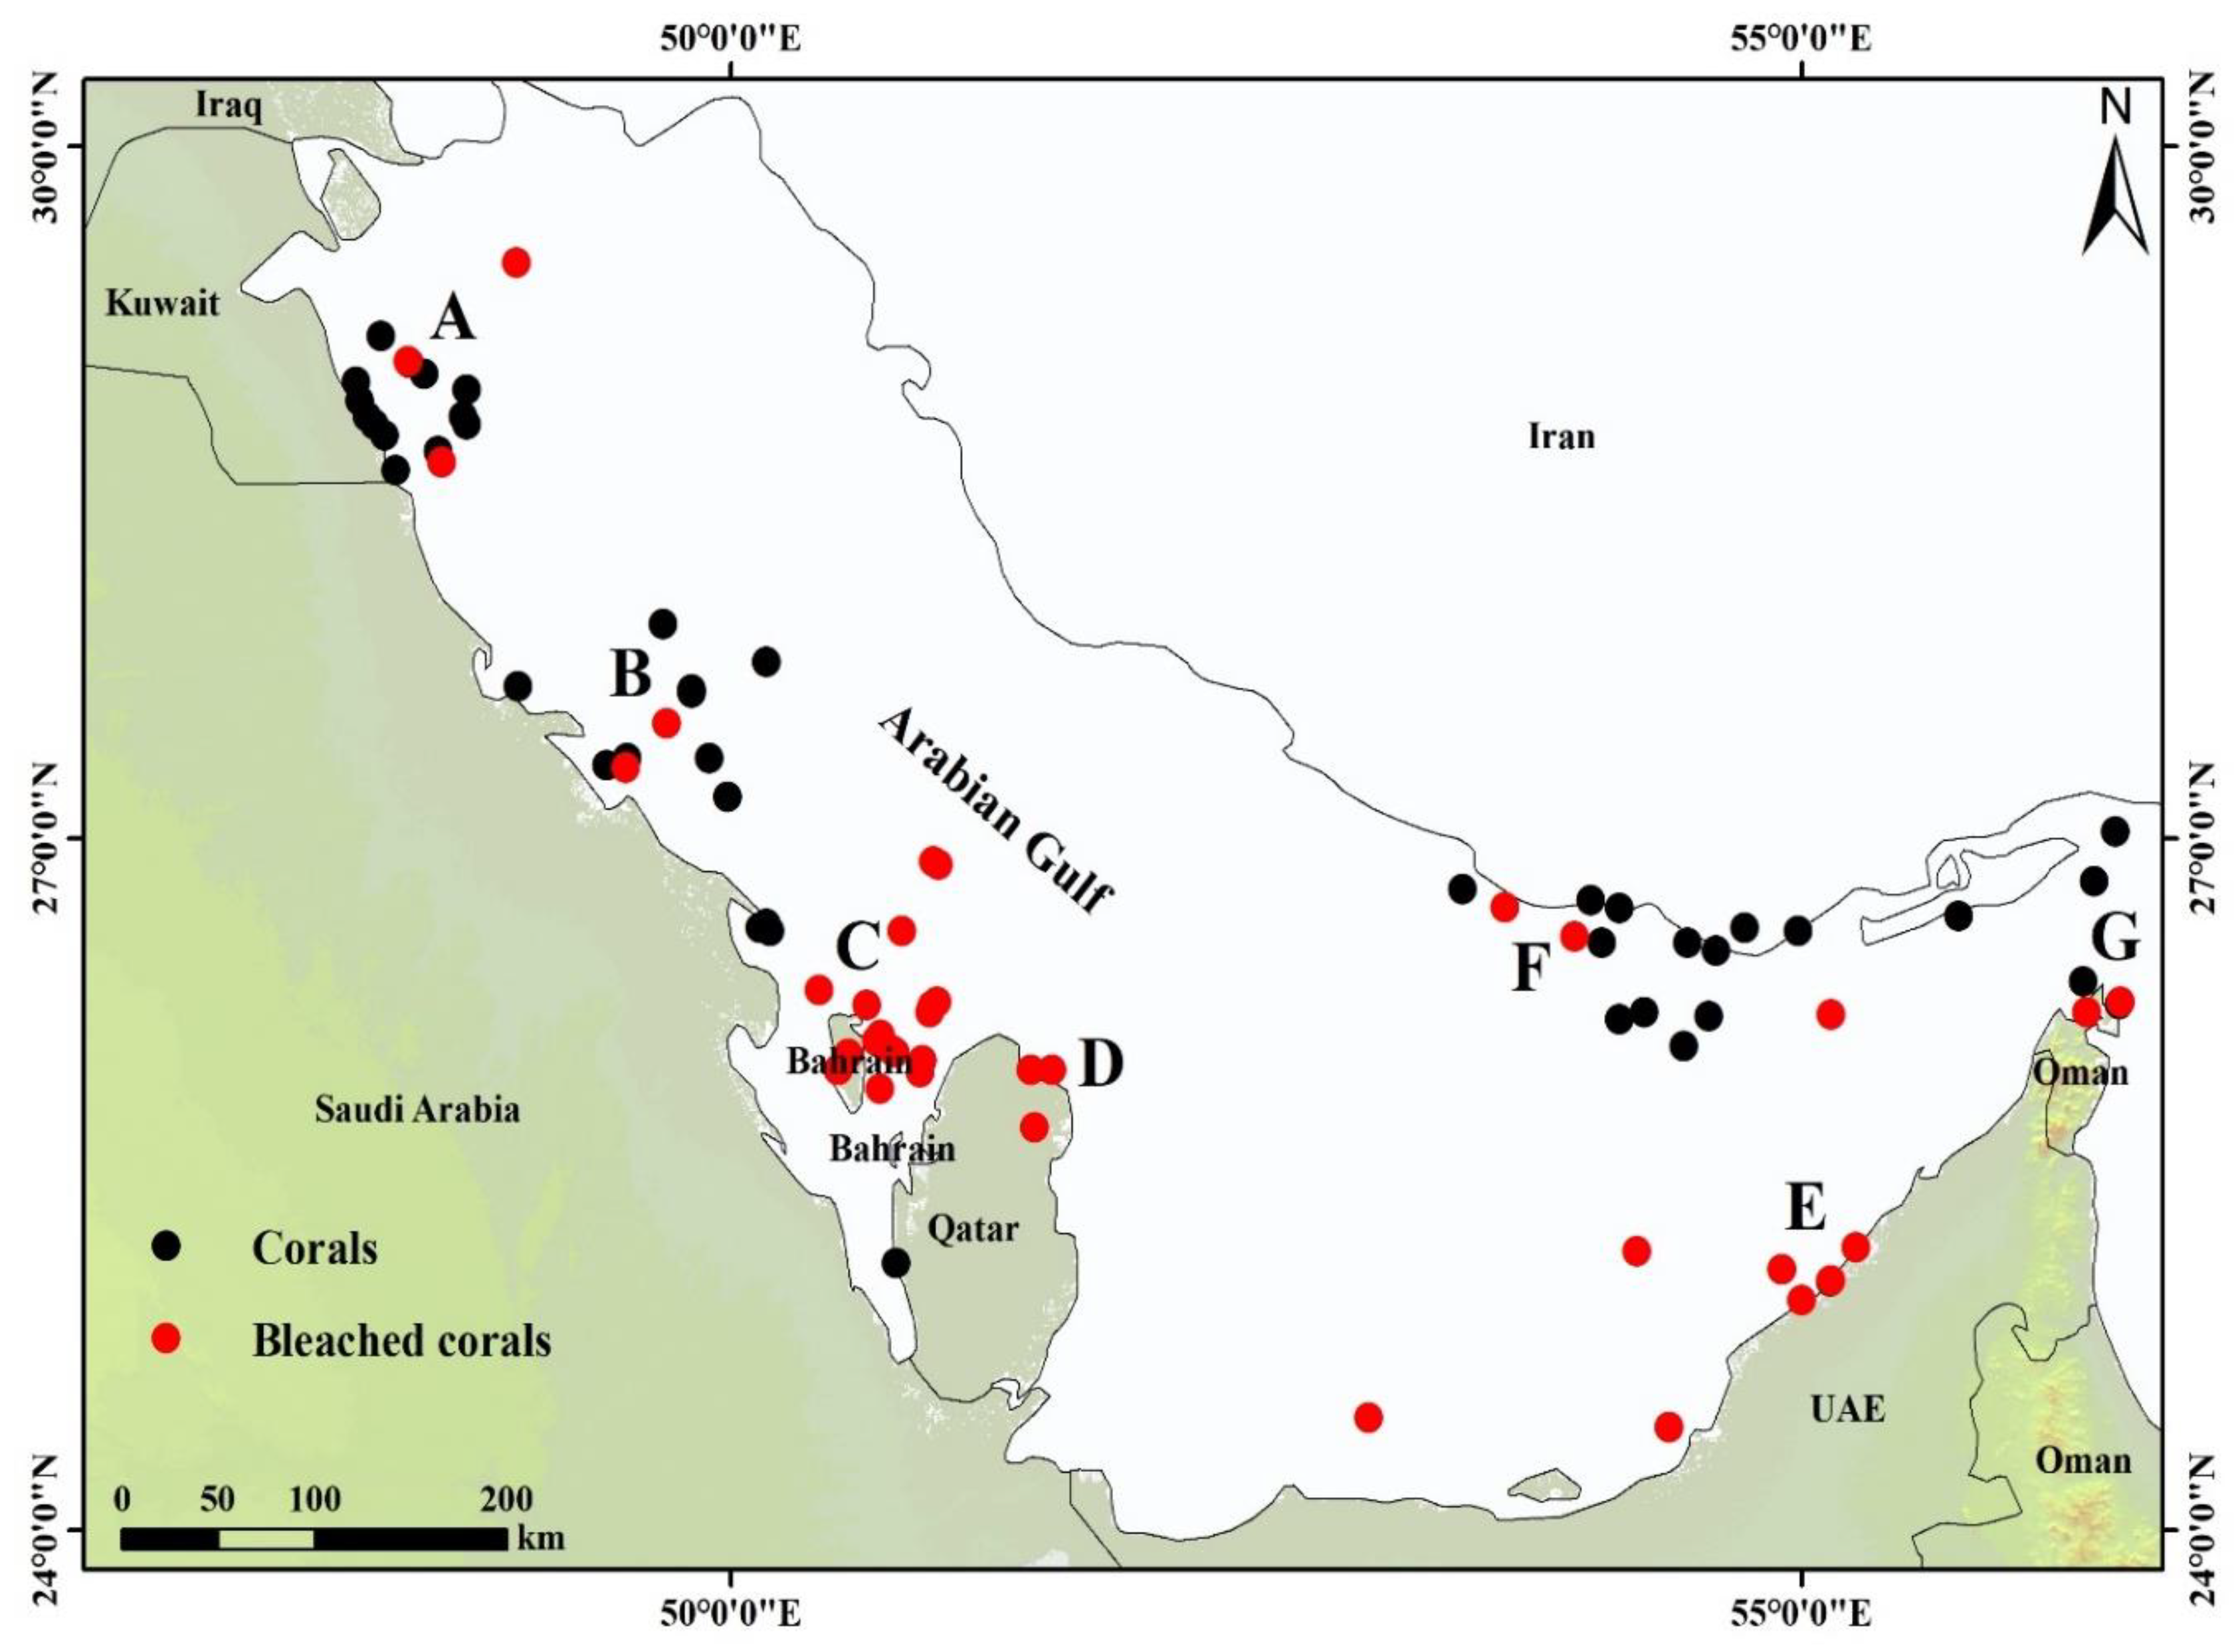
The bathymetry of the Gulf was extracted from the General Bathymetry Charts of the Ocean web portal (www.gebco.net) at 30 arc/sec (900 m) gridded data in Geotiff format. It is reported that the coral reefs in the Gulf has lower diversity than in the Indian Ocean due to the environmental stresses [36]. Coral reefs are not evenly distributed within the Gulf. Locations of the coral reefs and the reefs experiencing bleaching were downloaded from the Global Information System for Coral Reefs (http://www.reefbase.org). In this database, the coordinates, type and conditions of the reefs are tabled as point shapefiles in the form of Excel sheets. In ArcMap Software, the distribution of both corals and bleached corals were presented while using the coordinates of each category. The time series of the monthly SST trend for each location of the coral assemblage was plotted in order to extract the decadal change in SST for these coral locations. The SST decadal trend was determined and the decadal SST change at the seasonal and annual levels was calculated for each location. Person correlation also examined the statistical significance level for the time series trend in SPSS Software.
2.3. Coastal Vulnerability to Anticipated Sea Level Rise
The coastal topography of the Arabian countries facing the Gulf was extracted from the digital elevation models (DEM). The data were acquired from the Shuttle Radar Topography Mission (SRTM) as seamless raster images. Although the vertical accuracy of the DEM becomes low in rugged topographic terrains (about 5 m), it is much more accurate for flat surfaces and gentle sloping lands (1 m) [37]. As long as this investigation is applied to the coastal front of the Gulf, it is efficiently possible to determine the elevation of the flat on-shore zone. The DEM data were utilized in many similar studies to estimate the coastal elevation and slope [38,39]. In the present study, six tiles were downloaded from the Consortium for Spatial Information (CSI) web portal (http://srtm.csi.cgiar.org/) in 90 m spatial resolution. These tiles cover the Arabian side of the Gulf. The images were mosaicked together in ERDAS Imagine. A classification approach was performed for determining the regions having 1 m, 2 m and 3 m elevations along the Gulf coast. The corresponding area in each country was then determined at each elevation level by counting the number of pixels at this level. Theoretically, if the sea level increases above its current zero level by, for example, 1 m, then all of the coastal lands less than 1 m should be vulnerable to inundation by the sea level rise. The number of pixels of 1 m level were, then, counted to estimate the lands, which could be overwhelmed by that sea level rise. In a same manner, areas that are prone to inundation, if the sea level rises by 2 and 3 m, were calculated from the pixels in the DEM that reflect these levels. All of the coastal lands of the Arabian countries along the Gulf were topographically investigated to count the locations of each of these elevation levels and those locations vulnerable to inundation were mapped.
3. Results and Discussion
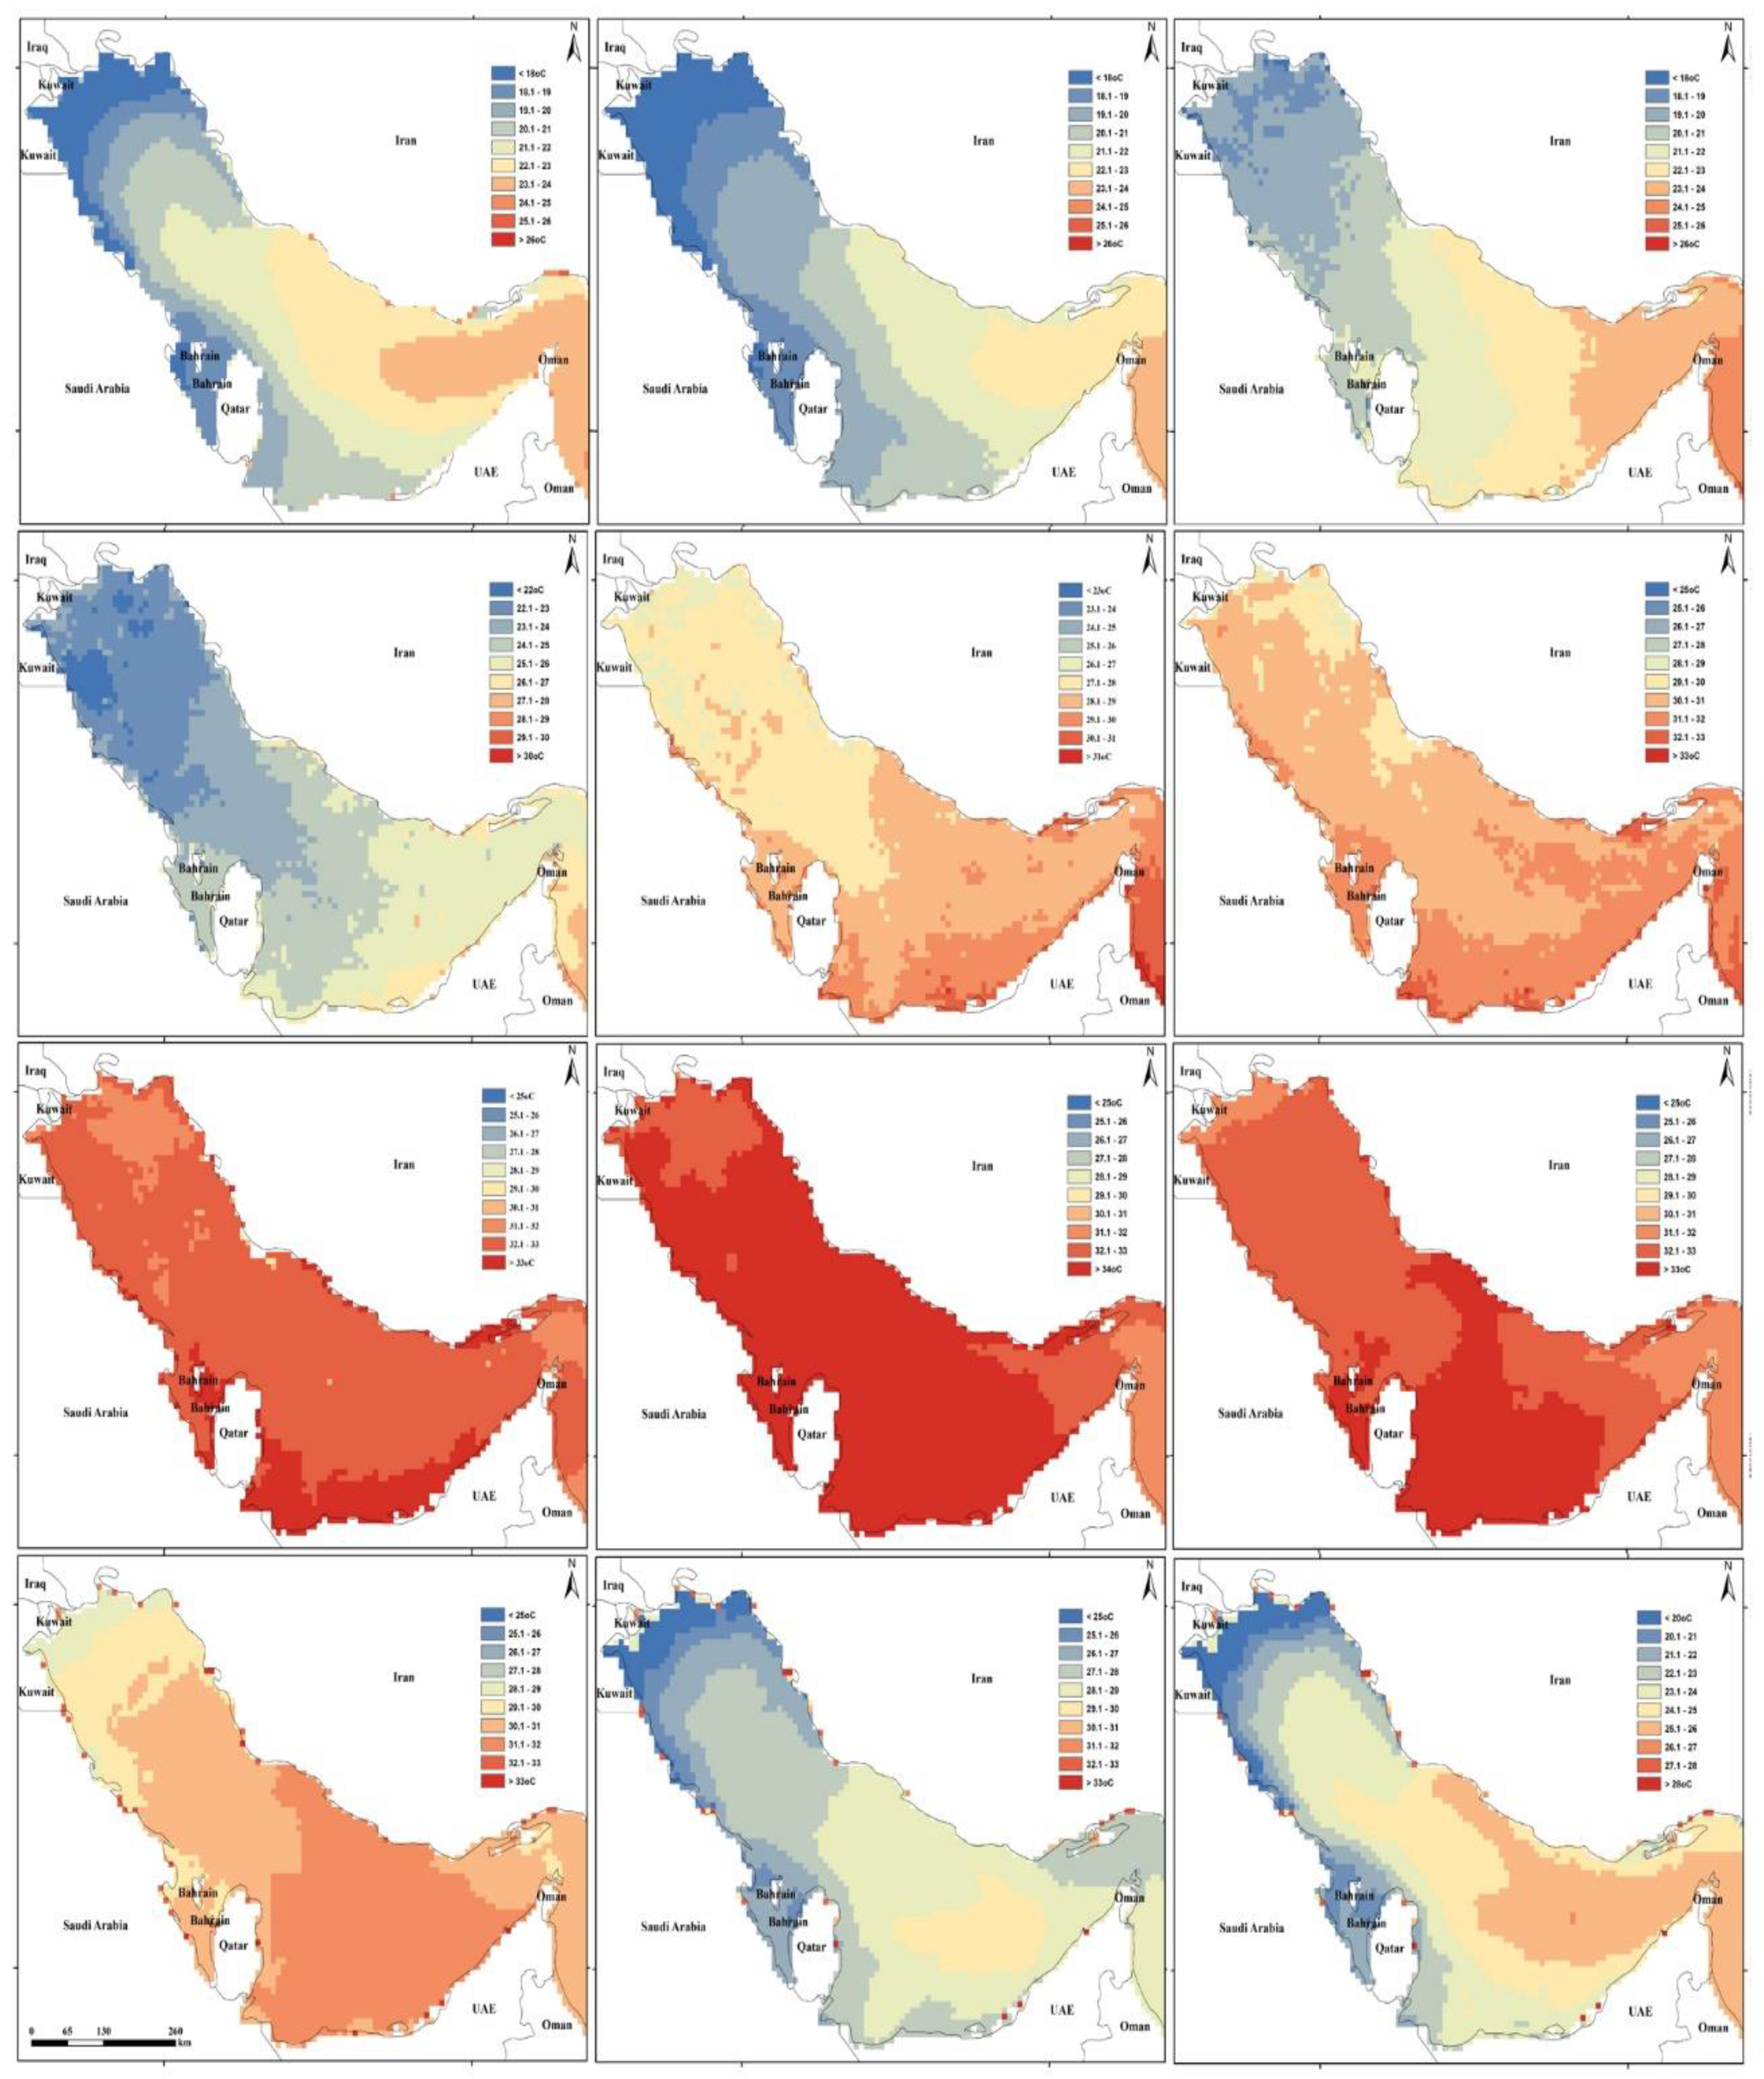
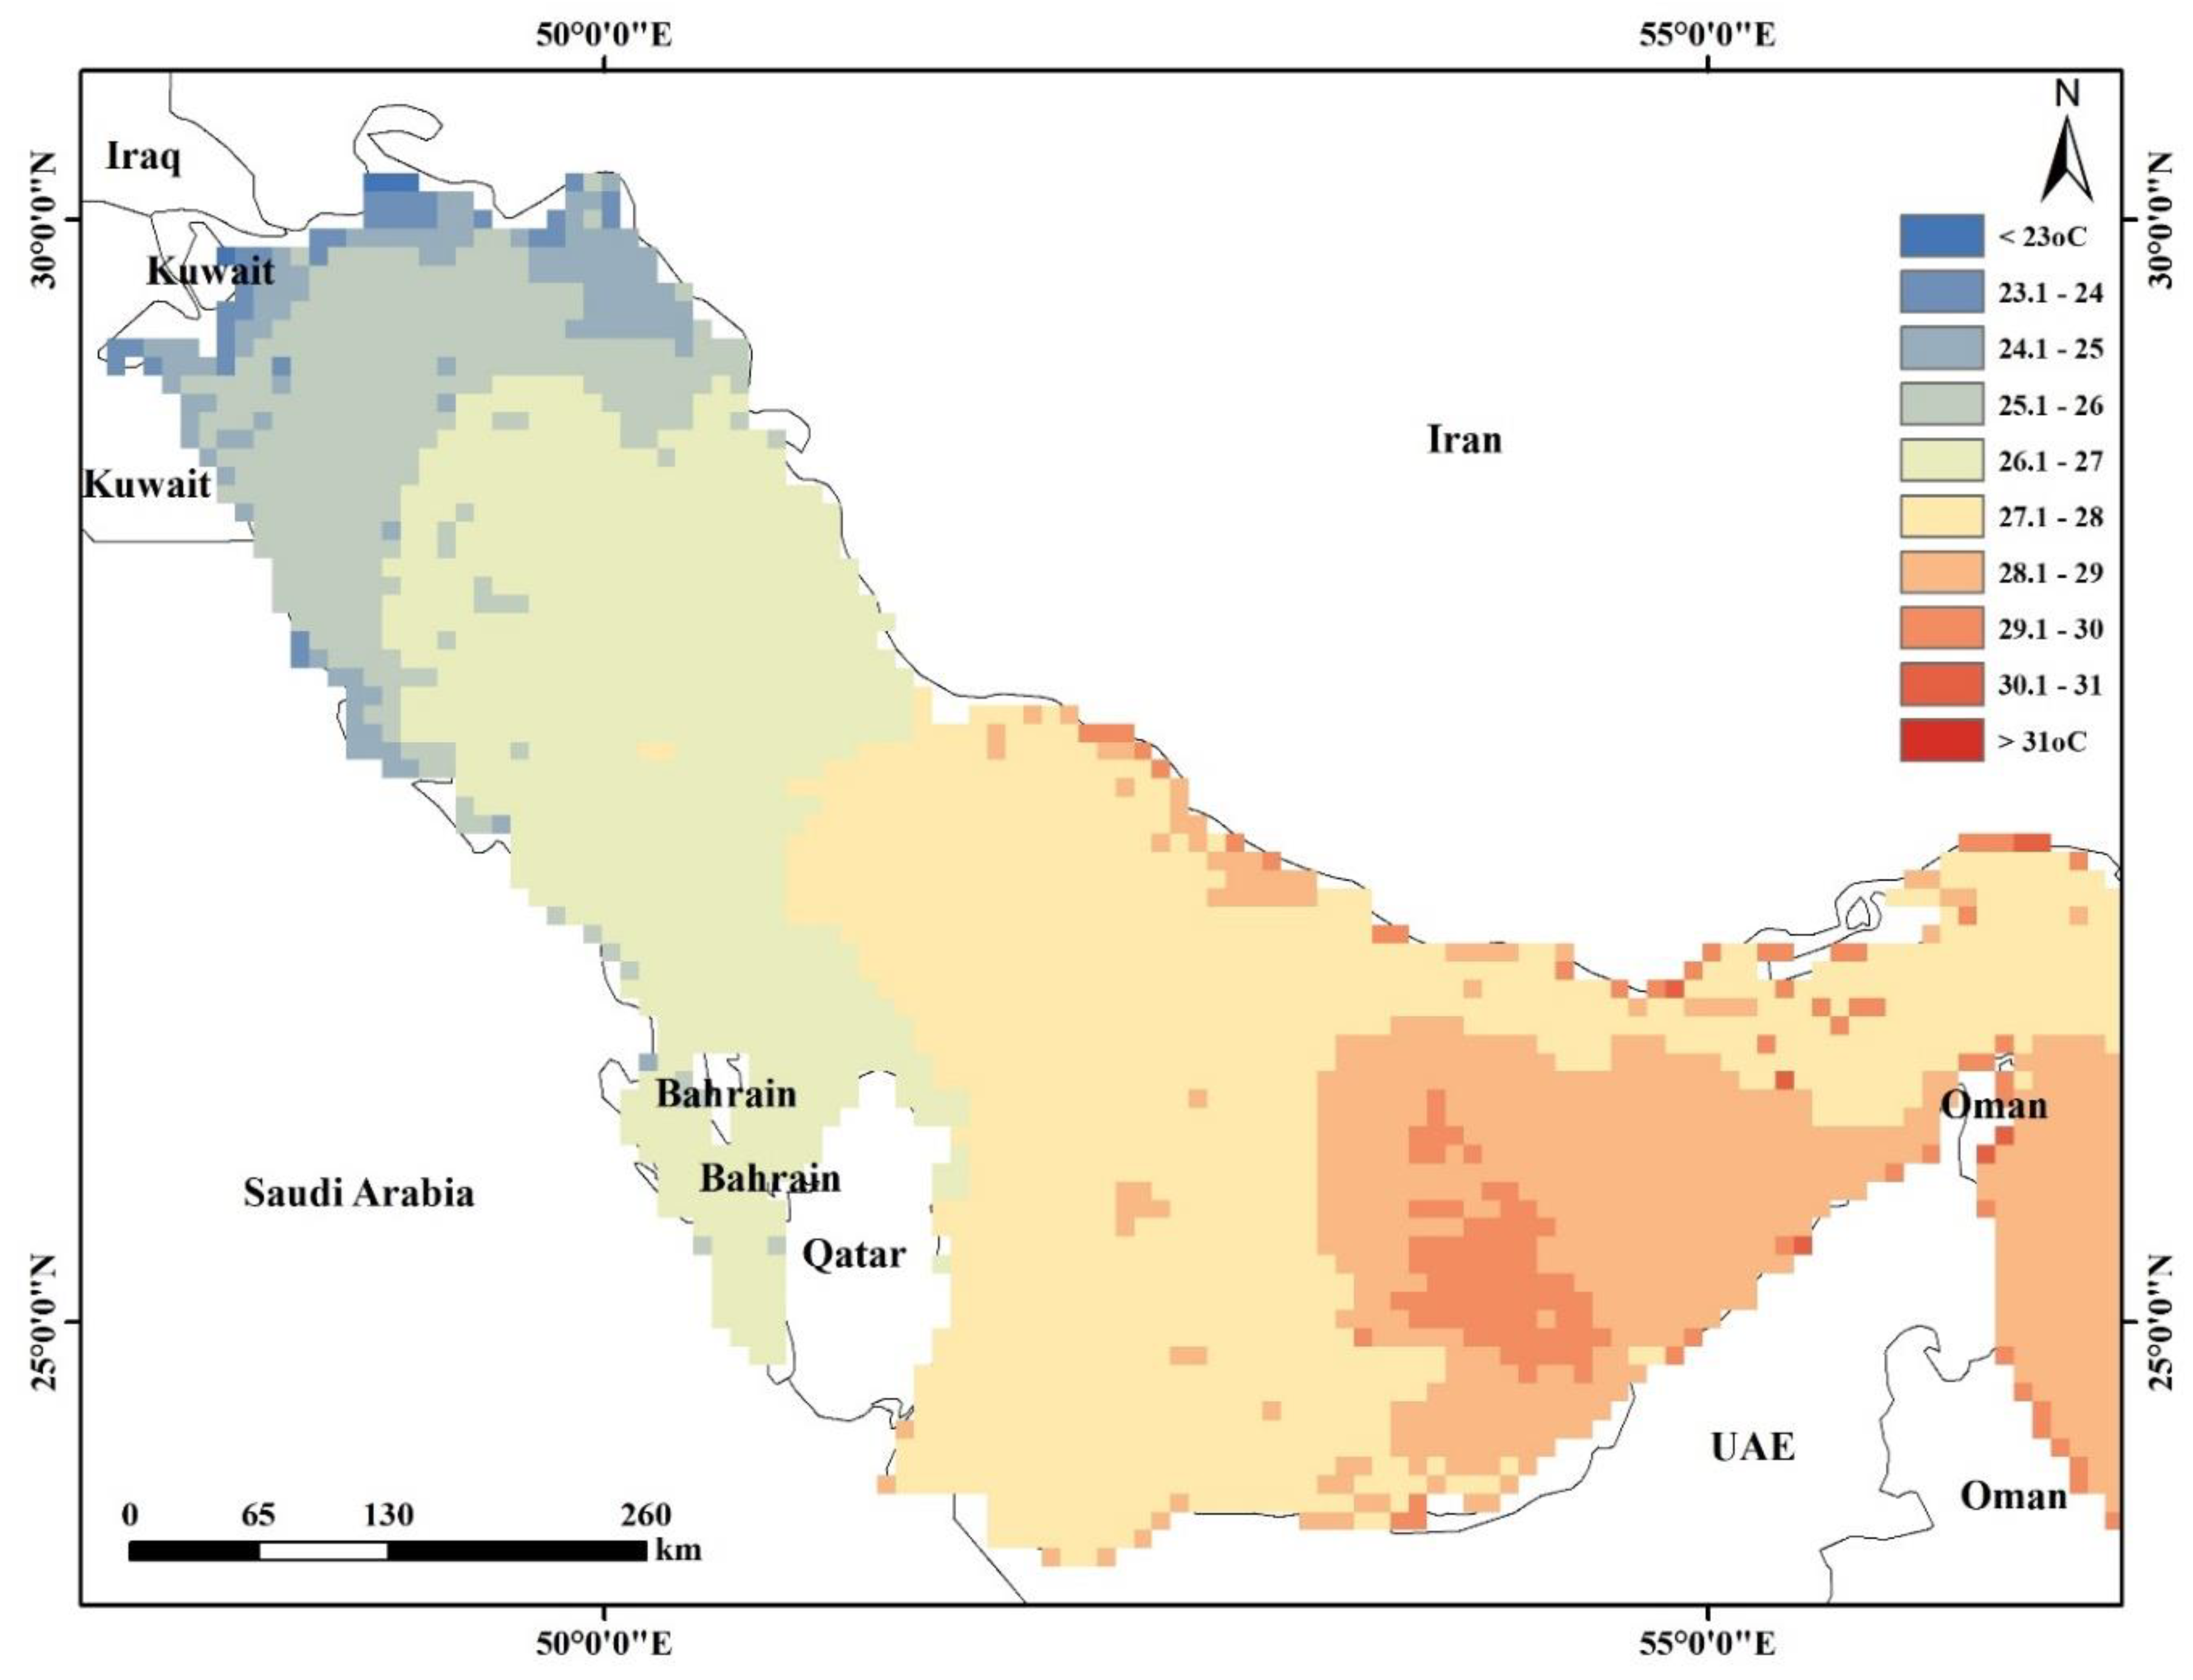
The monthly spatial distribution of the SSTs throughout the Gulf from January 2003 to December 2018 (Figure 3) reveals that three different thermal zones predominate at the western, the middle, and the eastern sides of the Gulf. The western side is always colder than the other sides. In the winter months, the SSTs descend to less than 18 °C in the west, whereas the middle and eastern sides approach 20 and 22 °C, respectively. In spring, there is a warming by 2 °C for all regions, but, in the summer, the entire Gulf warms up to reach its maximum temperatures in August (33–35 °C), which means that the Gulf is considered to be the warmest sea in the world [40]. SSTs descend again in Autumn to reach its maximum value in the middle part (32 °C) as compared to 31 °C in other sides. The temporal variation between the minimum and maximum SSTs within the Gulf is 18 °C. Figure 4 provides the spatial zonation of the average annual SST of the Gulf, which clearly indicates the westward decrease in SST. The annual spatial variation in SST between the eastern and western sides of the Gulf approach 6 °C. Figure 5 shows the distribution of the coral reefs within the Gulf. According to the Global Information System for Coral Reefs (http://www.reefbase.org), coral reefs could be observed in seven assemblages, mostly along the shallow waters of the Arabian side of the Gulf. The majority of these corals are either fringing reefs or reef patches. [41] reported the occurrence of 40 species of hard corals and other 35 species of soft corals.
In the Gulf, the shallowness of water, the high salinity, and the extreme seasonal variations in water temperatures are considered to be the major stressors for coral reefs [42]. Coral reefs of the Gulf tolerate long annual periods of high SST (~35 °C) at the time where, in other regions, such as the Great Barrier Reef and the Caribbean Basin, corals are bleached if they are exposed to SST of 32 °C for just a few days [20]. Yet, corals in the Gulf are considered as the most tolerant in the world [43]. However, temperature trends in the Gulf are increasing, particularly at the areas of coral reefs, which could exceed the upper tolerability level of these organisms. Coral bleaching is noticeable in some parts of the Gulf [18], and the SSTs are warming in some areas at rates three times the global average [44].
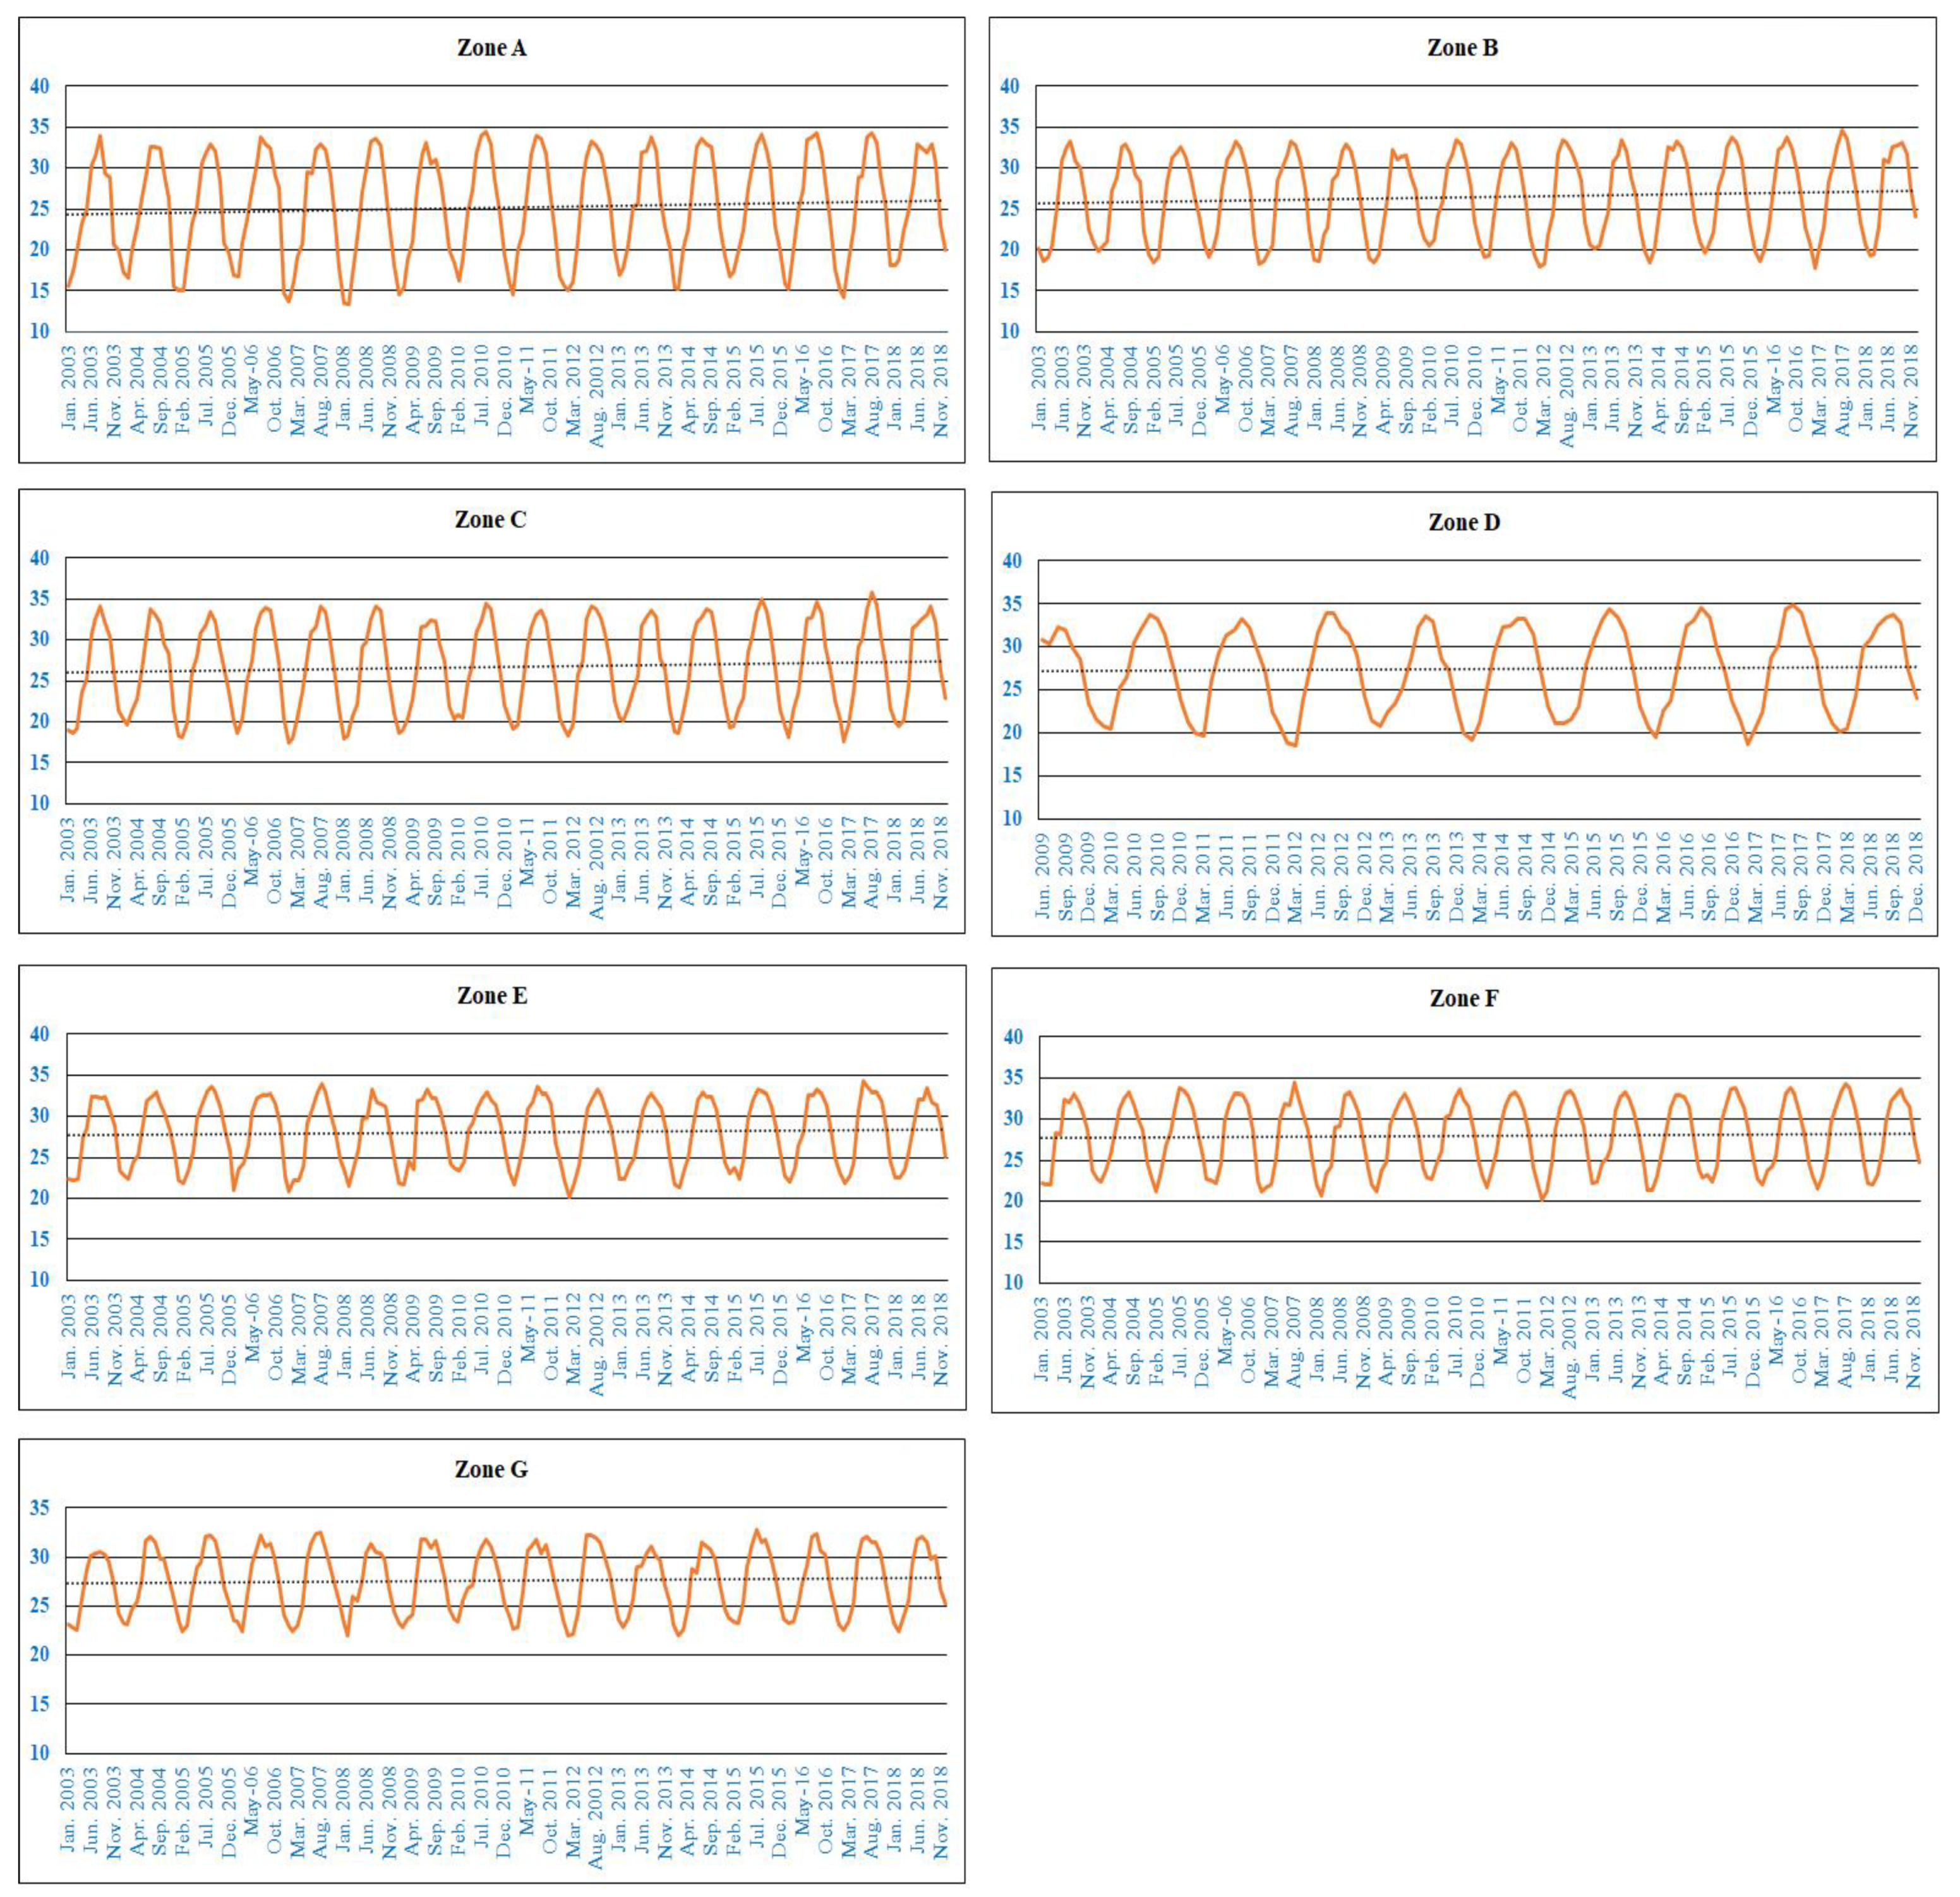
Coral bleaching is recorded in all the countries of Gulf according to the Global Information System for Coral Reefs (http://www.reefbase.org). The time series trend plots for the seven locations of coral reefs (Figure 6) reveal positive trends for all locations, meaning that the SST has increased between 2003 and 2018. It is also obvious that the locations at the western side of the Gulf (locations A, B, C, and D) have the highest SST trends. The locations of the bleached corals along the Arabian countries are mostly recorded in the shallow waters (below 20 m from the sea surface). Table 1 shows the seasonal and annual change in SST. The maximum annual rate of increase in average SST is observed in Zone A at the off-shore zone of Kuwait (0.7 °C/decade), followed by Zones B, C, and D at the off-shore regions of Al-Gubail, KSA (0.56 °C/decade), in the front of Bahrain (0.56 °C/decade) and at Qatar (0.61 °C/decade), respectively. At the seasonal level, the maximum change was observed in the summer for all locations. The annual increase in temperature between 2003 and 2018 in the western side of the Gulf exceeds the global ocean warming (0.6 °C) that occurred since 1900 [23]. A comparable observation for the high SST trend in the western side of the Gulf (Kuwait Bay) between 1985 and 2002, with a decadal increase by 0.6 °C, was also reported [44]. It is also observed that the rate of increase in SST is getting lower toward the eastern direction in the Gulf. In the eastern side, the rate of SST change ranges from 0.11 °C/decade along UAE (zone E) to 0.08 °C/decade at the entrance of the Gulf in front of Oman (zone G). Table 2 shows the statistical significance levels for the seasonal and annual SST trends. It is obvious that the SST trends at zones A, B, C, and D are significant at the 99% level (p<0.01). In addition, in the seven studied locations, the maximum SST is observed during Aug. 2017, except in zone G, where the maximum SST is in July 2015. Interestingly, this high SST observed in Aug. 2017 coincides with the low speed of the Shamal (northern) winds during the summer of 2017, as reported by [18,45]. On the other hand, the peak SST during July 2015 at the entrance of the Gulf coincides the El Niño event occurred in 2015/2016 [9].
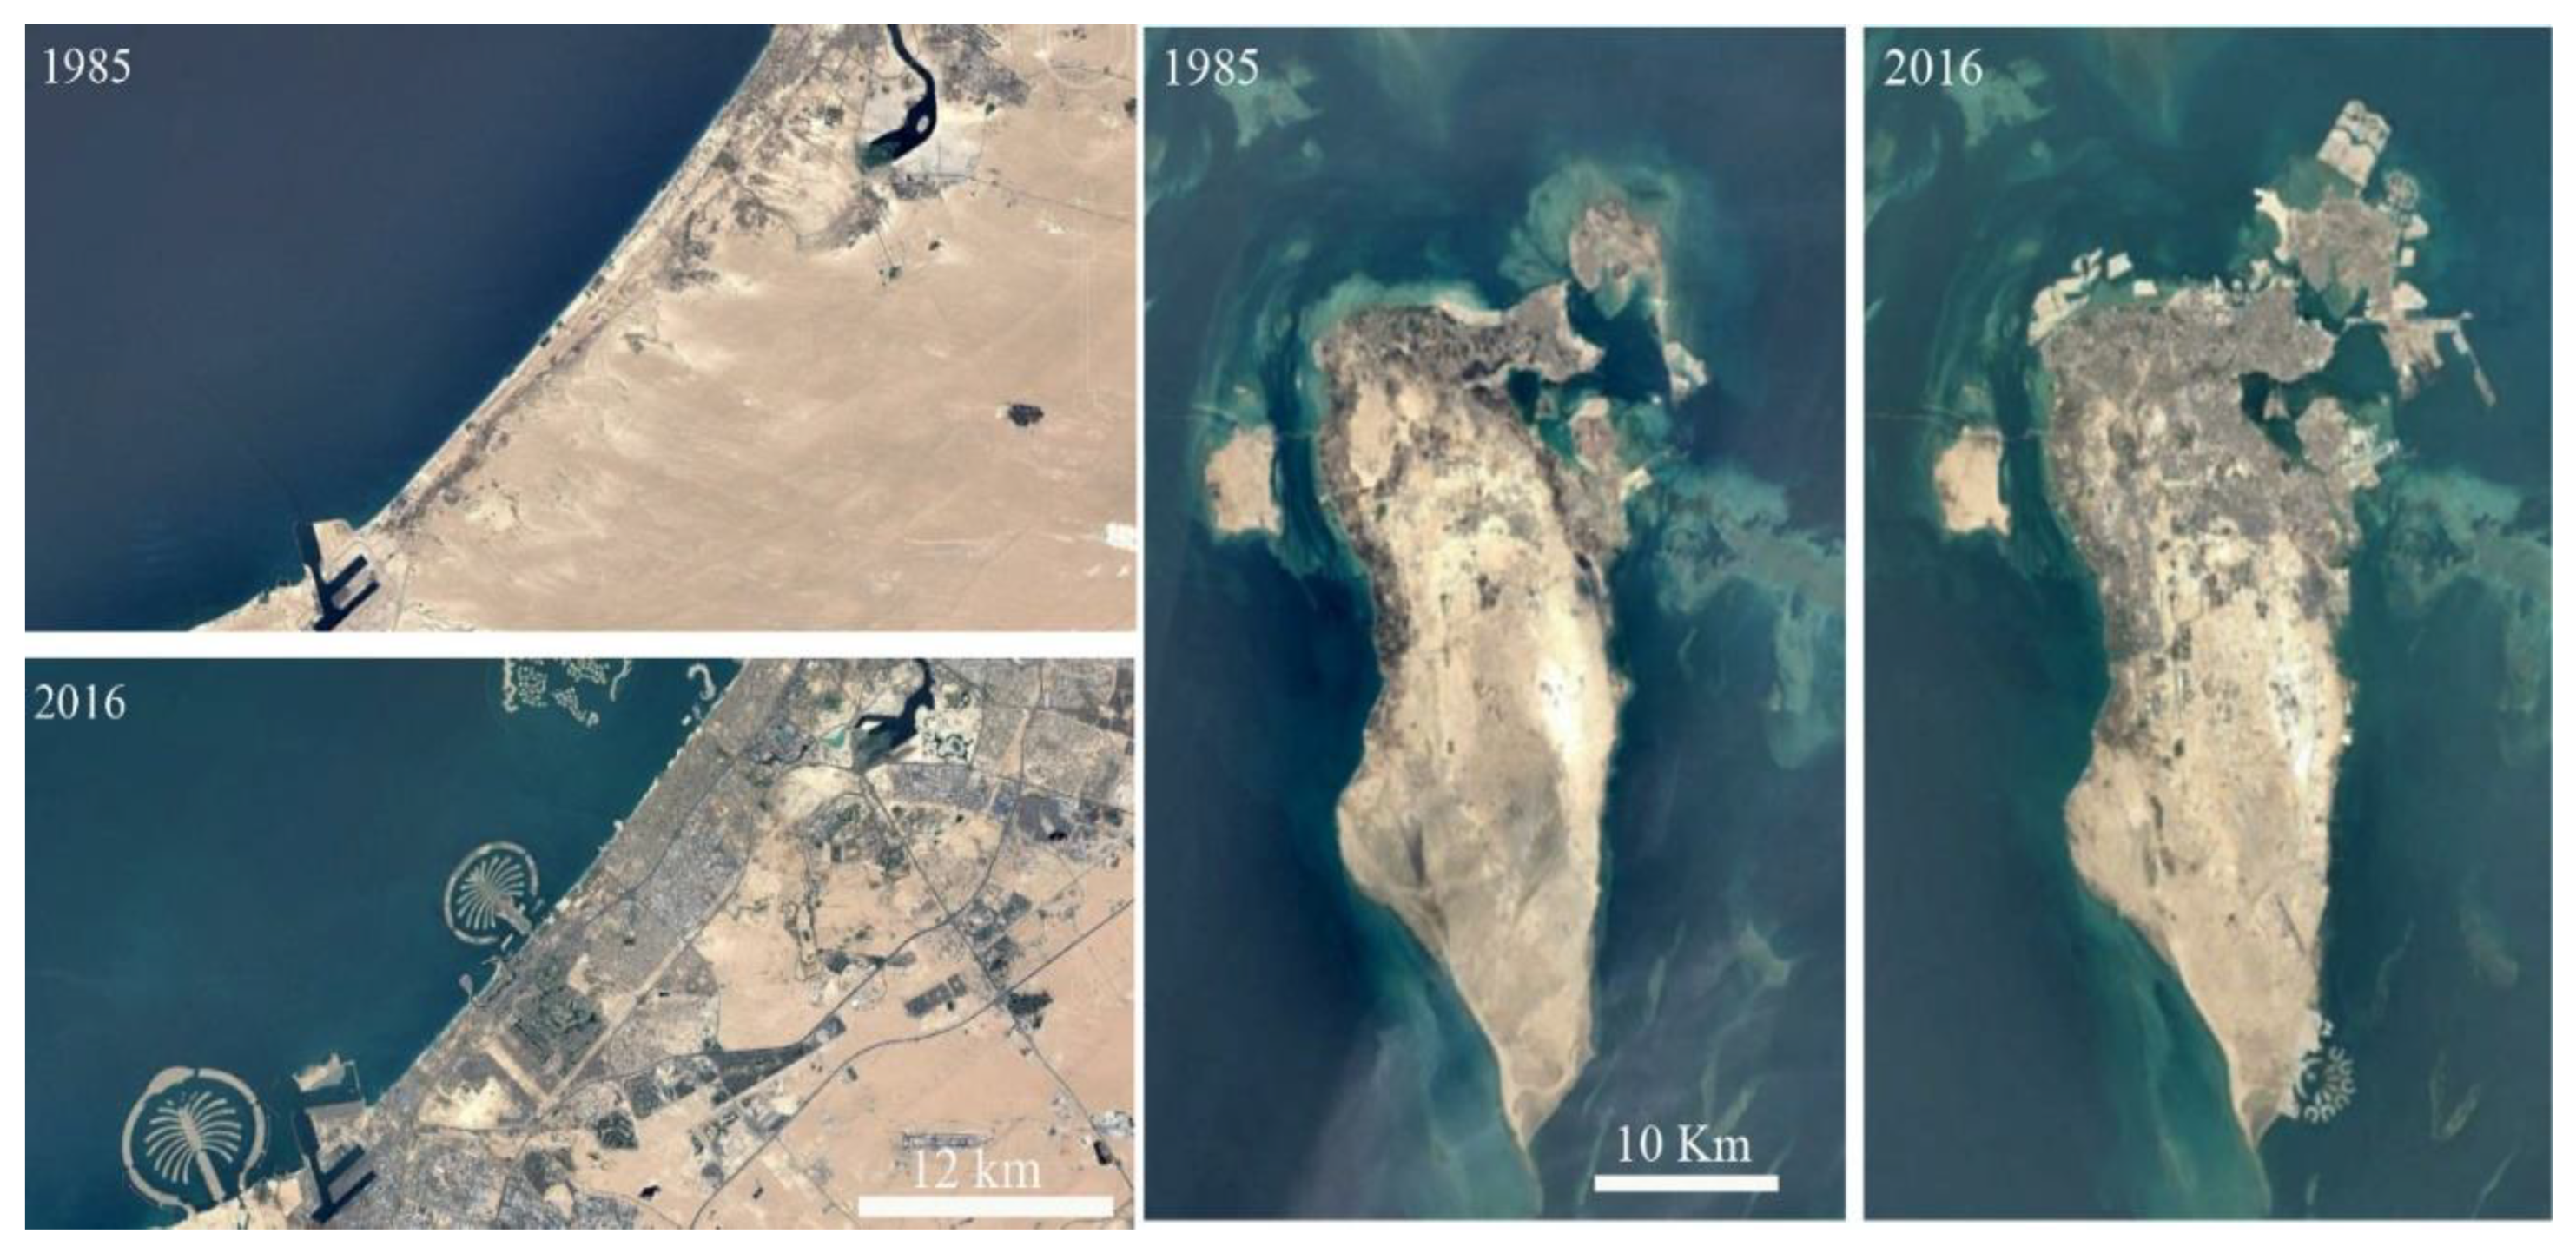
Among the seven locations of the bleached corals in the Gulf, four locations coincide with those experiencing high rates of average SST, notably, those of the western side (Zones A, B, C, and D). The increase in SST is likely to be a potential reason for their bleaching, as this increase might reach the tolerance limit of corals. Other factors for coral bleaching in the Gulf, particularly for those with low SST, could include ocean acidification, desalination plants, oil production, and anthropogenic coastal developments. As the Gulf countries are experiencing tremendous industrial developments, including oil production and refining, the large emission of CO2 gasses into the atmosphere is inevitable. [46] reported that the Gulf Cooperation Council (GCC) countries, which include Kuwait, Saudi Arabia, Bahrain, Qatar, United Arab Emirates, and Oman contributed to 8% of the total CO2 emissions in the world. Moreover, [47] mentioned that the concentration of CO2 has increased in the Gulf, which lead to more acidification of the seawater. [13] reported coral bleaching in the Gulf as a result of ocean acidification. The desalination of seawater has a profound impact on coral environment, where brine effluents could directly impair the symbiotic algae of the corals [48]. The dumping practices and reclamation of the sea could promote deterioration of the water quality of the reef environment [20]. This could be observed in Zones C and E (Figure 7). It is known that the Gulf countries constructed the largest man-made islands in the world and developed more than 40% of their coastline during the last 20 years [11]. This filling of significant coastal areas for land reclamation could severely impact the nearby coral reef assemblages by impairing water quality with suspended materials from construction activities. Nevertheless, [45] reported that the southern part of the Gulf (Zone E in this study) has witnessed noticeable mass bleaching due to an exceptional warming episode that was caused by the slowdown of the northern winds during 2017. Yet, [49] considered the coastal developments along the UAE coast (Zone E) is the major stressor for coral bleaching. Other sources of coral bleaching in the locations of low SST trend could include oil pollution as the Gulf is a major oil filed in the world. The Gulf has about 800 offshore oil and gas platforms and about 25,000 tanker travel annually through the Strait of Hormuz to transport 60% of all the oil that is carried by ships [13].
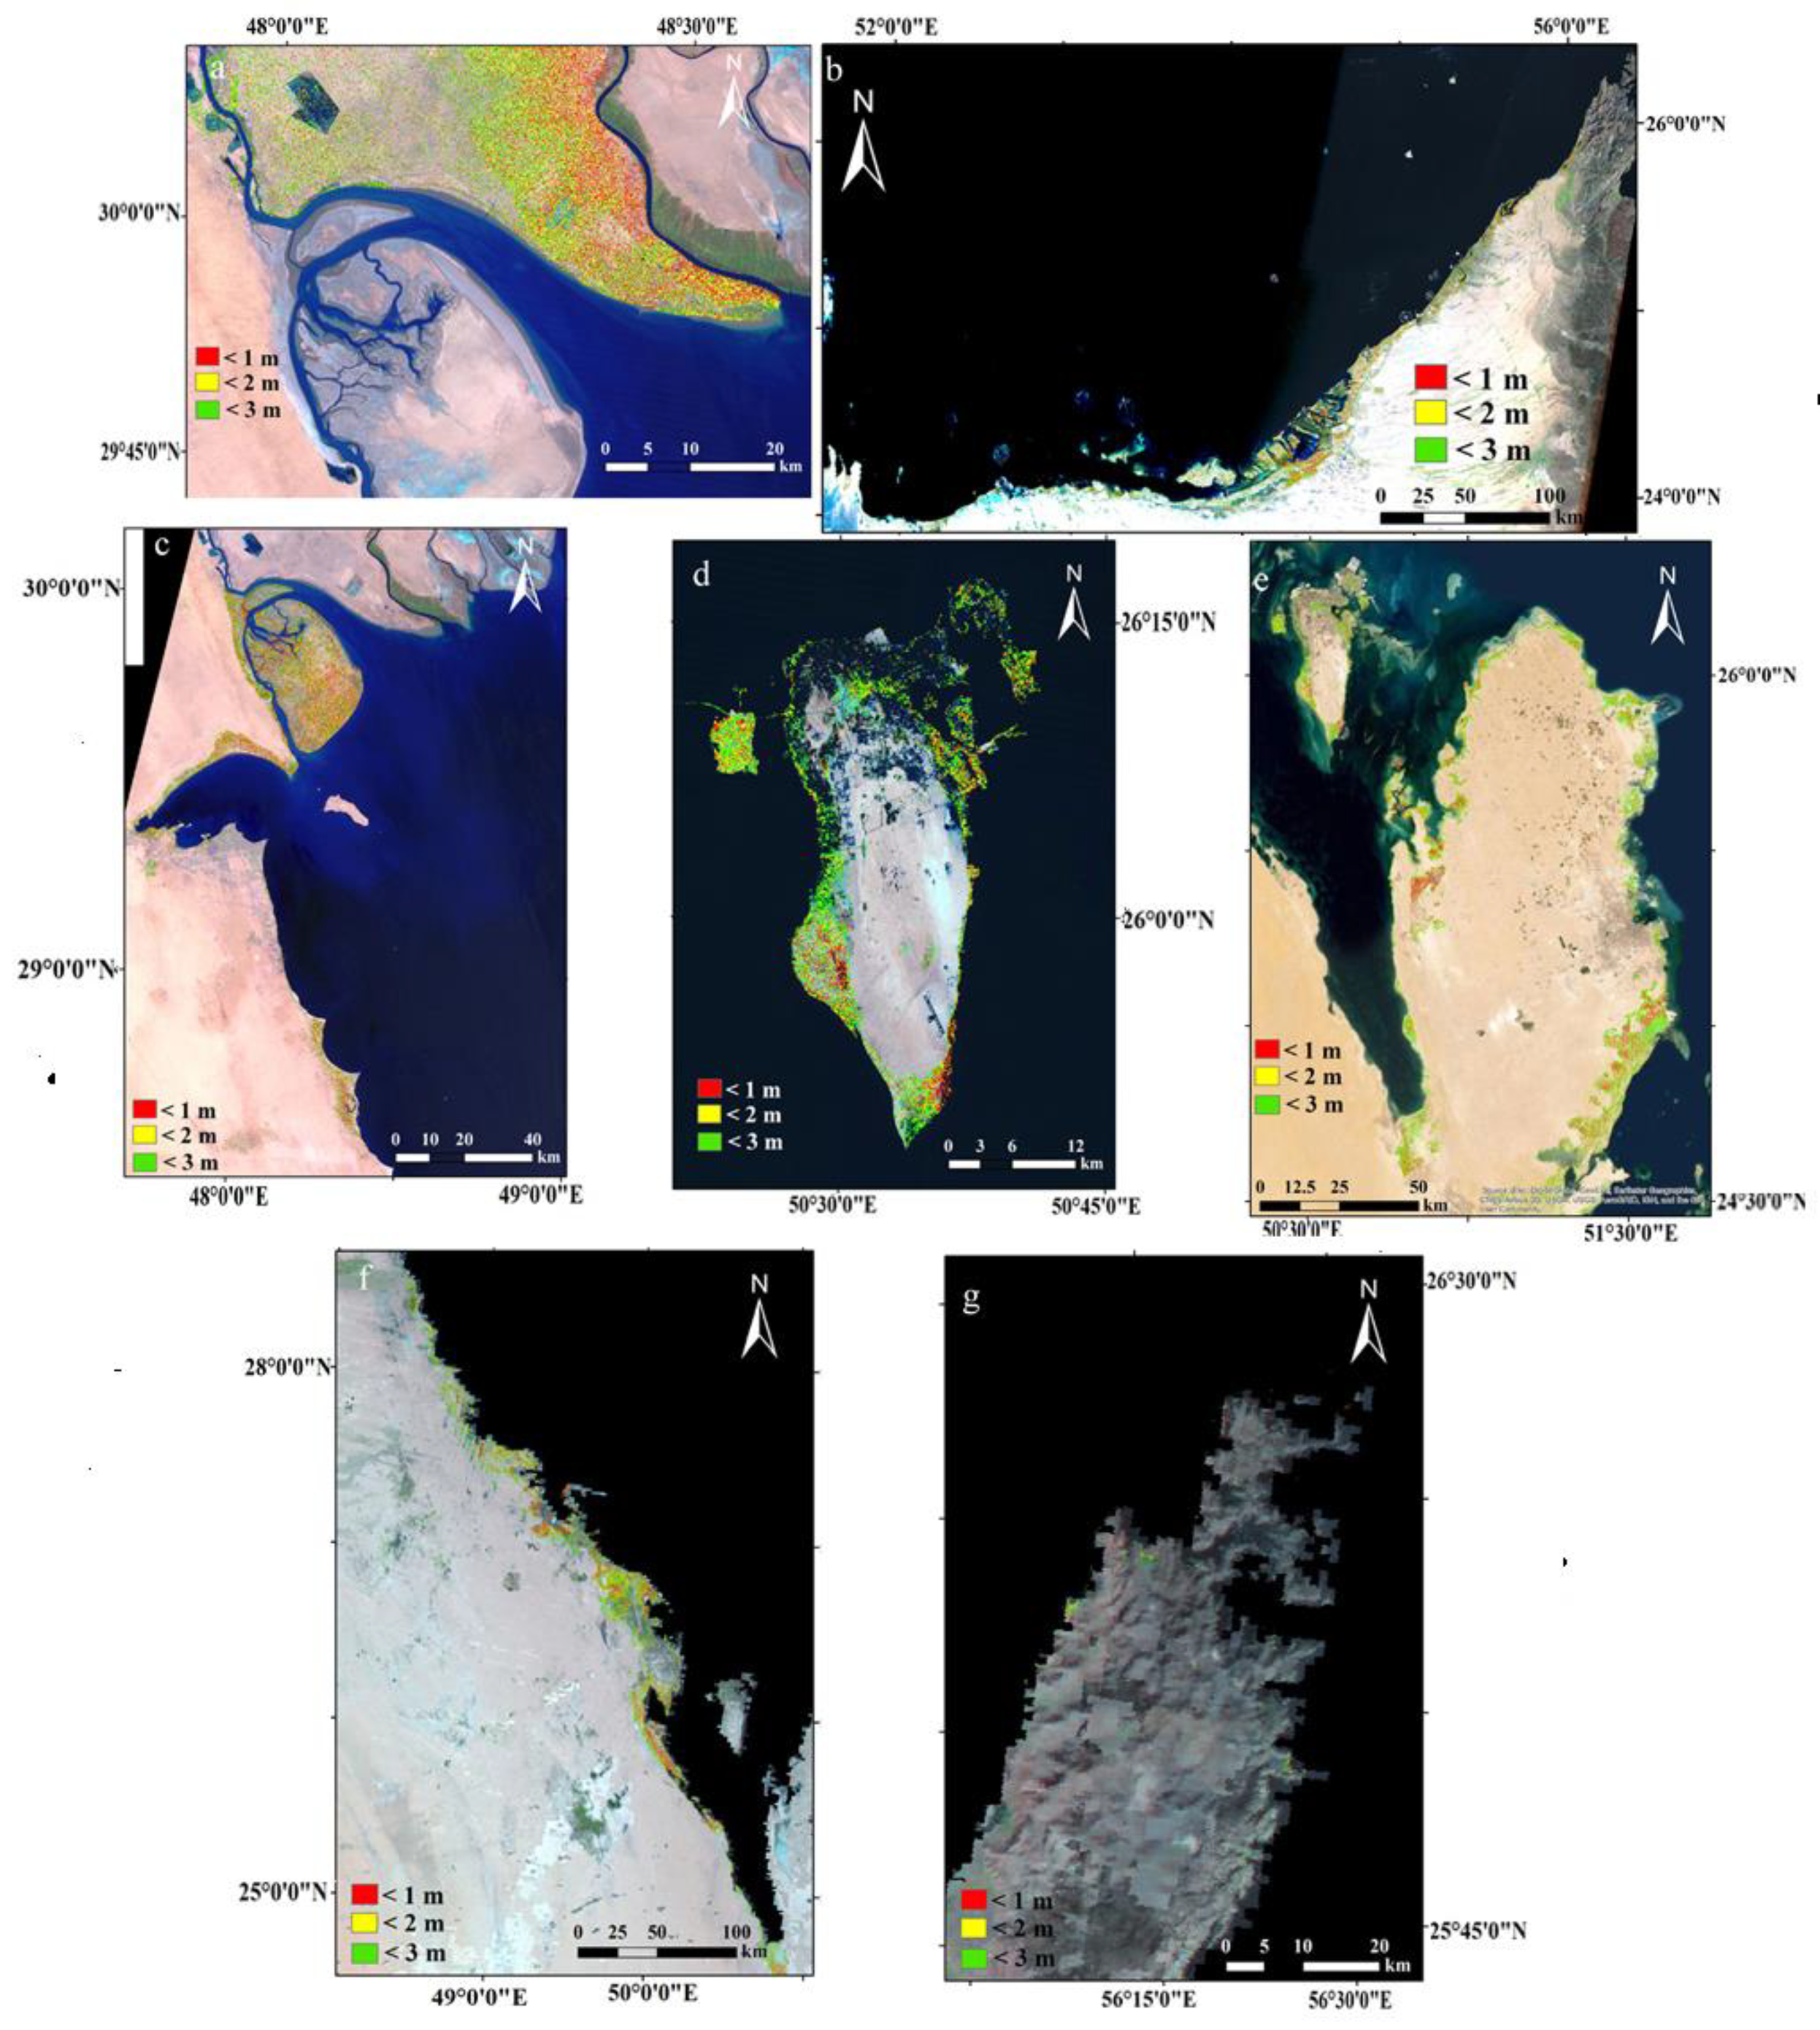
The DEM of the study area reveals that all of the Arab countries along the Gulf have low elevation coasts that could be inundated by the sea level rise (Figure 8). Table 3 presents the area of each elevation level for all the Arab counties in the Gulf. It is observed that the coastal areas of Iraq, KSA, UAE, and Qatar have the largest low-laying areas along the coast. The sea level rise by 1 m should overwhelm about 1910, 614, 270, and 147 km2 of those countries, respectively. The smallest area below 1 m level is estimated for the coasts of Musandam Peninsula of Oman (2.6 km2) (Figure 8g). The coastal topography of this peninsula is rugged and cliffy, except for some plains, such as Bukha and Khasab, where major population, services, and infrastructure of the peninsula settle. For a country like Bahrain, although the area of 1 m is relatively small (20.5 km2), it represents approximately 2.63% of the total area of the country (Figure 8d) and most of the areas of low-lands occur along the western side of the island. Nonetheless, Bahrain is experiencing tremendous processes of land use/cover change by filling the sea in the north by sand and other demolition debris to add new land to the country in order to increase its small area and confront future projections of the sea level rise (Figure 7). For Qatar, the southeastern side of the peninsula is the most prone to the sea level rise, whereas, in Kuwait, the most vulnerable locations are observed along the Bubiyan Island and along the southern coast of the country (Figure 8c). In Saudi Arabia, the low-lying areas south and north of Dammam are the susceptible location for inundation. For UAE, the middle coast and the islands in Abu Dhabi have low-levels and are vulnerable to sea level rise. The UAE, Qatar, and Bahrain have the highest impact of sea level rise in terms of the number of population at risk to the total number of population [11].
The sea level rise by two and three meters should be overwhelming, where, in most of the Arabian countries along the Gulf, the coastal areas of 3 m level are more than three-fold the area of 1 m level. Table 3 presents the areas of the coastal zones in these countries, which could be inundated at the different levels of the sea level rise (1, 2, and 3 m). Moreover, the extensive abstraction of oil and gas should promote land subsidence [50]. This subsidence could accelerate the sea level rise impact upon the coastal cities and low-land coastal areas. The ingress of tsunami waves is more likely to enter the Gulf through the Strait of Hormuz if strong marine earthquakes occur, as the Gulf is close to the Makran Subduction Zone (MSZ) in the Sea of Oman, which is one of the structurally active geologic regions with anticipated marine earthquakes [51,52]. The impact should be most significant along Musandam Peninsula of Oman. Historically, the Gulf has experienced a sea transgression during the late Holocene, where the inundation by 1–2 m sea level rise above the current level occurred along the Gulf coasts and covered significant areas in southern Iraq [53]. The population of the Arabian countries is significantly concentrated near the coast in UAE, Qatar, Kuwait, and Bahrain. However, the DEM reveals that most of the populated areas in Qatar, UAE, and Bahrain are much vulnerable to the sea level rise, as they settle on low elevated terrains. Unfortunately, most land reclamation occurs in these countries, particularly in the UAE and Bahrain.
4. Conclusions
The change in SST could be considered a proxy to climate change and global warming. As observed in this study there is an increase in SST by 0.7 °C/decade along the western side of the Gulf. This figure exceeds the annual global ocean warming since 1900 and it could be above the tolerance limit of coral reefs. As coral bleaching is recorded in regions of high SST trend, it could attribute this bleaching to the seawater warming. Among the seven coral reef locations, six show maximum warming during the weak Shamal winds in the summer of 2017 and one location, occurring between the Sea of Oman and the Arabian Gulf, reveals maximum warming synchronized by El Niño of 2015/206. Nevertheless, bleaching is also reported in regions with low SST trends, which may likely to be driven by other environmental (acidification) or anthropogenic stressors. The coastal vulnerability to inundation by the sea level rise in the Gulf is a significant issue, because most of the Arabian countries have low-laying coastal areas, particularly along Iraq, KSA, and UAE. Although some countries have increased their total area by constructing artificial islands and coasts, such as Bahrain and UAE, the anticipated sea level rise could be a serious threat to most of these developments, unless coastal protection structures are being planned and implemented.
Funding
This research is funded by the Sultan Qaboos University, HM Project (SR/ART/GEOG/17/01).
Acknowledgments
The author deeply acknowledges and thanks the Sultan Qaboos University for supporting this research as a part of the Project # SR/ART/GEOG/17/01. Two anonymous reviewers are acknowledged for their revisions and comments to improve the manuscript. The author also thanks Dr. Ahmed El-Kenawy, Geography Dept., Sultan Qaboos University for helping in the statistical analysis of the data presented in the manuscript.
Conflicts of Interest
The author declares no conflict of interest.
References
- Li, L.; Cao, R.; Wei, K.; Wang, W.; Chen, L. Adapting climate change challenge: A new vulnerability assessment framework from the global perspective. J. Clean. Prod. 2019, 217, 216–224. [Google Scholar] [CrossRef]
- Dong, L.; McPhaden, M.J. Interhemispheric SST Gradient Trends in the Indian Ocean prior to and during the Recent Global Warming Hiatus. J. Clim. 2016, 29, 9077–9095. [Google Scholar] [CrossRef]
- Ihara, C.; Kushnir, Y.; Cane, M.A. Warming Trend of the Indian Ocean SST and Indian Ocean Dipole from 1880 to 2004. J. Clim. 2008, 21, 2035–2046. [Google Scholar] [CrossRef]
- Arora, A.; Rao, S.A.; Chattopadhyay, R.; Goswami, T.; George, G.; Sabeerali, C.T. Role of Indian Ocean SST variability on the recent global warming hiatus. Glob. Planet. Chang. 2016, 143, 21–30. [Google Scholar] [CrossRef]
- Wang, H.; Murtugudde, R.; Kumar, A. Evolution of Indian Ocean dipole and its forcing mechanisms in the absence of ENSO. Clim. Dyn. 2004, 47, 2481–2500. [Google Scholar] [CrossRef]
- Wang, H.; Kumar, A.; Murtugudde, R.; Narapusetty, B.; Seip, K.L. Covariations between the Indian Ocean dipole and ENSO: A modeling study. Clim. Dyn. 2019, 53, 5743–5761. [Google Scholar] [CrossRef]
- Varotsos, C.A. The global signature of the ENSO and SST-like fields. Theor. Appl. Climatol. 2013, 113, 197–204. [Google Scholar] [CrossRef]
- Varotsos, C.A.; Franzke, C.L.; Efstathiou, M.N.; Degermendzhi, A.G. Evidence for two abrupt warming events of SST in the last century. Theor. Appl. Climatol. 2014, 116, 51–60. [Google Scholar] [CrossRef] [Green Version]
- Varotsos, C.A.; Cracknell, A.P.; Efstathiou, M.N. The global signature of the El Niño/La Niña Southern Oscillation. Int. J. Remote Sens. 2018, 39, 5965–5977. [Google Scholar] [CrossRef]
- Stocker, T.F.; Qin, D.; Plattner, G.K.; Tignor, M.; Allen, S.K.; Boschung, J.; Midgley, P.M. Climate Change 2013: The Physical Science Basis; Cambridge University Press: Cambridge, UK, 2013; p. 1535. [Google Scholar]
- Van Lavieren, H.; Burt, J.; Feary, D.A.; Cavalcante, G.; Marquis, E.; Benedetti, L.; Sale, P.F. Managing the Growing Impacts of Development on Fragile Coastal and Marine Ecosystems: Lessons from the Gulf; UNU-INWEH: Hamilton, ON, Canada, 2011. [Google Scholar]
- Pous, S.; Lazure, P.; Carton, X. A model of the general circulation in the Persian Gulf and in the Strait of Hormuz: Intraseasonal to interannual variability. Cont. Shelf Res. 2015, 94, 55–70. [Google Scholar] [CrossRef] [Green Version]
- Sheppard, C.; Al-Husiani, M.; Al-Jamali, F.; Al-Yamani, F.; Baldwin, R.; Bishop, J.; Jones, D.A. The Gulf: A young sea in decline. Mar. Pollut. Bull. 2010, 60, 13–38. [Google Scholar] [CrossRef] [PubMed]
- Buchanan, J.R.; Krupp, F.; Burt, J.A.; Feary, D.A.; Ralph, G.M.; Carpenter, K.E. Living on the edge: Vulnerability of coral-dependent fishes in the Gulf. Mar. Pollut. Bull. 2016, 105, 480–488. [Google Scholar] [CrossRef] [PubMed]
- Naser, H. Human impacts on marine biodiversity: Macrobenthos in Bahrain. Arab. Gulf 2011, 109–126. [Google Scholar]
- Feary, D.A.; Burt, J.A.; Bartholomew, A. Artificial marine habitats in the Arabian Gulf: review of current use, benefits and management implications. Ocean Coast. Manag. 2011, 54, 742–749. [Google Scholar] [CrossRef]
- Trench, R.K. The Cell Biology of Plant-Animal Symbiosis. Annu. Rev. Plant Physiol. 1979, 30, 485–531. [Google Scholar] [CrossRef]
- Paparella, F.; Xu, C.; Vaughan, G.O.; Burt, J.A. Coral bleaching in the Persian/Arabian Gulf is modulated by summer winds. Front. Mar. Sci. 2019, 6, 205. [Google Scholar] [CrossRef]
- Wilson, S.I.M.O.N.; Fatemi, S.M.R.; Shokri, M.R.; Claereboudt, M.I.C.H.E.L. Status of coral reefs of the Persian/Arabian Gulf and Arabian Sea region, in Status of coral reefs of the World; AIMS: Townsville, Australia, 2002; pp. 53–62. [Google Scholar]
- Burt, J.A.; Feary, D.A.; Van Lavieren, H. Persian Gulf reefs: An Important asset for Climate Science in Urgent Need of Protection. Ocean Chall. 2013, 20, 49–56. [Google Scholar]
- Hereher, M.E. Effect of land use/cover change on land surface temperatures-The Nile Delta, Egypt. J. Afr. Earth Sci. 2017, 126, 75–83. [Google Scholar] [CrossRef]
- Etheridge, D.M.; Steele, L.P.; Langenfelds, R.L.; Francey, R.J.; Barnola, J.M.; Morgan, V.I. Natural and anthropogenic changes in atmospheric CO2 over the last 1000 years from air in Antarctic ice and firn. J. Geophys. Res. Atmos. 1996, 101, 4115–4128. [Google Scholar] [CrossRef] [Green Version]
- Scafetta, N. Climate change and its causes, a discussion about some key issues. arXiv 2010, arXiv:1003.1554. [Google Scholar]
- Church, J.A.; White, N.J.; Konikow, L.F.; Domingues, C.M.; Cogley, J.G.; Rignot, E.; Velicogna, I. Revisiting the Earth’s sea-level and energy budgets from 1961 to 2008. Geophys. Res. Lett. 2011, 38. [Google Scholar] [CrossRef] [Green Version]
- Dasgupta, S.; Meisner, C. Climate Change and Sea Level Rise: A Review of the Scientific Evidence; Environment department papers; no. 118; Climate change series; World Bank: Washington, DC, USA, 2009. [Google Scholar]
- Bouttes, N.; Gregory, J.M.; Lowe, J.A. The reversibility of sea level rise. J. Clim. 2013, 26, 2502–2513. [Google Scholar] [CrossRef] [Green Version]
- Beckley, B.D.; Lemoine, F.G.; Luthcke, S.B.; Ray, R.D.; Zelensky, N.P. A reassessment of global and regional mean sea level trends from TOPEX and Jason-1 altimetry based on revised reference frame and orbits. Geophys. Res. Lett. 2007, 34. [Google Scholar] [CrossRef]
- Pfeffer, W.T.; Harper, J.T.; O’Neel, S.J.S. Kinematic constraints on glacier contributions to 21st-century sea-level rise. Science 2008, 321, 1340–1343. [Google Scholar] [CrossRef] [PubMed]
- Tol, R.S.; Bohn, M.; Downing, T.E.; Guillerminet, M.L.; Hizsnyik, E.; Kasperson, R.; Pfeifle, G. Adaptation to Five Metres of Sea Level Rise. J. Risk Res. 2006, 9, 467–482. [Google Scholar] [CrossRef] [Green Version]
- Kilpatrick, K.A.; Podestá, G.; Walsh, S.; Williams, E.; Halliwell, V.; Szczodrak, M.; Evans, R. A decade of sea surface temperature from MODIS. Remote Sens. Environ. 2015, 165, 27–41. [Google Scholar] [CrossRef]
- Bouali, M.; Sato, O.T.; Polito, P.S. Temporal trends in sea surface temperature gradients in the South Atlantic Ocean. Remote Sens. Environ. 2017, 194, 100–114. [Google Scholar] [CrossRef]
- O’Reilly, J.E.; Maritorena, S.; Mitchell, B.G.; Siegel, D.A.; Carder, K.L.; Garver, S.A.; Kahru, M.; McClain, C. Ocean color chlorophyll a algorithms for SeaWiFS, OC2, and OC4: Version 4. J. Geophys. Res. Ocean. 2000, 3, 9–23. [Google Scholar]
- Kozlov, I.; Dailidienė, I.; Korosov, A.; Klemas, V.; Mingėlaitė, T. MODIS-based sea surface temperature of the Baltic Sea Curonian Lagoon. J. Mar. Syst. 2014, 129, 157–165. [Google Scholar] [CrossRef]
- Ghanea, M.; Moradi, M.; Kabiri, K.; Mehdinia, A. Investigation and validation of MODIS SST in the northern Persian Gulf. Adv. Space Res. 2016, 57, 127–136. [Google Scholar] [CrossRef]
- Carlson, D.F.; Yarbro, L.A.; Scolaro, S.; Poniatowski, M.; McGee-Absten, V.; Carlson, P.R., Jr. Sea surface temperatures and seagrass mortality in Florida Bay: spatial and temporal patterns discerned from MODIS and AVHRR data. Remote Sens. Environ. 2018, 208, 171–188. [Google Scholar] [CrossRef]
- Burt, J.; Al-Harthi, S.; Al-Cibahy, A. Long-term impacts of coral bleaching events on the world’s warmest reefs. Mar. Environ. Res. 2011, 72, 225–229. [Google Scholar] [CrossRef] [PubMed]
- Mukul, M.; Srivastava, V.; Jade, S.; Mukul, M. Uncertainties in the shuttle radar topography mission (SRTM) Heights: Insights from the indian Himalaya and Peninsula. Sci. Rep. 2017, 7, 41672. [Google Scholar] [CrossRef] [PubMed] [Green Version]
- Hereher, M.E. Vulnerability of the Nile Delta to sea level rise: an assessment using remote sensing. Geomat. Nat. Hazards Risk 2010, 1, 315–321. [Google Scholar] [CrossRef]
- Djouder, F.; Boutiba, M. Vulnerability assessment of coastal areas to sea level rise from the physical and socioeconomic parameters: case of the Gulf Coast of Bejaia, Algeria. Arab. J. Geosci. 2017, 10, 299. [Google Scholar] [CrossRef]
- Ben-Hasan, A.; Christensen, V. Vulnerability of the marine ecosystem to climate change impacts in the Arabian Gulf—an urgent need for more research. Glob. Ecol. Conserv. 2019, 17, e00556. [Google Scholar] [CrossRef]
- Riegl, B.M.; Purkis, S.J. Coral reefs of the Gulf: adaptation to climatic extremes in the world’s hottest sea, in Coral reefs of the Gulf; Springer: Dordrecht, The Netherlands, 2012; pp. 1–4. [Google Scholar]
- Vaughan, G.O.; Burt, J.A. The changing dynamics of coral reef science in Arabia. Mar. Pollut. Bull. 2016, 105, 441–458. [Google Scholar] [CrossRef]
- Coles, S.L.; Riegl, B.M. Thermal tolerances of reef corals in the Gulf: A review of the potential for increasing coral survival and adaptation to climate change through assisted translocation. Mar. Pollut. Bull. 2013, 72, 323–332. [Google Scholar] [CrossRef]
- Al-Rashidi, T.B.; El-Gamily, H.I.; Amos, C.L.; Rakha, K.A. Sea surface temperature trends in Kuwait bay, Arabian Gulf. Nat. Hazards 2009, 50, 73–82. [Google Scholar] [CrossRef]
- Burt, J.A.; Paparella, F.; Al-Mansoori, N.; Al-Mansoori, A.; Al-Jailani, H. Causes and consequences of the 2017 coral bleaching event in the southern Persian/Arabian Gulf. Coral Reefs 2019, 38, 567–589. [Google Scholar] [CrossRef]
- Al-Saleh, Y.M.; Vidican, G.; Natarajan, L.; Theeyattuparampil, V.V. Carbon capture, utilisation and storage scenarios for the Gulf Cooperation Council region: A Delphi-based foresight study. Futures 2012, 44, 105–115. [Google Scholar] [CrossRef]
- Uddin, S.; Gevao, B.; Al-Ghadban, A.N.; Nithyanandan, M.; Al-Shamroukh, D. Acidification in Arabian Gulf—Insights from pH and temperature measurements. J. Environ. Monit. 2012, 14, 1479–1482. [Google Scholar] [CrossRef] [PubMed]
- Petersen, K.L.; Paytan, A.; Rahav, E.; Levy, O.; Silverman, J.; Barzel, O.; Bar-Zeev, E. Impact of brine and antiscalants on reef-building corals in the Gulf of Aqaba–Potential effects from desalination plants. Water Res. 2018, 144, 183–191. [Google Scholar] [CrossRef] [PubMed]
- Sale, P.F.; Feary, D.A.; Burt, J.A.; Bauman, A.G.; Cavalcante, G.H.; Drouillard, K.G.; Van Lavieren, H. The growing need for sustainable ecological management of marine communities of the Persian Gulf. Ambio 2011, 40, 4–17. [Google Scholar] [CrossRef] [PubMed] [Green Version]
- Gurevich, A.E.; Chilingarian, G.V. Subsidence over producing oil and gas fields, and gas leakage to the surface. J. Pet. Sci. Eng. 1993, 9, 239–250. [Google Scholar] [CrossRef]
- Heidarzadeh, M.; Pirooz, M.D.; Zaker, N.H.; Yalciner, A.C. Preliminary estimation of the tsunami hazards associated with the Makran subduction zone at the northwestern Indian Ocean. Nat. Hazards 2009, 48, 229–243. [Google Scholar] [CrossRef]
- El-Hussain, I.; Omira, R.; Al-Habsi, Z.; Baptista, M.A.; Deif, A.; Mohamed, A.M.E. Probabilistic and deterministic estimates of near-field tsunami hazards in northeast Oman. Geosci. Lett. 2018, 5, 1–13. [Google Scholar] [CrossRef] [Green Version]
- Lambeck, K. Shoreline reconstructions for the Persian Gulf since the last glacial maximum. Earth Planet. Sci. Lett. 1996, 142, 43–57. [Google Scholar] [CrossRef]
Figure 1.
Regional satellite image from Moderate Resolution Imaging Spectroradiometer (MODIS) showing the Arabian Gulf region.
Figure 1.
Regional satellite image from Moderate Resolution Imaging Spectroradiometer (MODIS) showing the Arabian Gulf region.

Figure 2.
A bathymetry map of the Arabian Gulf. Note the shallow water depths for the Gulf.

Figure 3.
Monthly maps of the sea surface temperatures (SST) in the Arabian Gulf. Note the variation from the west to east.
Figure 3.
Monthly maps of the sea surface temperatures (SST) in the Arabian Gulf. Note the variation from the west to east.

Figure 4.
The mean annual distribution of the SST in the Arabian Gulf.

Figure 5.
The distribution of corals and bleached corals in the Gulf. Note that there are seven coral assemblages mostly occurring along the southern side of the Gulf. Source: http://www.reefbase.org.
Figure 5.
The distribution of corals and bleached corals in the Gulf. Note that there are seven coral assemblages mostly occurring along the southern side of the Gulf. Source: http://www.reefbase.org.

Figure 6.
The time-series monthly SST trends for the seven locations of the coral assemblages. The X and Y axes refer to the degree Celsius and months, respectively.
Figure 6.
The time-series monthly SST trends for the seven locations of the coral assemblages. The X and Y axes refer to the degree Celsius and months, respectively.

Figure 7.
The landscape change in United Arab Emirates (UAE) (left) and Bahrain (right) as revealed by Google Earth maps in 1985 and 2016.
Figure 7.
The landscape change in United Arab Emirates (UAE) (left) and Bahrain (right) as revealed by Google Earth maps in 1985 and 2016.

Figure 8.
The distribution of the low-lands along the Arabian countries, (a) is for southern Iraq, (b) northern UAE, (c) eastern Kuwait, (d) northern Bahrain, (e) Qatar and Bahrain, (f) eastern Kingdom of Saudi Arabia (KSA), and (g) Musandam Peninsula of Oman.
Figure 8.
The distribution of the low-lands along the Arabian countries, (a) is for southern Iraq, (b) northern UAE, (c) eastern Kuwait, (d) northern Bahrain, (e) Qatar and Bahrain, (f) eastern Kingdom of Saudi Arabia (KSA), and (g) Musandam Peninsula of Oman.


Table 1.
The amount of change of SST in °C/decade expressed as seasonal and annual values for the studied locations.
Table 1.
The amount of change of SST in °C/decade expressed as seasonal and annual values for the studied locations.
| Zone | Winter | Spring | Summer | Fall | Annual |
|---|---|---|---|---|---|
| A | 0.69 | 0.93 | 0.78 | 0.47 | 0.71 |
| B | 0.47 | 0.65 | 0.53 | 0.74 | 0.56 |
| C | 0.5 | 0.87 | 0.6 | 0.37 | 0.56 |
| D | 0.52 | 0.88 | 0.83 | 0.38 | 0.61 |
| E | 0.47 | -0.39 | 0.36 | 0.14 | 0.11 |
| F | 0.3 | -0.27 | 0.29 | 0.23 | 0.11 |
| G | 0.2 | -0.04 | 0.22 | 0.09 | 0.08 |
Table 2.
The statistical significance level of the time series trend for the studied locations. Note that these trends are significant at 99% (p<0.01) for the annual trend for zones A, B, C, and D.
Table 2.
The statistical significance level of the time series trend for the studied locations. Note that these trends are significant at 99% (p<0.01) for the annual trend for zones A, B, C, and D.
| Zone | Winter | Spring | Summer | Fall | Annual |
|---|---|---|---|---|---|
| A | 0.32 | 0.04 | 0.02 | 0.38 | 0.01 |
| B | 0.26 | 0.17 | 0.03 | 0.03 | 0.00 |
| C | 0.25 | 0.01 | 0.01 | 0.24 | 0.00 |
| D | 0.17 | 0.03 | 0.02 | 0.20 | 0.00 |
| E | 0.14 | 0.38 | 0.13 | 0.45 | 0.55 |
| F | 0.29 | 0.44 | 0.12 | 0.22 | 0.49 |
| G | 0.32 | 0.89 | 0.54 | 0.70 | 0.57 |
Table 3.
The area in km2 of the coastal lands at 1, 2 and 3 m elevations along the Arabian countries along the Gulf as assessed from the DEM.
Table 3.
The area in km2 of the coastal lands at 1, 2 and 3 m elevations along the Arabian countries along the Gulf as assessed from the DEM.
| Country\Elevation | 1 m | 2 m | 3 m |
|---|---|---|---|
| Iraq | 1912.9 | 5293.6 | 9328.7 |
| Kuwait | 160.3 | 334.7 | 481.9 |
| KSA | 613.9 | 1401.4 | 2216.5 |
| Bahrain | 20.5 | 50.3 | 88.6 |
| Qatar | 147.2 | 362.4 | 620.0 |
| UAE | 269.9 | 628.3 | 1110.4 |
| Oman | 2.6 | 5.2 | 8.4 |
© 2020 by the author. Licensee MDPI, Basel, Switzerland. This article is an open access article distributed under the terms and conditions of the Creative Commons Attribution (CC BY) license (http://creativecommons.org/licenses/by/4.0/).
Share and Cite
MDPI and ACS Style
Hereher, M.E. Assessment of Climate Change Impacts on Sea Surface Temperatures and Sea Level Rise—The Arabian Gulf. Climate 2020, 8, 50. https://0-doi-org.brum.beds.ac.uk/10.3390/cli8040050
AMA Style
Hereher ME. Assessment of Climate Change Impacts on Sea Surface Temperatures and Sea Level Rise—The Arabian Gulf. Climate. 2020; 8(4):50. https://0-doi-org.brum.beds.ac.uk/10.3390/cli8040050
Chicago/Turabian StyleHereher, Mohamed E. 2020. "Assessment of Climate Change Impacts on Sea Surface Temperatures and Sea Level Rise—The Arabian Gulf" Climate 8, no. 4: 50. https://0-doi-org.brum.beds.ac.uk/10.3390/cli8040050
Note that from the first issue of 2016, this journal uses article numbers instead of page numbers. See further details here.