Modelling of Regional Economic Metabolism
by
 , ,
, ,
Afonso Silva
1,*, 
Bruno Augusto
1,
Sandra Rafael
1,
Johnny Reis
1,
Myriam Lopes
1,
Sérgio Costa
2 and
Carlos Borrego
1 1
Department of Environment and Planning & CESAM, University of Aveiro, 3810-193 Aveiro, Portugal
2
Simbiente, 4000-486 Porto, Portugal
*
Author to whom correspondence should be addressed.
Climate 2020, 8(4), 52; https://0-doi-org.brum.beds.ac.uk/10.3390/cli8040052
Submission received: 12 March 2020
/
Revised: 28 March 2020
/
Accepted: 30 March 2020
/
Published: 2 April 2020
(This article belongs to the Special Issue Fighting Climate Change with Circular Economy)
Abstract
:The current linear economic system has led Europe to unsustainable development, aggravating several issues, such as climate change, limitation of resources, and pollution. As a sustainable alternative, circular economy (CE) has been promoted around the world. This economic system allows for the maximization of a product’s life, thus decreasing its environmental impact and increasing its value. The main goal of this work is to scrutinise the concepts of CE over time, from the beginning of the concept, to its implementation in Europe and its application in Portugal. In addition, the requirement for strategies that led to studies on regional urban metabolism are addressed. Another goal is to examine Portugal and see how the country is dealing with the implementation of strategies for CE, moving from concept to practice. This part of the work resulted in the creation of the REMET-UA model, a tool to assess the regional economic metabolism, which also has the potential to evaluate synergies of materials in terms of fluxes between regions, maximizing the amount of information available at this scale for municipalities and enterprises to be used, having taken into account the purpose of circular economy. The results showed that REMET-UA is fully operational and corresponds to the goal for which the model was made. Future developments have been identified and are underway to improve the model and bring it as close to reality as possible.
1. Introduction
Current economic standards led Europe into unsustainable development, causing severe issues throughout the decades: climate change, contamination of natural environments, and the limitation of resources [1].
International conventions and inclusive legislation with sustainable development as a core topic made countries rethink the viability of their economic system, especially the usage of resources in a linear way. Currently, circular economy (CE) has been promoted around the world as a sustainable alternative to the actual economic system.
Since the late 1970s, interest in the concept of CE has been growing [2], despite credit for the creation of the term being given to [3], because of their description of the influence of natural resources in the economic system. By supplying inputs for production and consumption, taking into account outputs like waste, they researched the linearity and open aspects of current economic models [4,5].
Today, the latest understandings of CE evolved into assimilating new approaches and added features from different concepts [5]. The roots of CE and its vision come from industrial ecology nonetheless, essentially pushing for resource use minimization and the endorsement of newer and cleaner technologies [6]. It is implied that a society with a more circular model of economy will see benefits in the longer term. Benefits will be achieved by diminishing the use of the environment as a sink for waste, and by diminishing the use of natural resources for economic actions [6].
The evolution to a structured economy, where the outcomes and primary resources are kept in the system for the maximum time possible, and where waste management is diminished, will be a crucial part of the contribution to European efforts to create a more sustainable, efficient, and ambitious economy [7]. Such an evolution is the perfect excuse to reconstruct the economy and create new and sustainable ambitious advantages for the EU. CE will improve the EU’s competitiveness by defending businesses against the lack of resources and volatile costs, helping to develop new trade opportunities and inventive, more dynamic ways of producing and consuming, making this their priority [7].
Economic intermediaries, such as business bodies and consumers, are fundamental as a driving force in the operation. Local, regional, and national entities are enabling the conversion, but the EU also has an essential part to play in supporting it. The objective is to ensure that a managerial plan is in place for the social and economic progress of CE, and to grant clear indicators—to economic bodies and society in general—in a way forward in the long term, as well as an enthusiastic set of actions to be carried out before 2020 to complete the defined targets [7].
The review of the literature shows that certain economical practices, as CE, can contribute directly to accomplishing an important number of Sustainable Development Goals (SDGs) targets [8]. Therefore, the implementation of measures for the economy to become more circular can become crucial for achieving significant SDGs: SDG8 (Decent work and economic growth), SDG11 (Sustainable cities and communities), SDG12 (Responsible consumption and production), and SDG13 (Climate Action).
The main goal of this work is to explore the circular economy concept at both temporal and spatial evolution, from its beginning to now, and from European to Portuguese cases. The paper highlights the needs that emerged from the European strategy for a circular economy, namely related to regional urban metabolism. It is also a goal of this work to describe how Portugal is dealing with this need from concept to the practice, namely by developing a regional metabolism model, REMET-UA. This model aims to assess the regional economic metabolism, and also has the potential to evaluate synergies of materials in terms of fluxes between regions, maximizing the amount of information available at this scale for municipalities and enterprises to use, having taken into account the purpose of the circular economy.
The paper is structured as follows: in Section 2, the historical emergence of various concepts; in Section 3, an outline of European commitments for implementing a CE; in Section 4, an overview for Portugal is presented while focusing on REMET-UA, a new model for regional economic metabolism; and in Section 5, final remarks are presented.
2. The Beginning
The recognition of the concept of urban metabolism (UM) is given to Wolman (1965) [9]. In an inventive article at that time, Wolman evaluated the metabolism of a theoretical urban American municipality inhabited with a population of one million people, in which he quantified numerous flows of materials and energy [10]. The conceptual idea emerged from Wolman’s worries about the different types of pollution (air, soil, and water) affecting American cities [10].
The thought of UM emerged from an analogy with the metabolism of organisms [10,11], defined as “the total sum of the technical and socio-economic processes that occur in cities, resulting in growth, production of energy, and elimination of waste”.
At the time of its creation, UM was thought to be a supportive tool in the development of sustainable cities and communities. But now, there are much more applications, like sustainability reporting, mathematical modelling for policy analysis, and urban design. Practical examples of those applications can be the use of dynamic mathematical models used to simulate changes to UM as a result of policy analysis, and also sustainability indicators for energy efficiency, material cycling, waste management, and infrastructure in urban systems, because the parameters used for UM generally meet the criteria for good sustainability indicators, as outlined by Maclaren (1996) [12].
A chronological review on the theme of UM after Wolman (1965) shows a few studies in the 1970s, but also a disinterest in this study area in the 1980s. After a slow reappearance in the 1990s, the study of UM has grown in the last few years [11]. Material flow analysis, a systematic assessment of materials, and their stocks and flows over time and space within a defined system, is the basis for most of these studies [13]. These have proven to be reliable on a national scale, but analysis focused on smaller areas are necessary to gain a better understanding of how material consumption can be controlled and reduced, allowing opportunities for CE design and for CE progress monitoring to be identified [13]. Now—and even more so in the future—most of the world population will be concentrated in urban areas, and most of the products consumed in urban areas are imported [14].
UM studies were originally limited to black-box models and input-output accounting [15]. In simulation models of an urban metabolism, it is necessary to divide metabolic actors into increasingly precise compartments, such as sectors of the economy, and to clarify metabolic flows among the compartments [15].
This approach also permits the development of more sophisticated system simulation models that can reveal the evolution of ecological processes, the mechanisms responsible for environmental and other impacts, and the internal mechanisms that determine how a system functions [16]. Simulation models include ecological dynamics models, ecological network models, input-output analysis models, and processes models (Table 1) [15].
The input-output analysis method makes this possible. However, input-output analysis is a system-oriented method that considers coupling among different structures within the system, and this makes the method more suitable for analyses that examine the flows of ecological elements through an economic system from a macro-scale perspective [15].
Dramatically improved computer technology has also permitted the development and use of models of ecological dynamics, and these models have become an important tool for simulating flows of materials and energy within an urban metabolic system. However, decades of research have shown the limitations of these approaches, and the constraints they place on researchers (Zhang, 2013).
Material flow accounting is the basis for all these studies, but it needs to be adapted to several constraints and particularities when applied to cities [17]. Urban material flow analysis studies lack a unified methodology. Without a unified methodology, urban metabolism studies can only be considered on a case-by-case basis [17].
Establishing a robust method to quantify urban material flows, in order to characterize the urban metabolism of different cities worldwide, has been attempted by some researchers, but it has not yet been fully achieved because there are still some methodological gaps [17].
- Lack of a unified methodology;
- Lack of material flows data at the urban level;
- Limited categorizations of material types;
- Limited results about material flows as they are related to economic activities;
- Limited understanding of the origin and destination of flows;
- Lack of understanding about the dynamics of added stock;
- Lack of knowledge about the magnitude of the flow of materials that are imported and then, to a great extent, exported.
Economic problems, especially the ones in this century, have led to frequent socioeconomic instability, and to answer this question, the concept of CE, although not being new, started gaining new attention in the plans of policymakers and stakeholders [5] Metabolism studies can be used as a tool for finding prospects for a CE. Also, CE can be an important factor in a sustainable metabolism that could decrease the pressure caused in cities or regions through more efficient resource use, with a side-effect on the backing of the economy [13].
3. Overview of European Commitments to the Circular Economy
The principles of the European Action Plan for the Circular Economy are connected with the key EU priorities: business dynamization and employment, climate, social needs, industrialized innovations, all built on the need of and endeavor for sustainable development [7]. The focus of the Action Plan lies at the European level, and the time span required will be long, requiring long-term participation from all contributors, from EU countries, regions, and cities, to the citizen level [7].
The objective of the European Action Plan for the Circular Economy is to provide the correct framework to develop CE in the European economic system by implementing measures and actions before 2020 [7]. The plan will give signs to all economic agents and provide innovation and investment in Europe by encouraging sustainable actions in key areas, helping the economy grow, and to increase jobs potential. Its content combines pledges on eco-design; strategies on plastic and chemicals, and additionally targeted actions on these topics and wastes; construction; critical primary materials; consumption and public acquisition; and lastly a funded program to give financial incentives to inventive projects under EU’s Horizon 2020 research programme [7]. These actions will support the implementation of the CE in all phases of the value chain.
EU members are asked to play a major role in the actions built for EU, integrating them in their nation and supplementing them according to their needs. The actions included in the plan have already been finished or are in the final phase of implementation. Operations like the European Action Plan for the Circular Economy will be fundamental in the accomplishment of international commitments taken by the EU, such as the UN 2030 Agenda for Sustainable Development and the G7 Alliance on Resource Efficiency. About the Agenda for Sustainable Development, the action plan will specifically help to reach the Goal 12 (“Ensure sustainable consumption and production patterns”) [7].
To appease the transition to a more circular economy and to evaluate the efficiency of the actions implemented by the action plan, it is necessary to monitor the socioeconomic trends and patterns. The analysis of these results will help support the definition of new priorities in order to achieve sustainable development in the long-term through the implementation of the SDG [18]. Therefore, it was necessary to regulate and create a European framework for the monitoring of the European Action Plan for the Circular Economy, which has the general aim to measure the progress towards a CE. Thus, the EU Monitoring Framework for the Circular Economy was created in 2018. This framework contains ten key indicators holding every phase in the lifecycle of a product, and is organized into the four stages of CE: Production and consumption (EU self-sufficiency for raw materials, green public procurement, waste generation and food waste); waste management (overall recycling rates and recycling rates for specific waste streams); secondary raw materials (contribution of recycled materials to raw materials demand and trade in recyclable raw materials); competitiveness and innovation (private investments, jobs, and gross value added and patents) (European Commission, 2018) [18].
Through a material flow analysis, it is possible to gain an overview of the life cycle of materials and understand how resources move and are exchanged in the economy. Being grouped in the main stages of CE means that these indicators will capture the principal elements of a CE and specifically, the indicators that were created with criteria and based with as much existing data as possible. Until today there is no recognized indicator of “circularity” that could, through a single evaluation, pinch the complexity of the transition to a CE [18]. For this reason, a set of relevant indicators are being used for the monitoring framework. The objective was to help complement the Resource Efficiency Scoreboard and the Raw Materials Scoreboard developed recently by the EU. Work is being done through Horizon 2020 in the development of methodologies to improve data availability in the Eurostat platform, in order to deliver better official information to facilitate the work around the calculation of indicators [18].
Europe is a vast territorial unit with social, demographic, economic, or industrial characteristics different in every region and country. This implies that each nation moves into a CE in different ways, shifting with every challenge and opportunity that they face in their own land and their current political and socioeconomic system.
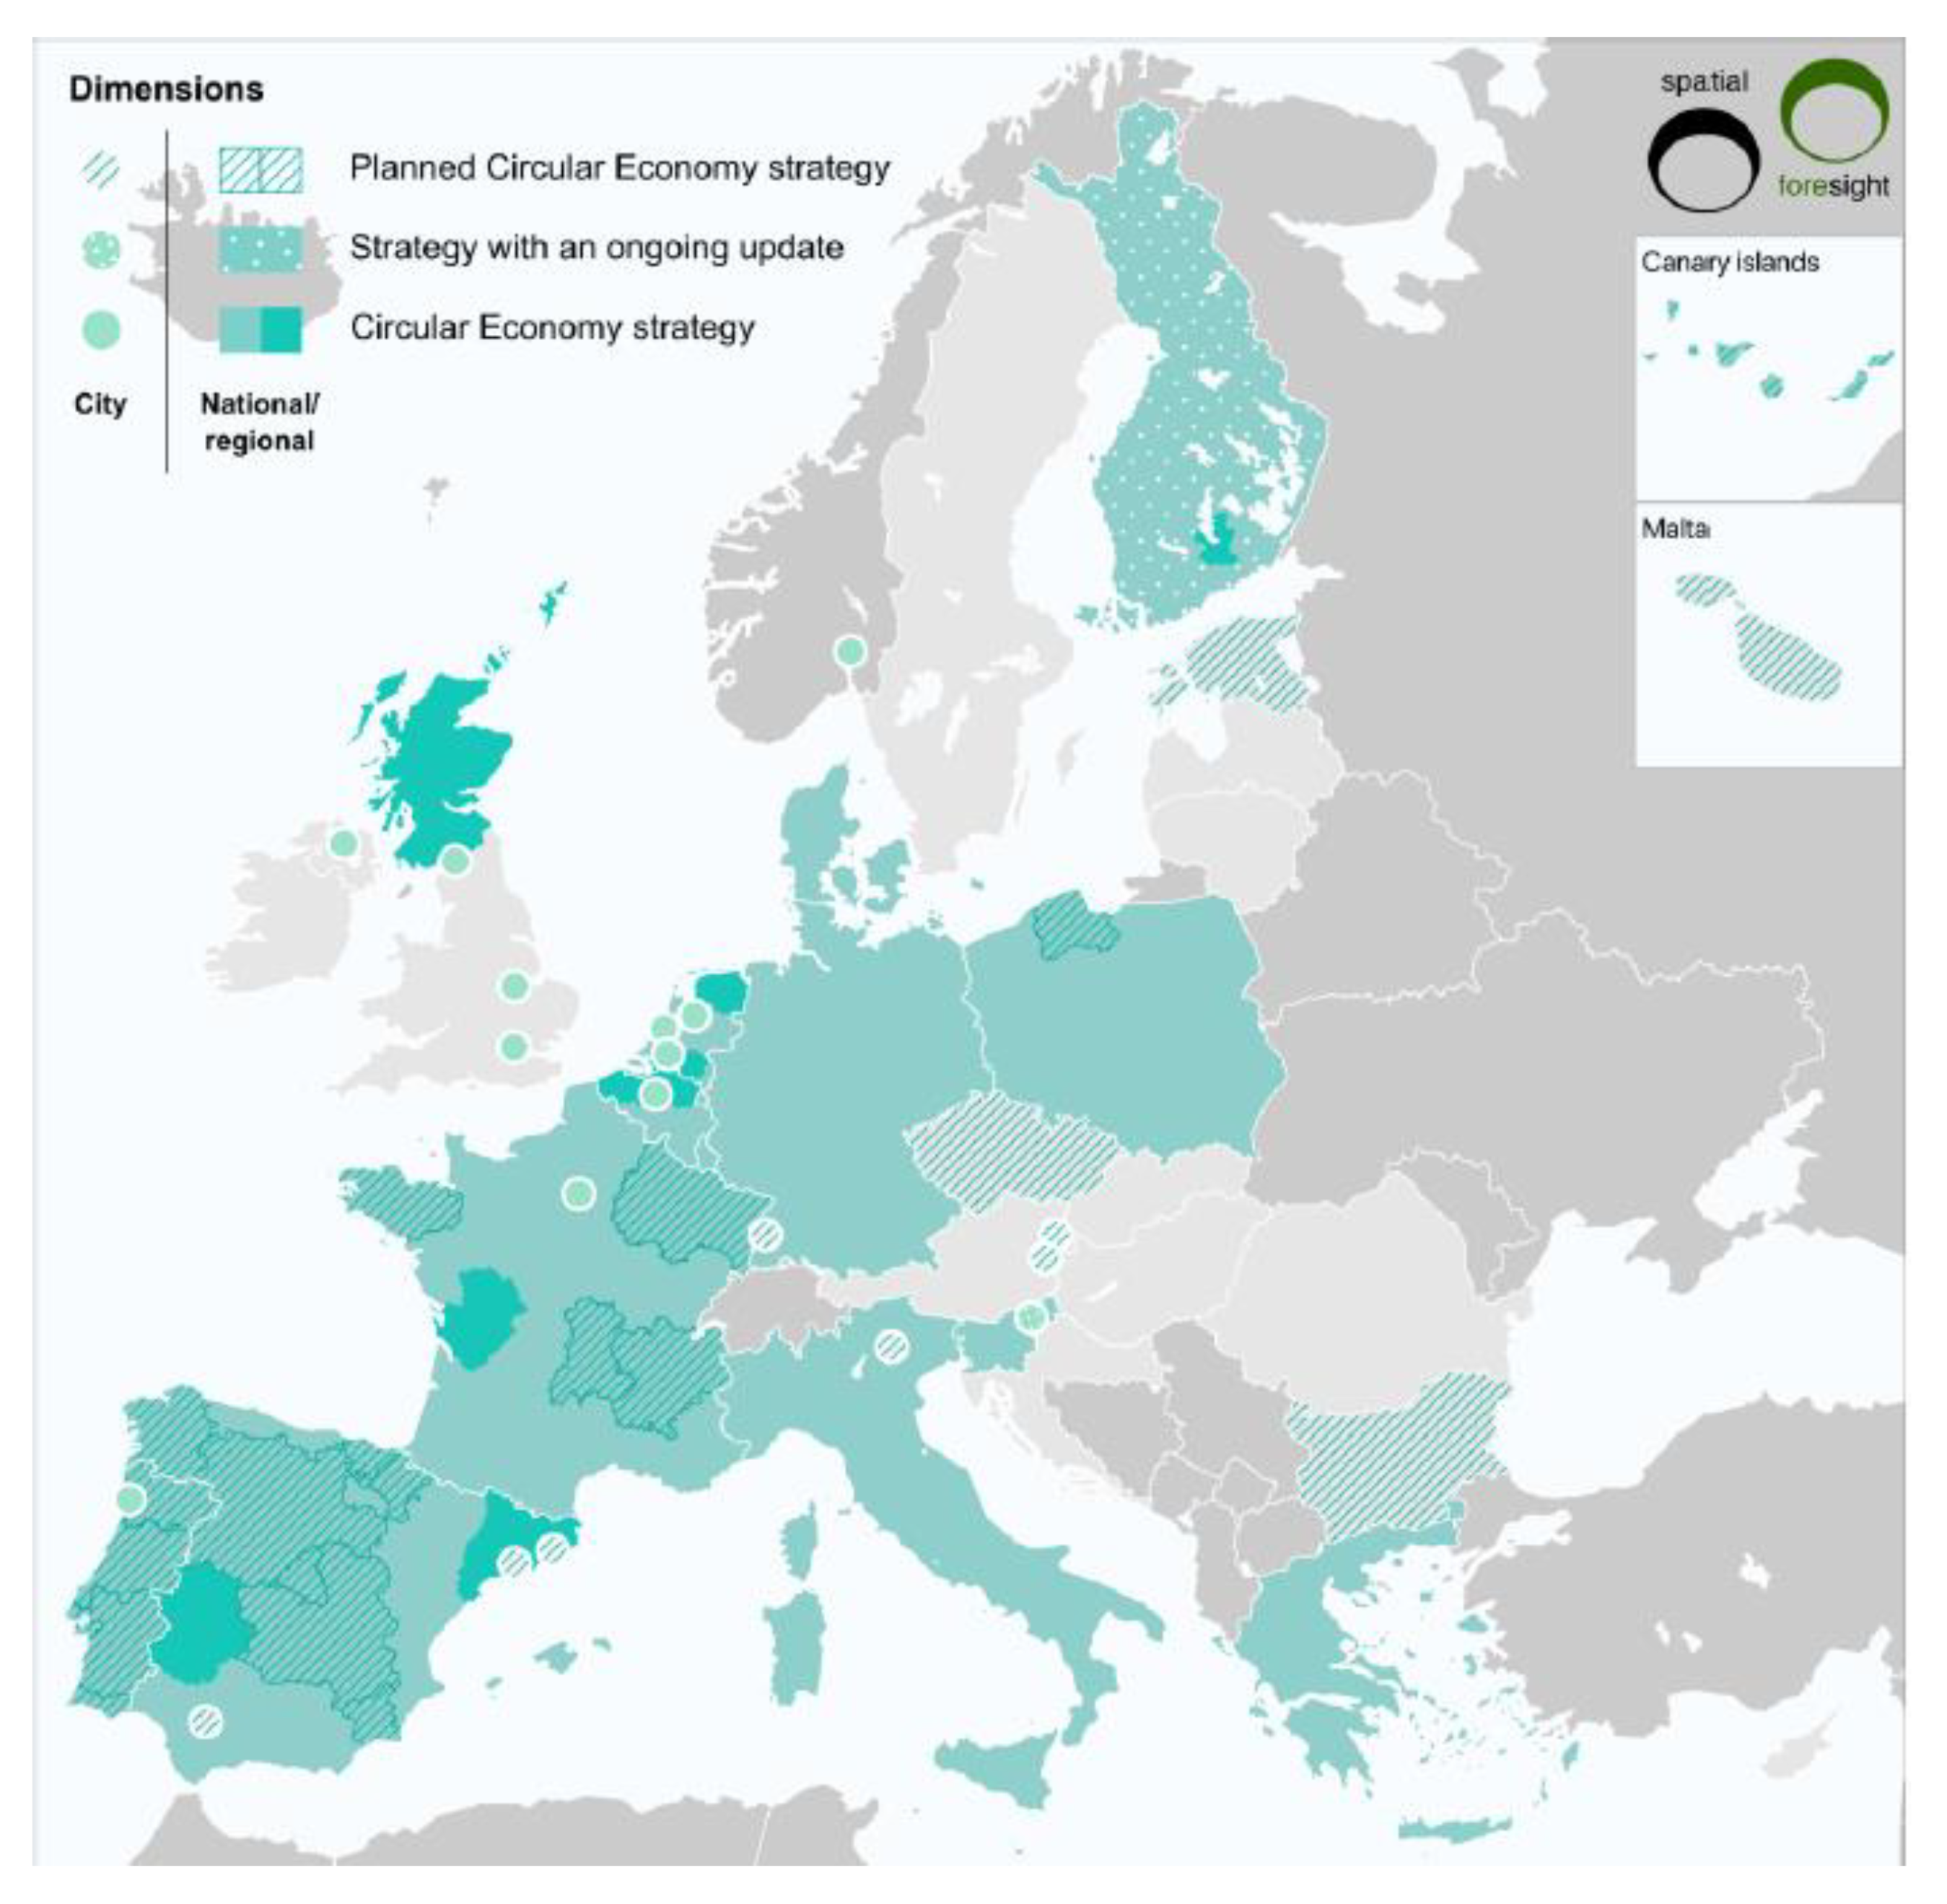
Strategies for the implementation of CE have been created all around Europe, slightly more in the north and west of Europe. Currently, more national strategies exist than regional and local ones, which all focus fully on urban areas. This gap will decrease attending the number of initiatives at a regional and local scale being created currently, especially in Portugal and other southern European countries. At the beginning of 2019, at least 29 new strategies were under development, ideally bringing the total number of strategies to over 60 by the end of the year [19]. An overview of current and prearranged CE strategies in Europe is shown in Figure 1, taken from (Salvatori et al. (2019) [19].
At the nations level, most of the initiatives were being developed in Central and Eastern Europe. Focusing on regional appliance, the southern countries had the most initiatives.
Only documents exhorting CE directly, and with CE at the core of their objectives, were used in this analysis. There are other documents that, although they do not address CE as the main focus, still include measures that secondarily can contribute to a CE. And in Europe, many countries are being dynamic in the field of CE without creating and raising one strategy [19].
4. Portuguese Case Study
Portugal is not an exception with regard to how a linear economic model can lead to unsustainable development. Multiple reasons have driven the adoption of the CE in Portugal. Historically, the Portuguese economy has a slow metabolism, with a trend to be an accumulative economy, extracting and importing more raw materials than the amount of goods it exports, accumulating stock in resources [20]. Portugal’s current vision focuses on the development of strategies focused on the optimization and reutilization of the most important materials for the nation, maximizing their value (for the longest time possible), and using renewable sources of energy, while increasing the quality of life and producing employment [20]. This new vision will reformulate the economy from a form that is linear, fossil fuel-based, unsustainable, and intense in terms of the consumption of resources and heavy production of wastes, to a circular form, reducing the anthropogenic impacts on the environment, while contributing to a sustainable development of the economy and society.
At the end of 2017, Portugal approved the APCE (Action Plan for Circular Economy), a strategic model of growth and investment founded on the efficient usage of resources and on diminishing environmental effects. APCE’s origin lies on international arrangements and deals, such as the Paris Agreement, the Sustainable Development Goals, and continuous settlements with the European Union. The plan presents three levels of action: (i) national cross-cutting actions that consolidate some of the actions of several governmental areas for this transition; (ii) sectoral agendas, especially for sectors that are more resource-intensive and export-oriented; and (iii) regional agendas, which should be adapted to the socio-economic specificities of each Portuguese region [20]. In these regional agendas, local participation will be endorsed, either by municipalities, intermunicipal communities, or metropolitan areas. These entities should adapt the guidelines of CE within their scope and to the best of their abilities. On this level of action, CE converges with the valorization of the territory, having taken into account the work of regional agendas in some regions, but also emerging topics in the national and European context.
Action plans for a circular economy recently created a need for characterization of the regional economic metabolism to be included in the new regional agendas, without giving regional communities the proper means to develop this work. There are few models available to calculate and represent the material flows for a region, however, they either don’t allow the inclusion of more than one region, or they are not prepared to account for a large number of material categories. In this context, a model was developed to assess the urban metabolism of a region, with the main objective of supplying information that allows to: (i) promote the circular economy of the region; (ii) promote a “smart” region (i.e., resource efficient); and (iii) promote investment.
The concept of regional economic metabolism is supported by the analogy between the consumption of resources and the production of waste by the socioeconomic system (economic metabolism), and the metabolism of living beings and ecosystems (ecological metabolism). This means that the metabolism is characterized by a set of inflows and outflows of materials, energy, and water, as well as consumption, use and storage. The quantification and subsequent analysis of these flows allows for the identification of synergies between the consumption needs of economic activities and the availability of materials to integrate productive cycles, identifying economically profitable opportunities for regions [21]. Taking resource inputs, extractions, and imports into account, as well as analyzing outputs, such as exports and emissions in the environment, is a fundamental need in efficient resource conservation planning. Indicators associated with the regional economic metabolism make it possible to identify inefficient use of natural resources and energy. These indicators are important tools in monitoring and developing measures to improve resource management, the development of a circular economy, and to promote territorial and industrial symbiosis. In addition, they provide an integrated view of the movement of materials through the economy, which is important for regional socio-economic development.
In this context, the REMET-UA model, version 1.0, was developed by Department of Environment and Planning of the University of Aveiro. The model makes it possible to identify feasible and logistic opportunities for the efficient use of resource between regional agents, based on the knowledge of quantities of material and sub-products in each location. The REMET-UA model provides an economic analysis of material flows based on the methodology defined by Eurostat [22], and has been developed according to three prerequisites: (i) scale, the model can be adapted to any spatial scale (region, city, municipality, etc.); (ii) supported by the Microsoft Excel format, in order to guarantee the application of the model through an intuitive, user friendly, and linear interface for the user (interoperable model); and (iii) interregional interactions, which means that the model quantifies the interactions between NUTS (Nomenclature of Territorial Units for Statistics) III sub-regions, representing them according to the user’s needs.
Six principles were fundamental while developing the REMET-UA model: (a) focused (specific material flow analysis to seek opportunities of circularity); (b) scalable (capable of adapting to any territorial scale and flexible to alterations according to user needs); (c) participative (implementable with help from regional agents); (d) evolutionary (to allow its evolution since the first phase of development); (e) interpolated (developed in Microsoft Excel, allowing ease of use and integration with other tools): (f) regionalized (ready to have into account interactions between NUTS III sub-regions).
In addition, the model was developed in a participatory way, allowing, on one hand, the involvement of regional actors in the collection of information, and on the other, the dissemination of concepts and the promotion of a collaborative spirit for future developments.
This model makes it possible to graphically represent the inputs and outputs of the economy of a region, and to gauge basic indicators set from the Eurostat methodology, calculating the materials that are stored or wasted, and which can lead to new opportunities. The general categories divide themselves between biomass (including 34 sub-categories), metal ore (including 13 sub-categories), non-metallic ore (including 10 sub-categories), fossil fuels (including eight sub-categories), industry (including 15 sub-categories), health (including two sub-categories), waste (including nine sub-categories), water (including one sub-category), and others (including two sub-categories). Each of these general categories includes various sub-categories adapted to the information obtained, providing more detailed data about the general categories. The model is flexible and allows adaptation to any territorial scale, and for the user to add new categories according to need and the availability of data.
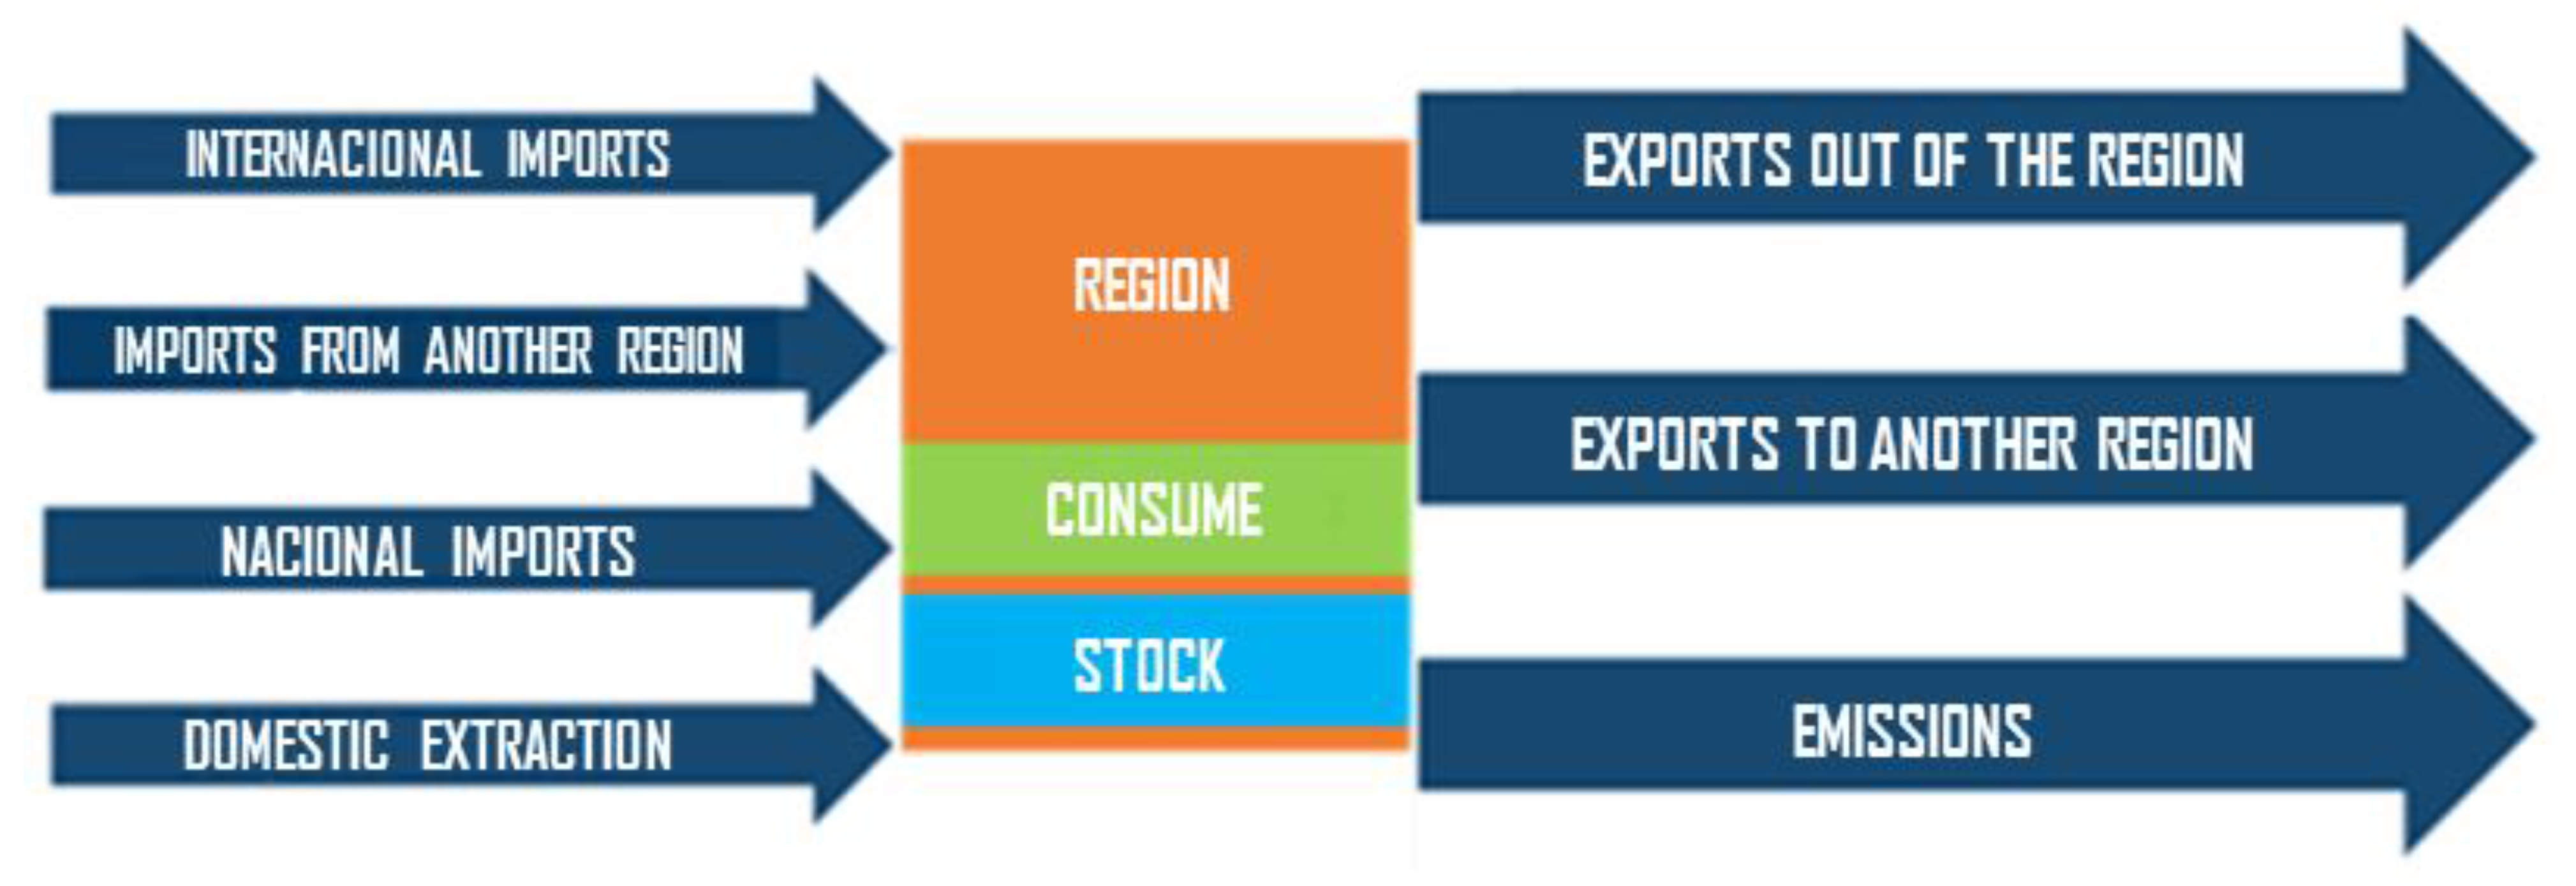
Analyzing and promoting spatial disaggregation is essential to define the average reference values and the origins of goods and products, internal flows in the various production and processing chains, and internal consumption and outputs of goods and products of the region, as well as to identify the relevant sectors in terms of consumption, and the strategic sectors for the development of the region. In a case where the approach is to be made in a European region, member states can use the geocode standard of the Nomenclature of Territorial Units for Statistics (NUTS), specifically NUTS III, because at this level, large areas are subdivided mostly into subregions, districts, or provinces. The main constraints of this phase are that the available information is very scattered, not detailed, with variable degrees of confidence, few data available at the NUTS III level (or with more detail), and a high time required for the collection of information (not systematized) in different entities. The model considers as inputs imports and domestic extractions, the respective exports, environmental emissions (that includes landfill waste, wastewater, atmospheric emissions), and internal resource consumptions, calculating the materials in stock inside the system boundaries/domain. Figure 2 shows the conceptual scheme of the material flows that are in the basis of the REMET-UA model.
The model, in its current version, uses a mass balance to calculate inputs and outputs of a study area (Figure 2), and makes it possible for the user to calculate and represent the interactions between sub-regions in an intuitive way.
4.1. Data Gathering and Good Practices
The model provides a quantitative and qualitative analysis, aiming to offer an integrated vision for the movement of material flows between economies, relevant for the development of a socioeconomic regional metabolism. For quantitative analysis, the model calculates the base indicators considered in Eurostat methodological guide. The indicators make it possible to identify the inefficient use of natural resources and energy, with measures to improve the management of resources. These indicators [23], both in total value and per capita, are:
- Direct Material Input (DMI)—represents the direct input of materials to the economy;
- Domestic Material Consumption (DMC)—represents the total quantity of material used directly in the economy;
- Domestic Processed Output (DPO)—measures the total quantity of materials released into the environment after use. Includes waste for landfill and atmospheric emissions;
- Net Additions to Stock (NAS)—measures the physical growth rate of an economy by the difference between new materials added and material removed after their use;
- Physical Trade Balance (PTB)—defines the difference between physical imports and physical exports
The first phase of approaching the development of a regional economic metabolism is to collect, treat, and operate data of activities and products. The categories and themes of collection were identified according to the information available. In detail, the base categories of materials used in the model are based on the Eurostat categories, adapted to the Portuguese reality according to the Portuguese Institute of Statistics (INE), and other statistical databases (PORDATA). The model is developed in such a way that the categories can be altered and adapted by the user to attend to specific demands and the availability of the input data. The data collection technique to feed the database consisted of a general and comprehensive documentary analysis, applying expeditious and intuitive research tools, using, as an instrument of online data collection, the analysis of the main clusters, regional management entities, companies in the region, and annual statistical and economic reports. It is also worth noting and anticipating the difficulty of obtaining data for feeding the model, that it was developed to be applied according to the available information, allowing its constant updating (evolutionary model); however, the quality of the results is proportional to the quantity and quality of the input data of the model.
4.2. REMET-UA: Outcomes
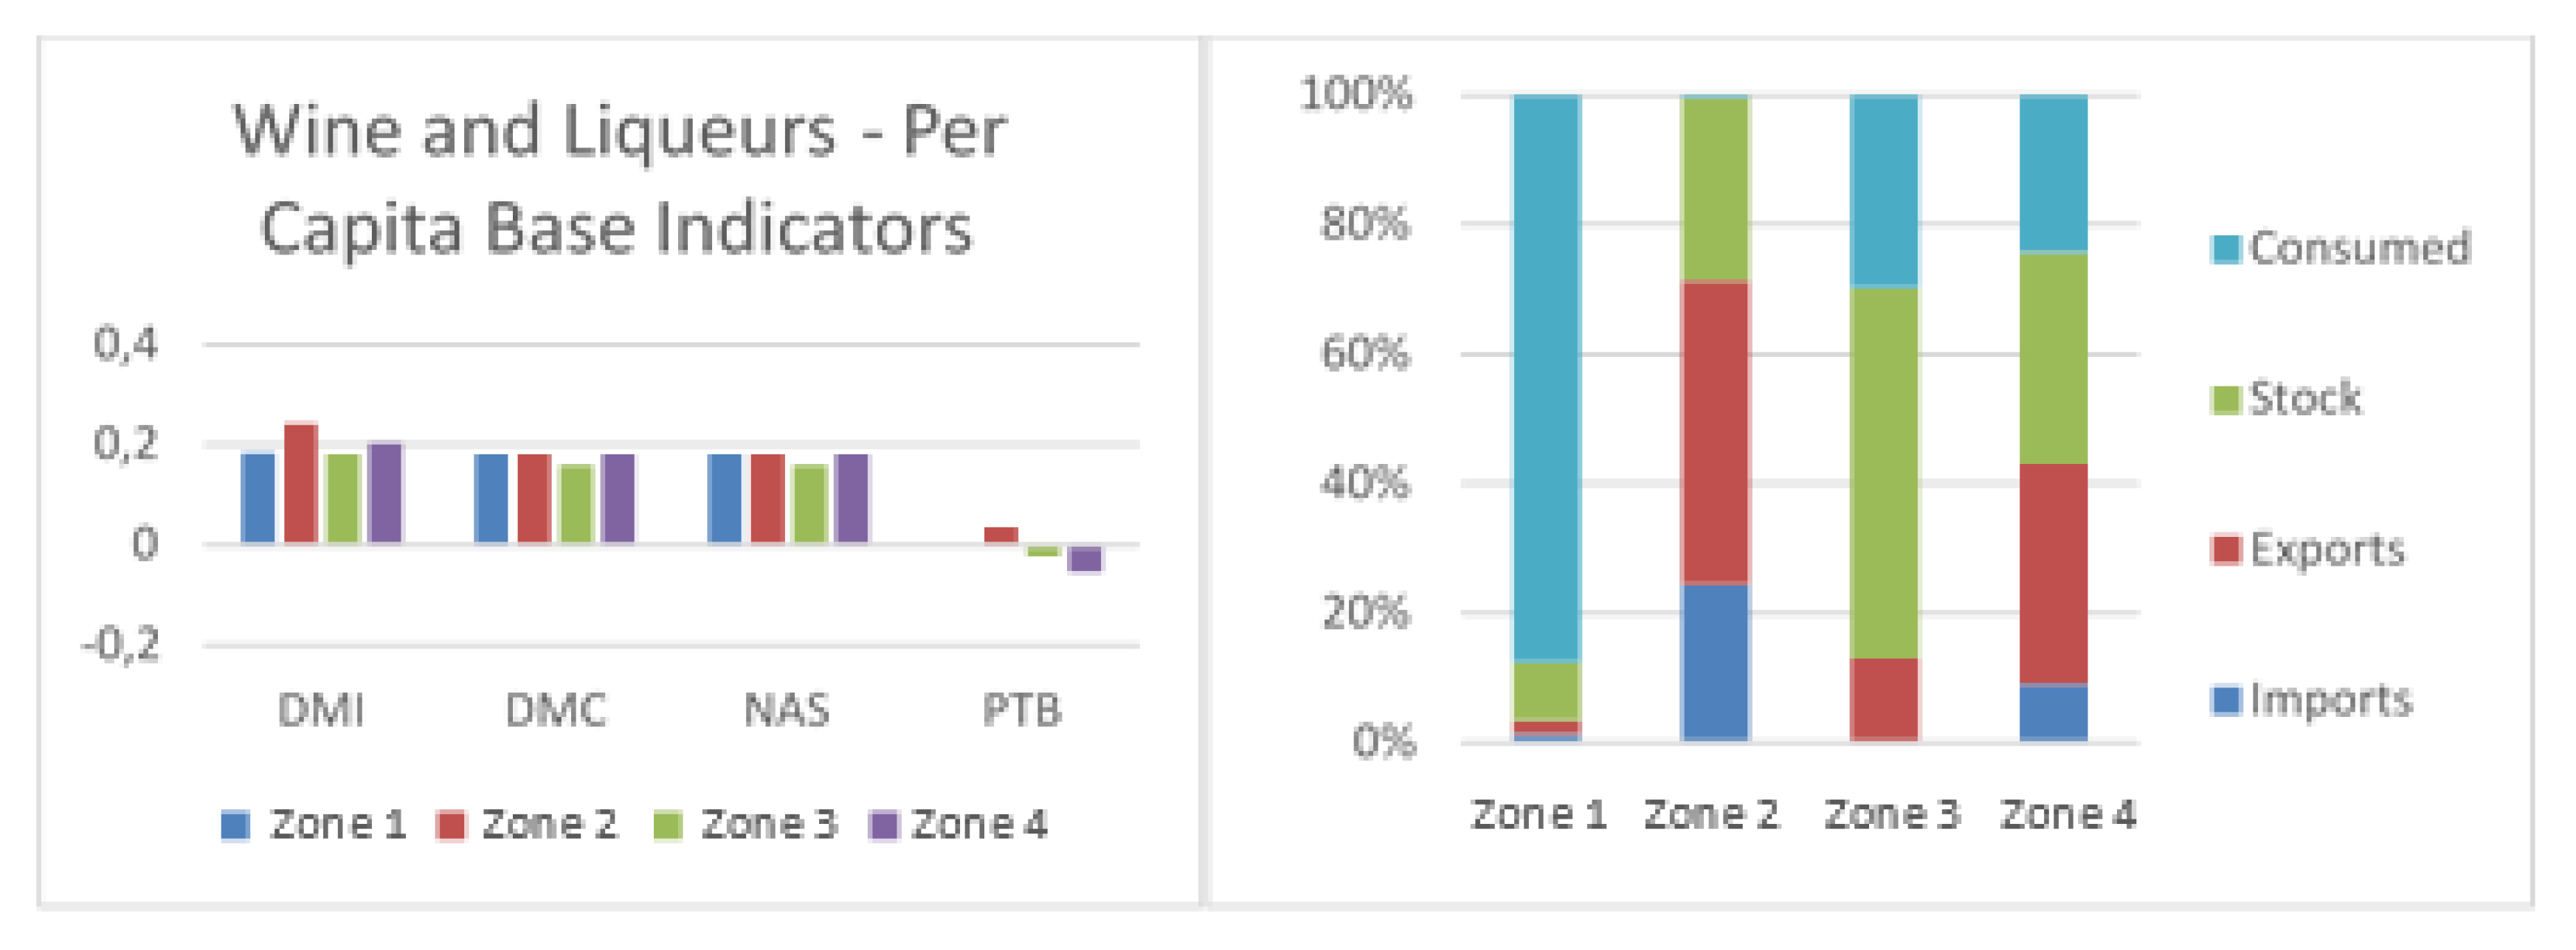
The model represents the results in various graphical forms, allowing for an immediate and intuitive qualitative analysis that will provide visual representations of the distribution of inputs, outputs, and stock of each region, and information by material category for region’s inputs and outputs (Figure 3). REMET-UA further makes it possible to represent all the results for all of the material categories, and/or for one category, chosen by the user. In this way all graphical representations can be altered to accommodate the user’s needs.
Figure 3, on the left, shows the indicators DMI, DMC, NAS, and PTB, per capita, for different regions, for a specific category (in this case, “Wine and liqueurs drinks”), chosen by the user. On the right, Figure 3 shows the economic distribution ratio of that category for each region. These types of graphics provide a lot of information about the economic status of a product. Regional entities or enterprises can utilize this type of information to make more reasonable decisions about the production or sale of their products, and to seek market opportunities in the region or for the export of a product.
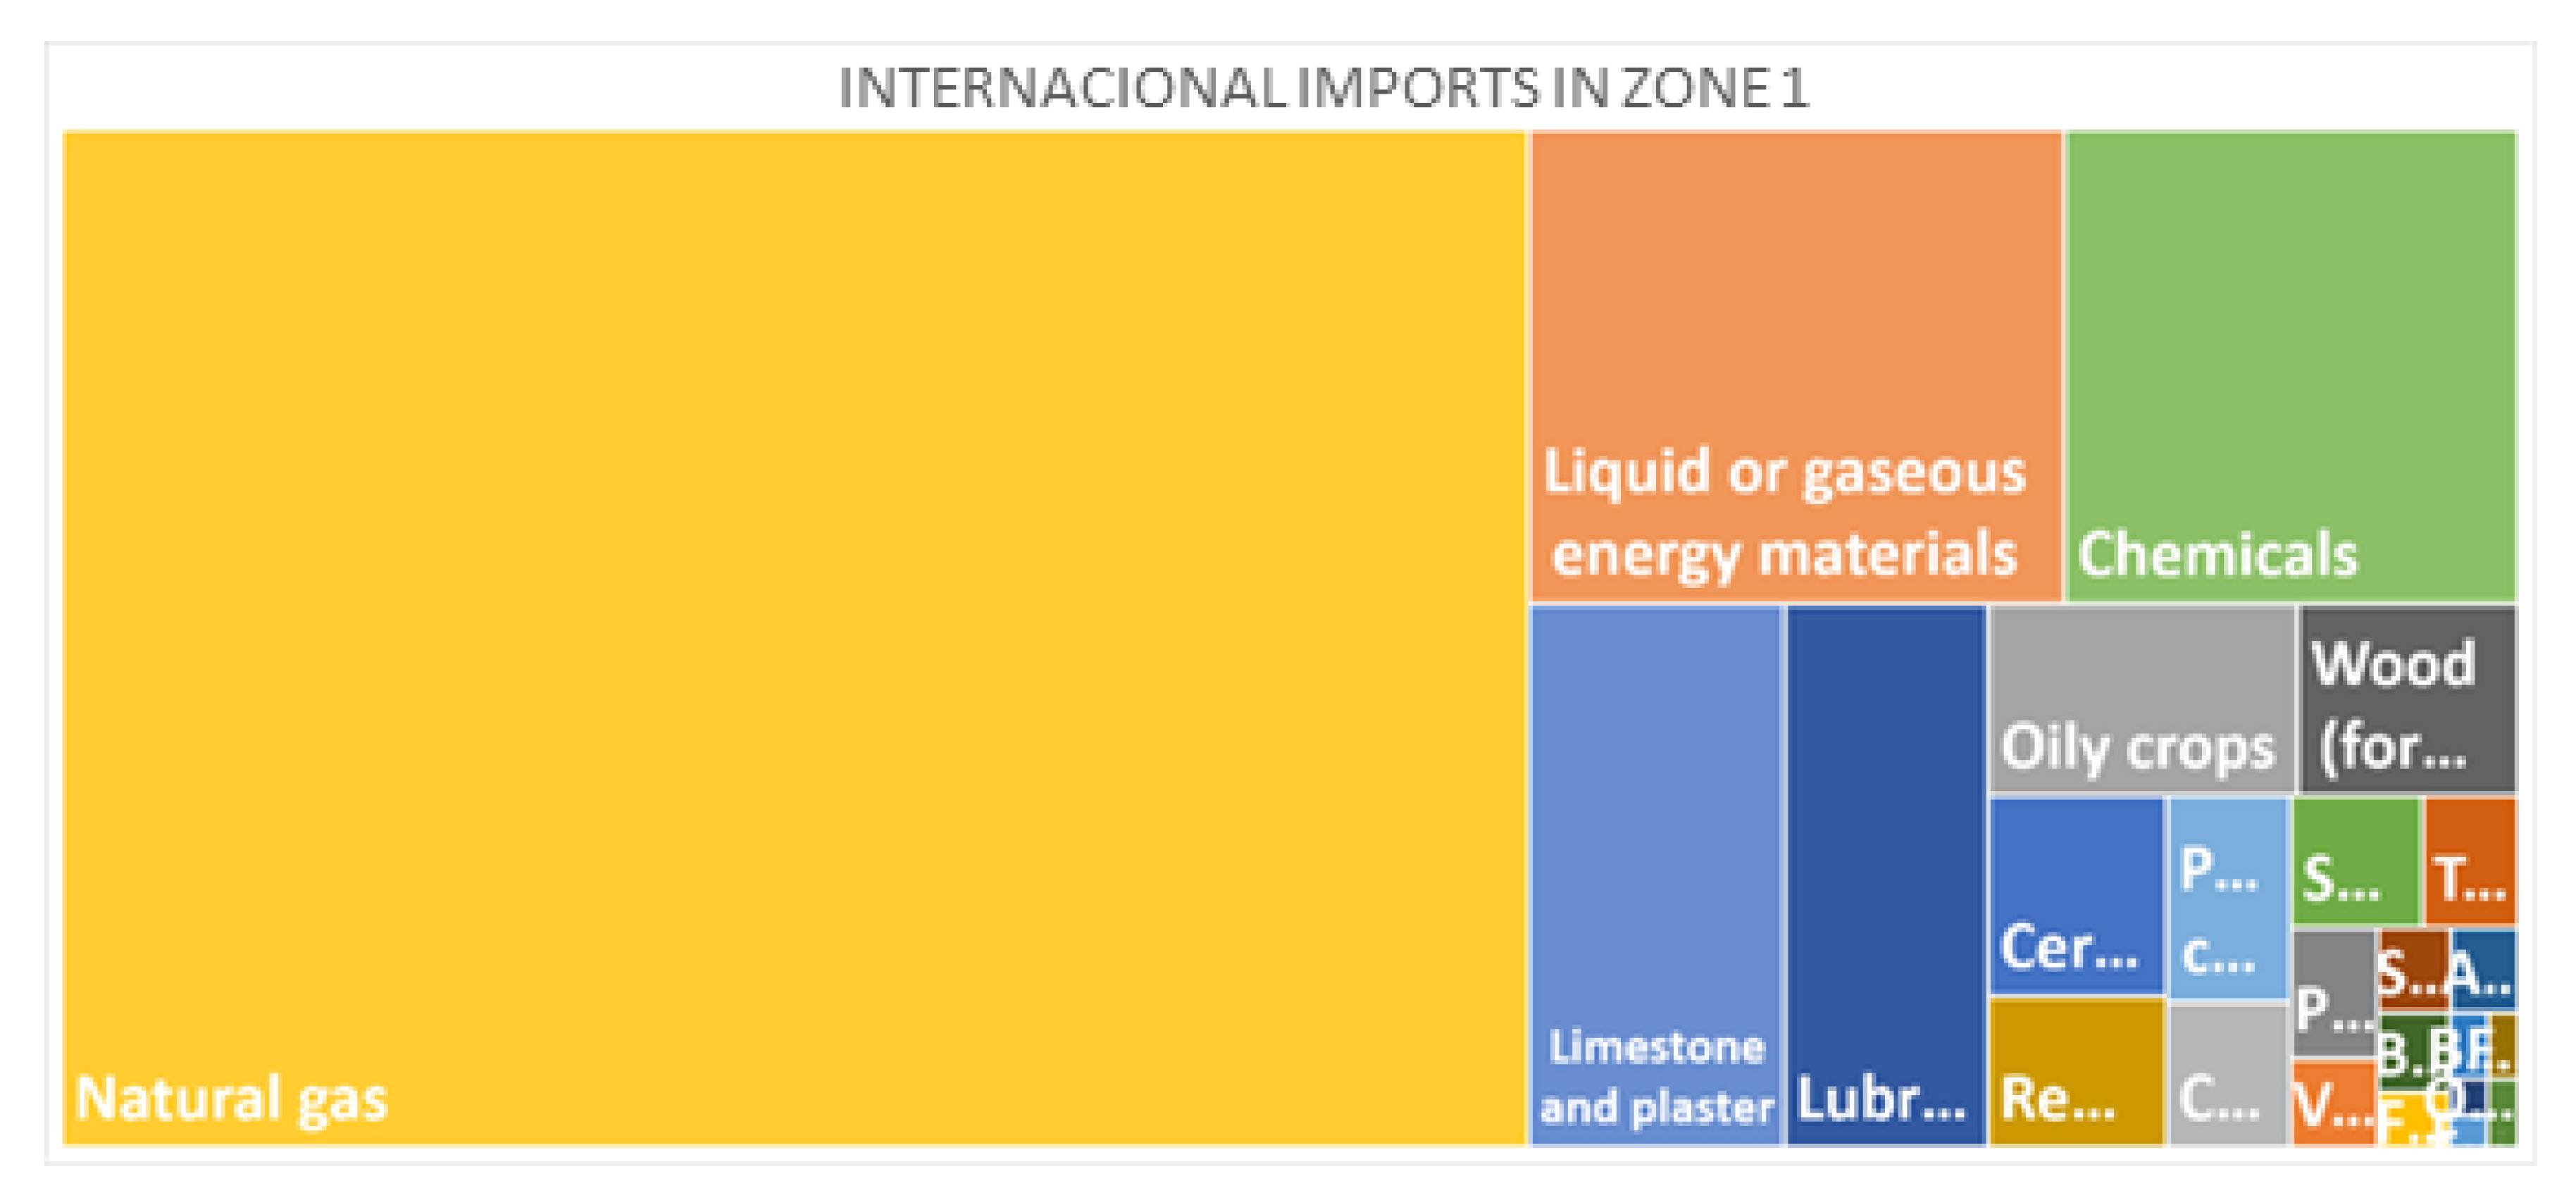
Figure 4 shows an innovative way to graphically present the results, demonstrating a vision of the international imports of a NUT III region and promoting an integrated view of more specific flows of materials for this region. The same can be done to national imports, domestic extraction, and exports and to other regions. This graphics were specially made for policymakers because it makes it possible, in a simple format, to understand the majority of products that contribute to that type of economic relationship.
This graphical adaptability presented by the REMET-UA model can be a useful tool for administrative services and policy makers, since it offers them an easier and simplified overview of economic flows between small scale territories, offering a unique functionality that distinguishes it from other models.
4.3. Main Advantages, Limitations, and Future Developments of REMET-UA
Currently, the REMET-UA model is operational, although it will always be data dependent. When fully operational, it makes it possible to identify business opportunities and circularity potential within the NUT III regions, while still representing the connection between different regions. It has a user-friendly interface and allows for user made personalization.
In terms of limitations, at this time REMET-UA does not yet include processes, so the way the input data is organized is crucial for good functioning. In this sense, the quality and quantity of necessary data to feed the model is very important to obtain trustworthy results, which is a common aspect of all models of material flow analysis. In Portugal, as in the rest of the world, systematized data collection is a difficult process to reconcile with research. If, on one hand, the compiled data is scarce and difficult to access, on the other hand, the existing data sometimes is not available in the quantity desired, and not in the level of detail necessary for the purpose intended. It is also important to mention that, as we increase the level of detail of information (e.g., going from a national to a regional scale), it gets harder for the data to be available, especially in the NUTS III scale, as was found during our work around the case study. Another disadvantage is that data driven metabolism models like REMET-UA are very heavy on time consuming activities, such as the collection of information to build the database to run the model.
Regarding further developments of the model, the next step will be to start including processes on REMET-UA to increase the level of detail in the model, and to consequently raise the quality of results provided. The higher the level of detail in REMET-UA, the more credible and closer to reality REMET-UA results will be. The next stage will be to find a partnership with industries to develop and work together with them to start building the first process, while working on the region’s metabolism. These partnerships will result in improvements and refinements to the model, while at the same time increasing its level of complexity.
5. Conclusions
The term “Urban Metabolism” emerged in the late sixties, but interest in this topic only really started to really reappear in the 1990s. Since then, a lot of research and development has been done, and technological advances led, most recently, to some studies in terms of modeling approaches.
Not only the terms have evolved—legislation, regulation, strategies, and action plans at international and national levels have also been developing in recent years. These measures have been accelerating the transition to CE, especially in the EU. Monitoring is a fundamental part in this growing process all around Europe.
In Portugal, and with climate and environmental European policies being an active influence, an action plan for CE was created and approved. This action plan included various levels of actions, one regarding regional agendas, which should include a characterization of the regional economic metabolism. Proper means for the characterization were not given and therefore, a knowledge gap was found. REMET-UA was created to fight back this gap, allowing, through modeling, for the illustration of the economic metabolism of a given region. Since the REMET-UA model was developed according to the “evolutionary” principle, its main limitation, detailed information at the NUTS III level, constitutes its main asset. The quality of the results and conclusions inherently have a higher degree of certainty the greater the level of detail of the data provided. In its current version, the REMET-UA model includes inputs (extractions and imports), consumption, outputs (exports and atmospheric emissions, and waste). The indicators associated with regional economic metabolism, calculated by the model, make it possible to identify the inefficient use of natural resources and energy, and therefore they present themselves as essential tools for monitoring and developing measures that promote the circularity of materials and their sustainable use. In addition, these indicators provide an integrated view of the movement of material flows in the economy, crucial for regional socio-economic development.
Concerning the future, REMET-UA will continue to be developed, and the next version is projected to be more detailed, more correct and representative, and will be more process-based to approximate reality.
Author Contributions
A.S.: Writing—Original draft preparation, Conceptualization, Methodology; B.A.: Software; Writing—review and editing; S.R.: Writing—review and editing; J.R.: Software; Data curation; M.L. Reviewing and Editing; Supervision; S.C.: Supervision; C.B.: Reviewing and Editing; Supervision. All authors have read and agreed to the published version of the manuscript.
Funding
This research received no external funding.
Acknowledgments
Thanks are due for the financial support to CESAM (UID/AMB/50017/2019), to FCT/MCTES through national funds, and the co-funding by the FEDER, within the PT2020 Partnership Agreement and Compete 2020. The authors also want to acknowledge the support and the partnership with the Regional Coordination and Development Commission of Alentejo (CCDR-Alentejo). This work is an extension of the work presented at ICEER2019 and published in Energy Reports.
Conflicts of Interest
The authors declare no conflict of interest.
References
- Korhonen, J.; Nuur, C.; Feldmann, A.; Birkie, S.E. Circular economy as an essentially contested concept. J. Clean. Prod. 2018, 175, 544–552. [Google Scholar] [CrossRef]
- Ellen Macarthur Foundation. Towards the Circular Economy, 1st ed.; Ellen Macarthur Foundation: Cowes, UK, 2013. [Google Scholar]
- Pearce, D.W.; Turner, R.K. Economics of natural resources and the environment. Am. J. Agric. Econ. 1990, 73, 227–228. [Google Scholar]
- Ghisellini, P.; Cialani, C.; Ulgiati, S. A review on circular economy: The expected transition to a balanced interplay of environmental and economic systems. J. Clean. Prod. 2016, 114, 11–32. [Google Scholar] [CrossRef]
- Geissdoerfer, M.; Savaget, P.; Bocken, N.M.P.; Hultink, E.J. The Circular Economy—A new sustainability paradigm? J. Clean. Prod. 2017, 143, 757–768. [Google Scholar] [CrossRef] [Green Version]
- Andersen, M.S. An introductory note on the environmental economics of the circular economy. Sustain. Sci. 2007, 2, 133–140. [Google Scholar] [CrossRef]
- European Commission. Closing the Loop—An EU Action Plan for the Circular Economy, 1st ed.; European Commission: Brussels, Belgium, 2015. [Google Scholar]
- Schroeder, P.; Anggraeni, K.; Weber, U. The Relevance of Circular Economy Practices to the Sustainable Development Goals. J. Ind. Ecol. 2019, 23, 77–95. [Google Scholar] [CrossRef] [Green Version]
- Wolman, A. The Metabolism of Cities. Sci. Am. 1965, 213, 179–190. [Google Scholar] [CrossRef]
- Kennedy, C.; Cuddihy, J.; Engel-yan, J. The Changing Metabolism of Cities. J. Ind. Tecnol. 2007, 11, 43–59. [Google Scholar]
- Kennedy, C.; Pincetl, S.; Bunje, P. The study of urban metabolism and its applications to urban planning and design. Environ. Pollut. 2011, 159, 1965–1973. [Google Scholar] [CrossRef] [PubMed]
- Maclaren, V. Developing Indicators of Urban Sustainability: A Focus on the Canadian Experience, 1st ed.; ICURR Press: Toronto, Canada, 1996. [Google Scholar]
- Kalmykova, Y.; Rosado, L. Urban Metabolism as Framework for Circular Economy Design for Cities. In Proceedings of the World Resources Forum 2015, Davos, Switzerland, 11–14 October 2015. [Google Scholar]
- Barles, S. Urban metabolism of Paris and its region. J. Ind. Ecol. 2009, 13, 898–913. [Google Scholar] [CrossRef]
- Zhang, Y. Urban metabolism: A review of research methodologies. Environ. Pollut. 2013, 178, 463–473. [Google Scholar] [CrossRef] [PubMed]
- Wang, R.; Li, F.; Hu, D.; Larry Li, B. Understanding eco-complexity: Social-Economic-Natural Complex Ecosystem approach. Ecol. Complex. 2011, 8, 15–29. [Google Scholar] [CrossRef]
- Rosado, L.; Niza, S.; Ferrão, P. A Material Flow Accounting Case Study of the Lisbon Metropolitan Area using the Urban Metabolism Analyst Model. J. Ind. Ecol. 2014, 18, 84–101. [Google Scholar] [CrossRef]
- European Commission. Communication on a Monitoring Framework for the Circular Economy, 1st ed.; European Commission: Brussels, Belgium, 2018. [Google Scholar] [CrossRef]
- Salvatori, G.; Holstein, F.; Böhme, K. Circular Economy Strategies and Roadmaps in Europe: Identifying Synergies and the Potential for Cooperation and Alliance Building—Study, 1st ed.; European Economic and Social Committee: Brussels, Belgium, 2019.
- FCT. Agenda Temática de Investigação e Inovação: Economia Circular, 1st ed.; FCT: Lisbon, Portugal, 2019. [Google Scholar]
- Regional Coordination and Development Commission of the Center. Action Plan and Regional Agenda for Alentejo’s Circular Economy—Study for the Regional Economic Metabolism Analysis. Available online: http://www.turismo.gov.br/sites/default/turismo/programas_acoes/qualificacao_equipamentos/galeria_qualificacoees_equipamentos/Relatorio_Iguacu.pdf (accessed on 1 March 2020).
- European Commission. Economy-Wide Material Flow Accounts and Derived Indicators: A Methodological Guide, 1st ed.; Office for Official Publications of the European Communities: Luxembourg; Brussels, Belgium, 2001.
- Silva, A.; Augusto, B.; Rafael, S.; Reis, J.; Lopes, M.; Costa, S.; Borrego, C. Analysis of regional economic metabolism through modelling. Energy Rep. 2020, 6, 102–107. [Google Scholar] [CrossRef]
Figure 1.
Overview of circular economy strategies (planned, updated and on-going) in Europe (Salvatori et al., 2019) [19].
Figure 1.
Overview of circular economy strategies (planned, updated and on-going) in Europe (Salvatori et al., 2019) [19].

Figure 2.
Conceptual scheme of material flows considered in the REMET-UA model [23].
Figure 2.
Conceptual scheme of material flows considered in the REMET-UA model [23].

Figure 3.
Examples of graphic representations produced by REMET-UA model [23].
Figure 3.
Examples of graphic representations produced by REMET-UA model [23].

Figure 4.
Graphical example of the international imports calculated by REMET-UA mode [23].
Figure 4.
Graphical example of the international imports calculated by REMET-UA mode [23].


Table 1.
Description of the main urban metabolism simulation methods (Zhang, 2013) [15].
Table 1.
Description of the main urban metabolism simulation methods (Zhang, 2013) [15].
| Type of Model | Approach |
|---|---|
| Ecological Dynamics | Characterize causal-effects to analyze trends in chronological order to simulate the progress tendency of the urban metabolic system |
| Ecological Network Analysis | Through the quantification simulation of flows the system structure and interim relations are built |
| Input-output Analysis | Linking economic aspects with the materials and energy flow in order to build an input-output table |
| Process Analysis | Life-cycle analysis from cradle to grave |
© 2020 by the authors. Licensee MDPI, Basel, Switzerland. This article is an open access article distributed under the terms and conditions of the Creative Commons Attribution (CC BY) license (http://creativecommons.org/licenses/by/4.0/).
Share and Cite
MDPI and ACS Style
Silva, A.; Augusto, B.; Rafael, S.; Reis, J.; Lopes, M.; Costa, S.; Borrego, C. Modelling of Regional Economic Metabolism. Climate 2020, 8, 52. https://0-doi-org.brum.beds.ac.uk/10.3390/cli8040052
AMA Style
Silva A, Augusto B, Rafael S, Reis J, Lopes M, Costa S, Borrego C. Modelling of Regional Economic Metabolism. Climate. 2020; 8(4):52. https://0-doi-org.brum.beds.ac.uk/10.3390/cli8040052
Chicago/Turabian StyleSilva, Afonso, Bruno Augusto, Sandra Rafael, Johnny Reis, Myriam Lopes, Sérgio Costa, and Carlos Borrego. 2020. "Modelling of Regional Economic Metabolism" Climate 8, no. 4: 52. https://0-doi-org.brum.beds.ac.uk/10.3390/cli8040052
Note that from the first issue of 2016, this journal uses article numbers instead of page numbers. See further details here.