Article

Robustness of the Link between Precipitation in North Africa and Standard Modes of Atmospheric Variability during the Last Millennium

Georges Lemaître Centre for Earth and Climate Research (TECLIM), Earth and Life Institute, Université catholique de Louvain (UCLouvain), 1348 Louvain la Neuve, Belgium
*
Author to whom correspondence should be addressed.
Submission received: 9 March 2020 / Revised: 30 April 2020 / Accepted: 1 May 2020 / Published: 6 May 2020
(This article belongs to the Special Issue From Local to Global Precipitation Dynamics and Climate Interaction)

Abstract

:
Drought is a recurring phenomenon in North Africa, and extended dry periods can have a serious impact on economic and social structures, as well as the natural environment. Consequently, understanding the mechanisms that underlie precipitation variability in the region is a key driver of sustainable economic growth in activities such as agriculture, manufacturing, energy, and transport. North Africa’s climate differs significantly between coastal and inland areas. The region has a Mediterranean climate along the coast, characterized by mild, wet winters and warm, dry summers with reasonable rainfall of around 400 to 600 mm per year. The link between winter precipitation variability in this region and atmospheric patterns is assessed here using several gridded datasets of observations and reanalysis as well as model simulations from the fifth phase of the Coupled Model Intercomparison Project (CMIP5) and the third phase of the Paleoclimate Modelling Intercomparison Project (PMIP) covering the last millennium. Results show that the link between the zonal wind index at 850 hPa (U850) and winter precipitation is stronger and more robust over time than the link with some well-known modes of variability, such as the North Atlantic Oscillation (NAO), Mediterranean Oscillation (MO), and Western Mediterranean Oscillation (WeMO). U850 better explains the interannual changes in winter precipitation variability in North Africa for the past decades as well as the last millennium. Both winter precipitation and U850 simulated time series present significant decreasing trends, associated with drier conditions, starting in the 19th century. This is in agreement with the reconstructed and simulated Palmer Drought Severity Index (PDSI), which shows a decreasing trend toward drying conditions in North Africa.

1. Introduction

North Africa is located in a transitional position between a wet European mid-latitude and a dry subtropical climate [1]. The region is characterized by a Mediterranean climate along a thin strip of land bordering the coasts of Morocco, Algeria, Tunisia, and parts of Libya and Egypt, with mild, wet winters, warm, dry summers, and rainfall of approximately 400 to 600 mm per year (Figure 1) [2]. Inland, North African countries have semi-arid and arid desert climates that regularly display extreme conditions with very hot summers, cold winters, and little rainfall, between 200 and 400 mm per year or even less in some regions [2]. The precipitation occurs mostly during the winter season (November to April) [1].
Rainfall in North Africa is characterized by high spatial and temporal variability [2], making the region particularly sensitive to water scarcity conditions. In recent decades, increased drought frequency [3] has been a major concern [4] in this region, where extended dry periods have a major impact on water availability, agriculture, and vegetation [4].
In winter, North Africa’s hydroclimate is strongly influenced by disturbances coming from the North Atlantic and controlled mostly by the action of the downward branch of the Hadley cell [1]. Additionally, the cold surface water flow associated with the Canary flow, which is a current flowing southwestward along the northwest African coast, from 30° N to 10° N, and from offshore to 20° W [5], affects mainly that coast [6].
Previous works have contributed substantially to the description of the atmospheric patterns that are related to precipitation variability in the Mediterranean basin on different timescales [7,8,9,10,11,12]. These studies have shown that a large part of the spatial and temporal variability of rainfall is closely linked to a few large-scale atmospheric modes of variability, mainly the North Atlantic Oscillation (NAO), the East Atlantic (EA) pattern, the Mediterranean Oscillation (MO), and the Western Mediterranean Oscillation (WeMO) [7,8,10]. It is suggested in [13] that the heavy precipitation events in the east of the Iberian Peninsula are linked to the NAO, MO, and WeMO negative phases. Furthermore, [14,15] showed that the increased precipitation along the Iberian Peninsula is mainly due to prevailing negative phases in the NAO and MO. More generally, the western part of the Mediterranean region is characterized by a strong anti-correlation between winter precipitation and the NAO, which is related to the transport of moisture by storm tracks [1,7,8,16]. The development of Mediterranean storminess and precipitation is indeed strongly linked to the atmospheric circulation over the Atlantic and Europe [11,13,14,15,16]. It was shown in [12] that NAO variability in winter explains up to 30% of the decadal winter precipitation changes in a region covering parts of Spain, Morocco, Southern France, Italy, and the Balkans.
Additional studies have underlined the importance of other atmospheric modes of variability, in particular the Upper-Level Mediterranean Oscillation index (ULMOi) and the East Atlantic (EA), East Atlantic/West Russia (EATL/WRUS), and Scandinavia (SCAND) patterns [17,18]. They have shown that these four teleconnection patterns have a substantial impact on the frequency of Euro-Mediterranean extreme precipitation.
Additionally, variations in zonal wind speed at the 850 hPa level explain a large fraction of the interannual changes in area-averaged Mediterranean precipitation and storminess, with stronger westerly winds (positive wind anomalies) associated with positive precipitation anomalies [19]. During the cold season (November–April), the Mediterranean region is subjected to weak atmospheric depression derived from Europe, which, together with a high-pressure zone over North Africa and the Sahara, induces a strong westerly flow [19]. The subtropical high-pressure zone over North Africa might be viewed as a side of the descending branch of the Hadley cell, which, with climate warming, is expected to enlarge poleward [16]. This phenomenon seems remarkably robust over the Mediterranean region [19], but for reasons that are still not well understood.
Analyses over the past decades have suggested that the Mediterranean drying in winter over the period 1960–1990 was due to the multidecadal variability of the NAO, with a much smaller part related to radiative forcing [12]. In contrast, [20] showed that human-induced greenhouse gas and aerosol forcing are the principal causes of winter drying in the Mediterranean region. This is confirmed by a recent study [21], which also pointed out that rainfall is more reactive to black carbon (BC) than to well-mixed greenhouse gases (WMGHGs). In addition to regional warming, BC and WMGHGs appear to reduce precipitation by inducing a sea level pressure (SLP) anomaly similar to the positive phase of NAO, with lower SLP at high latitudes and higher SLP at mid latitudes [21]. This leads to a northward movement of the jet stream and storm tracks, increasing precipitation in northern Europe while decreasing it in the Mediterranean.
Recent hydroclimate changes can be put into perspective by analyzing drought variability over the Common Era (CE, year 0–present). This has been done using a variety of proxies, including tree rings [22,23,24,25,26], sediment cores (e.g., [27,28]), and networks including various proxies [29,30,31]. Compared to other Mediterranean regions, little is known about North Africa. In [32] a reconstruction of precipitation was developed covering the past millennium in the Atlas Mountains of Morocco (a part of the mountain range in the Maghreb separating the Mediterranean and Atlantic coastlines from the Sahara Desert, reaching 2500km through Morocco, Algeria, and Tunisia). They showed that in the late 20th century, drought was exceptional in the context of the prior 500 years. A comparison between general circulation model (GCM) output and proxy-based precipitation and temperature reconstructions over the past 500 years showed that while no model accurately simulated the reconstructed changes, reasonably good agreement was found after 1650, with models taking into account changes in volcanic forcing, solar irradiance, and greenhouse gases [33].
The Old World Drought Atlas (OWDA) is a gridded (0.5° × 0.5°) reconstruction based on tree-ring data providing an estimate of the June, July, August (JJA) Palmer Drought Severity Index (PDSI) for Europe and the Mediterranean region over the past 2000 years [34]. The PDSI provides integrated information about relative dryness and wetness and is more representative of the conditions impacting tree growth than, for instance, precipitation. This is why it was chosen as the target for reconstruction over past centuries. However, in North Africa, there are few tree-ring time series included in the OWDA database. Only two time series of Cedrus atlantica (cedar) ring width data are used to recreate long-term changes in the PDSI in Morocco over the past 953 years [32].
The main goal of this study is to provide a better understanding of the variability of precipitation in the North African region over the past millennium and to compare those long-term changes with more recent ones observed over the past century. Only a few works have addressed the issue of long-term rainfall variability in this region, as most were limited to the last 20th century period. Additionally, most of that research focused on the whole of the Mediterranean basin or its northern part (Euro-Mediterranean region), with very little information specific to North Africa. The potentially different behavior in North Africa compared to the rest of the Mediterranean region justifies our focus on this important area.
In our manuscript, we divide the region of North Africa into three sub-regions (Figure 2) from west to east to take into account the potentially decreasing influence of the North Atlantic. The links between winter precipitation in sub-regions over the past millennium and the atmospheric modes of variability are separated into three periods (850–1850,1850–1950,1979–2005) to test the robustness of the correlations over time. We focus here on the NAO, WeMO, and MO indices in addition to the U850 zonal wind index introduced in [19], because a preliminary analysis showed that they are the best candidates among existing indices to explain the variability in our region of interest.
The outline of this paper is as follows: Section 2 describes the atmospheric indices, data, and methods. Section 3 discusses the links between these indices and winter precipitation variability in the North Africa region and compares model results and reconstructions over the last millennium. Finally, conclusions are given in Section 4.

2. Data and Methods

The present work is based on an analysis of winter (November to April) precipitation variability over North Africa (Figure 2) derived from observations, reanalysis, and model simulations over the last millennium. Several gridded datasets of monthly precipitation, SLP, temperature, and zonal wind speed at a pressure level of 850 were used (Table 1 and Table 2). These data were remapped to the same grid at 1° resolution and the values over the ocean were masked to only consider the land area.
The main study area is the North Africa region. This area is divided into three boxes, because the literature [13,14,15] suggests that the link between atmospheric patterns (NAO, WeMO, MO) and precipitation is highly heterogeneous in the region. The western part (left box) is mainly influenced by the North Atlantic Oscillation (NAO), which is not the case for the central part, which is found to be a transitional zone between the North Atlantic perturbations and the eastern part (right box), which is mainly under the impact of perturbations coming from the east, and the Mediterranean Oscillation (MO).
The three boxes are defined to roughly match the regions with decreasingly direct influence of perturbations coming from the North Atlantic. For simplicity and to avoid any bias that could come from a more specific choice, they have the same extent in longitude but differ in latitude to only cover the North Africa region (only land area, without the ocean in the box).

2.1. Statistical Tests

In addition to standard correlation analysis, we applied the modified Mann–Kendall test [35] and Pettitt’s test [36], two widely used nonparametric tests to detect trends and change points in time series of climatic and hydrological parameters, respectively. The modified Mann–Kendall is a variant of the Mann–Kendall test [37,38], which can be calculated by the equation:
S = i = 1 n j = 1 i 1 sign ( xi xj )
where n is the total length of data, xi and xj are sequential data values, and the function sign(x i –x j) gives the following values:
sign ( xi xj ) =   1 , if ( x 1 Xi ) > 0 0 , if ( x 1 Xi ) = 0 1 , if ( x 1 Xi ) < 0
The statistic S is approximately normally distributed with the mean E(S) and variance Var(S) computed as follows:
E ( s ) = 0 Var ( S ) = 1 / n [ n ( n 1 ) ( 2 n + 5 ) t t ( t 1 ) ( 2 t + 5 ) ]
where Σt means summation over all associated numbers of values.
In this test, the null hypothesis H0 is verified if there is no trend in a dataset of n independent randomly distributed variables of equally likely ordering. The use of this method comes with two advantages. First, it is a nonparametric test and does not require the data to be normally distributed. Second, the test has low sensitivity to abrupt breaks due to inhomogeneous time series [39].
Throughout the time series analysis, it is important to consider autocorrelation, defined as the correlation of a variable with itself over successive periods of time, before checking for trends. The modified Mann–Kendall takes account of autocorrelation, another reason to choose this statistical method.
The magnitude of the trend is estimated using Sen’s slope estimator, also called the Theil–Sen estimator. The Theil–Sen estimator of a set of two-dimensional points (xi, yi) as defined by [40] is the median m of the slopes (yjyi)/(xjxi) determined by all sample point pairs.
Pettitt’s test for change detection, developed by Pettitt [36], is a nonparametric method that is useful for detecting abrupt changes in climate records [36]. According to Pettitt’s test, x1;x2;x3,….,xn is a set of observed data that has a change point at t if x1;x2;x3,….,xt has a distribution function F1(x) that is different from the distribution function F2(x) of the second part of the sequence xt+1;xt+2;xt+3,….;xn. For this test, the nonparametric test statistics Ut can be defined as:
Ut = i = 1 t j = t + 1 n sign ( xt xj )
This test is commonly used because of its sensitivity to breaks in the middle of any time series [41]. Change point detection is also an important method to determine the period over which a significant trend has occurred in a time series [36].
In the present study, the modified Mann–Kendall test and Pettitt’s test were used in R packages to analyze precipitation, wind speed (U850), and PDSI variability in North Africa over the last millennium (850–2005).

2.2. Observation Datasets and Reanalysis

Several gridded datasets of observations and reanalysis of monthly precipitation were analyzed (Table 1). The Global Precipitation Climatology Center (GPCC) analysis V7 [42] has a resolution of 0.5° latitude by 0.5° longitude. It is based on rain-gauge data only and spans the period 1901–2005. The University of Delaware database, using high-resolution station (land) data [43], has a resolution of 0.5° latitude by 0.5° longitude and covers the period 1901–2005. The NOAA-CIRES 20th Century Reanalysis database is a global reanalysis dataset that contains objectively analyzed four-dimensional weather maps and their uncertainty from the mid-19th century to the 21st century [44].

2.3. Model Simulations

The simulations used here were performed in the framework of the Palaeoclimate Modeling Intercomparison Project (PMIP3) [45] and Coupled Model Intercomparison Project (CMIP5) [46], whose goal is to coordinate climate modelling activities performed in various centers worldwide. As indicated by their names, PMIP focuses on past periods while CMIP is devoted to the recent past and the future as well as control and sensitivity experiments. PMIP and CMIP activities are coordinated, in particular to use the same model version for analyzing past and recent conditions.
The World Climate Research Program (WCRP), which coordinated these projects, has made available a multimodel dataset intended to improve our knowledge of climate variability. The global scientific community has examined PMIP3/CMIP5 model outputs to produce results that support the Intergovernmental Panel on Climate Change (IPCC) Fifth Assessment Report (AR5; IPCC, 2013) [47].
The models used in this study are those for which the variables of interest were available at the time of analysis for both the past millennium and the past century, covering 850–1850 and 1850–2005, respectively. These models are: CCSM4, MPI-ESM-P, IPSL-CM5A-LR, GISS-E2-R, CESM1, and BCC-CSM1 (defined in Table 2).
Climate simulations covering the last millennium are driven by both anthropogenic (well-mixed greenhouse gases, ozone, tropospheric aerosols, land use) and natural (solar, volcanic, orbital) climate forcing. Forcing related to volcanic aerosols is obtained from different sources for GISS-E2-R and MPI-ESM-P [54] and the other four Global Simulation Models GSMs [55]. The input of volcanic aerosol in the stratosphere after a major volcanic eruption is known to have a major climate effect on the annual to decadal time scale, from observed and historical as well as modeling [56] studies. Observed and reconstructed changes in greenhouse gases (CO2, CH4, and N2O) driving past millennium [57,58] and historical [59] simulations are the same in all models. Both tropospheric ozone and aerosol variation are considered in historical experiments in CCSM4, CESM1, GISS-E2-R, MPI-ESM-P, and BCC-CSM1 and are based on the dataset described in [60], except in IPSL-CM5A-LR, which considers a pre-industrial aerosol concentration. See [61,62,63] for more details on the climate-forcing reconstructions used for past millennium experiments and their implementation.
The ability of CMIP5 models to explain the Mediterranean hydrological cycle during the 20th century has been investigated in detail [1,64]. Their results show that most CMIP5 models can reasonably represent the observed Mediterranean precipitation, evaporation, and moisture fluxes in winter.

2.4. Drought Index

The choice of using the PDSI [65] is mainly related to the fact that the hydroclimate related proxy-based reconstructions (such as OWDA) [34] do not directly reconstruct precipitation but rather PDSI. The PDSI incorporates precipitation and temperature and uses a provision and supply model to estimate changes in soil moisture availability over time. The index varies between negative values for dry conditions and positive values for wet conditions. Values below −4 or above +4 indicate extreme drought or wet spells, respectively [65].
Droughts in North Africa are induced by both lack of precipitation and high evaporation rates. Thus, it is important to use an index that considers soil water availability for vegetation, rather than strictly climatic variables [4,65].
In order to compare the reconstructed hydrological changes in North Africa (Morocco and Algeria, where reconstructions are available) over the last millennium (850–2005) with CMIP5 model simulations, we computed the PDSI using the MATLAB tool developed in [66]. This application allows calculation of the PDSI with the use of four types of input data: temperature, precipitation, available water capacity (AWC) of the soil [66], also known as field capacity, and the latitude of the location of interest. Note that this part of the analysis could only be achieved using results from the CCSM4, MPI-ESM-P, and CESM1 models due to data availability (the other models do not have the AWC variable).
For the 20th century, instrumental PDSI (1901–2005) from OWDA is from [34] (online resource, accessed on 10 September 2018: http://drought.memphis.edu/OWDA/ExtractSingleInst.aspx).
In addition, to further investigate precipitation variability in the region over the last millennium, we calculated Pearson’s correlation coefficients between OWDA and the calculated PDSI from CMIP5 models, then between each CMIP5 calculated PDSI for the whole period of the last millennium, as shown in Supplementary Table S1.

2.5. Atmospheric Circulation Indices

Atmospheric circulation is characterized in terms of circulation indices generally based on normalized SLP differences between two distant locations where observations are selected. We used four circulation indices obtained from station-based observations for the recent period (1979–2005; online resource accessed on 20 October 2017: https://climatedataguide.ucar.edu/climate-data/hurrell-north-atlantic-oscillation-nao-index-station-based) and calculated using reanalysis (NOAA-CIRES 20th Century Reanalysis) and PMIP3/CMIP5 model simulations over the last millennium.
These indices are NAO, MO, WeMO, and U850 (Figure 3) and are defined as follows:
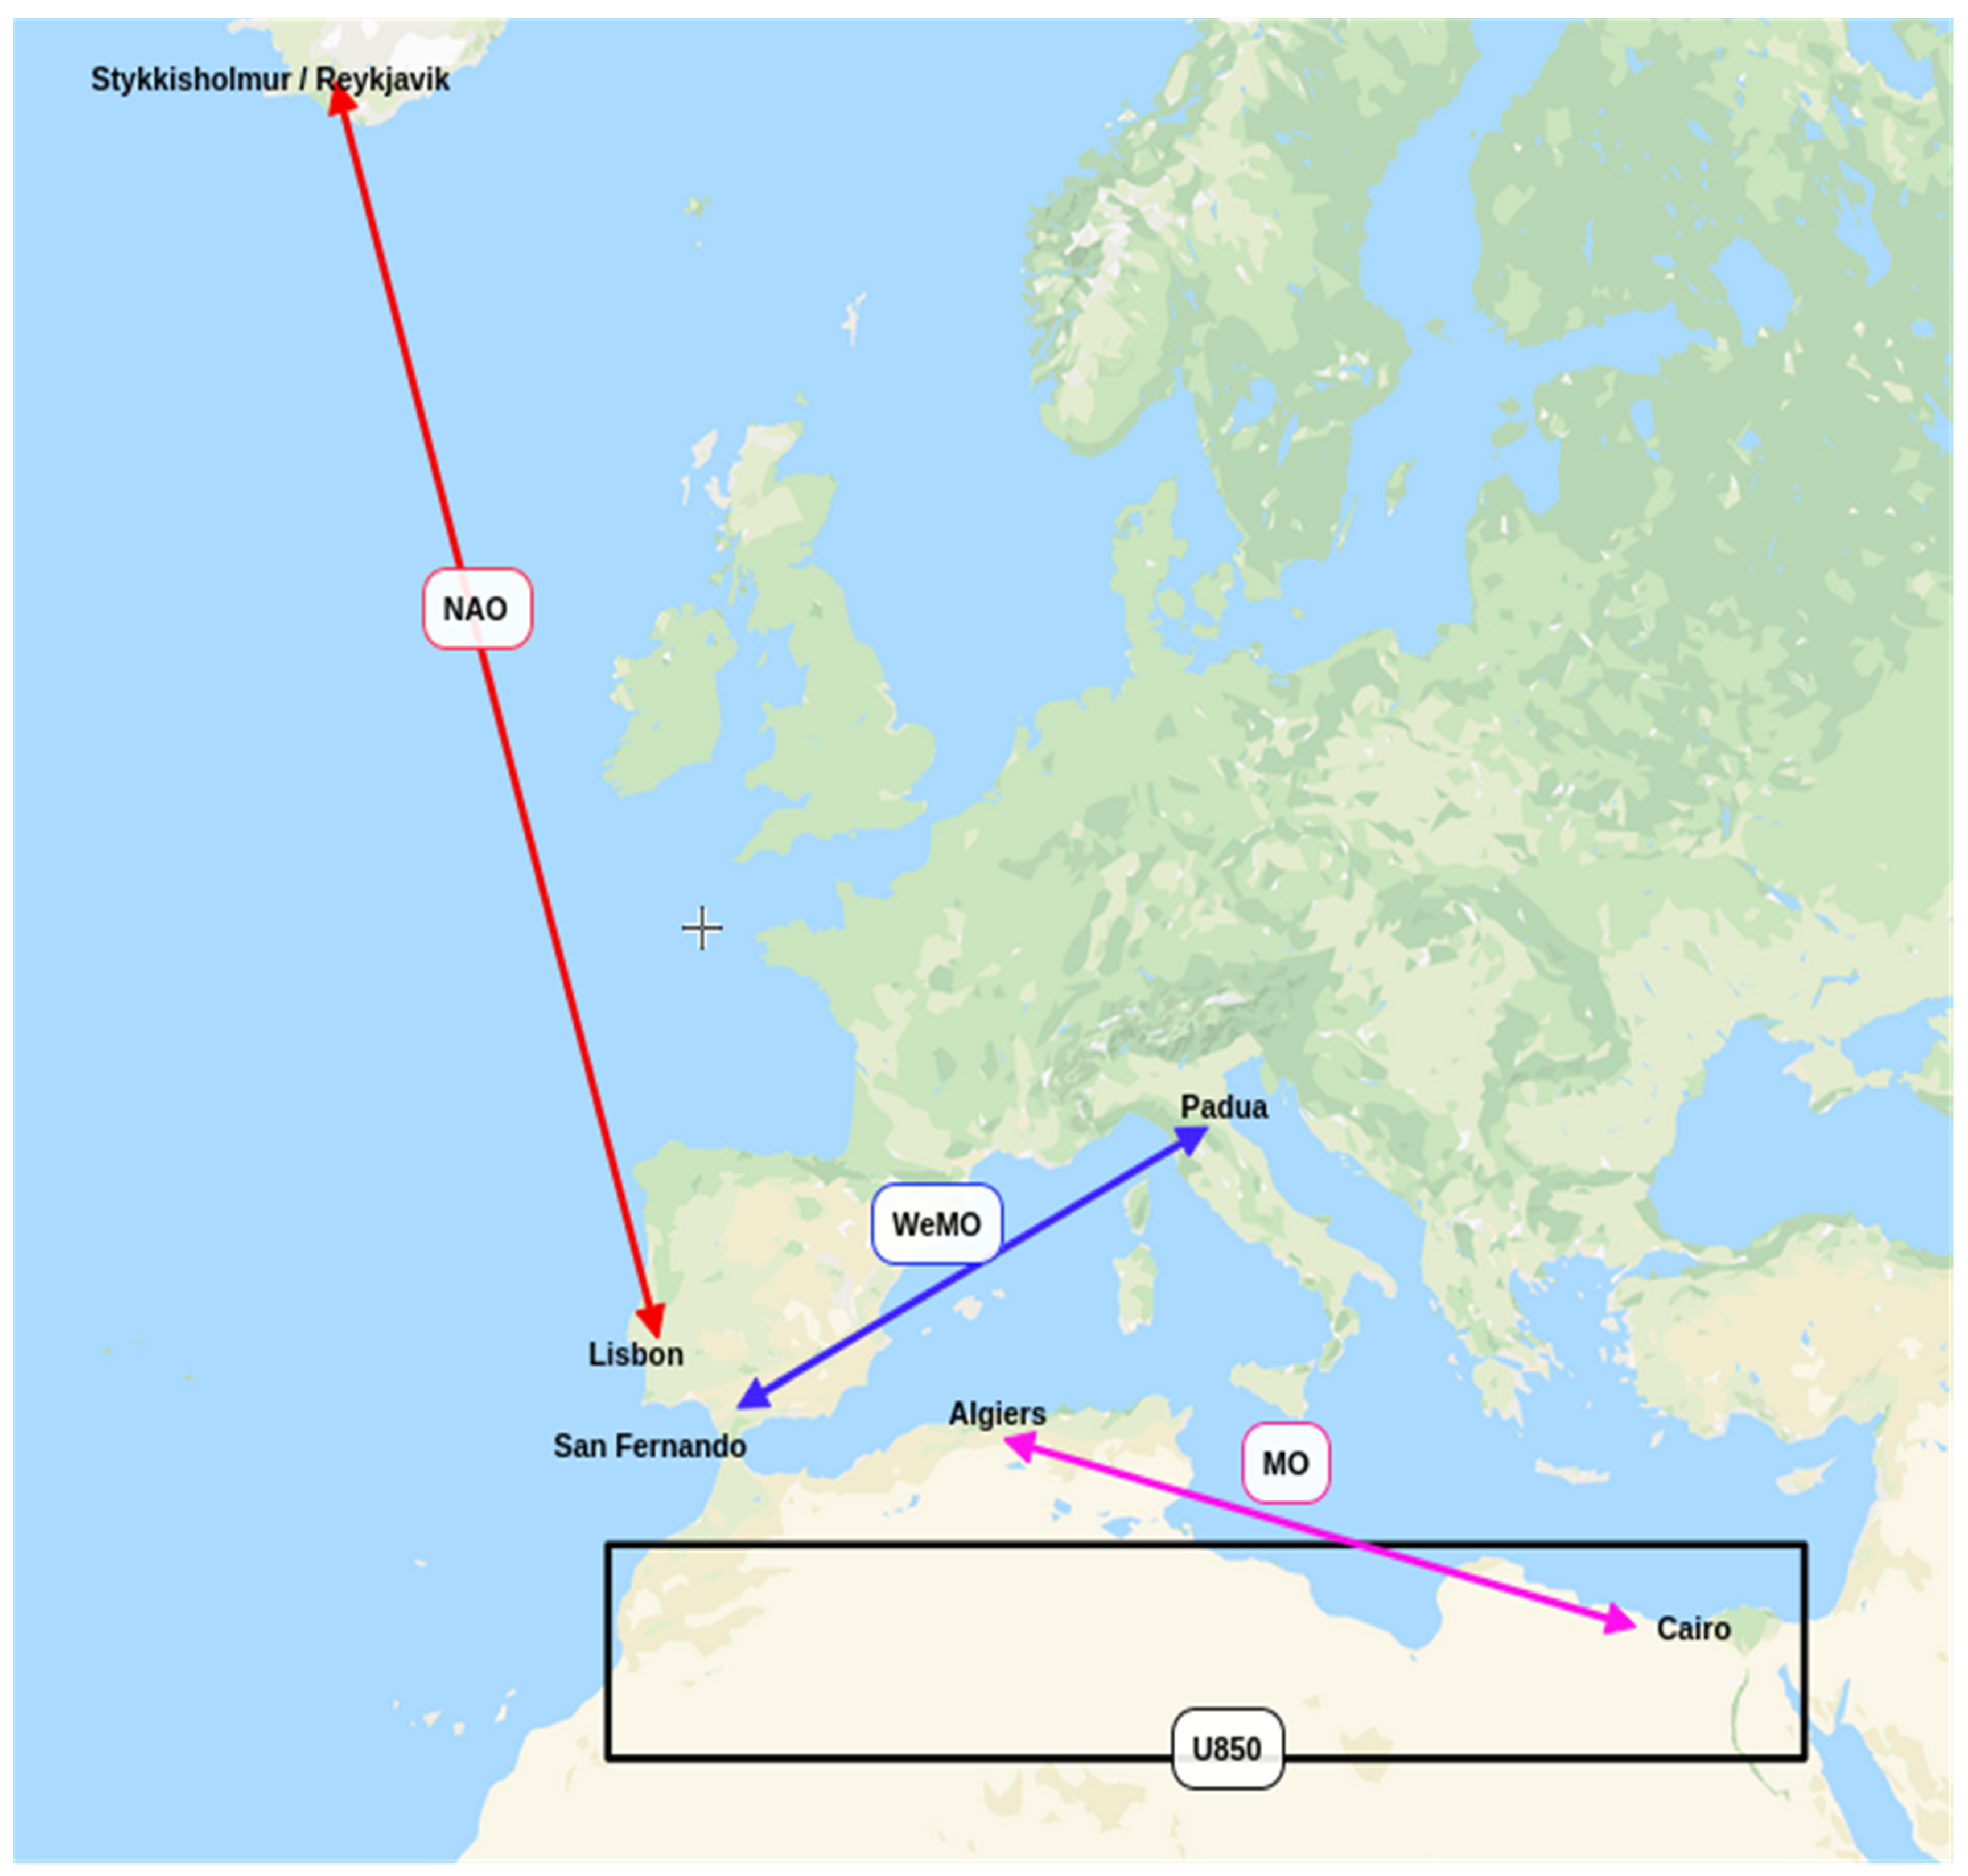
  • The NAO index is calculated as the difference in normalized SLP between Lisbon, Portugal, and Stykkisholmur/Reykjavik, Iceland (Figure 3). Normalization is obtained by removing the long-term mean and dividing by the long-term standard deviation of the interval 1864–1983. This is done to avoid the series being impacted by the greater variability of the northern station [7,67].
  • The MO index was calculated by [68,69,70] as the normalized pressure difference between Algiers (36.4° N, 3.1° E) and Cairo (30.1° N, 31.4° E) (Figure 3). The MO has been viewed as the dominant regional low-frequency atmospheric pattern impacting rainfall in the Mediterranean region [11,71,72].
  • The WeMO index is defined as the difference between the standardized surface pressure values recorded at Padua (45.40° N, 11.48° E) in northern Italy and San Fernando (Cádiz) (36.28° N, 6.12° W) in southwestern Spain (Figure 3) [73].
  • The zonal wind index (U850) is related to the eddy-driven jet and storm track action over the North Atlantic [19]. This index is obtained by averaging the monthly zonal wind over 25° N–33° N and 10° W–23° W (Figure 3).
The links between these atmospheric modes of variability (NAO, MO, WeMO, and U850 indices) and precipitation, averaged over the three study areas (Figure 2), are evaluated for the 6-month November–April mean using Pearson’s correlation coefficients. This period accounts for the majority of annual rainfall.

3. Results and Discussions

Overall, the CMIP5 precipitation patterns fit the observed annual climatological rainfall cycle in North African regions (Figure 4), although some models (in particular GISS-E2-R) overestimate precipitation, while others (IPSL-CM5A-LR) underestimate it. This gives credence for using the CMIP5 models in our analysis.

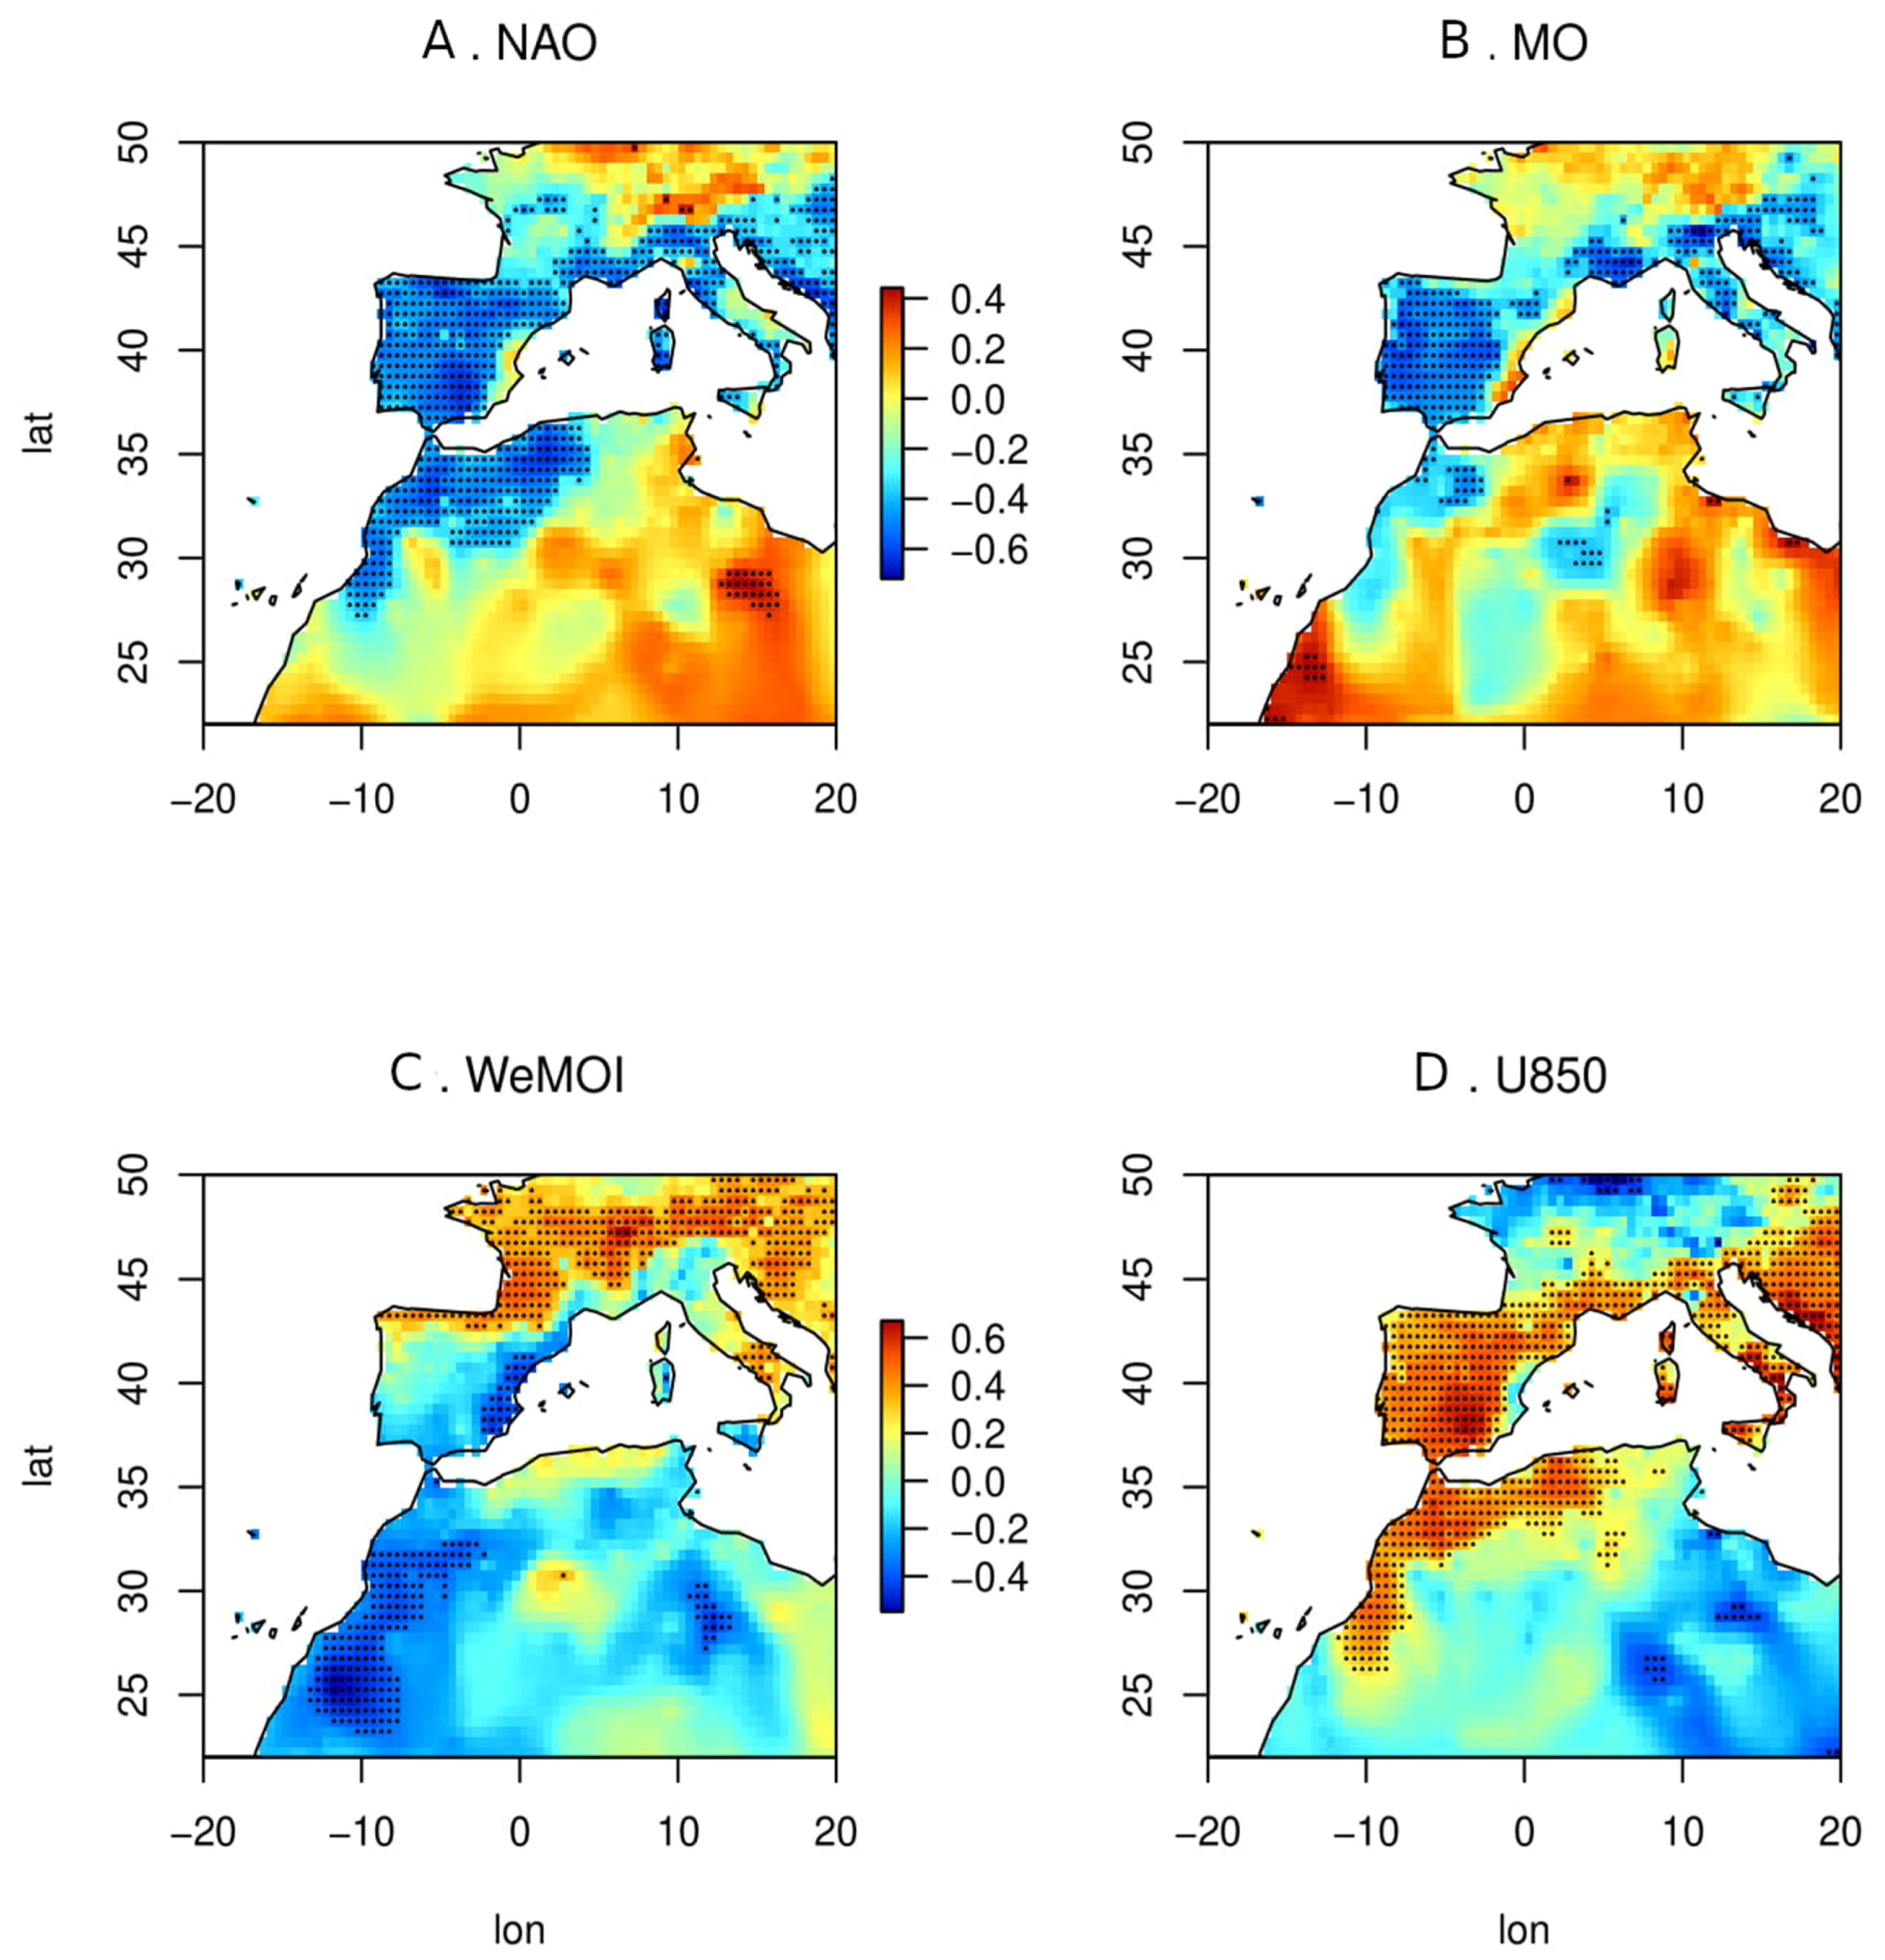
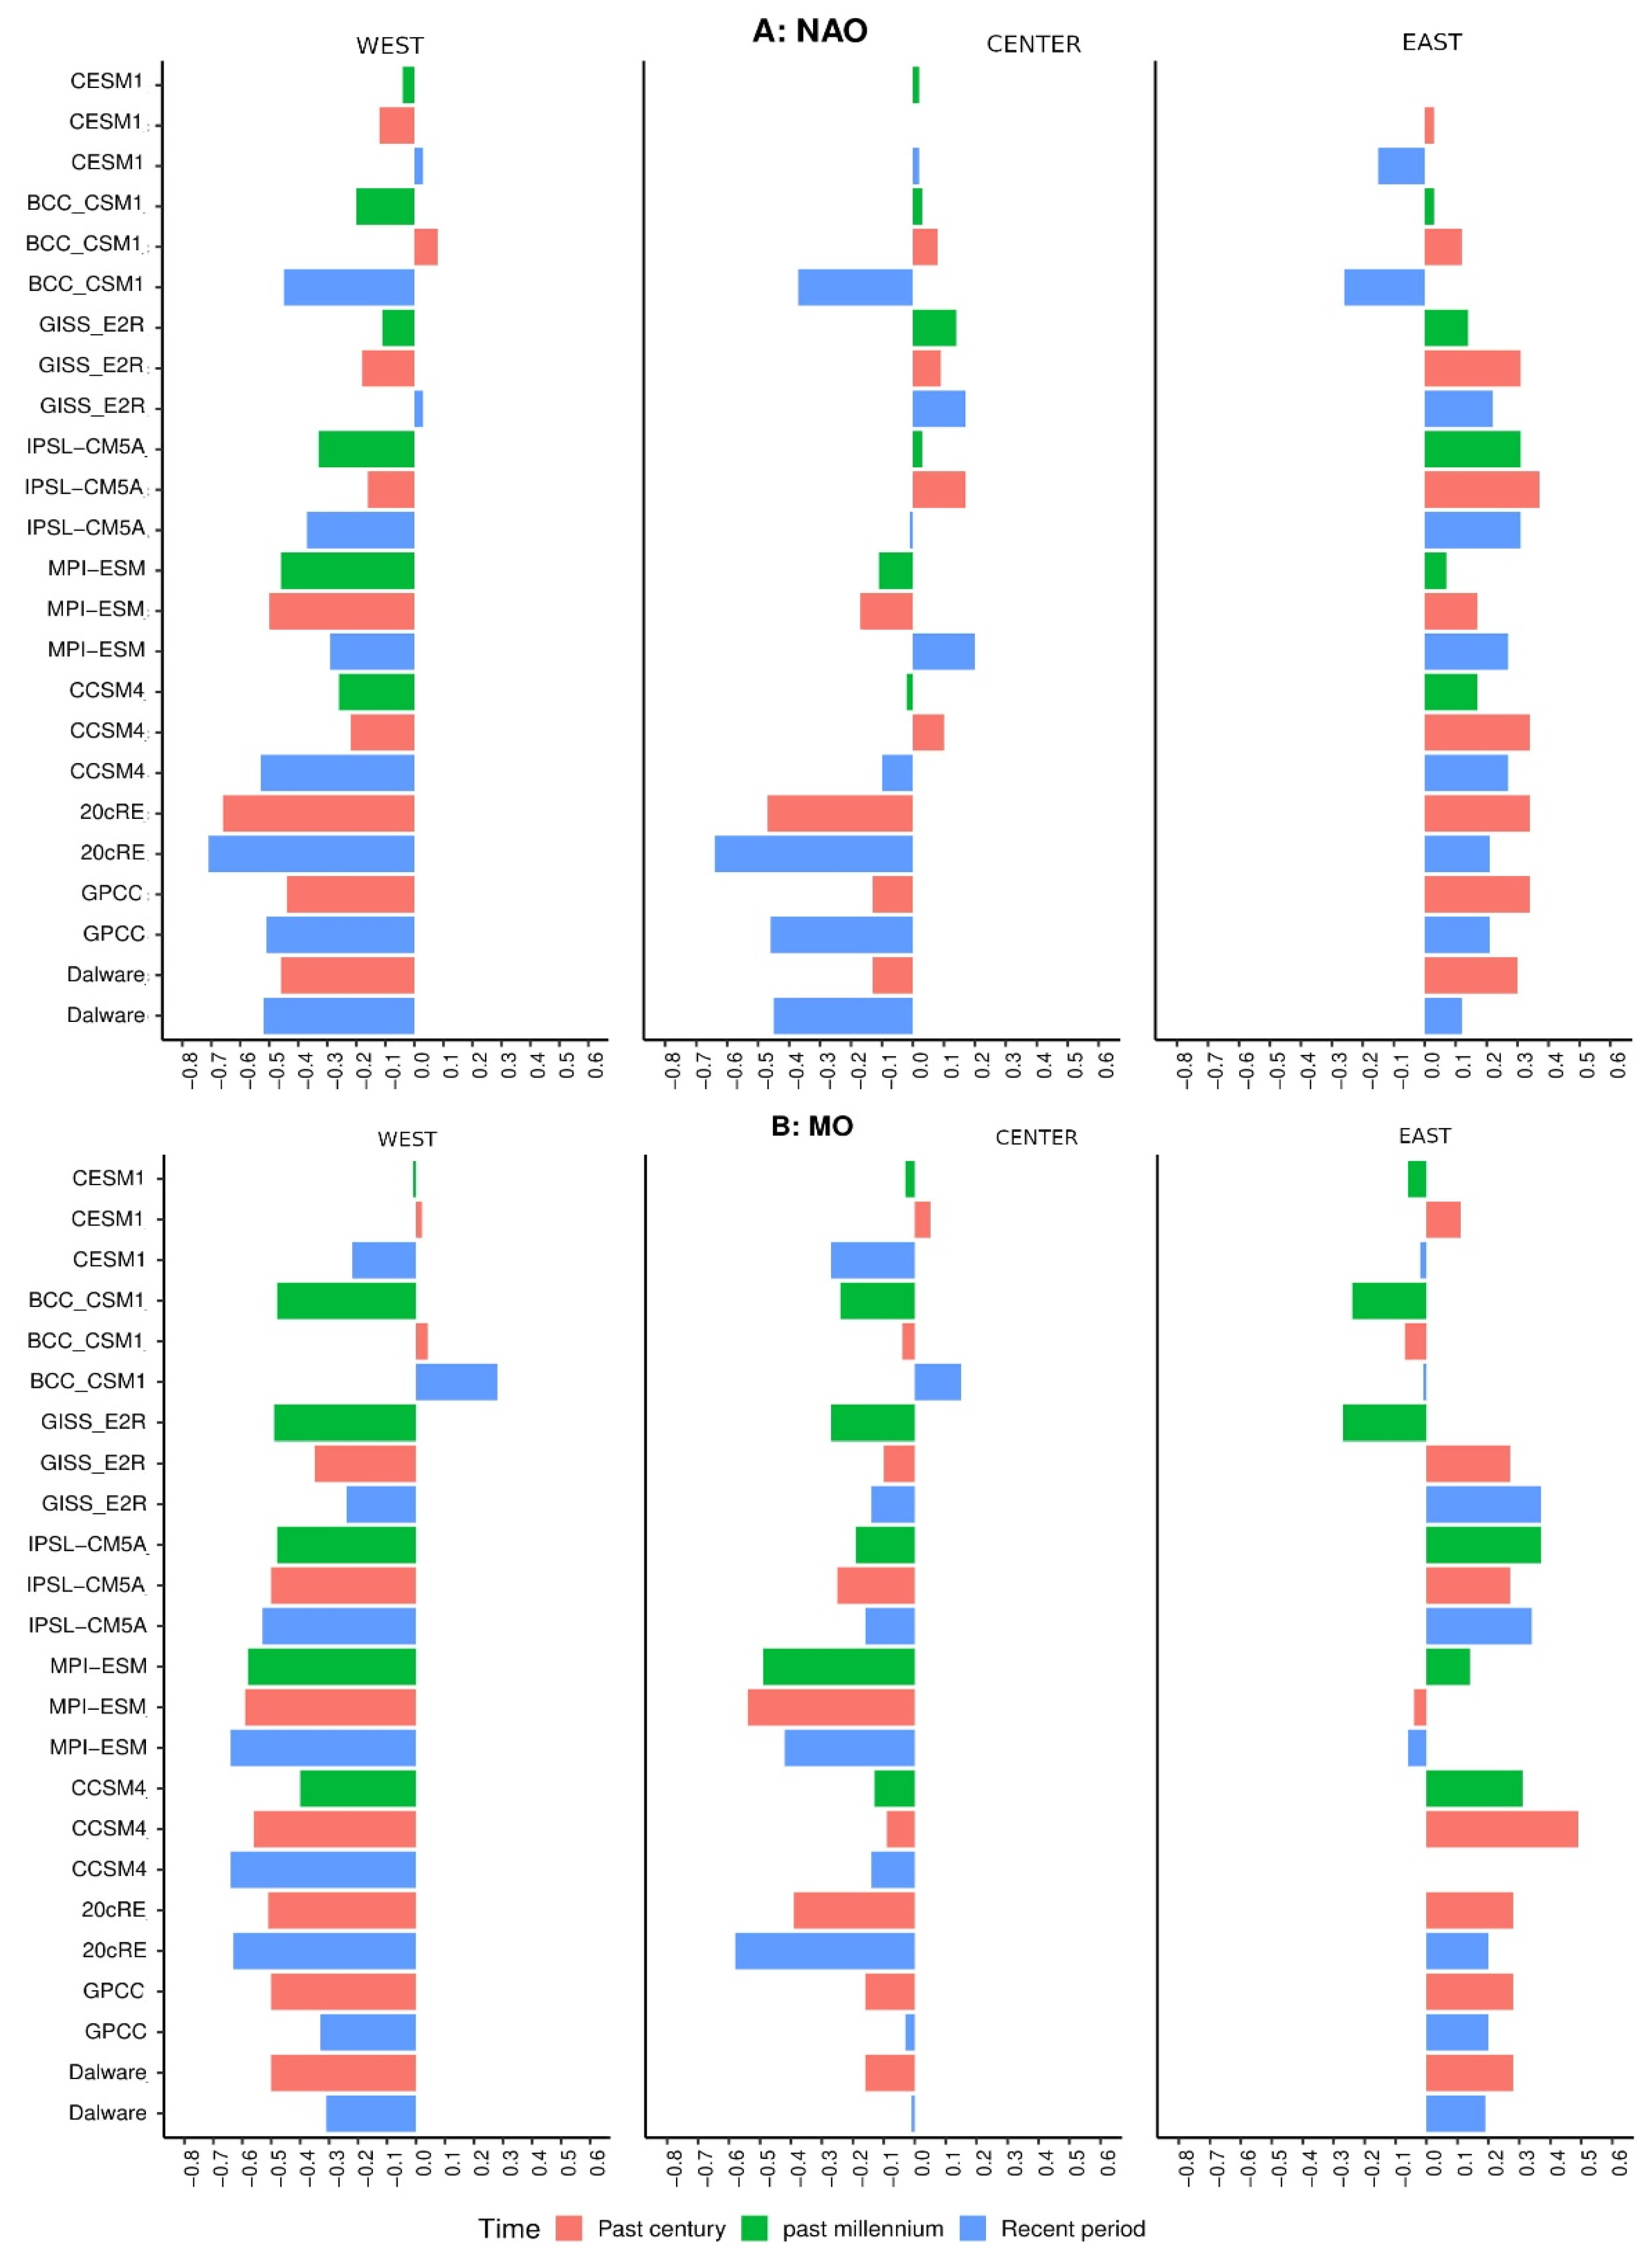
3.1. Link between Winter Precipitation and Atmospheric Modes of Variability in North Africa, 850–2005

The correlations between winter precipitation (observation, reanalysis, and models) and the atmospheric indices (NAO, MO, WeMO, and U850) over the past millennium are presented in Figure 5 and Figure 6 (exact numbers are given in Supplementary Tables S2–S5). Figure 5 shows the spatial distribution for one dataset as an example, while analysis of all datasets for averages over sub-regions and periods is shown in Figure 6 and Figure 7. For the analyses of different datasets, we determined if correlations were significant for the sub-regions and provide their ranges.

3.1.1. Recent Period (1979–2005):

The negative correlation coefficients between the NAO and the winter precipitation data in the western part of North Africa are significant except for MPI-ESM, GISS-E2-R, and CESM1 models (Figure 6A, Supplementary Table S2). The correlations become less significant going from west to east. The range of correlations varies from −0.37 to −0.71 on the west coast of Morocco, −0.45 to −0.64 in the north of Algeria, and −0.38 in Tunisia (only one dataset). These values are in agreement with previous results [1,7,8,13,20] that found negative correlations between winter NAO and precipitation in the 20th century in the western region of the Mediterranean. This is also consistent with [7,12], which argued that the NAO is the main atmospheric circulation pattern explaining the hydroclimate variability in this region.
The MO and WeMO show similar spatial patterns to the NAO in the western part of North Africa (Morocco coast) with high significant correlations (except for GISS-E2-R, BCC-CSM1, and CESM1 models). For both indices, the range of correlations varies from −0.31 to −0.65 in the west of Morocco, −0.42 to −0.58 in northern Algeria, and −0.38 to 0.38 in northern Tunisia (Figure 6B and Figure 7A, Tables S3 and S4 in Supplementary Materials).
In contrast, the correlations between winter precipitation and U850 are positive and highly significant in more datasets than those found for NAO, WeMO, and MOI. The range of correlations varies from 0.38 to 0.72 in the western part, 0.50 to 0.65 in the central part, and 0.18 to 0.30 in the eastern part (Figure 7B, Supplementary Table S5).

3.1.2. Past Century (1850–1950):

The correlation coefficients between NAO and winter precipitation are significant in five datasets, which range from −0.21 to −0.66 in the western part (Morocco coast), −0.46 in northern Algeria (only one dataset), and −0.27 to 0.36 in northern Tunisia with more datasets than in the recent period (6 datasets) (Figure 6A, Supplementary Table S2).
As in the recent period, the MO shows a similar atmospheric pattern to the NAO in the western part of the study area (Morocco) with significant negative correlations varying from −0.35 to −0.59 and −0.24 to −0.54 in northern Algeria, becoming positive in northern Tunisia in five datasets (more than for the recent period), with values ranging from 0.26 to 0.48.
The correlation of the WeMO with precipitation datasets shows a similar atmospheric pattern in the western part (Morocco coast) as in the recent period, but differs in the central and eastern parts of North Africa, with more significant correlations alternating between negative and positive values (discrepancies between datasets) compared to the recent period (Figure 7A, Supplementary Table S3).
Correlation coefficients between U850 and winter precipitation are similar for the recent period in most of the precipitation datasets, with high positive values ranging from 0.18 to 0.71 on the Morocco coast, 0.17 to 0.68 in northern Algeria, and 0.11 to 0.27 in northern Tunisia.

3.1.3. Past Millennium (850–1850):

The correlation of the NAO with the precipitation datasets in the western part (coast of Morocco) are similar to the periods previously mentioned. All correlations are significant except CESM1 model data. They vary from −0.19 to −0.46 on the Morocco coast, −0.10 to 0.13 in northern Algeria, and 0.16 to 0.31 in Tunisia. The correlations are less significant going from west to east (Figure 6A, Supplementary Table S2).
For the MO and WeMO, the correlations are significant for most datasets in all parts of North Africa. MO correlations vary between negative −0.12 and positive 0.36 values going from west to east. In contrast, the correlation between the WeMO and precipitation presents high variability between positive and negative values in the three parts of North Africa (Figure 6B and Figure 7A, Supplementary Tables S3 and S4).
As for the past century and the recent period, the U850 correlations are highly positive and significant in the majority of datasets and the three parts of North Africa. The correlations generally range from 0.13 to 0.73 (Figure 7B, Supplementary Table S5).
These results show that the link between winter precipitation variability and the three atmospheric patterns (NAO, WeMO, and MO) over the past millennium is stronger and more stationary in the western region of North Africa than in the central and eastern parts, where it is overall weak. This result appears robust over time with no large changes observed for the three studied periods, except for the WeMO. Compared to the recent period, the MO index has a quite similar pattern to that during the past century and past millennium, as seen for NAO. On the contrary, WeMO shows a different pattern during the past century and the past millennium over the whole region. U850 is characterized by a stronger positive link with winter precipitation than the other atmospheric patterns for all study periods considered.
This is consistent with [19], which analyzed CMIP5 climate model projections (2070–2099) to quantify the role of atmospheric circulation in the Mediterranean precipitation response to climate change in the cold season (November–April) using the RCP8.5 climate scenario. They found that the zonal wind U850 is strongly associated with area-averaged Mediterranean precipitation in North Africa and is a useful diagnostic to explain the precipitation change.

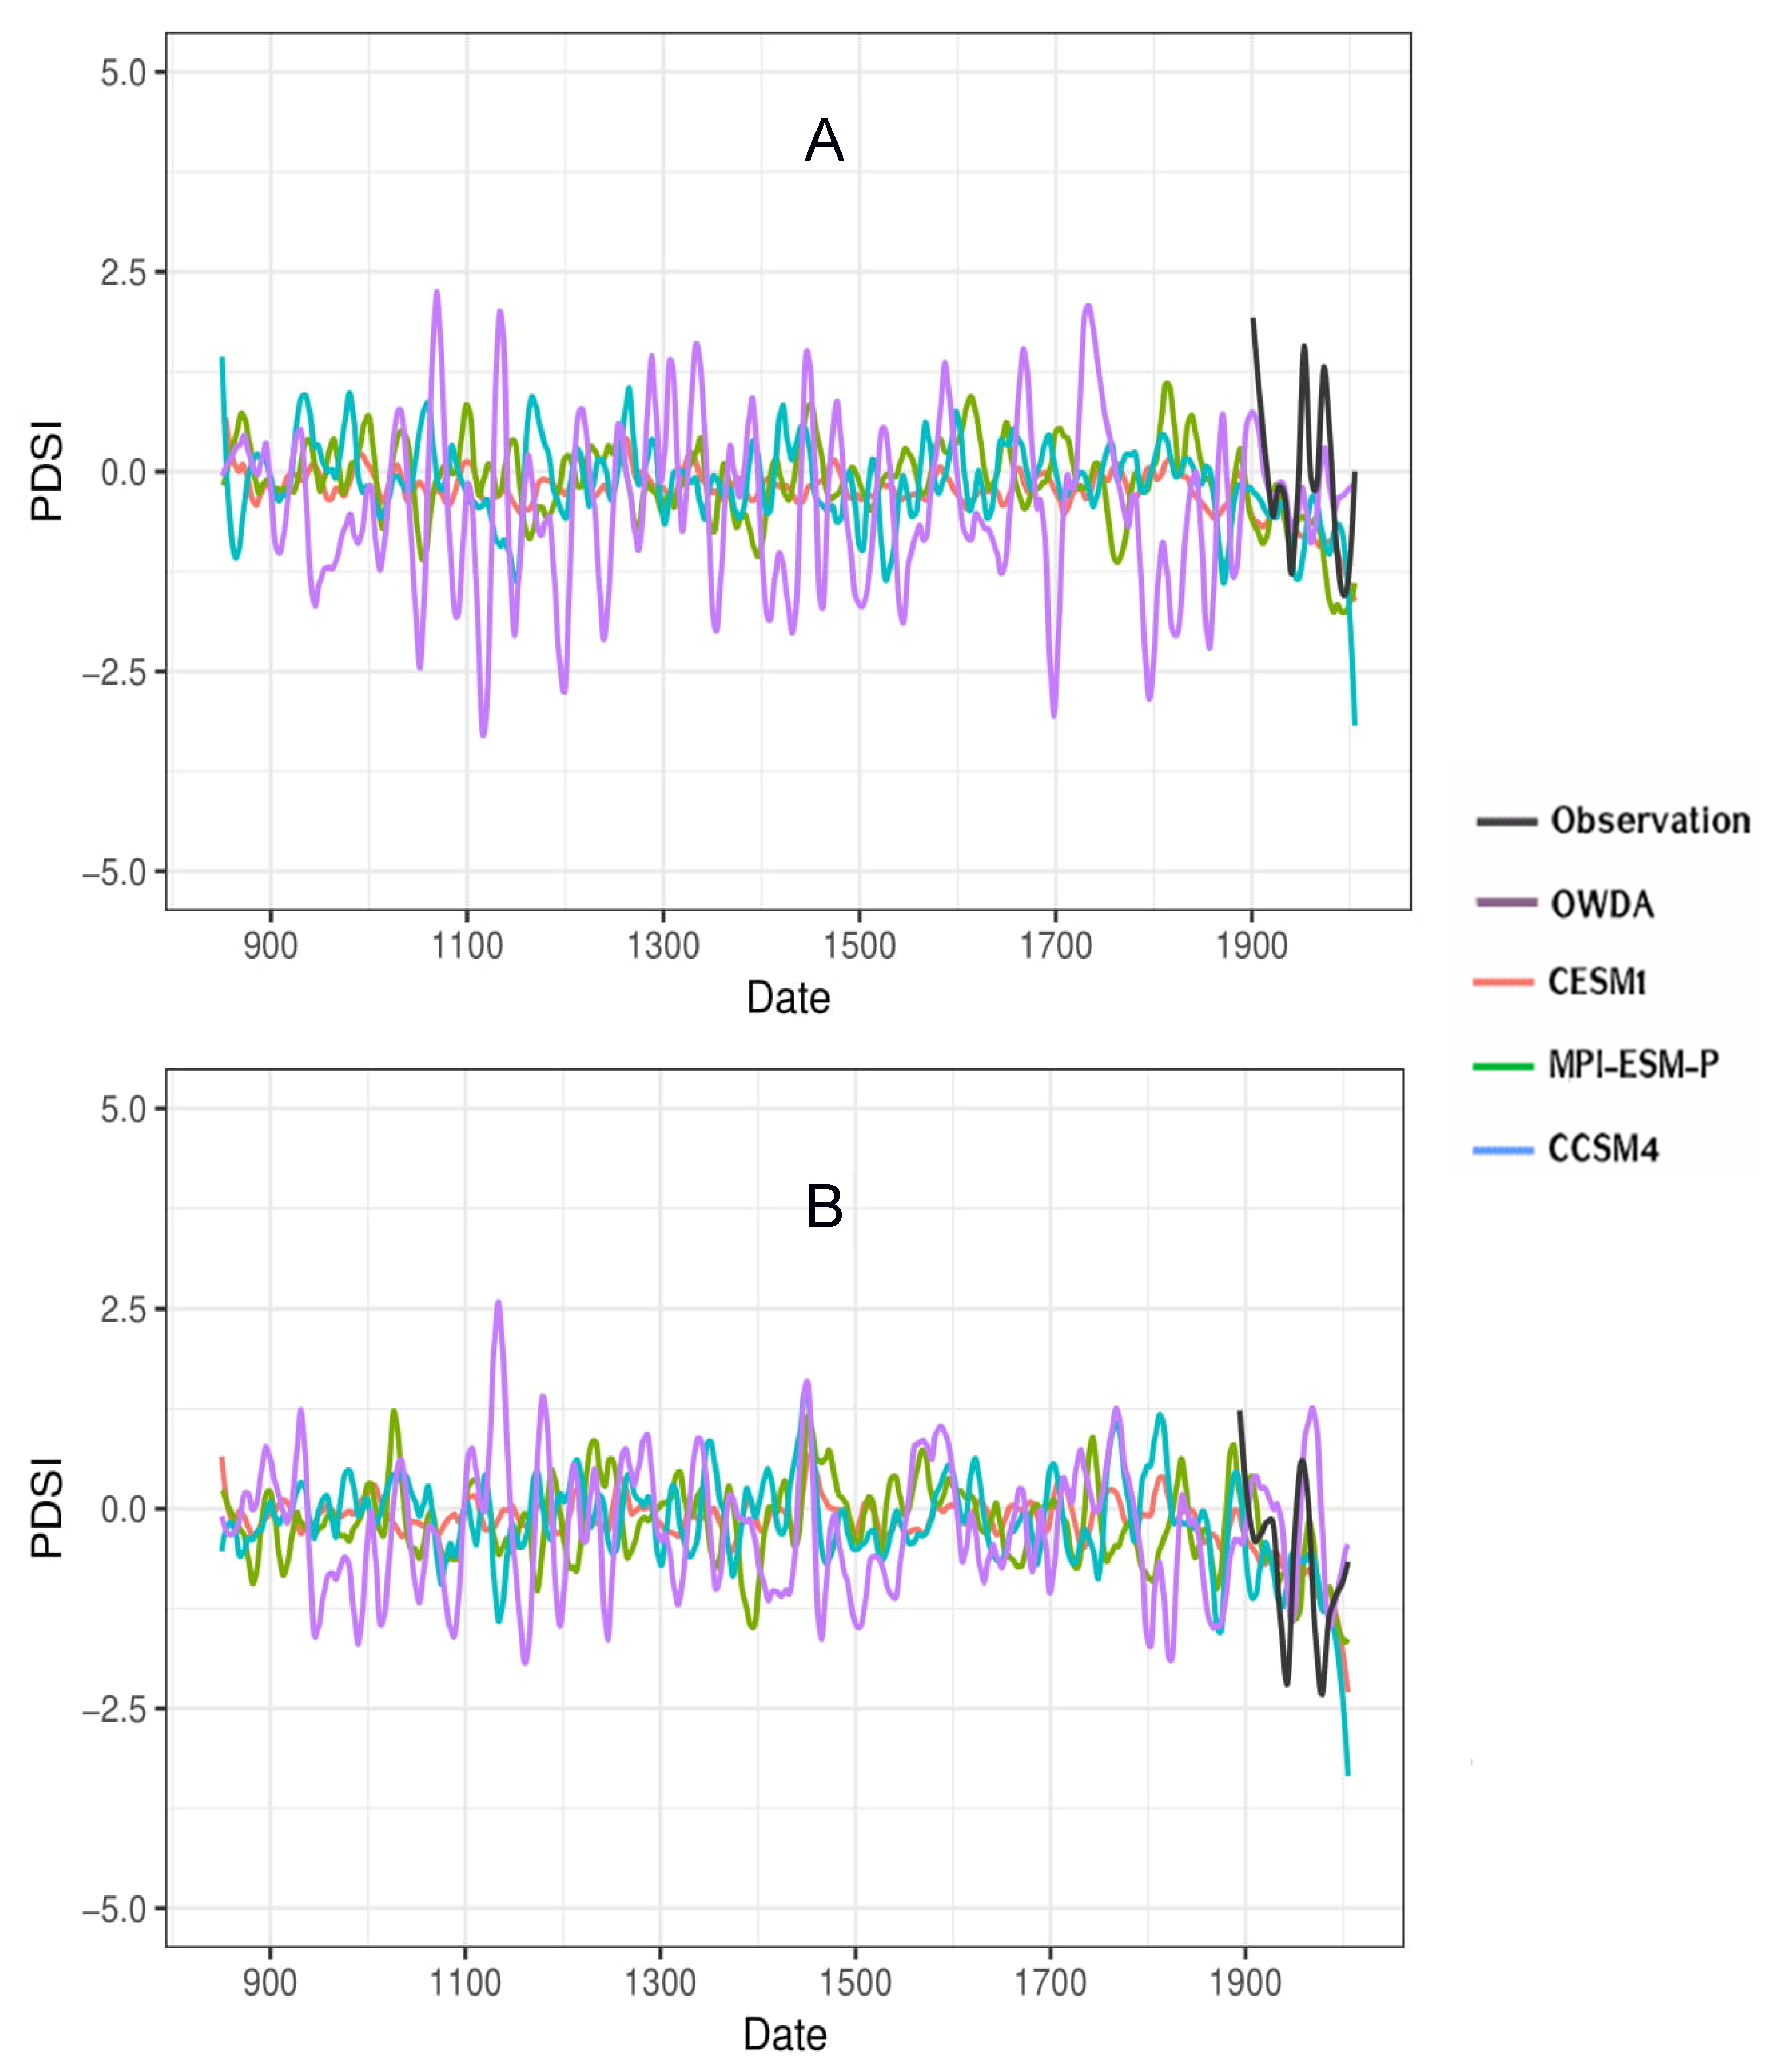
3.2. Precipitation, Wind, and PDSI Analysis over the Last Millennium in the North African Region

According to the modified Mann–Kendall test [35], a significant decreasing trend is found in the simulated precipitation between 1800 and 2005 in the three North African regions (except for BCC-CSM1 and CESM1 models in the western part) (Table 3 and Figure 8). No trend was found in the precipitation model results for the period 850–1800 (Figure 8). In order to detect the change point corresponding to the year when these significant trends started, we applied Pettitt’s test [36]. The results showed a change point around 1800–1850 for the PMIP3/CMIP5 model simulations in the three regions. Furthermore, a decreasing trend is found in the observations and reanalysis starting around 1950 depending on the region (Table 4 and Figure 8). The magnitude of trends in the annual mean was determined using Sen’s slope estimator. Sen’s slope estimator indicates a higher magnitude of the decreasing trend in the observations and reanalysis (from −0.001 to −0.008 mm/day/year) than in the CMIP5 data (from −0.0002 to −0.001 mm/day/year). This is consistent with the analysis of [74], which documented a decline in annual precipitation in the Mediterranean region during the 20th century (1901–2009) in the Coupled Model Intercomparison Project phase 3 (CMIP3) simulations at a rate of −0.007 mm/day/decade. The range of slope values is higher in the models than in the observations and reanalysis. Furthermore, for the same CMIP5 model precipitation data, there are differences in the magnitude of trends between the three parts of North Africa. This confirms the difference in variability of precipitation over the study period in the three parts (West, Center and East) of North Africa.
Winter U850 wind speed over the last millennium is characterized by a significant decreasing trend in most PMIP3/CMPI5 simulations (CCSM4, MPI-ESM-P, BCC-CSM1, and CESM1) (Table 5, Figure 9), as identified by the modified Mann–Kendall test. These decreasing trends start around 1800, which is consistent with the decreasing trend observed in winter precipitation shown in the six PMIP3/CMIP5 simulations (Table 3, Figure 8).
This decrease in precipitation could be explained by a higher pressure gradient across the North Atlantic channeling strong westerlies to central and northern Europe, with little moisture reaching the Mediterranean basin and North Africa [1,11]. This atmospheric pattern appears to have been more predominant during the 20th century, likely due to anthropogenic forcing [75]. However, this hypothesis is still debated and no formal attribution to human activities has been achieved yet [76].
Both results shown in Figure 8 and Figure 9 are in accordance with [19], which demonstrated that the departure of precipitation in the Mediterranean wet season in the future (2070–2099) is linearly related to 850 hPa wind. The findings of [19] for the future also appear to be valid for the 20th century and the last millennium in the simulations.
It is not possible to compare the decreasing trend with observed precipitation before the 20th century, but time series of the summer (June–August) PDSI are available over the last millennium in Morocco and Algeria (Figure 10). These locations correspond to those of the tree ring chronologies in the Mediterranean region used for the OWDA (Supplementary Figure S1) [34].
Model results, proxy-based reconstruction, and observations consistently show a significant decreasing trend of the PDSI over the last century (Figure 10, Table 6), according to the modified Mann–Kendall test [35], while no trend was found during the last millennium (850–1800). The trend started at the end of the 19th century for both PMIP3/CMIP5 models and reconstructed datasets. The instrumental data also depict a trend starting in the beginning of the 20th century (Table 7), which is in agreement with [77], which showed a clear trend toward drier conditions during the 20th century in most western and central Mediterranean regions. The decreasing trend in the instrument-based PDSI is larger than the one computed from the CMIP5/PMIP3 model output or OWDA reconstruction (Table 7).
The results show weak correlation coefficients between observed and simulated PDSI as well as between the PDSI simulated by the various models (Supplementary Table S1), which leads us to conclude that natural climate variability (internal variability) dominated the precipitation changes in the North African region over the last millennium, as observed in several other regions for the same period, e.g., [78,79]. This is confirmed by the wide range of ensemble simulations performed with CESM1 over that period.

4. Conclusions

Our analysis of the links between North African winter precipitation changes and the atmospheric patterns NAO, WeMO, MO, and U850 over the last millennium is based on recent observational data, 20th century reanalysis, and the results of six PMIP3/CMIP5 models. Specifically, we analyze the winter (November–April) precipitation variability observed during three periods (recent, 1979–2005; last century, 1850–2005; and last millennium, 850–2005) in western, central, and eastern regions of North Africa. Furthermore, we compared the results with reconstructed PDSI.
The link between NAO, WeMO, and MO atmospheric circulation indices and rainfall variability over the three periods of the last millennium is stronger and more stationary in the western region of North Africa than in the central and eastern parts, where it is overall weak. The NAO and MO are more likely to affect precipitation variability in the western part of North Africa (Morocco coast and West Algeria) associated with highly negatively significant correlation values, compared to the eastern part with weak positive correlation results. Additionally, the link between WeMO and precipitation is spatially and temporally not stationary over the period investigated, as it depends on the length of the time series analyzed and the geographic location.
The correlation coefficients obtained between U850 and winter precipitation in the three parts of North Africa over the last millennium are stronger than those calculated with NAO, WeMO, and MO. The U850 correlation coefficients are uniformly distributed throughout the whole region, with significant high positive values for the different data sources. The link between winter U850 and precipitation variability is consequently more robust over the last millennium and well describes the interannual changes of precipitation in North Africa. The weak correlation coefficients of PDSI in the climate model simulations over the last millennium, notably between members of the same climate model (CESM1), but also between simulated and reconstructed PDSI, lead us to conclude that internal climate variability dominated the precipitation changes in North Africa over this period. In addition, the variability of the long-term PMIP3/CMIP5 winter precipitation, U850 time series and PDSI (simulated and reconstructed from OWDA) presents a significant decreasing trend toward drier conditions over the recent past. This negative trend started in the beginning of the 19th century, except for the instrumental PDSI dataset, for which the trend started in the mid-20th century.
In conclusion, we find that precipitation variability associated with U850 represents an important contribution to our understanding of potential causes of the long-term hydroclimate variability in North Africa during the winter season. These results will benefit national governments and private institutions in the planning and management of water resources in North Africa.

Supplementary Materials

The following are available online at https://0-www-mdpi-com.brum.beds.ac.uk/2225-1154/8/5/62/s1.

Author Contributions

Conceptualization, A.D., H.G., and F.K.; methodology, A.D., H.G., and F.K.; resources, A.D. and H.G.; writing–original draft preparation, A.D. and H.G.; visualization, A.D., H.G., and F.K. All authors have read and agreed to the published version of the manuscript.

Funding

This research received no external funding.

Acknowledgments

We gratefully acknowledge the assistance of our colleague François Massonnet, who provided expertise and advice that considerably assisted this research. We acknowledge the World Climate Research Programme’s Working Group on Coupled Modelling, which is responsible for CMIP, and we thank the climate modeling groups (listed in Table 2 of this paper) for producing and making available their model output. For CMIP, the US Department of Energy’s Program for Climate Model Diagnosis and Intercomparison provided coordinating support and led the development of software infrastructure in partnership with the Global Organization for Earth System Science Portals. Computational resources were provided by the supercomputing facilities of the Université catholique de Louvain (CISM/UCL) and the Consortium des Équipements de Calcul Intensif en Fédération Wallonie Bruxelles (CÉCI), funded by the Fond de la Recherche Scientifique de Belgique (F.R.S.-FNRS) under convention 2.5020.11.

Conflicts of Interest

The authors hereby declare no conflict of interest.

References and Note

  1. Barcikowska, M.J.; Kapnick, S.B.; Feser, F. Impact of large-scale circulation changes in the North Atlantic sector on the current and future Mediterranean winter hydroclimate. Clim. Dyn. 2018, 50, 2039–2059. [Google Scholar] [CrossRef]
  2. NIC (National Intelligence Council): North Africa Special report (NIC-2009-07D). Prepared by Joint Global Change Research Institute and Battelle Memorial Institute, Pacific Northwest Division. 2009. Available online: https://www.hsdl.org/?abstract&did=24140 (accessed on 30 April 2018).
  3. Caloiero, T.; Veltri, S.; Caloiero, P.; Frustaci, F. Drought Analysis in Europe and in the Mediterranean Basin Using the Standardized Precipitation Index. Water 2018, 10, 1043. [Google Scholar] [CrossRef] [Green Version]
  4. Mohamed, B.; Melvyn, K.; Cody, K. Drought characteristics and management in North Africa and the Near East; Food and Agriculture Organization Of The United Nations: Rome, Italy, 2018. [Google Scholar]
  5. Hernández-Guerra, A.; Fraile-Nuez, E.; López-Laatzen, F.; Martínez, A.; Parrilla, G.; Vélez-Belchí, P. Canary Current and North Equatorial Current from an inverse box model. J. Geophys. Res. 2005, 110, C12019. [Google Scholar]
  6. Robinson, A.R.; Brink, K.H. The Global Coastal Ocean: Interdisciplinary Regional Studies and Syntheses, Part 2; Harvard University Press: Cambridge, MA, USA, 2006; p. 880. [Google Scholar]
  7. Jones, P.D.; Jonsson, T.; Wheeler, D.A. Monthly values of the North Atlantic Oscillation Index from 1821 to 2000. PANGAEA 1997. [Google Scholar] [CrossRef]
  8. Hurrell, W.J. Regional Temperatures and Precipitation. Science 1995, 5224, 676–679. [Google Scholar]
  9. Thompson, D.W.J.; Wallace, J.M. Annular modes in the extratropical circulation. Part I: Month-to-month variability. J. Climate. 2000, 13, 1000–1016. [Google Scholar] [CrossRef]
  10. Hurrell, W.J.; Kushnir, Y.; Ottersen, G.; Visbeck, M. The North Atlantic Oscillation: Climate Significance and Environmental impact. Geophys. Monogr. Ser. 2003, 279. [Google Scholar] [CrossRef]
  11. Dunkeloh, A.; Jacobeit, J. Circulation dynamics of Mediterranean precipitation variability 1948–98. Int. J. Cli-Matol. 2003, 23, 1843–1866. [Google Scholar] [CrossRef]
  12. Annarita, M.; Dell’Aquila, A. Decadal climate variability in the Mediterranean region: Roles of large-scale forcings and regional processes. Clim. Dyn. 2011, 38, 1129–1145. [Google Scholar] [CrossRef]
  13. Gonzalez-Hidalgo, J.C.; Lopez-Bustins, J.A.; Štepánek, P.; Martín-Vide, J.; de Luis, M. Monthly precipitation trends on the Mediterranean fringe of the Iberian Peninsula during the second half of the 20th century (1951–2000). Int. J. Climatol. 2009, 29, 1415–1429. [Google Scholar] [CrossRef]
  14. López-Moreno, J.I.; Vicente-Serrano, S.M.; Moran-Tejeda, E.; Zabalza, J.; Lorenzo-Lacruz, J.; García-Ruiz, J.M. Impact of climate evolution and land use changes on water yield in the ebro basin. Hydrol. Earth Syst. Sci. 2011, 15, 311–322. [Google Scholar] [CrossRef] [Green Version]
  15. Fernández-González, S.; del Río, S.; Castro, A.; Penas, A.; Fernández-Raga, M.; Calvo, A.I.; Fraile, R. Connection between NAO, weather types and precipitation in León, Spain (1948–2008). Int. J. Climatol. 2012, 32, 2181–2196. [Google Scholar]
  16. Ulbrich, U.; Lionello, P.; Belusic, D.; Jacobeit, J.; Knippertz, P.; Kuglitsch, F.G.; Leckebusch, G.C.; Luterbacher, J.; Maugeri, M.; Maheras, P.; et al. Climate of the Mediterranean: Synoptic Patterns, Temperature, Precipitation, Winds, and Their Extremes. In Climate of the Mediterranean Region-From the Past to the Future; Elsevier: Sydney, NSW, Australia, 2012. [Google Scholar]
  17. Krichak, S.O.; Breitgand, J.S.; Gualdi, S.; Feldstein, S.B. Teleconnection–extreme precipitation relationships over the Mediterranean region. Appl. Climatol. 2013, 117, 679–692. [Google Scholar] [CrossRef]
  18. Redolat, D.; Monjo, R.; Lopez-Bustins, J.A.; Martin-Vide, J. Upper-Level Mediterranean Oscillation index and seasonal variability of rainfall and temperature. Appl. Clim. 2019, 135, 1059–1077. [Google Scholar] [CrossRef]
  19. Zappa, G.; Hoskins, B.J.; Shepherd, T.G. The dependence of wintertime Mediterranean precipitation on the atmospheric circulation response to climate change. Environ. Res. Lett. 2015, 10, 104012. [Google Scholar] [CrossRef] [Green Version]
  20. Roman, B.; Silje, L.S.; Nico, K.; Christoph, S. Causes of future Mediterranean precipitation decline depend on the season. Environ. Res. Lett. 2019, 14, 114017. [Google Scholar]
  21. Tang, T.; Shindell, D.; Samset, B.H.; Boucher, O.; Forster, P.M.; Hodnebrog, Ø.; Myhre, G.; Sillmann, J.; Voulgarakis, A.; Andrews, T.; et al. Dynamical response of Mediterranean precipitation togreenhouse gases and aerosols. Atmos. Chem. Phys. 2018, 18, 8439–8452. [Google Scholar] [CrossRef] [Green Version]
  22. Smerdon, J.; Luterbacher, J.; Phipps, S.; Anchukaitis, K.; Ault, T.; Coats, S.; Cobb, K.; Cook, B.; Colose, C.; Felis, T.; et al. Comparing proxy and model estimates of hydroclimate variability and change over the Common Era. Clim. Past Discuss. 2017, in press. [Google Scholar] [CrossRef]
  23. Touchan, R.; Xoplaki, E.; Funkhouser, G.; Luterbacher, J.; Hughes, M.K.; Erkan, N.; Akkemik, Ü.; Stephan, J. Dendroclimatol-ogy and large-scale circulation influences in the eastern Medi-terranean and Near East region. Clim. Dyn. 2005, 25, 75–98. [Google Scholar] [CrossRef]
  24. Nicault, A.; Alleaume Brewer, S.; Carrer, M.; Nola, P.; Guiot, J. Mediterranean drought fluctuation during the last 500 years based on tree-ring data. Clim. Dyn. 2008, 31, 227–245. [Google Scholar] [CrossRef]
  25. Touchan, R.; Anchukaitis, K.J.; Meko, D.M.; Sabir, M.; Attalah, S.; Aloui, A. Spatiotem-poral drought variability in northwestern Africa over the last nine centuries. Clim. Dyn. 2011, 37, 237–252. [Google Scholar] [CrossRef]
  26. Touchan, R.; Anchukaitis, K.J.; Shishov, V.V.; Sivrikaya, F.; Attieh, J.; Ketmen, M.; Stephan, J.; Mitsopoulos, I.; Christou, A.; Meko, D.M. Spatial pat-terns of Eastern Mediterranean climate influence on tree growth. Holocene 2014, 24, 381–392. [Google Scholar] [CrossRef]
  27. Jones, P.D.; Briffa, K.R. Unusual climate in northwest Europe during the period 1730 to 1745 based on instrumental and documentary data. Clim. Chang. 2006, 79, 361–379. [Google Scholar] [CrossRef]
  28. Moreno, A.; Pérez, A.; Frigola, J.; Nieto-Moreno, V.; Rodrigo-Gámiz, M.; Martrat, B.; González-Sampériz, P.; Morellón, M.; Martín-Puertas, C.; Corella, J.P.; et al. Age determination and sea surface temperature reconstruction from marine and lake records, Iberian Peninsula. PANGAEA 2012. [Google Scholar] [CrossRef]
  29. Carro-Calvo, L.; Salcedo-Sanz, S.; Luterbacher, J. Neural computation in paleoclimatology: General methodology and a case study. Neurocomputing 2013, 113, 262–268. [Google Scholar] [CrossRef]
  30. Luterbacher, J.; Xoplaki, E.; Dietrich, D.; Jones, P.D.; Davies, T.D.; Portis, D.; Gonzalez-Rouco, J.F.; Von Storch, H.; Gyalistras, D.; Casty, C.; et al. Extending North Atlantic Oscillationreconstructions back to 1500. Atmos. Sci. Lett. 2002, 2, 114–124. [Google Scholar] [CrossRef]
  31. Pauling, A.; Paeth, H. On the variability of return periods ofEuropean winter precipitation extremesover the last five centuries. Clim. Past Discuss. 2006, 2, 157–189. [Google Scholar] [CrossRef]
  32. Esper, J.; Frank, D.; Verstege, A.; Luterbacher, J.; Xoplaki, E. Long-term drought severity variations in Morocco. Geophys. Res. Lett. 2007, 34, L17702. [Google Scholar] [CrossRef] [Green Version]
  33. Brewer, S.; Alleaume, S.; Guiot, J.; Nicaul, A. Historical droughts in Mediterranean regions during the last 500 years: A data/model approach. Clim. Past Discuss. 2006, 2, 771–800. [Google Scholar] [CrossRef]
  34. Cook, E.R.; Seager, R.; Kushnir, Y.; Briffa, K.R.; Buntgen, U.; Frank, D.; Krusic, P.J.; Tegel, W.; vander Schrier, G.; Andreu-Hayles, L.; et al. Old World megadroughts and pluvials during the Common Era. Sci. Adv. 2016, 1. [Google Scholar] [CrossRef] [Green Version]
  35. Hamed, K.H.; Ramachandra Rao, A. A modified Mann-Kendall trend test for autocorrelated data. J. Hydrol. 1998, 204, 182–196. [Google Scholar] [CrossRef]
  36. Pettitt, A.N. A non-parametric approach to the change point problem. 1979, Journal of the Royal Statistical Society Series C. Appl. Stat. 1979, 28, 126–135. [Google Scholar] [CrossRef]
  37. Mann, H.B. Non-parametric tests against trend. Econometrica 1945, 13, 163–171. [Google Scholar] [CrossRef]
  38. Kendall, M.G. Rank Correlation Methods, 4th ed.; Charles Griffin: London, UK, 1975. [Google Scholar]
  39. Carvalho, J.R.; Assad, E.D.; Evangelista, S.R.M.; Pinto, H.S. Estimation of dry spells in three Brazilian regions—Analysis of extremes. Atmos. Res. 2013, 132, 12–21. [Google Scholar] [CrossRef]
  40. Theil, H. A rank-invariant method of linear and polynomial regression analysis. I, II, III. Nederl. Akad. Wetensch. Proc. 1950, 53, 386–392, 521–525, 1397–1412. [Google Scholar]
  41. Dhorde, A.G.; Zarenistanak, M. Three-way approach to test data homogeneity: An analysis of temperature and precipitation series over southwestern Islamic Republic of Iran. J. Ind. Geophys. Union 2013, 17, 233–242. [Google Scholar]
  42. Schneider, U.; Becker, A.; Finger, P.; Meyer-Christoffer, A.; Rudolf, B.; Ziese, M. GPCC Full Data Reanalysis Version 7.0 at 0.5: Monthly Land-Surface Precipitation from Rain-Gauges built on GTS-based and Historic Data; National Center for Atmospheric Research: Boulder, CO, USA, 2014. [Google Scholar]
  43. Willmott, C.J.; Matsuura, K. Terrestrial Air Temperature and Precipitation: Monthly and Annual Time Series (1950–1999). 2001. Available online: http://climate.geog.udel.edu/~climate/html_pages/README.ghcn_ts2.html (accessed on 4 March 2019).
  44. Compo, G.P.; Whitaker, J.S.; Sardeshmukh, P.D.; Matsui, N.; Allan, R.J.; Yin, X.; Gleason, P.D.; Vose, P.D.; Rutledge, G.; Bessemoulin, P.; et al. The Twentieth Century Reanalysis Project. Q. J. R. Meteorol. Soc. 2011, 137, 1–28. [Google Scholar] [CrossRef]
  45. Otto-Bliesner, B.L.; Joussaume, S.; Braconnot, P.; Harrison, S.P.; Abe-Ouchi, A. Modeling and data syntheses of past climates. Eos Trans. Am. Geophys. Union 2009, 90, 93. [Google Scholar] [CrossRef]
  46. Taylor, K.E.; Stouffer, R.J.; Meehl, G.A. An Overview of CMIP5 and the Experiment Design, B. Am. Meteorol. Soc. 2012, 93, 485–498. [Google Scholar] [CrossRef] [Green Version]
  47. Emori, S.; Taylor, K.; Hewitson, B.; Zermoglio, F.; Juckes, M.; Lautenschlager, M.; Stockhause, M. CMIP5 data provided at the IPCC Data Distribution Centre. Fact Sheet of the Task Group on Data and Scenario Support for Impact and Climate Analysis (TGICA) of the Intergovernmental Panel on Climate Change (IPCC). 2016. Available online: https://www.dkrz.de/up/de-services/de-data-management/de-projects_cooperations/de-ipcc-data/de-ipcc-ddc-statistics/de-images/de-TGICA_Fact_Sheet_CMIP5_data_provided_at_the_IPCC_DDC_Ver_1_2016.pdf?lang=en (accessed on 4 March 2019).
  48. Gent, P.R.; Danabasoglu, G.; Donner, L.J.; Holland, M.M.; Hunke, E.C.; Jayne, S.R.; Lawrence, D.M.; Neale, R.B.; Rasch, P.J.; Vertenstein, M.; et al. The Community Climate System Model, Version 4. J. Clim. 2011, 24, 4973–4991. [Google Scholar] [CrossRef]
  49. Stevens, B.; Giorgetta, M.; Esch, M.; Mauritsen, T.; Crueger, T.; Rast, S.; Salzmann, M.; Schmidt, H.; Bader, J.; Block, K.; et al. The atmospheric component of the MPI-M earth system model: ECHAM6. J. Adv. Modeling Earth Syst. 2013, 2013, 1–27. [Google Scholar] [CrossRef]
  50. Dufresne, J.L.; Foujols, M.A.; Denvil, S.; Caubel, A.; Marti, O.; Aumont, O.; Balkanski, Y.; Bekki, S.; Bellenger, H.; Benshila, R.; et al. Climate change projections using the IPSL-CM5 Earth System Model: From CMIP3 to CMIP5. Clim. Dynam. 2013, 40, 2123–2165. [Google Scholar] [CrossRef]
  51. Schmidt, G.A.; Kelley, M.; Nazarenko, L.; Ruedy, R.; Russell, G.L.; Aleinov, I.; Bauer, M.; Bauer, S.E.; Bhat, M.K.; Bleck, R.; et al. Configuration and assessment of the GISS ModelE2 contributions to the CMIP5 archive. J. Adv. Modeling Earth Syst. 2014, 6, 141–184. [Google Scholar] [CrossRef]
  52. Otto-Bliesner, B.L.; Brady, E.C.; Fasullo, J.; Jahn, A.; Landrum, L.; Stevenson, S.; Rosenbloom, N.; Mai, A.; Strand, G. Climate Variability and Change since 850 C.E.: An Ensemble Approach with the Community Earth System Model (CESM). Am. Meteorol. Soc. 2016, 97, 735–754. [Google Scholar] [CrossRef]
  53. Wu, T.; Song, L.; Li, W.; Wang, Z.; Zhang, H.; Xin, X.; Zhang, Y.; Zhang, L.; Li, J.; Wu, F.; et al. An overview of BCC climate system model development and application for climate change studies. J. Meteorol. Res. 2014, 28, 34–56. [Google Scholar] [CrossRef]
  54. Crowley, T.J.; Unterman, M.B. Technical details concerning development of a 1200 yr proxy index for global volcanism. Earth Syst. Sci. Data 2013, 5, 187–197. [Google Scholar] [CrossRef] [Green Version]
  55. Gao, C.; Robock, A.; Ammann, C. Volcanic forcing of climate over the past 1500 years: An improved ice core-based index for climate models. J. Geophys. Res. 2008, 113, D23111. [Google Scholar] [CrossRef] [Green Version]
  56. Timmreck, C.; Pohlmann, H.; Illing, S.; Kadow, C. The impact of stratospheric volcanic aerosol on decadal-scale climate predictions. Geophys. Res. Lett. 2016, 43, 834–842. [Google Scholar] [CrossRef] [Green Version]
  57. Flückiger, J.; Monnin, E.; Stauffer, B.; Schwander, J.; Stocker, T.F.; Chappellaz, J.; Raynaud, D.; Barnola, J.-M. High resolution Holocene N2O ice core record and its relation-ship with CH4 and CO2. Glob. Biogeochem. Cycles 2002, 16, 1010. [Google Scholar] [CrossRef]
  58. MacFarling Meure, C.; Etheridge, D.; Trudinger, C.; Steele, P.; Langenfelds, R.; Van Ommen, T.; Smith, A.; Elkins, J. Law Dome CO2, CH4 and N2O ice core records extended to 2000 years BP. Geophys. Res. Lett. 2006, 33, 2000–2003. [Google Scholar] [CrossRef]
  59. Hansen, J.; Sato, M. Greenhouse gas growth rates. Proc. Natl. Acad. Sci. USA 2004, 101, 16109–16114. [Google Scholar] [CrossRef] [Green Version]
  60. Lamarque, J.-F.; Bond, T.C.; Eyring, V.; Granier, C.; Heil, A.; Klimont, Z.; Lee, D.; Liousse, C.; Mieville, A.; Owen, B.; et al. Historical (1850–2000) gridded anthropogenic and biomass burning emissions of reactive gases and aerosols: Methodology and application. Atmos. Chem. Phys. 2010, 10, 7017–7039. [Google Scholar] [CrossRef] [Green Version]
  61. Schmidt, G.A.; Jungclaus, J.H.; Ammann, C.M.; Bard, E.; Bra-connot, P.; Crowley, T.J.; Delaygue, G.; Joos, F.; Krivova, N.A.; Muscheler, R.; et al. Climate forc-ing reconstructions for use in PMIP simulations of the last mil-lennium (v1.0). Geosci. Model Dev. 2011, 4, 33–45. [Google Scholar] [CrossRef] [Green Version]
  62. Schmidt, G.A.; Jungclaus, J.H.; Ammann, C.M.; Bard, E.; Bra-connot, P.; Crowley, T.J.; Delaygue, G.; Joos, F.; Krivova, N.A.; Muscheler, R.; et al. Cli-mate forcing reconstructions for use in PMIP simulations of the Last Millennium (v1.1). Geosci. Model Dev. 2012, 5, 185–191. [Google Scholar] [CrossRef] [Green Version]
  63. Klein, F.; Goosse, H.; Graham, N.E.; Verschuren, D. Comparison of simulated andreconstructed variations in East African hydroclimate over the last millennium. Clim. Past 2016, 12, 1499–1518. [Google Scholar] [CrossRef] [Green Version]
  64. Seager, R.; Liu, H.; Henderson, N.; Simpson, I.; Kelley, C.; Shaw, T.; Kushnir, Y.; Ting, M. Causes of Increasing Aridification of the Mediterranean Region in Response to Rising Greenhouse Gases. J. Clim. 2014, 27, 4655–4676. [Google Scholar] [CrossRef] [Green Version]
  65. Dai, A.; National Center for Atmospheric Research Staff (Eds.) Last modified 12 Dec 2019. “The Climate Data Guide: Palmer Drought Severity Index (PDSI)”. Available online: https://climatedataguide.ucar.edu/climate-data/palmer-drought-severity-index-pdsi (accessed on 30 April 2020).
  66. Jacobi, J.; Perrone, D.; Duncan, L.L.; Hornberger, G. A tool for calculating the Palmer drought indexes. Water Resour. 2013, 49, 6086–6089. [Google Scholar] [CrossRef]
  67. Quadrelli, R.; Pavan, V.; Molteni, F. Wintertime variability of Mediterranean precipitation and its links with large-scale circulation anomalies. Clim. Dyn. 2011, 17, 457–466. [Google Scholar] [CrossRef]
  68. Conte, M.; Giuffrida, A.; Tedesco, S. The Mediterranean Oscillation. Impact on precipitation and hydrology in Italy Climate Water; Publications of the Academy of Finland: Helsinki, Finland, 1989. [Google Scholar]
  69. Palutikof, J.P.; Conte, M.; Casimiro Mendes, J.; Goodess, C.M.; Espirito Santo, F. Climate and climate change. In Mediterranean Desertification and Land Use; Brandt, C.J., Thornes, J.B., Eds.; John Wiley and Sons: London, UK, 1996. [Google Scholar]
  70. Palutikof, J.P. Analysis of Mediterranean climate data: Measured and modelled. In Mediterranean Climate: Variability and Trends; Springer-Verlag: Berlin, Germany, 2003. [Google Scholar]
  71. Douguedroit, A. Que peut-on dire d’une Oscillation Mediterraneenne? Clim. Environ. Chang. 1998, 135–136. [Google Scholar]
  72. Maheras, P.; Xoplaki, E.; Kutiel, H. Wet and dry monthly anomalies across the Mediterranean basin and their relationship with circulation 1860–1990. Theor. Appl. Climatol. 1999, 64, 189–199. [Google Scholar] [CrossRef]
  73. Ma, J.; Ja, L. The Western Mediterranean Oscillation and Iberian Peninsula Rainfall. Int. J. Climatol. 2006, 26, 1455–1475. [Google Scholar]
  74. Hoerling, M.; Jon, E.; Judith, P.; Xiaowei, Q.; Tao, Z.; Pegion, P. On the Increased Frequency of Mediterranean Drought. J. Clim. 2012, 6, 2146–2161. [Google Scholar] [CrossRef] [Green Version]
  75. Kelley, C.; Ting, M.; Seager, R.; Kushnir, Y. The relative contributions of radiative forcing and internal climate variability to the late 20th Century winter drying of the Mediterranean region. Clim. Dyn. 2012, 38, 2001–2015. [Google Scholar] [CrossRef] [Green Version]
  76. Marvel, K.; Bonfils, C. Identifying external influences on global precipitation. Proc. Natl. Acad. Sci. USA 2013, 110, 19301–19306. [Google Scholar] [CrossRef] [Green Version]
  77. Sousa, P.M.; Trigo, R.M.; Aizpurua, P.; Nieto, R.; Gimeno, L.; Garcia-Herrera, R. Trendsand extremes of drought indices throughout the 20th century in the Mediterranean. Nat. Hazards Earth Syst. Sci. 2011, 11, 33–51. [Google Scholar] [CrossRef] [Green Version]
  78. Jungclaus, J.H.; Lorenz, S.; Timmreck, C.; Reick, C.H.; Brovkin, V.; Six, K.; Segschneider, J.; Giorgetta, M.; Crowley, T.J.; Pongratz, J.; et al. Climate and carbon-cycle variability over the last millennium. Clim. Past. 2010, 6, 723–737. [Google Scholar] [CrossRef] [Green Version]
  79. Frankcombe, L.M.; England, M.H.; Mann, M.E.; Steinman, B.A. Separating internal variability from the externally forced climate response. J. Clim. 2015, 28, 8184–8202. [Google Scholar] [CrossRef]
Figure 1. Climate types over North Africa based on the Köppen–Geiger climate classification system, 1980–2016 (https://commons.wikimedia.org/wiki/File:World_K%C3%B6ppen_Classification.svg).
Climate 08 00062 g001
Figure 2. Study area. Precipitation is averaged over solid boxes (western, central, and eastern North Africa) (source: https://www.scribblemaps.com).
Climate 08 00062 g002
Figure 3. Circulation indices, North Atlantic Oscillation (NAO), Western Mediterranean Oscillation (WeMO), and Mediterranean Oscillation (MO), and zonal wind speed at 850 hPa (U850, averaged over black box as in [19]) (map source: https://www.scribblemaps.com).
Climate 08 00062 g003
Figure 4. Seasonal climatological cycle of precipitation datasets: observations (Delaware) [43] and six Coupled Model Intercomparison Project (CMIP5) climate simulations over 1979–2005 in North Africa (between –5° W–5° E and 34° N–36.5° N).
Climate 08 00062 g004
Figure 5. Pearson’s correlation coefficients between observed precipitation (Delaware) [43] and (A) NAO, (B) WeMO, (C) MO, and (D) U850 for the period 1979–2005. Dotted areas represent significant correlations at 95% confidence interval.
Climate 08 00062 g005
Figure 6. Pearson’s correlation coefficients between winter precipitation (observations, reanalysis, and CMIP5 simulations) and (A) NAO and (B) MO indices for western, central, and eastern North Africa during the recent period (1979–2005), the past century (1850–2005), and the past millennium (850–1850).
Climate 08 00062 g006
Figure 7. Pearson’s correlation coefficients between winter precipitation (observations, reanalysis, and CMIP5 simulations) and (A) WeMO and (B) U850 indices for western, central, and eastern North Africa during the recent period (1979–2005), the past century (1850–2005), and the past millennium (850–1850).
Climate 08 00062 g007
Figure 8. Loess-smoothed (30-year window) time series of monthly area averaged precipitation data for (A) western, (B) central, and (C) eastern parts of North Africa over the past millennium for PMIP3/CMIP5 model simulations and over the 20th century for observations and reanalysis.
Climate 08 00062 g008
Figure 9. Loess-smoothed time series (30-year window) of simulated U850 (PMIP3/CMIP5 models) over 850–2005. Red line represents ensemble mean for 10 CESM1 simulations and shaded red corresponds to standard deviation of the ensemble.
Climate 08 00062 g009
Figure 10. Loess-smoothed time series (30-year window) of summer (June, July, August (JJA)) PDSI in (A) Morocco and (B) Algeria in 850–2005 for CCSM4, MPI-ESM, and ensemble mean of CESM1 (mean of 10 members), and reconstructed and instrumental dataset (observation) from OWDA.
Climate 08 00062 g010
Table 1. Observations and reanalysis used in this study.
Observations and Reanalysis DataVersion and ResolutionDescriptionReference
GPCC V70.5° latitude × 0.5° longitude global grid (720 × 180)Monthly gridded land-surface precipitation from rain gauges built on GTS-based and historic data from 1901–2013 [42]
Delaware0.5° latitude × 0.5° longitude global grid (720 × 360)Monthly global gridded high-resolution station (land) data for air temperature and precipitation from 1900–2013[43]
20th century reanalysis
(20cRE)
2.0° latitude × 2.0° longitude global grid (180 × 91)Monthly gridded precipitation
Geopotential height
Zonal wind at 850 hPa (u-wind) from 1901–2013
[44]
Table 2. Modelling centers, characteristics, and references of Coupled Model Intercomparison Project (CMIP5) models used in this study.
Model nameInstitutionPeriod Covered Data Availability During the StudyAtmospheric Resolution
Horizontal Vertical
Reference
CCSM4National Center for Atmospheric Research (NCAR), USAPast millennium


Past century
850–2005280 × 20027[48]
MPI-ESM-PMax Planck Institute for Meteorology (MPI-M), Germany940–2005192 × 9647[49]
IPSL-CM5A-LRInstitut Pierre-Simon Laplace850–200596 × 9639[50]
GISS-E2-RNASA Goddard Institute for Space Studies850–2005250 × 20040[51]
CESM1NCAR, USA850–2005144 × 9627[52]
BCC-CSM1Beijing Climate Center, China Meteorological Administration850–2005128 × 6426[53]
Table 3. Results of modified Mann–Kendall test for precipitation trend detection for six Palaeoclimate Modeling Intercomparison Project (PMIP3)/CMIP5 models over 1800–2005 in the three parts of North Africa. Significant test results (p-value ≤0.05) shown in red.
Period1800–2005
RegionTime SeriesP-Value Slope (mm/day/year)
WesternCCSM4
MPI-ESM-P
IPSL-CM5A-LR
GISS-E2-R
BCC-CSM1
CESM1
0.01
0.003
0.0008
0.04
0.1
0.1
−0.0006
−0.001
−0.0006
−0.0004


CentralCCSM4
MPI-ESM-P
IPSL-CM5A-LR
GISS-E2-R
BCC-CSM1
CESM1
0.02
0.007
0.0002
0.2
0.001
0.003
−0.0002
−0.0006
−0.0004

−0.0004
−0.0005
EasternCCSM4
MPI-ESM-P
IPSL-CM5A-LR
GISS-E2-R
BCC-CSM1
CESM1
0.04
0.002
0.02
0.007
0.003
0.01
−0.0002
−0.0008
−0.0005
−0.0009
−0.0006
−0.0004
Note: The red color in the P-value column is to highlight in which dataset the modified Mann-Kendall test for trend detection is significant.
Table 4. Results of modified Mann–Kendall test for precipitation trend detection for observations and reanalysis over 1950–2005 in three parts of North Africa. Significant test results (p-value ≤0.05) shown in red.
1950–2005
RegionTime seriesP-value Slope (mm/day/year)
WesternObservation
Reanalysis
0.017
0.003
−0.008
−0.001
CentralObservation
Reanalysis
0.015
0.003
−0.003
−0.007
EasternObservation
Reanalysis
0.02
0.04
−0.001
−0.004
Note: The red color in the P-value column is to highlight in which dataset the modified Mann-Kendall test for trend detection is significant.
Table 5. Results of modified Mann–Kendall test of U850 trend detection for six PMIP3/CMIP5 model simulations over 850–1800 and 1800–2005 in North Africa. (Red indicates significance, with a p-value <0.05.).
Period1800–2005
LocationModel Time Series P-ValueSlope (m/s)
North Africa
(25–33° N, 10° W–23° E)
CCSM4
MPI-ESM-P
IPSL-CM5A-LR
GISS-E2-R
BCC-CSM1
CESM1 (ensemble mean)
0.04
0.01
0.8
0.5
0.03
0.01
−0.001
−0.001


−0.001
−0.001
Note: The red color in the P-value column is to highlight in which dataset the modified Mann-Kendall test for trend detection is significant.
Table 6. Results of modified Mann–Kendall test of trend detection applied to Palmer Drought Severity Index PDSI simulated by CMIP5 models, reconstructed from Old World Drought Atlas (OWDA) over 1850–2005 in Morocco and Algeria. (Red indicates significance, with a p-value <0.05.).
Period1850–2005
LocationPDSI Time seriesP-valueSlope

Algeria
CCSM4
MPI-ESM
CESM1 (mean of 10 members)
Reconstructed OWDA
0.007
0.002
1.9 × 10−07
0.002
−0.006
−0.008
−0.006
−0.006

Morocco
CCSM4
MPI-ESM
CESM1 (mean of 10 members)
Reconstructed OWDA
0.001
0.0004
1.2 × 10−06
0.003
−0.008
−0.009
−0.008
−0.005
Note: The red color in the P-value column is to highlight in which dataset the modified Mann-Kendall test for trend detection is significant.
Table 7. Results of modified Mann–Kendall test of trend detection applied to observed PDSI over 1901–2005 in Morocco and Algeria. (Red indicates significance, with a p-value <0.05.).
Period1901–2005
LocationPDSI Time Series P-ValueSlope
AlgeriaInstrumental data 0.004−0.01
MoroccoInstrumental data0.005−0.01
Note: The red color in the P-value column is to highlight in which dataset the modified Mann-Kendall test for trend detection is significant.

