Next Issue
Volume 8, September
Previous Issue
Volume 8, July


Climate, Volume 8, Issue 8 (August 2020) – 7 articles

Cover Story (view full-size image): 
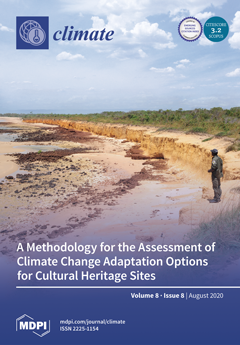
Climate change threatens to destroy hundreds of thousands of the world’s cultural heritage sites. These sites play a significant role in community identity, cohesion, and sense of place, and this is particularly the case for Indigenous peoples. In Northern Australia, Indigenous rangers from Kakadu National Park and the Djelk Indigenous Protected Area have perceptions of sea level rise and more extreme storm surges increasing erosion of coastal middens, and more extreme and frequent precipitation events eroding inland riverine rock art. In response, rangers conducted a risk analysis to identify the most vulnerable sites. They then tested a methodology aimed at assisting them in identifying and appraising a range of adaptive actions for deployment at those sites. View this paper.
  • Issues are regarded as officially published after their release is announced to the table of contents alert mailing list.
  • You may sign up for e-mail alerts to receive table of contents of newly released issues.
  • PDF is the official format for papers published in both, html and pdf forms. To view the papers in pdf format, click on the "PDF Full-text" link, and use the free Adobe Reader to open them.
Order results
Result details
Section
Select all
Export citation of selected articles as:
20 pages, 4407 KiB  
Article
Assessing the Potential Impacts of Climate Changes on Rainfall and Evapotranspiration in the Northwest Region of Bangladesh
by Fazlul Karim, Mohammed Mainuddin, Masud Hasan and Mac Kirby
Climate 2020, 8(8), 94; https://0-doi-org.brum.beds.ac.uk/10.3390/cli8080094 - 12 Aug 2020
Cited by 12 | Viewed by 4384
Abstract
Changes in the natural climate is a major concern for food security across the world, including Bangladesh. This paper presents results from an analysis on quantitative assessment of changes in rainfall and potential evapotranspiration (PET) in the northwest region of Bangladesh, which is [...] Read more.
Changes in the natural climate is a major concern for food security across the world, including Bangladesh. This paper presents results from an analysis on quantitative assessment of changes in rainfall and potential evapotranspiration (PET) in the northwest region of Bangladesh, which is a major agricultural hub in the country. The study was conducted using results from 28 global climate models (GCMs), based on IPCC’s 5th assessment report (AR5) for two emission scenarios. Projections were made over the period of 2045 to 2075 for 16 administrative districts in the study area, and the changes were estimated at annual, seasonal and monthly time scale. More projections result in an increase in rainfall than decrease, while almost all projections show an increase in PET. Although annual rainfall is generally projected to increase, some projections show a decrease in some months, especially in December and January. Across the region, the average change projected by the 28 GCMs for the moderate emission was an increase of 235 mm (12.4%) and 44 mm (3.4%) for rainfall and PET, respectively. Increases in rainfall and PET are slightly higher (0.6% and 0.2%, respectively) under high emission scenarios. Increases in both rainfall and PET were projected for two major cropping seasons, Kharif (May-Oct) and Rabi (Nov-Apr). Projections of rainfall show increase in the range of 160 to 250 mm (with an average of 200 mm) during the Kharif season. Although an increase is projected in the Rabi season, the amount is very small (~10mm). It is important to note that rainfall increases mostly in the Kharif season, but PET increases for both Kharif and Rabi seasons. Contrary to rainfall, increase in PET is higher during Rabi season. This information is crucial for better adaptation under increased water demand for agricultural and domestic use. Full article
Show Figures

Figure 1

18 pages, 9685 KiB  
Article
Development of a Parametric Regional Multivariate Statistical Weather Generator for Risk Assessment Studies in Areas with Limited Data Availability
by Saddam Q. Waheed, Neil S. Grigg and Jorge A. Ramirez
Climate 2020, 8(8), 93; https://0-doi-org.brum.beds.ac.uk/10.3390/cli8080093 - 11 Aug 2020
Cited by 7 | Viewed by 2640
Abstract
Risk analysis of water resources systems can use statistical weather generators coupled with hydrologic models to examine scenarios of extreme events caused by climate change. These require multivariate, multi-site models that mimic the spatial, temporal, and cross correlations of observed data. This study [...] Read more.
Risk analysis of water resources systems can use statistical weather generators coupled with hydrologic models to examine scenarios of extreme events caused by climate change. These require multivariate, multi-site models that mimic the spatial, temporal, and cross correlations of observed data. This study developed a statistical weather generator to facilitate bottom-up approaches to assess the impact of climate change on water resources systems for cases of limited data. While existing weather generator models have impressive features, this study suggested a simple weather generator which is straightforward to implement and can employ any distribution function for variables such as precipitation or temperature. It is based on (1) a first-order, two-state Markov chain to simulate precipitation occurrences; (2) the use of Wilks’ technique to produce correlated weather variables at multiple sites with the conservation of spatial, temporal, and cross correlations; (3) the capability to vary the statistical parameters of the weather variables. The model was applied to studies of the Diyala River basin in Iraq, which is a case with limited observed records. Results show that it exhibits high values (e.g., over 0.95) for the Nash–Sutcliffe and Kling–Gupta metric tests, preserves the statistical properties of the observed variables, and conserves the spatial, temporal, and cross correlations among the weather variables in the meteorological stations. Full article
(This article belongs to the Special Issue Application of Climatic Data in Hydrologic Models)
Show Figures

Figure 1

29 pages, 7008 KiB  
Article
Greening and Browning Trends of Vegetation in India and Their Responses to Climatic and Non-Climatic Drivers
by Bikash Ranjan Parida, Arvind Chandra Pandey and N.R. Patel
Climate 2020, 8(8), 92; https://0-doi-org.brum.beds.ac.uk/10.3390/cli8080092 - 09 Aug 2020
Cited by 61 | Viewed by 8595
Abstract
It is imperative to know the spatial distribution of vegetation trends in India and its responses to both climatic and non-climatic drivers because many ecoregions are vulnerable to global climate change. Here we employed the NDVI3g satellite data over the span of 35 [...] Read more.
It is imperative to know the spatial distribution of vegetation trends in India and its responses to both climatic and non-climatic drivers because many ecoregions are vulnerable to global climate change. Here we employed the NDVI3g satellite data over the span of 35 years (1981/82–2015) to estimate vegetation trends and corresponding climatic variables trends (i.e., precipitation, temperature, solar radiation and soil moisture) by using the Mann–Kendall test (τ) and the Theil–Sen median trend. Analysis was performed separately for the two focal periods—(i) the earlier period (1981/82–2000) and (ii) later period (2000–2015)—because many ecoregions experienced more warming after 2000 than the 1980s and 1990s. Our results revealed that a prominent large-scale greening trend (47% of area) of vegetation continued from the earlier period to the later period (80% of area) across the northwestern Plain and Central India. Despite climatologically drier regions, the stronger greening trend was also evident over croplands which was attributed to moisture-induced greening combined with cooling trends of temperature. However, greening trends of vegetation and croplands diminished (i.e., from 84% to 40% of area in kharif season), especially over the southern peninsula, including the west-central area. Such changes were mostly attributed to warming trends and declined soil moisture trends, a phenomenon known as temperature-induced moisture stress. This effect has an adverse impact on vegetation growth in the Himalayas, Northeast India, the Western Ghats and the southern peninsula, which was further exaggerated by human-induced land-use change. Therefore, it can be concluded that vegetation trend analysis from NDVI3g data provides vital information on two mechanisms (i.e., temperature-induced moisture stress and moisture-induced greening) operating in India. In particular, the temperature-induced moisture stress is alarming, and may be exacerbated in the future under accelerated warming as it may have potential implications on forest and agriculture ecosystems, including societal impacts (e.g., food security, employment, wealth). These findings are very valuable to policymakers and climate change awareness-raising campaigns at the national level. Full article
Show Figures

Figure 1

3 pages, 181 KiB  
Editorial
SI: Air Pollution and Plant Ecosystems
by Evgenios Agathokleous, Elisa Carrari and Pierre Sicard
Climate 2020, 8(8), 91; https://0-doi-org.brum.beds.ac.uk/10.3390/cli8080091 - 09 Aug 2020
Viewed by 2877
Abstract
Air pollution continues to be a serious issue for plant health and terrestrial ecosystems. In this issue of climate, some papers relevant to air pollution and its potential impacts on plant health and terrestrial ecosystems are collated. The papers provide some new insights [...] Read more.
Air pollution continues to be a serious issue for plant health and terrestrial ecosystems. In this issue of climate, some papers relevant to air pollution and its potential impacts on plant health and terrestrial ecosystems are collated. The papers provide some new insights and offer the opportunity to further advance the current understandings of air pollution and its linked impacts at different levels. Full article
(This article belongs to the Special Issue Air Pollution and Plant Ecosystems)
26 pages, 6028 KiB  
Article
Spatial and Temporal Distribution of Biomass Open Burning Emissions in the Greater Mekong Subregion
by Agapol Junpen, Jirataya Roemmontri, Athipthep Boonman, Penwadee Cheewaphongphan, Pham Thi Bich Thao and Savitri Garivait
Climate 2020, 8(8), 90; https://0-doi-org.brum.beds.ac.uk/10.3390/cli8080090 - 06 Aug 2020
Cited by 6 | Viewed by 3573
Abstract
Moderate Resolution Imaging Spectroradiometer (MODIS) burnt area products are widely used to assess the damaged area after wildfires and agricultural burning have occurred. This study improved the accuracy of the assessment of the burnt areas by using the MCD45A1 and MCD64A1 burnt area [...] Read more.
Moderate Resolution Imaging Spectroradiometer (MODIS) burnt area products are widely used to assess the damaged area after wildfires and agricultural burning have occurred. This study improved the accuracy of the assessment of the burnt areas by using the MCD45A1 and MCD64A1 burnt area products with the finer spatial resolution product from the Landsat-8 Operational Land Imager/Thermal Infrared Sensor (OLI/TIRS) surface reflectance data. Thus, more accurate wildfires and agricultural burning areas in the Greater Mekong Subregion (GMS) for the year 2015 as well as the estimation of the fire emissions were reported. In addition, the results from this study were compared with the data derived from the fourth version of the Global Fire Emissions Database (GFED) that included small fires (GFED4.1s). Upon analysis of the data of the burnt areas, it was found that the burnt areas obtained from the MCD64A1 and MCD45A1 had lower values than the reference fires for all vegetation fires. These results suggested multiplying the MCD64A1 and MCD45A1 for the GMS by the correction factors of 2.11−21.08 depending on the MODIS burnt area product and vegetation fires. After adjusting the burnt areas by the correction factor, the total biomass burnt area in the GMS during the year 2015 was about 33.3 million hectares (Mha), which caused the burning of 109 ± 22 million tons (Mt) of biomass. This burning emitted 178 ± 42 Mt of CO2, 469 ± 351 kilotons (kt) of CH4, 18 ± 3 kt of N2O, 9.4 ± 4.9 Mt of CO, 345 ± 206 kt of NOX, 46 ± 25 kt of SO2, 147 ± 117 kt of NH3, 820 ± 489 kt of PM2.5, 60 ± 32 kt of BC, and 350 ± 205 kt of OC. Furthermore, the emission results of fine particulate matter (PM2.5) in all countries were slightly lower than GFED4.1s in the range between 0.3 and 0.6 times. Full article
(This article belongs to the Section Climate and Environment)
Show Figures

Graphical abstract

18 pages, 22890 KiB  
Article
Trend Analysis of Air Temperature in the Federal District of Brazil: 1980–2010
by Valdir Adilson Steinke, Luis Alberto Martins Palhares de Melo, Mamedes Luiz Melo, Rafael Rodrigues da Franca, Rebecca Luna Lucena and Ercilia Torres Steinke
Climate 2020, 8(8), 89; https://0-doi-org.brum.beds.ac.uk/10.3390/cli8080089 - 29 Jul 2020
Cited by 6 | Viewed by 2879
Abstract
This study was designed to identify trends in maximum, minimum, and average air temperatures in the Federal District of Brazil from 1980 to 2010, measured at five weather stations. Three statistical tests (Wald–Wolfowitz, Cox–Stuart, and Mann–Kendall) were tested for their applicability for this [...] Read more.
This study was designed to identify trends in maximum, minimum, and average air temperatures in the Federal District of Brazil from 1980 to 2010, measured at five weather stations. Three statistical tests (Wald–Wolfowitz, Cox–Stuart, and Mann–Kendall) were tested for their applicability for this purpose, and the ones found to be most suitable for the data series were validated. For this data sample, it was observed that the application of the Wald–Wolfowitz test and its validation by the Cox–Stuart and Mann–Kendall tests was the best solution for analyzing the air temperature trends. The results showed an upward trend in average and maximum air temperature at three weather stations, a downward trend at one, and the absence of any trend at two. If the trend of increasing air temperature in the Federal District persists, it could have a negative impact on various sectors of society, mainly on the health of the population, especially during the dry season when more cases of respiratory diseases are registered. These results could serve as inputs for public administrators involved in the planning and formulation of public policies. Full article
(This article belongs to the Section Climate and Environment)
Show Figures

Figure 1

19 pages, 2221 KiB  
Article
A Methodology for the Assessment of Climate Change Adaptation Options for Cultural Heritage Sites
by Bethune Carmichael, Greg Wilson, Ivan Namarnyilk, Sean Nadji, Jacqueline Cahill, Sally Brockwell, Bob Webb, Deanne Bird and Cathy Daly
Climate 2020, 8(8), 88; https://0-doi-org.brum.beds.ac.uk/10.3390/cli8080088 - 24 Jul 2020
Cited by 12 | Viewed by 4292
Abstract
Cultural sites are particularly important to Indigenous peoples, their identity, cosmology and sociopolitical traditions. The benefits of local control, and a lack of professional resources, necessitate the development of planning tools that support independent Indigenous cultural site adaptation. We devised and tested a [...] Read more.
Cultural sites are particularly important to Indigenous peoples, their identity, cosmology and sociopolitical traditions. The benefits of local control, and a lack of professional resources, necessitate the development of planning tools that support independent Indigenous cultural site adaptation. We devised and tested a methodology for non-heritage professionals to analyse options that address site loss, build site resilience and build local adaptive capacity. Indigenous rangers from Kakadu National Park and the Djelk Indigenous Protected Area, Arnhem Land, Australia, were engaged as fellow researchers via a participatory action research methodology. Rangers rejected coastal defences and relocating sites, instead prioritising routine use of a risk field survey, documentation of vulnerable sites using new digital technologies and widely communicating the climate change vulnerability of sites via a video documentary. Results support the view that rigorous approaches to cultural site adaptation can be employed independently by local Indigenous stakeholders. Full article
(This article belongs to the Section Policy, Governance, and Social Equity)
Show Figures

Figure 1

Previous Issue
Next Issue
Back to TopTop