Article

Spatial and Temporal Distribution of Biomass Open Burning Emissions in the Greater Mekong Subregion

by
Agapol Junpen
1,2,
Jirataya Roemmontri
3,*,
Athipthep Boonman
1,
Penwadee Cheewaphongphan
4,
Pham Thi Bich Thao
1,2 and
Savitri Garivait
1,2
1
The Joint Graduate School of Energy and Environment (JGSEE), King Mongkut’s University of Technology Thonburi (KMUTT), Bangkok 10140, Thailand
2
Center of Excellence on Energy Technology and Environment (CEE–PERDO), Ministry of Education, Bangkok 10140, Thailand
3
Faculty of Environment and Resource Studies, Mahidol University, Phutthamonthon Nakhon Pathom 73170, Thailand
4
National Institute for Environmental Studies (NIES), 16-2 Onogawa, Tsukuba, Ibaraki 305-8506, Japan
*
Author to whom correspondence should be addressed.
Submission received: 3 July 2020 / Revised: 4 August 2020 / Accepted: 4 August 2020 / Published: 6 August 2020
(This article belongs to the Section Climate and Environment)

Abstract

:
Moderate Resolution Imaging Spectroradiometer (MODIS) burnt area products are widely used to assess the damaged area after wildfires and agricultural burning have occurred. This study improved the accuracy of the assessment of the burnt areas by using the MCD45A1 and MCD64A1 burnt area products with the finer spatial resolution product from the Landsat-8 Operational Land Imager/Thermal Infrared Sensor (OLI/TIRS) surface reflectance data. Thus, more accurate wildfires and agricultural burning areas in the Greater Mekong Subregion (GMS) for the year 2015 as well as the estimation of the fire emissions were reported. In addition, the results from this study were compared with the data derived from the fourth version of the Global Fire Emissions Database (GFED) that included small fires (GFED4.1s). Upon analysis of the data of the burnt areas, it was found that the burnt areas obtained from the MCD64A1 and MCD45A1 had lower values than the reference fires for all vegetation fires. These results suggested multiplying the MCD64A1 and MCD45A1 for the GMS by the correction factors of 2.11−21.08 depending on the MODIS burnt area product and vegetation fires. After adjusting the burnt areas by the correction factor, the total biomass burnt area in the GMS during the year 2015 was about 33.3 million hectares (Mha), which caused the burning of 109 ± 22 million tons (Mt) of biomass. This burning emitted 178 ± 42 Mt of CO2, 469 ± 351 kilotons (kt) of CH4, 18 ± 3 kt of N2O, 9.4 ± 4.9 Mt of CO, 345 ± 206 kt of NOX, 46 ± 25 kt of SO2, 147 ± 117 kt of NH3, 820 ± 489 kt of PM2.5, 60 ± 32 kt of BC, and 350 ± 205 kt of OC. Furthermore, the emission results of fine particulate matter (PM2.5) in all countries were slightly lower than GFED4.1s in the range between 0.3 and 0.6 times.

Graphical Abstract

1. Introduction

The Greater Mekong Subregion (GMS) is a group of countries located in the northern part of Southeast Asia and Southern China consisting of Cambodia, Lao People’s Democratic Republic, Myanmar, Thailand, Vietnam, and Yunnan province and Guangxi Zhuang Autonomous Region, China. The GMS occupies a large amount of agricultural area, particularly rice, corn, and sugar cane, as well as forested area, including deciduous forest or evergreen forest [1,2]. Burning in agricultural and forested areas is a common practice in the GMS [3,4]. According to the report of the ASEAN Specialized Meteorological Centre (ASMC), which monitors the occurrence of fire in the Association of Southeast Asian Nations (ASEAN) by using the National Oceanic and Atmospheric Administration (NOAA)’s satellite information, about 26,000−126,000 hotspots were found in the GMS during the years 2009–2018, especially during the dry season [5].
Due to the biomass burning situation, people in the GMS face an air pollution problem. In Thailand, the Pollution Control Department (PCD) monitors the air quality in Northern Thailand, nearby the forested and agricultural areas, and reported that the 24-h mean concentrations of PM2.5 during February–May 2019 were in the range of 38–151 micrograms per cubic meter (µg/m3) [6]. Additionally, the World Health Organization (WHO)’s air quality guidelines advise that PM2.5 should not exceed a 25 µg/m3 24-h mean [7]); however, 112 days of this 120-day period were reported to be over this standard [6]. Fine particles from biomass open burning have an influence on the people who live in the GMS and transboundary neighboring countries. Khamkaew et al. [8] studied the chemical composition of aerosol particles from emissions occurring during the dry season of 2014 in the northern part of Thailand and found that biomass open burning was an important source of PM2.5 released into the atmosphere. Liang et al. [4] found the impact on background aerosols in Southern China (the northern part of the GMS) from the long-range transport of aerosols from biomass burning over the Indochinese Peninsula during March–May 2015.
There are various types of information related to the inventories of biomass burning emissions based on the burnt area derived from satellite products; for example, the Global Fire Emissions Database (GFED) [9], Global Fire Assimilation System (GFAS) [10], the Fire INventory from NCAR (FINN) [11], and the Global Inventory for Chemistry−Climate studies (GICC) [12]. All this information is open access, which can be used as input data for air quality simulation as well as air quality management planning.
The GFAS v1.0 employs the measurement of fire radiative power (FRP) derived from the fire product MOD14 [13,14], which is linked to the biomass consumption rate [15]. The FRP data are obtained at shortwave infrared wavelengths of around 3.9 µm, which measures the radiant energy released per unit of time by the burnt biomass during the combustion process (MJ/s). The results of the GFASv1.0 are able to estimate the emissions in real time and present the high spatial and temporal resolutions of fire emissions.
The emission assessments of the FINN, GICC, and GFED are calculated based on the burnt area derived from multiple satellite products. The FINN uses active fires from the MODIS Thermal Anomalies Product [16], whereas the GICC uses the burnt area data set from the Global Burnt Area 2000 Project (GBA2000) derived from the SPOT VEGETATION Earth Observation system, known as the L3JRC product [17,18].
The GFED uses the MODIS global burnt area products, which continuously improves the assessment of the burnt area. Recently, GFED version 3.1 (GFED v3.1) assessed the emissions from biomass open burning by using the burnt area data set developed by Giglio et al. [19], which reported that during the 1997−2010 period, the annual average of released carbon (C) was approximately 89 million tons (Mt) of C in the GMS consisting of 10.8 Mt of C from savannah fires, 3.6 Mt of C from woodland fires, 62.8 Mt of C from deforestation and degradation fires, 7.5 Mt of C from forest fires, and 4.3 Mt of C from agricultural waste burning. The highest annual average of released C was found in Myanmar (40 Mt of C), followed by Cambodia at 21 Mt of C, Thailand with 12 Mt of C, Lao PDR. with 12 Mt of C, and Vietnam with 4 Mt of C. Additionally, the annual average emissions from biomass open burning consist of 300 Mt of CO2, 1 Mt of CH4, 0.4 Mt of N2O, 17 Mt of CO, 0.1 Mt of BC, 0.8 Mt of OC, and 1.6 Mt of PM2.5 [20].
Lastly, data from the GFED version 4.1 that included small fires (GFED 4.1s), developed by van der Werf et al. [21], was released in the year 2017. This version assessed the burnt area data set from Giglio et al. [22] and small fire burnt areas from Randerson et al. [23], which was updated by van der Werf et al. [21]. A small fire is a burning area, smaller than the spatial resolution of the MODIS product, which is assessed by using the MOD14A1 active fire (1-km resolution) information together with the MCD64A1 Burnt Area Product (500-m resolution) information. Randerson et al. [23] found that during the years 2001–2010, the global burnt area increased about 35% or 120 million hectares per year (Mha/y) due to the burning of small fires, which included 46.4 Mha/y from burning of woody savannah, 30.5 Mha/y from savannah, 11.8 Mha/y from burning of cropland, 11.2 Mha/y from vegetation mosaics, and 9.6 Mha/y from grassland. This study also suggested to validate the assessment of small fire areas by using a finer resolution product to obtain an accurate assessment of the burnt area.
From the recommendation of Randerson et al. [23], other research validated the MODIS burnt area products with the reference to higher resolution satellite products. Tsela et al. [24] presented the validation results for the MCD45A1 and MCD64A1 products from MODIS across four fire-prone biomes in South Africa encompassing savannah, grassland, fynbos, and exotic pine forest plantations. The methods were based on the error matrix and MODIS subpixel analysis to compare the 500-m burnt area products with the fire reference data from the multitemporal Landsat TM imagery distributed over six validation sites. The results indicated that the MCD45A1 presented higher detection probabilities in the range of 3.0–37.9% for small fractions (≤50% of a burnt MODIS pixel), whereas the MCD64A1 appeared more reliable in the range of 12.0–89.2% in detecting large fractions (>50% of a burnt MODIS pixel), respectively.
Next, Zhu et al. [25] focused on the 2012 burning season in Boreal Eurasia to determine the correction factors for the total area burnt via validation of the MCD64A1 burnt area product with reference burnt areas, including the Landsat 7 ETM+, RapidEye, WorldView−2, and GeoEye−1 (spatial resolution of 30, 5, 2, and 2 m, respectively) satellites. The main result showed that the burnt area from the MCD64A1 comprised only 13% of the reference burnt areas in the cropland. The results indicated that the MCD64A1 could be corrected by multiplying with the correction factors. On an ecotype basis, the correction factors were estimated as 7.70 for the cropland, 0.80 for mixed forest, 1.40 for deciduous forest, 0.47 for wetlands, 0.99 for grassland, and 0.95 for shrubland.
Lastly, Fornacca et al. [26] evaluated the potential of the MCD64A1 product to detect fire events in a mountainous area of Northwest Yunnan, China. The burnt area was compared with a reference fire data set based on the visual interpretation of the Landsat TM scenes for two sample years (2006 and 2009). The MCD64A1 product showed lower performances in the detection of fire events. Fires smaller than 50 ha were poorly detected by the products. The probability of detection increased by 25% for fire sizes larger than 50 ha, and when excluding smaller fire events from the analysis.
According to the findings of previous studies [21], the current monitoring of biomass burning emissions in the GMS has been based on the medium to coarse resolution fire data. Additionally, the current air quality model to support the air quality management used the global emission database for biomass burning emissions, e.g., GFED [27], which was found to be insufficient for identifying the areas to reduce haze pollution in the GMS. Hence, this study was designed to estimate more accurate burnt areas and fire emissions in the GMS (excluding China) for the year 2015 based on the MODIS burnt area products. We identified the corrective factors to adjust the burnt area derived from the MCD45A1 and MCD64A1 products. Furthermore, this work provided spatial and temporal gridded emissions from biomass open burning to support air quality modelling and management. Finally, the emissions obtained from this study were compared with those from the GFED4.1s. The targeted emissions included CO2, CH4, N2O, CO, NOX, SO2, NH3, PM2.5, BC, and OC.

2. Materials and Methods

2.1. Assessment of the Emissions from Biomass Open Burning

The emissions from biomass open burning could be estimated using the equation developed by Seiler and Crutzen [28], which represented the relationship between the combustion process and its emission. This was as follows:
E i = M × E F i × 10 3 ,
where Ei is the air pollutant emission i (t); M is the mass of dry matter burnt (t of dry matter), and EFi is the emission factor of the air pollutant i (g/kg of dry matter burnt). The amount of the burnt biomass was determined using the modified version of the equation provided in the Revised 1996 IPCC Guidelines for National Greenhouse Gas Inventories [29]. The equation was expressed as follows:
M = B A × B L × C C ,
where BA is the burnt area (ha) while BL is the biomass load (t of dry matter/ha), and CC is the fraction of the mass combusted by fire, also known as the combustion completeness (unitless). For the emission factors of biomass burning, this study referred to the report of Akagi et al. [30]. They reviewed the set of the emission factors from various studies, which was measured in a laboratory or in the field. They considered a subset of the available literature focusing on the measurements of smoke that had cooled to an ambient temperature. The value was reported in terms of the mean values, which were used to estimate the fire emissions in the GFED4.1s. The values of the emission factors for each of the analyzed trace gases or aerosols are summarized in Table 1.
This study used the propagation of errors method to present the range of fire emissions (Ei ± δEi) providing Ei (BA,BL,CC,EF) as the function, which showed the relationship of the factor variables. The calculations of the uncertainty of the emissions estimation ( δ E i ) are presented in Equations (3) and (4).
E i ( B A ,   B L ,   C C ,   E F ) = B A a × B L b × C C c × E F i d ,
δ E i = E i × ( a δ B A B A ) 2 + ( b δ B L B L ) 2 + ( c δ C C C C ) 2 + ( d δ E F i E F i ) 2 .

2.2. Assessment of the Burnt Area in the GMS

The estimation of the burnt areas directly from the MODIS burnt area product had a relatively large rate of errors of detection of small fire sizes (<50 ha) because of the medium to coarse resolution of the products [25,26,27]. To avoid such errors, this study used higher resolution spatial satellite images as a reference fire to adjust the burnt area-derived MODIS products. This study used the MCD64A1 and MCD45A1 together with the Landsat-8 with a 30-m resolution to evaluate the corrective factor for the burnt area in Northern Thailand (Figure 1) covering forested and agricultural areas for the years 2014–2016, which classified the burnt area into five vegetation types: Cropland, forestland, savannah, grassland, and shrubland. The information of each satellite product used in this study is as follows:

2.2.1. The MODIS Burnt Area Product (MCD45A1)

The MCD indicated that the MODIS on board both the Aqua and Terra satellites provided input data and the number 45 indicated the burnt area product [31]. There were three different formats of the MODIS burnt area product: The official MCD45A1 in the MODIS Hierarchical Data Format, NASA Earth Observation System (HDF-EOS), and the Geotiff and Shapefile versions. In this study, we used the Geotiff version of the MCD45 monthly product, which was derived from the standard MCD45A1 HDF version developed by the University of Maryland Information for Resource Management System for the global detection of fires (http://modis-fire.umd.edu/) [32]. The version was reprojected from the world Plate Carree projection map and showed a set of subcontinental windows (24 windows) [33,34,35]. The algorithm of the product used a bidirectional reflectance distribution function (BRDF) model based on a change detection approach, which removed all the MODIS band 6 (mid-infrared, 1550–1750 nm) multi-temporal tests, and caused omission errors on the land surface with temperatures greater than 327.7 K. This was used over certain forested areas and agricultural land and detected the burning per pixel by daily (range 1–366) gridded MODIS at a 500 m × 500 m spatial resolution land surface reflectance time series [34,35].

2.2.2. The MODIS Burnt Area Product (MCD64A1)

In this study, we also used the MODIS burnt area product version 6 (MCD64A1) [36,37] to estimate the burnt areas in the GMS. The general improvement of version 6 was the reduction of error in terms of the detection of the burnt areas. Significantly, this provided better detection for small burns [37]. The MCD64A1 product was a monthly global gridded 500 m product containing per-pixel burnt-area and quality information. The MCD64A1 burnt area mapping approach employed MODIS surface reflectance imagery (500 m resolution) combined with MODIS active fire observations (1-km resolution). The hybrid algorithm applied dynamic thresholds to compound the imagery generated from a burn-sensitive vegetation index (VI), providing VI was equal to (b5 − b7)/(b5 + b7), where bi referred to the reflectance of band i. The mapping algorithm ultimately identified the date of the burning for the 500-m grid cells within the individual MODIS tile being processed (http://modis-fire.umd.edu/) [32].

2.2.3. Reference Fires

We assessed the MODIS burnt area products occurring in the study area (Thailand’s northern region as seen in Figure 1) over a three-year period (2014–2016) by using Landsat-8 OLI/TIRS satellite images. The burn scars (reference fires) were created by using medium spatial resolution (30 m) and a 16-day temporal resolution by the using the Landsat-8 Operational Land Imager/Thermal Infrared Sensor (OLI/TIRS) surface reflectance data products through Earth-Explorer (EROS) (http://earthexplorer.usgs.gov) [38]. Landsat imagery has been available for acquisition as a free download from 2013 to the present using the Earth-Explorer tools to select specific scenes. Reference fires focused on the fires occurring in the five vegetation types: Cropland, forestland, savannah, grassland, and shrubland. The satellite imagery technique involved an analysis of the selected prefire and post−fire conditions that represented equations as the differenced normalized burn ratio (∆NBR) derived from Key and Benson [39] to interpret the polygon of the burn scars. The equations are provided in the following formulas:
Δ N B R = ( N B R p r e N B R p o s t ) × 1000 ,
N B R p r e = ( N I R M I R ) / ( N I R + M I R ) ,
N B R p o s t = ( N I R M I R ) / ( N I R + M I R ) ,
where ∆NBR is a differenced Normalized burn ratio, NBRpre is a normalized burn ratio of a pre-burn image, NBRpost is a normalized burn ratio of a post-burn image, NIR is the reflectance of near-infrared and MIR is the reflectance of the mid-infrared.
From the equation for assessing the burnt areas via the ∆NBR method, we needed to use the data of the pre-burn image where no burnt areas appeared at that time. Consequently, we chose to use the satellite image data during November 2013–2015 (the period which there was a small number of burnt areas) in the equation together with the March 2014–2016 post-burn images.
Regarding the quantity of the satellite images, to cover all areas of the study in the 10 provinces of Thailand’s northern region, we used Landsat WRS-2 (Worldwide Reference System) path 129 to 132 and row 46 to 49. Figure 2 presents that the pre-fire image (a) was Landsat-8 images (MIR, NIR, GREEN) path/row 130/47 acquired on 24 November 2014. The post-fire image (b) was a dark purple-colored Landsat-8 image (MIR, NIR, GREEN) path/row 130/47 acquired on 16 March 2015.

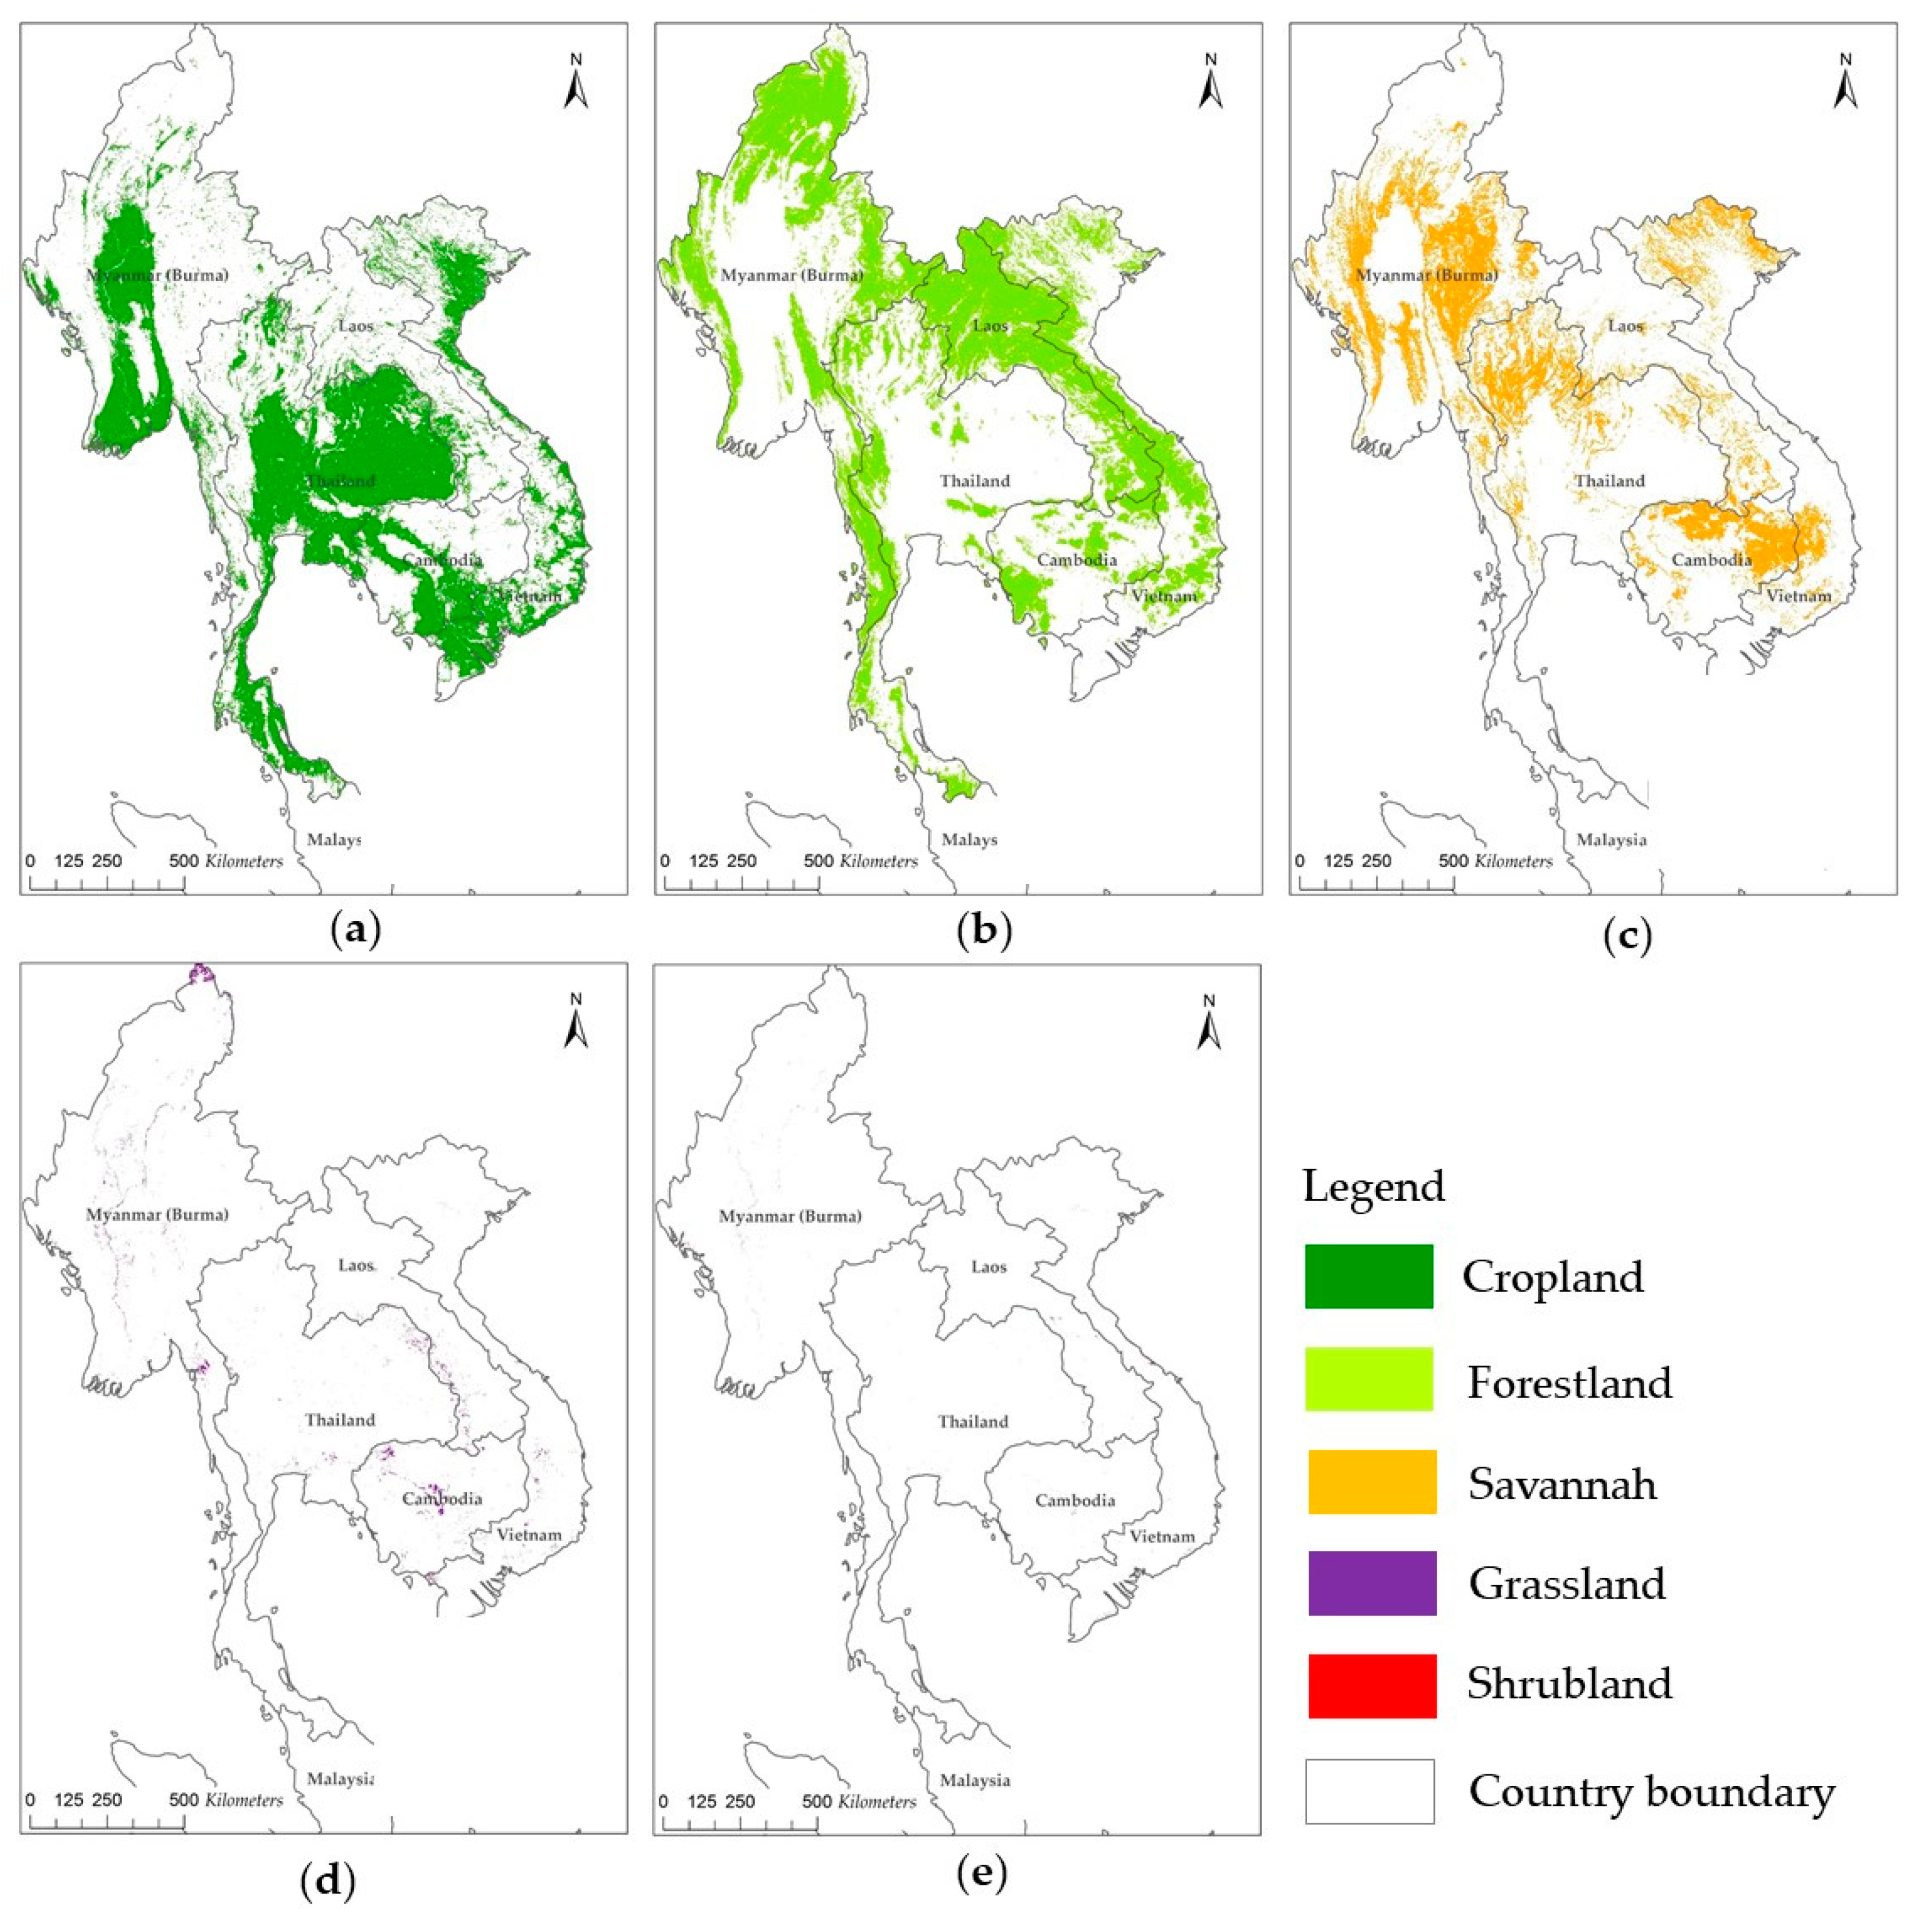
2.2.4. Land Use and Land Cover Mapping

As the vegetation and properties of the biomass in each continental group were different [40,41], fires occurring in each area had different behavior, burnt area spread [42,43,44,45,46,47], and emission factors [30,48]. In this study, we categorized the burnt areas derived from the MODIS burnt area products and the reference fires by overlaying all the burnt areas with a land cover map of the MODIS-based Global Land Cover (MDC12Q1) version 6 data product [49]. Figure 3 shows the land use and land cover map derived from the MCD12Q1 for the GMS in 2015. We reclassified the vegetation types of the MCD12Q1 following the GFED4 burnt area product [21,22].
From the land use and cover map, it could be seen that in Thailand, the cropland area was distributed along the central, eastern, and southern parts of the country, while the savannah areas, where burning occurred every year, were in the northern part of the country. In Myanmar, the cropland area was in the central part of the country, such as Ayerarwady, Yangon, Bago, Magwe, and Mandalay, and the large forestland and savannah area was located in the central eastern region, i.e., Shan State and the western region, i.e., Rakhine State and Chin State of the country bordering the upper part of Thailand. In Cambodia, the cropland was in the central, southern, and western parts of the country, whereas the forestland, comprising evergreen forests and deciduous forests, was in the upper and eastern part of the country. In Vietnam, the cropland was in the southern part of the country, which was mostly planted along the north to south stretch of the western part, while the forestland was only in the central part of the country bordering Cambodia.

2.2.5. Validation of the MODIS Burnt Area Products with the Reference Fires

We wanted to seek the burnt area detection rate of the MODIS burnt area products per actual burnt area through a reference fire derived from the Landsat-8 OLI/TIRS, as such a product had a higher image resolution than the MODIS burnt area products. The interpretation of the Landsat-8 images found that there were many small fires occurring in the study area. This can be explained as the behavior of forest fires in the GMS area was not severe compared to areas in other continents since most of them were surface fires [42,50,51,52,53], which often occurred as people living close to forests lit fires, while agricultural fires in the GMS area were also small with a short duration [54,55]. As a result, the direct overlay polygon of the burnt areas of both products influenced being unable to find the burnt area detection rates. Therefore, we made square grids to gather the sizes of the burnt areas shown in the grids by determining the grid size to be larger than the resolution of the MODIS burnt area products but not too large. Therefore, we selected the size 12 km × 12 km, similar to the grid size, to analyze the spatial distribution of the burnt areas and fire emissions.
The percentage of overlap between the MODIS burnt area products and the reference burnt areas was calculated from the number of grids showing the burnt areas from the MODIS burnt area products and reference fire per the total number of grids showing the burnt areas from the reference fire.
In order to bring the total sum of the burnt areas from small fires to assess the emission of air pollutants, the amount of actual burnt area in each grid cell was collected from three products. This information was used for scatter graph analysis in order to assess the correlation slope, which represented the correction factor, and was used for adjusting the burnt area of small fires in the MODIS products according to the assessment of the emissions. We separated the burnt areas in accordance with the vegetation types since the occurring fires had different behavior. The fires were separated into three groups having different behavior: (1) Forest fires; (2) agricultural fires; and (3) savannah, grassland, and shrubland fires.

2.3. Assessment of the Biomass Load and Combustion Completeness

2.3.1. Agricultural Fires

According to the report of the Food and Agriculture Organization Corporate Statistical Database (FAOSTAT) [1], agricultural fires related to biomass open burning emissions in the GMS during the years 2010–2016 were reported to mostly occur in paddy, corn, and sugar cane fields. Approximately, 144 Mt of agricultural residue in total was consumed by fire, including 114 Mt of rice residue, 22 Mt of corn, and 8 Mt of sugar cane. The burning in the paddy and corn fields was to clear the fields for the planting of the next crop, while the burning of the tops and leaves of sugar cane was to eliminate parts, which impeded the harvesting operation that was mostly carried out by humans.
From the literature review on the emissions from biomass open burning in the GMS or Southeast Asia, most of the previous studies [56,57] referred to the data of Koopmans and Koppejan [58] and Turn et al. [59], which provided the value of the residue to the product ratio (RPR) at 1.76 for rice residue with a moisture content of 12.7%. This rate was obtained from the field measurement in Thailand under the condition of harvesting by humans at two inches above ground level. In addition, Chang and Song [60] used the RPR (1.5), and the percentage of dry matter residue burnt in the field for developing countries reported by Yevich and Logan [61]. The biomass load of cropland in the GMS was in the range of 0.9–3.7 t/ha. Recently, Shi and Yamaguchi [62] used the default value of the biomass load and combustion completeness from the 2006 IPCC Guidelines [40], which obtained the data from an expert’s assessment.
However, recently, updated and locally specific studies for crop types have been published. Cheewaphongphan and Garivait [63] assessed the biomass load and combustion completeness specific for rice stubble and straw by the paddy field measurement in nine subregions covering various rice varieties planted in Thailand, which reported the biomass load for stubble and straw at 2.74–5.98 and 2.10–2.41 t/ha, respectively, and the rate of the combustion completeness at 0.02–0.33 for stubble and 0.23–0.86 for straw. Those rates were aggregated to represent the rice residue as 7.62 ± 1.91 t/ha for the biomass load and 0.34 ± 0.06 for the combustion completeness.
Sornpoon et al. [64] studied the biomass load and the combustion completeness for sugar cane residue by the measurement of sugar cane fields in three regions (northern, northeastern, and central), which are the largest sugar cane plantation areas in Thailand. The prescribed burning experiment was done for four cane varieties, which covered all cane species planted in Thailand and provided the biomass load in the range of 5.0–13.9 t/ha (average rate at 9.40 ± 2.80 t/ha) and the combustion completeness of preharvest burning at 0.64 ± 0.05.
For the burning of corn residue, Kanokkanjana and Garivait [65] measured the biomass load and the combustion completeness for corn residue in the northeastern part of Thailand by using a prescribed burning experiment in the cornfields. The area of the prescribed burn was 7 m × 8 m. The burning was prepared and conducted using the traditional way of the farmer. They prepared the biomass by bending the residue down and igniting the fire at an upwind point. The results presented the rate of the biomass load and combustion completeness at 5.26 ± 0.91 t/ha and 0.85 ± 0.13, respectively.
In taking these results into consideration, this study used land use and a land cover map from the MCD12Q1 [49], which classified the land as cropland and unidentified crop types. Thus, in order to obtain the rates of the biomass load and combustion completeness representing each crop, this study utilized the weighted average method as presented in Equation (8) for the biomass load and Equation (9) for the combustion completeness by obtaining the biomass load and combustion completeness for each crop type from the literature review mentioned above (Cheewaphongphan and Garivait [63]; Kanokkanjana and Garivait [65]; Sornpoon et al. [64]) together with the average harvesting area for each crop during the years 2010–2015, taken from FAOSTAT [1]:
B L c r o p l a n d = p ,   c ,   s ( B L × H A ) p ,   c ,   s ( H A ) ,
C C c r o p l a n d = p ,   c ,   s ( B L × H A × C C ) p ,   c ,   s ( B L × H A ) ,
where BLcropland and CCcropland are the biomass load and the combustion completeness of the cropland for the GMS, respectively; HA is the average of the harvested area of the paddy field (p), corn (c), and sugar cane (s) in the GMS during 2000–2015 (paddy field = 208 M/ha, corn = 22 M/ha, and sugarcane = 12.5 M/ha); BL is the biomass load of the paddy field (7.62 ± 1.91 t/ha), corn (5.26 ± 0.91 t/ha), and sugar cane (9.40 ± 2.80 t/ha); CC is the combustion completeness of the paddy field (0.34 ± 0.06), corn (0.85 ± 0.13), and sugar cane (0.64 ± 0.05), which referred to previous studies. After the calculation, the rates of the biomass load and combustion completeness of the cropland in the GMS, used to estimate the crop residue burning, were 7.50 ± 1.90 t/ha and 0.39 ± 0.06, respectively.

2.3.2. Forest Fires

Fires are common in most deciduous forests in the GMS. Forest fire is in the category of surface fire, which occurs on the surface and consumes only low-layer vegetation, e.g., grass, dead leaves, twigs, and undergrowth. Surface fires usually have low to moderate severity and do not cause extensive mortality in the standing vegetation [66]. This kind of fire occurs mainly during the dry season due to the high accumulation of dead leaves on the ground from deciduous plants.
Most fires are caused by deliberate or accidental human activities, especially by the rural people who live in or adjacent to the forest. Forest fires are due to activities associated with the collection of non-timber forest products, burning agricultural residue, especially in shifting agriculture, hunters, carelessness, etc. Uncontrolled fire from shifting agriculture is one of the main causes of forest fire in the GMS [42,50]. In addition, the cause of fire in the GMS is not from clearing or cutting standing trees to make way for a plantation or a new settlement. The Global Forest Resources Assessment 2015 [2] reported a significant decrease in the reduction rate of forested area in the GMS, so this study focused on the surface fire behavior, which used the values of the biomass load and combustion completeness from the prescribed burning experiment in the forested area from the various previous studies.
There have been several previous studies on fire behavior in the GMS. For example, Wanthongchai et al. [51] studied the fire behavior in the deciduous forest of Huai Kha Khaeng Wildlife Sanctuary located in Northern Thailand during December 2004–January 2005, which has the highest frequency of wildfires occurring in the GMS area. The study measured the biomass load in four sampling plots with the dimension of 50 m × 50 m and started a fire at the bottom of the sampling plot to let the propagation of fire to be in a line. The results reported the rates of the biomass load and combustion completeness in the range of 5.1 ± 0.4–12.2 ± 0.9 t/ha and 0.65 ± 0.02–0.84 ± 0.2, for specific burnt biomass, including saplings, seedlings, shrubs, herbs, grass, leaf litter, and small fuel. Then, Junpen et al. [42] studied the fire behavior during the forest fire season (January–May 2008) in deciduous forest located in the northern part of Thailand. That study arranged 40 circular sampling plots varied by forest slope (0–40%) and started the fire at the center of the plot. The obtained biomass loads were in the range of 2.74–4.69 t/ha (average rate at 3.88 ± 0.75 t/ha) and the combustion completeness in the range of 0.6–0.87 (average rate at 0.78 ± 0.13).
Next, Chaiyo et al. [52] studied the fire behavior in deciduous forest located in the central part of Thailand by setting three sampling plots varying by steep slope (20–40%) and terrain slope, and started the fire from the bottom of the plot. This study found that dead leaves were the main component consumed of the surface biomass with coverage higher than 90% in volume and mass. The dead leaves load was 3.42 ± 1.90 t/ha followed by a little mass load of twigs (1.00 t/ha). The amount of the surface biomass consumed was 2.71 ± 1.38 t/ha, which was equal to the combustion completeness (0.79 ± 0.08). A part of that study also reviewed the biomass load and combustion completeness of deciduous forest in the central and northern parts of Thailand, which recorded values in the range of 3.42–8.10 tons/ha for the biomass load and 0.40–0.90 for the combustion completeness.
Because there was a variation of the biomass load and combustion completeness reported in the literature review (Chaiyo et al. [52]; Junpen et al. [42]; Wanthongchai et al. [51]), this study used the average rates from the previous studies as 4.88 ± 0.42 t/ha for the biomass load and 0.76 ± 0.02 for the combustion completeness.

2.3.3. Savannah Fires

Ratnam et al. [67] studied the distribution of biogeographic savannah in Asia. They reported that there were at least three distinct Asian savannah communities; namely, deciduous broadleaf savannah, deciduous fine-leafed and spiny savannah, and evergreen pine savannah, with distinct functional ecologies consistent with fire and herbivory driven community assembly. Likewise, in savannah classification systems, Sankaran and Ratnam [68] consistently reported that the characteristic vegetation type of the lowland regions from Northern Myanmar through Thailand, Lao PDR., Cambodia, and Vietnam was an open dry dipterocarp forest with the ground covered by grass and undergrowth. These regions experienced mean annual rainfall in the range of 800–2000 mm with dry seasons ranging from five to seven months. The dominant tree species were Dipterocarpus tuberculatus, S. obtusa, S. siamensis, and D. obtusifolius. The mixed deciduous forest consisted of Lagerstroemia duperreana, Terminalia mucronata, Tectona grandis, X. xylocarpa, and P. macrocarpus and some Bambusa membranacea, and B. nutans.
From the literature review, there were quite a few previous studies on fire behavior in dry dipterocarp forest or savannah in the GMS. During the forest fire season from 2008–2009, Junpen et al. [53] developed a fire spread model for dry dipterocarp forest fires by using a simple statistical model. A series of 80 experimental fire plots were set in actual dry dipterocarp forests in Northern Thailand. The biomass load and combustion completeness were conducted under a range of weather and fuel conditions to gather quantitative data on fire spreading. Some parts of the results presented the average biomass load of dry dipterocarp forest that were 3.88 ± 0.11 t/ha (in the range of 2.4–5.17 t/ha), which included the biomass load of dead leaves and grass = 2.36 ± 0.10 t/ha and biomass load of twigs and undergrowth = 1.52 ± 0.06 t/ha. The combustion completeness was 0.98 ± 0.02 for dead leaves and grass and 0.49 ± 0.04 for twigs and undergrowth (average at 0.80 ± 0.02).

2.3.4. Grassland and Shrubland Fires

For grassland and shrubland, this study used the results of van Leeuwen et al. [41], which compiled the peer-reviewed literature on fuel combustion for various biomes and fuel categories to understand fuel combustion and its variability better. They provided a database that could be used to constrain biogeochemical models with fire modules. Their research was compiled in a total of 77 studies covering 11 biomes. The biomass load of grassland and shrubland was 7.60 ± 6.50 t/ha and 5.30 ± 2.00 t/ha, respectively. The combustion completeness was 0.81 ± 0.16 for grassland and 0.71 ± 0.26 for shrubland.
The biomass loads and combustion completeness, which were used in this study, are summarized in Table 2.

2.4. Assessment of the Spatial and Temporal Distribution of the Burnt Areas and Fire Emissions

The spatial distribution of the burnt areas from the biomass open burning was assessed by using the satellite information resulting from the Monthly Burnt Area Product (MCD64A1). This product covered five layers as follows: Burn date, burn data uncertainty, quality assurance, and along with the first day and last day of the reliable change detection of the year. For the year 2015, the burnt area data from the MCD64A1 was categorized by the vegetation area, which was reclassified from the land use and land cover map of the MCD12Q1 version 6 in 2015 [49] (Figure 3). The monthly amount of the burnt area per grid was calculated from the total burnt area in each grid (12 km × 12 km).
Next, the spatial distribution of the emissions was calculated by the amount of biomass burnt in each grid multiplied with the emission factors, which were presented in the form of a yearly 12 km × 12 km grid.
Compared with the GFED4.1s dataset, we firstly compared annual and total PM2.5 emissions classified by vegetation fires over the study area. We also compared maps of the annual intensity of PM2.5 emissions. Since different datasets have varying spatial resolutions, we resampled both datasets into 1 km × 1 km grids.

3. Results

3.1. Assessment of the MCD45A1 and MCD64A1 in the GMS

The total burnt area in the GMS during the year 2015 assessed by the MODIS products MCD45A1 and MCD64A1 was about 4.41 and 10.70 Mha, respectively (Table 3). In addition, both MODIS products detected the largest burnt areas to be in Myanmar, Cambodia, and Thailand in descending order. The total burnt areas occurring in the GMS derived from the MCD64A1 was 2.4 times higher than the MCD45A1, especially the detection of the burnt areas occurring in forestland and savannah (3.5 times and 2.7 times higher, respectively). As it was described that most wildfires occurring in the GMS area were surface fires (refer to Section 2.3), making the spread of burnt areas not too large when compared to other types of wildfire caused the GMS area to have a large number of small size burnt areas. Similar to agricultural fires occurring in the GMS area, most burnt areas were small since most farmers grew plants on a small plot of land rather than a large plot [69,70]. Based on the ability to detect small fire sizes of the MCD64A1 collection 6 whose algorithm was improved and more appropriate than the MCD45A1 and MCD64A1, which was modified to meet different regions’ conditions in many ecosystems, it was considered a significant positive aspect of this product [37] that enabled the total sum of burnt areas derived from the MCD64A1 to be greater than that of the MCD45A1.
The peak of burning was found to be in January to March, particularly in March (Figure 4a–d). Taking into consideration the monthly temporal distribution of the burnt areas in the GMS found in January, both MODIS products detected the burnt area to be mainly in Cambodia, especially in cropland and savannah. In February, the burnt area was mainly found in cropland and savannah in Myanmar, whereas the burnt area in Cambodia decreased by half from the previous month. In March, both MODIS products detected the burnt area to be mainly found in forestland and savannah in Myanmar, Thailand, and Vietnam. However, the difference between these two products was the amount of the burnt area detected in each month. In particular, the MCD64A1 detected the highest amount of burnt area in March which was about two times higher than the amount detected in January and February. On the other hand, the MCD45A1 detected the highest amount of burnt area in March. The amount of the burnt area detected in March was higher than the amount detected in January and February by about 13% and 25%, respectively.

3.2. Detection Rate of the MODIS Products and Correction Factor

Table 4 presents the number of grids where the burnt areas were detected by three satellite products, distinguished by vegetation types, and provides the assessment of the percentage of the overlap between the MODIS burnt area products and the reference burnt area detected by Landsat-8 OLI/TIRS. The total number of grids in which the reference fire occurred in the savannah, grassland, shrubland, forestland, and cropland was about 2382 grids, 2019 grids, and 1964 grids, respectively. The total number of grids on the burnt area classified by vegetation types from the MODIS products and Landsat-8 found the percentage of the overlap between the MCD64A1 and the reference burnt area to be about 72% (savannah, grassland, and shrubland), 70% (forestland), and 41% (cropland), respectively, while the overlapping percentage of the MCD45A1 was only about 34% (savannah, grassland, and shrubland), 21% (forestland), and 14% (cropland), respectively. In addition, there were some reference fire grids, especially in the cropland, which did not overlap with the MODIS products. Based on the percentage of the detection rate, the results demonstrated that the MCD64A1 could detect the reference fire higher than the MCD45A1, especially in the savannah and forestland.
Table 5 presents the total burnt area derived from Landsat-8 and the MODIS products. The ratio of the burnt areas between the MODIS products and reference fires was about 0.35 and 0.08 for the MCD64A1 and MCD45A1, respectively. Based on the differences of the burnt areas between the reference fires and MODIS products, the burnt areas from the MODIS products had to be adjusted by the correction factor as well as be used for the estimation of the emissions. The average correction factor for the MCD64A1 and MCD45A1 was about 2.89 and 12.01, respectively. These results demonstrated that the burnt areas from the MCD64A1 were more closely associated with actual fires than the MCD45A1.

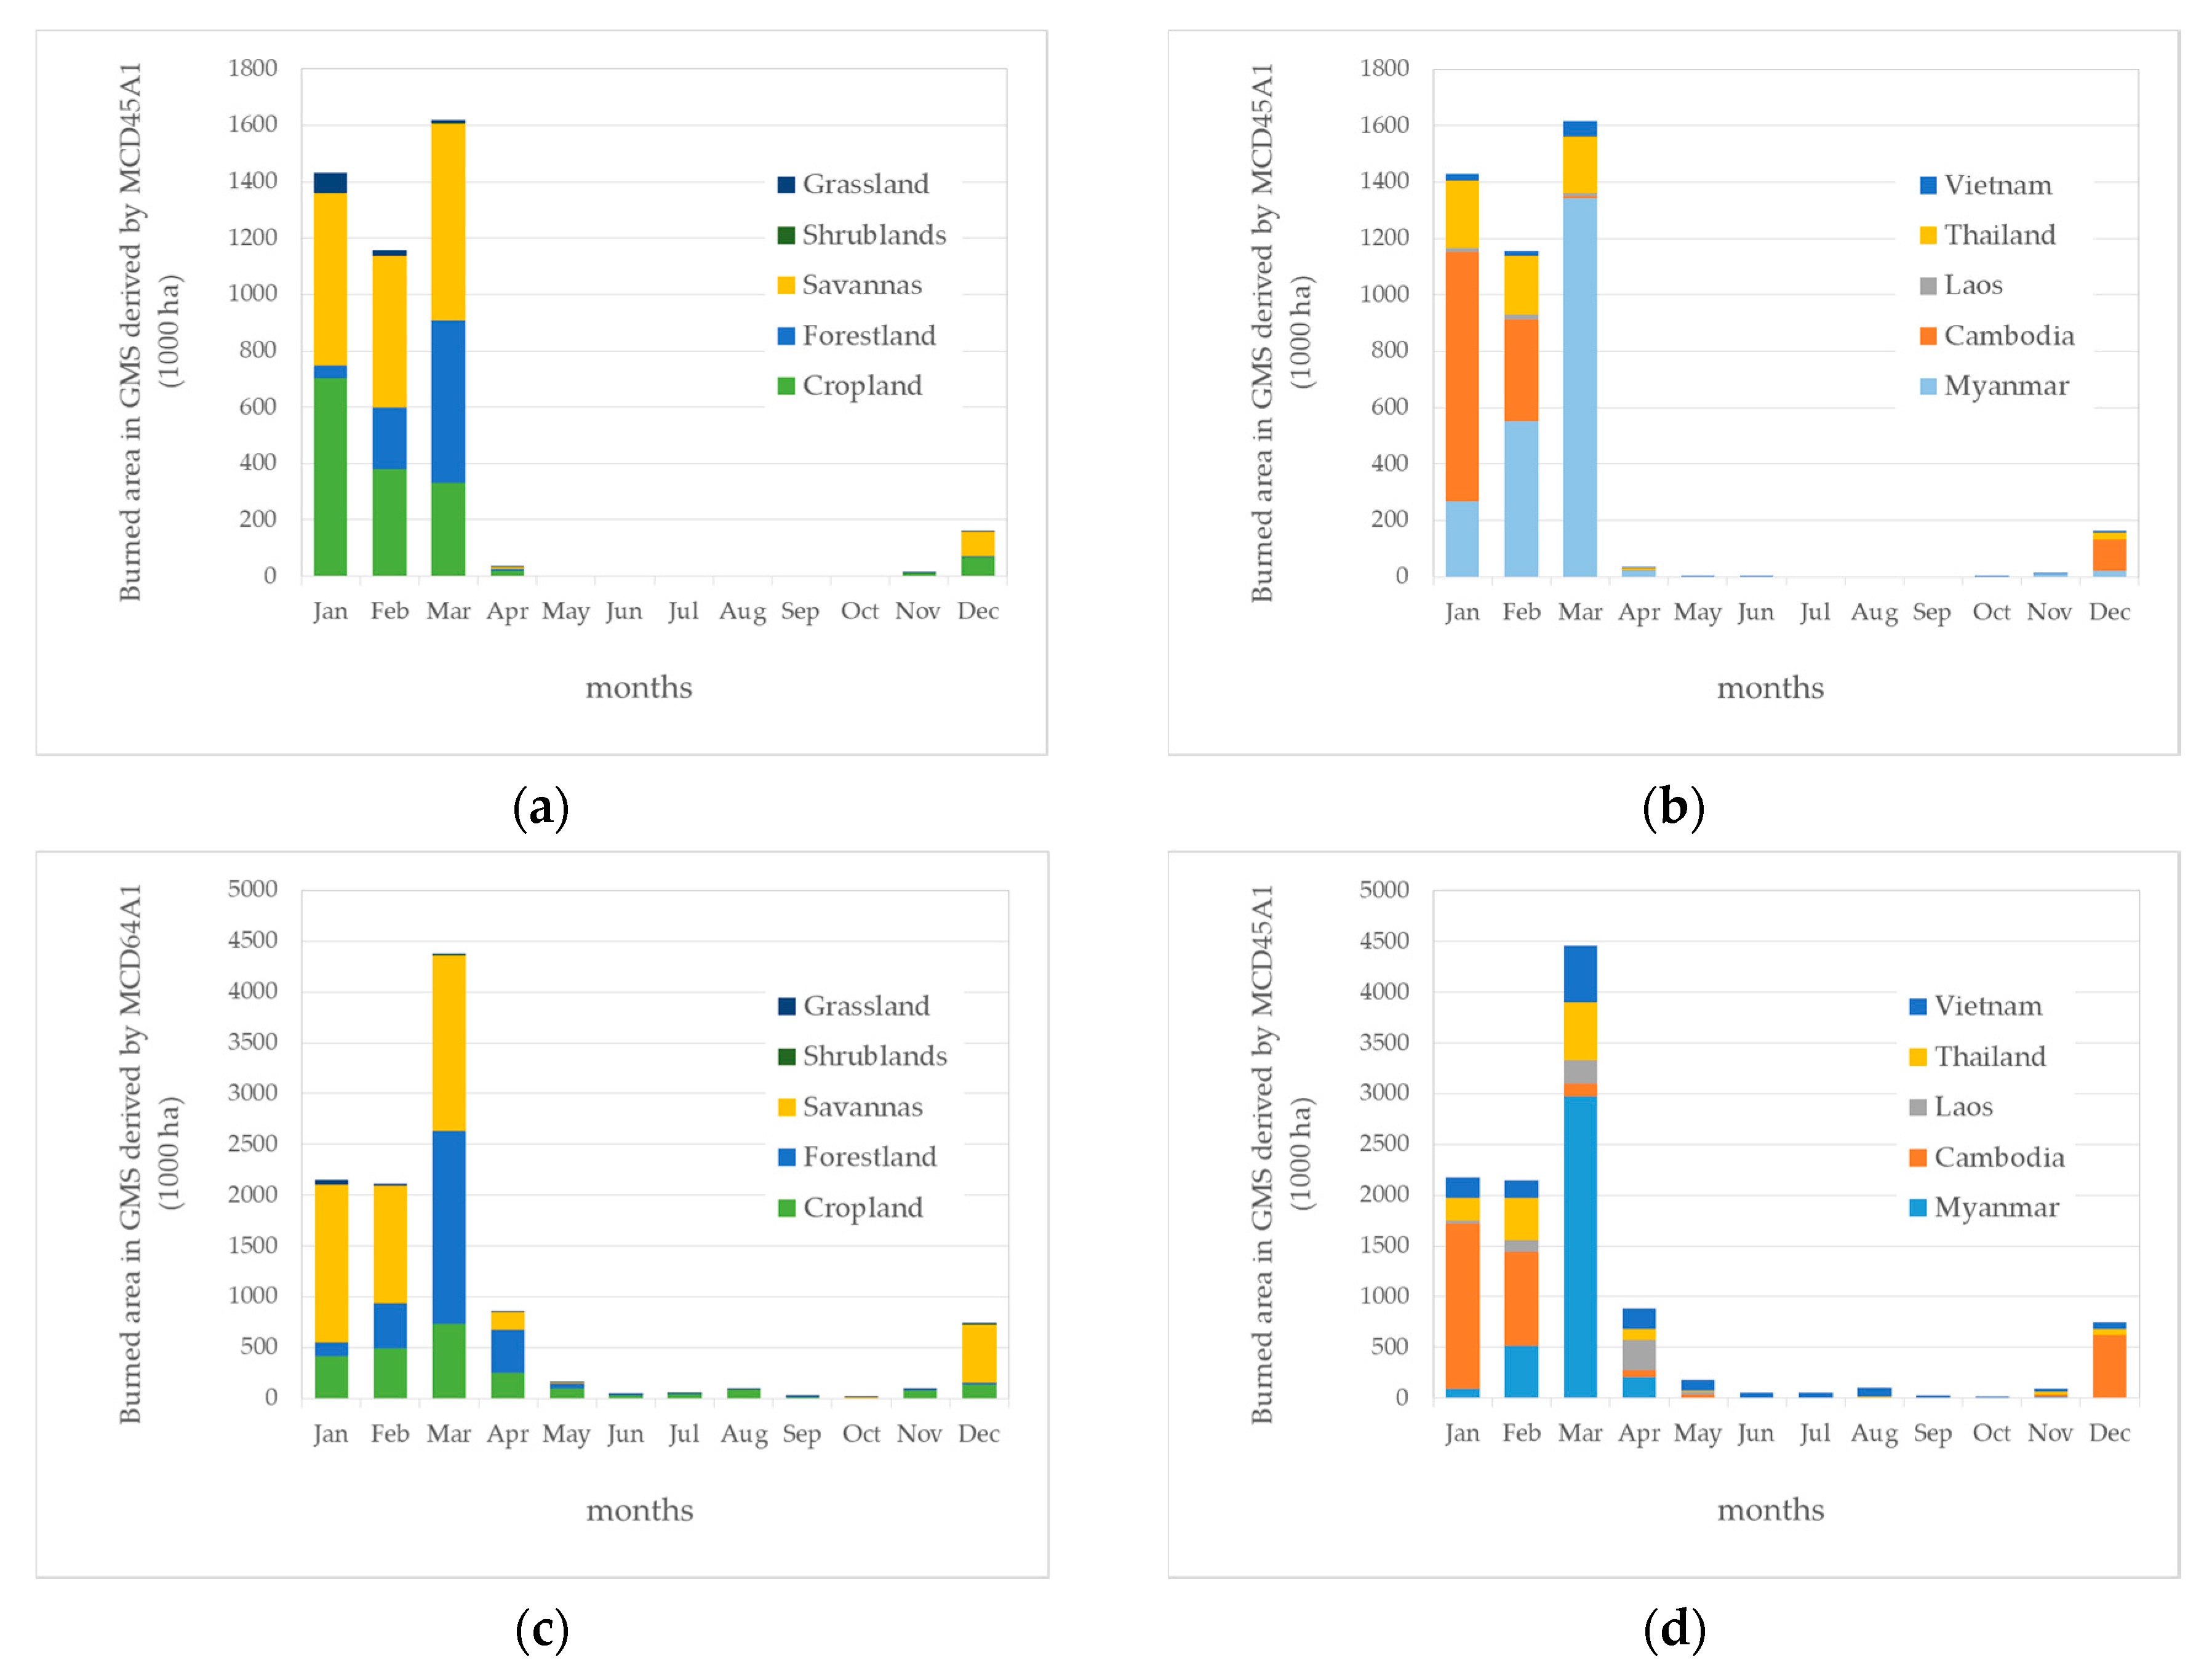
3.3. Spatial and Monthly Temporal Distribution of the Burnt Areas

To understand the seasonal variation of the burnt area situation in the GMS, this study assessed the monthly distribution of the burnt areas by using the information of the MCD64A1 during the year 2015 (Figure 5a–l).
Figure 5a presents the spatial distribution of the burnt area in January 2015, which found biomass burning was mainly in Cambodia and was distributed throughout the country. The burning mainly occurred in cropland areas, particularly in the upper western region (Preah Vihear, Oddar Meanchey, Siem Reap, Banteay Meanchey, and Battambang provinces), and occurred in the savannah areas in the eastern region of the country (Kratie and Mondulkiri provinces). The amount of burnt area was in the range of 5000 to 14,000 ha/grid. There were also a few burnt areas distributed in the other countries, such as in the central part of Thailand and Myanmar, which was mainly due to crop burning.
In February (Figure 5b), the highest density of burnt area, 5000−14,000 ha/grid, was still found mostly in Cambodia, especially in the upper part of the country, which occurred in the savannah. There was also burning of agricultural areas in the central region of the western part of Cambodia (Pursat, Kampong Speu, and Battambang provinces). There was also a high density of burnt areas in the forestland and savannah in the western part of Myanmar, and cropland in the southern part of Vietnam. For the moderate density of the burnt area, 1000−5000 ha/grid, areas were found widely distributed in the cropland of Thailand (particularly in the central, northeastern, and Lower North regions), Lao PDR (lower part of the country), and Myanmar (the central part of the country).
In March (Figure 5c), the burning in Cambodia decreased significantly; simultaneously, it was mostly found in Myanmar, especially in the western and eastern parts of Shan State, and the upper part of Thailand. The burning of those areas were forest fires and savannah fires. A high intensity of burning in cropland was also found in the southern region of Vietnam.
In April (Figure 5d), the burnt area decreased but was still found in the areas that it had occurred in March. However, there was high burning distributed around Lao PDR, which mainly occurred in the forestland and savannah.
During May-November (Figure 5e–k), there was only a few burnings found in the GMS. This was mostly cropland, especially in the central part of Thailand and the southern part of Vietnam, which was the burning of agricultural residue for the off-season crop plantation. In December (Figure 5l), the burnt area was mainly found in Cambodia in the savannah in the east and the cropland in the western part of the country.
From these results, the peak period of biomass burning of the GMS area varied by country. The peak period of Cambodia was during December and February (of the following year), Myanmar was during February to March, Thailand was in January to March, Lao PDR was in February to March, and for Vietnam during February-April, which was found only in the lower part of that country.
The analysis found that the burnt area of each country was mostly found in the dry season. For example, in Cambodia, the MCD64A1 detected the burnt area during the northeast monsoon season (December to April), especially mostly in January and February, which was the driest period of the year. In Myanmar, the burnt area was found mostly during the dry inter-monsoonal season (mid-February-mid-May). In Thailand, the burnt area was detected typically during the hot season (summer) from March to June, with April and May being the hottest months of the year.

3.4. Estimation of the Burnt Area in the GMS

Accordingly, the MCD64A1 product should be used instead of the MCD45A1 product when evaluating the amount of the burnt area for biomass burning in the GMS, so as to obtain results that would be more consistent with the actual biomass burning activity. Upon adjustment of the data of the burnt area obtained from the MCD64A1 with the correction factors (Table 5), it was found that there were approximately 33.7 Mha of burnt area in the GMS. The largest total burnt area occurred on cropland with over 37.1%, or approximately 12.50 Mha. The savannah, forestland, grassland, and shrubland areas were combusted by fire at approximately 11.0 (32.6%), 9.9 (29.5%), 0.23 (0.7%), and 0.02 Mha (0.1%), respectively.

3.5. Estimation of Air Pollutant Emissions in the GMS

The overall burnt area in the GMS during the year 2015 was about 33.7 Mha, which burnt a total biomass of approximately 109 ± 22 Mt. The burnt biomass included 36 ± 15 Mt of biomass in the cropland, 37 ± 4 Mt of biomass in the forestland, 34 ± 2 Mt of biomass in the savannah, 0.09 ± 0.11 Mt of biomass in the shrubland, and 1 ± 0.6 Mt of biomass in the grassland. The country with the highest amount of burnt biomass was Myanmar (39 ± 6 Mt), followed by Cambodia (27 ± 4 Mt), Vietnam (18 ± 6 Mt), Thailand (16 ± 4 Mt), and Lao PDR. (8 ± 1 Mt). By multiplying this amount with the emission factors, the burning of these biomasses emitted approximately 178 ± 42 Mt of CO2, 469 ± 351 kilotons (kt) of CH4, 18 ± 3 kt of N2O, 9.4 ± 4.9 Mt of CO, 345 ± 206 kt of NOX, 46 ± 25 kt of SO2, 147 ± 117 kt of NH3, 820 ± 489 kt of PM2.5, 60 ± 32 kt of BC, and 350 ± 205 kt of OC (Table 6). The actual amount of air pollutant emissions from biomass open burning in the GMS for the year 2015 classified by vegetation types and countries is shown in Appendix A (from Table A1, Table A2, Table A3, Table A4, Table A5, Table A6, Table A7, Table A8, Table A9 and Table A10 in Appendix A).

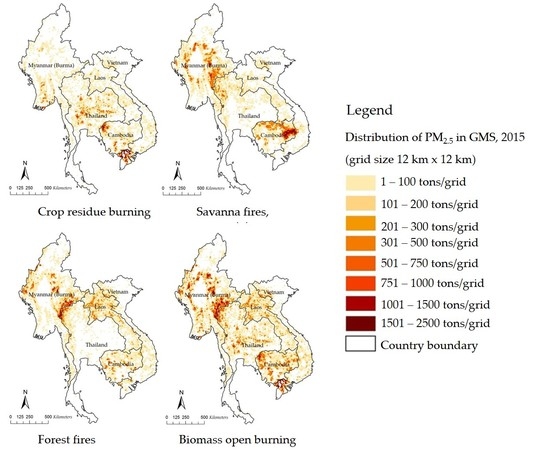
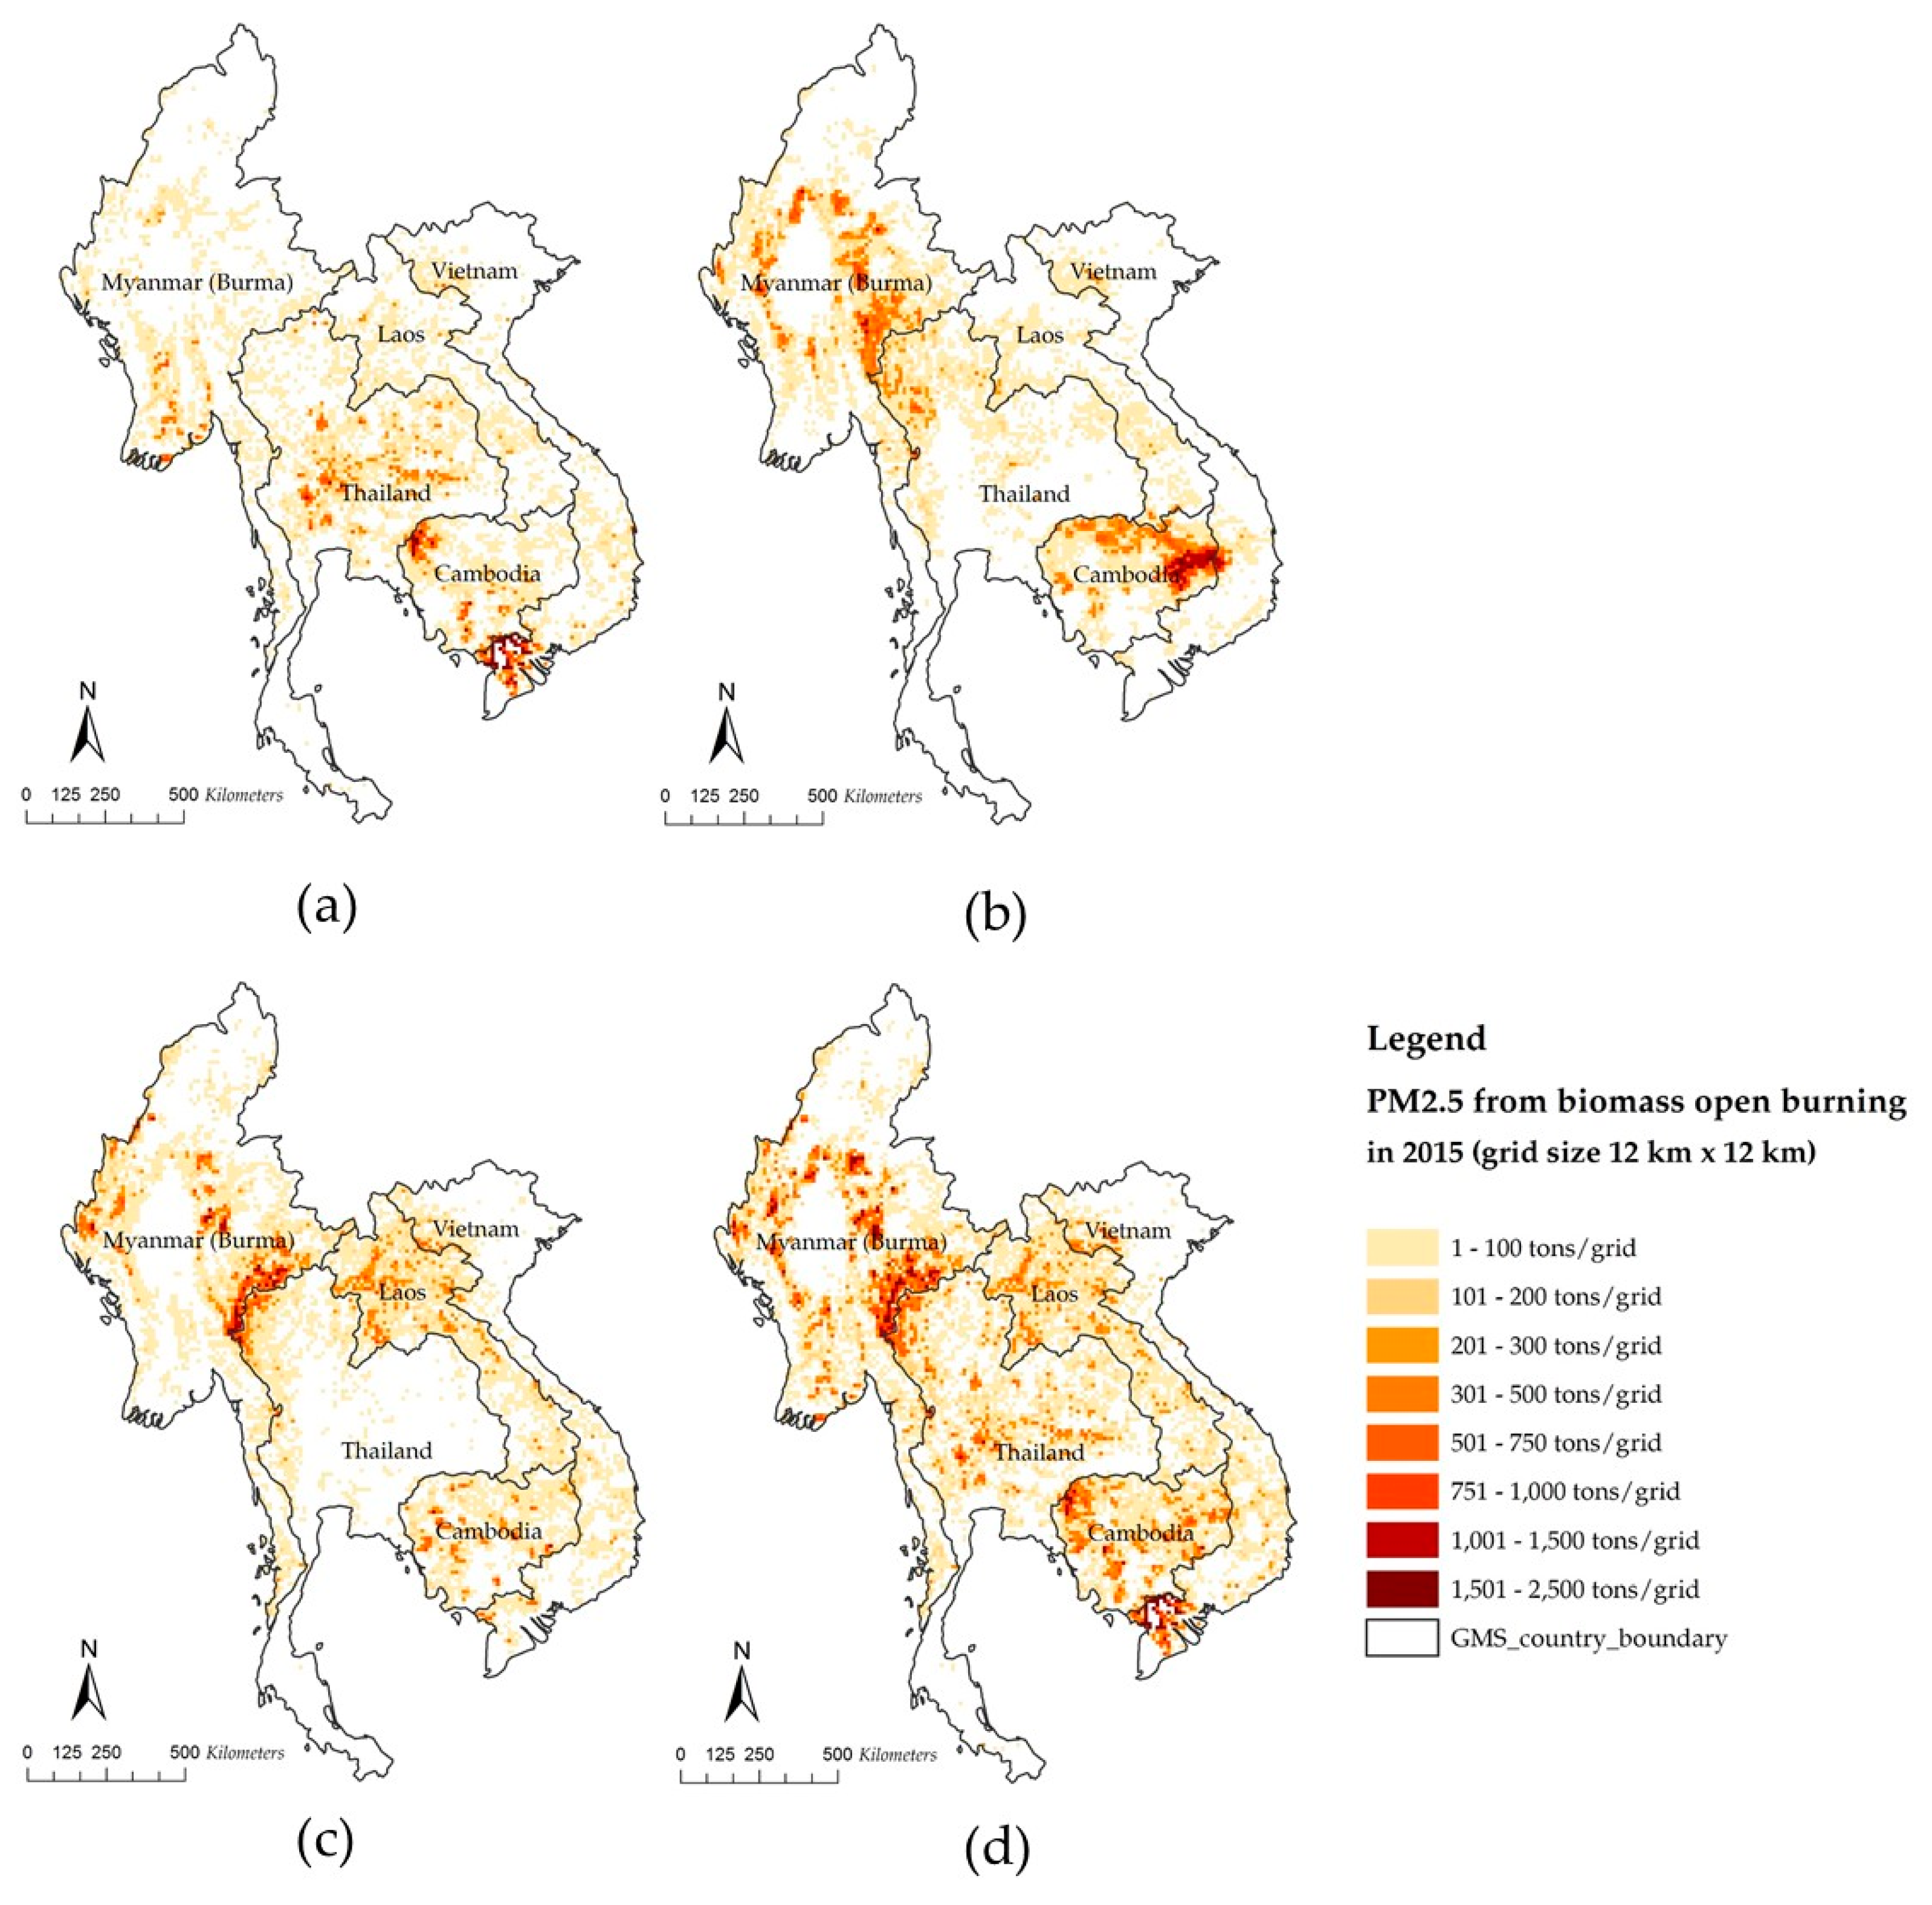
3.6. Spatial Distribution of PM2.5 Emissions

Among the pollutants, emissions of PM2.5 were a major concern in the region because of the well-known adverse effects to human health [71]. Medium spatial resolution maps of PM2.5 from biomass burning were useful to support the development of the control strategy and air quality modelling. The amount of PM2.5 during the year 2015 in the countries along the GMS was about 820 kt consisting of 316, 199, 65, 117, and 123 kt produced in Myanmar, Cambodia, Lao PDR, Thailand, and Vietnam, respectively (Table 6).
As presented in Figure 6a, the densities of the emissions of PM2.5 from agricultural fires were 1000–2500 t/grid (grid size 12 km × 12 km) for the central region of Thailand, the western region of Cambodia, and the southern region of Vietnam; 500–1000 t/grid for the central regions of Myanmar and Cambodia; and only 100–500 t/grid for the other regions of all countries.
As demonstrated in Figure 6b,c, the density of the emissions of PM2.5 from forest fires and savannah, grassland, and shrubland fires was 1000–2500 t/grid for the northern region of Thailand, the western region of Myanmar, as well as the northern regions of Cambodia and Lao PDR, while it was only 500–1000 t/grid for the central region of Myanmar, Cambodia, and Lao PDR.
In combining all fires (Figure 6d), the highest PM2.5 emissions were found in the northern region of Thailand, the western region of Myanmar, and the central and northern regions of Cambodia at the density of 1000–2500 t/grid, followed by the central and northeastern regions of Thailand, the whole of both Lao PDR and Vietnam at the density of 500–1000 t/grid, and other regions of all countries at the density of 100–500 t/grid. Hence, these regions entailed effective mitigation measures to reduce the amount of smoke and smog pollution, such as extending the no-burning period by the local authorities and promoting alternative uses of straw.

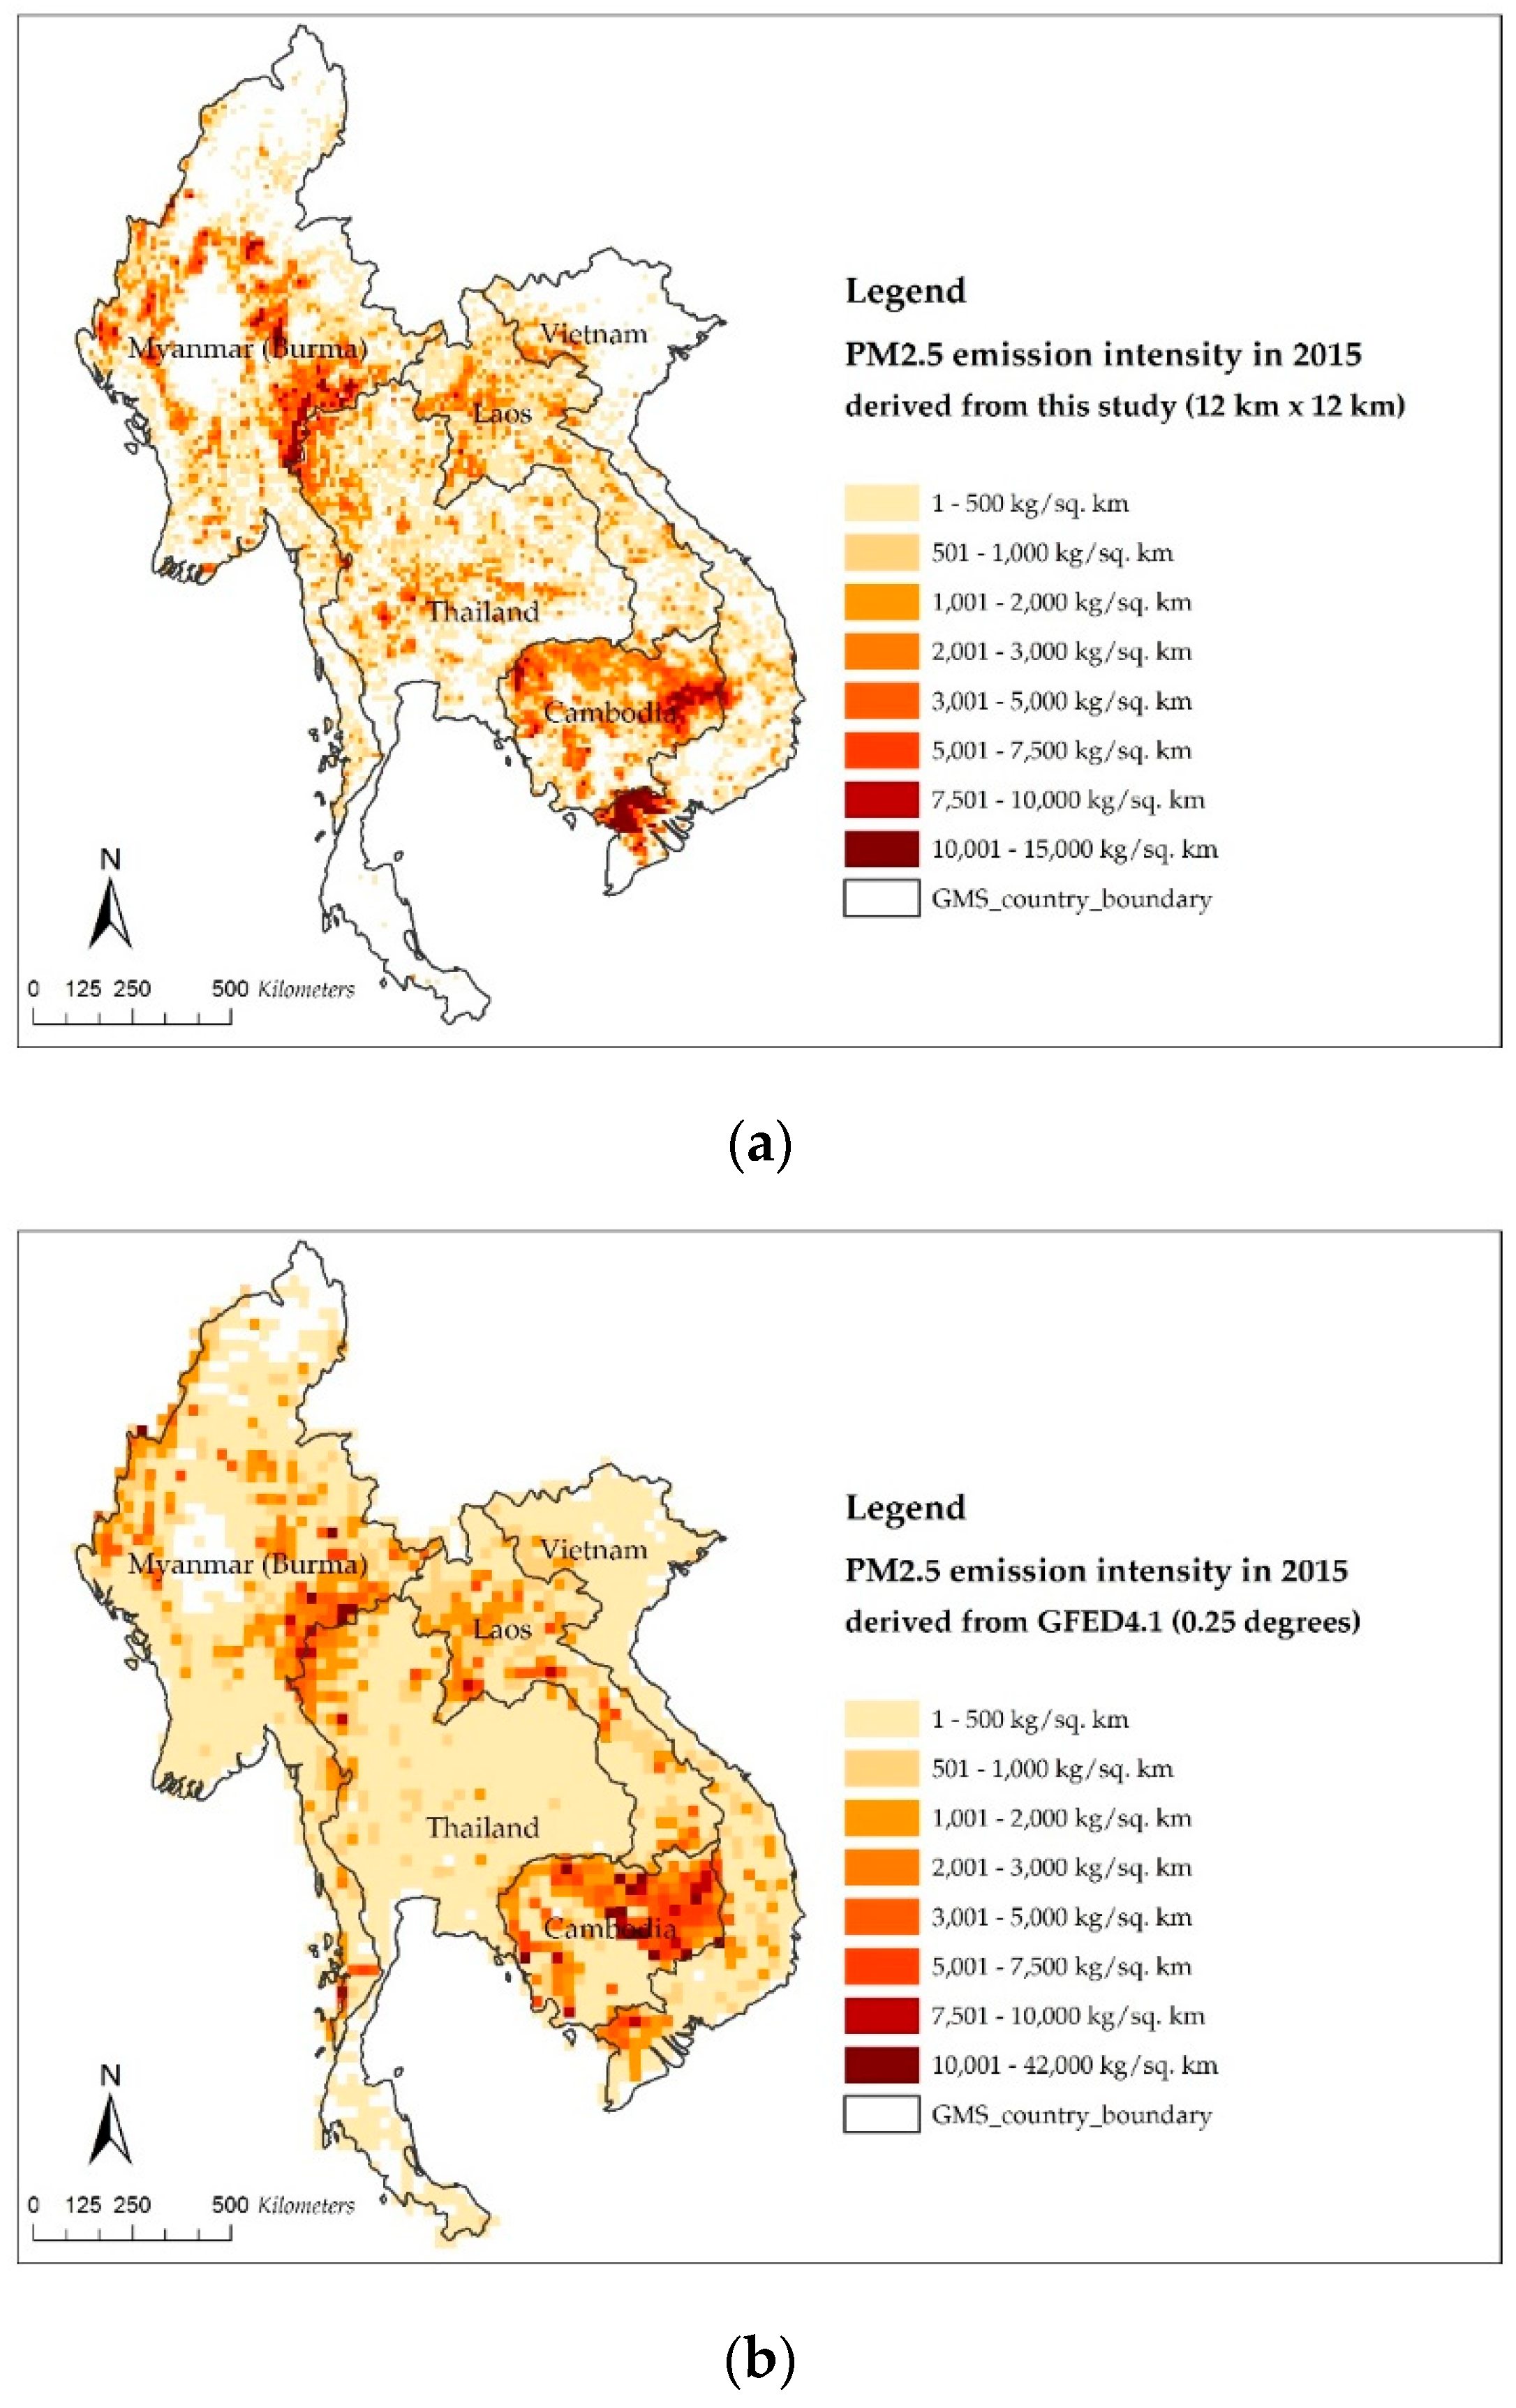
3.7. Comparison with the Global Fire Emission Database

The results of the emissions from the biomass fires in the GMS from this study were compared with the GFED4.1s. The emission data were at 0.25-degree latitude by 0.25-degree longitude spatial resolution and were available from 1997 through 2018, depending on the individual data set. This revised GFEDv4 data set included monthly burnt areas without small files for 2016 and 2015–2003 to 2015–2012, as well as all files for emissions with small fires that were replaced for the years 1997–2014 and the year 2015. The GFEDv4 was compiled as a set of emission factors based mostly on the study of Akagi et al. [30].
The comparison of the PM2.5 emissions between this study and the information of the GFED4.1s (Table 7) found that the total emissions from the biomass open burning from each country estimated in this study were slightly lower than those in the GFED4.1s in the range between 0.3–0.6 times. Taking into consideration the details of the fire types, it was found that the results for the cropland in this study were about 1.8 times higher than the GFED4.1s, while conversely in the savannah and forestland, they were approximately 0.2 and 0.4 times lower than the GFED4.1s, respectively.
PM2.5 derived from the GFED4.1 was higher than the result obtained from this study, which was caused by the following:
(1) Selected fuel consumption values (calculated from the multiple results between the biomass load and combustion completeness) that were different; the value of the selected GFED4.1 was higher than the value used in this study. For example, for the fuel consumption of biomass burning in forested areas, the GFED4.1 selected the fuel consumption values from the review of van Leeuwen et al. [41] in which the fuel consumption of tropical forests was determined at 126 t/ha (determined from a biomass load of 285 t/ha and combustion completeness of 0.49). The selected value was the behavior of the combusted biomass for clearing the forest area or deforestation, which was different from the behavior of surface fires that burnt only the surface fuel and undergrowth. This study determined the fuel consumption value of the forests to be 3.71 t/ha (Table 2). As for the fuel consumption in the savannah areas, the GFED4.1 selected the value equal to 4.6 t/ha (the biomass load was equal to 7.6 t/ha and the combustion completeness was equal to 0.71), which was 1.5 times higher than the value in this study.
(2) The amount of the burnt areas assessed in the GMS was different. Though, in this study, the MCD64A1 was selected to assess the burnt areas similar to the GFED4.1s, the burnt areas were modified by the correction factor, so to combine small size burnt areas that the MCD64A1 could not detect, and they were calculated to evaluate the emission of air pollutants.
From the results of the estimation of the emissions, the gridded emissions of the PM2.5 resolution 12 km × 12 km were created in order to see the spatial allocation of the emissions’ intensity (Figure 7a) and also validated with the results from the GFED4.1s (Figure 7b). This study found the highest PM2.5 intensity was about 15.0 t/km2, which was lower than the result from the GFED4.1s that reported the intensity rate at 42.0 t/km2. The details of the fine resolution of the emissions’ intensity were important information for government officers in acquiring an explicit understanding of the biomass open burning situation in the GMS. Likewise, this information could be used as input data in air quality modelling to simulate the air quality at the national and regional levels. The improvement of fine emissions’ intensity would support the greater accuracy of the study results of the simulation of the air quality [72,73].

4. Conclusions

This research emphasized improving the estimation of the burnt area available for biomass open burning that employed remote sensing data from the MODIS burnt area products, which have been widely used in the evaluation of burnt areas from vegetation fires. The improvement was performed by using reference fires obtained from medium-resolution remote sensing data, namely, Landsat-8 (OLI/TIRS) Surface Reflectance data products. The results suggested multiplying the MCD64A1 and MCD45A1 for the GMS by the correction factors. Moreover, the MODIS burnt area products could be corrected for further regional-scale applications.
The emission results of the air pollution were compared with the GFED4.1s, particularly PM2.5, which is considered to have significant effects on air quality in the GMS. Upon comparison, it was found that, in 2015, the PM2.5 emissions obtained from this study were lower than the results obtained from the GFED4.1s for every country. This research proposed a modified method of evaluating air pollution from biomass open burning that would deliver more accurate results and a higher resolution of spatial emission data than the data obtained from the GFED4.1s, which could be applied to the air quality model.
With respect to future research, the study area should be expanded to cover other regions in the GMS in order to enhance the accuracy of the evaluation of the burnt area, especially as this research only focused on 10 provinces of Northern Thailand. Likewise, other variables relating to the evaluation of air pollution emissions from biomass burning should be considered, which could include biomass load, combustion completeness, and emission factors. Additionally, it is recommended to review and examine local country-specific data to obtain results that would be more accurate and representative of each area.

Author Contributions

Conceptualization, A.J., J.R. and S.G.; methodology, A.J., J.R. and A.B.; software, A.J. and A.B.; validation, A.J., and A.B.; formal analysis, A.J. and A.B.; writing—original draft preparation, A.J. and J.R.; writing—review and editing, P.C. and P.T.B.T.; supervision, P.C., P.T.B.T. and S.G.; project administration, A.J.; funding acquisition, S.G. All authors have read and agreed to the published version of the manuscript.

Funding

This research was funded by the Development of Thailand’s Air Pollutants and Greenhouse Gases (GHGs) Emission Inventory and Projection for use in Air Quality Models Project.

Acknowledgments

The author would like to thank research fund supported from The Thailand Research Fund (TRG6080012) for research activities. This study was also supported by King Mongkut’s University of Technology Thonburi (KMUTT) through the “KMUTT 55th Anniversary Commemorative Found” and the Mahidol University (MU).

Conflicts of Interest

The authors declare no conflict of interest.

Appendix A

Table A1. The actual amount of CO2 from biomass open burning classified by vegetation types in the GMS in 2015.
CountriesCO2 from Biomass Open Burning in the GMS in 2015 (Mt)
CroplandForestlandSavannahGrasslandShrublandTotal
Myanmar936180064
Cambodia97291045
Lao PDR.2920013
Thailand14760027
Vietnam24330030
GMS58615720178
Table A2. The actual amount of CH4 from biomass open burning classified by vegetation types in the GMS in 2015.
CountriesCH4 from Biomass Open Burning in the GMS in 2015 (kt)
CroplandForestlandSavannahGrasslandShrublandTotal
Myanmar341112100167
Cambodia3121331087
Lao PDR.82730037
Thailand522060079
Vietnam87830099
GMS2131886620469
Table A3. The actual amount of N2O from biomass open burning classified by vegetation types in the GMS in 2015.
CountriesN2O from Biomass Open Burning in the GMS in 2015 (kt)
CroplandForestlandSavannahGrasslandShrublandTotal
Myanmar142007
Cambodia113005
Lao PDR.010001
Thailand111002
Vietnam100002
GMS4770018
Table A4. The actual amount of CO from biomass open burning classified by vegetation types in the GMS in 2015.
CountriesCO from Biomass Open Burning in the GMS in 2015 (Mt)
CroplandForestlandSavannahGrasslandShrublandTotal
Myanmar121003
Cambodia101002
Lao PDR.000001
Thailand100002
Vietnam200002
GMS432009
Table A5. The actual amount of NOX from biomass open burning classified by vegetation types in the GMS in 2015.
CountriesNOX from Biomass Open Burning in the GMS in 2015 (kt)
CroplandForestlandSavannahGrasslandShrublandTotal
Myanmar18564210117
Cambodia1711662096
Lao PDR.41350023
Thailand2810130051
Vietnam47470058
GMS1149413340345
Table A6. The actual amount of SO2 from biomass open burning classified by vegetation types in the GMS in 2015.
CountriesSO2 from Biomass Open Burning in the GMS in 2015 (kt)
CroplandForestlandSavannahGrasslandShrublandTotal
Myanmar2950016
Cambodia2280012
Lao PDR.121003
Thailand422007
Vietnam611008
GMS1515160046
Table A7. The actual amount of NH3 from biomass open burning classified by vegetation types in the GMS in 2015.
CountriesNH3 from Biomass Open Burning in the GMS in 2015 (kt)
CroplandForestlandSavannahGrasslandShrublandTotal
Myanmar132960048
Cambodia12690026
Lao PDR.3710010
Thailand19520027
Vietnam33210036
GMS79491810147
Table A8. The actual amount of PM2.5 from biomass open burning classified by vegetation types in the GMS in 2015.
CountriesPM2.5 from Biomass Open Burning in the GMS, 2015 (kt)
CroplandForestlandSavannahGrasslandShrublandTotal
Myanmar372007810316
Cambodia343812241199
Lao PDR.84890065
Thailand57362410117
Vietnam94151310123
GMS23033724571820
Table A9. The actual amount of BC from biomass open burning classified by vegetation types in the GMS in 2015.
CountriesBC from Biomass Open Burning in the GMS in 2015 (kt)
CroplandForestlandSavannahGrasslandShrublandTotal
Myanmar41140020
Cambodia4260013
Lao PDR.130004
Thailand7210010
Vietnam11110013
GMS2719130060
Table A10. The actual amount of OC from biomass open burning classified by vegetation types in the GMS in 2015.
CountriesOC from Biomass Open Burning in the GMS in 2015 (kt)
CroplandForestlandSavannahGrasslandShrublandTotal
Myanmar141032800146
Cambodia1220441078
Lao PDR.32530031
Thailand211990048
Vietnam34850047
GMS841748930350

References

  1. Food and Agriculture Organization (FAO). FAOSTAT Agricultural Database−Crops; Food and Agriculture Organization (FAO): Rome, Italy, 2019; Available online: http://www.fao.org/faostat/en/#data/GB (accessed on 15 May 2019).
  2. Food and Agriculture Organization (FAO). Global Forest Resources Assessment 2015; Food and Agriculture Organization (FAO): Rome, Italy, 2015. [Google Scholar]
  3. Li, J.; Zhang, Y.; Wang, Z.; Sun, Y.; Fu, P.; Yang, Y.; Huang, H.; Li, J.; Zhang, Q.; Lin, C.; et al. Regional Impact of biomass burning in Southeast Asia on atmospheric aerosols during the 2013 seven South-East Asian studies project. Aerosol Air Qual. Res. 2017, 17, 2924–2941. [Google Scholar] [CrossRef]
  4. Liang, Y.; Che, H.; Gui, K.; Zheng, Y.; Yang, X.; Li, X.; Liu, C.; Sheng, Z.; Sun, T.; Zhang, X. Impact of biomass burning in South and Southeast Asia on background aerosol in Southwest China. Aerosol Air Qual. Res. 2019, 19, 1188–1204. [Google Scholar] [CrossRef] [Green Version]
  5. ASEAN Specialised Meteorological Centre (ASMC). Hotspot Information; ASEAN Specialised Meteorological Centre (ASMC): Singapore, 2019. Available online: http://asmc.asean.org/asmc-hotspot/ (accessed on 21 July 2019).
  6. Pollution Control Department (PCD). Thailand’s Air Quality and Situation Reports; Pollution Control Department (PCD): Bangkok, Thailand, 2019. Available online: http://air4thai.pcd.go.th/webV2/download.php (accessed on 20 September 2019).
  7. World Health Organization (WHO). WHO Air Quality Guidelines for Particulate Matter, Ozone, Nitrogen Dioxide and Sulfur Dioxide; World Health Organization (WHO): Geneva, Switzerland, 2006. [Google Scholar]
  8. Khamkaew, C.; Chantara, S.; Janta, R.; Pani, S.K.; Prapamontol, T.; Kawichai, S.; Wiriya, W.; Lin, N.H. Investigation of biomass burning chemical components over northern Southeast Asia during 7-SEAS/BASELInE 2014 campaign. Aerosol Air Qual. Res. 2016, 16, 2655–2670. [Google Scholar] [CrossRef]
  9. van der Werf, G.R.; Randerson, J.T.; Giglio, L.; Collatz, G.J.; Mu, M.; Kasibhatla, P.S.; Morton, D.C.; DeFries, R.S.; Jin, Y.; van Leeuwen, T.T. Global fire emissions and the contribution of deforestation, savanna, forest, agricultural, and peat fires (1997–2009). Atmos. Chem. Phys. 2010, 10, 11707–11735. [Google Scholar] [CrossRef] [Green Version]
  10. Kaiser, J.W.; Heil, A.; Andreae, M.O.; Benedetti, A.; Chubarova, N.; Jones, L.; Morcrette, J.J.; Razinger, M.; Schultz, M.G.; Suttie, M.; et al. Biomass burning emissions estimated with a global fire assimilation system based on observed fire radiative power. Biogeosciences 2012, 9, 527–554. [Google Scholar] [CrossRef] [Green Version]
  11. Wiedinmyer, C.; Akagi, S.K.; Yokelson, R.J.; Emmons, L.K.; Al-Saadi, J.A.; Orlando, J.J.; Soja, A.J. The Fire INventory from NCAR (FINN): A high resolution global model to estimate the emissions from open burning. Geosci. Model. Dev. 2011, 4, 625–641. [Google Scholar] [CrossRef] [Green Version]
  12. Mieville, A.; Granier, C.; Liousse, C.; Guillaume, B.; Mouillot, F.; Lamarque, J.F.; Gregoire, J.M.; Petron, G. Emissions of gases and particles from biomass burning during the 20th century using satellite data and an historical reconstruction. Atmos. Environ. 2010, 44, 1469–1477. [Google Scholar] [CrossRef]
  13. Justice, C.O.; Giglio, L.; Korontzi, S.; Owens, J.; Morisette, J.T.; Roy, D.; Descloitres, J.; Alleaume, S.; Petitcolin, F.; Kaufman, Y. The MODIS fire products. Remote Sens. Environ. 2002, 83, 244–262. [Google Scholar] [CrossRef]
  14. Giglio, L. MODIS Collection 4 Active Fire Product User’s Guide Version 2.3. Science Systems and Applications Inc.; University of Maryland, Department of Geography: College Park, MD, USA, 2015. [Google Scholar]
  15. Wooster, M.J.; Roberts, G.; Perry, G.L.W. Retrieval of biomass combustion rates and totals from fire radiative power observations: FRP derivation and calibration relationships between biomass consumption and fire radiative energy release. J. Geophys. Res. 2005, 110, D24311. [Google Scholar] [CrossRef]
  16. Giglio, L.; van der Werf, G.R.; Randerson, J.T.; Collatz, G.J.; Kasibhatla, P.S. Global estimation of burned area using MODIS active fire observations. Atmos. Chem. Phys. 2006, 6, 957–974. [Google Scholar] [CrossRef] [Green Version]
  17. Tansey, K.; Grégoire, J.M.; Binaghi, E.; Boschetti, L.; Brivio, P.A.; Ershov, D.; Flasse, S.; Fraser, R.; Graetz, D.; Maggi, M.; et al. A global inventory of burned areas at 1 km resolution for the year 2000 derived from spot vegetation data. Clim. Chang. 2004, 67, 345–377. [Google Scholar] [CrossRef]
  18. Tansey, K.; Grégoire, J.M.; Defourny, P.; Leigh, R.; Pekel, J.F.; van Bogaert, E.; Bartholomé, E. A new, global, multi-annual (2000−2007) burnt area product at 1 km resolution. Geophys. Res. Lett. 2008, 35, L01401. [Google Scholar] [CrossRef]
  19. Giglio, L.; Randerson, J.T.; van der Werf, G.R.; Kasibhatla, P.S.; Collatz, G.J.; Morton, D.C.; De Fries, R.S. Assessing variability and long-term trends in burned area by merging multiple satellite fire products. Biogeosciences 2010, 7, 1171–1186. [Google Scholar] [CrossRef] [Green Version]
  20. Randerson, J.T.; van der Werf, G.R.; Giglio, L.; Collatz, G.J.; Kasibhatla, P.S. Global Fire Emissions Database. Version 3 (GFEDv3.1). Data Set; Oak Ridge National Laboratory Distributed Active Archive Center: Oak Ridge, TN, USA, 2013.
  21. van der Werf, G.R.; Randerson, J.T.; Giglio, L.; van Leeuwen, T.T.; Chen, Y.; Rogers, B.M.; Mu, M.; van Marle, M.J.E.; Morton, D.C.; Collatz, G.J.; et al. Global fire emissions estimates during 1997–2016. Earth Syst. Sci. Data 2017, 9, 697–720. [Google Scholar] [CrossRef] [Green Version]
  22. Giglio, L.; Randerson, J.T.; van der Werf, G.R. Analysis of daily, monthly, and annual burned area using the fourth-generation global fire emissions database (GFED4). J. Geophys. Res. 2013, 118, 317–328. [Google Scholar] [CrossRef] [Green Version]
  23. Randerson, J.T.; Chen, Y.; van der Werf, G.R.; Rogers, B.M.; Morton, D.C. Global burned area and biomass burning emissions from small fires. J. Geophys. Res. 2012, 117, G04012. [Google Scholar] [CrossRef]
  24. Tsela, P.; Wessels, K.; Botai, J.; Archibald, S.; Swanepoe, D.; Steenkamp, K.; Frost, P. Validation of the two standard MODIS satellite burned-area products and an empirically-derived merged product in South Africa. Remote Sens. 2014, 6, 1275–1293. [Google Scholar] [CrossRef] [Green Version]
  25. Zhu, C.; Kobayashi, H.; Kanaya, Y.; Saito, M. Size-dependent validation of MODIS MCD64A1 burned area over six vegetation types in boreal Eurasia: Large underestimation in croplands. Sci. Rep. 2017, 7, 4181. [Google Scholar] [CrossRef]
  26. Fornacca, D.; Ren, G.; Xiao, W. Performance of Three MODIS fire products (MCD45A1, MCD64A1, MCD14ML), and ESA Fire CCI in a mountainous area of Northwest Yunnan, China, characterized by frequent small fires. Remote Sens. 2017, 9, 1131. [Google Scholar] [CrossRef] [Green Version]
  27. Chatani, S.; Yamaji, K.; Sakurai, T.; Itahashi, S.; Shimadera, H.; Kitayama, K.; Hayami, H. Overview of model inter-comparison in Japan’s study for reference air quality modeling (J-STREAM). Atmosphere 2018, 9, 19. [Google Scholar] [CrossRef] [Green Version]
  28. Seiler, W.; Crutzen, P.J. Estimates of gross and net fluxes of carbon between the biosphere and the atmosphere from biomass burning. Clim. Chang. 1980, 2, 207–247. [Google Scholar] [CrossRef]
  29. Houghton, J.T.; Filho, L.G.M.; Lim, B.; Tranton, K.; Mamaty, I.; Bonduki, Y.; Griggs, D.J.; Callander, B.A. Intergovernmental Panel on Climate Change (IPCC). In Revised 1996 IPCC Guidelines for National Greenhouse Gas Inventories, Volume 3: Greenhouse Gas Inventory; Meteorological Office: Bracknell, UK, 1997. [Google Scholar]
  30. Akagi, S.K.; Yokelson, R.J.; Wiedinmyer, C.; Alvarado, M.J.; Reid, J.S.; Karl, T.; Crounse, J.D.; Wennberg, P.O. Emission factors for open and domestic biomass burning for use in atmospheric models. Atmos. Chem. Phys. 2011, 11, 4039–4072. [Google Scholar] [CrossRef] [Green Version]
  31. Roy, D.P.; Boschetti, L.; Justice, C.O. The collection 5 MODIS burned area product—Global evaluation by comparison with the MODIS active fire product. Remote Sens. Environ. 2008, 112, 3690–3707. [Google Scholar] [CrossRef]
  32. MODIS Active Fire and Burned Area Products MODIS, USA. 2018. Available online: http://modis-fire.umd.edu/ (accessed on 1 April 2018).
  33. Boschetti, L.; Roy, D.; Hoffmann, A.A.; Humber, M. MODIS Collection 5.1 Burned Area Product—MCD45 User’s Guide Version 3.1.0; University of Maryland: College Park, MD, USA, 2015; Available online: http://modis-fire.umd.edu/files/MODIS_Burned_Area_Collection51_User_Guide_3.1.0.pdf (accessed on 1 April 2018).
  34. Roy, D.P.; Jin, Y.; Lewis, P.E.; Justice, C.O. Prototyping a global algorithm for systematic fire-affected area mapping using MODIS time series data. Remote Sens. Environ. 2005, 97, 137–162. [Google Scholar] [CrossRef]
  35. Roy, D.P.; Lewis, P.E.; Justice, C.O. Burned area mapping using multitemporal moderate spatial resolution data—A bi-directional reflectance model-based expectation approach. Remote Sens. Environ. 2002, 83, 263–286. [Google Scholar] [CrossRef]
  36. Giglio, L.; Boschetti, L.; Roy, D.; Hoffmann, A.A.; Humber, M. Collection 6 MODIS Burned Area Product User’s Guide Version 1.0; NASA EOSDIS Land Processes DAAC: Sioux Falls, SD, USA, 2016.
  37. Giglio, L.; Loboda, T.; Roy, D.P.; Quayle, B.; Justice, C.O. An active fire based burned area mapping algorithm for the MODIS sensor. Remote Sens. Environ. 2009, 113, 408–420. [Google Scholar] [CrossRef]
  38. U.S. Geological Survey (USGS). National Center for Earth Resource Observations and Science (EROS); U.S. Geological Survey (USGS): Reston, VA, USA, 2018. Available online: https://earthexplorer.usgs.gov/ (accessed on 1 April 2018).
  39. Key, C.; Benson, N. Landscape Assessment: Remote Sensing of Severity, the Normalized Burn Ratio and Ground Measure of Severity, the Composite Burn Index. In FIREMON: Fire Effects Monitoring and Inventory System; Lutes, D., Keane, R., Caratti, J., Key, C., Benson, N., Sutherland, S., Gangi, L., Eds.; RMRS-GTR-164-CD; USDA Forest Service, Rocky Mountain Research Station: Ogden, UT, USA, 2006; pp. 1–51. [Google Scholar]
  40. Eggleston, H.S.; Buendia, L.; Miwa, K.; Ngara, T.; Tanabe, K. IPCC, 2006. Guidelines for National Greenhouse Gas Inventories. In Agriculture, Forestry and Other Land Use, Vol. 4; Institute for Global Environmental Strategies (IGES): Kanoyama Town, Japan, 2006. [Google Scholar]
  41. van Leeuwen, T.T.; van der Werf, G.R.; Hoffmann, A.A.; Detmers, R.G.; Rücker, G.; French, N.H.F.; Archibald, S.; Carvalho, J.A.; Cook, G.D.; de Groot, W.J.; et al. Biomass burning fuel consumption rates: A field measurement database. Biogeosciences 2014, 11, 7305–7329. [Google Scholar] [CrossRef] [Green Version]
  42. Junpen, A.; Garivait, S.; Bonnet, S. Estimating emissions from forest fires in Thailand using MODIS active fire product and country specific data. Asia Pac. J. Atmos. Sci. 2013, 49, 389–400. [Google Scholar] [CrossRef]
  43. Pastor, E.; Zarate, L.; Planas, E.; Arnaldos, J. Mathematical models and calculation systems for the study of wildland fire behaviour. Prog. Energy Combust. Sci. 2003, 29, 139–153. [Google Scholar] [CrossRef]
  44. Forestry Canada Fire Danger Group (FCFDG). Development and Structure of the Canadian Forest Fire Behavior Prediction System; Forestry Canada, Information Report ST-X-3; Forestry Canada, Science and Sustainable Development Directorate: Ottawa, ON, Canada, 1992.
  45. Rothermel, R.C. A Mathematical Model for Predicting Fire Spread in Wildland Fuels; Intermountain Forest and Range Experiment Station, Forest Service, U.S. Department of Agriculture: Ogden, UT, USA, 1972.
  46. Fernandes, P.A.M. Fire spread prediction in shrub fuels in Portugal. For. Ecol. Manag. 2001, 144, 67–74. [Google Scholar] [CrossRef]
  47. Bilgili, E.; Saglam, B. Fire behavior in maquis fuels in Turkey. For. Ecol. Manag. 2003, 184, 201–207. [Google Scholar] [CrossRef]
  48. Andreae, M.O.; Merlet, P. Emissions of trace gases and aerosols from biomass burning. Glob. Biogeochem. Cycles 2001, 15, 955–966. [Google Scholar] [CrossRef] [Green Version]
  49. Land Processes Distributed Active Archive Center (LP DAAC). The MODIS Land Cover Type Product (MCD12Q1); Earth Resources Observation and Science (EROS) Center: Sioux Falls, SD, USA, 2018. Available online: https://lpdaac.usgs.gov/dataset_discovery/modis/modis_products_table/mcd12q1 (accessed on 1 April 2018).
  50. Karki, S. Community Involvement in and Management of Forest Fires in South East Asia; Project FireFight South East Asia: Jakarta, Indonesia, 2002. [Google Scholar]
  51. Wanthongchai, K.; Goldammer, J.G.; Bauhus, J. Effects of fire frequency on prescribed fire behavior and soil temperatures in dry dipterocarp forests. Int. J. Wildland Fire 2011, 20, 35–45. [Google Scholar] [CrossRef]
  52. Chaiyo, U.; Garivait, S.; Wanthongchai, K. Carbon storage in above-ground biomass of tropical deciduous forest in Ratchaburi Province, Thailand. Int. J. Innov. Res. Sci. Eng. Technol. 2011, 5, 585–590. [Google Scholar]
  53. Junpen, A.; Garivait, S.; Bonnet, S.; Pongpullponsak, A. Fire spread prediction for deciduous forest fires in Northern Thailand. Sci. Asia 2013, 39, 535–545. [Google Scholar] [CrossRef]
  54. Lasko, K.; Vadrevu, K.P.; Tran, V.T.; Ellicott, E.; Nguyen, T.T.N.; Bui, H.Q.; Justice, C. Satellites may underestimate rice residue and associated burning emissions in Vietnam environ. Res. Lett. 2017, 12, 085006. [Google Scholar] [CrossRef]
  55. Junpen, A.; Pansuk, J.; Kamnoet, O.; Cheewaphongphan, P.; Garivait, S. Emission of air pollutants from rice residue open burning in Thailand, 2018. Atmosphere 2018, 9, 449. [Google Scholar] [CrossRef] [Green Version]
  56. Streets, D.G.; Yarber, K.F.; Woo, J.H.; Carmichael, G.R. Biomass burning in Asia: Annual and seasonal estimates and atmospheric emissions. Glob. Biogeochem. Cycles 2003, 17, 1099. [Google Scholar] [CrossRef] [Green Version]
  57. Kim Oanh, N.T.; Permadi, D.A.; Hopke, P.K.; Smith, K.R.; Dong, N.P.; Dang, A.N. Annual emissions of air toxics emitted from crop residue open burning in Southeast Asia over the period of 2010–2015. Atmos. Environ. 2018, 187, 163–183. [Google Scholar] [CrossRef]
  58. Koopmans, A.; Koppejan, J. Agricultural and forest fires: Generation, utilization and availability. Reg. Consult. Mod. Appl. Biomass Energy Malays. 1997, 6, 10. [Google Scholar]
  59. Turn, S.Q.; Jenkins, B.M.; Chow, J.C.; Pritchett, L.C.; Campbell, D.; Cahill, T.; Whalen, S.A. Elemental characterization of particulate matter emitted from biomass burning: Wind tunnel derived source profiles for herbaceous and wood fuels. J. Geophys. Res. 1997, 102, 3683–3700. [Google Scholar] [CrossRef]
  60. Chang, D.; Song, Y. Estimates of biomass burning emissions in tropical Asia basedon satellite-derived data. Atmos. Chem. Phys. 2010, 10, 2335–2351. [Google Scholar] [CrossRef] [Green Version]
  61. Yevich, R.; Logan, J.A. An assessment of biofuel use and burning of agricultural waste in the developing world. Glob. Biogeochem. Cycles 2003, 7, 1095. [Google Scholar] [CrossRef]
  62. Shi, Y.; Yamaguchi, Y. A high-resolution and multi-year emissions inventory for biomass burning in Southeast Asia during 2001−2010. Atmos. Environ. 2014, 98, 8–16. [Google Scholar] [CrossRef]
  63. Cheewaphongphan, P.; Garivait, S. Bottom up approach to estimate air pollution of rice residue open burning in Thailand. Asia Pac. J. Atmos. Sci. 2013, 49, 139–149. [Google Scholar] [CrossRef]
  64. Sornpoon, W.; Bonnet, S.; Kasemsap, P.; Prasertsak, P.; Garivait, S. Estimation of emissions from sugarcane field burning in Thailand using bottom−up country−specific activity data. Atmosphere 2014, 5, 669–685. [Google Scholar] [CrossRef] [Green Version]
  65. Kanokkanjana, K.; Garivait, S. Climate change effect from black carbon emission: Open burning of corn residues in Thailand. Int. J. Innov. Res. Sci. Eng. Technol. 2011, 5, 567–570. [Google Scholar]
  66. Werth, P.A.; Potter, B.E.; Alexander, M.E.; Clements, C.B.; Cruz, M.G.; Finney, M.A.; Forthofer, J.M.; Goodrick, S.L.; Hoffman, C.; Jolly, W.; et al. Synthesis of Knowledge of Extreme Fire Behavior: Volume 2 for Fire Behavior Specialists, Researchers, and Meteorologists; Gen. Tech. Rep. PNW-GTR-891; U.S. Department of Agriculture, Forest Service, Pacific Northwest Research Station: Portland, OR, USA, 2016.
  67. Ratnam, J.; Tomlinson, K.W.; Rasquinha, D.N.; Sankaran, M. Savannahs of Asia: Antiquity, biogeography, and an uncertain future. Phil. Trans. R. Soc. B 2016, 371, 20150305. [Google Scholar] [CrossRef]
  68. Sankaran, M.; Ratnam, J. African and Asian Savannas. Encycl. Biodivers 2013, 1, 58–74. [Google Scholar]
  69. Food and Agriculture Organization (FAO). Agricultural Transformation of Middle-Income Asian Economies: Diversification, Farm Size and Mechanization; ESA Working Paper No. 15-04; Food and Agriculture Organization (FAO): Rome, Italy, 2015. [Google Scholar]
  70. Lowder, S.; Skoet, J.; Raney, T. The number, size, and distribution of farms, smallholders’ farms, and family farms worldwide. World Dev. 2016, 87, 16–29. [Google Scholar] [CrossRef] [Green Version]
  71. BOED—Bureau of Occupational and Environmental Diseases. Study on the Relationship between Particulate Matter Smaller than 10 Microns (PM10) and Patients with Chronic Respiratory Diseases (ICD-10 Code J40-J47) in 8 Northern Provinces of Thailand; Ministry of Public Health: Nonthaburi, Thailand, 2015. Available online: http://envocc.ddc.moph.go.th/contents/view/451 (accessed on 20 July 2020).
  72. Theobald, M.R.; Simpson, D.; Vieno, M. Improving the spatial resolution of air–quality modelling at a European scale–development and evaluation of the Air Quality Re-gridder Model (AQRv1.1). Geosci. Model Dev. 2016, 9, 4475–4489. [Google Scholar] [CrossRef] [Green Version]
  73. Tan, J.; Zhang, Y.; Ma, W.; Yu, Q.; Wang, J.; Chen, L. Impact of spatial resolution on air quality simulation: A case study in a highly industrialized area in Shanghai, China. Atmos. Pollut. Res. 2015, 6, 322–333. [Google Scholar] [CrossRef] [Green Version]
Figure 1. The Greater Mekong Subregion (GMS) map showing the study area.
Climate 08 00090 g001
Figure 2. The pre-fire image (a) derived from Landsat 8 image (MIR, NIR, GREEN) path/row 130/47 acquired on 24 November 2014. The post-fire image (b) is a dark purple color Landsat 8 image (MIR, NIR, GREEN) path/row 130/47 acquired on 16 March 2015.
Climate 08 00090 g002
Figure 3. Land use map of (a) cropland, (b) forestland, (c) savannah, (d) grassland, and (e) shrubland in the GMS for the year 2015 derived from the MCD12Q1.
Climate 08 00090 g003
Figure 4. Monthly temporal distribution of the total burnt area from the biomass open burning classified by country and vegetation fire derived by the MCD45A1 ((a) and (b)) and the MCD64A1 ((c) and (d)) in 2015.
Climate 08 00090 g004
Figure 5. Spatial and monthly temporal distribution of the burnt areas occurring in (a) January, (b) February, (c) March, (d) April, (e) May, (f) June, (g) July, (h) August (i) September, (j) October, (k) November, and (l) December 2015.
Climate 08 00090 g005aClimate 08 00090 g005b
Figure 6. Spatial distribution of the gridded PM2.5 emissions from (a) agricultural fires, (b) savannah, grassland, and shrubland fires, (c) forest fires, and (d) biomass open burning in the GMS in 2015; grid size = 12 km × 12 km.
Climate 08 00090 g006
Figure 7. Comparison of the intensity of the PM2.5 emissions from the biomass open burning in the GMS between (a) this study and (b) the GFED4.1s in 2015.
Climate 08 00090 g007
Table 1. Value of the emission factors in each of the trace gases and aerosols (standard error in parentheses).
SpeciesValue of the Emission Factors (g Specie per kg Dry Matter Burnt) 1
CLFLSV, GL, SL
CO21585 (100)1643 (58)1686 (38)
CO102 (33)93 (27)63 (17)
CH45.82 (3.56)5.07 (1.98)1.94 (0.85)
NOX3.11 (1.57)2.55 (1.40)3.9 (0.8)
N2O0.1 (−)0.2 (−)0.2 (−)
PM2.56.26 (2.36)9.1 (3.5)7.17 (3.42)
OC2.3 (−)4.71 (2.73)2.62 (1.24)
BC0.75 (−)0.52 (0.28)0.37 (0.20)
SO20.40 (−)0.40 (0.19)0.48 (0.27)
NH32.17 (1.27)1.33 (1.21)0.52 (0.35)
1 CL = cropland; FL = forestland; SV = savannah; GL = grassland; SL = shrubland.
Table 2. Value of the biomass loads and combustion completeness in each vegetation fire (standard error in parentheses).
Vegetation TypesBiomass Load (t/ha)Combustion Completeness
Cropland7.50 (1.90)0.39 (0.06)
Forestland4.88 (0.42)0.76 (0.02)
Savannah3.88 (0.11)0.80 (0.02)
Grassland 7.60 (6.50)0.81 (0.16)
Shrubland5.30 (2.00)0.71 (0.26)
Table 3. General results of the estimation of the burnt areas derived from the MCD45A1 and MCD64A1 in the GMS classified by vegetation fires in 2015.
CountriesEstimation of the Burnt Areas Derived from the MCD45A1 (Mha) 1
CLFLSVSL GLTotal% of BA
Myanmar0.600.700.890.0020.032.2150%
Cambodia0.430.040.830.0020.061.3731%
Lao PDR.0.010.0060.020.000.0020.041%
Thailand0.410.100.170.000.010.6815%
Vietnam0.070.0030.040.000.000.113%
GMS1.520.851.940.0040.114.41100%
% of BA34%19%44%0%2%100%
CountriesEstimation of the Burnt Areas Derived from the MCD64A1 (Mha) 1
CLFLSVSLGLTotal% of BA
Myanmar0.391.771.650.0010.023.8236%
Cambodia0.350.342.590.010.063.3531%
Lao PDR.0.090.420.200.000.0040.717%
Thailand0.590.320.510.000.011.4313%
Vietnam0.980.130.270.000.011.4013%
GMS2.402.985.210.0080.1110.70100%
% of BA22%28%49%0%1%100%
1 CL = cropland; FL = forestland; SV = savannah; GL = grassland; SL = shrubland; BA = burnt area.
Table 4. Detection rate of the gridded fire court overlap between the MCD64A1 and MCD45A1 and the reference fires.
Vegetation Types 1Detection Rate of the MCD64A1
Gridded Fire Court 2Detection Rate (%)
RFMCD64A1Overlap of the MCD64A1 and RFOccurrence of RF without the MCD64A1
SV, GL, and SL23821784172365972%
FL20191539140863870%
CL19648967981,10841%
Vegetation Types 1Detection Rate of MCD45A1
Gridded Fire Court 2Detection Rate (%)
RFMCD45A1Overlap of the MCD45A1 and RFOccurrence of RF without the MCD45A1
SV, GL, and SL2382847812156634%
FL2019462425161821%
CL1964300283167914%
1 CL = cropland; FL = forestland; SV = savannah; GL = grassland; SL = shrubland; 2 RF = reference fires.
Table 5. General results of the validation of the MCD45A1 and MCD64A1 and the reference fires.
Vegetation Types 1Validation of the MCD45A1 2
Burnt Area (kha)MCD45A1/RFCorrection Factor
RFMCD45A1
SV, GL, and SL26413170.128.34
FL32552170.0714.99
CL1194570.0521.08
Total70895900.0812.01
Vegetation Types 1Validation of the MCD64A1 2
Burnt Area (kha)MCD64A1/RFCorrection Factor
RFMCD64A1
SV, GL, and SL264112510.472.11
FL32559770.303.33
CL11942290.195.21
Total 708924570.352.89
1 CL = cropland; FL = forestland; SV = savannah; GL = grassland; SL = shrubland; 2 RF = reference fires.
Table 6. The actual amount of emissions from biomass open burning in the GMS in 2015 (standard error in parentheses).
CountriesEmission from Biomass Open Burning in the GMS in 2015
CO2 CH4N2OCO NOXSO2NH3PM2.5BCOC
(Mt)(kt)(kt)(Mt)(kt)(kt)(kt)(kt)(kt)(kt)
Myanmar6416773.3117164831620146
(12)(102)(1)(2)(66)(10)(41)(172)(12)(93)
Cambodia458752.09612261991378
(8)(61)(1)(1)(42)(7)(20)(116)(7)(44)
Lao PDR.133710.72331065431
(2)(22)(0.5)(0)(14)(2)(8)(36)(3)(20)
Thailand277921.5517271171048
(9)(68)(0.5)(1)(36)(4)(21)(77)(5)(27)
Vietnam309921.8588361231347
(12)(97)(0.5)(1)(48)(4)(27)(90)(6)(22)
GMS178469189.43454614782060350
(42)(351)(3)(5)(206)(26)(117)(489)(32)(205)
Table 7. Comparison of the PM2.5 emissions between this study and the GFED4.1s.
CountryPM2.5 Derived from
This Study (kt) 1
PM2.5 Derived from GFED4.1s (kt) 1Ratio (This Study/GFED4.1s) 1
CLSV, GL, SLFLTotalCLSV, GL, SLFLTotalCLSV, GL, SLFLTotal
Myanmar3779200316143682045852.60.21.00.5
Cambodia3412738199262323476051.30.50.10.3
Lao PDR.81048654155892482.00.10.50.3
Thailand57253611734196492801.70.10.70.4
Vietnam9413151235093592021.90.10.30.6
GMS230253337820128104374919201.80.20.40.4
1 CL = cropland; FL = forestland; SV = savannah; GL = grassland; SL = shrubland.

