Increasing Trend on Storm Wave Intensity in the Western Mediterranean


Department of Civil Engineering, Bursa Uludağ University, Gorukle Campus, 16059 Bursa, Turkey
*
Author to whom correspondence should be addressed.
Climate 2021, 9(1), 11; https://0-doi-org.brum.beds.ac.uk/10.3390/cli9010011
Submission received: 6 December 2020
/
Revised: 28 December 2020
/
Accepted: 6 January 2021
/
Published: 8 January 2021
(This article belongs to the Special Issue Wave Climate)
Abstract
:Annual trends in storm wave intensity over the past 41 years were evaluated during the present study. Storm wave intensity is evaluated in terms of total storm wave energy (TSWE) and storm power index (SPI) of Dolan and Davis (1992). Using an accurate long-term wave hindcast developed using a calibrated SWAN model, all storm wave events occurring over the past 41 years were characterized in terms of significant wave height (Hs) and total storm duration. Thus, both SPI and TSWE was computed for each storm wave event. The Theil–Sen slope estimator was used to estimate the annual slopes of the SPI and TSWE and the Mann–Kendall test was used to test the trend significance with different confidence levels. The present study is spatially performed for the western Mediterranean Sea basin considering 2308 grid points in a regular grid of 0.198° resolution in both directions. Results allow as to define five hotspots covering a large area, experienced a significant increasing slope in both SPI and TSWE (annual maxima and average). The confidence level in this area exceed 95%, with a steep slope between 100 kWh·m−1·year−1 and 240 kWh·m−1·year−1 for annual max TSWE and between 28 m²·h·year−1 and 49 m²·h·year−1 for annual max SPI. Consideration of the present findings is strongly recommended for risk assessment and for sustainable development in coastal and offshore area and to identify areas sensitive to global climate change in the western Mediterranean Sea.
1. Introduction
Marine storms are one of the major preoccupations of sea users and marine security services. They are often responsible for significant damage and loss in several sectors of marine activity such as aquaculture [1] and navigation [2,3]; additionally, these storms are responsible for several changes in the coastlines [4,5] and cause damage to coastal and port infrastructure [6,7,8]. The extent of this damage can have a considerable impact on the economies of countries. Currently, several researchers are interested in assessing the impact of storms on coastal areas in the Mediterranean [9,10,11,12,13,14,15]. These contributions have been motivated by the alarming climate changes observed over the last decades [5,16,17,18], considering the increasing trend in significant wave heights (Hs) reported in several studies [19,20,21,22,23,24], as well as the increase in Hs during tropical cyclones [25,26], and also the variation in storm wave intensity [4], linked to the local variation in the storm power index of Dolan and Davis [27]. Thus, the intensity of storm waves depends on several factors, mainly the wave heights and wave period during the storm, the persistence of storms, and the direction of storm waves with respect to the shoreline. An assessment of these parameters that characterize storm waves occurred over a considerable period of time will provide a better understanding of the storm regime and allow for a better assessment of the likely intensities of a storm wave along the coast.
In the present study, we aim to evaluate the trend in storm wave intensity based on total storm wave energy of each storm event (TSWE), also called energy flux and computed following Molina et al. [28], and on the storm power index (SPI), derived by Dolan and Davis [27], calculated for each characterized storm. The SPI index is applied by several researchers in the evaluation of the impacts of storms in the coastal zones [5,29,30,31,32]. These studies showed a significant correlation between the storm power index [27] and the storm’s causality. For our aim, the storm wave events occurred in the whole western Mediterranean Sea basin during the last 41 years were characterized according to the definition adopted by Ojeda et al. [33], which characterizes a storm as an event during which significant wave heights exceed a minimum threshold Hs for a minimum period of 12 h. Thus, the storm threshold height is defined according to the wave climate data of each grid point of the western Mediterranean based on the formula proposed by Birkemeier et al. [34] and used by Walker and Besco [35] and Mendoza et al. [36].
Trend analysis was based on the Theil–Sen slope estimator and the Mann–Kendall test to assess the significance of trends with several levels of confidence. Spatial assessment of storm wave intensity trends helps to assess the influence of global warming and global change on storm regimes in the Western Mediterranean basin and helps to define the areas most affected by climate change hazards. Thus, the database and the results developed during this study will constitute a decision-making tool that should be considered to ensure a more sustainable development of maritime activities carried out in areas experiencing significant trends in storm wave intensity.
2. Methodology
Increases in storm intensity and wave heights constitute an important factor to be considered in the assessment of global climate change and coastal hazards [25]. For the Mediterranean climate, several observable physical changes are experiencing trends that may extend into the future [16,37]. Increasing trends in storm intensity resulting from global climate variations may increase coastal vulnerability, risk in maritime transport, risk in offshore activities, and affect sustainable development on the Western Mediterranean coasts. Increased storms accompanied by a temporary rise in local sea level [38] will allow energetic storm surges to reach higher beach and dune areas, which can lead to severe erosion [39].
During this study, trends in storm wave intensities are assessed in three main steps. Taking into account one grid point every 0.198°, extracted from a validated wave hindcast of 0.033° resolution (Section 2.1), the first step consists of characterizing the storm wave events occurring in the western Mediterranean Sea during the last 41 years. These storms are characterized by their persistence, their average direction, and the variations in significant wave heights during the storm. The second step consists of the calculation of two main parameters used to determine the storm’s intensity. These two parameters are the storm intensity index of Dolan and Davis [27] and the total wave energy during each storm calculated according to [28] as detailed below. The final step is the analysis of annual trends in storm wave energies and SPI storm power index. For this analysis, the Theil–Sen slope estimator was used for the slope estimation and the Mann–Kendall test was used for the assessment of the significant of the storm intensity trends. Details on the analysis method are presented in following subsections.
2.1. Wave Hindcast
During this study, a high-precision hindcast wave dataset was used. This wave hindcast, developed using a SWAN model [40,41], was calibrated specifically for the western Mediterranean Sea [42]. This wave hindcast was developed to carry out a detailed assessment of the wave energies resources in the Algerian coast [43], and it is updated annually using the same model, the same numerical and physical parameters, and the same spatial and temporal resolution of 0.033° and 3 h, respectively.
The CFSR (Climate Forecast System Reanalysis) wind [44,45] was used for forcing the wave model. This reanalysis was developed and provided by the National Centers for Environmental Prediction (NCEP) from the webservices https://rda.ucar.edu/. CFSR data are characterized by a very high temporal resolution of 1 h, considered to be necessary in the estimation of storm peaks [46], and covers 41 years. The CFSR’s accuracy was approved in several studies with a slight overestimation of wind speed [47,48,49,50,51,52,53]. For an efficient study of coastal hazards, a slight overestimation of wind speed and significant wave heights can be preferred than a slight underestimation to ensure sustainable development and an improved security.
Using the CFSR wind field [44,45], the model was run in the third generation and in nonstationary mode using the STOPC (Stop Criterion) convergence criterion requiring 99% of the active grid points to be converged across the entire western Mediterranean Domain from 17° E to 6° W and from 35° N to 45° N. The selected time step was 30 min with a maximum of 4 iterations per time step, and the directional wave energy density spectrum function was discretized using 36 directional bins and 35 frequency bins between 0.033 Hz and 1.0 Hz. For the boundary condition, the southeastern and western boundary of the computational grid was defined with the JONSWAP spectrum with a peak enhancement parameter gamma = 3.3. Further information on the wave model setup are detailed in Amarouche et al. [42], and some physical computation settings are summarized in Table 1.
For the evaluation of the wave hindcast accuracy, validation was carried out based on 11 wave buoys. The results were detailed in Amarouche et al. [42,43]. In Table 2, we presented same statistical errors obtained by comparing the hindcast wave data against wave measurements of 11 buoys around the western Mediterranean sea. The results show a good accuracy of the wave hindcast, with average scatter index of 0.298 and 0.194 for both significant wave height (Hs) and zero crossing wave period (Tm02), respectively. Thus, a high correlation is recorded in all buoys, with an average of 0.925 and 0.83 for Hs and Tm02, respectively, reflecting the high precision of the calibrated SWAN model used during this study. Further detail on the SWAN model calibration and accuracy assessment can be found in Amarouche et al. [42].
2.2. Storm Wave Characterization
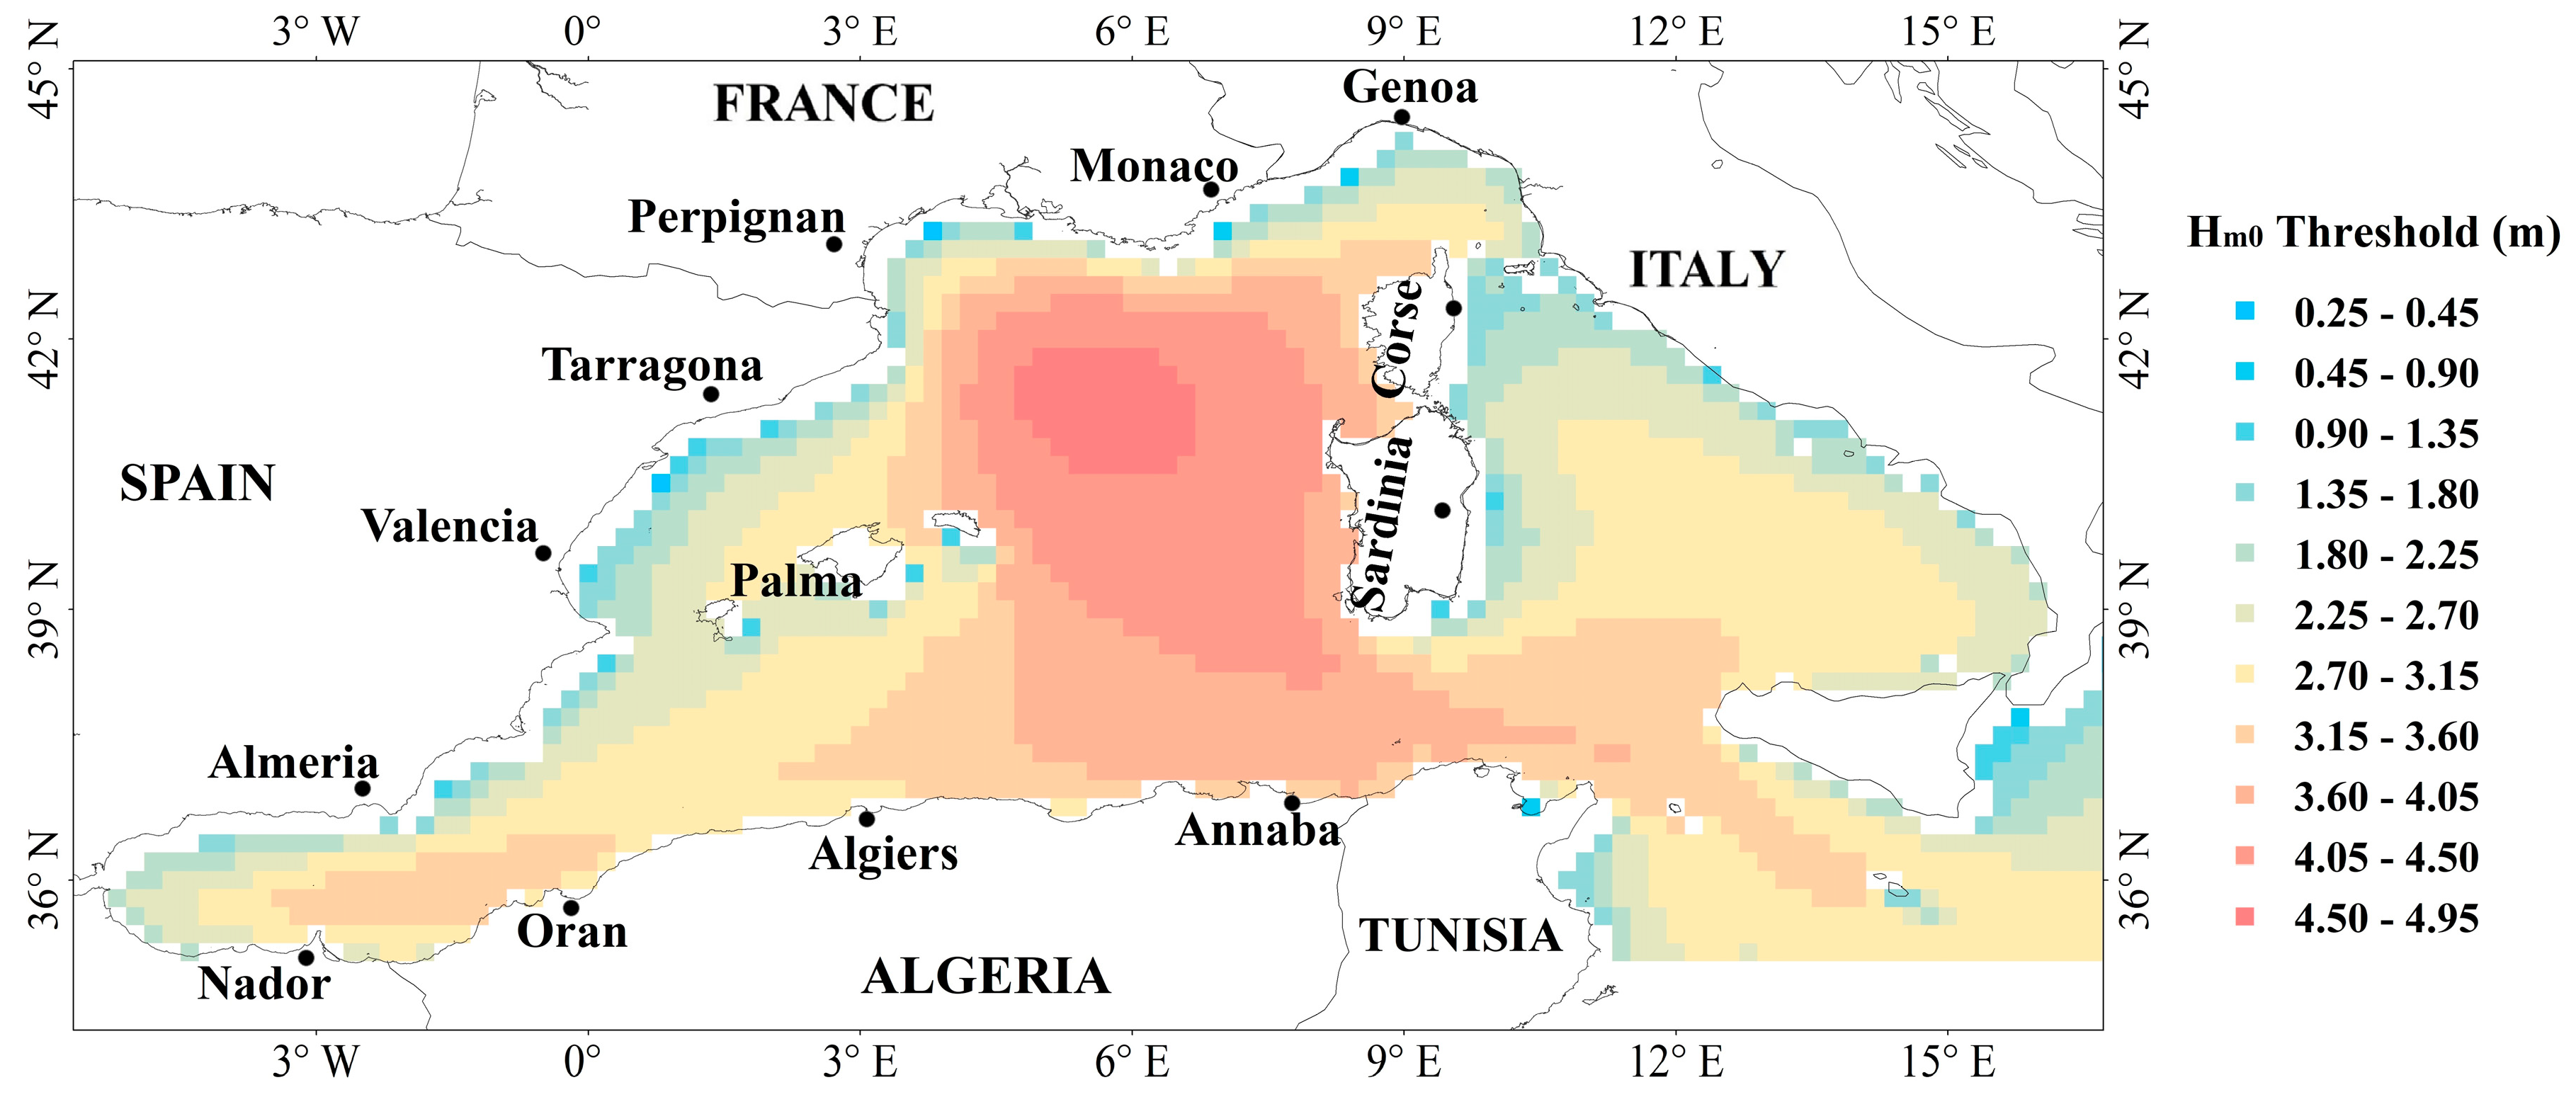
A storm wave is a climate event defined as a time period during which the significant wave height exceeds a minimum threshold Hs during a considerable time lapse. The storm wave events identified during the present study are characterized according to the definition established by [33], who considered a storm wave as an event where the observed significant wave heights exceed a threshold height for at least 12 h, whereas the Hs, threshold is calculated according to the long term wave climate data in the concerned area according to Birkemeier et al. [34] and Walker and Besco [35], which defines Hs, threshold for each study area as the long-term mean of significant wave heights plus twice the standard deviation according to the following formula:
Figure 1 shows the threshold heights calculated based on this formula for all the grid points evaluated during the present study. This figure clearly shows a variation in the threshold heights to be considered in each zone and their dependence on the local wave climate, which is related in turn to the depth and proximity of the coast. Thus, in order to ensure that the event is statistically independent [33], two consecutive storm waves are considered independent if the significant wave heights between two events remain above Hs, threshold for a minimum of 48 h; this separation period allows a distinction of macro-meteorological phenomena [62]. The total storm number characterized based on these criteria are mapped.
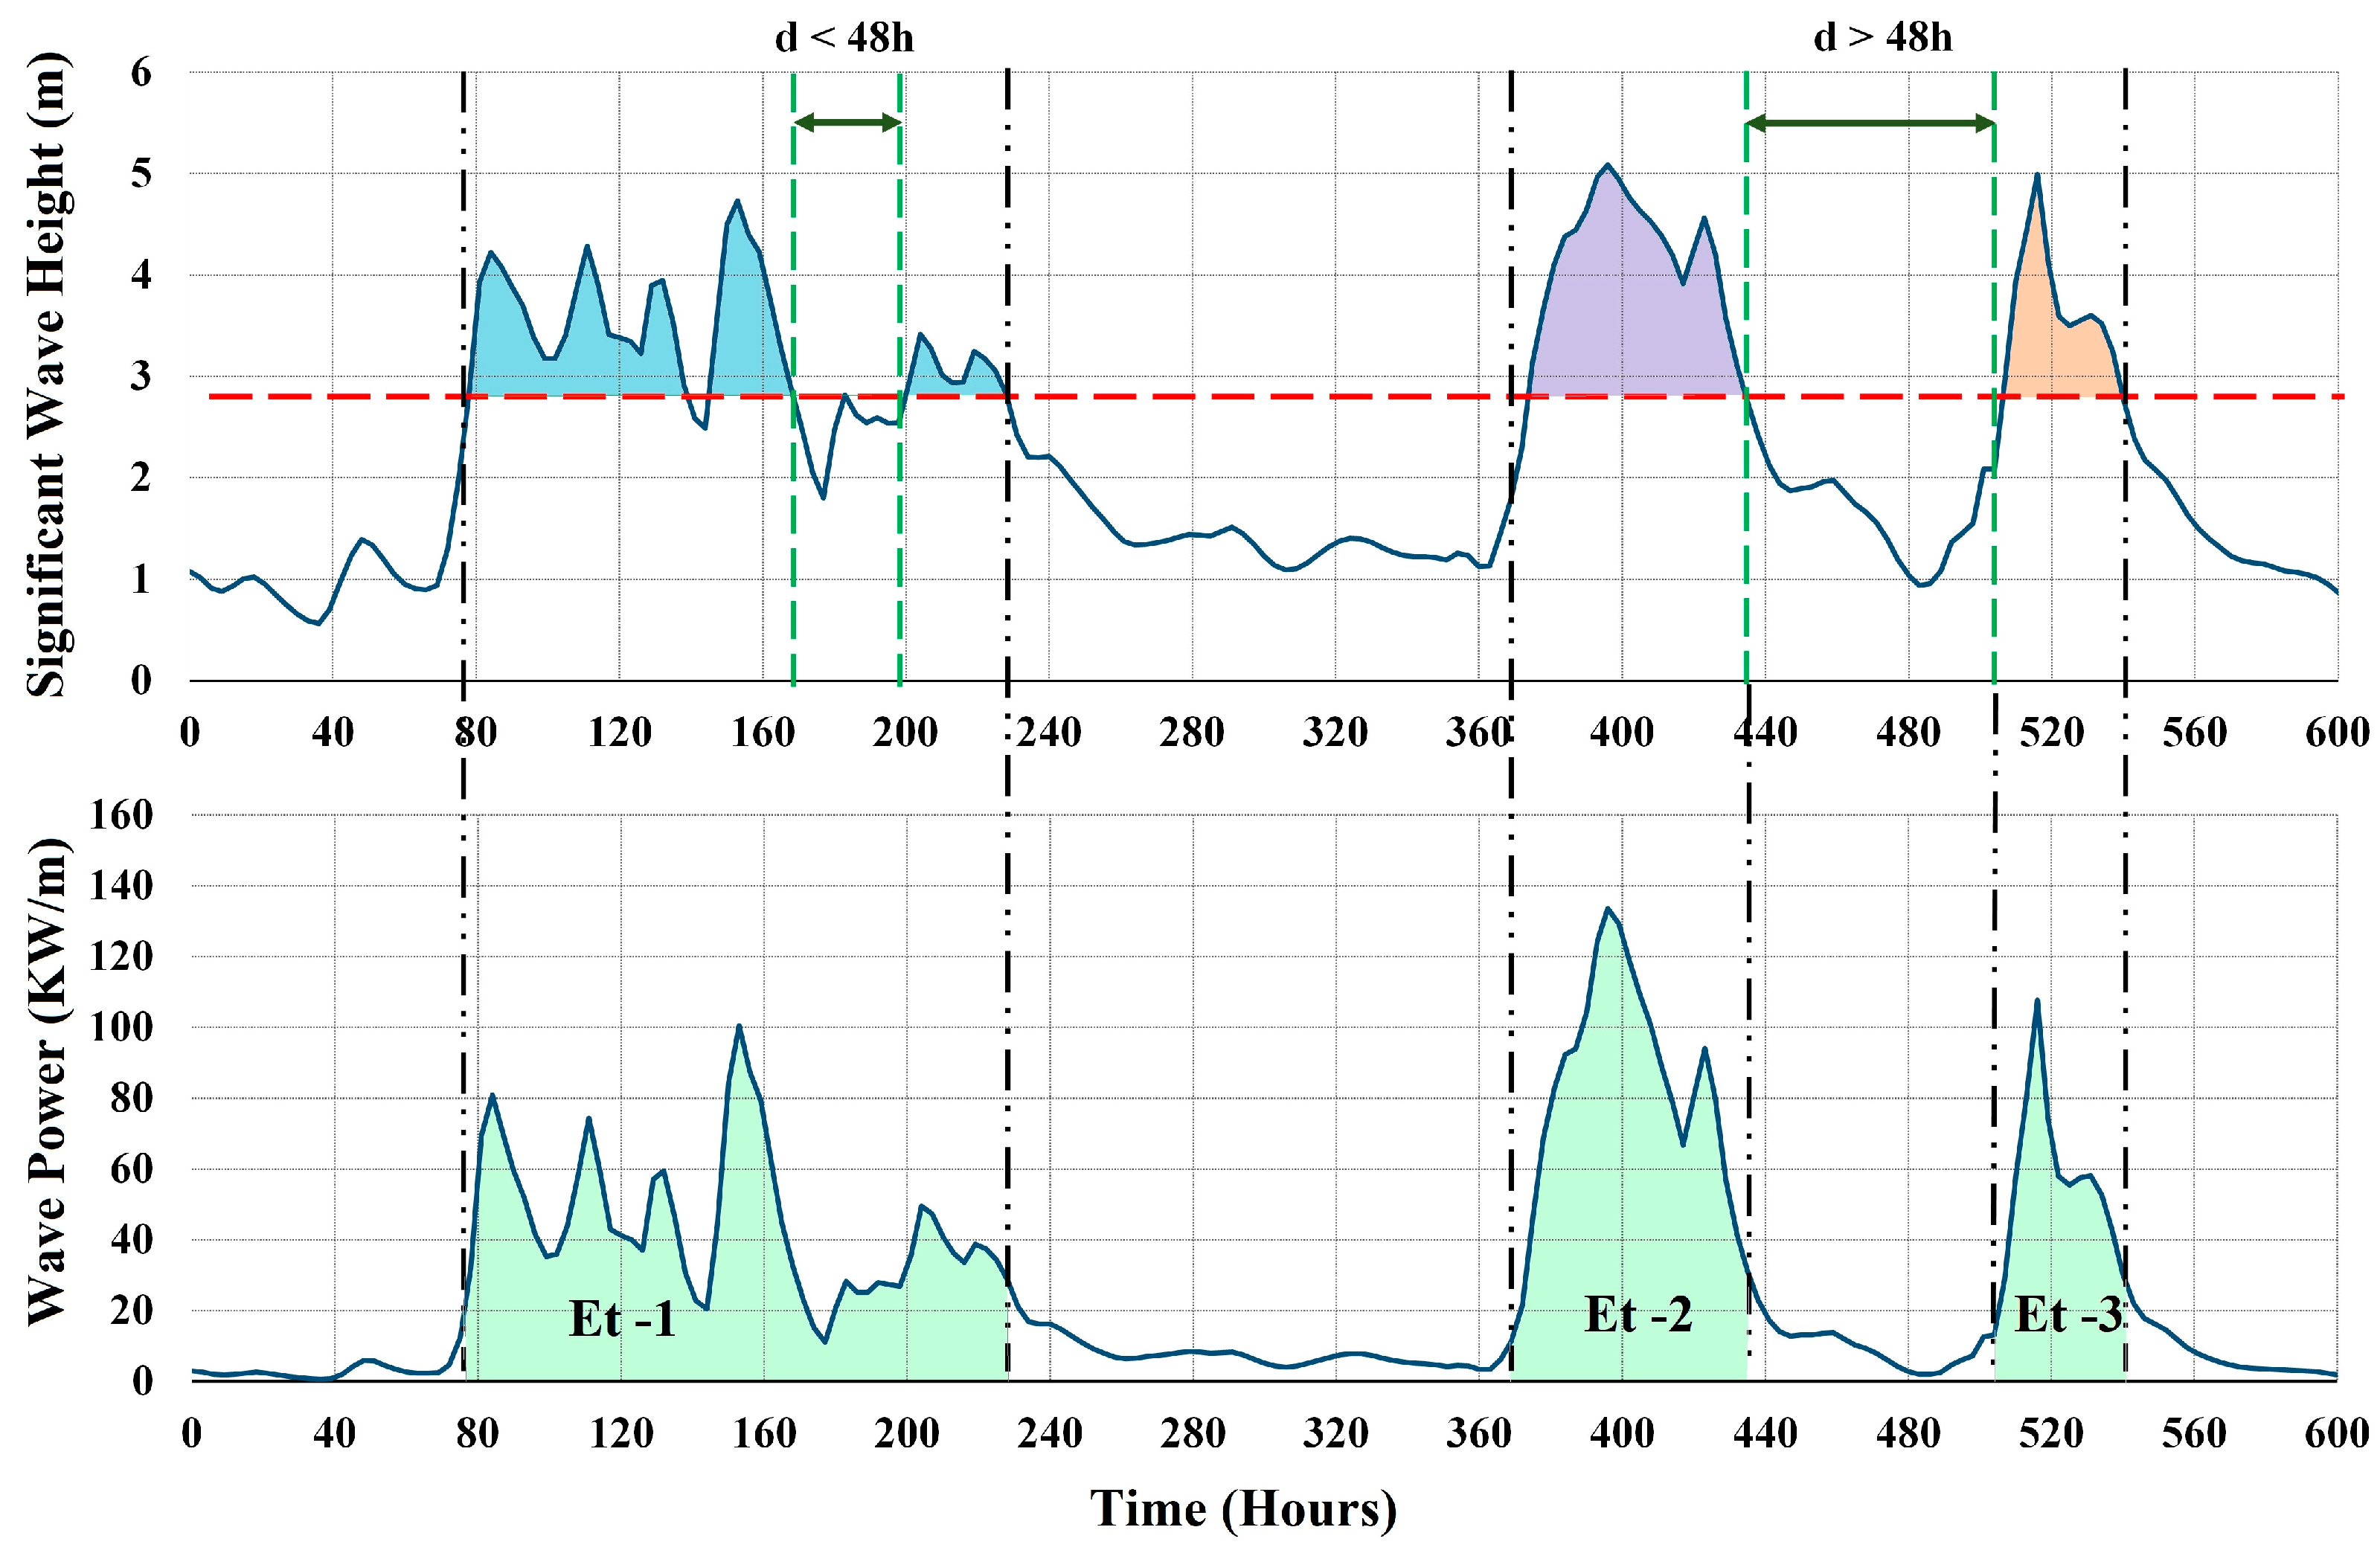
Figure 2 illustrates three independent consecutive storms that are characterized based on the definition of [33] in the time series plot of significant wave heights; thus, on the same figure the total energy of each storm wave is illustrated by a green area above the time series plot of wave powers (Pw) between the starting time t0 of the storm and the ending time tn. This area is mathematically represented by the following integral:
where TSWE represents the total energy during the storm wave and Pw is the wave energy flux (wave power) approximated by the following formula
where Te is the energy period defined in terms of spectral moments, Hs is the significant wave height, and ρ is the seawater density taken as 1027 kg/m3. The wave parameters (Hs and Te) used for the calculation of the wave power Pw were both obtained from the same wave hindcast database developed using the SWAN model. This simple definition of TSWE based on the total wave power during the storm period is adopted and illustrated by Molina et al. [28] and can be used to quantitatively evaluate and classify storm waves in terms of their intensities.
In addition to the TSWE, the storm power index [27] was computed for each storm event and was also used for the evaluation of storm intensity trends in the Mediterranean Sea. The SPI is determined only from the mean significant wave heights during the storm and the persistence of the storm as follows:
where Td is the storm duration in hours. The several studies [29,30,36,50,63,64,65,66] have shown a strong correlation between the SPI and the damage recorded in coastal areas. As such an evaluation of the annual trend in the SPI is considered valuable to assess the annual trend in the SPI as an indicator of storm intensity trends. The storm intensity trend is thus evaluated in terms of both TSWE and SPI.
2.3. Trend Aanalysis Method
Currently, the combined approach of Theil–Sen slope estimator [67,68] and Mann–Kendall test [69,70] is one of the most commonly practiced methods in the analysis of wave and wind climate trends [71,72,73,74,75,76,77]. The Theil–Sen slope estimator was adopted by Theil [68] and reviewed by [67] by considering the asymptotic properties of the estimators. This method does not require that constant values should be all distinct, and it is based on weaker assumptions [67]. Furthermore, the Theil–Sen estimator is not sensitive to the non-normality. Therefore, this method is more suitable for the analysis of the wave climate trend. The statistical approach of this method consists of determining the slopes aij between the set of values distributed as a function of time, two by two, by considering all possible pairs using the following formula:
where Y is the annual average data and t is the year, n is the total observations, and i and j are indexes that point out the position of all the pair of observations points used for the slope estimation. Then, the non-parametric Theil–Sen slope is determined as the median value of all pair’s points slope aij.
For the evaluation of the trend significant in storm intensity, the non-parametric test of Kendall was used. This test was developed and initiated by Mann [70] and illustrated statistically by Kendall [69]. For the application of the Mann–Kendall test, the normality distribution of the evaluated data is also not required. The Mann–Kendall test hypothesis are H0 (null hypothesis), in which we assume that the trend over the time is not existing or nonsignificant, and H1 (alternative hypothesis), in which we assume an increasing or decreasing trend over time and that this trend is significant.
Practically, the Mann–Kendall test can be summarized in four steps. The first step is preparing and ordering the data chronologically. To study the annual (mean and max) trends in TSWE and SPI over 41 years, the total observation n is 41 and the annual observations (Yi) (mean and max) of each parameter was chronologically ordered Yi…Yn. The second step of the test is the calculation of the total n(n − 1)/2 possible difference yj − yi; where i-values indicate the order of the years of observation; i = 1…n − 1, and j = i + 1…n. In the third step, the signs of the possible difference set Yj − Yi are to be used to calculate The Mann–Kendall test statistic S as follows:
The signs of the differences yj − yi are used to calculate the Mann–Kendall test statistic S using the following formula , where sgn(yj − yi) is an indicator function defined on the basis of three criteria:
sgn(Yj − Yk) = 1 if Yj − Yk > 0
sgn(Yj − Yk) = 0 if Yj − Yk = 0
sgn(Yj − Yk) = −1 if Yj − Yk < 0
sgn(Yj − Yk) = 0 if Yj − Yk = 0
sgn(Yj − Yk) = −1 if Yj − Yk < 0
The fourth step is to compute the standardized S statistic “Z” following [67] description.
where Var(S) is computed according the following
where m is the number of related values in the time series, whereas Ti is the number of data values in the mth group up to observation i.
Finally, the last step is the test of the null hypothesis (H0) by comparing the test statistic Z absolute computed value against the theorical Z1−α/2 obtained from the standard normal table. This test was evaluated by considering different significance levels α of 0.01, 0.05, 0.1, and 0.2. H0 is rejected if ǀZǀ > Z1−α/2, and that means that there is a significant trend for a confidence level of 1 − α, and the trend direction is defined as increasing or decreasing depending on the Z value sign.
3. Results and Discussion
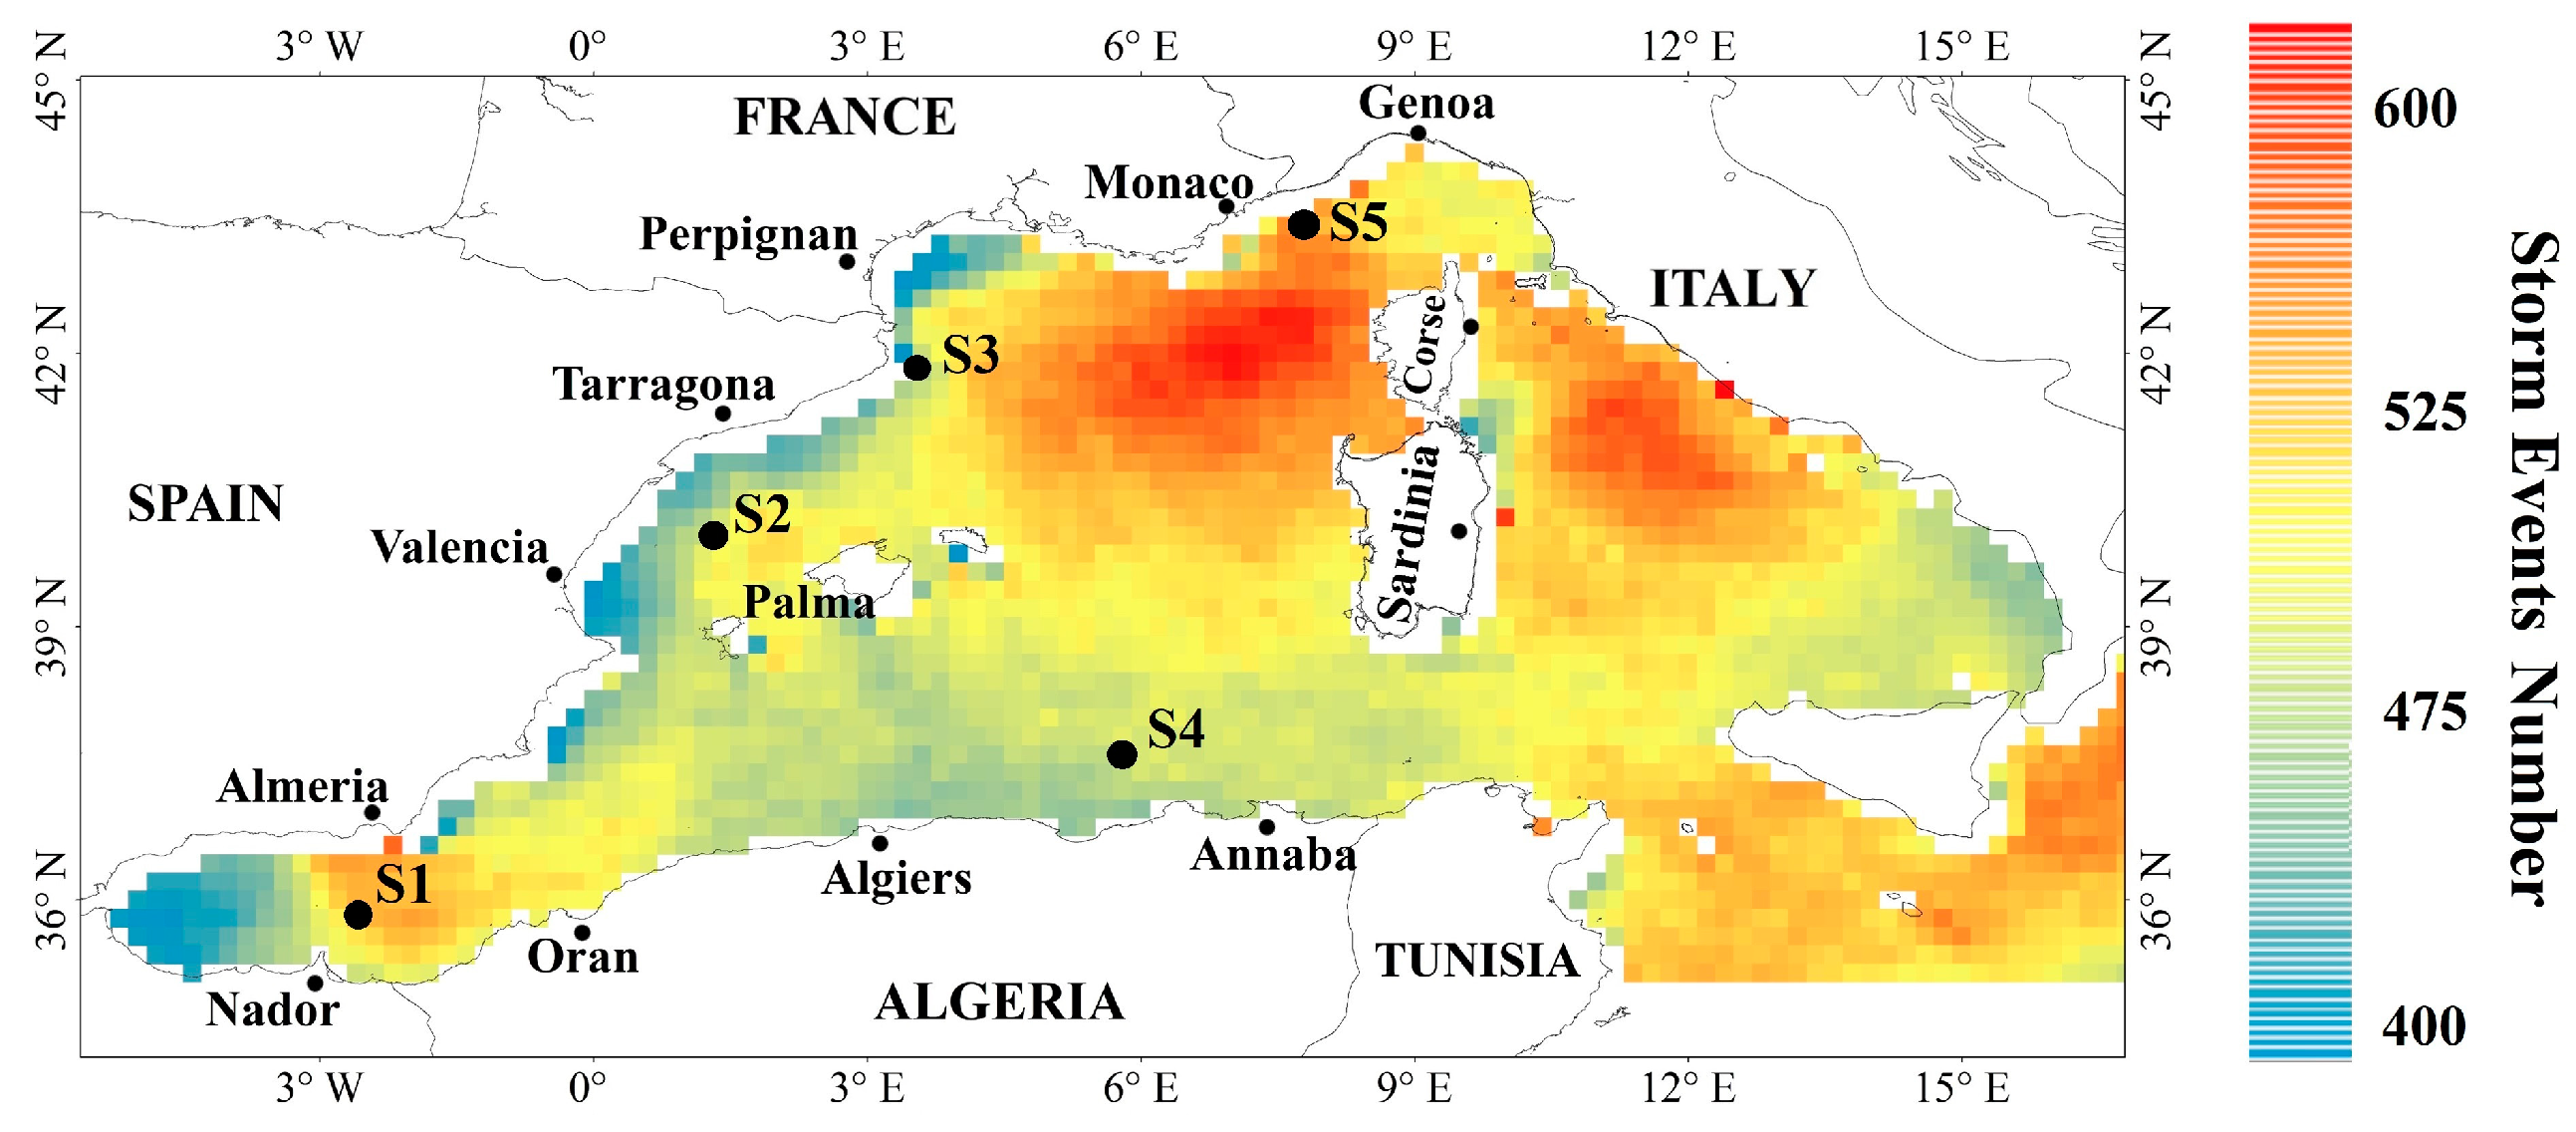
Based on the storm criteria detailed in Section 2.2, the storm wave events occurring across the whole western Mediterranean Sea were characterized according to the significant wave heights and their duration. The number of storms occurring during the last 41 years was computed spatially every 20 km from the initial wave hindcast grid of 3 km of resolution (the exact point value of the grid was mapped without interpolation). Figure 3 illustrates the number of storm events recorded during these last four decades. This result shows a considerable spatial variation in the distribution of the number of wave storm events, which mostly varied from 400 to 690 events, corresponding to around 10 to 16 events per year. The average annual number of storm events is almost in accordance with the results of Martzikos et al. [78], although the methodologies used for the storm wave characteristics are different. The area that has experienced the higher storm event numbers during the last four decades is located above the latitude 40, an area also characterized by a high probability of the Medicane (Mediterranean tropical-like cyclone) development [79], and also in the Eastern part of the Alboran Sea (S1). By comparing the spatial distribution of storms (Figure 3) with the long-term annual mean and maxima of wave energy and Hs presented in [42], we observe a significant difference in the spatial distribution between these three parameters. This difference may depend on the variability of wave climate in each region and implies that the number of storms is not directly dependent on the long-term annual mean and/or annual maxima of significant wave height and wave energy. The western Mediterranean basin is often exposed to different strong winds: the Vendaval wind from South West of the Balearic basin, the Ponente wind from the West through the Straits of Gibraltar, the Mistral wind from the northwest, the Sirocco wind from the south and southeast, the Levant wind from east and northeast, the Libeccio wind from southwest in Corsica and the Tyrrhenian basin, the Tramontane wind from the north, and the Marin from the southwest Gulf of Lion.
All the storm occurring in each point, was considered in the computation of the annual mean of the TSWE and the storm power index, was used for the annual trend’s analysis and the result was mapped by considering the real grid point without interpolation. In the present study, the storm intensity was evaluated in terms of the total energy during each storm events and in terms of the storm power index [27].
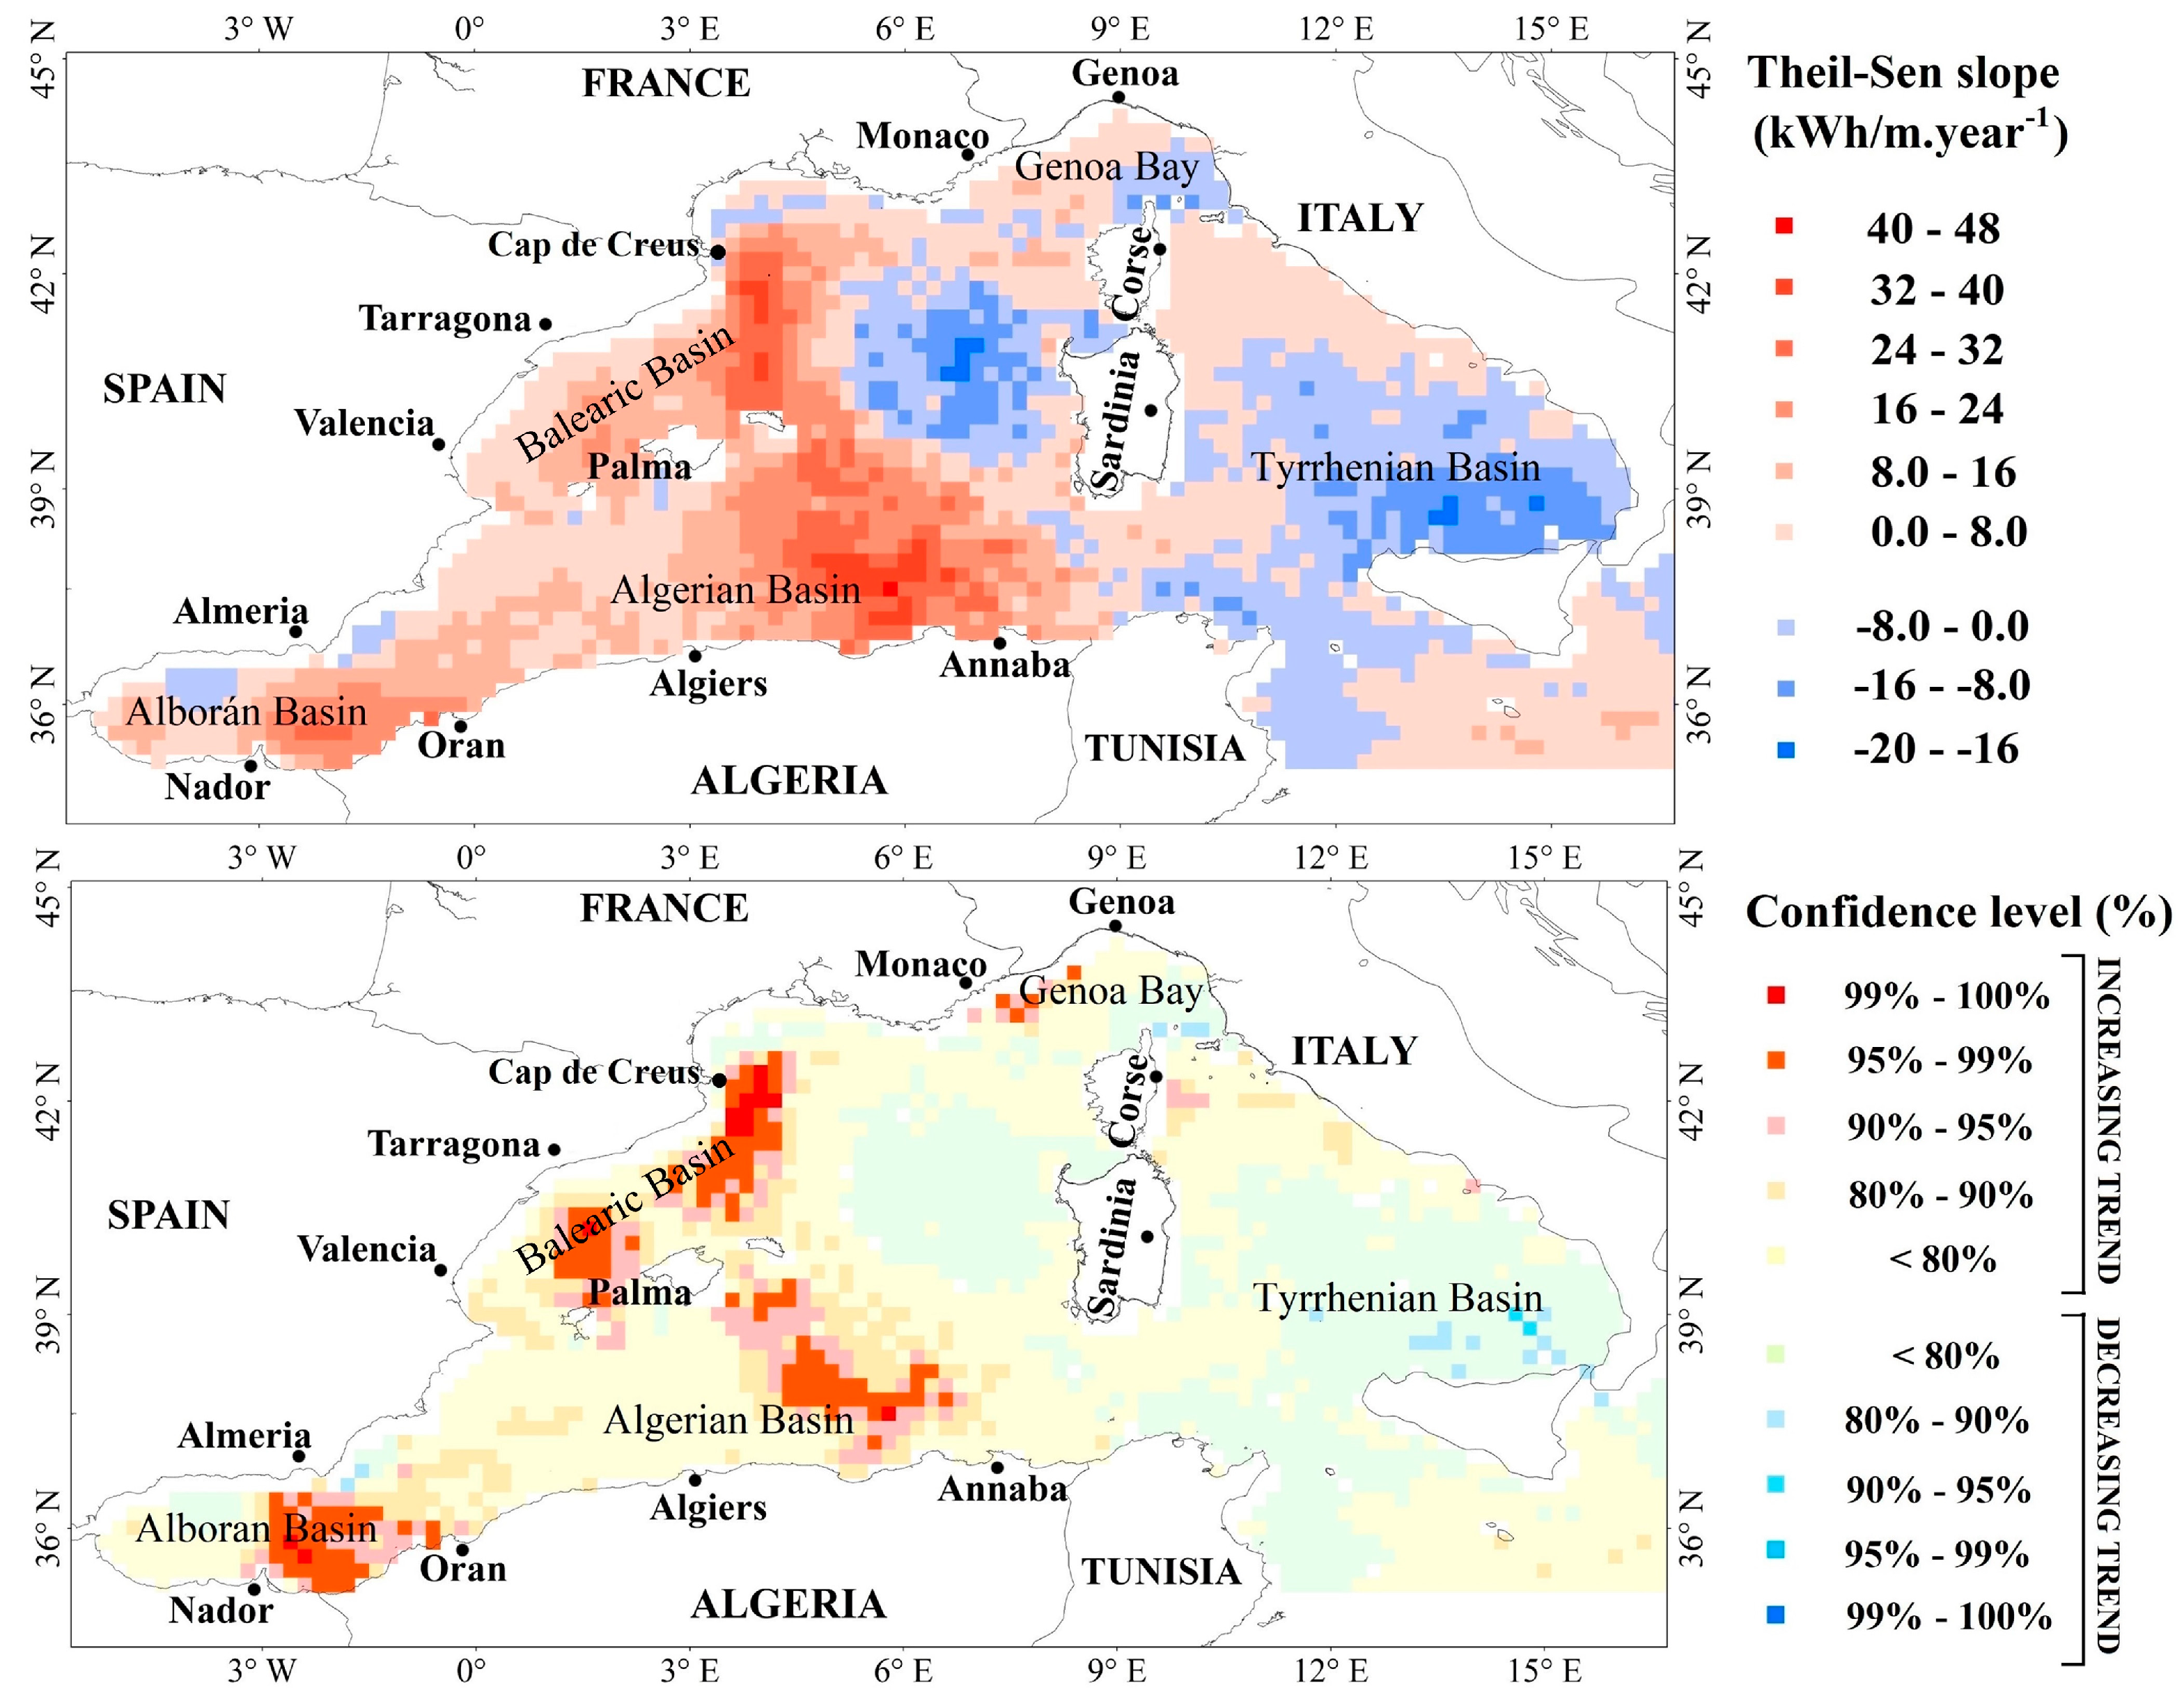
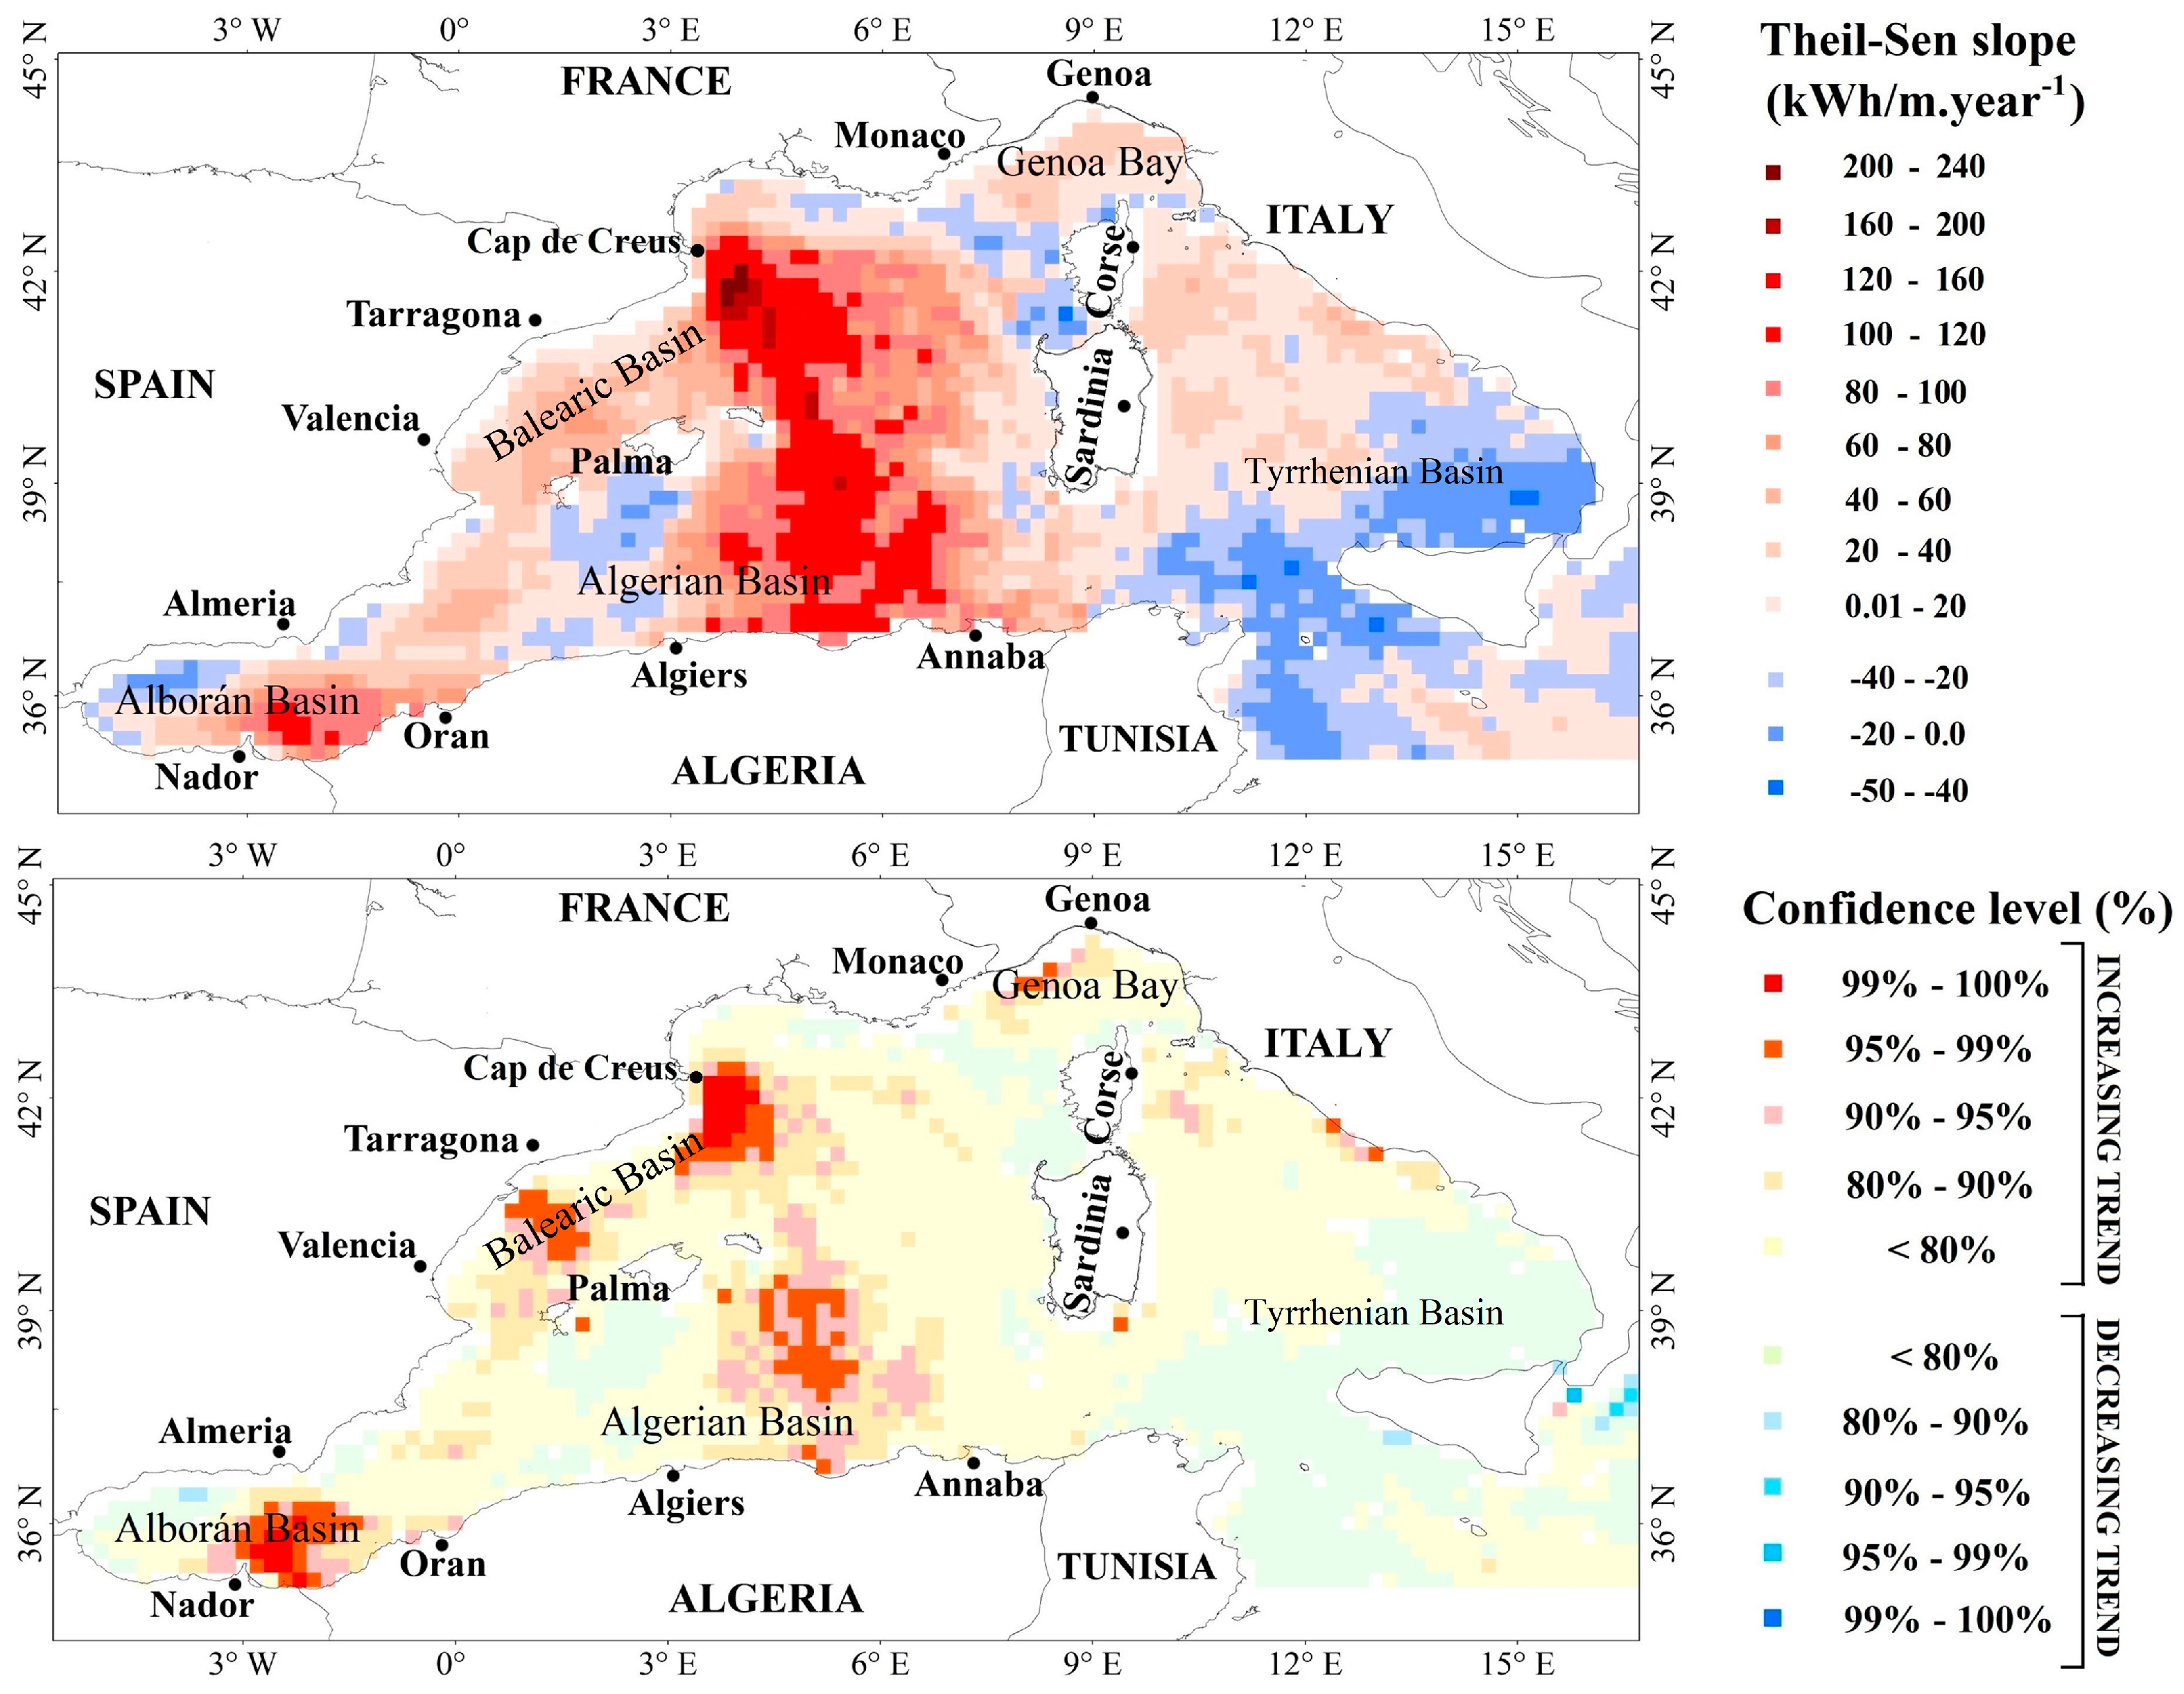
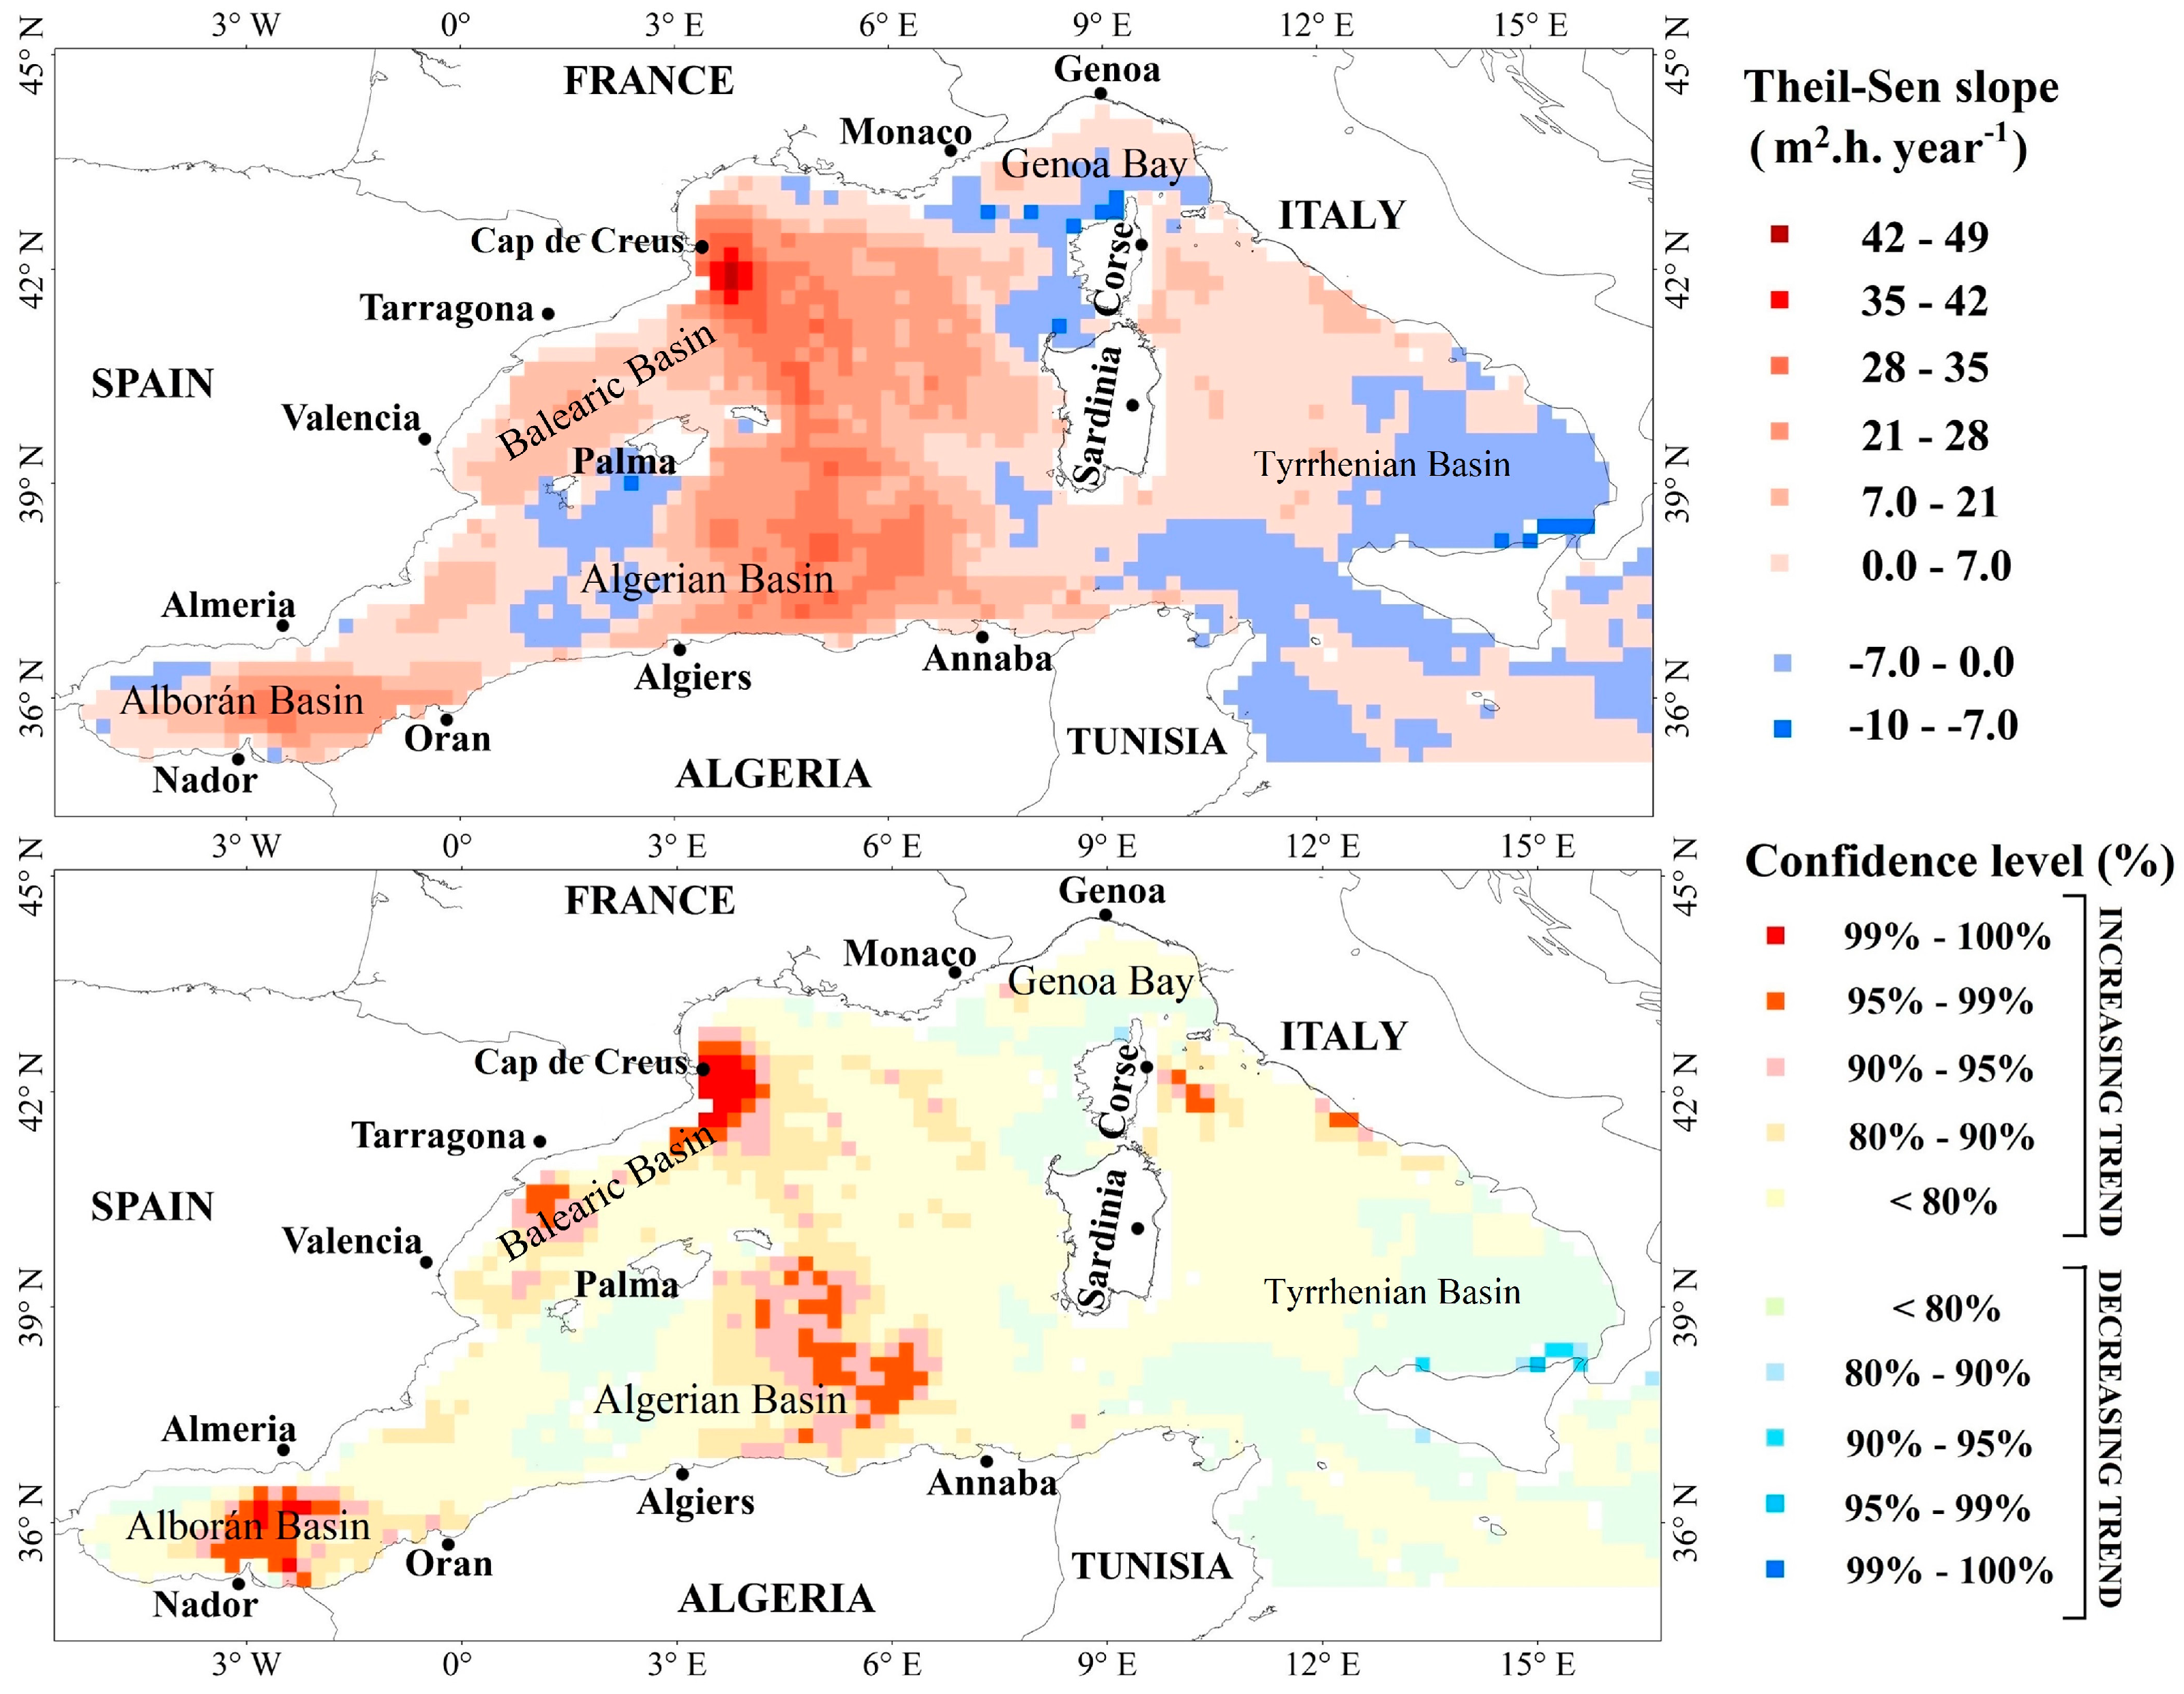
The annual trends of these parameters shown in Figure 4, Figure 5, Figure 6 and Figure 7 are used as indicators of storm wave intensity trends, given that there is no defined and specific parameter quantifying the storm wave intensity. Trends in maximum and mean TSWE and SPI were assessed. The results show a strong spatial correspondence between the area experiencing a significant trend in maximum storm intensity and the area experiencing a significant trend in mean storm intensity. Figure 4, Figure 5, Figure 6 and Figure 7 illustrate the areas experiencing a significant annual trend in TSWE and SPI (mean and maximum) according to Mann–Kendall test results as well as the estimated slope values for each area based on the Theil–Sen slope estimator. These results show that a very important part of the western Mediterranean Sea basin has experienced an increasing slope and a considerable area has experienced a significant increase in the TSWE with a confidence level >95%. This area is principally located in five different parts. The first part is located in the east of the Alboran Sea, where a significant trend in storm intensity is estimated with a slope >32 kWh·m−1·year−1 and >100 kWh·m−1. year−1, respectively, for annual average and maximum of TSWE and a slope >6 kWh·m−1. year−1 and >28 kWh·m−1. year−1 for annual average and maximum of SPI, respectively. The second part is the eastern Algerian basin, where a significant increase in both SPI and TSWE was recorded with a confidence level >95% and a very steep slope for both the annual average SPI and annual average TSWE of > 6 m²·h·year−1 and >32 kWh·m−1·year−1, respectively. Thus, a very steep slope has been estimated for annual maximum SPI and annual maximum TSWE of >28 m²·h·year−1 and >120 kWh·m−1·year−1, respectively.
The third area, is located in western part of Genoa coast, where a significant trend is estimated for max and average TSWE with a confidence level exceeding 95% and a slope >8 kWh·m−1·year−1 for the average TSWE and >40 kWh·m−1·year−1 for max TSWE. In the same area, a significant trend was also recorded for the SPI but with a lower confidence level, and only in one grid point significant trend was detected with a 95% confidence level. This can be explained by an influence of wave period variation and trend, which is considered only in the wave TSWE formulation. The fourth interesting area is located off Cap de Creus in the western part of the Gulf of Lion, where the significant trend is estimated with a confidence level >99% for both SPI and TSWE. The slope value estimated in this area exceeds 6 m²·h·year−1 and 32 kWh·m−1·year−1 for the annual average of SPI and TSWE, respectively, and exceed 42 m²·h·year−1 and 200 kWh·m−1·year−1 for the annual maximum of SPI and TSWE, respectively. The last area that experienced a significant trend in storm intensity is located off the coast of Tarragona and covers a considerable area of the Balearic on which a significant trend in both annual average and maximum of the TSWE and SPI are estimated with a confidence level exceeding 95% and with a slope of 6 m²·h·year−1 and 16 kWh·m−1·year−1 for average SPI and TSWE and 21 m²·h·year−1 and 40 kWh·m−1·year−1 for maximum SPI and TSWE, respectively. This part of the Balearic sea as well as the eastern part of Gulf of Lion experienced an extreme catastrophe in January 2020 (Storm Gloria) during which new records were recorded by the wave buoy measurements of Tarragona and Valencia, causing catastrophe damage along the French and Spanish coasts [12]. Knowing that the results obtained during this study are elaborated based on wave climate data from 1979 to 2019, we can note that the results obtained by this analysis allowed us to estimate the increase in the intensity of storm waves in the affected area during Storm Gloria 2020 [12]. However, other catastrophic storms may probably occur in the coming years and in all areas characterized by a very significant trend. Consideration of trends in storm wave intensities in the prediction of areas with high risks and in the future planning on sustainable development can therefore provide significant guidance.
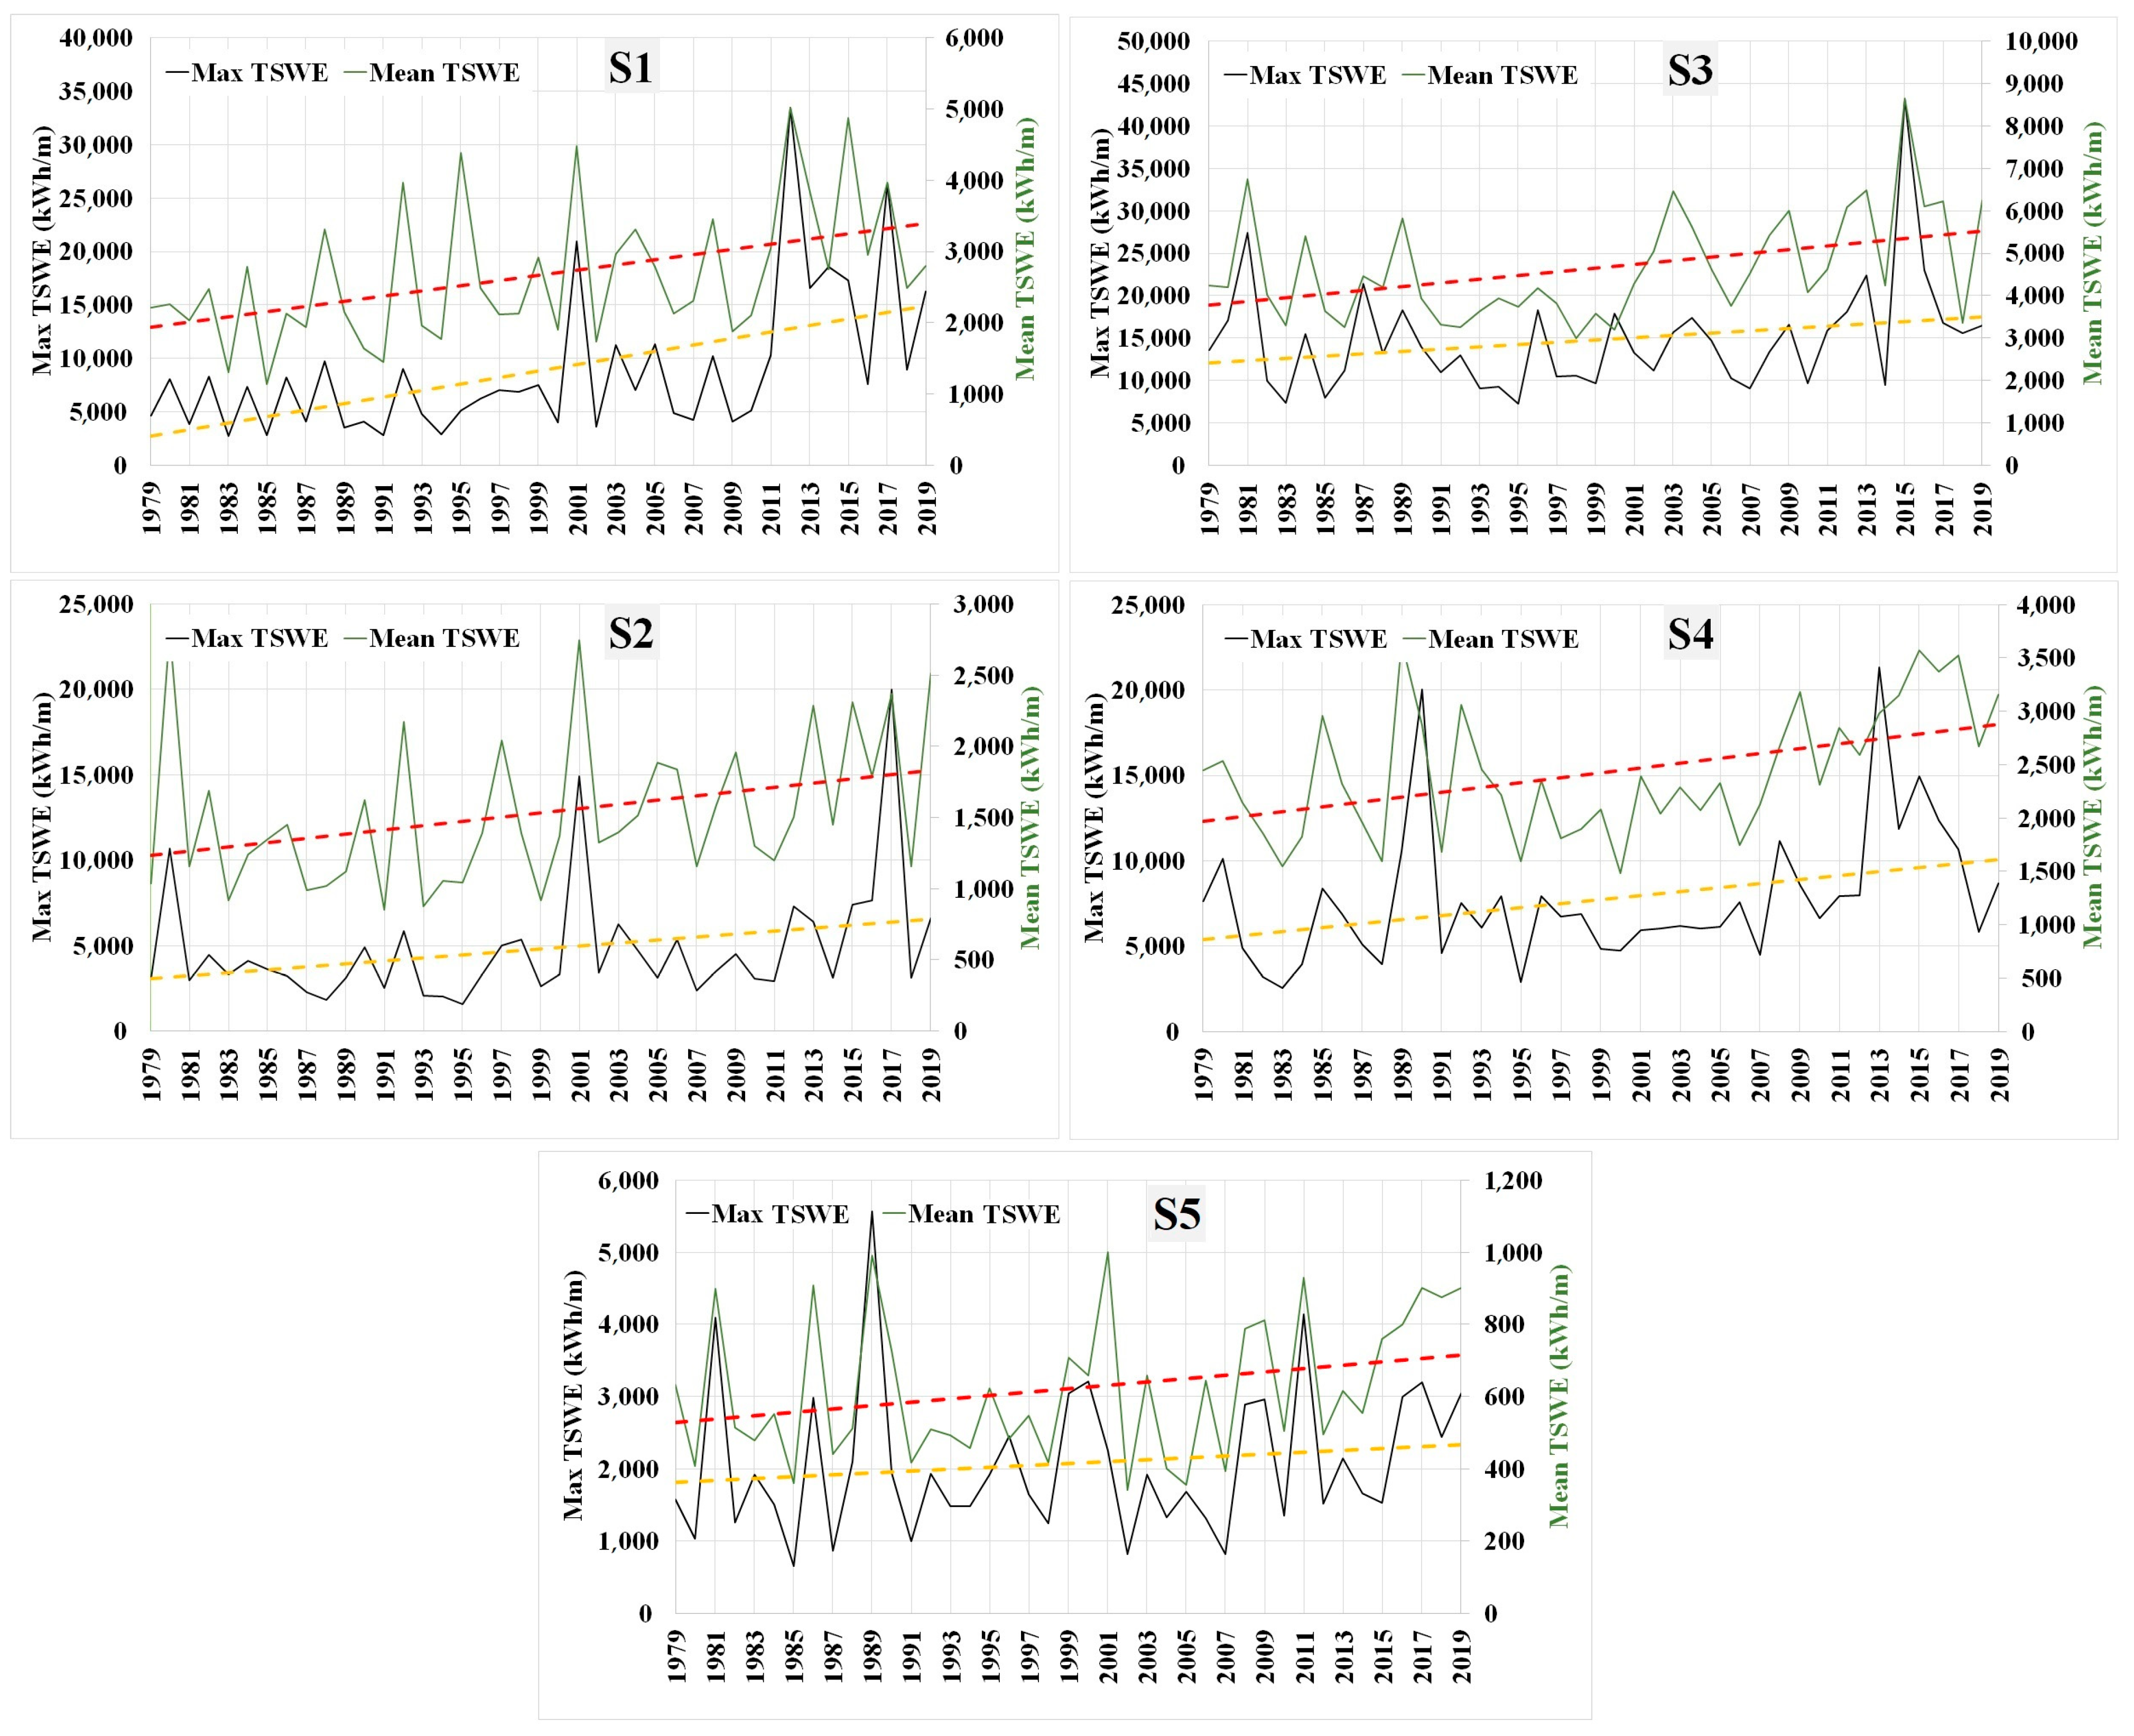
For a better visualization, a time series plot indicating the annual variation of TSWE and SPI was presented for five different stations located in the areas experiencing an increasing trend in TSWE and SPI (presented in Figure 3); the time series plots are presented in Figure 8 and Figure 9 and details on the geographical location and estimated slope in these five stations are presented in Table 3. The plots illustrate clearly the annual variation and the increasing trend in both SPI and TSWE for the annual average and maximum. Thus, these plots show a strong correspondence between the trends in mean storm intensity and trends in the most violent annual storm waves; this information may reveal that the assessed trends are not only due to exceptional annual events but to a deeper change and trend in the storm pattern observed during the year, and these areas may therefore experience strong climate change.
The present study represents the first attempt to assess the intensity of storm waves according to the TSWE and SPI. The existing studies [19,75,76,77,80,81,82,83,84,85] are focused on the evaluation of individual significant wave height trends and wind speed trends on which the storm wave events are highly dependent. Compared to the global study on wind and wave trend analysis, the result obtained during this study are in the line with the trend results of the 90th and 99th percentile significant wave height and wind speed obtained by [19,80]. Thus, a study on significant wave height trends recently made by Timmermans et al. [81] shows a strong and significant increasing trend in significant wave height in the western part of the Mediterranean basin for several analyses of wave data sources. Timmermans et al. [81] results show that the Mediterranean basin experiences one of the higher positives slope around the world during the period of 1992–2017. Thus, in comparing the area experiencing a significant increase in storm intensity with the area experiencing a significant increase in the maximum Hs as defined by De Leo et al. [74], we can notice an intersecting correspondence along the western European coast but not along the African coast. The area characterized by a significant increasing trend in storm intensity covers a more important space. This difference can be a fact of the trend in storm duration, which can considerably affect storm intensity. Results obtained are also in agreement with the results obtained by Molina et al. [28], which show an increase in the intensity of storm waves in the eastern Alboran basin between 1979 and 2014, and with the results of Jiménez [4], which show an increase in the intensity of storms on the Catalan coast for the period of 1958–2008. The results obtained in the present study and in the above-mentioned studies are based exclusively on the trends of the SPI and the TWSE by considering the overall storm wave events. However, consideration of storm direction can provide more detailed information on the main climatic events causing the trends in storm wave intensity. Table 4 illustrates the occurrence of storms by direction in the five selected hotspots. Western storm waves are very dominant in the Alboran Basin, these storms can be generated by strong Vendaval and Ponente winds, and a trend in storm intensity in this area can be affected by the Atlantic climate. The storms that occur in the Balearic Basin mainly originate from the north and northeast and can be linked to the Mistral, the Tramontane, and probably the Levantine wind. In the station S3, located off Cap de Creus in the western part of the Gulf of Lion, the dominant storm waves are from northward and can be linked to the Mistral and Tramontane. In the southern hotspot S4, the storm wave directions are practically north and west and can also be related to the Mistral, Tramontane, Vendaval, and Ponente winds. For the S5 hotspot located off of Monaco, we observe a domination of storm wave events from the southwest, probably related to the Libeccio storm winds. The storm wave events can also originate by exceptional storm events, such as Storm Gloria and other medicane events.
4. Conclusions
All storm wave events occurring in the western Mediterranean Sea over the last 41 years were characterized one by one, and the SPI and TSWE were determined for each storm event and in each grid point. Based on the Theil–Sen slope estimator and the Mann–Kendall test, the annual trend of the maximum and average of the SPI and TSWE were determined for the entire western Mediterranean Sea. The results allowed us to determine the trend slope of the SPI and TSWE and to identify the areas characterized by a significant increasing trend with an acceptable confidence level. According to the results, a very large part of the western Mediterranean Sea shows an annual increasing trend in SPI and TSWE, both in maximum and average, which is in line with the results of Young et al. [80], Young and Ribal [19], and Timmermans et al. [81]. Five areas are defined as hotspots, with a significant increasing trend and a confidence level above 95%. These areas are the East Albert Sea, the eastern Algerian Basin, the West Genoa coast, off of Cap de Creus, and off the coast of Tarragona. These last two areas were recently exposed to a record storm in January 2020 (Storm Gloria), which caused heavy damage on the French and Spanish coasts [12]. According to the present findings, a considerable and very probable risk can be expected in this area, and more intensive storms are likely to occur in the coming years.
The area that experienced a significant trend in storm intensity based on the SPI and TSWE are considerably larger than the area that experienced a significant trend in significant wave height determined by De Leo et al. [74] for the western Mediterranean basin. This can be explained by a significant influence of the storm duration trends. In order to ensure a sustainable development of the coasts and offshore in these hazardous areas, it is strongly recommended to take into account the results presented on the storm intensity trend with a detailed analysis of the wave climate variation in order to support decision-making as well as for risk assessment and management. Thus, a consideration of the wave direction during storm events can provide advantageous knowledge about the storm wave regime in the hotspot area. Our perspective is to develop a more detailed study in the selected hotspots, by considering the storm waves’ direction to assess the likely effect of the detected change in storm wave climates on the coastal zone and for the location of the most affected coasts by the increasing trend in storm wave intensity.
Author Contributions
Conceptualization, K.A. and A.A.; methodology, K.A. and A.A.; software, K.A.; validation, K.A.; formal analysis, K.A.; resources, K.A and A.A.; data curation, K.A. and A.A.; writing—original draft preparation, K.A.; writing—review and editing, K.A. and A.A. All authors have read and agreed to the published version of the manuscript.
Funding
This research received no external funding.
Acknowledgments
The authors acknowledge the National Centers for Environmental Prediction/University Corporation for Atmospheric Research (NCEP/UCAR) for providing the Climate Forecast System Reanalysis (CFSR) wind data of the National Oceanic and Atmospheric Administration (NOAA) via the Research data archive services (RDA) and we acknowledge the “Office National de Signalisation Maritime” (ONSM), The French national centre for archiving coastal swell measurement (CANDHIS) and “Público Puertos del Estado” for providing the wave measurements data used for wave hindcast validation.
Conflicts of Interest
The authors declare no conflict of interest.
References
- Jackson, D.; Drumm, A.; McEvoy, S.; Jensen, Ø.; Mendiola, D.; Gabiña, G.; Borg, J.A.; Papageorgiou, N.; Karakassis, Y.; Black, K.D. A pan-European valuation of the extent, causes and cost of escape events from sea cage fish farming. Aquaculture 2015, 436, 21–26. [Google Scholar] [CrossRef]
- Zhang, Z.; Li, X.-M. Global ship accidents and ocean swell-related sea states. Hazards Earth Syst. Sci. 2017, 17. [Google Scholar] [CrossRef] [Green Version]
- Xu, S.; Ma, M.; Yin, K.; Tang, S. Risk evaluation system of navigation security based on coupled wind and wave model: A case of study of Qiongzhou strait. IET Intell. Transp. Syst. 2020, 14, 1311–1318. [Google Scholar] [CrossRef]
- Jiménez, J.A.; Sancho-García, A.; Bosom, E.; Valdemoro, H.I.; Guillén, J. Storm-induced damages along the Catalan coast (NW Mediterranean) during the period 1958–2008. Geomorphology 2012, 143–144, 24–33. [Google Scholar] [CrossRef]
- Amarouche, K.; Akpınar, A.; Çakmak, R.E.; Houma, F.; Bachari, N.E.I. Assessment of storm events along the Algiers coast and their potential impacts. Ocean Eng. 2020, 210, 107432. [Google Scholar] [CrossRef]
- Marzeddu, A.; Oliveira, T.C.A.; Sánchez-Arcilla, A.; Gironella, X. Effect of wave storm representation on damage measurements of breakwaters. Ocean Eng. 2020, 200, 107082. [Google Scholar] [CrossRef]
- Casas-Prat, M.; Sierra, J.P. Trend analysis of wave storminess: Wave direction and its impact on harbour agitation. Nat. Hazards Earth Syst. Sci. 2010, 10, 2327–2340. [Google Scholar] [CrossRef] [Green Version]
- Wang, Y.C.; Wang, Y.Z.; Hong, N.N. Dynamic stability analysis of caisson breakwater in lifetime considering the annual frequency of severe storm. China Ocean Eng. 2015, 29, 287–300. [Google Scholar] [CrossRef]
- Sanuy, M.; Jiménez, J.A. Sensitivity of Storm-Induced Hazards in a Highly Curvilinear Coastline to Changing Storm Directions. The Tordera Delta Case (NW Mediterranean). Water 2019, 11, 747. [Google Scholar] [CrossRef] [Green Version]
- Sanuy, M.; Duo, E.; Jäger, W.S.; Ciavola, P.; Jiménez, J.A. Linking source with consequences of coastal storm impacts for climate change and risk reduction scenarios for Mediterranean sandy beaches. Nat. Hazards Earth Syst. Sci. 2018, 18, 1825–1847. [Google Scholar] [CrossRef] [Green Version]
- Lira-Loarca, A.; Cobos, M.; Losada, M.Á.; Baquerizo, A. Storm characterization and simulation for damage evolution models of maritime structures. Coast. Eng. 2020, 156, 103620. [Google Scholar] [CrossRef]
- Amores, A.; Marcos, M.; Carrió, D.S.; Gómez-Pujol, L. Coastal impacts of Storm Gloria (January 2020) over the north-western Mediterranean. Nat. Hazards Earth Syst. Sci. 2020, 20, 1955–1968. [Google Scholar] [CrossRef]
- Cavaleri, L.; Bajo, M.; Barbariol, F.; Bastianini, M.; Benetazzo, A.; Bertotti, L.; Chiggiato, J.; Davolio, S.; Ferrarin, C.; Magnusson, L.; et al. The October 29, 2018 storm in Northern Italy–An exceptional event and its modeling. Prog. Oceanogr. 2019, 178, 102178. [Google Scholar] [CrossRef]
- Sánchez-Arcilla, A.; González-Marco, D.; Doorn, N.; Kortenhaus, A. Extreme values for coastal, estuarine, and riverine environments. J. Hydraul. Res. 2008, 46, 183–190. [Google Scholar] [CrossRef]
- Jiménez, J.A.; Sanuy, M.; Ballesteros, C.; Valdemoro, H.I. The Tordera Delta, a hotspot to storm impacts in the coast northwards of Barcelona (NW Mediterranean). Coast. Eng. 2018, 134, 148–158. [Google Scholar] [CrossRef]
- Cramer, W.; Guiot, J.; Fader, M.; Garrabou, J.; Gattuso, J.-P.; Iglesias, A.; Lange, M.A.; Lionello, P.; Llasat, M.C.; Paz, S.; et al. Climate change and interconnected risks to sustainable development in the Mediterranean. Nat. Clim. Chang. 2018, 8, 972–980. [Google Scholar] [CrossRef] [Green Version]
- Lionello, P.; Scarascia, L. The relation of climate extremes with global warming in the Mediterranean region and its north versus south contrast. Reg. Environ. Chang. 2020, 20. [Google Scholar] [CrossRef]
- Sánchez-Arcilla, A.; González-Marco, D.; Bolaños, R. A review of wave climate and prediction along the Spanish Mediterranean coast. Nat. Hazards Earth Syst. Sci. 2008, 8, 1217–1228. [Google Scholar] [CrossRef]
- Young, I.R.; Ribal, A. Multiplatform evaluation of global trends in wind speed and wave height. Science 2019, 364, 548–552. [Google Scholar] [CrossRef]
- Gulev, S.K. Last century changes in ocean wind wave height from global visual wave data. Geophys. Res. Lett. 2004, 31, L24302. [Google Scholar] [CrossRef]
- Reguero, B.G.; Losada, I.J.; Méndez, F.J. A recent increase in global wave power as a consequence of oceanic warming. Nat. Commun. 2019, 10, 1–14. [Google Scholar] [CrossRef] [Green Version]
- Vieira, F.; Cavalcante, G.; Campos, E. Analysis of wave climate and trends in a semi-enclosed basin (Persian Gulf) using a validated SWAN model. Ocean Eng. 2020, 196, 106821. [Google Scholar] [CrossRef]
- Dobrynin, M.; Murawsky, J.; Yang, S. Evolution of the global wind wave climate in CMIP5 experiments. Geophys. Res. Lett. 2012, 39. [Google Scholar] [CrossRef]
- Meucci, A.; Young, I.R.; Aarnes, O.J.; Breivik, Ø. Comparison of wind speed and wave height trends from twentieth-century models and satellite altimeters. J. Clim. 2020, 33, 611–624. [Google Scholar] [CrossRef]
- Komar, P.D.; Allan, J.C. Increasing hurricane-generated wave heights along the U.S. East Coast and their climate controls. J. Coast. Res. 2008, 24, 479–488. [Google Scholar] [CrossRef]
- Bromirski, P.D.; Kossin, J.P. Increasing hurricane wave power along the U.S. Atlantic and Gulf coasts. J. Geophys. Res. 2008, 113, C07012. [Google Scholar] [CrossRef] [Green Version]
- Dolan, R.; Davis, E. An intensity scale for Atlantic coast northeast storms. J. Coast. Res. 1992, 8, 840–853. [Google Scholar]
- Molina, R.; Manno, G.; Lo Re, C.; Anfuso, G.; Ciraolo, G. Storm Energy Flux Characterization along the Mediterranean Coast of Andalusia (Spain). Water 2019, 11, 509. [Google Scholar] [CrossRef] [Green Version]
- Martzikos, N.; Afentoulis, V.; Tsoukala, V. Storm clustering and classification for the port of Rethymno in Greece. Water Util. J. 2018, 20, 67–79. [Google Scholar]
- Anfuso, G.; Rangel-Buitrago, N.; Cortés-Useche, C.; Iglesias Castillo, B.; Gracia, F.J. Characterization of storm events along the Gulf of Cadiz (eastern central Atlantic Ocean). Int. J. Climatol. 2016, 36, 3690–3707. [Google Scholar] [CrossRef]
- Rangel-Buitrago, N.; Anfuso, G. Coastal storm characterization and morphological impacts on sandy coasts. Earth Surf. Process. Landforms 2011, 36, 1997–2010. [Google Scholar] [CrossRef]
- Rangel-Buitrago, N.; Anfuso, G. An application of Dolan and Davis (1992) classification to coastal storms in SW Spanish littoral. J. Coast. Res. 2010, 64, 1891–1895. [Google Scholar]
- Ojeda, E.; Appendini, C.M.; Mendoza, E.T. Storm-wave trends in Mexican waters of the Gulf of Mexico and Caribbean Sea. Nat. Hazards Earth Syst. Sci. 2017, 17, 1305–1317. [Google Scholar] [CrossRef] [Green Version]
- Birkemeier, W.; Nicholls, R.; Lee, G. Storms, Storm Groups and Nearshore Morphologic Change, Coastal Sediments’ 99; ASCE Press: Long Island, NY, USA, 1999. [Google Scholar]
- Walker, R.A.; Basco, D.R. Application of coastal storm impulse (COSI) parameter to predict coastal erosion. Coast. Eng. Proc. 2011, 1, 23. [Google Scholar] [CrossRef] [Green Version]
- Mendoza, E.T.; Trejo-Rangel, M.A.; Salles, P.; Appendini, C.M.; Lopez-Gonzalez, J.; Torres-Freyermuth, A. Storm characterization and coastal hazards in the Yucatan Peninsula. J. Coast. Res. 2013, 65, 790–795. [Google Scholar] [CrossRef]
- Satta, A.; Puddu, M.; Venturini, S.; Giupponi, C. Assessment of coastal risks to climate change related impacts at the regional scale: The case of the Mediterranean region. Int. J. Disaster Risk Reduct. 2017, 24, 284–296. [Google Scholar] [CrossRef]
- Han, W.; Stammer, D.; Meehl, G.; Hu, A.; Sienz, F.; Zhang, L. Multi-Decadal Trend and Decadal Variability of the Regional Sea Level over the Indian Ocean since the 1960s: Roles of Climate Modes and External Forcing. Climate 2018, 6, 51. [Google Scholar] [CrossRef] [Green Version]
- Zhang, K.; Douglas, B.C.; Leatherman, S.P. Global warming and coastal erosion. Clim. Change 2004, 64, 41–58. [Google Scholar] [CrossRef]
- Booij, N.; Ris, R.C.; Holthuijsen, L.H. A third-generation wave model for coastal regions: 1. Model description and validation. J. Geophys. Res. 1999, 104, 7649–7666. [Google Scholar] [CrossRef] [Green Version]
- Ris, R.C.; Holthuijsen, L.H.; Booij, N. A third-generation wave model for coastal regions: 2. Verification. J. Geophys. Res. 1999, 104, 7667–7681. [Google Scholar] [CrossRef]
- Amarouche, K.; Akpınar, A.; Bachari, N.E.I.; Çakmak, R.E.; Houma, F. Evaluation of a high-resolution wave hindcast model SWAN for the West Mediterranean basin. Appl. Ocean Res. 2019, 84, 225–241. [Google Scholar] [CrossRef]
- Amarouche, K.; Akpınar, A.; El Islam Bachari, N.; Houma, F. Wave energy resource assessment along the Algerian coast based on 39-year wave hindcast. Renew. Energy 2020. [Google Scholar] [CrossRef]
- Saha, S.; Moorthi, S.; Pan, H.-L.; Wu, X.; Wang, J.; Nadiga, S.; Tripp, P.; Kistler, R.; Woollen, J.; Behringer, D.; et al. The {NCEP} Climate Forecast System Reanalysis. Bull. Am. Meteorol. Soc. 2010, 91, 1015–1058. [Google Scholar] [CrossRef]
- Saha, S.; Moorthi, S.; Wu, X.; Wang, J.; Nadiga, S.; Tripp, P.; Behringer, D.; Hou, Y.-T.; Chuang, H.; Iredell, M.; et al. The {NCEP} Climate Forecast System Version 2. J. Clim. 2014, 27, 2185–2208. [Google Scholar] [CrossRef]
- Tiberi-Wadier, A.-L.; Laugel, A.; Benoit, M. Construction of the Numerical Wave Databases Anemoc-2 on the Mediterranean Sea and the Atlantic Ocean Through Hindcast Simulations Over the Period 1979–2010. In Advances in Hydroinformatics; Springer Water; Springer: Singapore, 2016; pp. 127–143. [Google Scholar]
- Campos, R.M.; Guedes Soares, C. Assessment of three wind reanalyses in the North Atlantic Ocean. J. Oper. Oceanogr. 2017, 10, 30–44. [Google Scholar] [CrossRef] [Green Version]
- Campos, R.M.; Guedes Soares, C. Comparison and assessment of three wave hindcasts in the North Atlantic Ocean. J. Oper. Oceanogr. 2016, 9, 26–44. [Google Scholar] [CrossRef]
- Stopa, J.E.; Cheung, K.F. Intercomparison of wind and wave data from the ECMWF Reanalysis Interim and the NCEP Climate Forecast System Reanalysis. Ocean Model. 2014, 75, 65–83. [Google Scholar] [CrossRef]
- Carvalho, D. An assessment of NASA’s GMAO MERRA-2 reanalysis surface winds. J. Clim. 2019, 32, 8261–8281. [Google Scholar] [CrossRef]
- Akpinar, A.; Ponce de León, S. An assessment of the wind re-analyses in the modelling of an extreme sea state in the Black Sea. Dyn. Atmos. Ocean. 2016, 73, 61–75. [Google Scholar] [CrossRef]
- Çakmak, R.E.; Akpinar, A.; Van Vledder, G.P. Comparative Performance Analysis of Different Wind Fields in Southern and North-Western Coastal Areas of the Black Sea. Mediterr. Mar. Sci. 2019, 20, 427–452. [Google Scholar] [CrossRef]
- Van Vledder, G.P.; Akpınar, A. Wave model predictions in the Black Sea: Sensitivity to wind fields. Appl. Ocean Res. 2015, 53, 161–178. [Google Scholar] [CrossRef]
- Cavaleri, L.; Rizzoli, P.M. Wind wave prediction in shallow water: Theory and applications. J. Geophys. Res 1981, 86, 10961–10973. [Google Scholar] [CrossRef]
- Komen, G.J.; Hasselmann, K.; Hasselmann, K. On the Existence of a Fully Developed Wind-Sea Spectrum. J. Phys. Oceanogr. 1984, 14, 1271–1285. [Google Scholar] [CrossRef]
- Janssen, P.A.E.M. Quasi-linear Theory of Wind-Wave Generation Applied to Wave Forecasting. J. Phys. Oceanogr. 1991, 21, 1631–1642. [Google Scholar] [CrossRef] [Green Version]
- Janssen, P.A.E.M. Wave-Induced Stress and the Drag of Air Flow over Sea Waves. J. Phys. Oceanogr. 1989, 19, 745–754. [Google Scholar] [CrossRef] [Green Version]
- Hasselmann, S.; Hasselmann, K. Computations and Parameterizations of the Nonlinear Energy Transfer in a Gravity-Wave Spectrum. Part I: A New Method for Efficient Computations of the Exact Nonlinear Transfer Integral. J. Phys. Oceanogr. 1985, 15, 1369–1377. [Google Scholar] [CrossRef] [Green Version]
- Eldeberky, Y. Nonlinear Transformations of Wave Spectra in the Nearshore Zone; Delft University of Technology: Delft, The Netherlands, 1996. [Google Scholar]
- Battjes, J.A.; Janssen, J.P.F.M. Energy Loss and Set-Up Due to Breaking of Random Waves. In Proceedings of the 16th International Conference on Coastal Engineering, Hamburg, Germany, 27 August–3 September 1978; American Society of Civil Engineers: New York, NY, USA, 1978; pp. 569–587. [Google Scholar] [CrossRef] [Green Version]
- Hasselmann, K.; Barnett, T.P.; Bouws, E.; Carlson, H.; Cartwright, D.E.; Enke, K.; Ewing, J.A.; Gienapp, H.; Hasselmann, D.E.; Kruseman, P.; et al. Measurements of wind-wave growth and swell decay during the Joint North Sea Wave Project ({JONSWAP}). Dtsch. Hydrogr. Z 1973, A8, 1–95. [Google Scholar]
- Gusella, V. Estimation of extreme winds from short-term records. J. Struct. Eng. 1991, 117, 375–390. [Google Scholar] [CrossRef]
- Nicholls, R.J.; Hoozemans, F.M.J. The Mediterranean: Vulnerability to coastal implications of climate change. Ocean Coast. Manag. 1996, 31, 105–132. [Google Scholar] [CrossRef]
- Quevauviller, P. (Ed.) Hydrometeorological Hazards; John Wiley & Sons, Ltd.: Chichester, UK, 2014; Volume 1, ISBN 9781118629567. [Google Scholar] [CrossRef]
- Guisado-Pintado, E.; Malvárez, G.; Navas, F.; Carrero, R. Spatial distribution of storm wave energy dissipation for the assessment of beach morphodynamics. J. Coast. Res. 2014, 70, 259–265. [Google Scholar] [CrossRef]
- Karunarathna, H.; Pender, D.; Ranasinghe, R.; Short, A.D.; Reeve, D.E. The effects of storm clustering on beach profile variability. Mar. Geol. 2014, 348, 103–112. [Google Scholar] [CrossRef] [Green Version]
- Sen, P.K. Estimates of the Regression Coefficient Based on Kendall’s Tau. J. Am. Stat. Assoc. 1968, 63, 1379. [Google Scholar] [CrossRef]
- Theil, H. A rank-invariant method of linear and polynomial regression analysis, Part I. Proc. R. Neth. Acad. Sci. 1950, 53, 387–392. [Google Scholar]
- Kendall, M. Rank Correlation Methods, 4th ed.; Griffin: London, UK, 1975; ISBN 9780852641996. [Google Scholar]
- Mann, H.B. Nonparametric Tests against Trend. Econometrica 1945, 13, 245. [Google Scholar] [CrossRef]
- Cattrell, A.D.; Srokosz, M.; Moat, B.I.; Marsh, R. Seasonal intensification and trends of rogue wave events on the US western seaboard. Sci. Rep. 2019, 9. [Google Scholar] [CrossRef]
- Yang, S.; Oh, J. Long-Term Changes in the Extreme Significant Wave Heights on the Western North Pacific: Impacts of Tropical Cyclone Activity and ENSO. Asia-Pac. J. Atmos. Sci. 2018, 54, 103–109. [Google Scholar] [CrossRef]
- Nchaba, T.; Mpholo, M.; Lennard, C. Long-term austral summer wind speed trends over southern Africa. Int. J. Climatol. 2017, 37, 2850–2862. [Google Scholar] [CrossRef]
- De Leo, F.; De Leo, A.; Besio, G.; Briganti, R. Detection and quantification of trends in time series of significant wave heights: An application in the Mediterranean Sea. Ocean Eng. 2020, 202, 107155. [Google Scholar] [CrossRef]
- De Leo, F.; Besio, G.; Mentaschi, L. Trends and variability of ocean waves under RCP8.5 emission scenario in the Mediterranean Sea. Ocean Dyn. 2020, 1–21. [Google Scholar] [CrossRef]
- Aydoğan, B.; Ayat, B. Spatial variability of long-term trends of significant wave heights in the Black Sea. Appl. Ocean Res. 2018, 79, 20–35. [Google Scholar] [CrossRef]
- Akpınar, A.; Bingölbali, B. Long-term variations of wind and wave conditions in the coastal regions of the Black Sea. Nat. Hazards 2016, 84, 69–92. [Google Scholar] [CrossRef]
- Martzikos, N.T.; Prinos, P.E.; Memos, C.D.; Tsoukala, V.K. Statistical analysis of Mediterranean coastal storms. Oceanologia 2020. [Google Scholar] [CrossRef]
- Cavicchia, L.; von Storch, H.; Gualdi, S. A long-term climatology of medicanes. Clim. Dyn. 2014, 43, 1183–1195. [Google Scholar] [CrossRef]
- Young, I.R.; Zieger, S.; Babanin, A.V. Global trends in wind speed and wave height. Science 2011, 332, 451–455. [Google Scholar] [CrossRef] [PubMed]
- Timmermans, B.W.; Gommenginger, C.P.; Dodet, G.; Bidlot, J.-R. Global Wave Height Trends and Variability from New Multimission Satellite Altimeter Products, Reanalyses, and Wave Buoys. Geophys. Res. Lett. 2020, 47. [Google Scholar] [CrossRef]
- Shanas, P.R.; Kumar, V.S. Trends in surface wind speed and significant wave height as revealed by ERA-Interim wind wave hindcast in the Central Bay of Bengal. Int. J. Climatol. 2015, 35, 2654–2663. [Google Scholar] [CrossRef]
- Wang, X.L.; Swail, V.R. Trends of Atlantic Wave Extremes as Simulated in a 40-Yr Wave Hindcast Using Kinematically Reanalyzed Wind Fields. J. Clim. 2002, 15, 1020–1035. [Google Scholar] [CrossRef]
- Aarnes, O.J.; Abdalla, S.; Bidlot, J.-R.; Breivik, Ø. American Meteorological Society Marine Wind and Wave Height Trends at Different ERA-Interim Forecast Ranges. Source J. Clim. 2015, 28, 819–837. [Google Scholar] [CrossRef] [Green Version]
- Divinsky, B.V.; Kosyan, R.D. Climatic trends in the fluctuations of wind waves power in the Black Sea. Estuar. Coast. Shelf Sci. 2020, 235, 106577. [Google Scholar] [CrossRef]
Figure 1.
Significant wave height thresholds used for the characterization of storm wave events.

Figure 2.
Time series plot illustrating three storm waves (distinguished by colors) characterized for a significant wave height threshold of 2.7 m with a minimum interval between two consecutive storms of 48 h.
Figure 2.
Time series plot illustrating three storm waves (distinguished by colors) characterized for a significant wave height threshold of 2.7 m with a minimum interval between two consecutive storms of 48 h.

Figure 3.
Map showing the number of storm wave events occurring at each analyzed point during the period of 1979 to 2019.
Figure 3.
Map showing the number of storm wave events occurring at each analyzed point during the period of 1979 to 2019.

Figure 4.
Spatial distribution of long-term trends (Theil–Sen slope in kWh·m−1·year−1) of the annual average of the total storm wave energy (TSWE) (upper panel) and their significant trends according to the Mann–Kendall test at different confidence levels (lower panel).
Figure 4.
Spatial distribution of long-term trends (Theil–Sen slope in kWh·m−1·year−1) of the annual average of the total storm wave energy (TSWE) (upper panel) and their significant trends according to the Mann–Kendall test at different confidence levels (lower panel).

Figure 5.
Spatial distribution of long-term trends (Theil–Sen slope in kWh·m−1·year−1) of the annual maxima of the total storm wave energy (TSWE) (upper panel) and their significant trends according to the Mann–Kendall test at different confidence levels (lower panel).
Figure 5.
Spatial distribution of long-term trends (Theil–Sen slope in kWh·m−1·year−1) of the annual maxima of the total storm wave energy (TSWE) (upper panel) and their significant trends according to the Mann–Kendall test at different confidence levels (lower panel).

Figure 6.
Spatial distribution of long-term trends (Theil-Sen slope in m²·h·year−1) of the annual average of Storm Power Index (SPI) (upper panel) and their significant trends according to the Mann Kendall test at different confidence levels (lower panel).
Figure 6.
Spatial distribution of long-term trends (Theil-Sen slope in m²·h·year−1) of the annual average of Storm Power Index (SPI) (upper panel) and their significant trends according to the Mann Kendall test at different confidence levels (lower panel).

Figure 7.
Spatial distribution of long-term trends (Theil–Sen slope in m²·h. year−1) of the annual maxima of the Storm Power Index (SPI) (upper panel) and their significant trends according to the Mann–Kendall test at different confidence levels (lower panel).
Figure 7.
Spatial distribution of long-term trends (Theil–Sen slope in m²·h. year−1) of the annual maxima of the Storm Power Index (SPI) (upper panel) and their significant trends according to the Mann–Kendall test at different confidence levels (lower panel).

Figure 8.
Time series plots of annual average and maximum TSWE between 1979 and 2019 in five different locations of the Mediterranean Sea that have experienced the significant trend during this period. The dashed line shows the linear trend of each time series. The discontinued line illustrates the estimated Theil–Sen slope adjusted to the corresponding time series plot.

Figure 9.
Time series plots of annual average and maximum SPI between 1979 and 2019 in five different locations of the Mediterranean Sea that have experienced the significant trend during this period. The dashed line shows the linear trend of each time series. The discontinued line illustrates the estimated Theil–Sen slope adjusted to the corresponding time series plot.


Table 1.
The calibrated physical processes’ settings of SWAN model used for the development of the wave hindcast database [42].
Table 1.
The calibrated physical processes’ settings of SWAN model used for the development of the wave hindcast database [42].
| Physical Process | Formula References | Parameters |
|---|---|---|
| Linear wind growth | [54] | |
| Exponential wind growth | [55] | |
| Whitecapping | [56,57] | Cds2 = 1.0 & delta = 1 |
| Quadruplets wave–wave interactions | the discrete Interaction approximation (DIA) [58] | ƛ = 0.25 & Cn/4 = 3.0 × 10⁷ |
| Triads wave–wave interactions | [59] | EB = 0.1 |
| Depth-induced breaking | [60] | BJ = 1.0 & γBJ = 0.73 |
| Bottom friction | [61] | CFJON = 0.038 |
Table 2.
Statistical error results obtained during the validation of SWAN coarse grid model [42,43].
| Buoy Name/Positions | Used Period | Nbr of Observation | SI | Bias | R | |||
|---|---|---|---|---|---|---|---|---|
| Hs | Tm02 | Hs | Tm02 | Hs | Tm02 | |||
| Matifou 3.22° E 36.84° N | 1 October 1998 to 31 March 1999 | 1304 | 0.3 | 0.15 | 0.15 | 0.17 | 0.92 | 0.88 |
| Azzefoun 4.39° E 36.917° N | 1 September 2000 to 28 February 2001 | 1196 | 0.31 | 0.21 | 0.09 | −0.03 | 0.92 | 0.78 |
| Kala 8.43° E 36.92° N | 1 January 2002 to 31 December 2002 | 2480 | 0.3 | 0.18 | 0.01 | −0.43 | 0.93 | 0.89 |
| Palos −0.33° E 37.65° N | 1 January 2007 to 31 December 2009 | 25,470 | 0.30 | 0.14 | 0.15 | −0.07 | 0.92 | 0.82 |
| Dragonera 2.1° E 39.55° N | 1 January 2007 to 31 December 2009 | 25,222 | 0.30 | 0.18 | 0.05 | −0.45 | 0.92 | 0.84 |
| Tarragona 1.47° E 40.68° N | 1 January 2008 to 31 December 2008 | 8717 | 0.30 | 0.17 | 0.03 | −0.35 | 0.91 | 0.86 |
| Buger 3.65° E 41.92° N | 1 January 2008 to 31 December 2008 | 6374 | 0.27 | 0.18 | −0.04 | −0.48 | 0.94 | 0.88 |
| Mahon 4.42° E 39.71°N | 1 January 2007 to 31 December 2009 | 23,257 | 0.29 | 0.15 | 0.16 | −0.30 | 0.94 | 0.88 |
| Nice 7.23° E 43.63° N | 1 January 2008 to 31 December 2008 | 8177 | 0.38 | 0.27 | −0.02 | −0.76 | 0.87 | 0.63 |
| Porquerolles 6.20° E 42.97° N | 1 January 2000 to 31 December 2000 | 3129 | 0.25 | 0.17 | −0.03 | −0.4 | 0.94 | 0.88 |
| Marseille 3.66° E 43.33° N | 1 January 2000 to 31 December 2000 | 2095 | 0.28 | 0.29 | −0.06 | −0.92 | 0.96 | 0.84 |
Table 3.
Geographic information and estimated slopes of SPI and TSWE in five selected stations.
| Stations. | Lon. | Lat. | Depth (m) | Distance from the Coast (km) | Estimated Annual Slope of Mean SPI (m²·h·year−1) | Estimated Annual Slope of Mean TSWE (kWh·m−1·year−1) | Estimated Annual Slope of Max SPI (m²·h·year−1) | Estimated Annual Slope of Max TSWE (kWh·m−1·year−1) |
|---|---|---|---|---|---|---|---|---|
| S1 | 2.6° W | 35.8° N | 750 | 51 | 5.9 | 26.1 | 23.2 | 114.8 |
| S2 | 1.4° E | 40° N | 1439 | 88 | 3.3 | 14.2 | 14.1 | 57.2 |
| S3 | 3.6° E | 41.8° N | 1326 | 35 | 6.4 | 26.5 | 37.4 | 149.7 |
| S4 | 5.8° E | 37.6° N | 2812 | 74 | 5.7 | 40.8 | 21.7 | 98.5 |
| S5 | 7.6° E | 43.4° N | 2418 | 44 | 2.1 | 5.9 | 7.5 | 18.5 |
Table 4.
Number of storm wave events per direction in the five selected stations.
| Stations: | S1 | S2 | S3 | S4 | S5 |
|---|---|---|---|---|---|
| N | 10 | 107 | 348 | 167 | 1 |
| NE | 187 | 166 | 40 | 7 | 102 |
| E | 0 | 28 | 65 | 20 | 78 |
| SE | 0 | 7 | 10 | 0 | 10 |
| S | 0 | 11 | 6 | 0 | 28 |
| SW | 0 | 70 | 23 | 0 | 347 |
| W | 323 | 34 | 0 | 148 | 4 |
| NW | 11 | 84 | 7 | 148 | 0 |
Publisher’s Note: MDPI stays neutral with regard to jurisdictional claims in published maps and institutional affiliations. |
© 2021 by the authors. Licensee MDPI, Basel, Switzerland. This article is an open access article distributed under the terms and conditions of the Creative Commons Attribution (CC BY) license (http://creativecommons.org/licenses/by/4.0/).
Share and Cite
MDPI and ACS Style
Amarouche, K.; Akpınar, A. Increasing Trend on Storm Wave Intensity in the Western Mediterranean. Climate 2021, 9, 11. https://0-doi-org.brum.beds.ac.uk/10.3390/cli9010011
AMA Style
Amarouche K, Akpınar A. Increasing Trend on Storm Wave Intensity in the Western Mediterranean. Climate. 2021; 9(1):11. https://0-doi-org.brum.beds.ac.uk/10.3390/cli9010011
Chicago/Turabian StyleAmarouche, Khalid, and Adem Akpınar. 2021. "Increasing Trend on Storm Wave Intensity in the Western Mediterranean" Climate 9, no. 1: 11. https://0-doi-org.brum.beds.ac.uk/10.3390/cli9010011
Note that from the first issue of 2016, this journal uses article numbers instead of page numbers. See further details here.