
Development of a Quality-Controlled and Homogenised Long-Term Daily Maximum and Minimum Air Temperature Network Dataset for Ireland


School of Geography, Archaeology and Irish Studies, Ryan Institute, National University of Ireland Galway, H91 TK33 Galway, Ireland
*
Author to whom correspondence should be addressed.
Climate 2021, 9(11), 158; https://0-doi-org.brum.beds.ac.uk/10.3390/cli9110158
Submission received: 29 September 2021
/
Revised: 21 October 2021
/
Accepted: 25 October 2021
/
Published: 29 October 2021
Abstract
:Accurate long-term daily maximum and minimum air temperature series are needed to assess the frequency, intensity, distribution, and duration of extreme climatic events. However, quality control and homogenisation procedures are required to minimise errors and inhomogeneities in climate series before the commencement of climate data analysis. A semi-automatic quality control procedure consisting of climate consistency, internal consistency, day-to-day step-change, and persistency tests was applied for 12 long-term series registered in Ireland from 1831–1968, Armagh Observatory (Northern Ireland) from 1844–2018, and for 21 short-term series dating to the mid-19th century. There were 976,786 observations quality-controlled, and 27,854 (2.9%) values flagged. Of the flagged records, 98.5% (n = 27,446) were validated, 1.4% (n = 380) corrected and 0.1% (n = 28) deleted. The historical long-term quality-controlled series were merged with the modern series quality-controlled by Met Éireann and homogenised using the software MASHv3.03 in combination with station metadata for 1885–2018. The series presented better homogenisation outcomes when homogenised as part of smaller regional networks rather than as a national network. The homogenisation of daily, monthly, seasonal, and annual series improved for all stations, and the homogenised records showed stronger correlations with the Central England long-term temperature series.
1. Introduction
The Island of Ireland has a great heritage of meteorological observations dating back to the 17th century, although the majority of the records remain as paper data-sources which need to be rescued to fill critical gaps in climate research [1]. A total of 21 short-term and 12 long-term daily maximum air temperature (MAX) and daily minimum air temperature (MIN) series registered in the Island of Ireland and dating back to the 19th century were rescued from multiple data-sources and digitised [2,3]. The historical data will be analysed to assess the frequency, duration, intensity, and distribution of extreme air temperature indices as recommended by the Expert Team on Climate Change Detection and Indices (ETCCDI), as well as long-term trends of heat waves and cold waves in Ireland [4,5,6].
However, systematic, random, gross, or micrometeorological errors can influence the quality of climate datasets [7,8]. Quality control of instrumental datasets involves checking for data keying errors and detecting other errors which can be deleted or corrected to ensure the accuracy and consistency of data. Data validation applies quality control tests to flag, and subsequently inspect, suspicious data [8].
Quality control refers to short-term errors that may affect days or weeks, while inhomogeneities refer to long-term changes in the observing system [9]. Changes of the observer, relocation of a station, changes in thermometers, thermometer screens, station surroundings, or the replacement of manual with automatic weather stations can affect the homogeneity of long-term series [9,10,11]. The assessment of climate data homogeneity is necessary to minimise artificial effects on climate data series and ensure that any variability, change, and trends result from weather and climate variations [12,13]. The World Meteorological Organization recommends applying quality control and homogenisation procedures before climate data analysis [7,14,15]. The assessment of quality and homogenisation of climate data is advised for international data exchange, data repositories, scientific analysis, and the generation of products, such as climate normals or gridded datasets. Statistical homogenisation procedures aim to detect and correct (minimise) artificial bias in the climate series and validate the results [9,15,16]. Detection corresponds to the application of statistical methodologies and the examination of station metadata to identify non-climate inhomogeneities in the data. During the adjustment (correction), statistical approaches are employed to reduce inhomogeneities in order to achieve comparable series with the modern data. Nevertheless, small inhomogeneities may remain in the adjusted series [9]. Thus, validation is essential to review the homogenised data against the original data [16].
This research applied quality-control procedures to 13 long-term and 21 short-term historical daily MAX and MIN series dating back to the 19th century and homogenised 11 long-term daily MAX and MIN series from 1885–2018 on the island of Ireland to develop series suitable for the assessment of extreme air temperature indices [4,5,6].
2. Material and Methods
2.1. Study Area
Air temperatures in Ireland reflect oceanic, topographic, and latitudinal controls [17]. The proximity of the Atlantic Ocean and the westerly atmospheric circulation of the middle latitudes are the major controls on Ireland’s climate [17]. The influence of the North Atlantic Current makes Ireland experience a subdued range of temperatures compared to more continental countries at the same latitude [18]. The contrast in the air temperature gradient between coastal and inland areas is clear in the winter, whereas the latitudinal influence in the air temperature is greater in the summer [17,18]. Hills and mountains allow shelter from strong winds and direct oceanic influences [17]. For instance, Markree Observatory, although sited ~7 km from the Atlantic Ocean, presents low minimum air temperatures and large diurnal air temperature ranges due to the surrounding topography that shields the site from the influence of the Atlantic Ocean and the prevailing south-westerly winds [19].
2.2. Quality Control
The historical network dating to the 19th century includes 14 long-term (Table 1) and 21 short-term (Table 2) daily MAX and MIN series across Ireland (Figure 1). Met Éireann has performed quality control tests on daily MAX and MIN data of the 12 long-term series from 1960 onwards [20]. Therefore, this research applies similar quality control tests to the rescued historical data from 1831–1968 (Table 1, Figure 1). The MAX and MIN data registered at Armagh Observatory (Northern Ireland) in 1844–2018 [21,22] were also subjected to quality control procedures as part of this research.
2.2.1. Quality Control Tests
A semi-automatic quality control procedure was used so that doubtful MAX and MIN data were automatically flagged, and assessment of flagged data was conducted manually. The quality control tests comprise climate consistency, internal consistency, day-to-day step-change, and persistence, written in R software to automatically flag suspect MAX and MIN values. These tests have been explored by [24]. Met Éireann applied these same quality control tests to daily MAX and MIN series registered in Ireland from 1961 to 2010 [20].
The quality control tests were defined as follows (Table 3):
Climate consistency (flags nos. 1–4). These tests check that daily MAX and MIN data are defined by upper and lower thresholds for each month. The upper and lower daily MAX and MIN thresholds were determined by Met Éireann according to Ireland’s climate [20].
Internal consistency (flag no. 5). This test assures that daily MAX and MIN data for a given day are internally consistent. If the MAX is lower than the MIN for a given day, both observations are flagged.
Day-to-day step-change (flags nos. 6–8). These tests check if the daily step-change falls within the expected lower and upper limits of the daily change rate for a given month, defined as 4.5 standard deviations from the mean.
Persistence (flags nos. 9–11). These tests flag three or more consecutive days with the same air temperature values. The test is essential to detect possible errors caused by the non-reading and non-resetting of thermometers.
2.2.2. Manual Assessment of Flagged Data
Each flagged value was manually checked to keep false positive values to a minimum. Although it is time-consuming, the manual verification of flagged values is necessary to preserve extreme air temperature events, which otherwise could be erroneously considered as outliers in a fully automated quality control procedure [25,26]. Data corrections were carefully evaluated to prevent erroneous adjustments of unique observations [27].
The flagged daily MAX and MIN data were manually compared with the dry-bulb air temperature values in the original data-source to evaluate the consistency between thermometers. The daily MAX (MIN) must be equal or higher (lower) than the dry-bulb thermometer on the observation day and the previous day, considering the 24 h period, or the last time when the MAX (MIN) thermometer was reset in case of more than one observation in a 24 h period. The flagged daily MAX and MIN data were manually verified in the image of the original data-source to identify possible errors in the meteorological register, assess observer’s notes, evaluate general weather remarks, and compare the consistency of the MAX and MIN records with the dry-bulb readings. The manual comparison of flagged data with observations registered at one or more surrounding stations was completed when flagged MAX and MIN data disagreed with the dry-bulb readings.
Station metadata were also examined during the assessment of the consistency between the flagged data and dry-bulb readings to avoid inaccurate validation, correction, or deletion of flagged data. Overlapping data-sources were consulted in addition to the handwritten meteorological registers that were used for data rescue. Extreme absolute MAX and MIN data registered at other stations, e.g., [28], and articles on past extreme air temperature events, e.g., [29], were examined since publications such as these include the analysis of absolute MAX and MIN data at various locations. Relevant documentary sources include historical newspapers with references to extreme weather events (Figure 2). Other observed climate elements in the instrumental meteorological logbooks, such as the register of snow or snow depth records and observer’s notes on the frozen wet-bulb, are essential for validating low MIN values. Historical daily synoptic charts and weather summaries in the Daily Weather Report and reanalysis at Wetterzentrale [30] were consulted. The station metadata examined included observer’s notes, weather remarks, and inspections of the stations on observers, instruments, observation practices, and station surroundings [2].
Following the manual examination of the flagged values as described above, flagged values were validated (retained), corrected, or deleted in case of error and unfeasibility to ensure accuracy. Concerning the corrections, if the flagged MAX (MIN) was initially lower (higher) than the dry-bulb on the previous and/or observation days, the flagged reading was replaced with the same or +1 °F (–1 °F) value higher than the dry-bulb reading on the previous and/or observation days, since the historical readings were recorded as degrees Fahrenheit. The correction was converted to degrees Celsius before adding it to the quality-controlled dataset. The correction was based on the manual comparison of MAX and MIN registers at neighbouring stations with a similar observation time and a similar elevation above sea level. In this case, it was confirmed that the dry-bulb readings had no gross instrumental errors and were higher than the wet-bulb records. Flagged values were corrected if possible, rather than deleted from the dataset. The quality-control script was then applied after the correction of flagged data to ensure no errors were inserted in the quality-controlled dataset.
2.3. Homogenisation
2.3.1. Selection of Homogenisation Software
The criteria for selecting the homogenisation software comprised freely available software applicable to the daily MAX and MIN data, automatic use of station metadata, and a relative homogenisation method that would allow future updates with recent observations. While homogenisation of monthly, seasonal, and annual data has been widely researched and performed with satisfactory results, the homogenisation of daily air temperature data constitutes a challenge [15]. Various homogenisation software packages were benchmarked in the European Cooperation in Science and Technology (COST) program [32]. This research highlighted MASH (Multiple Analysis of Series for Homogenisation) as one of the best methods for monthly homogenisation and production of high-quality time series [32]. The “excellent performance” of the software MASH was also reported by [9] (p. 39) and by [33]. The software MASH has also been successfully applied for the homogenisation of daily air temperature data, e.g., [34,35,36]. Thus, the interactive and automatic homogenisation software package MASHv3.03 [16,37] was chosen to homogenise daily, monthly, seasonal, and annual long-term MAX and MIN series.
2.3.2. Homogenisation Procedure
MASHv3.03 is a Windows-executable, relative test homogenisation method that uses an additive model for homogenisation of air temperature series. Generalised least square estimation is employed to estimate the unknown climate change signal in each candidate series with a reference series, which can be changed through the procedure to optimise homogenisation [16].
Station metadata can be used to automatically identify potential dates of break-points, although MASHv3.03 is effective in detecting break-points with and without station metadata [38]. MASHv3.03 has an iterative multiple break-point detection procedure based on hypothesis testing, point estimation, and confidence intervals. Correction factors are automatically estimated according to point estimation and based on confidence intervals to correct the series [39,40]. MASHv3.03 applies spatial interpolation with optimal weighting factors to fill data gaps.
The main steps in MASHv3.03 include the calculation of the monthly series derived from the daily series. During the homogenisation of the monthly series, the mean is homogenised. Daily inhomogeneities are smooth estimated, considering the detected monthly inhomogeneities. The software allows for automatic correction of the daily series, posterior automatic quality control of the homogenised series, and automatic missing daily data gaps completion, which procedures were applied to the 11 series.
A total of 11 long-term quality-controlled MAX and MIN series (Table 4) were tested for homogeneity at daily, monthly, seasonal, and annual resolutions in the period 1885–2018. The historical data quality-controlled in this research (1885–1960) were merged with the quality-controlled data following the same quality control tests by Met Éireann for 1961–2010 [20] and 2011–2018. Despite the availability of quality-controlled data from 1831, the series were tested for homogenisation from 1885 due to observational gaps, lack of a dense station network, incomplete station metadata, and employment of historical instrumentation and observational practices in the earlier records. By the late-19th century, the meteorological stations were required to follow standard instrumental and observational practices and were frequently inspected [2]. The Stevenson screen was introduced in the 1880s for most of the stations.
The Fitzwilliam Square, Dublin (1885–1903), Trinity College Dublin (1904–1970), and Merrion Square, Dublin (1971–2018) series, all located within Dublin city centre, were merged to create a more extended series for Dublin city (1885–2018) (Table 4). The NUI Galway records (1885–2011) were merged with Athenry (2012–2018), and the Birr series (1885–2008) were combined with the automatic records of Gurteen Agricultural College (2009–2018) to complete data coverage to 2018. Due to a high percentage of missing data (MAX: 54.8%; MIN: 55.1%), the Killarney series were not included in the homogenisation.
The homogenisation of the MAX and MIN series was performed separately. The correlations for daily MAX range from r = 0.987 (Merrion Square, Dublin and Glasnevin, Merrion Square, Dublin, and Trinity College Dublin) to r = 0.860 (Malin Head and Roches Point). For the MIN series, the correlations range from r = 0.983 (Fitzwilliam Square, Dublin and Trinity College Dublin) to r = 0.824 (Malin Head and Valentia Observatory).
2.3.3. Comparison of Station Networks: National versus Regional
Two homogenisation methodologies were compared: one national network versus two regional networks. The homogeneity testing of the Dublin/Midlands and Western regional networks was performed to compare the outcomes of the same stations included in the national network, thus with more reference series. The national network has 11 stations (Table 4) and contains 2.9% (n = 15,474) missing data for the MAX series and 2.9% (n = 15,559) missing data for the MIN series. The Dublin/Midlands network incorporates the series Phoenix Park, Dublin city, Botanic Gardens (Glasnevin, Dublin), Armagh Observatory, and Birr/Gurteen. This regional network has 0.8% (n = 2053) missing data for the MAX series and 0.9% (n = 2152) missing data for the MIN series. The Western network includes the series Malin Head, Markree, Belmullet/Blacksod Point, NUI Galway/Athenry, Valentia Observatory, and Roches Point. The Western network contains 4.6% (n = 13,481) missing data for the MAX series and 4.6% (n = 13,407) missing data for the MIN series.
The following criteria were assessed to compare the homogenisation outcomes of the national and regional networks: (1) changes in MAX and MIN trends in comparison to raw data in the seasonal and annual series, e.g., to ensure that general trends are preserved; (2) homogenisation test statistics; (3) conservation of extremes, e.g., summer days and frost days; (4) alignment of inhomogeneities with known station relocations; and (5) Pearson correlations with the Central England MAX and MIN series [41]. Good homogenisation results require that the test statistics (TS) after homogenisation (TSa) should be near or lower than the critical value and lower than the test statistics before homogenisation (TSb) [16]. The analysis of TSb and TSa is performed for each candidate series and the whole network of series. The relative change of the TS is obtained as (TSb–TSa)/TSb [16]. The summary of TS is part of the automatic verification of homogenisation, which is integrated into the software MASHv3.03 to ensure that the homogeneity of the series has increased during the statistical procedures. The relative modification of the series and the statistics for estimated inhomogeneities (which are also outputs produced by MASHv3.03 in the verification statistics to characterise inhomogeneities [16]) were analysed. The number of days with daily minimum air temperature below 0 °C (frost days) and daily maximum air temperature above 25 °C (summer days) were examined in the quality-controlled and homogenised series (with gaps as presented before homogeneity testing to assess the impact of the homogenisation on the daily data). Comparing raw and homogenised series with independent records, such as climate reconstruction from proxies, documentary sources, or other instrumental records, is essential to examine the quality of homogenised data [15]. Therefore, the Pearson correlations between each MAX and MIN homogenised series were compared to the Central England seasonal and annual series.
3. Results
3.1. Quality Control
In total, 976,786 observations were quality-controlled and 27,854 (2.9%) values were flagged. Of the flags, 16,156 were MAX and 11,698 were MIN. The flagged data can be summarised as follows: 51 for climate consistency (Table A1, Table A2, Table A3 and Table A4 in Appendix A), 264 for internal consistency (Table A5), 13 for a day-to-day step-change (Table A6 and Table A7), and 27,526 for climate persistency (Table A8, Table A9 and Table A10). Of the flagged values, 98.5% (n = 27,446) were validated, 1.4% (n = 380) corrected, and 0.1% (n = 28) deleted (Table 5). The highest number of flagged data concerned the persistency tests: flag 10 (n = 15,577), flag 9 (n = 11,133), and flag 11 (n = 816) (Table 6). The greatest number of corrections were made on flagged data that failed the quality control test flag 5 (n = 170) (Table A5), flag 10 (n = 138) (Table A9), and flag 9 (n = 44) (Table A8). More issues were identified in the flagged MAX, resulting in a greater number of corrections and deletions than the MIN. Concerning the temporal distribution of flagged data, more flags were registered in the 1920s (n = 4320), 1930s (n = 4189), and 1910s (n = 3694) (Table 5). The highest number of flags were registered at Belmullet/Blacksod Point (n = 4073), Malin Head (n = 3411), and NUI Galway (n = 3407) (Table 6).
3.2. Homogenisation
All series were inhomogeneous before homogenisation testing (Table 7 and Table 8). The homogenisation procedures applied using MASHv3.03 have reduced the inhomogeneities for all series (Table 7 and Table 8). The verification statistics show that greater inhomogeneities were presented in the MIN series before homogenisation.
For the MAX series in the national network (Table 7), the relative change of TS is highest for the NUI Galway/Athenry series (0.99), which had the highest estimated inhomogeneities (1641.70). This series had the highest TSb (1525.84), which were reduced near to the critical value (21.94) with lower TSa (22.04). The greatest relative changes of TS were registered at Dublin city (0.97) and the Botanic Gardens, Glasnevin (0.95). The lowest relative change of TS (0.68) was reported at Roches Point, which exhibited a low TSb (78.36) before the homogenisation testing. The majority of the series had low TSa with the lowest value at Armagh Observatory (18.42).
For the MIN series in the national network (Table 7), the biggest relative change of TS occurred in the Botanic Gardens and NUI Galway/Athenry (0.99), followed by Markree (0.98). The highest relative inhomogeneities were registered at the Botanic Gardens (3709.10) and NUI Galway/Athenry (1976.95). The homogenisation procedures have improved the homogeneity of these series which register low TSa near the critical value compared to the previous TSb for the Botanic Gardens (36.10) and NUI Galway/Athenry (21.65). The lowest relative change of TS (0.66) was verified at Malin Head, which presented the lowest TSb (74.40). Overall, the series register low TSa, although Phoenix Park, Dublin (58.15) and Blacksod Point/Belmullet (45.58) could not be diminished near the critical value (21.94).
The MAX series in the Dublin/Midlands network (Table 8) exhibited similar TSa in the Phoenix Park, Botanic Gardens, Dublin city, Birr/Gurteen, and Armagh Observatory series when compared to the results obtained in the national network. However, NUI Galway/Athenry (TSa 67.43 vs. 22.04), Roches Point (TSa 43.87 vs. 25.05), and Malin Head (TSa 36.22 vs. 23.51) series registered worse TSa when homogenised with fewer reference series in the Western regional network of stations in comparison to the TSa results obtained in the national network. However, the Valentia Observatory series improved near the level of the critical value (Table 8).
The MIN series in the Dublin/Midlands network (Table 8) showed similar TSa results in the Dublin city, Birr/Gurteen, and Armagh Observatory series, whereas the Phoenix Park, Dublin (TSa 82.27 vs. 58.15) and the Botanic Gardens (TSa 53.17 vs. 36.10) series presented more inhomogeneities when compared to the outcomes derived from the application of more reference series within the national network. Roches Point (TSa 42.69 vs. 29.33) and NUI Galway/Athenry (TSa 36.41 vs. 21.65), when included in the Western regional network, have more inhomogeneities in comparison to the final results derived from the application of more reference series in the national network.
Estimated break-points of ±0.2 °C in the annual MAX and MIN series were cross-referenced with station metadata. A total of 27 break-points were estimated in the MAX series within the national network. NUI Galway/Athenry (n = 9, 33.3%) presented a greater frequency of break-points, although no station metadata were available for 77.8% (n = 7) of the estimated break-points. The NUI Galway/Athenry series contains more estimated break-points in the late 19th and early 20th centuries, and in the 1930s. The documented break-points in MAX in the national network (44.4%) are related to possible changes in thermometers (2.7%), conversion to automatic station (2.7%), screen (3.7%), relocation (22.2%) and observation time (3.7%). A total of 54 break-points were estimated in the MIN series within the national network. The NUI Galway/Athenry series contained the greatest frequency of break-points (n = 20; 36.4%), followed by the Belmullet series (n = 12; 21.8%). The greatest estimated shifts are in the NUI Galway/Athenry series, although no metadata is available for 90% (n = 18) of the estimated break-points. The highest shift in NUI Galway/Athenry occurred in 1931 (–2.27 °C), although this is not documented by metadata. The station metadata explains 33.3% of the estimated break-points in the MIN in the national network, which are associated with likely changes in exposure (1.9%), thermometers (14.8%), observers (5.6%), relocation (9.3%), and observation time (1.9%).
A total of 26 break-points were estimated in the MAX series in the regional networks. Fewer estimated break-points were registered in the Dublin city series compared to the results verified in the national network (n = 5 versus n = 7). The break-point associated with relocation from Valentia Island to Caherciveen in 1892 was apparent in the Western network homogenisation (+0.20 °C). A greater number of break-points were present in the NUI Galway/Athenry series (n = 10, 38.5%). The station metadata explains 38.5% of the estimated break-points, which are likely to be linked with changes of location (19.2%), thermometers or thermometers’ errors (11.5%), observation time (3.8%), or conversion to automatic station (3.8%) for MAX in regional networks.
A total of 60 break-points were estimated in the MIN series in the regional networks. More estimated break-points were detected in the Phoenix Park, Malin Head, and NUI Galway/Athenry series as part of regional networks. A greater number of break-points were found in the NUI Galway/Athenry series (n = 22, 36.7%). For the Blacksod Point/Belmullet series, a greater number of break-points explained by metadata are estimated in the national network (n = 8) compared with the Western network (n = 1) homogenisation procedures. The greatest estimated break-point (–2.20 °C in 1931) is present in the NUI Galway/Athenry series, although no station metadata is available. The metadata describe 31.7% of the estimated break-points, which are related to possible changes of the observer (6.7%), location (11.7%), conversion to automatic station (3.3%), thermometers (8.3%), and screen painting (1.7%) for MIN in regional networks.
4. Discussion
4.1. Quality Control
The manual assessment of flagged data and cross-reference with detailed station metadata and sources on past extreme air temperature events were crucial in analysing flagged data for climate consistency. References to extreme air temperature events were available for 41.2% of the flagged data for climate consistency. Examples include the cold wave of April 1917, e.g., [42], and the heat wave of July 1876, e.g., [43].
A greater number of climate persistency flags were registered at Malin Head, Belmullet/Blacksod Point, and NUI Galway, which can be explained by their proximity to the Atlantic Ocean, which may be responsible for subdued air temperature ranges, and the registry of data as whole degrees Fahrenheit instead of to one decimal place. The greater number of flagged data in the 1910s to the 1930s may be associated with the predominant registry of readings as whole degrees Fahrenheit during this time.
More observations were flagged for internal consistency in the NUI Galway (n = 42) and Botanic Gardens (n = 56) series. The observations for these stations were taken under a voluntary role during the 19th century, possibly explaining the high number of flagged data. Additionally, the handwritten registers used to rescue the historical series at NUI Galway (1885–1952) and the Botanic Gardens (1885–1910) are not kept in the archives of Met Éireann and thus do not comprise red ink corrections made as part of manual quality control [2]. Errors referred to inconsistencies of MAX and MIN data with the dry-bulb on the previous and observation days, reversed values, gross errors, internal consistency, or the interpolation of missing data.
Long-term historical dry-bulb air temperature readings are presently not available in a digital format, and thus all flagged MAX and MIN data were manually cross-referenced with dry-bulb records. The inclusion of dry-bulb records in the R script to check the consistency of MAX and MIN data would avoid higher rates of false-positive flagged data. Thus, future work should involve the digitisation of historical dry-bulb records [1]. Additional historical MAX and MIN series [1] should also be rescued to create a denser station network with which to apply a spatial quality control test [24]. The rescue of the historical MAX and MIN series would allow the quality control of records dating back to the 18th century [1]. Although not digitised at present, historical thermographs register air temperature in a 24 h period, indicating the MIN and MAX records that could be used for cross-reference of flagged data [27] in future work.
4.2. Homogenisation
The raw and homogenised series as part of national and regional networks were correlated to the long-term Central England air temperature series [41] for 1885–2018 (Table A11 and Table A12). The homogenisation improved the positive Pearson correlations for all stations in the MAX series (Table A11). The NUI Galway/Athenry series, which exhibited the lowest correlation among the raw series (r = 0.532), improved when homogenised as part of national (r = 0.874) and regional (r = 0.865) networks. In the MIN series, all stations presented positive correlations that were improved with the homogenisation (Table A12). Greater correlations were assessed in the MAX series. The raw NUI Galway/Athenry series had the lowest correlation among the Irish stations (r = 0.326). The homogenisation of the NUI Galway/Athenry series as part of national (r = 0.831) and regional (r = 0.754) networks improved the quality of the series.
A few relocations of stations were better assessed in the estimated break-points in the series homogenised within a regional network. For example, the Dublin city series have a relocation of the station from Fitzwilliam Square to Trinity College Dublin in 1904, representing a bias of −0.27 °C. A break-point of 0.28°C was identified in 1904 when the series were homogenised as part of the Dublin/Midlands network. In comparison, a small inhomogeneity (−0.02 °C) was identified in 1904 when the Dublin series were homogenised as part of the national network, highlighting that the homogenisation of these series within the regional network is more robust to estimate the relocation signal. This was also the case with an inhomogeneity associated with a station relocation in 1948 at Blacksod Point which was better assessed in the MIN homogenised as part of the Western network.
The number of frost days was reduced in the homogenised data (with gaps) at Phoenix Park, Botanic Gardens, Dublin city, Malin Head, and Valentia Observatory. However, the homogenised data as part of a regional network preserves a greater number of frost days in comparison to the series homogenised as part of the national network. The greatest reduction of the number of frost days is displayed in the homogenised Botanic Gardens series: −1219 days (regional network) and −1342 (national network). Except for the Glasnevin series, the homogenised series, as part of a regional network, preserve a greater number of summer days compared to the series homogenised in a national network.
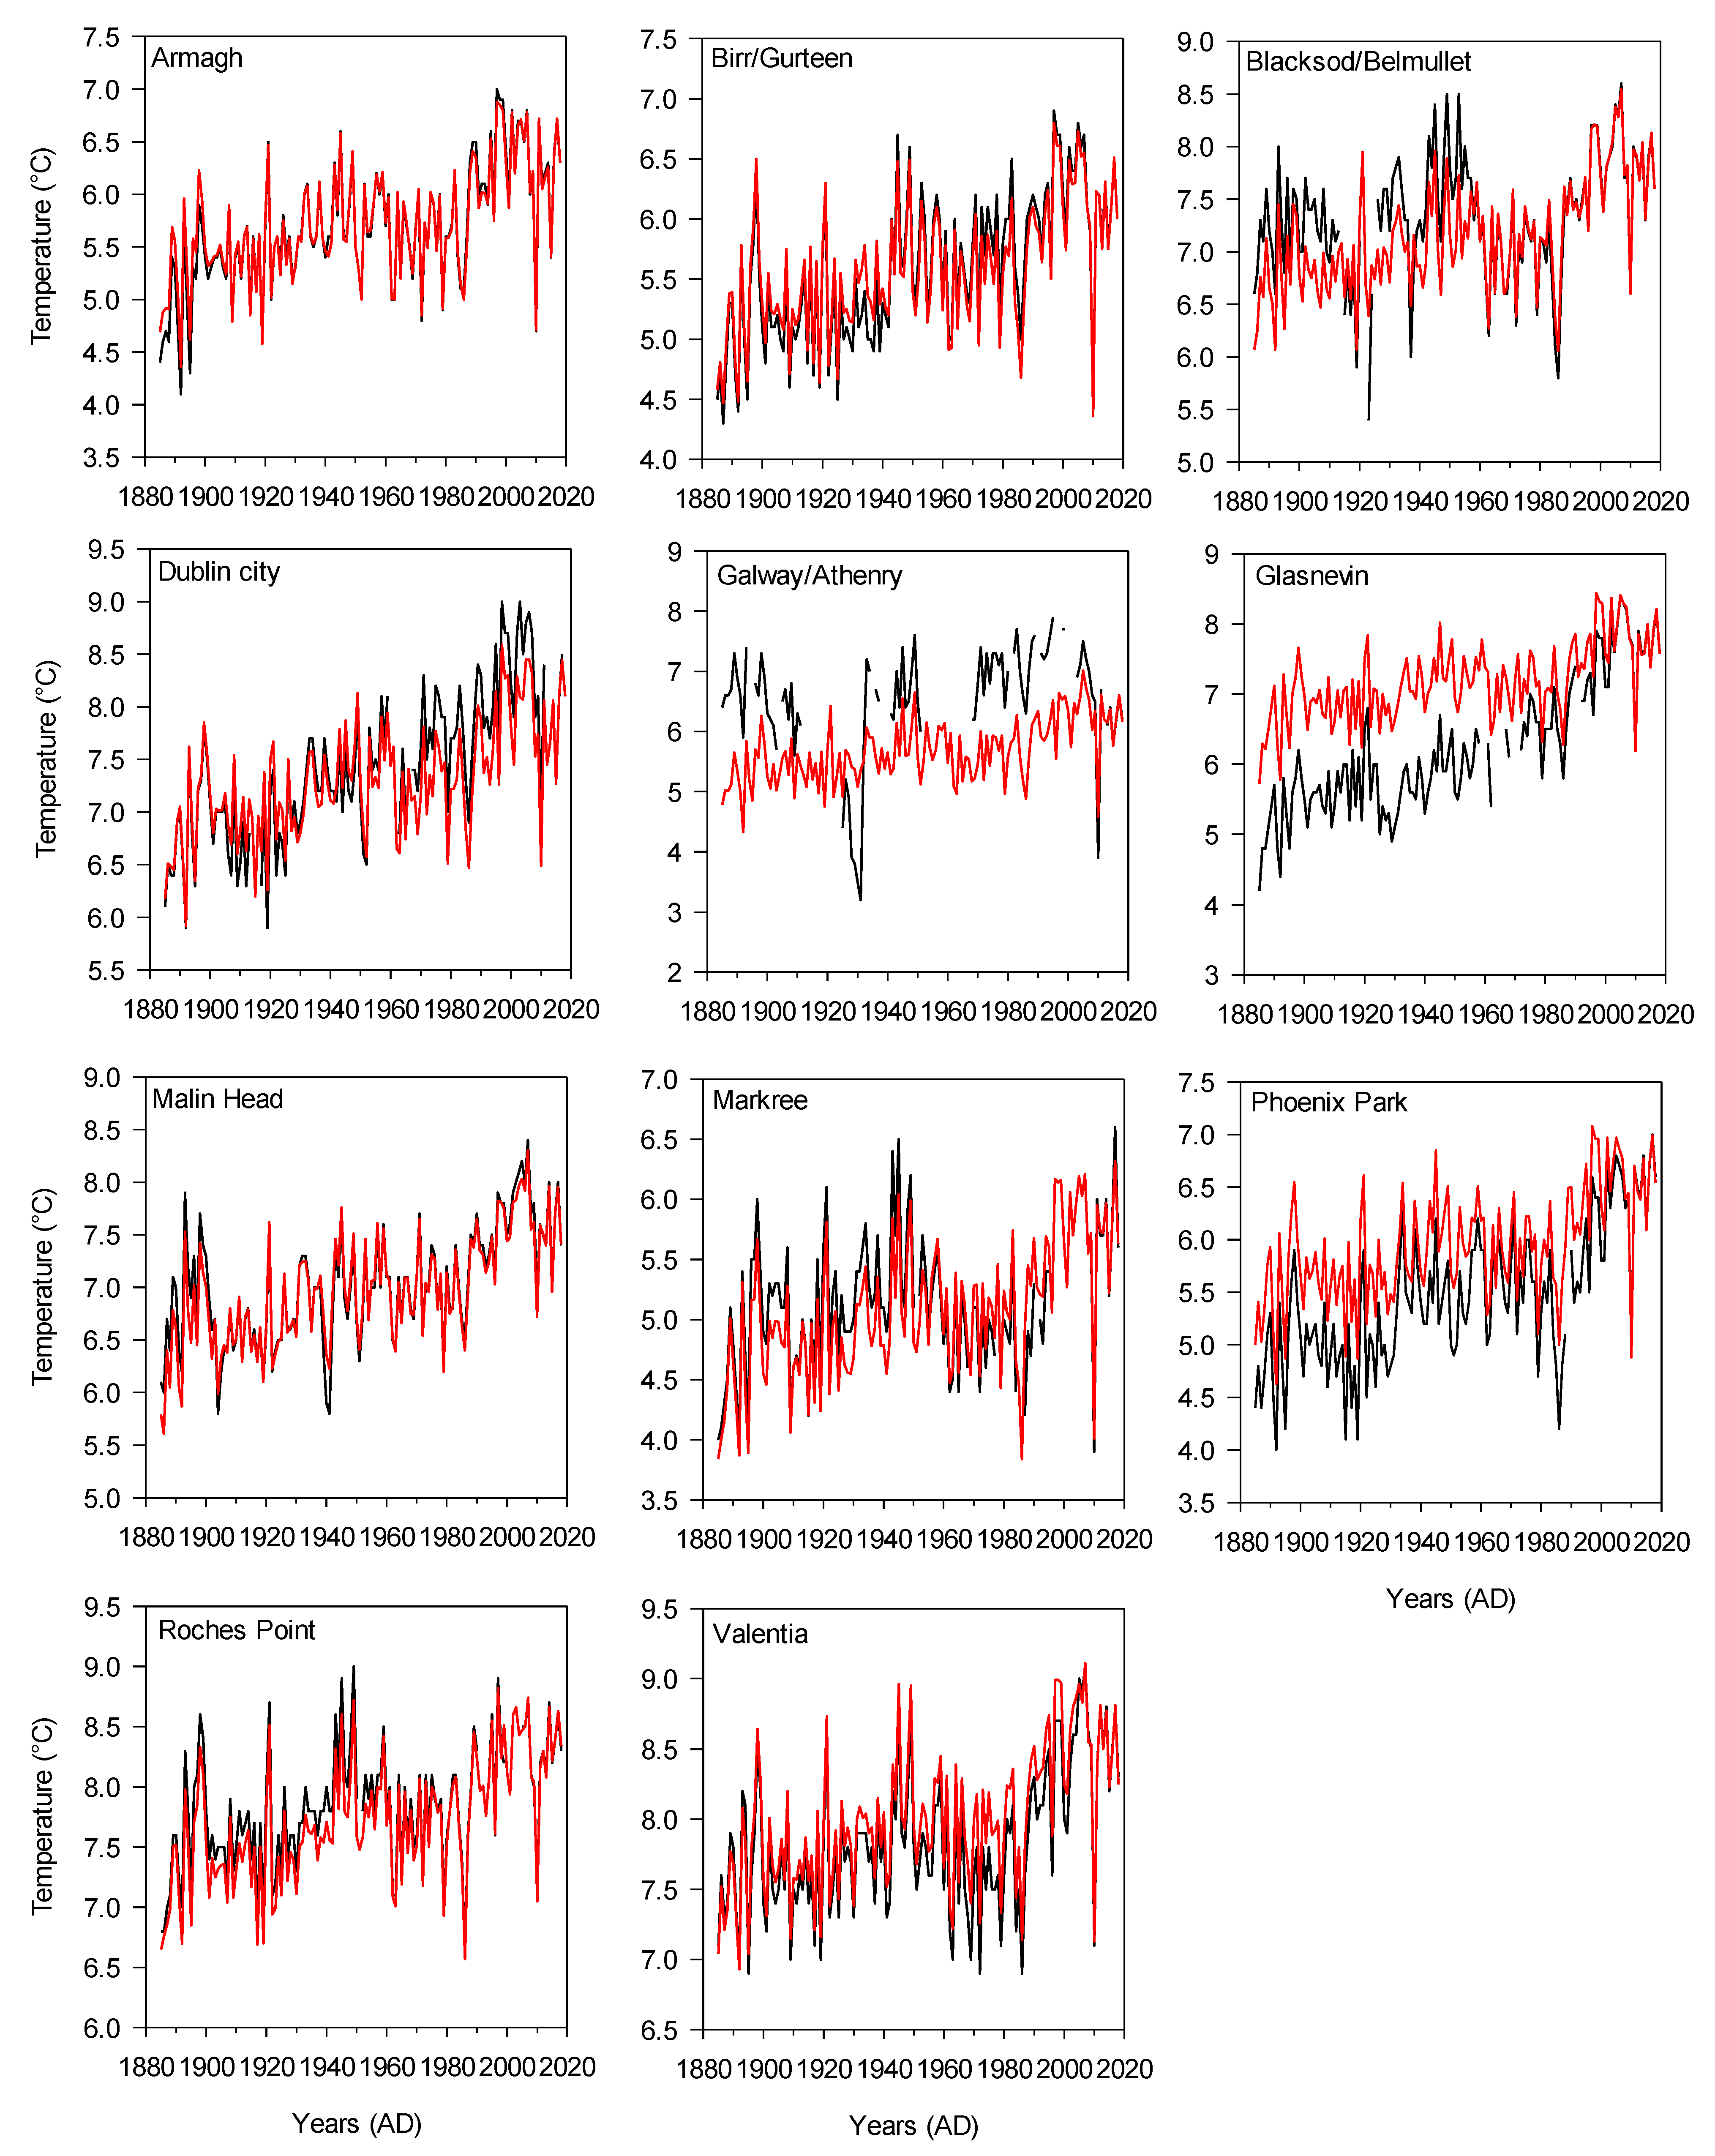
For the reasons highlighted above, the homogenised series in the Dublin/Midlands and Western regional networks were chosen to assess extreme air temperature indices [4,5,6] rather than the series homogenised as part of the national network (Figure 3, Figure 4, Figure 5 and Figure 6).
Despite high correlations among all stations for the MAX and MIN series, because the national network attempts to include both coastal and inland stations, the stations are in different climatic regions and have different controls, such as orography or distance to the ocean. The historical network of stations is scarce, limiting the inclusion of more reference series in the same climatic region as part of regional networks. Although it is a coastal station, Markree presents characteristics of an inland station due to its sheltered relief conditions [19], which can decrease the winter MIN of Malin Head (a coastal station in a northerly location) since both stations are part of the Western network.
The historical MIN series at NUI Galway/Athenry and the Botanic Gardens, Glasnevin should be analysed with caution (Figure 5 and Figure 6). In the case of the NUI Galway/Athenry series, the historical observations were made at NUI Galway under a voluntary role, and the station was not included in the official networks of telegraphic weather reporting or second order stations under the direction of the Meteorological Office and later by Met Éireann [4]. Additionally, scarce inspections and metadata are available. Except for an inspection of the station taken in 1884, no other inspections are available in the Quarterly Journal of the Royal Meteorological Society, the Report of the Meteorological Council to the Royal Society, or the Report of the Meteorological Council, despite the existence of several inspections in other stations in western Ireland [2]. It is therefore possible that inspections were not made, obsolete instrumentation was not replaced, or instrumental and observational errors were not identified and corrected. In the modern series, no metadata are accessible on the maintenance of green areas, such as the planting, growing, or cutting of trees, for cross-reference with estimated break-points. New buildings were added in NUI Galway throughout the time, which could also explain break-points. Several relocations occurred; in 2002, the thermometer screen was re-located due to security reasons [44], indicating that the instruments were perhaps compromised.
Concerning the Botanic Gardens, Glasnevin series (Figure 5 and Figure 6), the station metadata report that the thermometers were periodically stolen, broken, or interfered with or vandalised by intruders, resulting in relocations of the thermometer screen and replacement of instrumentation [2], which may have had an impact on the MIN.
The historical station network is scarce, which constitutes an obstacle to perform homogeneity testing on dense regional networks. Despite the existence of 89 inventoried historical MAX and MIN series registered pre-1900, the majority of the records are only available as paper data-sources, or the daily resolution of the records is at present missing [1]. The oldest MAX and MIN records date back to the period 1787–1788 [1]. Station metadata on observation practices and instrumentation is scarce or currently not available, which does not allow quality control and homogenisation in combination with statistical procedures of early instrumental records. Also, the majority of the historical MAX and MIN records are short-term series registered throughout the time in diverse geographical areas [1], which compromises the merging of series in order to create long-term records.
5. Conclusions
For the first time, a long-term network of daily MAX and MIN series has been quality-controlled and homogenised in the period 1885–2018, which will fill critical gaps in climate research in Ireland. The quality-controlled and homogenised MAX and MIN series as part of regional networks that were produced in this research will be employed to calculate trends and assess the frequency, duration, intensity, and distribution of extreme air temperature indices recommended by the ETCCDI, as well as heat waves and cold waves dating back to the 19th century [4,5,6]. Previous research on past extreme air temperature indices in Ireland has focused on the instrumental period with available digital MAX and MIN data, generally from the 1940s and 1950s onwards [45].
The Island of Ireland has a great heritage of historical meteorological observations that remain in paper data-sources across multiple archives [1]. A total of 86 records kept during the 19th century and three records registered during the 18th century, which contain MAX and MIN data, have been inventoried and it is possible that other records might be found [1]. Future work should aim to rescue historical MAX and MIN records, especially pre-1885, in order to digitise additional long-term series and merge short-term series to extend the temporal and geographical distribution of long-term temperature records, and to create a denser network of stations to apply quality control and homogenisation procedures. Further efforts should be made to rescue additional historical station metadata for cross-reference with homogenisation procedures.
Author Contributions
C.M. completed the quality control and homogenisation procedures and wrote the manuscript. A.P. provided advice on quality control and homogenisation and revised the manuscript. All authors have read and agreed to the published version of the manuscript.
Funding
This research has been funded by the Tony Ryan Research Scholarship, a Ryan Institute Travel Bursary, a Discipline of Geography Postgraduate Travel Bursary, a Postgraduate Research Travel Bursary by NUI Galway, and the Geographical Society of Ireland Postgraduate Travel Award by the Geographical Society of Ireland.
Data Availability Statement
The historical raw daily maximum and minimum air temperature dataset (1831–1968) and station metadata are available open-access at: http://hdl.handle.net/2262/92442 (accessed on 10 October 2021), and are described in Mateus et al. [2]. The methodology for data rescue is detailed in Mateus et al. [2,3].
Acknowledgments
The authors wish to thank Met Éireann, specifically Seámus Walsh, for providing the preliminary R script for quality control of maximum and minimum air temperature data and for supplying quality-controlled data for the period 1961–2018. Many thanks to Conor Murphy, Mary Curley, and Tamás Szemtimrey for their discussions on climate homogenisation.
Conflicts of Interest
The authors declare no conflict of interest. The funders had no role in the design, execution, interpretation, or writing of the study.
Appendix A

Table A1.
Flagged lower daily MIN threshold exceedance (flag 1) and the dry-bulb thermometer registered on previous and observation days.
Table A1.
Flagged lower daily MIN threshold exceedance (flag 1) and the dry-bulb thermometer registered on previous and observation days.
| Station | Year | Month | Day | MIN (°C) | MAX (°C) | Dry-Bulb Previous Day (°C) | Dry-Bulb Obs. Day (°C) | Dry-Bulb Obs. Day (°C) | Decision (°C) |
|---|---|---|---|---|---|---|---|---|---|
| Armagh Observatory | 1947 | March | 3. | −12.4. | 1.9. | −4.8. | −9.4. | −3.2. | Validated (−12.4) |
| Killarney | 1882 | July | 2. | −1.1. | 21.1. | 17.2. | 17.9. | NA. | Deleted |
| 1882 | July | 3 | −1.1 | 21.2 | 17.9 | 18.3 | NA | Deleted | |
| 1882 | July | 22 | −1.1 | 21.1 | 18.3 | 20.1 | NA | Deleted | |
| Markree | 1947 | March | 1 | −16.7 | 4.4 | 0 | −0.8 | 0 | Validated (−16.7) |
| 1947 | March | 2 | −13.3 | 3.9 | 0 | −1.1 | −1.7 | Validated (−13.3) | |
| 1947 | March | 3 | −17.2 | 3.9 | −1.7 | −1.7 | −0.1 | Validated (−17.2) | |
| 1947 | March | 6 | −13.9 | 5.6 | −0.1 | 3.9 | 1.7 | Validated (−13.9) |
Relative to the dry-bulb air temperature observations in the given tables, NA means that no readings are available, or that the values fall outside of the 24 h period used to assess the consistency between the maximum, minimum, and dry-bulb thermometers.
Table A2.
Flagged upper daily MIN threshold exceedance (flag 2) and the dry-bulb thermometer registered on previous and observation days.
Table A2.
Flagged upper daily MIN threshold exceedance (flag 2) and the dry-bulb thermometer registered on previous and observation days.
| Station | Year | Month | Day | MIN (°C) | MAX (°C) | Dry-Bulb Previous Day (°C) | Dry-Bulb Morning Obs. Day (°C) | Dry-Bulb Evening Obs. Day (°C) | Decision (°C) |
|---|---|---|---|---|---|---|---|---|---|
| Botanic Gardens, Glasnevin | 1868 | May | 31 | 16.7 | 21.1 | 15.6 | NA | 16.7 | Corrected (5.6) |
| 1878 | March | 1 | 15.4 | 15.1 | 13.2 | NA | 15 | Corrected (9.9) | |
| 1927 | November | 2 | 15.1 | 20.2 | 16.4 | 16.7 | 16.4 | Validated (15.1) | |
| Botanic Gardens (NLI), Glasnevin | 1927 | November | 2 | 15.1 | 20.2 | 13.7 A | 16.7 | NA | Validated (15.1) |
| 1944 | February | 15 | 14.1 | 11.8 | 0.1 B | 4.4 | NA | Corrected (−2.6) | |
| Fitzwilliam Square, Dublin | 1927 | November | 2 | 15.6 | 17.8 | 16.3 | 16.3 | 15.8 | Validated (15.6) |
| NUI Galway | 1881 | November | 14 | 15.6 | 11.7 | 9.4 | 7.8 | NA | Corrected (11.7) |
| 1889 | July | 4 | 25 | 26.7 | 22.8 | 22.2 | NA | Corrected (10.6) | |
| 1939 | May | 28 | 17.2 | 23.3 | 14.4 | 17.8 | NA | Corrected (11.7) | |
| 1939 | May | 29 | 16.7 | 25.6 | 17.8 | 16.7 | NA | Corrected (11.1) | |
| Portarlington | 1846 | October | 3 | 18.3 | 13.9 | 11.9 | 10.1 | NA | Corrected (7.2) |
| Valentia Observatory | 1890 | May | 25 | 16.7 | 18.3 | 17.2 C | 17.8 | NA | Validated (16.7) |
A Botanic Gardens (NLI), Glasnevin: dry-bulb on the previous day at 09:00 (16.4 °C). B Botanic Gardens (NLI), Glasnevin: dry-bulb on the previous day at 09:00 (−0.6 °C). C Valentia Observatory: dry-bulb on the previous day at 08:00 (17.2 °C), 14:00 (19.4 °C), and 18:00 (17.2 °C).
Table A3.
Flagged lower daily MAX threshold exceedance (flag 3) and the dry-bulb thermometer registered on previous and observation days.
Table A3.
Flagged lower daily MAX threshold exceedance (flag 3) and the dry-bulb thermometer registered on previous and observation days.
| Station | Year | Month | Day | MIN (°C) | MAX (°C) | Dry-Bulb Previous Day (°C) | Dry-Bulb Morning Obs. Day (°C) | Dry-Bulb Evening Obs. Day (°C) | Decision (°C) |
|---|---|---|---|---|---|---|---|---|---|
| Armagh Observatory | 1859 | October | 24 | −2.2 | 3 | −0.8 | −0.2 | −0.1 | Validated (3) |
| 1859 | October | 25 | −1.8 | 2.3 | −0.1 | −1.9 | 0.2 | Validated (2.3) | |
| 1870 | May | 4 | 3.9 | 1.2 | 6.7 | 8.5 | 7.2 | Corrected (12.8) | |
| 1962 | May | 31 | −1 | 2.9 | 12.6 A | 51.8 | NA | Corrected (13.2) | |
| Blacksod Point | 1917 | April | 1 | −2.8 | −0.6 | −2.2 B | −2.8 | −2.2 | Validated (−0.6) |
| Botanic Gardens, Glasnevin | 1859 | October | 23 | −1.1 | 3.3 | 3.9 | NA | 2.8 | Validated (3.3) |
| 1859 | October | 24 | −2.2 | 2.8 | 2.8 | NA | 1.1 | Validated (2.8) | |
| 1873 | October | 24 | −0.6 | 3.9 | 7.2 | NA | 4.4 | Corrected (7.2) | |
| 1880 | October | 20 | −2.8 | 1.7 | 5.4 | 2.1 | NA | Corrected (1.7) | |
| 1880 | October | 21 | −2.2 | 2.2 | 2.1 | 2.4 | NA | Corrected (2.2) | |
| 1880 | October | 30 | 3.7 | −2.2 | 3.9 | 3.9 | NA | Corrected (3.7) | |
| Botanic Gardens (NLI), Glasnevin | 1949 | October | 22 | 2 | 2.2 | 7.2 C | 2.2 | NA | Corrected (7.8) |
| Commercial Buildings, Dublin | 1856 | April | 24 | 6.1 | −2.8 | 13.3 | 13.3 | NA | Corrected (13.9) |
| Grafton Street, Dublin | 1848 | October | 19 | 0.6 | 3.9 | NA | NA | NA | Corrected (9.4) |
| Malin Head | 1917 | April | 10 | −2.2 | 0.6 | −2.2 D | −1.7 | NA | Validated (0.6) |
| NUI Galway | 1881 | March | 30 | −3.9 | −1.1 | 3.3 | 1.7 | NA | Corrected (3.3) |
| 1930 | December | 31 | −1.1 | −15.6 | 4.4 | 4.4 | NA | Corrected (7.2) | |
| 1938 | August | 21 | NA | 7.8 | 12.8 | 14.4 | NA | Corrected (14.4) | |
| 1951 | March | 27 | 1.1 | −0.6 | 5 | 6.1 | NA | Corrected (6.1) | |
| Phoenix Park, Dublin | 1855 | February | 15 | −14.9 | −11.9 | NA | NA | NA | Validated (−11.9) |
| 1856 | September | 7 | 9.4 | 4.4 | 17.2 E | 13.3 | NA | Corrected (17.2) | |
| 1859 | October | 25 | −3.1 | 1.6 | 0.7 F | −1.9 | NA | Validated (1.6) |
A Dry-bulb on the previous day at 09:00 (12.6 °C) and 21:00 (7.0 °C). B Dry-bulb on the previous day at 07:00 (−2.2 °C), 13:00 (−2.8 °C), 18:00 (−2.2 °C), and 21:00 (−2.2 °C). C Dry-bulb on the previous day at 09:00 and 21:00 (7.2 °C). D Dry-bulb on the previous day at 07:00 (−2.2 °C), 13:00 (−0.6 °C), 18:00 (−2.2 °C) and 21:00 (−1.7 °C). E Dry-bulb on the previous day at 09:30 and 15:30 (17.2 °C). F Dry-bulb on the previous day at 09:30 (0.7 °C) and 15:30 (0.8 °C).
Table A4.
Flagged upper daily MAX threshold exceedance (flag 4) and the dry-bulb thermometer registered on previous and observation days.
Table A4.
Flagged upper daily MAX threshold exceedance (flag 4) and the dry-bulb thermometer registered on previous and observation days.
| Station | Year | Month | Day | MIN (°C) | MAX (°C) | Dry-Bulb Previous Day (°C) | Dry-Bulb Morning Obs. Day (°C) | Dry-Bulb Evening Obs. Day (°C) | Decision (°C) |
|---|---|---|---|---|---|---|---|---|---|
| Blackrock | 1885 | July | 26 | 16.1 | 33.9 | NA | NA | NA | Deleted |
| 1885 | July | 27 | 13.9 | 33.3 | NA | NA | NA | Deleted | |
| Dunmore | 1851 | June | 29 | 17.8 | 33.3 | 18.9 A | 19.4 | NA | Validated (33.3) |
| NUI Galway | 1895 | October | 1 | 12.2 | 24.4 | 14.4 | 15.6 | NA | Validated (24.4) |
| Markree | 1851 | June | 27 | 15.4 | 33.1 | 12.4 | 21.9 | 18 | Validated (33.1) |
| 1851 | June | 28 | 15.4 | 33.3 | 18 | 23.4 | 19.4 | Validated (33.3) | |
| Phoenix Park, Dublin | 1876 | July | 16 | 4.9 | 33.5 | 23.1 B | 26.9 | NA | Validated (33.5) |
| 1959 | October | 3 | 15.3 | 24.2 | 18.8 C | 18.9 | NA | Validated (24.2) | |
| Royal College of Surgeons, Dublin | 1852 | March | 23 | 7.5 | 35 | NA | NA | NA | Corrected (15) |
A Dry-bulb on the previous day at 09:00 (18.9 °C) and 21:00 (18.9 °C). B Dry-bulb on the previous day at 09:30 (23.1 °C) and 15:30 (25.1 °C). C Dry-bulb on the previous day at 09:00 (18.8 °C) and 21:00 (16.7 °C).
Table A5.
Total of flagged daily MAX and MIN data, which failed the quality control test flag 5 per station.
Table A5.
Total of flagged daily MAX and MIN data, which failed the quality control test flag 5 per station.
| Station | Total Flagged | Total Validated | Total Corrected | Total Deleted |
|---|---|---|---|---|
| Armagh Observatory | 2 | 1 | 1 | 0 |
| Belmullet/Blacksod | 46 | 0 | 37 | 0 |
| Birr | 16 | 6 | 10 | 0 |
| Blackrock | 2 | 1 | 1 | 0 |
| Botanic Gardens, Dublin | 56 | 13 | 35 | 8 |
| Commercial Buildings, Dublin | 4 | 1 | 3 | 0 |
| Grafton Street, Dublin | 4 | 1 | 3 | 0 |
| Killarney | 6 | 3 | 3 | 0 |
| Malin Head | 8 | 4 | 4 | 0 |
| Markree Observatory | 18 | 4 | 14 | 0 |
| NUI Galway | 42 | 13 | 29 | 0 |
| Phoenix Park, Dublin | 24 | 11 | 10 | 3 |
| Portarlington | 6 | 2 | 4 | 0 |
| Royal College of Surgeons, Dublin | 2 | 0 | 2 | 0 |
| Roches Point | 10 | 5 | 5 | 0 |
| Trinity College Dublin | 4 | 2 | 2 | 0 |
| Valentia Observatory | 14 | 7 | 7 | 0 |
Table A6.
Flagged step-change in daily MIN higher than 4.5 standard deviations from the mean (flag 6) and the dry-bulb thermometer registered on previous and observation days.
Table A6.
Flagged step-change in daily MIN higher than 4.5 standard deviations from the mean (flag 6) and the dry-bulb thermometer registered on previous and observation days.
| Step Change | Station | Year | Month | Day | MIN (°C) | MAX (°C) | Dry-Bulb Previous Day (°C) | Dry-Bulb Morning Obs. Day (°C) | Dry-Bulb Evening Obs. Day (°C) | Decision (°C) |
|---|---|---|---|---|---|---|---|---|---|---|
| Previous day | Armagh Observatory | 2010 | December | 26 | −10.9 | 7 | −10.9 | 3.1 | NA | |
| Flagged | 27 | 3 | 8.8 | 3.1 | 6.8 | NA | Validated (3) | |||
| Previous day | Birr | 1909 | December | 22 | −10.7 | 5.1 # | −10.4 A | 4.9 | NA | |
| Flagged | 23 | 4.3 | 7.5 | 4.9 B | 7.4 | NA | Validated (4.3) | |||
| Previous day | Botanic Gardens, Glasnevin | 1882 | December | 15 | −12.4 | 5.6 | −10.9 | 3.1 | 5.7 | |
| Flagged | 16 | 4.3 | 7.9 | 5.7 | 7.2 | 6.7 | Validated (4.3) | |||
| Previous day | Fitzwilliam Square, Dublin | 1882 | December | 15 | −10.4 | 5.4 | −10.4 | NA | 5.1 | |
| Flagged | 16 | 4.4 | 7.7 | 5.1 | NA | 4.8 | Validated (4.4) | |||
| Previous day | Phoenix Park, Dublin | 1882 | December | 15 | −14 | 5.7 | −12.7 | 3.6 | 5.4 | |
| Flagged | 16 | 4.9 | 8 | 5.4 | 8 | 6.6 | Validated (4.9) |
A Dry-bulb on the previous day at 08:00 (−10.4 °C) and 18:00 (2.1 °C). B Dry-bulb on the previous day at 08:00 (4.9 °C) and 18:00 (7.7 °C). # Not thrown back, as read.
Table A7.
Flagged step-change in daily MAX higher than 4.5 standard deviation of the mean (flag 7) and the dry-bulb thermometer registered on previous and observation days.
Table A7.
Flagged step-change in daily MAX higher than 4.5 standard deviation of the mean (flag 7) and the dry-bulb thermometer registered on previous and observation days.
| Step Change | Station | Year | Month | Day | MIN (°C) | MAX (°C) | Dry-Bulb Previous Day (°C) | Dry-Bulb Morning Obs. Day (°C) | Dry-Bulb Evening Obs. Day (°C) | Decision (°C) |
|---|---|---|---|---|---|---|---|---|---|---|
| Previous day | Armagh Observatory | 1847 | December | 8 | 4.1 | 11.6 | 1.6 | 4.4 | 11.1 | |
| Flagged | 9 | −0.2 | 18.2 | 11.1 | 2.6 | 2.6 | Corrected (11.1) | |||
| Previous day | 1848 | December | 5 | 1.8 | 5.2 | 5.4 | 4.7 | 2.7 | ||
| Flagged | 6 | 1.3 | 17.4 | 2.7 | 2.9 | 1.4 | Corrected (5.8) | |||
| Previous day | 1867 | December | 1 | −2.1 | 0.4 | 10.6 | 8.4 | 0.1 | ||
| Flagged | 2 | −3.2 | 11.7 | 0.1 | −1.3 | −2.2 | Corrected (1.1) | |||
| Previous day | Birr | 1886 | December | 20 | −10.1 | −2.8 | −1.8 A | −9.9 | NA | |
| Flagged | 21 | −10.4 | 8.7 | −9.9 B | −2.8 | NA | Validated (8.7) | |||
| Previous day | Killarney | 1882 | December | 14 | −11.4 | −3.9 | −8.6 | −10.6 | −7.5 | |
| Flagged | 15 | −9.4 | 9.2 | −7.5 | 4.6 | 6.1 | Validated (9.2) | |||
| Previous day | NUI Galway | 1926 | December | 14 | 0 | 7.8 | 6.1 | 0.6 | NA | |
| Flagged | 15 | −5 | −2.2 | 0.6 | −1.7 | NA | Corrected (8.9) | |||
| Flagged | 16 | 1.7 | 8.3 | −1.7 | 4.4 | NA | Validated (8.3) | |||
| Previous day | Phoenix Park, Dublin | 1882 | December | 14 | −13.8 | −7.6 | −7.9 | −9.2 | −12.7 | |
| Flagged | 15 | −14 | 5.7 | −12.7 | 3.6 | 5.4 | Validated (5.7) |
A Dry-bulb on the previous day at 08:00 (−1.8 °C) and 18:00 (−6.2 °C). B Dry-bulb on the previous day at 08:00 (−9.9 °C) and 18:00 (−6.7 °C).
Table A8.
Total of MIN data that failed the quality control test flag 9 and total validated, corrected and deleted data.
Table A8.
Total of MIN data that failed the quality control test flag 9 and total validated, corrected and deleted data.
| Station | Total Data | Total Passed | Total Flagged | Total Validated | Total Corrected | Total Deleted |
|---|---|---|---|---|---|---|
| Armagh Observatory | 63,508 | 63,336 | 172 | 161 | 4 | 7 |
| Athy | 504 | 496 | 8 | 8 | 0 | 0 |
| Belfast | 306 | 303 | 3 | 3 | 0 | 0 |
| Belmullet/Blacksod Point | 26,147 | 24,523 | 1624 | 1616 | 8 | 0 |
| Birr | 41,590 | 41,065 | 525 | 523 | 1 | 1 |
| Blackrock | 3086 | 2997 | 89 | 89 | 0 | 0 |
| Botanic Gardens, Glasnevin | 65,273 | 64,524 | 1043 | 1041 | 2 | 0 |
| Buncrana | 456 | 437 | 19 | 19 | 0 | 0 |
| Castletownsend | 456 | 445 | 11 | 11 | 0 | 0 |
| Commercial Buildings, Dublin | 2997 | 2892 | 105 | 105 | 0 | 0 |
| Courtown | 488 | 485 | 3 | 3 | 0 | 0 |
| Donaghadee | 457 | 441 | 16 | 13 | 3 | 0 |
| Dunmore | 367 | 360 | 7 | 7 | 0 | 0 |
| Dunsink | 275 | 275 | 0 | 0 | 0 | 0 |
| Fitzwilliam Square, Dublin | 24,379 | 24,029 | 350 | 350 | 0 | 0 |
| Glendooen | 1528 | 1469 | 59 | 59 | 0 | 0 |
| Grafton Street, Dublin | 2556 | 2475 | 81 | 81 | 0 | 0 |
| Innisgort Island | 270 | 251 | 19 | 19 | 0 | 0 |
| Kilkenny | 542 | 524 | 18 | 18 | 0 | 0 |
| Killarney | 11,011 | 10,897 | 114 | 114 | 0 | 0 |
| Killough | 517 | 510 | 7 | 6 | 1 | 0 |
| Killybegs | 263 | 260 | 3 | 3 | 0 | 0 |
| Kilrush | 241 | 223 | 18 | 18 | 0 | 0 |
| Malin Head | 26,131 | 24,469 | 1662 | 1656 | 6 | 0 |
| Markree | 35,596 | 35,165 | 431 | 428 | 3 | 0 |
| NUI Galway | 29,029 | 27,877 | 1152 | 1141 | 8 | 3 |
| Phoenix Park, Dublin | 49,322 | 48,815 | 507 | 507 | 0 | 0 |
| Portarlington | 4578 | 4530 | 48 | 48 | 0 | 0 |
| Portrush | 639 | 592 | 47 | 46 | 1 | 0 |
| Roches Point | 30,991 | 29,493 | 1498 | 1493 | 5 | 0 |
| Royal College of Surgeons, Dublin | 4349 | 4331 | 18 | 18 | 0 | 0 |
| Scattery (Inis Cathaigh) | 367 | 350 | 17 | 17 | 0 | 0 |
| Valentia Observatory | 36,489 | 35,694 | 795 | 793 | 2 | 0 |
| Trinity College Dublin | 24,896 | 24,232 | 664 | 664 | 0 | 0 |
| Total | 489,604 | 478,765 | 11,133 | 11,078 | 44 | 11 |
Table A9.
Total of MAX data that failed the quality control test flag 10 and total validated, corrected and deleted data.
Table A9.
Total of MAX data that failed the quality control test flag 10 and total validated, corrected and deleted data.
| Station | Total Data | Total Passed | Total Flagged | Total Validated | Total Corrected | Total Deleted |
|---|---|---|---|---|---|---|
| Armagh Observatory | 63,508 | 63,308 | 200 | 200 | 0 | 0 |
| Athy | 484 | 465 | 19 | 19 | 0 | 0 |
| Belfast | 306 | 303 | 3 | 3 | 0 | 0 |
| Belmullet/Blacksod Point | 26,159 | 23,903 | 2256 | 2232 | 24 | 0 |
| Birr | 41,586 | 41,009 | 577 | 577 | 0 | 0 |
| Blackrock | 3086 | 2951 | 135 | 135 | 0 | 0 |
| Botanic Gardens, Glasnevin | 65,275 | 64,041 | 1234 | 1208 | 26 | 0 |
| Buncrana | 173 | 162 | 11 | 11 | 0 | 0 |
| Castletownsend | 457 | 435 | 22 | 22 | 0 | 0 |
| Commercial Buildings, Dublin | 2999 | 2876 | 123 | 123 | 0 | 0 |
| Courtown | 488 | 479 | 9 | 9 | 0 | 0 |
| Donaghadee | 430 | 430 | 0 | 0 | 0 | 0 |
| Dunmore | 445 | 436 | 9 | 9 | 0 | 0 |
| Dunsink | 275 | 272 | 3 | 2 | 1 | 0 |
| Fitzwilliam Square, Dublin | 24,379 | 23,922 | 457 | 457 | 0 | 0 |
| Glendooen | 0 | 0 | 0 | 0 | 0 | 0 |
| Grafton Street, Dublin | 2556 | 2418 | 138 | 138 | 0 | 0 |
| Innisgort Island | 173 | 156 | 17 | 16 | 1 | 0 |
| Kilkenny | 540 | 516 | 24 | 24 | 0 | 0 |
| Killarney | 10,839 | 10,719 | 120 | 120 | 0 | 0 |
| Killough | 517 | 499 | 18 | 18 | 0 | 0 |
| Killybegs | 264 | 258 | 6 | 6 | 0 | 0 |
| Kilrush | 238 | 223 | 15 | 15 | 0 | 0 |
| Malin Head | 26,128 | 24,512 | 1616 | 1615 | 1 | 0 |
| Markree | 35,606 | 34,753 | 853 | 853 | 0 | 0 |
| NUI Galway | 29,034 | 26,968 | 2066 | 1992 | 73 | 1 |
| Phoenix Park, Dublin | 49,377 | 48,567 | 810 | 809 | 1 | 0 |
| Portarlington | 4577 | 4478 | 99 | 99 | 0 | 0 |
| Portrush | 639 | 609 | 30 | 30 | 0 | 0 |
| Royal College of Surgeons, Dublin | 4347 | 4244 | 103 | 103 | 0 | 0 |
| Roches Point | 31,016 | 28,783 | 2233 | 2231 | 2 | 0 |
| Scattery (Inis Cathaigh) | 367 | 358 | 9 | 9 | 0 | 0 |
| Trinity College Dublin | 24,563 | 23,662 | 901 | 898 | 3 | 0 |
| Valentia Observatory | 36,351 | 34,890 | 1461 | 1455 | 6 | 0 |
| Total | 487,182 | 471,605 | 15,577 | 15,438 | 138 | 1 |
Table A10.
Total of MAX and MIN data that failed the quality control test flag 11 and total validated, corrected and deleted data.
Table A10.
Total of MAX and MIN data that failed the quality control test flag 11 and total validated, corrected and deleted data.
| Station | Total Data | Total Passed | Total Flagged | Total Validated | Total Corrected | Total Deleted |
|---|---|---|---|---|---|---|
| Armagh Observatory | 127,016 | 127,010 | 6 | 6 | 0 | 0 |
| Athy | 988 | 988 | 0 | 0 | 0 | 0 |
| Belfast | 612 | 612 | 0 | 0 | 0 | 0 |
| Belmullet/Blacksod Point | 52,306 | 52,160 | 146 | 145 | 1 | 0 |
| Birr | 83,176 | 83,158 | 18 | 18 | 0 | 0 |
| Blackrock | 6172 | 6166 | 6 | 6 | 0 | 0 |
| Botanic Gardens, Glasnevin | 130,548 | 130,512 | 36 | 36 | 0 | 0 |
| Buncrana | 629 | 629 | 0 | 0 | 0 | 0 |
| Castletownsend | 913 | 907 | 6 | 6 | 0 | 0 |
| Commercial Buildings, Dublin | 5996 | 5996 | 0 | 0 | 0 | 0 |
| Courtown | 976 | 976 | 0 | 0 | 0 | 0 |
| Donaghadee | 887 | 887 | 0 | 0 | 0 | 0 |
| Dunmore | 812 | 812 | 0 | 0 | 0 | 0 |
| Dunsink | 550 | 550 | 0 | 0 | 0 | 0 |
| Fitzwilliam Square, Dublin | 48,758 | 48,752 | 6 | 6 | 0 | 0 |
| Glendooen | 1528 | 1528 | 0 | 0 | 0 | 0 |
| Grafton Street, Dublin | 5112 | 5100 | 12 | 12 | 0 | 0 |
| Innisgort Island | 443 | 443 | 0 | 0 | 0 | 0 |
| Kilkenny | 1082 | 1082 | 0 | 0 | 0 | 0 |
| Killarney | 21,850 | 21,838 | 12 | 12 | 0 | 0 |
| Killough | 1034 | 1034 | 0 | 0 | 0 | 0 |
| Killybegs | 527 | 527 | 0 | 0 | 0 | 0 |
| Kilrush | 479 | 479 | 0 | 0 | 0 | 0 |
| Malin Head | 52,259 | 52,135 | 124 | 124 | 0 | 0 |
| Markree | 71,202 | 71,184 | 18 | 18 | 0 | 0 |
| NUI Galway | 58,063 | 57,927 | 136 | 133 | 3 | 0 |
| Phoenix Park, Dublin | 98,699 | 98,681 | 18 | 18 | 0 | 0 |
| Portarlington | 9155 | 9155 | 0 | 0 | 0 | 0 |
| Portrush | 1278 | 1278 | 0 | 0 | 0 | 0 |
| Roches Point | 62,007 | 61,853 | 154 | 154 | 0 | 0 |
| Royal College of Surgeons, Dublin | 8696 | 8696 | 0 | 0 | 0 | 0 |
| Scattery (Inis Cathaigh) | 734 | 734 | 0 | 0 | 0 | 0 |
| Trinity College Dublin | 49,459 | 49,415 | 44 | 44 | 0 | 0 |
| Valentia Observatory | 72,840 | 72,766 | 74 | 73 | 1 | 0 |
| Total | 976,786 | 975,970 | 816 | 811 | 5 | 0 |
Table A11.
Pearson correlations between the Central England series [41] and the raw and homogenised MAX series in 1885–2018. All correlations are significant at the 0.01 level. Series: (1) Phoenix Park Dublin, (2) Botanic Gardens, Glasnevin, (3) Dublin city, (4) Roches Point, (5) Malin Head, (6) Birr/Gurteen, (7) NUI Galway/Athenry, (8) Valentia Observatory, (9) Markree, (10) Armagh Observatory, (11) Blacksod Point/Belmullet.
| 1 | 2 | 3 | 4 | 5 | 6 | 7 | 8 | 9 | 10 | 11 | |
|---|---|---|---|---|---|---|---|---|---|---|---|
| Annual (raw) | 0.933 | 0.907 | 0.821 | 0.809 | 0.881 | 0.861 | 0.532 | 0.807 | 0.792 | 0.90 | 0.851 |
| Annual (national homogenisation) | 0.946 | 0.936 | 0.945 | 0.867 | 0.900 | 0.908 | 0.874 | 0.854 | 0.888 | 0.918 | 0.861 |
| Annual (regional homogenisation) | 0.939 | 0.941 | 0.943 | 0.850 | 0.902 | 0.912 | 0.865 | 0.852 | 0.893 | 0.922 | 0.862 |
| Winter (raw) | 0.711 | 0.700 | 0.717 | 0.660 | 0.665 | 0.671 | 0.531 | 0.662 | 0.631 | 0.678 | 0.605 |
| Winter (national homogenisation) | 0.721 | 0.719 | 0.723 | 0.689 | 0.665 | 0.693 | 0.650 | 0.667 | 0.660 | 0.678 | 0.632 |
| Winter (regional homogenisation) | 0.717 | 0.716 | 0.713 | 0.683 | 0.655 | 0.698 | 0.655 | 0.673 | 0.651 | 0.688 | 0.629 |
| Spring (raw) | 0.936 | 0.932 | 0.854 | 0.829 | 0.898 | 0.871 | 0.769 | 0.800 | 0.850 | 0.901 | 0.835 |
| Spring (national homogenisation) | 0.936 | 0.919 | 0.922 | 0.860 | 0.905 | 0.893 | 0.853 | 0.823 | 0.877 | 0.902 | 0.848 |
| Spring (regional homogenisation) | 0.930 | 0.914 | 0.908 | 0.860 | 0.900 | 0.900 | 0.850 | 0.830 | 0.882 | 0.908 | 0.847 |
| Summer (raw) | 0.925 | 0.904 | 0.840 | 0.808 | 0.852 | 0.879 | 0.647 | 0.792 | 0.844 | 0.898 | 0.798 |
| Summer (national homogenisation) | 0.939 | 0.923 | 0.920 | 0.814 | 0.853 | 0.905 | 0.839 | 0.836 | 0.877 | 0.910 | 0.806 |
| Summer (regional homogenisation) | 0.936 | 0.919 | 0.924 | 0.796 | 0.859 | 0.909 | 0.826 | 0.815 | 0.870 | 0.908 | 0.801 |
| Autumn (raw) | 0.915 | 0.885 | 0.873 | 0.778 | 0.889 | 0.861 | 0.627 | 0.784 | 0.785 | 0.896 | 0.808 |
| Autumn (national homogenisation) | 0.920 | 0.916 | 0.927 | 0.852 | 0.886 | 0.892 | 0.844 | 0.796 | 0.861 | 0.901 | 0.785 |
| Autumn (regional homogenisation) | 0.921 | 0.921 | 0.931 | 0.838 | 0.883 | 0.881 | 0.813 | 0.796 | 0.846 | 0.905 | 0.798 |
Table A12.
Pearson correlations between the Central England series [41] and the raw and homogenised MIN series in 1885–2018. All correlations are significant at the 0.01 level. Series: (1) Phoenix Park Dublin, (2) Botanic Gardens, Glasnevin, (3) Dublin city, (4) Roches Point, (5) Malin Head, (6) Birr/Gurteen, (7) NUI Galway/Athenry, (8) Valentia Observatory, (9) Markree, (10) Armagh Observatory, (11) Blacksod Point/Belmullet.
| 1 | 2 | 3 | 4 | 5 | 6 | 7 | 8 | 9 | 10 | 11 | |
|---|---|---|---|---|---|---|---|---|---|---|---|
| Annual (raw) | 0.822 | 0.785 | 0.803 | 0.807 | 0.741 | 0.803 | 0.326 | 0.773 | 0.695 | 0.865 | 0.593 |
| Annual (national homogenisation) | 0.866 | 0.877 | 0.869 | 0.827 | 0.800 | 0.848 | 0.831 | 0.822 | 0.838 | 0.863 | 0.804 |
| Annual (regional homogenisation) | 0.844 | 0.847 | 0.846 | 0.814 | 0.756 | 0.810 | 0.754 | 0.778 | 0.770 | 0.841 | 0.725 |
| Winter (raw) | 0.636 | 0.630 | 0.625 | 0.564 | 0.573 | 0.616 | 0.339 | 0.561 | 0.582 | 0.628 | 0.480 |
| Winter (national homogenisation) | 0.641 | 0.666 | 0.654 | 0.587 | 0.580 | 0.618 | 0.582 | 0.565 | 0.620 | 0.626 | 0.566 |
| Winter (regional homogenisation) | 0.648 | 0.665 | 0.649 | 0.672 | 0.630 | 0.614 | 0.655 | 0.637 | 0.657 | 0.623 | 0.618 |
| Spring (raw) | 0.846 | 0.806 | 0.799 | 0.788 | 0.739 | 0.825 | 0.559 | 0.757 | 0.787 | 0.876 | 0.666 |
| Spring (national homogenisation) | 0.888 | 0.897 | 0.856 | 0.812 | 0.786 | 0.850 | 0.821 | 0.785 | 0.831 | 0.871 | 0.770 |
| Spring (regional homogenisation) | 0.854 | 0.874 | 0.838 | 0.796 | 0.746 | 0.823 | 0.751 | 0.757 | 0.799 | 0.869 | 0.692 |
| Summer (raw) | 0.820 | 0.709 | 0.803 | 0.792 | 0.724 | 0.764 | 0.511 | 0.715 | 0.751 | 0.845 | 0.635 |
| Summer (national homogenisation) | 0.842 | 0.845 | 0.837 | 0.804 | 0.802 | 0.801 | 0.796 | 0.782 | 0.801 | 0.850 | 0.762 |
| Summer (regional homogenisation) | 0.819 | 0.822 | 0.828 | 0.764 | 0.721 | 0.771 | 0.774 | 0.706 | 0.724 | 0.823 | 0.719 |
| Autumn (raw) | 0.849 | 0.808 | 0.854 | 0.758 | 0.743 | 0.800 | 0.539 | 0.751 | 0.698 | 0.834 | 0.657 |
| Autumn (national homogenisation) | 0.846 | 0.845 | 0.856 | 0.789 | 0.760 | 0.799 | 0.797 | 0.764 | 0.780 | 0.829 | 0.755 |
| Autumn (regional homogenisation) | 0.852 | 0.845 | 0.853 | 0.776 | 0.723 | 0.813 | 0.775 | 0.765 | 0.767 | 0.833 | 0.737 |
References
- Mateus, C. Searching for historical meteorological observations on the Island of Ireland. Weather 2021, 76, 160–165. [Google Scholar] [CrossRef]
- Mateus, C.; Potito, A.; Curley, M. Reconstruction of a long-term historical daily maximum and minimum air temperature network dataset for Ireland (1831–1968). Geosci. Data J. 2020, 7, 102–115. [Google Scholar] [CrossRef]
- Mateus, C.; Potito, A.; Curley, M. Engaging secondary school students in climate data rescue through service-learning partnerships. Weather 2021, 76, 113–118. [Google Scholar] [CrossRef]
- Mateus, C. Development of Long-Term Daily Maximum and Minimum Air Temperature Series and Assessment of Past Extreme Air Temperature Events in Ireland. Ph.D. Thesis, National University of Ireland Galway, Galway, Ireland, 2021. [Google Scholar]
- Mateus, C.; Potito, A. Long-term trends in daily extreme air temperature indices in Ireland in 1885–2018. Weather. Clim. Extrem. 2021. In Preparation. [Google Scholar]
- Mateus, C.; Potito, A. Historical heat waves and cold waves in Ireland. Environ. Hist. 2021. In Preparation. [Google Scholar]
- World Meteorological Organization. Guide to Meteorological Instruments and Methods of Observation; World Meteorological Organization: Geneva, Switzerland, 2017. [Google Scholar]
- World Meteorological Organization. Guide to the Global Observing System; World Meteorological Organization: Geneva, Switzerland, 2017. [Google Scholar]
- Venema, V.; Trewin, B.; Wang, X.; Szentimrey, T.; Lakatos, M.; Aguilar, E.; Auer, I.; Guijarro, J.A.; Menne, M.; Oria, C.; et al. Guidance on the Homogenisation of Climate Station Data. 2018. Available online: https://eartharxiv.org/8qzrf/ (accessed on 7 April 2019).
- Easterling, D.R.; Peterson, T.C. The effect of artificial discontinuities on recent trends in minimum and maximum temperatures. Atmos. Res. 1995, 37, 19–26. [Google Scholar] [CrossRef]
- Trewin, B. Exposure, instrumentation, and observing practice effects on land temperature measurements. Wiley Interdiscip. Rev. Clim. Chang. 2010, 1, 490–506. [Google Scholar] [CrossRef]
- Conrad, V.; Pollack, L.W. Methods in Climatology; Harvard University Press: Cambridge, MA, USA, 1950. [Google Scholar]
- Izsák, B.; Szentimrey, T. To what extent does the detection of climate change in Hungary depend on the choice of statistical methods? GEM-Int. J. Geomath. 2020, 11, 1–24. [Google Scholar]
- World Meteorological Organization. Guide to Climatological Practices; World Meteorological Organization: Geneva, Switzerland, 2011. [Google Scholar]
- World Meteorological Organization. Guide to Climatological Practices; World Meteorological Organization: Geneva, Switzerland, 2018. [Google Scholar]
- Szentimrey, T. Multiple Analysis of Series for Homogenization (MASHv3.03); Hungarian Meteorological Service: Budapest, Hungary, 2017. [Google Scholar]
- Rohan, P.K. The Climate of Ireland; Stationery Office: Dublin, Ireland, 1975. [Google Scholar]
- Sweeney, J. Regional weather and climates of the British Isles—Part 6: Ireland. Weather 2014, 69, 20–27. [Google Scholar] [CrossRef]
- McKeown, M.; Potito, A.P.; Hickey, K.R. The long term temperature record from Markree Observatory, County Sligo, from 1842 to 2011. Ir. Geogr. 2012, 45, 257–282. [Google Scholar] [CrossRef]
- Walsh, S. Long-Term Temperature Averages for Ireland, 1981–2010; Climatological Note no. 16; Met Éireann: Dublin, Ireland, 2017. [Google Scholar]
- Butler, C.J.; García-Suárez, A.M.; Coughlin, A.D.S.; Cardwell, D. Meteorological Data Recorded at Armagh Ob-servatory: Vol. II—Daily, Mean Monthly, Seasonal and Annual, Maximum and Minimum Temperatures, 1844–2004. 2005. Available online: http://www.climate.armagh.ac.uk/calibrated/airtemp/yellow-textD.pdf (accessed on 14 March 2020).
- Armagh Observatory Meteorology Databank. Available online: http://www.climate.armagh.ac.uk/ (accessed on 8 September 2021).
- NASA SRTM 90m and EUDEM 30m Topography Raster Image.
- Hubbard, K.G.; Goddard, S.; Sorensen, W.D.; Wells, N.; Osugi, T.T. Performance of quality assurance procedures for an applied climate information system. J. Atmos. Ocean. Technol. 2005, 22, 105–112. [Google Scholar] [CrossRef] [Green Version]
- Hunkel, K.E.; Easterling, D.R.; Hubbard, K.; Redmond, K.; Andsager, K.; Kruk, M.C. and Spinar, M.L. Quality control of pre-1948 Cooperative Observer Network data. J. Atmos. Ocean. Technol. 2005, 22, 1691–1705. [Google Scholar]
- Durre, I.; Menne, M.J.; Vose, R.S. Strategies for evaluating quality assurance procedures. J. Appl. Meteorol. Clim. 2008, 47, 1785–1791. [Google Scholar] [CrossRef]
- Hunziker, S.; Gubler, S.; Calle, J.; Moreno, I.; Andrade, M.; Velarde, F.; Ticona, L.; Carrasco, G.; Castellón, Y.; Oria, C.; et al. Identifying, attributing, and overcoming common data quality issues of manned station observations. Int. J. Climatol. 2017, 37, 4131–4145. [Google Scholar] [CrossRef]
- Symons, G.J. Symons’s Monthly Meteorological Magazine; Edward Stanford: London, UK, 1874; Volume 9, p. 189. [Google Scholar]
- Harding, C. Note on the weather of January 1881. Q. J. R. Meteorol. Soc. 1885, 11, 292–299. [Google Scholar] [CrossRef]
- Wetterzentrale. Available online: https://www.wetterzentrale.de/en/ (accessed on 8 September 2021).
- Ireland shivers in bitter weather. The Irish Times, 28 December 1962.
- Venema, V.K.C.; Mestre, O.; Aguilar, E.; Auer, I.; Guijarro, J.A.; Domonkos, P.; Vertacnik, G.; Szentimrey, T.; Stepanek, P.; Zahradnicek, P.; et al. Benchmarking homogenization algorithms for monthly data. Clim. Past 2012, 8, 89–115. [Google Scholar] [CrossRef] [Green Version]
- Killick, R.E. Benchmarking the Performance of Homogenisation Algorithms on Daily Temperature Data. Ph.D. Thesis, University of Exeter, Exeter, UK, 2016. [Google Scholar]
- Zhen, L.; Zhong-Wei, Y.; Hong, W. Updated homogenised Chinese temperature series with physical consistency. Atmos. Ocean. Sci. Lett. 2015, 8, 17–22. [Google Scholar]
- Zhen, L.; Cao, L.; Zhu, Y.; Zhong-Wei, Y. Comparison of two homogenized datasets of daily maxi-mum/mean/minimum temperature in China during 1960–2013. J. Meteorol. Res. 2016, 30, 53–66. [Google Scholar]
- Zhen, L.; Zhong-Wei, Y.; Cao, L.; Jones, P.D. Further-adjusted long-term temperature series in China based on MASH. Adv. Atmos. Sci. 2018, 35, 909917. [Google Scholar]
- Szentimrey, T. Mathematical questions of homogenization and summary of MASH. In Proceedings of the Tenth Seminar for Homogenization and Quality Control in Climatological Databases and Fifth Conference on Spatial Interpolation Techniques in Climatology and Meteorology, Budapest, Hungary, 12–14 October 2020; WCDMP-No. 86. pp. 4–17. [Google Scholar]
- Zhen, L.; Zhong-Wei, Y. Application of multiple analysis of series for homogenization to Beijing daily tempera-ture series (1960–2006). Adv. Atmos. Sci. 2010, 27, 777–787. [Google Scholar]
- Szentimrey, T. Multiple Analysis of Series for Homogenization (MASH). In Proceedings of the Second Seminar for Homoge-nization of Surface Climatological Data, Budapest, Hungary, 9–13 November 1998; World Meteorological Organization: Geneva, Switzerland, 1999; pp. 27–46. [Google Scholar]
- Szentimrey, T. Development of MASH homogenization procedure for daily data. In Proceedings of the Fifth Seminar for Homogenization and Quality Control in Climatological Databases., Budapest, Hungary, 29 May–2 June 2006; WCDMP-No. 71, WMO/TD-NO. 1493. pp. 123–130. [Google Scholar]
- Parker, D.E.; Legg, T.P.; Folland, C.K. A new daily central England temperature series, 1772–1991. Int. J. Clim. 1992, 12, 317–342. [Google Scholar] [CrossRef]
- Bonacina, L.C.W. The frost of January and February, 1917. Symons’s Mon. Meteorol. Mag. 1917, 52, 13–15. [Google Scholar]
- Symons, G.J. The temperature in July. Symons’s Mon. Meteorol. Mag. 1876, 11, 94–97. [Google Scholar]
- Gaffney, F. Climate of Galway 1966–2005. Measurement of Temperature, Sunshine and Rainfall; Department of Experimental Physics, National University of Ireland Galway: Galway, Ireland, 2006. [Google Scholar]
- McElwain, L.; Sweeney, J. Key Meteorological Indicators of Climate Change in Ireland; Environment Research Report; Environment Protection Agency: Wexford, Ireland, 2007.
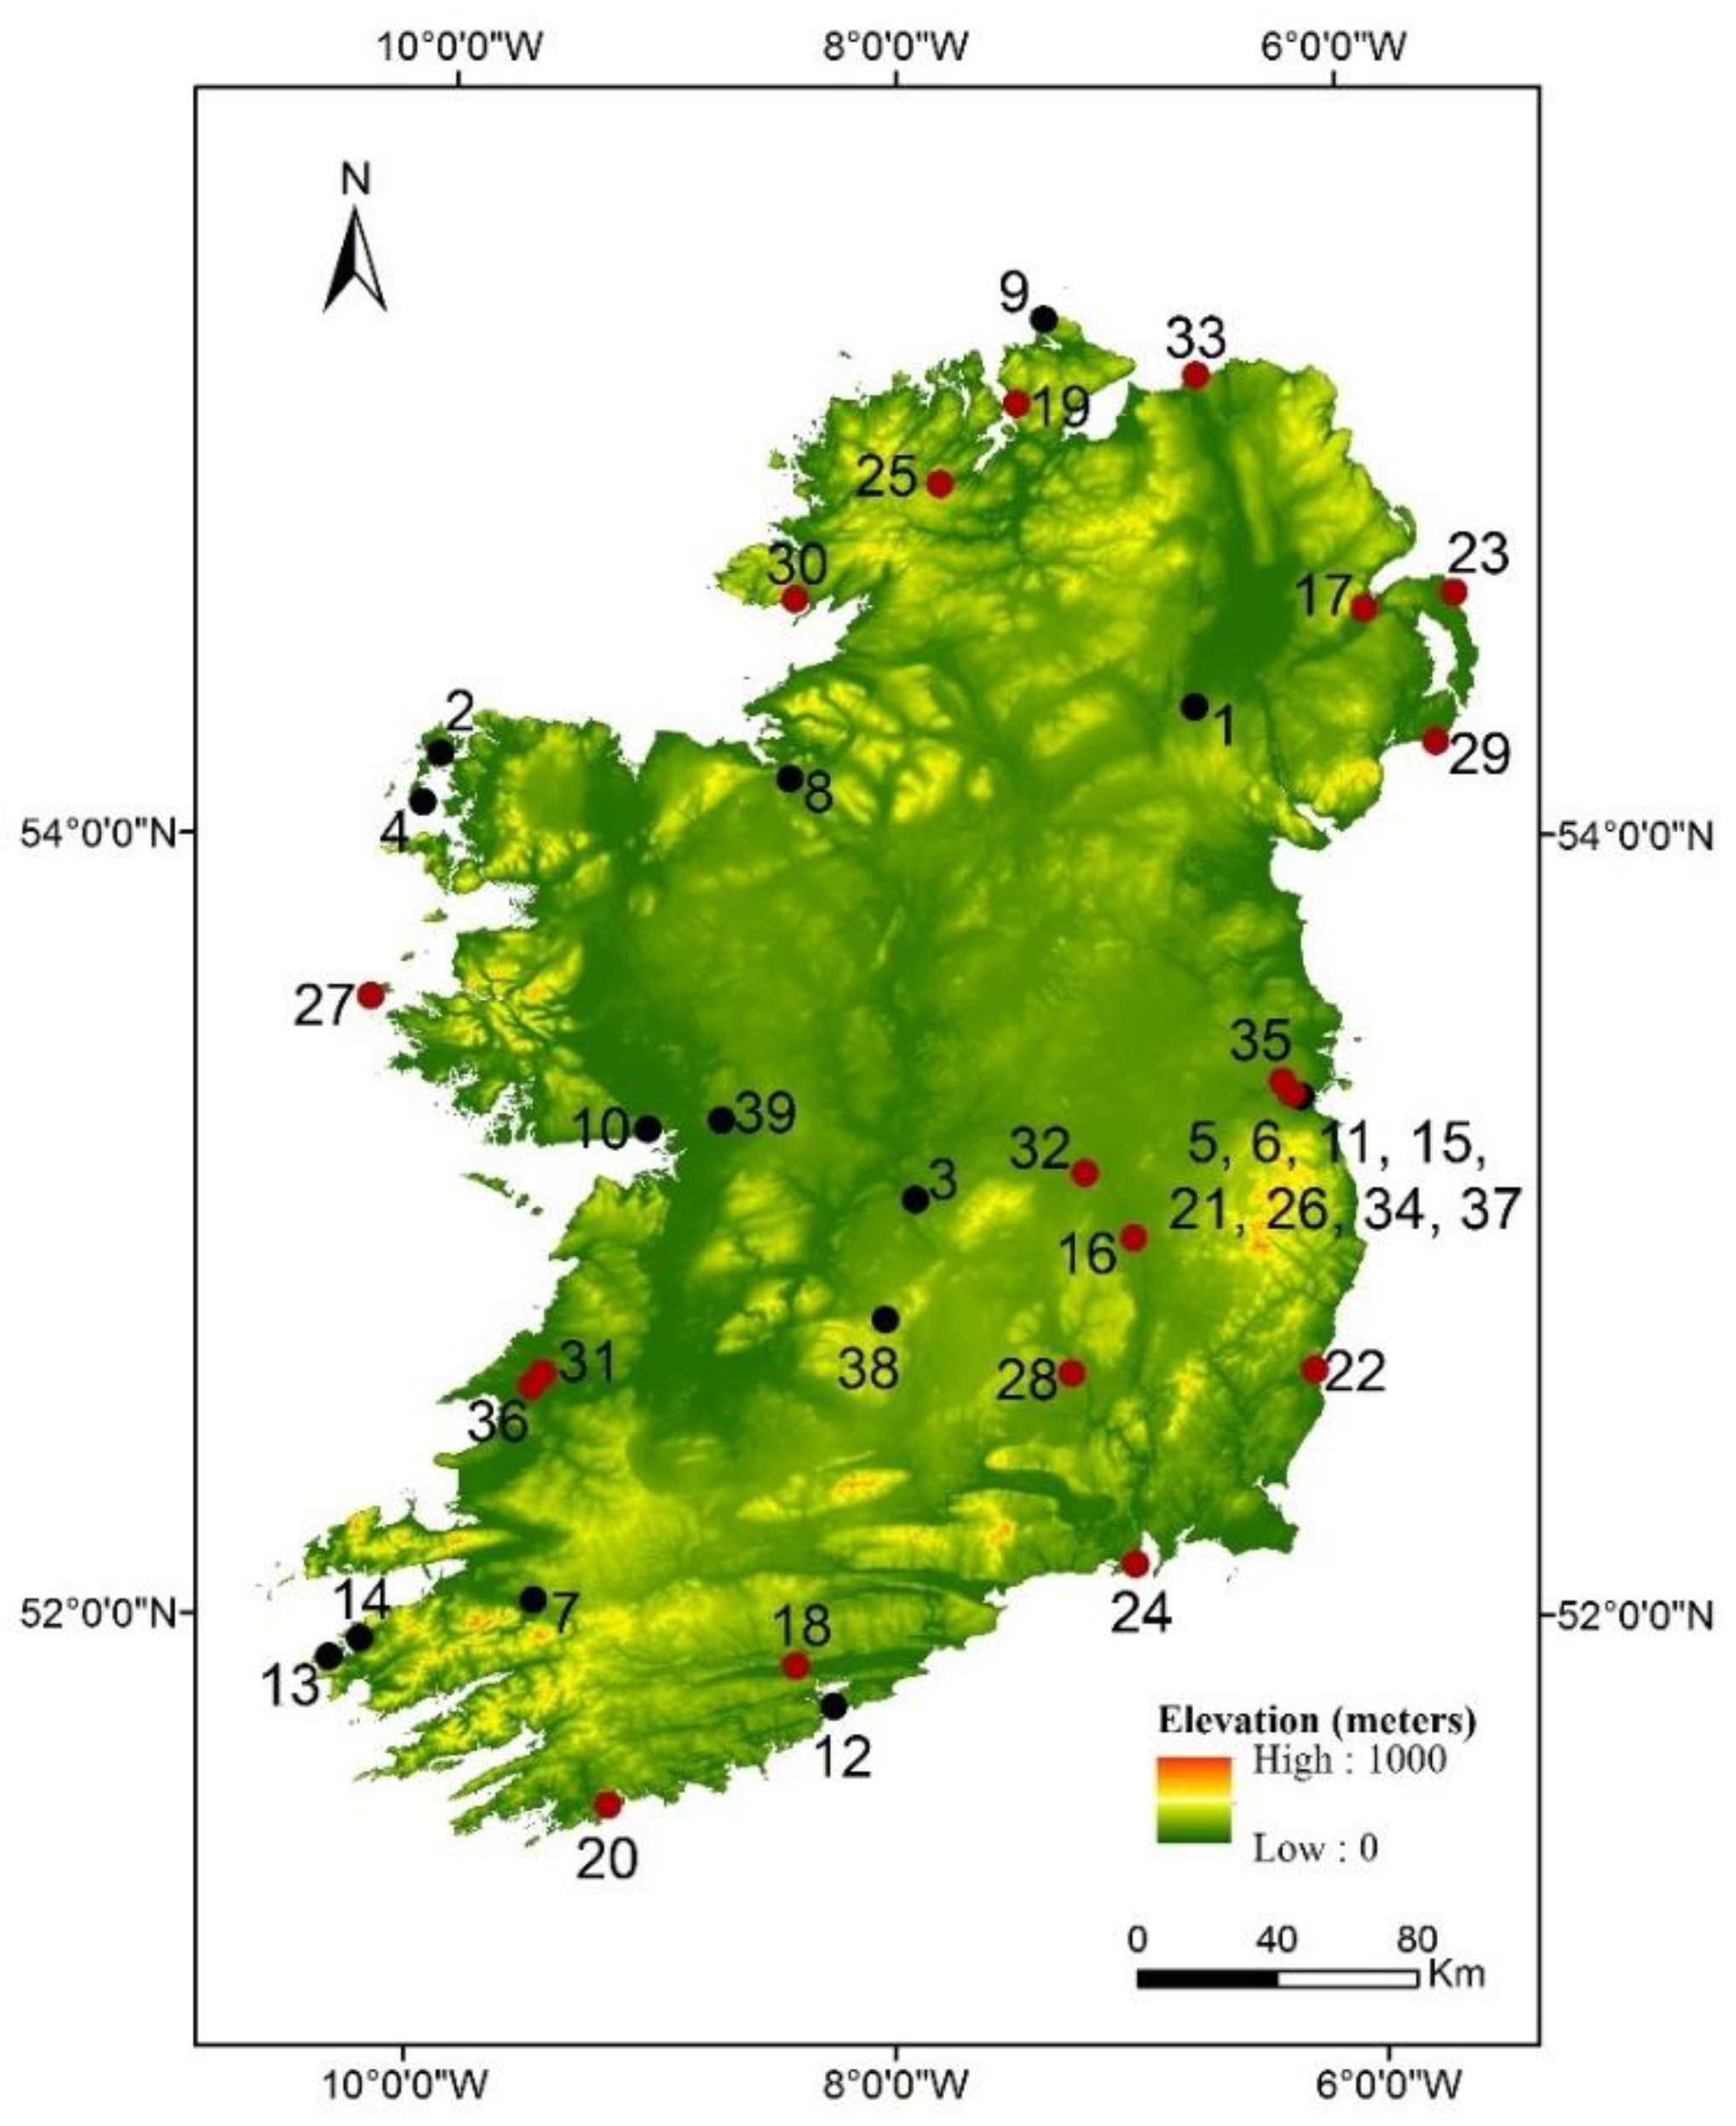
Figure 1.
Location of the daily MAX and MIN long-term (black) and short-term (red) series. Numbers correspond to station numbers in Table 1 and Table 2, with additional stations used in homogenisation: 37—Merrion Square, Dublin; 38—Gurteen; 39—Athenry. Raster source: [23].

Figure 2.
Newspaper consulted during the manual assessment of flagged data [31].
Figure 2.
Newspaper consulted during the manual assessment of flagged data [31].

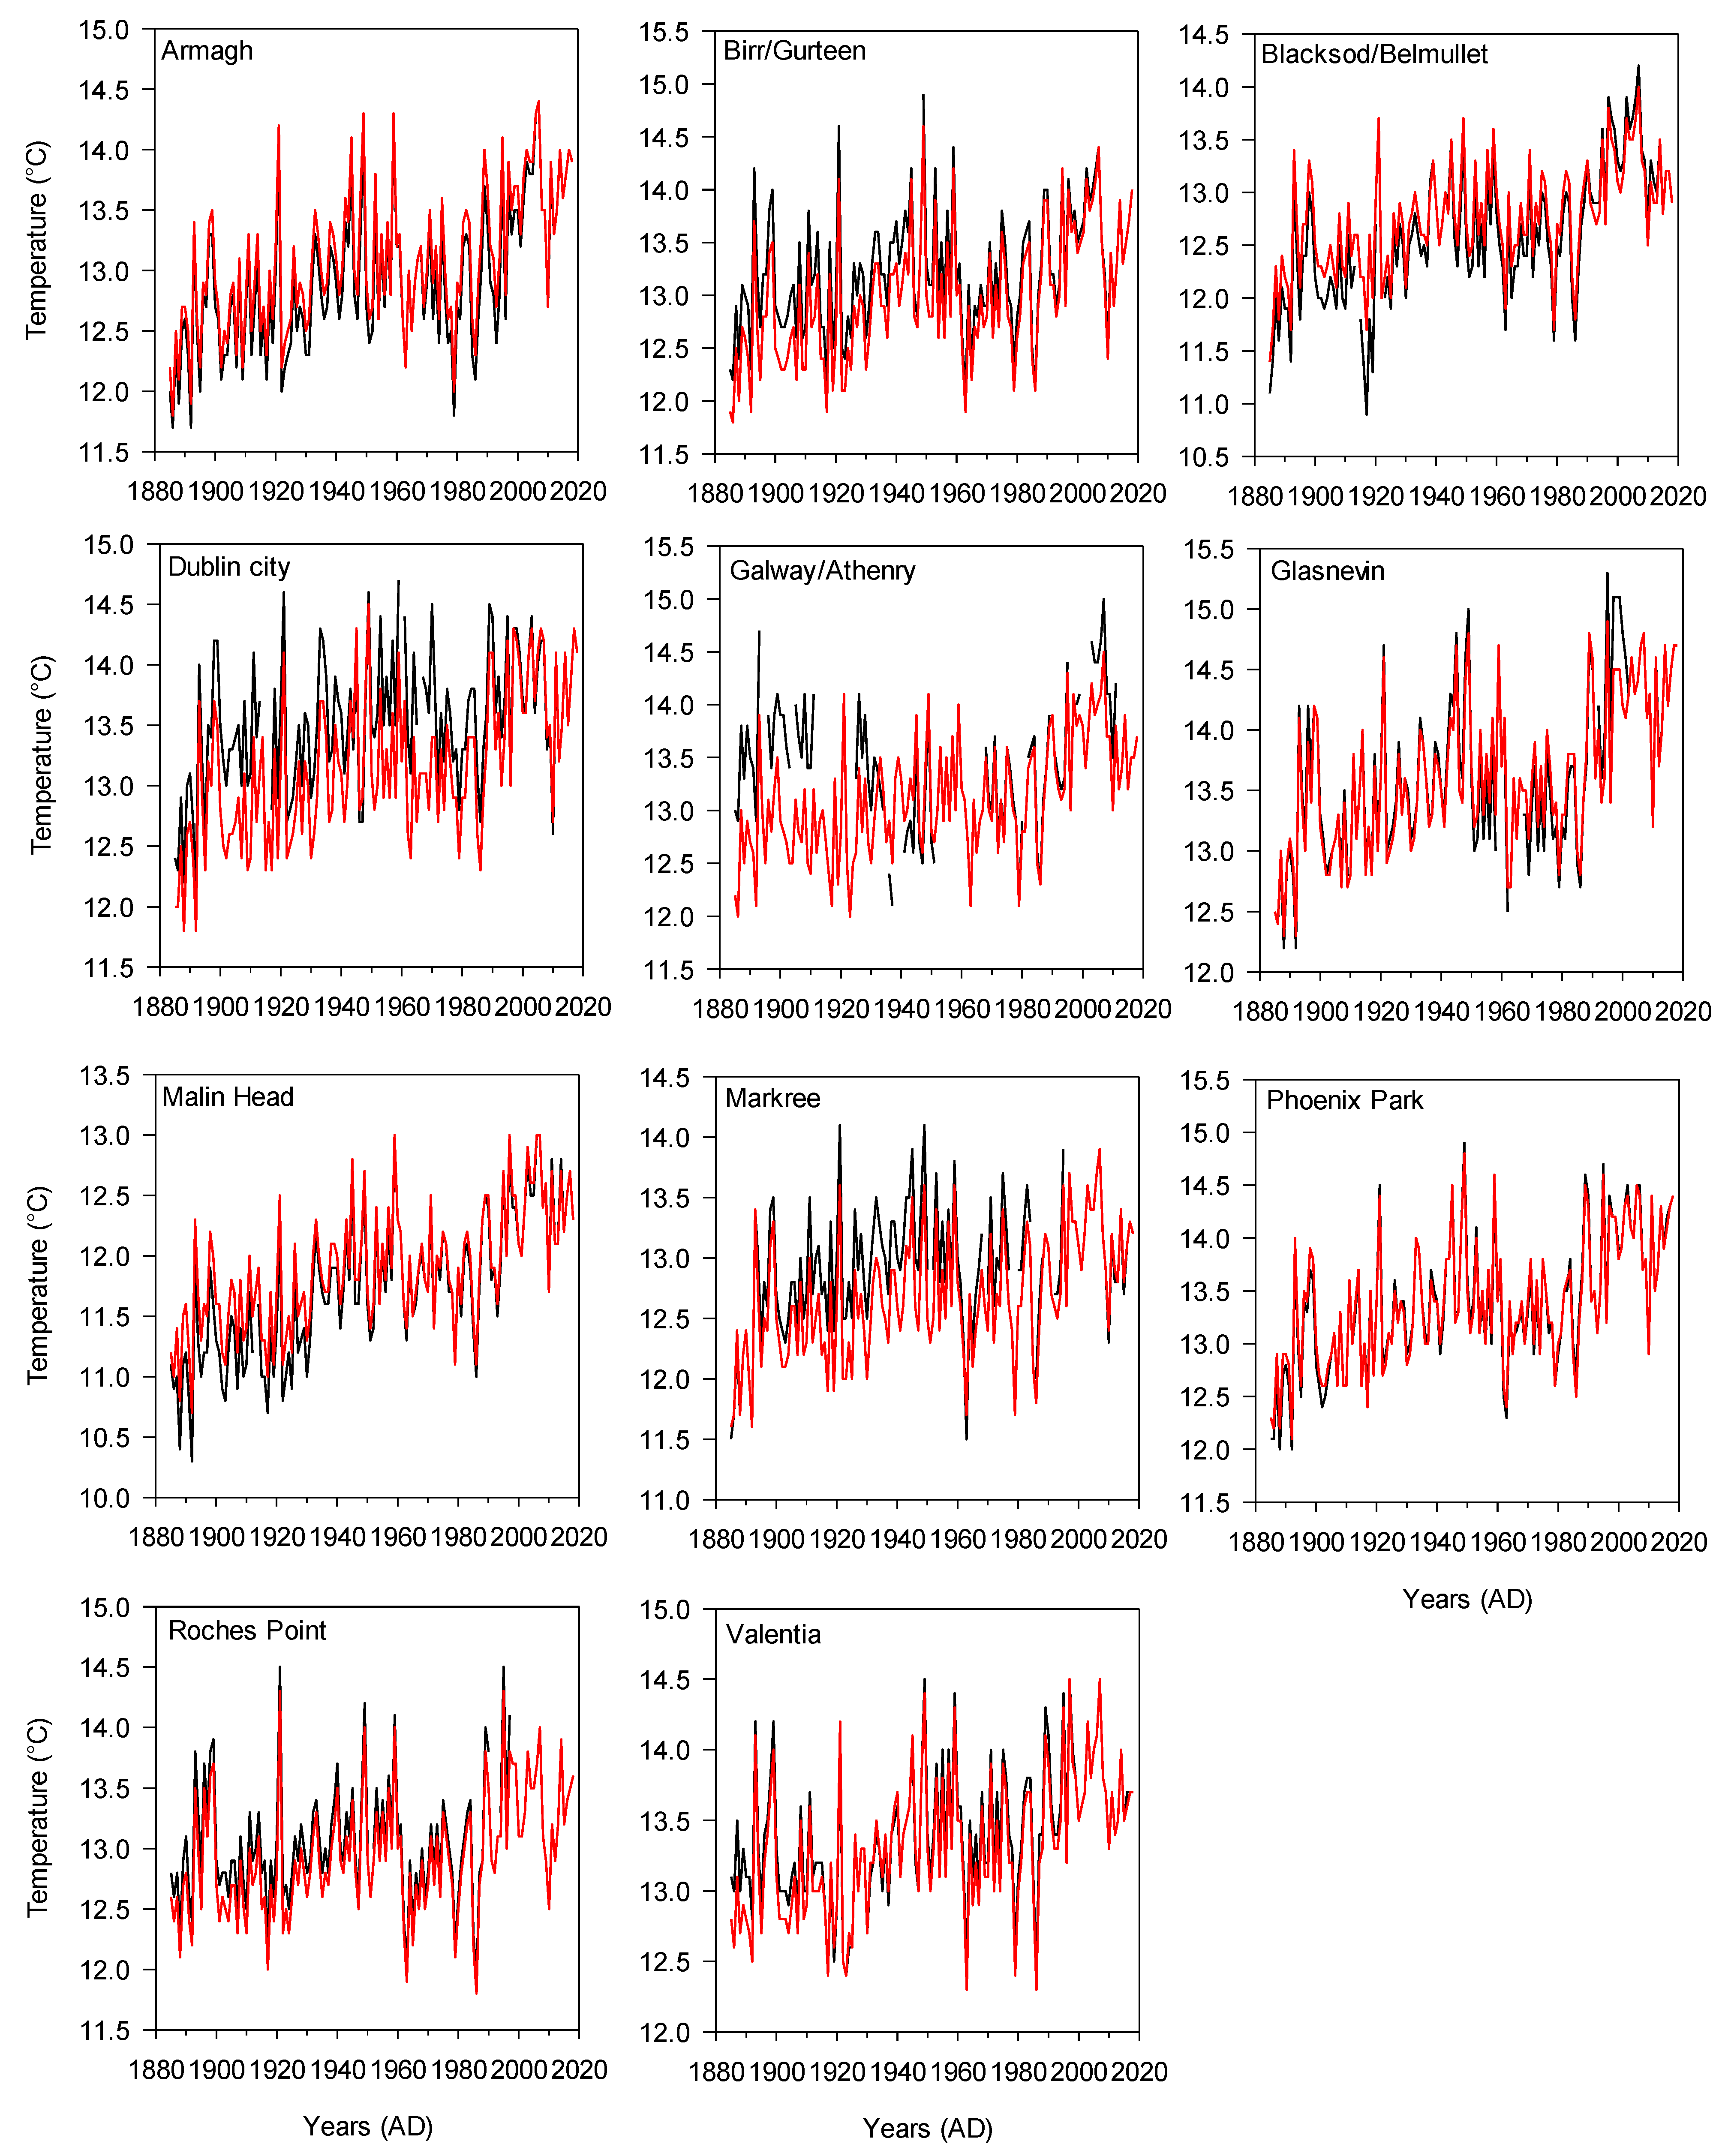
Figure 3.
Quality-controlled (black) and homogenised (red) annual MAX series as part of regional networks in 1885–2018.
Figure 3.
Quality-controlled (black) and homogenised (red) annual MAX series as part of regional networks in 1885–2018.

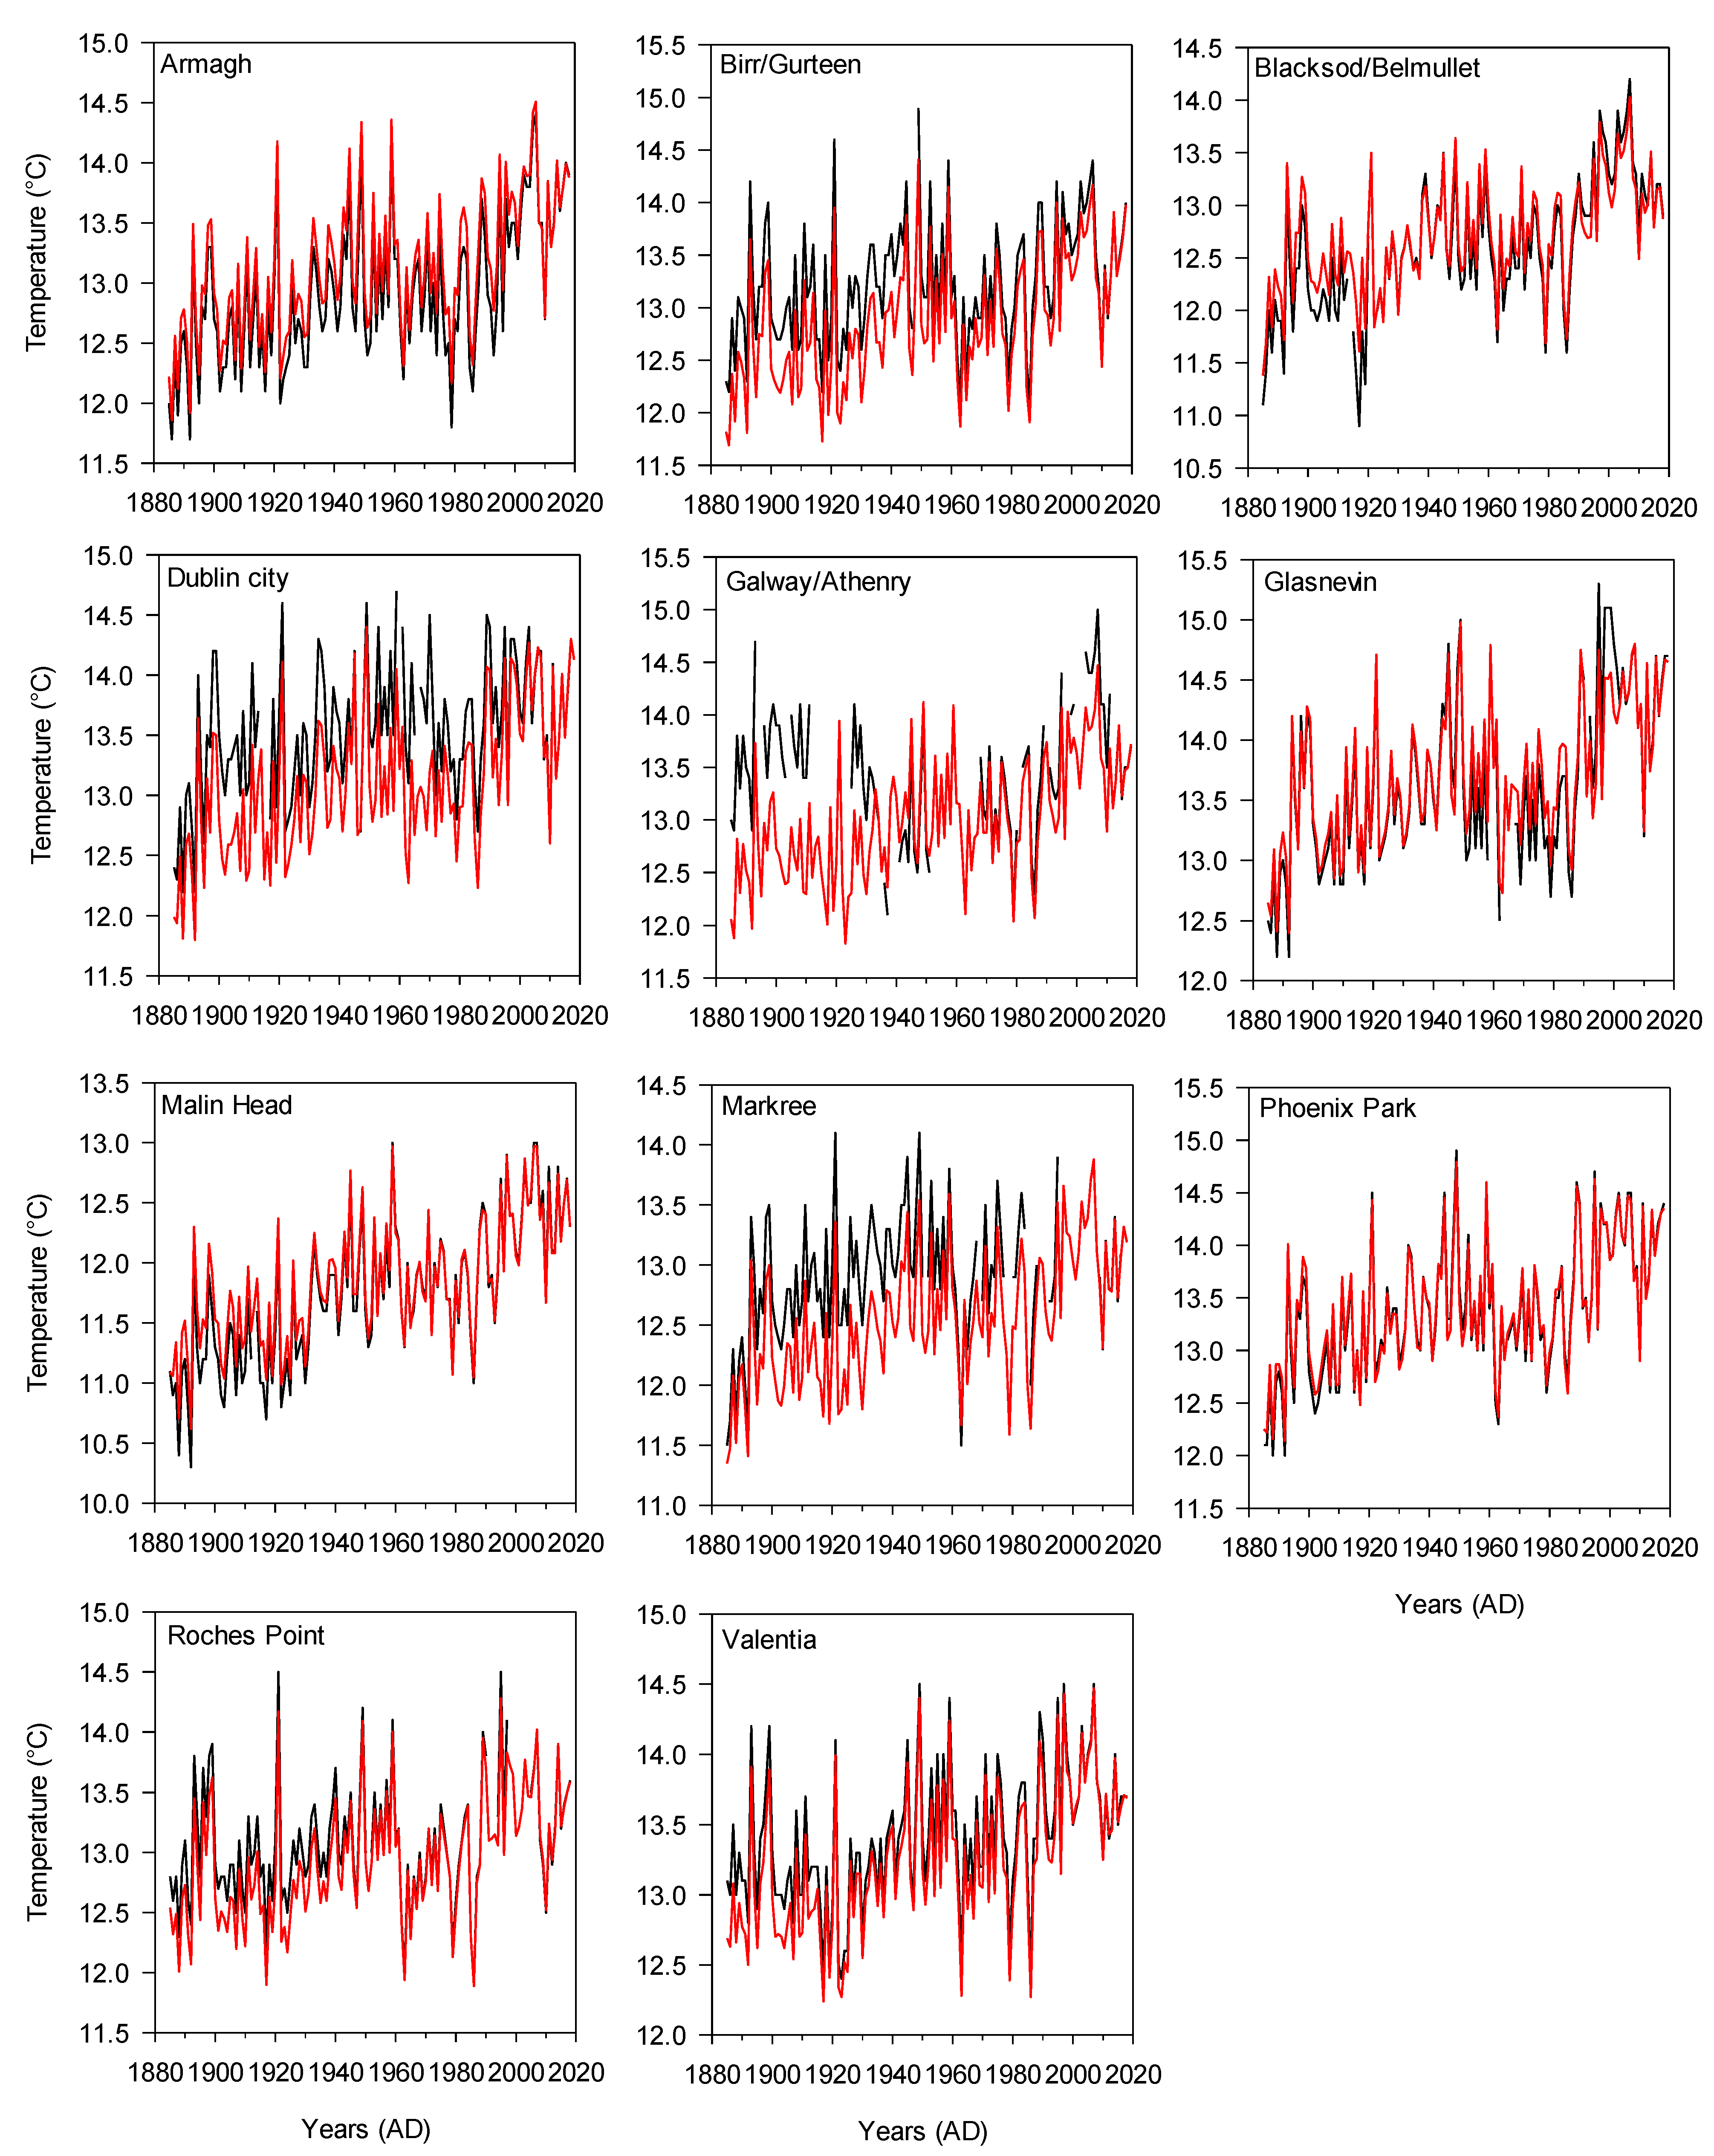
Figure 4.
Quality-controlled (black) and homogenised (red) annual MAX series as part of the national network in 1885–2018.
Figure 4.
Quality-controlled (black) and homogenised (red) annual MAX series as part of the national network in 1885–2018.

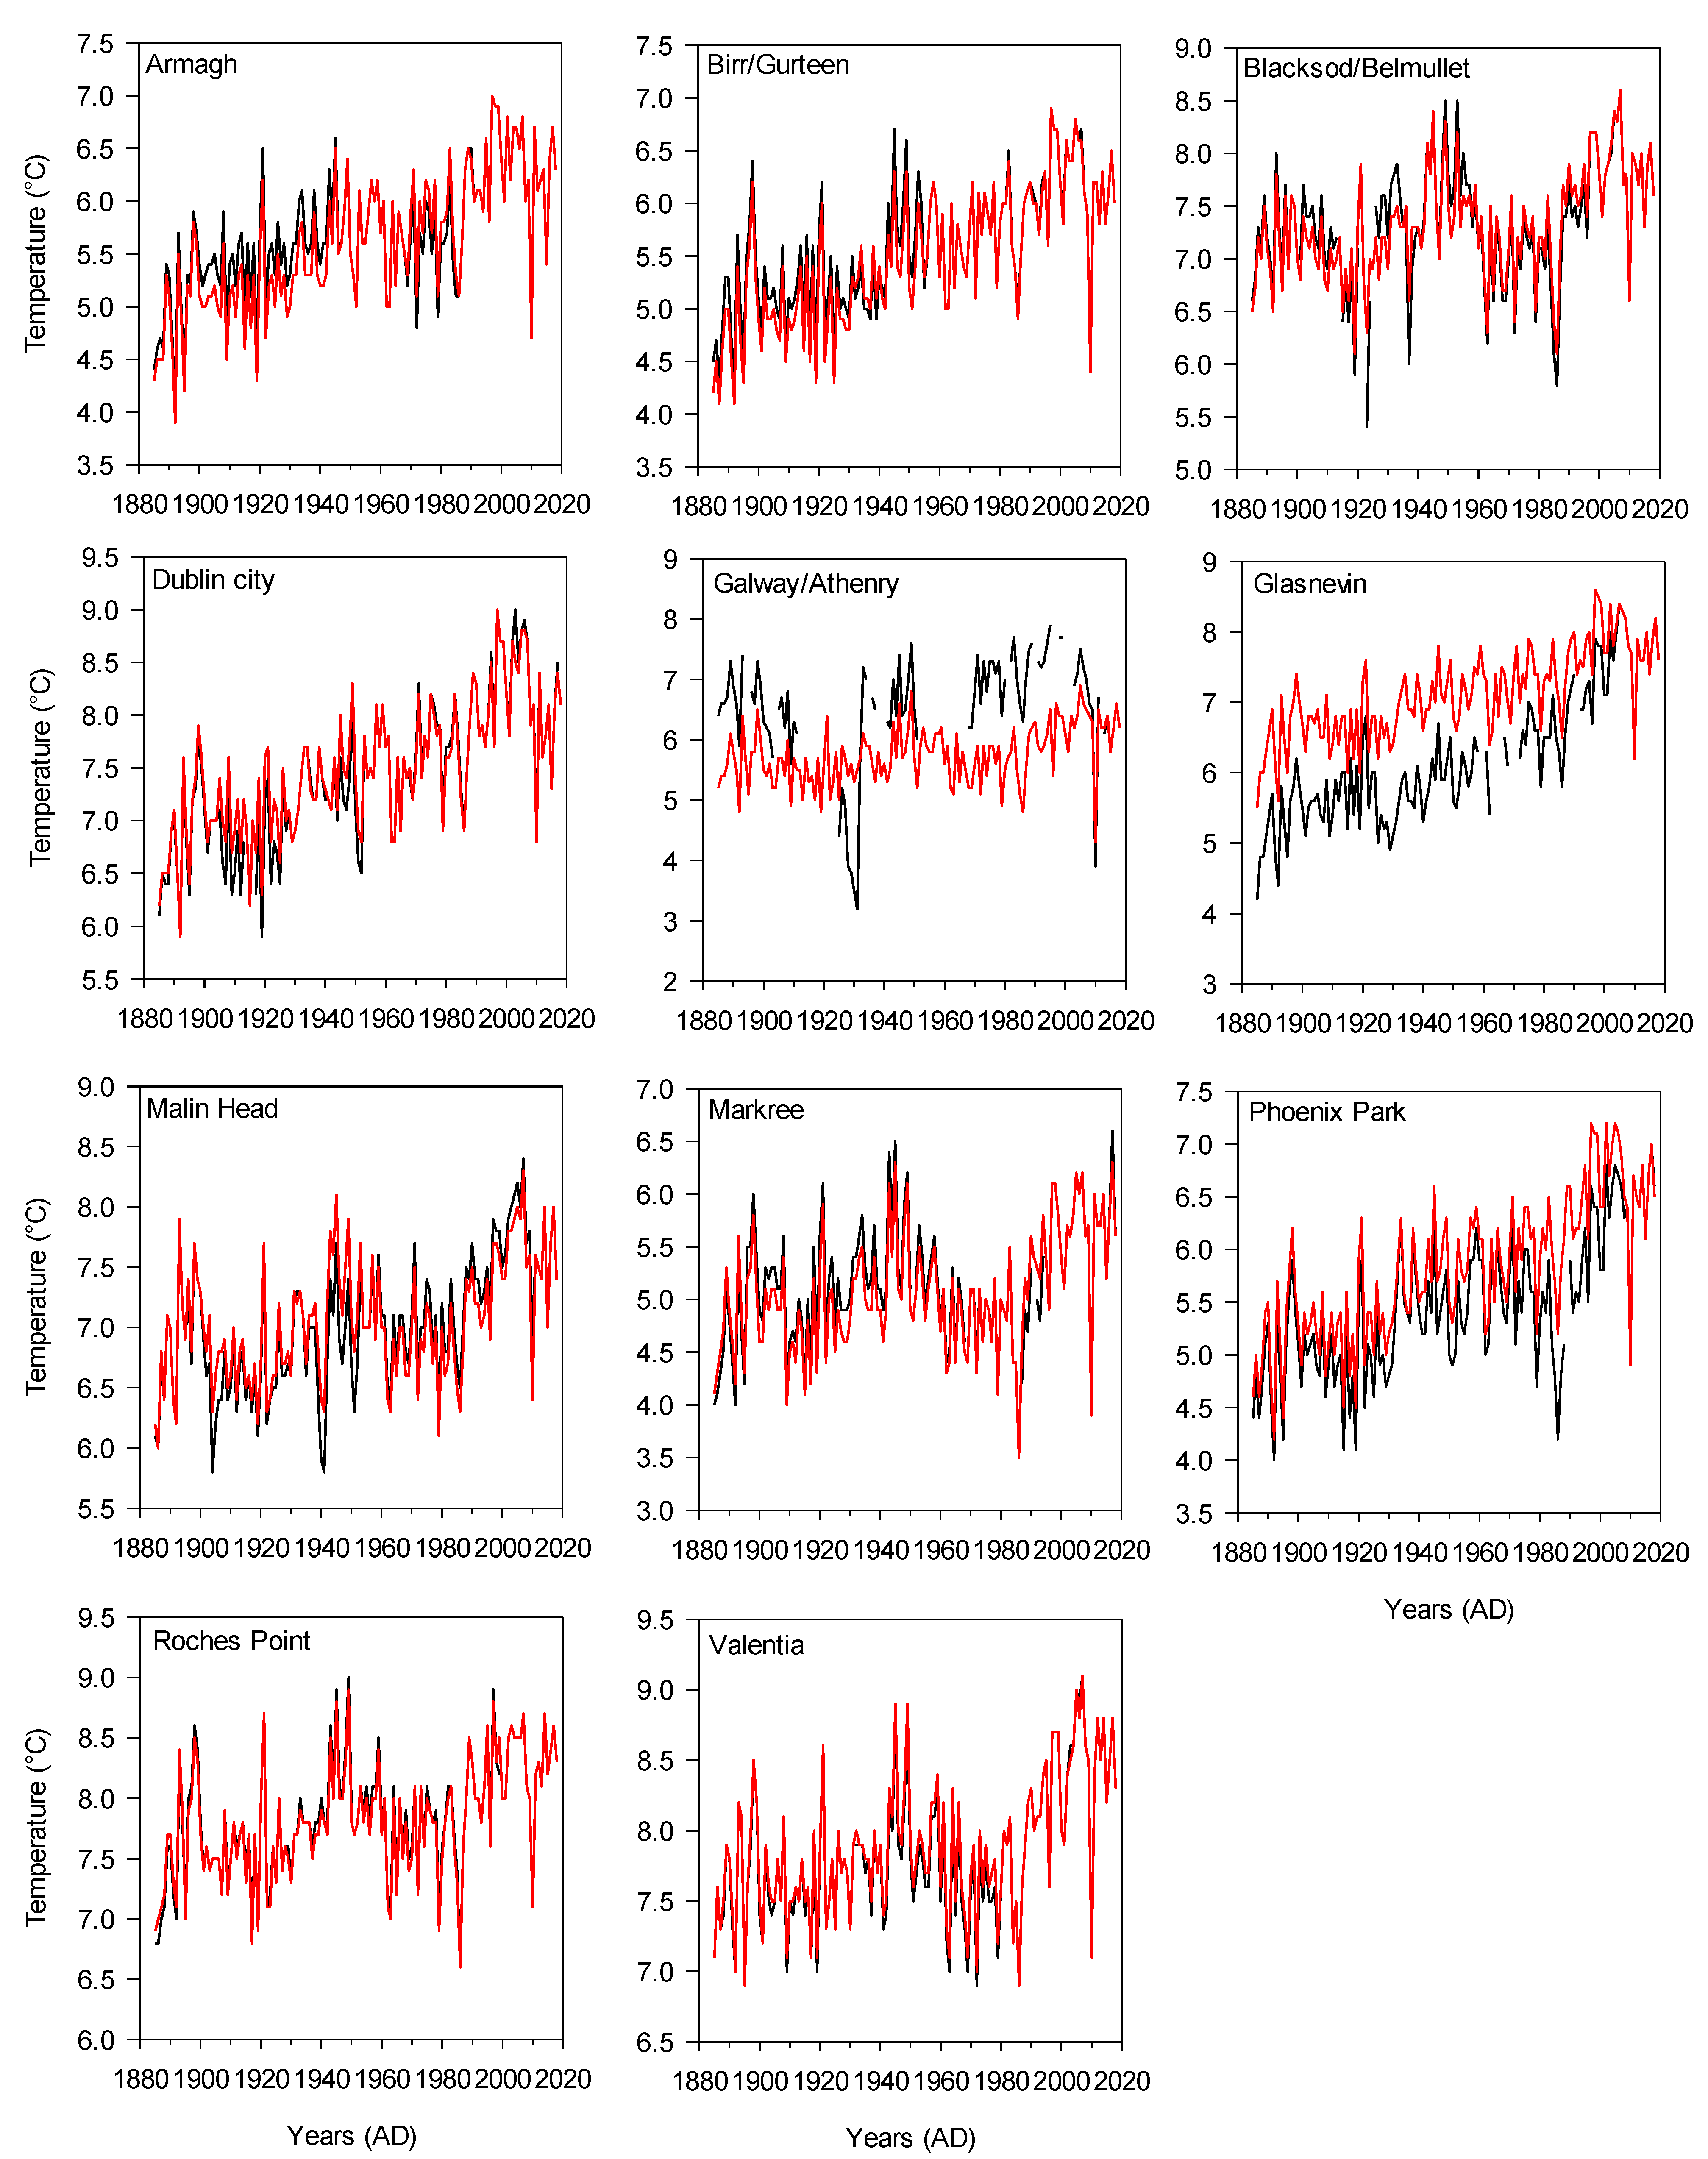
Figure 5.
Quality-controlled (black) and homogenised (red) annual MIN series as part of regional networks in 1885–2018.
Figure 5.
Quality-controlled (black) and homogenised (red) annual MIN series as part of regional networks in 1885–2018.

Figure 6.
Quality-controlled (black) and homogenised (red) annual MIN series as part of the national network in 1885–2018.
Figure 6.
Quality-controlled (black) and homogenised (red) annual MIN series as part of the national network in 1885–2018.

Table 1.
Historical quality-controlled long-term daily MAX and MIN series.
| Series | Station No. | County | Years |
|---|---|---|---|
| Armagh Observatory | 1 | Armagh | 1844–2018 |
| Belmullet | 2 | Mayo | 1884–1899 |
| 1956 | |||
| Birr (second order station) | 3 | Offaly | 1872–1911 |
| Birr (telegraphic station) | 1880–1956 | ||
| Blacksod Point | 4 | Mayo | 1899–1956 |
| Botanic Gardens, Glasnevin-Dublin | 5 | Dublin | 1834 |
| 1847–1958 | |||
| Botanic Gardens, Glasnevin-Dublin (NLI series) | 1882–1952 | ||
| Fitzwilliam Square, Dublin | 6 | Dublin | 1971–1937 |
| Killarney | 7 | Kerry | 1881–1898 |
| 1920–1933 | |||
| Markree | 8 | Sligo | 1850–1852 |
| 1855–1856 | |||
| 1874–1968 | |||
| Markree (new screen) | 1953–1954 | ||
| Malin Head | 9 | Donegal | 1885–1955 |
| NUI Galway | 10 | Galway | 1851–1852 |
| 1861–1952 | |||
| Phoenix Park, Dublin | 11 | Dublin | 1831–1852 |
| 1855–1959 | |||
| Phoenix Park, Dublin (outside observatory) | 1842–1847 | ||
| Phoenix Park, Dublin (Larcom papers) | 1853–1855 | ||
| Phoenix Park, Dublin (comparison sheet) | 1856–1860 | ||
| Phoenix Park, Dublin (Bilham screen) | 1953–1955 | ||
| Roches Point | 12 | Cork | 1872–1956 |
| Roches Point (new station) | 1955 | ||
| Valentia Observatory (Valentia Island) | 13 | Kerry | 1850–1851 |
| 1872–1892 | |||
| Valentia Observatory (Caherciveen) | 14 | Kerry | 1892–1943 |
| Valentia Observatory (Valentia Island, second order station) | 13 | Kerry | 1883–1892 |
| Valentia Observatory (Caherciveen, second order station) | 14 | Kerry | 1892–1909 |
| Trinity College Dublin | 15 | Dublin | 1840–1851 |
| 1855–1856 | |||
| 1904–1959 |
Table 2.
Historical quality-controlled short-term daily MAX and MIN series.
| Series | Station No. | County | Years |
|---|---|---|---|
| Athy | 16 | Kildare | 1850–1852 |
| Belfast | 17 | Down | 1851–1852 |
| Blackrock | 18 | Cork | 1881–1890 |
| Buncrana | 19 | Donegal | 1850–1851 |
| Castletownsend | 20 | Cork | 1850–1851 |
| Commercial Buildings, Dublin | 21 | Dublin | 1850–1858 |
| Courtown | 22 | Wexford | 1850–1852 |
| Donaghadee | 23 | Donegal | 1850–1852 |
| Dunmore East | 24 | Waterford | 1850–1851 |
| Glendooen | 25 | Donegal | 1865–1870 |
| Grafton Street, Dublin | 26 | Dublin | 1843–1849 |
| Inishgort Island | 27 | Mayo | 1851–1852 |
| Kilkenny | 28 | Kilkenny | 1862–1864 |
| Killough | 29 | Down | 1851–1852 |
| 1854 | |||
| Killybegs | 30 | Donegal | 1850–1851 |
| Kilrush | 31 | Clare | 1850–1851 |
| Portarlington | 32 | Laois/Offaly | 1845–1864 |
| Portrush | 33 | Antrim | 1850–1852 |
| Royal College of Surgeons, Dublin | 34 | Dublin | 1841–1857 |
| Royal Dublin Observatory (Dunsink) | 35 | Dublin | 1851 |
| Scattery (Inis Cathaigh) | 36 | Clare | 1850–1852 |
Table 3.
Quality control tests.
| Flags | Definition |
|---|---|
| Flag 1 | Lower daily MIN threshold exceedance. |
| Flag 2 | Upper daily MIN threshold exceedance. |
| Flag 3 | Lower daily MAX threshold exceedance. |
| Flag 4 | Upper daily MAX threshold exceedance. |
| Flag 5 | Daily MAX lower than the MIN. |
| Flag 6 | Step-change in daily MIN higher than 4.5 standard deviations from the mean. |
| Flag 7 | Step-change in daily MAX higher than 4.5 standard deviations from the mean. |
| Flag 8 | Step-change in daily MIN and MAX higher than 4.5 standard deviations from the mean. |
| Flag 9 | Three or more consecutive days with the same daily MIN. |
| Flag 10 | Three or more consecutive days with the same daily MAX. |
| Flag 11 | Three or more consecutive days with the same daily MIN and MAX. |
Table 4.
Long-term MAX and MIN series tested for homogenisation. All series are part of the national network. Series are included in regional networks: Dublin/Midlands and Western.
Table 4.
Long-term MAX and MIN series tested for homogenisation. All series are part of the national network. Series are included in regional networks: Dublin/Midlands and Western.
| Series | Regional Network | Gaps Max (%) | Gaps Min (%) |
|---|---|---|---|
| Armagh Observatory | Dublin/Midlands | 0.02 | 0.04 |
| Birr/Gurteen | Dublin/Midlands | 0.1 | 0.05 |
| Blacksod Point/Belmullet | Western | 0.48 | 0.49 |
| Botanic Gardens, Glasnevin | Dublin/Midlands | 2.84 | 2.95 |
| Dublin (Fitzwilliam Square/Trinity College Dublin/Merrion Square) | Dublin/Midlands | 1.16 | 1.23 |
| Malin Head | Western | 0.12 | 0.1 |
| Markree | Western | 9.14 | 9.10 |
| NUI Galway/Athenry | Western | 12.31 | 12.32 |
| Phoenix Park, Dublin | Dublin/Midlands | 0.07 | 0.13 |
| Roches Point | Western | 5.49 | 5.37 |
| Valentia Observatory | Western | 0.02 | 0.01 |
Table 5.
Total of flagged and percentage of flagged, validated, corrected, and deleted air temperature data per each flag and per decade.
Table 5.
Total of flagged and percentage of flagged, validated, corrected, and deleted air temperature data per each flag and per decade.
| 1830s | 1840s | 1850s | 1860s | 1870s | 1880s | 1890s | 1900s | 1910s | 1920s | |||
|---|---|---|---|---|---|---|---|---|---|---|---|---|
| Flag no. | 1 | 0 | 0 | 0 | 0 | 0 | 3 | 0 | 0 | 0 | 0 | |
| 2 | 0 | 1 | 0 | 1 | 1 | 2 | 1 | 0 | 0 | 3 | ||
| 3 | 0 | 1 | 8 | 0 | 2 | 4 | 0 | 0 | 2 | 0 | ||
| 4 | 0 | 0 | 4 | 0 | 1 | 2 | 1 | 0 | 0 | 0 | ||
| 5 | 14 | 14 | 22 | 14 | 24 | 78 | 10 | 2 | 6 | 26 | ||
| 6 | 0 | 0 | 0 | 0 | 0 | 3 | 0 | 1 | 0 | 0 | ||
| 7 | 0 | 2 | 0 | 1 | 0 | 3 | 0 | 0 | 0 | 2 | ||
| 8 | 0 | 0 | 0 | 0 | 0 | 0 | 0 | 0 | 0 | 0 | ||
| 9 | 42 | 154 | 461 | 271 | 468 | 941 | 1259 | 1199 | 1553 | 1691 | ||
| 10 | 39 | 286 | 719 | 304 | 727 | 1344 | 1659 | 1947 | 2059 | 2406 | ||
| 11 | 0 | 18 | 6 | 6 | 44 | 58 | 116 | 106 | 74 | 192 | ||
| Summary | Total flagged | 95 | 476 | 1220 | 597 | 1267 | 2438 | 3046 | 3255 | 3694 | 4319 | |
| Total validated | 83 | 460 | 1189 | 567 | 1243 | 2348 | 3033 | 3238 | 3676 | 4273 | ||
| Total corrected | 1 | 16 | 31 | 30 | 24 | 84 | 13 | 14 | 18 | 47 | ||
| Total deleted | 11 | 0 | 0 | 0 | 0 | 6 | 0 | 3 | 0 | 0 | ||
| Total data | 5535 | 33,793 | 55,509 | 30,472 | 50,451 | 102,410 | 109,084 | 106,401 | 95,240 | 101,171 | ||
| % Flagged | 1.7 | 1.4 | 2.2 | 2 | 2.5 | 2.4 | 2.8 | 3.1 | 3.9 | 4.3 | ||
| % Validated | 87.4 | 96.6 | 97.5 | 95 | 98.1 | 96.3 | 99.6 | 99.5 | 99.5 | 98.9 | ||
| % Corrected | 1.1 | 3.4 | 2.5 | 5 | 1.9 | 3.4 | 0.4 | 0.4 | 0.5 | 1.1 | ||
| % Deleted | 11.6 | 0 | 0 | 0 | 0 | 0.2 | 0 | 0.1 | 0 | 0 | ||
| 1930s | 1940s | 1950s | 1960s | 1970s | 1980s | 1990s | 2000s | 2010s | ||||
| Flag no. | 1 | 0 | 5 | 0 | 0 | 0 | 0 | 0 | 0 | 0 | 8 | Total |
| 2 | 2 | 1 | 0 | 0 | 0 | 0 | 0 | 0 | 0 | 12 | ||
| 3 | 2 | 1 | 1 | 1 | 0 | 0 | 0 | 0 | 0 | 22 | ||
| 4 | 0 | 0 | 1 | 0 | 0 | 0 | 0 | 0 | 0 | 9 | ||
| 5 | 14 | 2 | 20 | 18 | 0 | 0 | 0 | 0 | 0 | 264 | ||
| 6 | 0 | 0 | 0 | 0 | 0 | 0 | 0 | 0 | 1 | 5 | ||
| 7 | 0 | 0 | 0 | 0 | 0 | 0 | 0 | 0 | 0 | 8 | ||
| 8 | 0 | 0 | 0 | 0 | 0 | 0 | 0 | 0 | 0 | 0 | ||
| 9 | 1741 | 878 | 426 | 43 | 0 | 0 | 3 | 0 | 3 | 11,133 | ||
| 10 | 2296 | 1173 | 554 | 61 | 0 | 0 | 0 | 3 | 0 | 15,577 | ||
| 11 | 134 | 62 | 0 | 0 | 0 | 0 | 0 | 0 | 0 | 816 | ||
| Summary | Total flagged | 4189 | 2122 | 1002 | 123 | 0 | 0 | 3 | 3 | 4 | 27,853 | |
| Total validated | 4141 | 2098 | 979 | 108 | 0 | 0 | 3 | 3 | 4 | 27,446 | ||
| Total corrected | 48 | 24 | 15 | 15 | 0 | 0 | 0 | 0 | 0 | 380 | ||
| Total deleted | 0 | 0 | 8 | 0 | 0 | 0 | 0 | 0 | 0 | 28 | ||
| Total data | 95,200 | 82,895 | 59,693 | 13,876 | 7300 | 7306 | 7300 | 7306 | 5844 | 976,786 | ||
| % Flagged | 4.4 | 2.6 | 1.7 | 0.9 | 0 | 0 | 0 | 0 | 0.1 | 2.9 | Percentage | |
| % Validated | 98.9 | 98.9 | 97.7 | 87.8 | 0 | 0 | 100 | 100 | 100 | 98.5 | ||
| % Corrected | 1.1 | 1.1 | 1.5 | 12.2 | 0 | 0 | 0 | 0 | 0 | 1.4 | ||
| % Deleted | 0 | 0 | 0.8 | 0 | 0 | 0 | 0 | 0 | 0 | 0.1 | ||
Table 6.
Geographical distribution of flags.
| Flags No. | |||||||||||||
|---|---|---|---|---|---|---|---|---|---|---|---|---|---|
| Series | 1 | 2 | 3 | 4 | 5 | 6 | 7 | 8 | 9 | 10 | 11 | Total Flagged | Total Data |
| Armagh Observatory | 1 | 0 | 4 | 0 | 2 | 1 | 3 | 0 | 172 | 200 | 6 | 389 | 127,016 |
| Athy | 0 | 0 | 0 | 0 | 0 | 0 | 0 | 0 | 8 | 19 | 0 | 27 | 988 |
| Belfast | 0 | 0 | 0 | 0 | 0 | 0 | 0 | 0 | 3 | 3 | 0 | 6 | 612 |
| Belmullet/Blacksod Point | 0 | 0 | 1 | 0 | 46 | 0 | 0 | 0 | 1624 | 2256 | 146 | 4073 | 52,306 |
| Birr | 0 | 0 | 0 | 0 | 16 | 1 | 1 | 0 | 525 | 577 | 18 | 1138 | 83,176 |
| Blackrock | 0 | 0 | 0 | 2 | 2 | 0 | 0 | 0 | 89 | 135 | 6 | 234 | 6172 |
| Botanic Gardens, Glasnevin | 0 | 5 | 7 | 0 | 56 | 1 | 0 | 0 | 1043 | 1234 | 36 | 2382 | 130,548 |
| Buncrana | 0 | 0 | 0 | 0 | 0 | 0 | 0 | 0 | 19 | 11 | 0 | 30 | 629 |
| Castletownsend | 0 | 0 | 0 | 0 | 0 | 0 | 0 | 0 | 11 | 22 | 6 | 39 | 913 |
| Commercial Buildings Dublin | 0 | 0 | 0 | 0 | 4 | 0 | 0 | 0 | 105 | 123 | 0 | 232 | 5996 |
| Courtown | 0 | 0 | 1 | 0 | 0 | 0 | 0 | 0 | 3 | 9 | 0 | 13 | 976 |
| Donaghadee | 0 | 0 | 0 | 0 | 0 | 0 | 0 | 0 | 16 | 0 | 0 | 16 | 887 |
| Dunmore | 0 | 0 | 0 | 1 | 0 | 0 | 0 | 0 | 7 | 9 | 0 | 17 | 812 |
| Dunsink | 0 | 0 | 0 | 0 | 0 | 0 | 0 | 0 | 0 | 3 | 0 | 3 | 550 |
| Fitzwilliam Square, Dublin | 0 | 1 | 0 | 0 | 0 | 1 | 0 | 0 | 350 | 457 | 6 | 815 | 48,758 |
| Glendooen | 0 | 0 | 0 | 0 | 0 | 0 | 0 | 0 | 59 | 0 | 0 | 59 | 1528 |
| Grafton Street, Dublin | 0 | 0 | 1 | 0 | 4 | 0 | 0 | 0 | 81 | 138 | 12 | 236 | 5112 |
| Innisgort Island | 0 | 0 | 0 | 0 | 0 | 0 | 0 | 0 | 19 | 17 | 0 | 36 | 443 |
| Kilkenny | 0 | 0 | 0 | 0 | 0 | 0 | 0 | 0 | 18 | 24 | 0 | 42 | 1082 |
| Killarney | 3 | 0 | 0 | 0 | 6 | 0 | 1 | 0 | 114 | 120 | 12 | 256 | 21,850 |
| Killough | 0 | 0 | 0 | 0 | 0 | 0 | 0 | 0 | 7 | 18 | 0 | 25 | 1034 |
| Killybegs | 0 | 0 | 0 | 0 | 0 | 0 | 0 | 0 | 3 | 6 | 0 | 9 | 527 |
| Kilrush | 0 | 0 | 0 | 0 | 0 | 0 | 0 | 0 | 18 | 15 | 0 | 33 | 479 |
| Malin Head | 0 | 0 | 1 | 0 | 8 | 0 | 0 | 0 | 1662 | 1616 | 124 | 3411 | 52,259 |
| Markree | 4 | 0 | 0 | 2 | 18 | 0 | 0 | 0 | 431 | 853 | 18 | 1326 | 71,202 |
| NUI Galway | 0 | 4 | 4 | 1 | 42 | 0 | 2 | 0 | 1152 | 2066 | 136 | 3407 | 58,063 |
| Phoenix Park, Dublin | 0 | 0 | 3 | 2 | 24 | 1 | 1 | 0 | 507 | 810 | 18 | 1366 | 98,699 |
| Portarlington | 0 | 1 | 0 | 0 | 6 | 0 | 0 | 0 | 48 | 99 | 0 | 154 | 9155 |
| Portrush | 0 | 0 | 0 | 0 | 0 | 0 | 0 | 0 | 47 | 30 | 0 | 77 | 1278 |
| Roches Point | 0 | 0 | 0 | 0 | 10 | 0 | 0 | 0 | 1498 | 103 | 154 | 1765 | 62,007 |
| Royal College of Surgeons, Dublin | 0 | 0 | 0 | 1 | 2 | 0 | 0 | 0 | 18 | 2233 | 0 | 2254 | 8696 |
| Scattery (Inis Cathaigh) | 0 | 0 | 0 | 0 | 0 | 0 | 0 | 0 | 17 | 9 | 0 | 26 | 734 |
| Trinity College Dublin | 0 | 0 | 0 | 0 | 4 | 0 | 0 | 0 | 664 | 1461 | 74 | 2203 | 49,459 |
| Valentia Observatory | 0 | 1 | 0 | 0 | 14 | 0 | 0 | 0 | 795 | 901 | 44 | 1755 | 72,840 |
| Total | 8 | 12 | 22 | 9 | 264 | 5 | 8 | 0 | 11,133 | 15,577 | 816 | 27,854 | 976,786 |
Table 7.
Average test statistics for series included in the national network. Critical value (significance level 0.05): 21.94. TSb—test statistics before homogenisation; TSa—test statistics after homogenisation; RC of TS—relative change of TS; RM—relative modification; SE—statistics for estimated inhomogeneities.
| Series | MAX Series | MIN Series | ||||||||
|---|---|---|---|---|---|---|---|---|---|---|
| TSb | TSa | RC of TS | RM | SE | TSb | TSa | RC of TS | RM | SE | |
| Phoenix Park, Dublin | 217.89 | 27.75 | 0.87 | 0.13 | 94.94 | 897.80 | 58.15 | 0.94 | 0.81 | 473.55 |
| Botanic Gardens, Glasnevin | 705.19 | 34.11 | 0.95 | 0.31 | 631.39 | 2970.01 | 36.10 | 0.99 | 1.16 | 3709.10 |
| Dublin city | 973.34 | 33.17 | 0.97 | 0.90 | 562.09 | 491.24 | 25.12 | 0.95 | 0.42 | 700.65 |
| Roches Point | 78.36 | 25.05 | 0.68 | 0.42 | 63.75 | 168.46 | 29.33 | 0.83 | 0.31 | 85.17 |
| Malin Head | 149.42 | 23.51 | 0.84 | 0.29 | 91.41 | 74.40 | 25.14 | 0.66 | 0.27 | 43.70 |
| Birr/Gurteen | 264.54 | 29.41 | 0.89 | 0.68 | 409.24 | 596.11 | 22.26 | 0.96 | 0.27 | 238.60 |
| NUI Galway/ Athenry | 1525.84 | 22.04 | 0.99 | 1.07 | 1641.70 | 2080.64 | 21.65 | 0.99 | 1.15 | 1976.95 |
| Valentia Observatory | 111.04 | 33.04 | 0.70 | 0.39 | 42.49 | 330.28 | 25.01 | 0.92 | 0.41 | 87.28 |
| Markree | 546.91 | 54.76 | 0.90 | 0.83 | 455.06 | 1114.49 | 21.63 | 0.98 | 0.41 | 443.83 |
| Armagh Observatory | 203.09 | 18.42 | 0.91 | 0.39 | 78.63 | 174.54 | 25.87 | 0.85 | 0.19 | 125.59 |
| Blacksod Point/Belmullet | 466.70 | 41.61 | 0.91 | 0.35 | 268.52 | 513.83 | 45.58 | 0.91 | 0.61 | 356.02 |
| Average (National network) | 476.57 | 31.17 | 0.93 | 0.52 | 394.47 | 855.62 | 30.53 | 0.96 | 0.55 | 749.13 |
Table 8.
Average test statistics for series included in the Dublin/Midlands and Western networks. Critical value (significance level 0.05): 21.94. TSb—test statistics before homogenisation; TSa—test statistics after homogenisation; RC of TS—relative change of TS; RM—relative modification; SE—statistics for estimated inhomogeneities.
| Series | MAX Series | MIN Series | ||||||||
|---|---|---|---|---|---|---|---|---|---|---|
| TSb | TSa | RC of TS | RM | SE | TSb | Tsa | RC of TS | RM | SE | |
| Phoenix Park, Dublin | 211.78 | 23.68 | 0.89 | 0.11 | 54.17 | 949.50 | 82.27 | 0.91 | 0.61 | 455.30 |
| Botanic Gardens, Glasnevin | 701.87 | 31.15 | 0.96 | 0.26 | 490.53 | 2045.17 | 53.17 | 0.97 | 1.06 | 1804.43 |
| Dublin city | 917.33 | 25.27 | 0.97 | 0.83 | 549.95 | 249.52 | 20.44 | 0.92 | 0.26 | 151.63 |
| Roches Point | 92.93 | 43.87 | 0.53 | 0.36 | 17.40 | 78.89 | 42.69 | 0.46 | 0.12 | 13.61 |
| Malin Head | 230.26 | 36.22 | 0.84 | 0.35 | 78.23 | 169.30 | 25.96 | 0.85 | 0.38 | 90.11 |
| Birr/ Gurteen | 166.76 | 30.17 | 0.82 | 0.50 | 116.42 | 170.45 | 20.66 | 0.88 | 0.25 | 46.94 |
| NUI Galway/ Athenry | 1314.64 | 67.43 | 0.95 | 0.90 | 1216.11 | 2423.70 | 36.41 | 0.98 | 1.10 | 2013.58 |
| Valentia Observatory | 133.80 | 22.13 | 0.83 | 0.28 | 52.35 | 106.31 | 33.79 | 0.68 | 0.13 | 15.07 |
| Markree | 689.60 | 53.75 | 0.92 | 0.59 | 258.80 | 197.98 | 30.80 | 0.84 | 0.31 | 62.81 |
| Armagh Observatory | 152.56 | 25.85 | 0.83 | 0.31 | 38.44 | 222.45 | 18.96 | 0.91 | 0.33 | 187.99 |
| Blacksod Point/Belmullet | 389.05 | 23.12 | 0.94 | 0.39 | 248.78 | 201.20 | 29.82 | 0.85 | 0.35 | 97.24 |
| Average (Dublin/Midlands network) | 430.06 | 27.22 | 0.94 | 0.40 | 249.90 | 727.42 | 39.10 | 0.95 | 0.50 | 529.26 |
| Average (Western Network) | 475.05 | 41.09 | 0.91 | 0.48 | 311.94 | 529.56 | 33.25 | 0.94 | 0.40 | 382.07 |
Publisher’s Note: MDPI stays neutral with regard to jurisdictional claims in published maps and institutional affiliations. |
© 2021 by the authors. Licensee MDPI, Basel, Switzerland. This article is an open access article distributed under the terms and conditions of the Creative Commons Attribution (CC BY) license (https://creativecommons.org/licenses/by/4.0/).
Share and Cite
MDPI and ACS Style
Mateus, C.; Potito, A. Development of a Quality-Controlled and Homogenised Long-Term Daily Maximum and Minimum Air Temperature Network Dataset for Ireland. Climate 2021, 9, 158. https://0-doi-org.brum.beds.ac.uk/10.3390/cli9110158
AMA Style
Mateus C, Potito A. Development of a Quality-Controlled and Homogenised Long-Term Daily Maximum and Minimum Air Temperature Network Dataset for Ireland. Climate. 2021; 9(11):158. https://0-doi-org.brum.beds.ac.uk/10.3390/cli9110158
Chicago/Turabian StyleMateus, Carla, and Aaron Potito. 2021. "Development of a Quality-Controlled and Homogenised Long-Term Daily Maximum and Minimum Air Temperature Network Dataset for Ireland" Climate 9, no. 11: 158. https://0-doi-org.brum.beds.ac.uk/10.3390/cli9110158
Note that from the first issue of 2016, this journal uses article numbers instead of page numbers. See further details here.