Article

Assessment of Climate-Driven Flood Risk and Adaptation Supporting the Conservation Management Plan of a Heritage Site. The National Art Schools of Cuba

by
Leonardo Stucchi
1,
Daniele Fabrizio Bignami
2,
Daniele Bocchiola
1,*,
Davide Del Curto
3,
Andrea Garzulino
3 and
Renzo Rosso
1
1
Department of Civil and Environmental Engineering, Politecnico di Milano, 20133 Milano, Italy
2
Fondazione Politecnico di Milano. L. da Vinci 32, 20133 Milano, Italy
3
Department of Architecture and Urban Studies, Politecnico di Milano, 20133 Milano, Italy
*
Author to whom correspondence should be addressed.
Submission received: 31 December 2020 / Revised: 18 January 2021 / Accepted: 20 January 2021 / Published: 23 January 2021
(This article belongs to the Special Issue Cultural Landscape Approaches and Climate Change Policy)

Abstract

:
This work illustrates the contribution of flood risk assessment and adaptation to set up a conservation management plan for a masterpiece of 20th-century architecture. Case study is the iconic complex, internationally known as the National Art Schools of Cuba. It consists of five buildings built in the early 1960s within a park of Habana next to the Caribbean Sea. The path of the river (Rio Quibù) crossing the estate was modified to fit the landscape design. The complex has then been exposed to the risk of flooding. The School of Ballet, located in a narrow meander of the river, slightly upstream of a bridge and partially obstructing the flow, is particularly subject to frequent flash floods from the Rio Quibù, and it needs urgent restoration. Keeping ISA Modern is a project aimed at preserving the Schools complex. Based upon in situ surveys on the Rio Quibù and local area measurements during 2019, numerical modelling, and previous work by the Cuban National Institute of Hydraulic Resources, we pursued a flood risk analysis for the area, and a preliminary analysis of available risk reduction strategies. Using HEC-RAS 2D software for hydraulic modelling, we evaluated the flooded area and the hydraulic conditions (flow depth, velocity) for floods with given return periods. Our results show that SB is a building most subject to flooding, with high levels of risk. Defense strategies as designed by Cuban authorities may include a (new) wall around the School of Ballet and widening of the river channel, with high impact and cost, although not definitive. Temporary, light, permanent, and low cost/impact flood proofing structures may be used with similar effectiveness. We demonstrate that relatively little expensive hydraulic investigation may aid flood modelling and risk assessment in support of conservation projects for historically valuable sites. This may support brainstorming and the selection of (low to high cost) adaptation and risk reduction measures in the coastal areas of Cuba in response to ever increasing extreme storms and sea level rise controlling flood dynamics under transient climate change.

1. Introduction

1.1. Flood Risk Assessment in Developing Countries

Flood risk assessment (FRA) is a main challenge in modern hydrology. It was estimated that, during 1998–2017, ca. 2 billion people were affected by floods worldwide, with economic losses estimated up to 658 Billion US$ [1]. Such figures are expected to increase in the wake of present and expected climate change [2,3], and even increasing urbanization henceforth [4]. Pursuing integrated disaster response, and climate change adaptation is an urgent need, in particular when there are endangered heritage sites involved, where climate change could accelerate existing risks [5,6]. Even presently, however, the FRA exercise can be a very hard task for scientists and experts. Risk assessment does not only require extensive knowledge of flow regime (stream flows, volumes) of the water body during extreme events, but also details of use, destination, value, and the geometry of the surrounding areas necessary to assess flow conditions (depth, velocity), expected degree of damage, and economic and non-economic cost (value) thereby. Goods at risk of damage frequently may include historically valuable buildings, the stability of which is at stake due to floods.
Most developed countries possess special authorities, dedicated to FRA, and emergency planning. In these countries, the damages caused by flood may be typically large in terms of economic losses, but small for peoples’ health, due to the existence of a rapid alert system and adequate flood resistant structures. On the other hand, in developing countries, floods are a severe threat even for people.
The chance of death, e.g., for drowning, and of being injured during floods is possibly lower than under other natural hazards [7]. However, stagnant water in the wake of floods can even be a driver for diseases, due to a high level of water pollution [8], especially in urban areas where sewage treatment plants are poorly effective, or lacking [9].
The flood modelling exercise is more complicated in less rich countries, due to a scarcity/lack of the necessary data, such as historical precipitation/flow measurements and (maps of) soil use/cover, useful to estimate the peak discharges/volumes as a function of the return period.
Several techniques have been developed in such contexts through the years that do not imply physically based hydrologic/hydraulic models. However, such methods require inputs of several locally measured data, historical data of precipitation, and discharge. For instance, remote sensing techniques can contribute to compensating for the lack of field measurements in developing countries, to pursue the study of land use [10] and of rainfall regimes thereby [11], that can subsequently be used to simulate hydrological processes and assess critical (design) peak flows and flooded areas [12]. The introduction of machine learning techniques in flood susceptibility modelling (e.g., [13,14]) allows to bypass physical modelling and to assess flood susceptibility as a combination of some input parameters, also considering the effect of climate change [15]. In our case study, remote sensing could not be used to assess flooded areas directly. Satellite images are not available here that can be used to map floods, that in this area display a very rapid development, making satellite images less useful. Furthermore, the lack of historical data regarding precipitation series, and flood occurrence make difficult to apply a statistical approach, or machine learning algorithms. As a consequence, in our case study here, an accurate small scale flood mapping exercise is necessary for the purpose of FRA, and to set up proper countermeasures, it is necessary to implement a hydraulic model, exploiting the availability of high-resolution geometry data and design values for peak discharge flow, which will be presented in the next chapter.
This study aims to assess the flood risk for a national heritage site, internationally known as the National Art Schools of Cuba. Nowadays, this hosts the University of Arts of Cuba/Instituto Superior de Arte (ISA) in Habana. The area is heavily threatened by flooding of the Quibù river and there is a need to devise a set of risk reduction strategies, in support of a conservation plan for the area. Here, we demonstrate that a high-resolution flood model can be implemented, partly compensating lack of detailed hydrological data and climatic series, when extensive knowledge of the geometry of the area is available. Here, such knowledge was obtained using a manual laser scanner and river sections measurements, and with both quantitative and qualitative information provided by local authorities. Our results are preliminary to the design and implementation of adequate risk reduction actions.

1.2. The Keeping It Modern Initiative

‘Keeping It Modern’ is an initiative launched by the Getty Foundation in 2014, with the aim to promote a comprehensive approach to the conservation of modern architecture. Modern architecture is one of the defining artistic forms of the 20th century, and nowadays it represents a major field of investigation within the architectural preservation sector. In facts, thanks to new construction techniques, and the mechanical properties of materials derived from industry (iron, concrete, glass, polymers), architects and engineers had the opportunity to conceive forms, and spaces that were previously unimaginable. However, because of those highly experimental features, buildings have often not performed as expected over the years, and they are now at risk. The program aims at addressing this challenge, and it has supported the preparation of a Conservation Management Plan (CMP), for a selection of iconic buildings during 2014–2019 [16]. A CMP for the ISA of Havana was prepared under this initiative during 2018–2020.
This complex of buildings is a masterpiece of modern architecture, internationally known as the National Art School of Cuba. The working group comprises personnel from Politecnico di Milano, Università di Parma, Princeton University, Assorestauro (the Italian Association for Architectural, Artistic and Urban Restoration). The team operated together with a panel of partners in Cuba, namely the teaching staff of the University of Arts of Cuba/Instituto Superior de Arte (ISA) in Habana, the scholars of the local Facultad de Arte de Conservaciòn del Patrimonio Cultural (the Faculty of Arts for the Conservation of Cultural Heritage), which was involved in the layout of the project. The CMP includes five actions: (1) documentation, (2) conservation, (3) landscape management and flood risk assessment and mitigation, (4) environmental sustainability, and (5) management [17].
This paper reports the main results obtained under the Action 3, namely “Landscape Management and flood risk assessment and mitigation”. The main content of the Action 3 was the assessment of flood risk in the area of ISA as due to flood events within the Rio Quibù catchment. Particular focus was cast upon the School of Ballet (SB), which was also the subject of a study to propose flood proofing solutions. The paper is organized as follows. In this section, we report information of the ISA area, and of hydro-climatology of Cuba. In the section Materials and Methods, divided in 3 subsections, we report information of the ISA area and the hydro-climatology of Cuba, driving extreme floods dynamics. We then report about the available information for the study and the in-situ activity we carried out, mainly during 2018–2019, to gather relevant information for the purpose of flood modelling. Also, we report therein a summary of the adopted method for 2D hydraulic modelling of the area. In the Results section, we provide the main findings, in terms of flood dynamics and flood risk for the buildings, and even for people, under “shared” flood scenarios (with return period up to R = 100 years), made available by the Instituto Nacional de Recursos Hidràulicos (INRH). We then comment upon the potential effectiveness of recently proposed (by INRH) measures for expensive, permanent flood proofing of the area. In the Discussion section, we first benchmark the design flows from the INRH study. We then discuss use and report examples of alternative (more suitable, both temporary and permanent) flood proofing strategies for the most critical area of SB. We then provide some conclusions and outlooks.

2. Materials and Methods

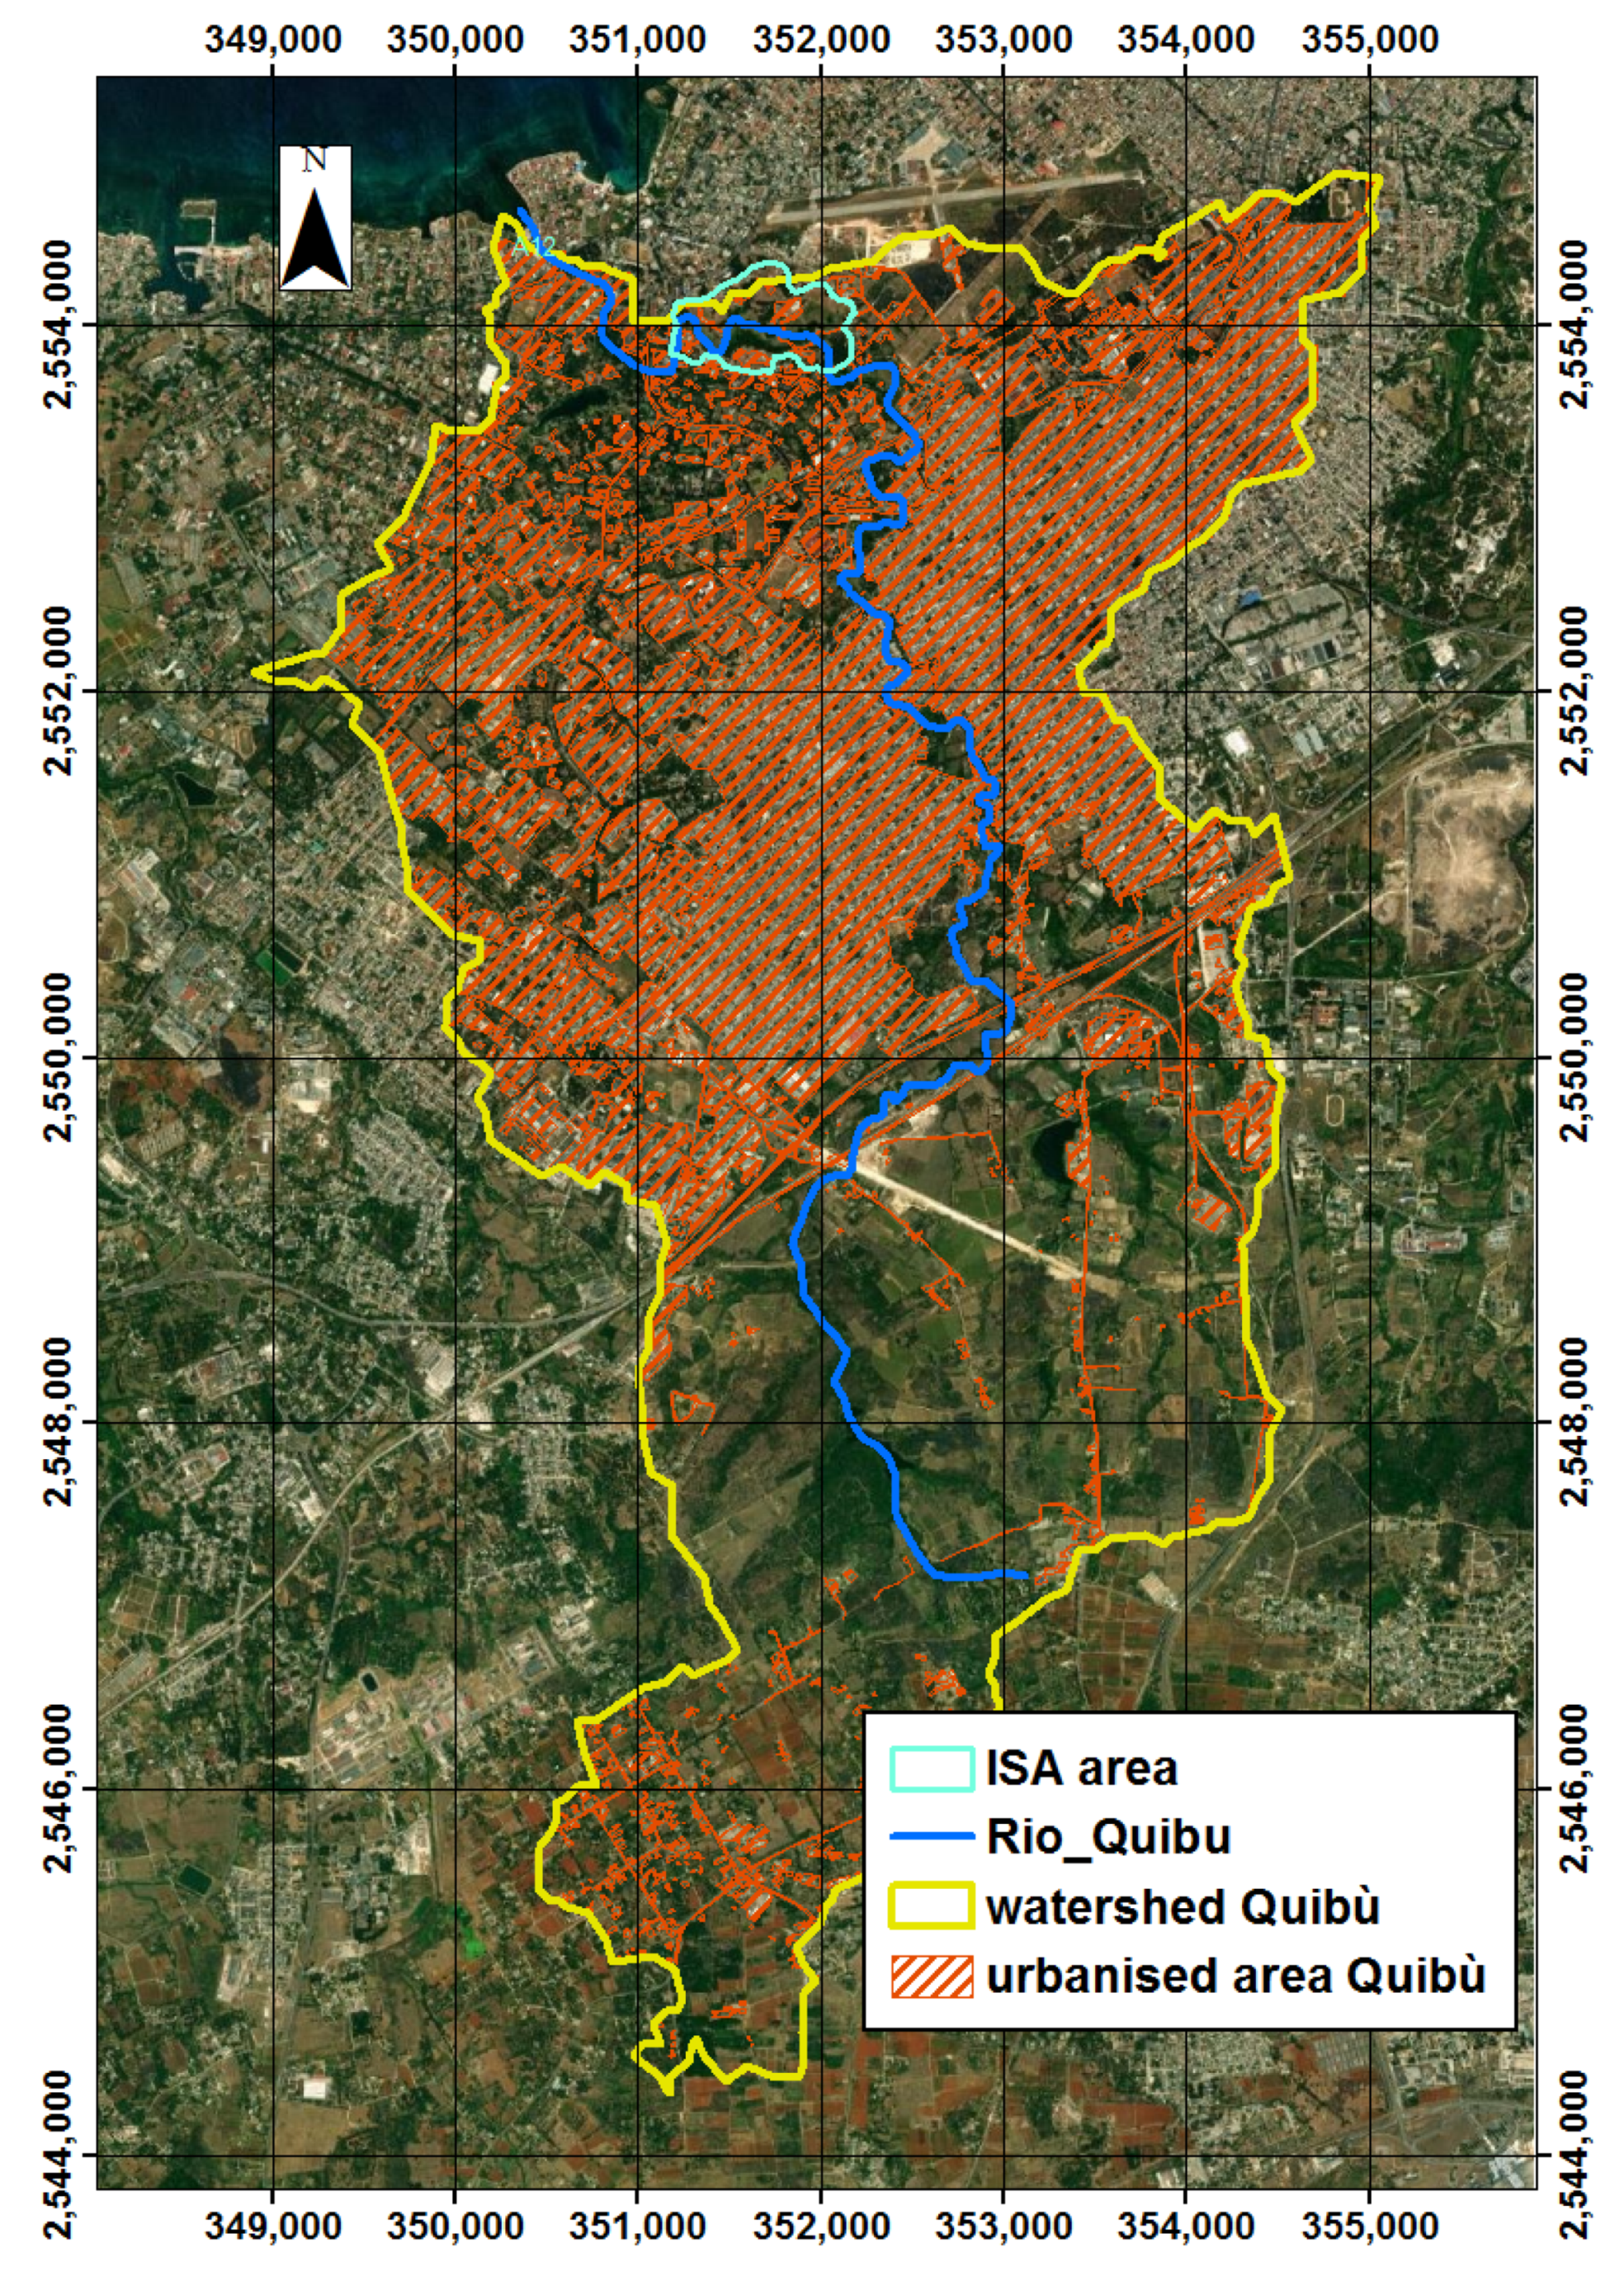
2.1. Study Area and Climate of Cuba

Soon after the Revolution in 1961, the Cuban leaders Fidel Castro, and Ernesto (El Che) Guevara decided to build, within the enchanting scenario of the Country Club of Havana, a School of Arts, to offer an education in the field of arts to the youth of the island, and possibly of Latin America. The complex, designed by the Cuban architect Ricardo Porro, together with the Italian architects Vittorio Garatti and Roberto Gottardi, is made of five iconic buildings (Figure 1), each one originally designed to accommodate the teaching of a single form of art (Fine Arts, Drama, Music, Ballet, Modern Dance). Due to the exacerbation of the political and economic context (e.g., with the Cuban Missile Crisis, the embargo), the ISA project was discontinued in 1965, while still unfinished, and when only 2 out of the 5 buildings were actually operative.
In particular, the SB, designed by architect Vittorio Garatti, was built as an open structure within a meander of the local Rio Quibù river. Such position amplifies the effect of the frequent floods occurring therein, also given that the Rio Quibù thalweg (bottom level) is in practice at the sea level, or below. Small, frequent floods occur more than once per year, and ponding of the area even occurs when storm water flows overland from a small hill, south-east of the SB, given ineffective drainage of the area.
However, the most impacting events in the area are the large, less frequent floods from the Rio Quibù. An original levee/wall that protected SB fell soon, and now the Rio Quibù water can intrude easily. Also, erosion from flooding water may affect the foundations of the School of Music, the worm-shaped building (el Gusano, the worm) North of the SB (Figure 1). The presence of bridges, particularly the bridge of road 15° (puente de calle quince, BR15), located immediately downstream of the SB, negatively impacts on flood dynamic, by obstructing the flow and causing backwater.
A previous project of the INRH [19], suggested the construction of a new levee/wall, and the excavation, and channel widening towards North of the Rio Quibù. Such countermeasures would protect the SB, which is located in a narrow meander of the river, and also would avoid flooding of the park, near the School of Music. However, these structures were never realized during the last 15 years, mainly due to their high cost (in the order of 2 M$, personnel of INRH, personal communication, June 2019).
The ISA school is located in the riparian area of the terminal course of Rio Quibù. This small catchment is a typical case of flood prone coastal basin, where heavy storm and hurricane precipitation can severely hit the area [20].
This is also a typical example of urban catchment in a developing country, with fast urbanization in the last century [21], and it has ca. 34% of the basin area used for agriculture (and less, industry), and main land use (ca. 66%) for urban settlements. Using satellite images, we were able to compute the share of impermeable area (concrete/paved) of the basin, resulting into ca. 40% (Figure 2). Total population is ca. 240,000, indicating noticeable pollution risk, because over-flooding of polluted water, typical of Cuban rivers like Rio Quibù [22,23] can amplify the impact of severe flood events.
Rio Quibù catchment area is about 33 km2. It displays moderate relief, with elevation ranging from 78 m.a.s.l., to sea level. The river network is 41 km long, with a main channel of 13 km, displaying an average drainage density of 1.3 km/km2, but higher in the upstream catchment, and lower in the downstream area [24]. The natural river runoff from the catchment is quite small during low flow periods. However, there is a systematic intake of water from external catchments in this basin to supply population water demand. This modifies (increases) the every-day flow, so that discharge is rather constant throughout the year, and it is sufficient to smooth the effect of the seasonal variability of precipitation. The present average flow rate is estimated into 0.35 m3s−1 (i.e., the specific flow is 109 ls−1km−2). This amounts to 345 mmy−1 of net annual precipitation, based upon yearly water balance [25]. During a storm, this flow can increase by three orders of magnitude in a short time, thus explaining the high potential for severe floods to hit the study area.

2.2. Available Data, and Field Surveys

In Figure 3, we report a schematic of the adopted procedure, including main data availability, tools and software adopted, and main results. To build a 2D flood model for the area, we gathered a high-resolution Digital Terrain Model, and detailed information of the buildings. We collected and joined all the available data we could retrieve, here listed in Table 1, to create a 0.5 m resolution DTM of ISA. Namely, we could exploit:
(1)
River sections, measured in June 2019 during an in situ campaign of Politecnico personnel. Merging information of these sections, and assuming a constant slope, we used CAD and ARC GIS software to design a profile of the Rio Quibù, well approximating its track along the ISA area (Table 1).
(2)
Discharge data collected in situ during June 2019, used to validate river slope and roughness values, as given by in INRH.
(3)
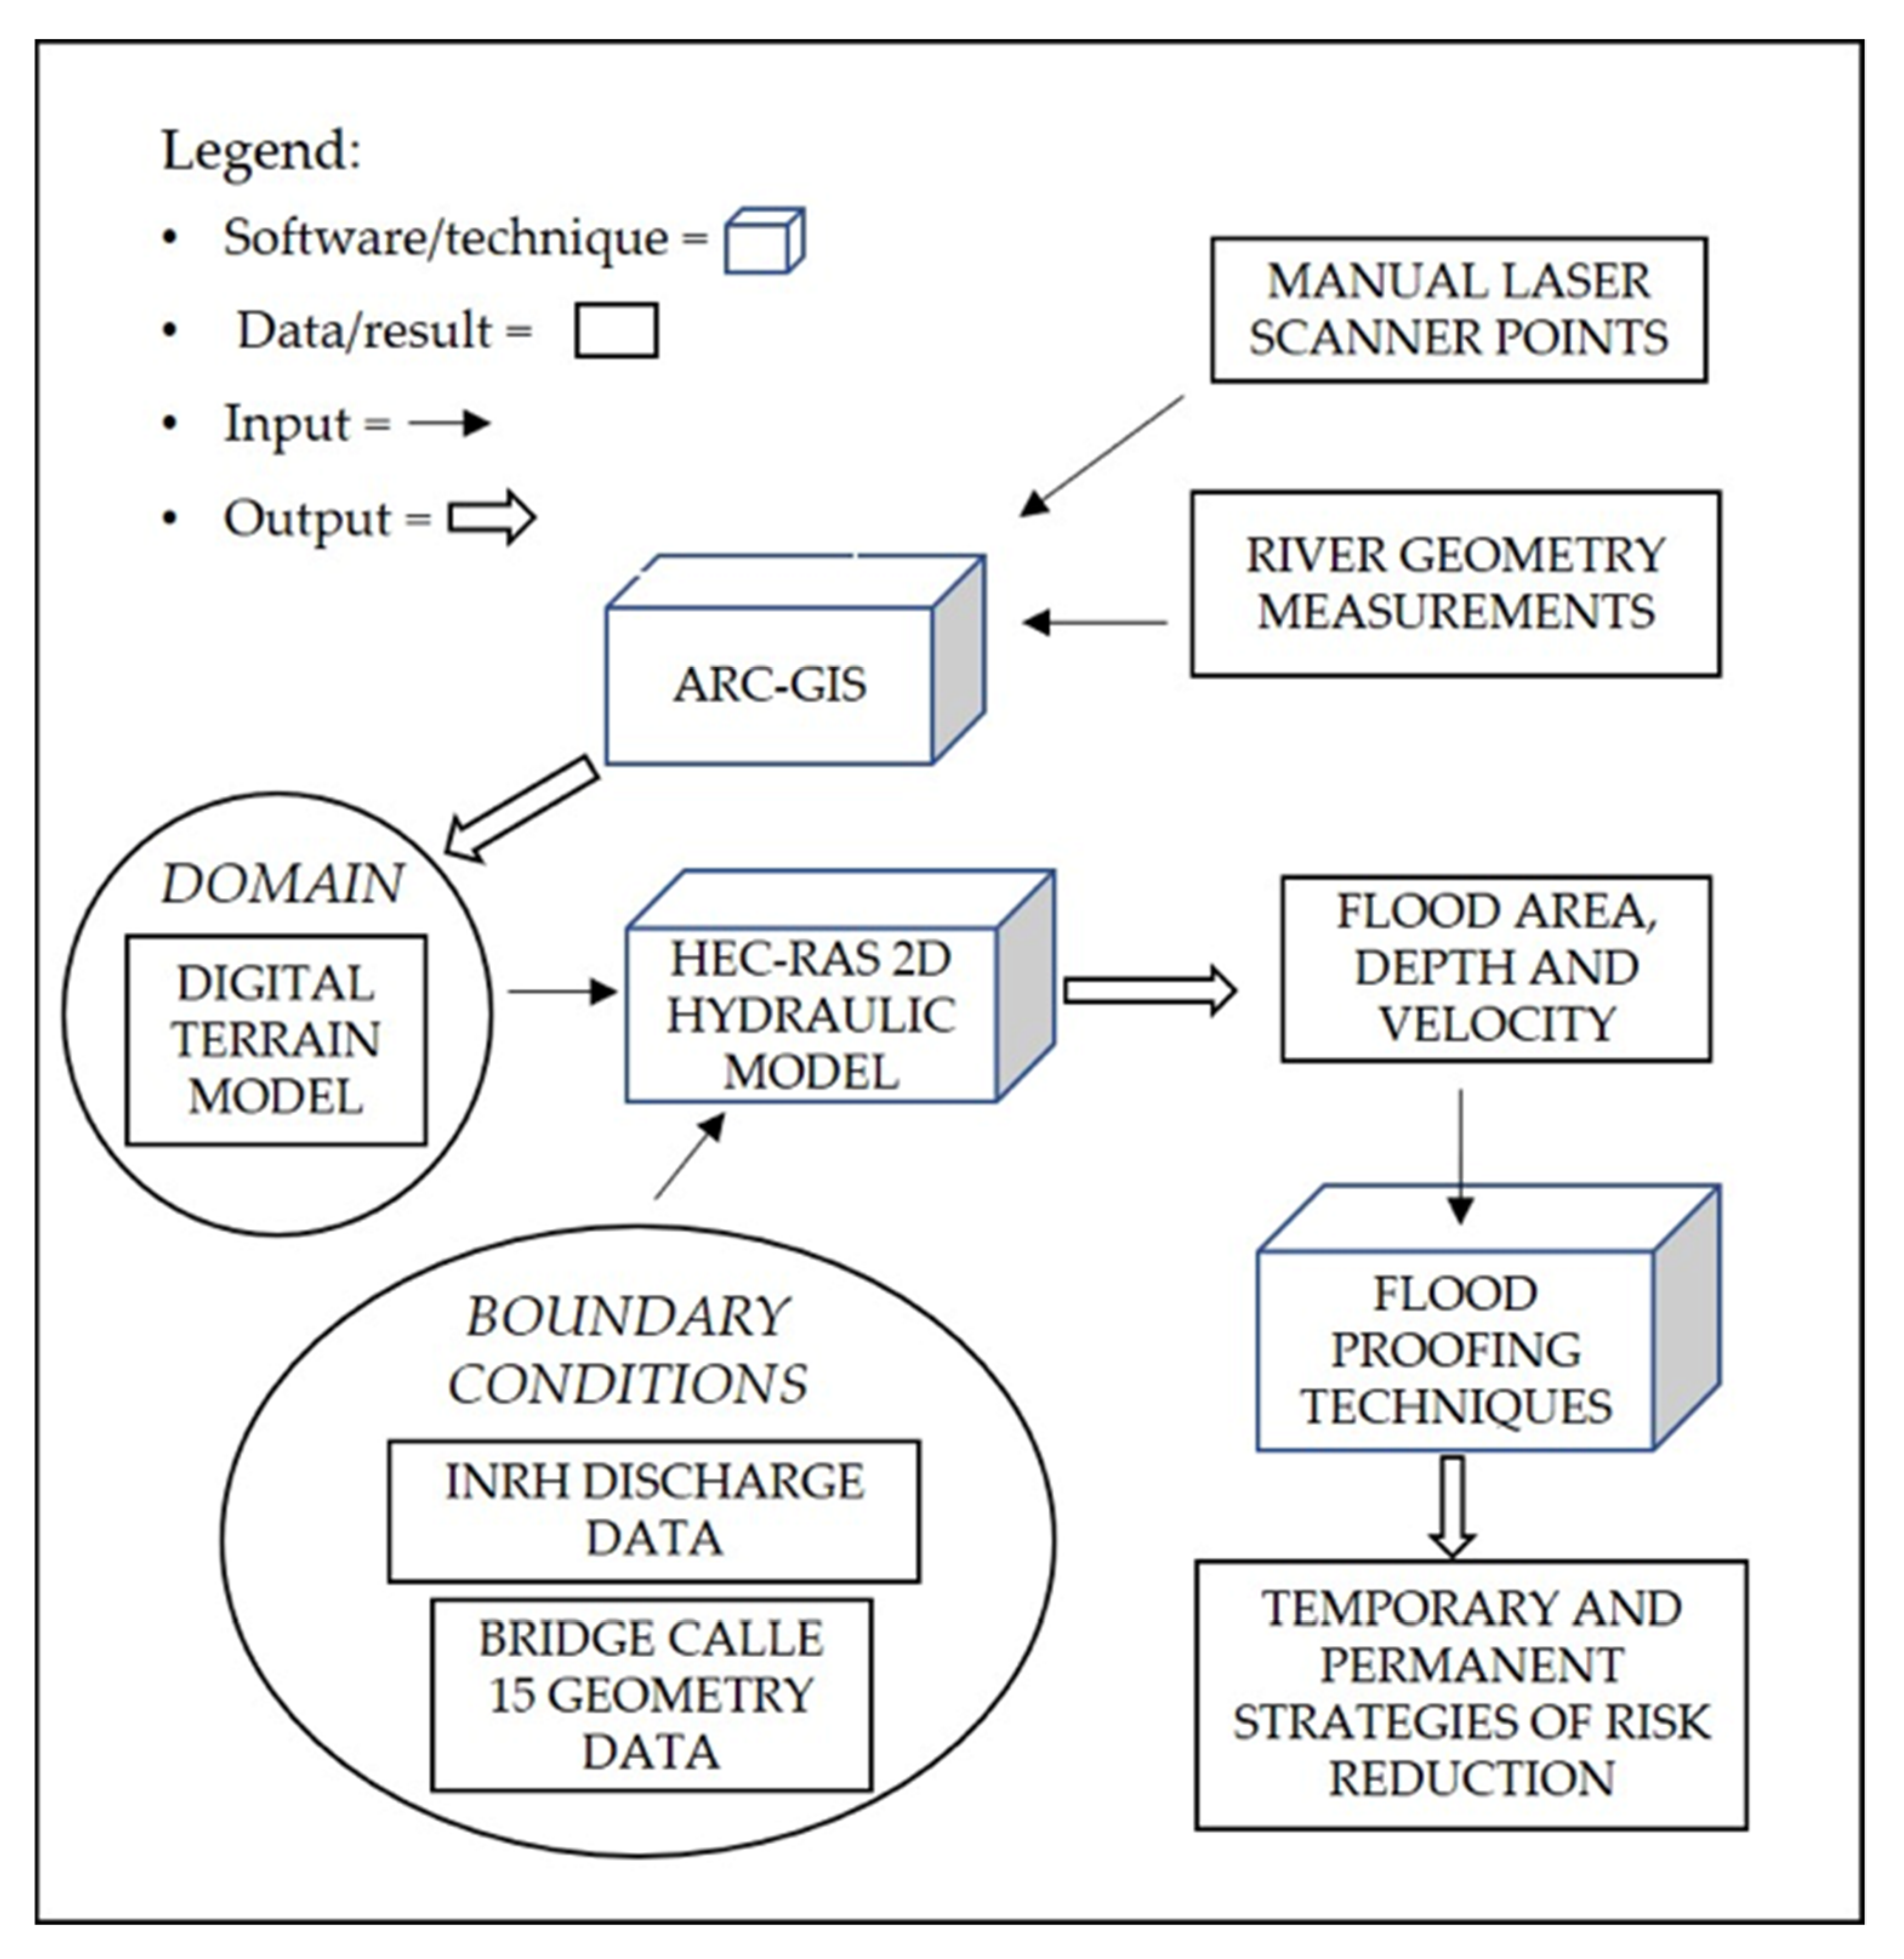
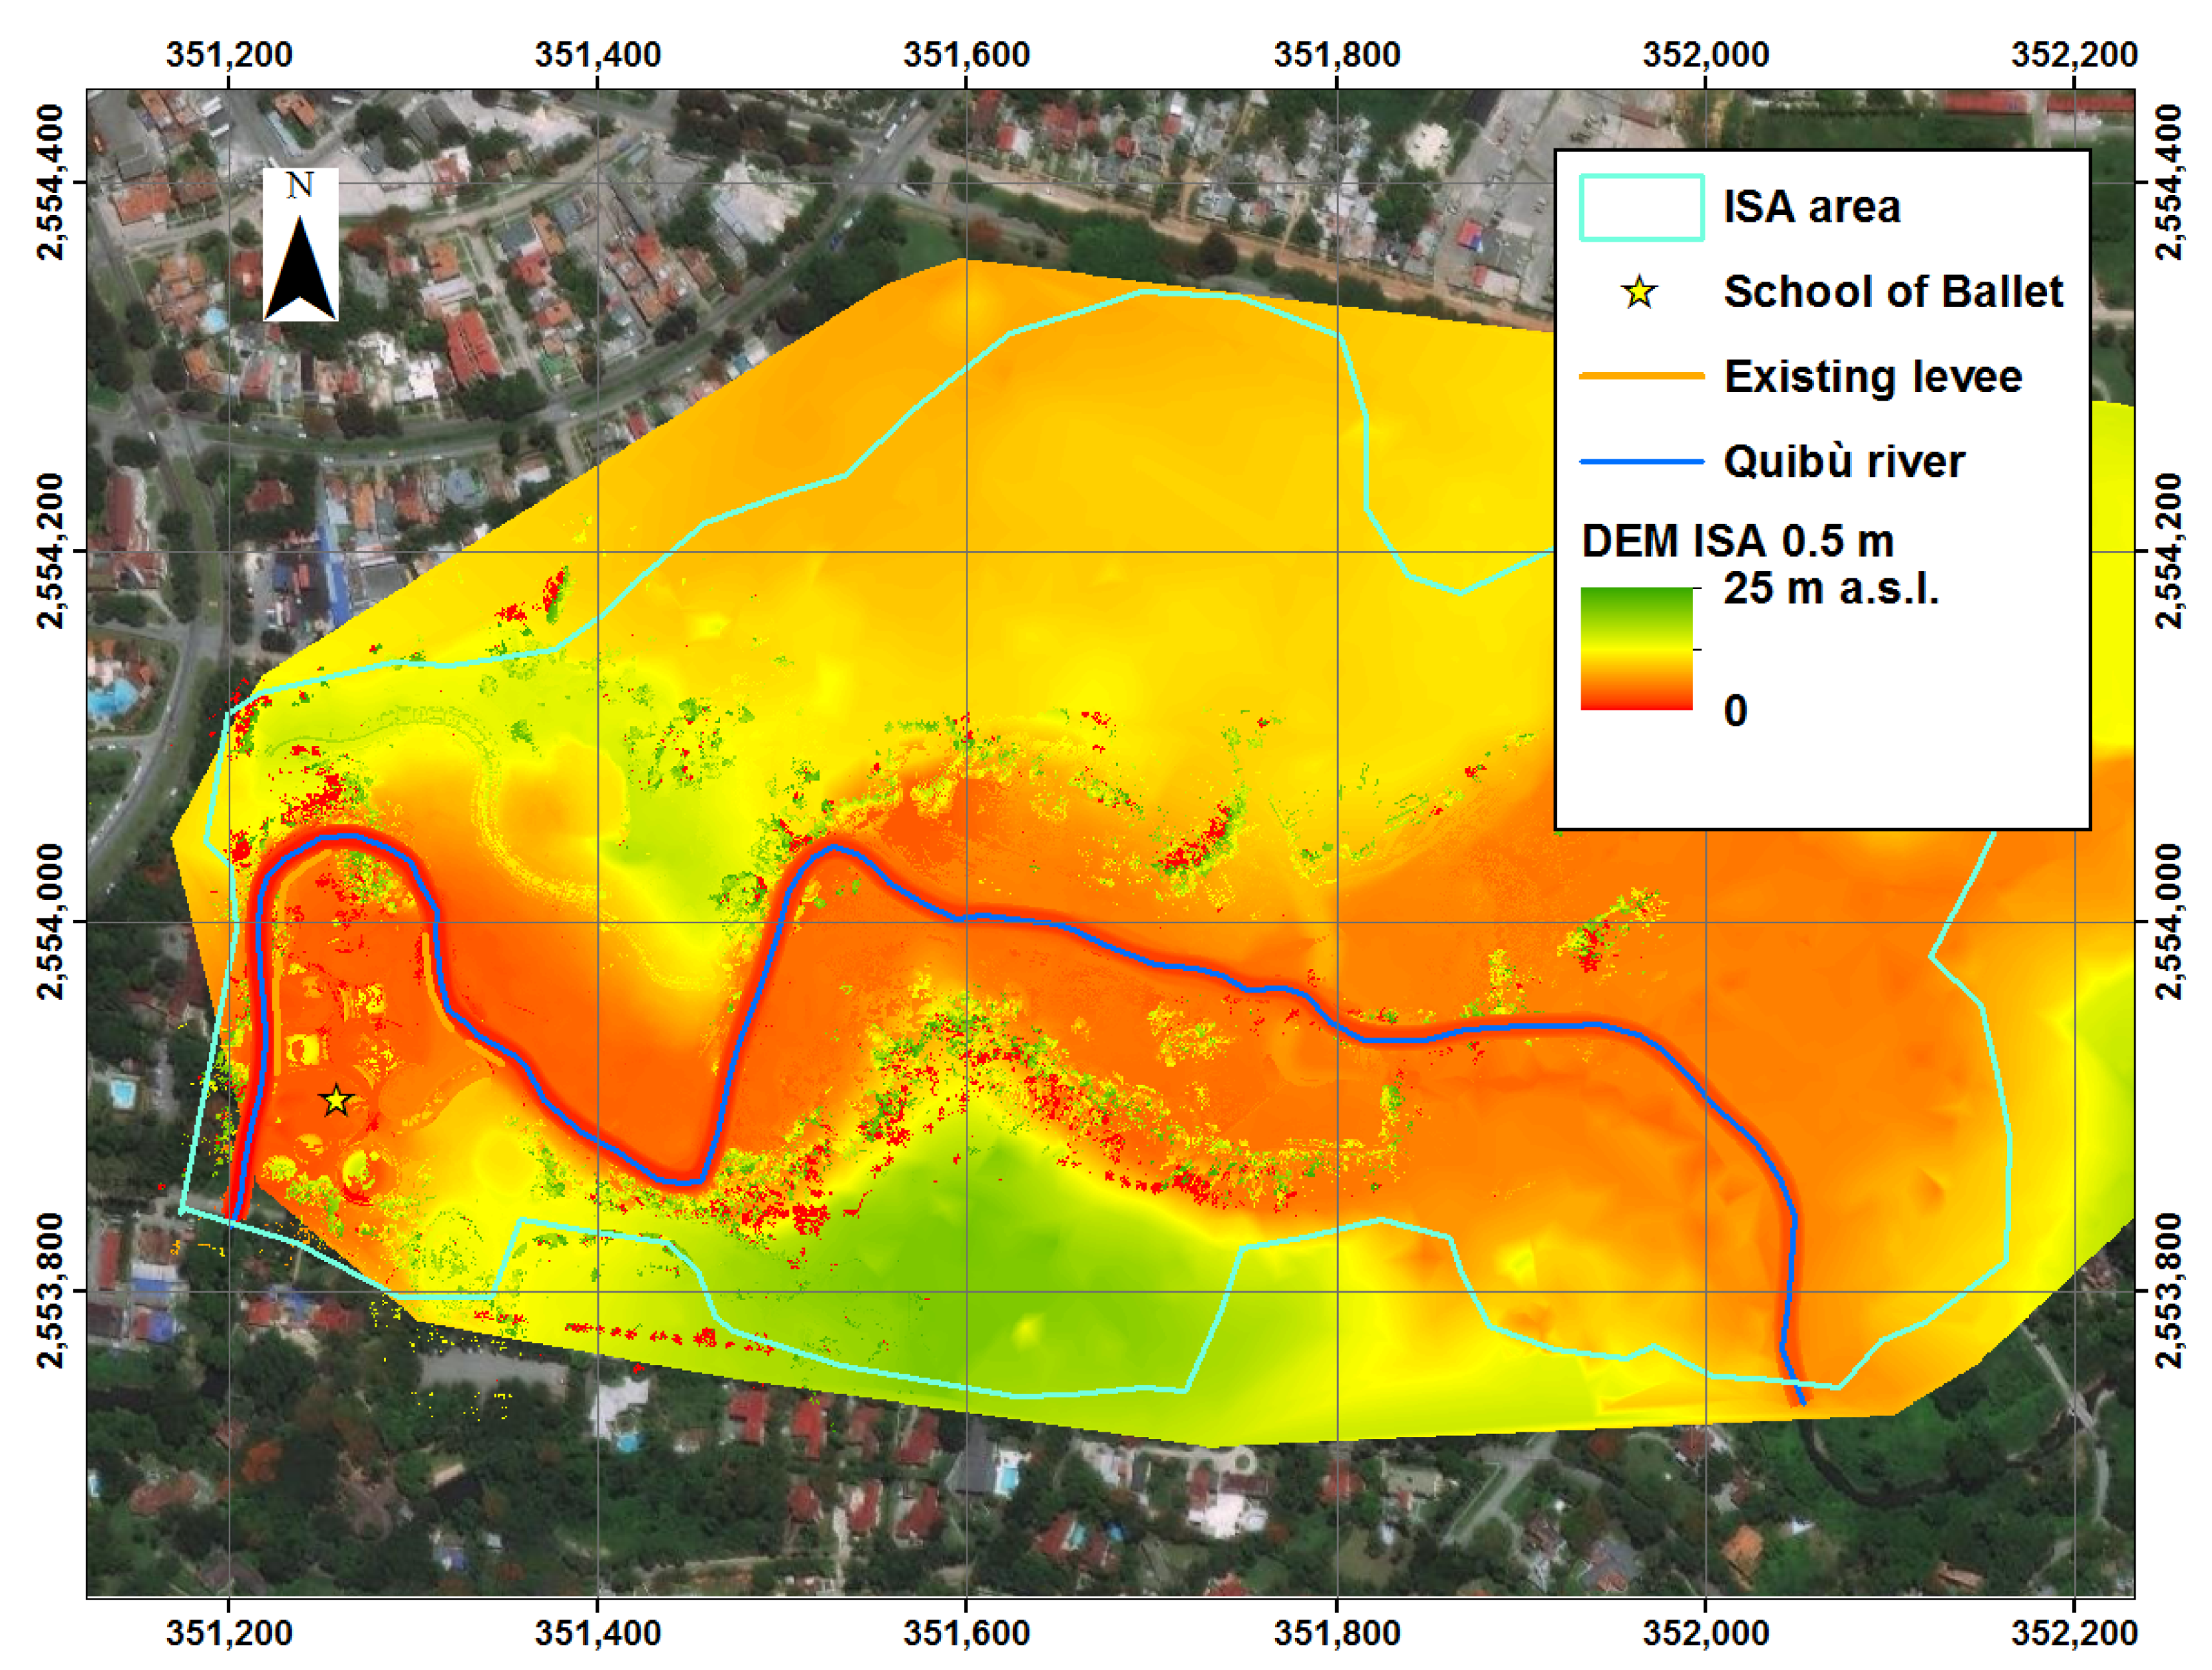
Geo-referenced points, obtained in situ using a manual laser scanner (Fall 2019). These were used to extract the 0.5 m resolution DEM for the whole ISA area (Figure 4), and for merging with the river track.
(4)
Design peak flow for 4 relevant return periods in several sections of Quibù, including the section of BR15, that we used as input for hydraulic model (Table 2), provided by INRH.
(5)
Hydraulic features of Quibù river, i.e., Manning coefficient and river-bed slope, that were also validated using the information collected in situ (Table 1).
(6)
Geometry of the bridges in the area, measured in situ in June 2019. Here we considered only BR15 (puente quince), since the other bridges were found not to affect significantly flood dynamic, upon preliminary analysis.
(7)
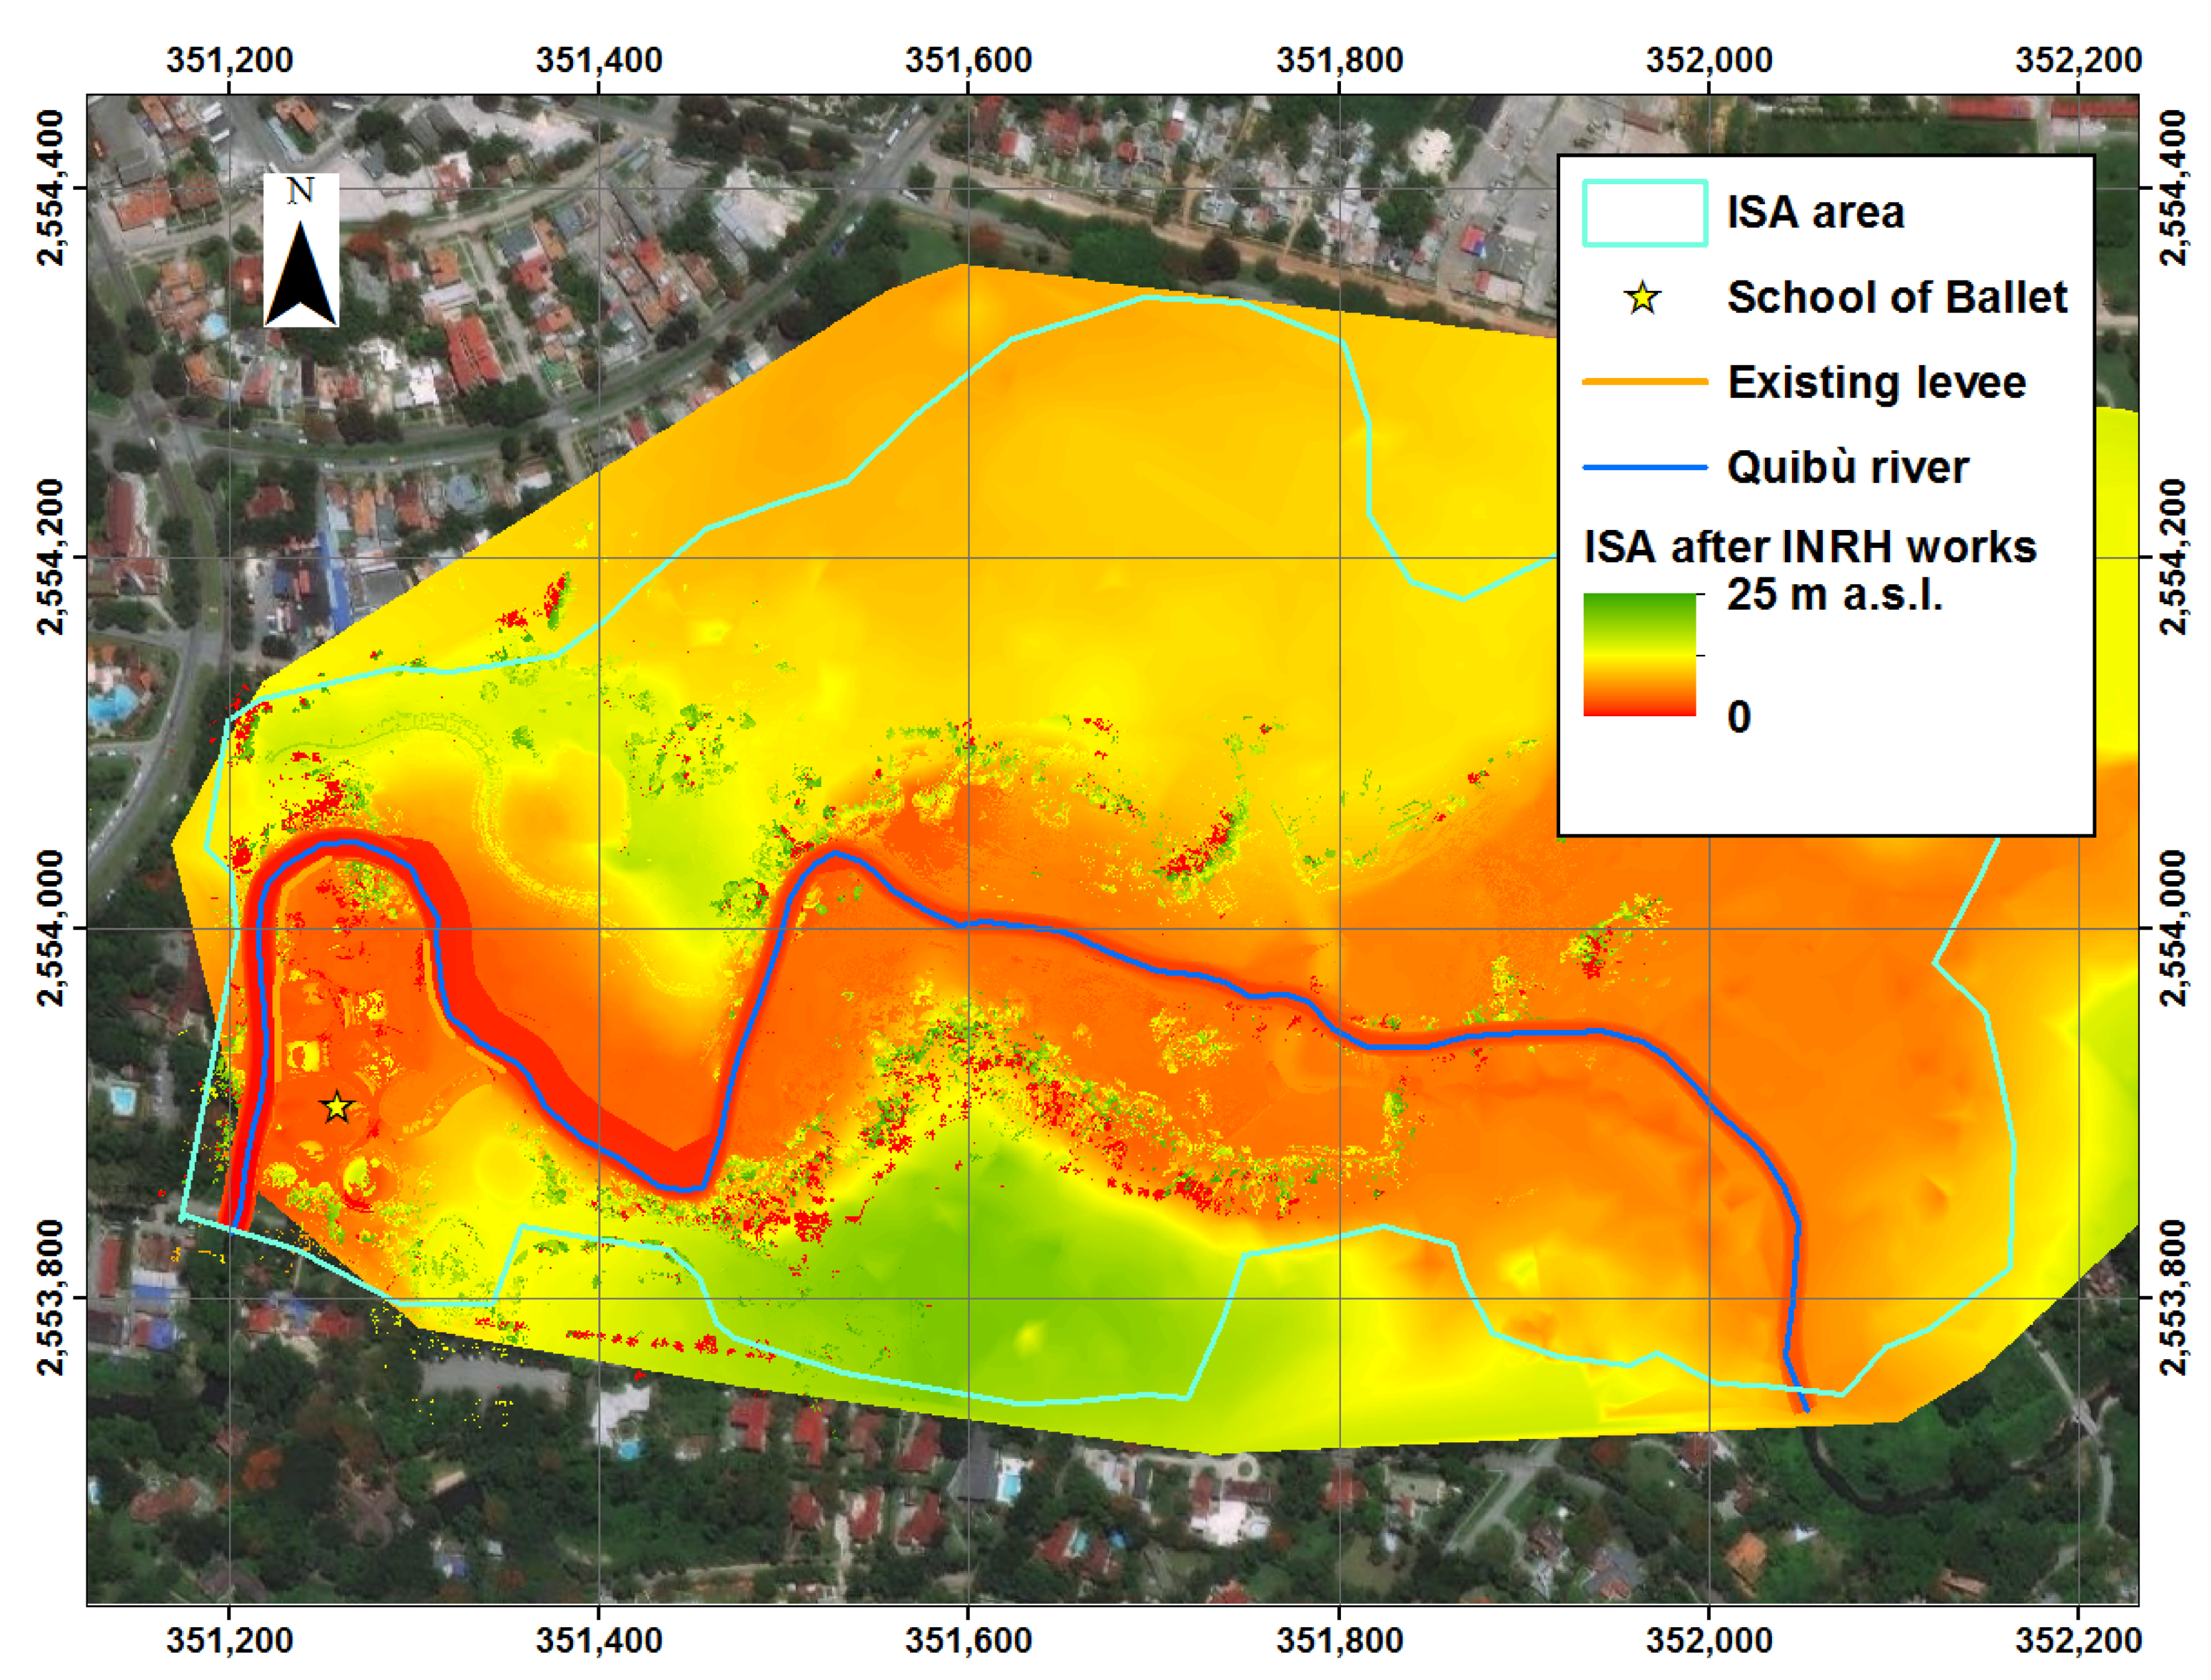
Designed river, and park geometry, also according to the adaptation measures as proposed by INRH, which we used to assess flood proofing (Table 2, and Figure 4 and Figure 5). INRH gave specific information only for the section below the bridge BR15. This bridge should be widened by 20 m in width, according to their project (Table 3). INRH personnel suggested widening of the river section, from 295 m to 529 m upstream bridge BR15, up to 20 m. Also, INRH personnel suggested that the river segment from 15 m to 295 m needs to be widened “as much as possible”. Since there is not much space for river works in this segment, unless by digging in the direction of the BS buildings, the largest river bottom width could be ca. 12 m (vs. the present 8 m).

2.3. 2D Flood Modelling

To build flooding maps for given flood scenarios, we used the software HEC-RAS 2D [26]. This software extrapolates from the input domain (here ISA DEM) a fixed resolution grid, where for each cell it integrates (2D) shallow water equations (SWEs) in the form
H t + ( hu ) x + ( hv ) y + q = 0   ;
u t + u u x + v u y = g H x + ν t ( 2 u x 2 + 2 u y 2 ) c f u   ;
v t + v v y + u v x = g H y + ν t ( 2 v x 2 + 2 v y 2 ) c f v
where q (ms−1) is the source term, here equal to 0, u, v (ms−1) are velocity components in plane directions x and y, respectively, H (m a.s.l.) is water surface elevation, z (m a.s.l.) is bottom elevation, h = H-z (m) is water depth, g (ms−2) is gravity, cf (s−1) is bottom friction coefficient, vt (.) is a horizontal eddy viscosity coefficient. Since we had no previous information of flood evolution (i.e., hydrograph) during a real-world event, we implemented HEC-RAS 2D until it reached steady state, i.e., no significant variation of flow velocity was detected. In so doing, we were able to neglect the Courant Friedrichs Levy (CFL) condition, necessary for the stability of the solution in some partial derivative equations PDEs, like indeed SWEs. CFL is respected for given values of the Courant number Cf = VwT/∆X, with ∆X grid size (1 m here), ∆T time step (0.5 s here), and Vw wave velocity. Namely, one should have Cf < 1 to avoid instability of the solution. Since we input a constant discharge, by the time we reach steady conditions, Vw will tend to 0 everywhere in the domain, and Courant number will become very small, so giving consistent result. Due to the nature of the landscape, with little bed slope (ca. 0.2%), and the presence of structures, such as bridges, culverts, etc. the flow is subcritical, with Froude number (evaluated a posteriori) mostly smaller than 0.5. Thereby, the SWE equations can be simplified via diffusion wave equations (DSW), i.e., the inertial terms can be neglected.
H t + ( hu ) x + ( hv ) y + q = 0
g H x ν t ( 2 u x 2 + 2 u y 2 ) + c f u = 0
g H y ν t ( 2 v x 2 + 2 v y 2 ) + c f v = 0
HEC-RAS uses the Crank–Nicolson method (7), based on the trapezoidal rule, which, if coefficient θ is equal to 1 as in our case, leads to a backward Euler scheme (8):
Ω ( H n + 1 ) + j a j ( ( 1 θ ) H j n + θ H j n + 1 ) = Ω ( H n ) ,
Ω ( H n + 1 ) + j a j H j n + 1 = Ω ( H n )
where Ω ( H n ) is water volume in cell n as a function of water level H, and the coefficients αi are a function of Δt. Since this scheme is implicit, HEC-RAS 2D uses a Newton-like algorithm, to solve the equations iteratively, to provide water level H (maximum number of iterations equal to 20 and water surface output resolution equal to 3 mm). We used as boundary conditions (i) upstream, constant discharge for the 4 design flows for BR15 by INRH, and (ii) downstream, constant water level. As reported, the ISA area is limited downstream by BR15, which we expect to cause backwater. Since HEC-RAS 2D does not easily account for bridges, and other hydraulic structures, we proceeded as follows. We built a preliminary, 1D steady model, where structures like bridges, and culverts can be more easily incorporated. In so doing, we performed a steady 1D simulation, which we used to evaluate the water table (m a.s.l.) upstream BR15. We subsequently used such a water table as a boundary condition for the 2D model.
Since flow is always subcritical (Froude < 1) within our tested range of discharges, it is necessary to assess downstream boundary conditions for the 1D model. The Rio Quibù outlet at sea is ca. 1.4 km downstream ISA, so we verified the possible impact of high tide on water level downstream of BR15. Considering a high tide of 0.60 m as suggested by INRH, the corresponding backwater does not affect (i.e., it is lower than critical depth therein) flow at BR15. Given these assumptions, we used a conservative boundary condition for the 1D model the uniform flow depth with slope of 0.1%. This value is lower than that used for ISA (0.2%). The riverbed at the puente quince is at ca. 0 m a.s.l., and during the in-situ campaign in 2019, we measured water depth at the outlet, no deeper than 2 m.

3. Results

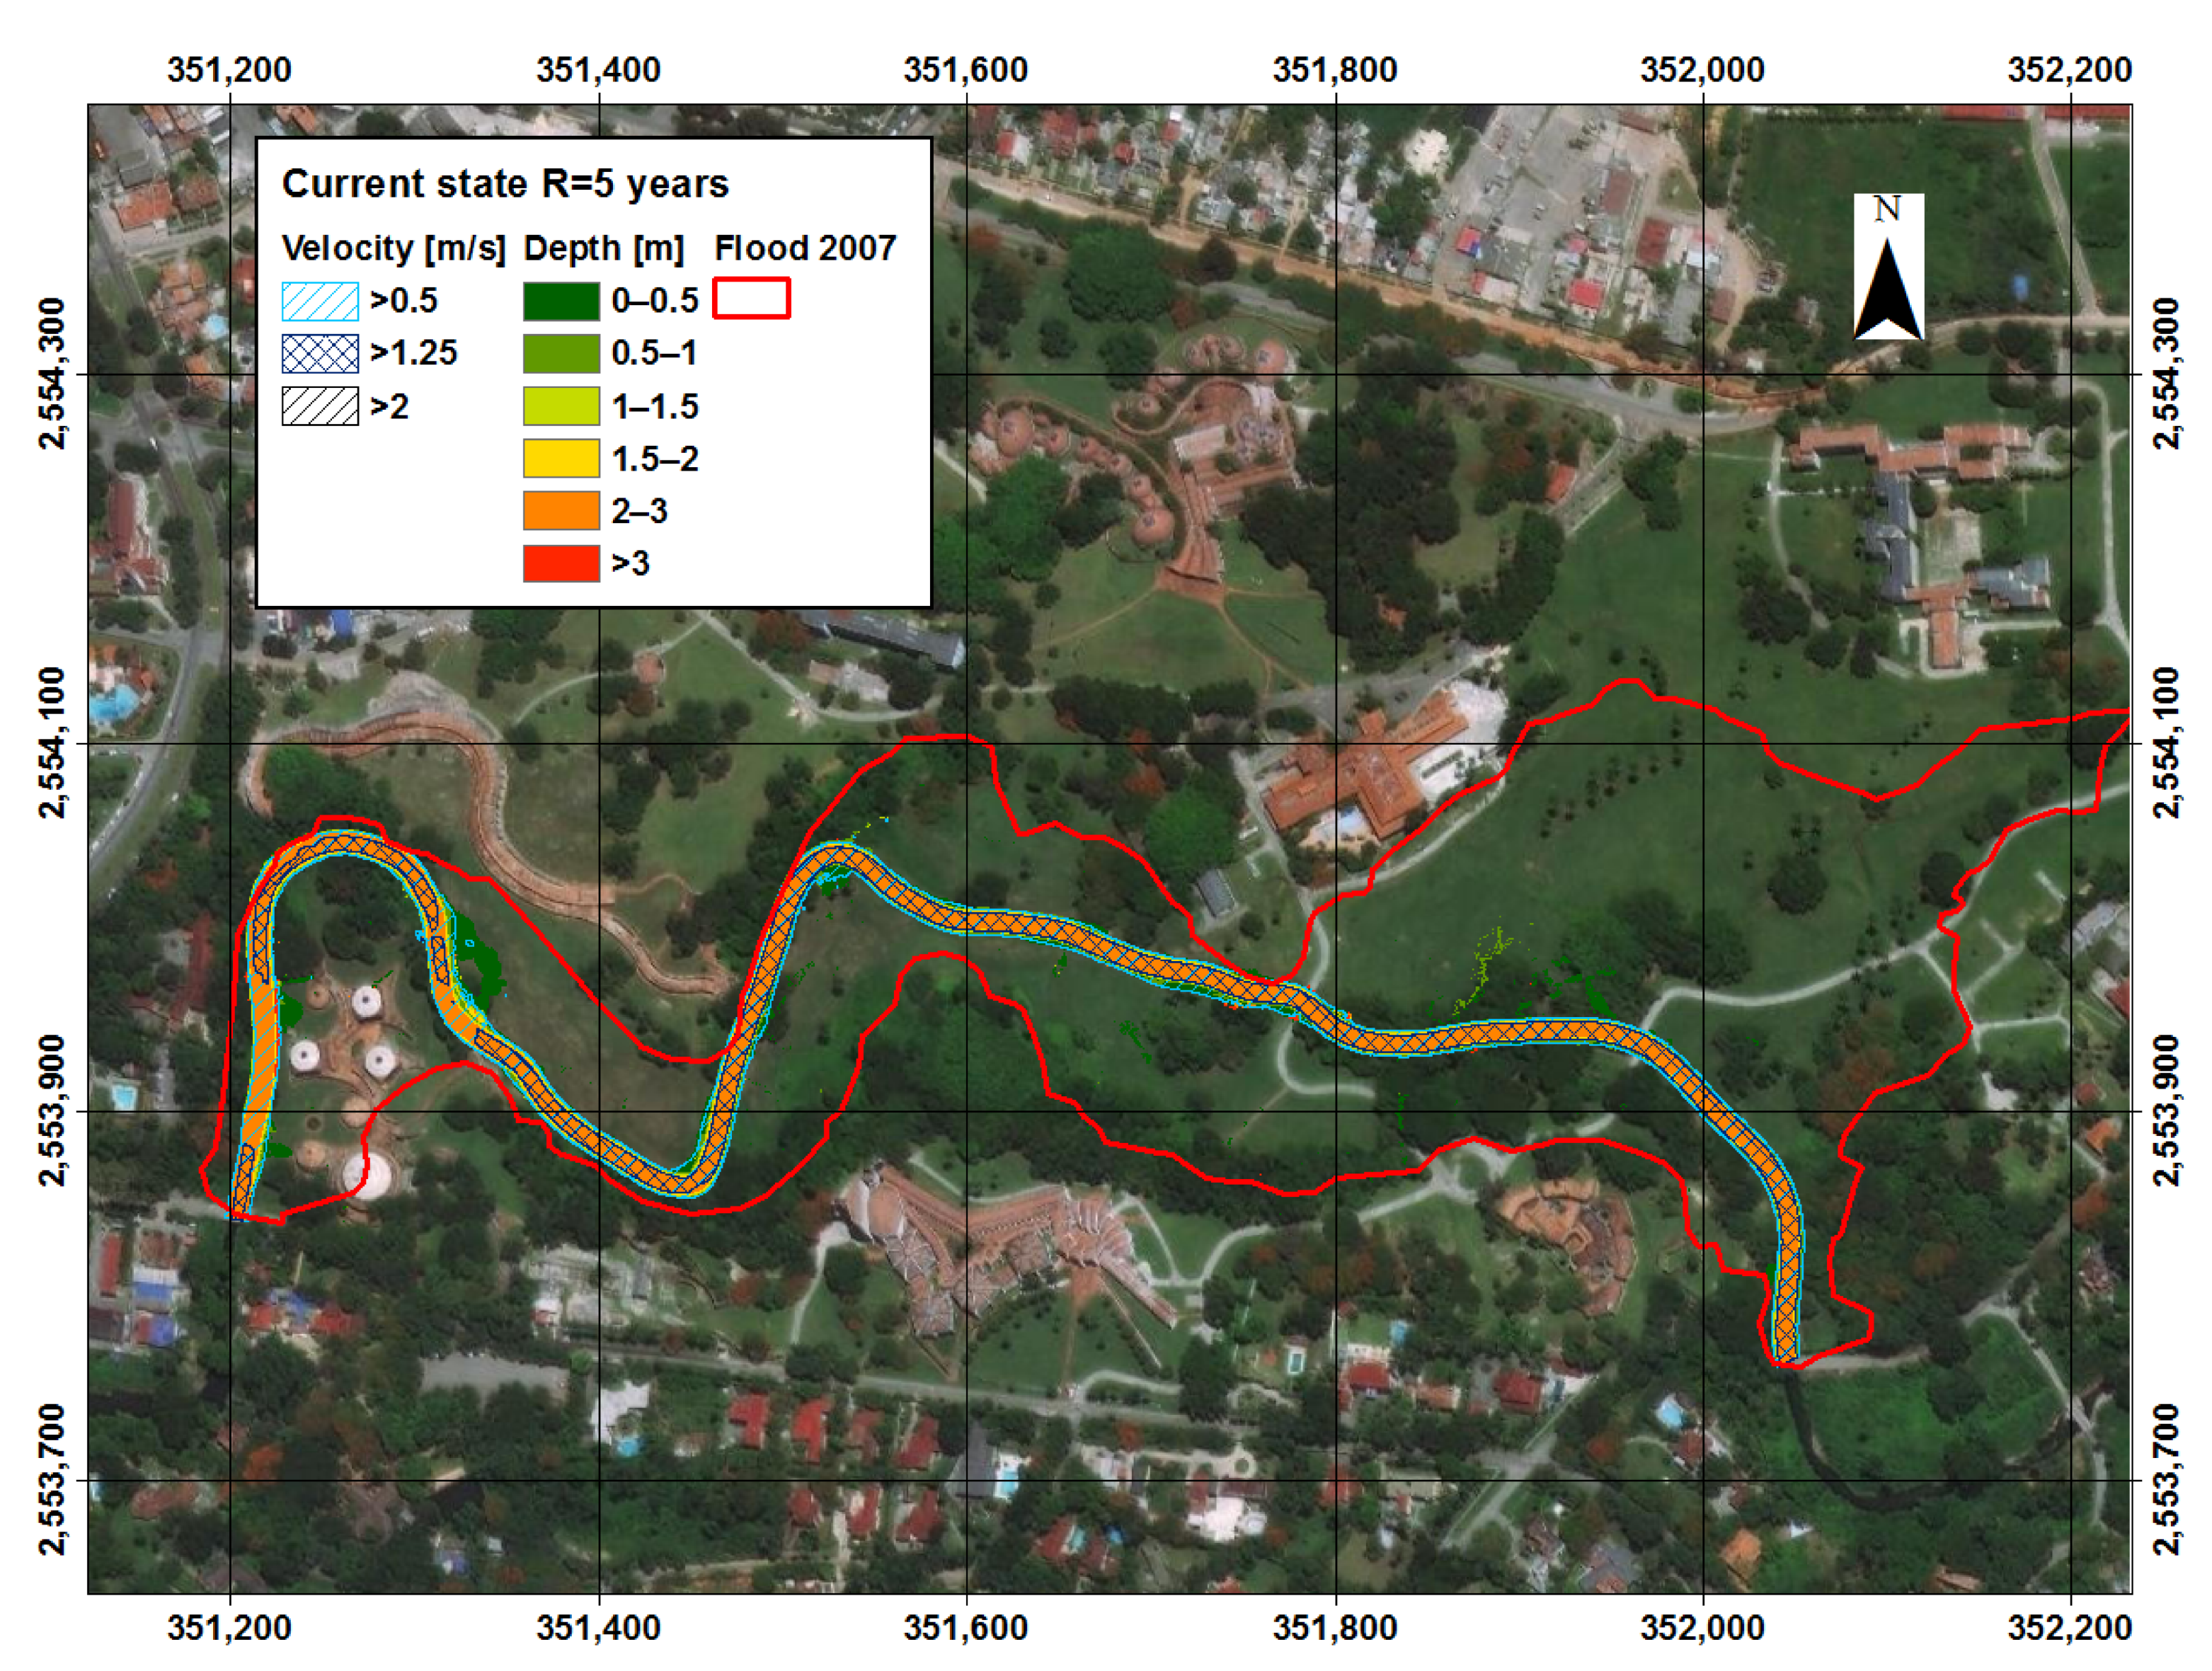
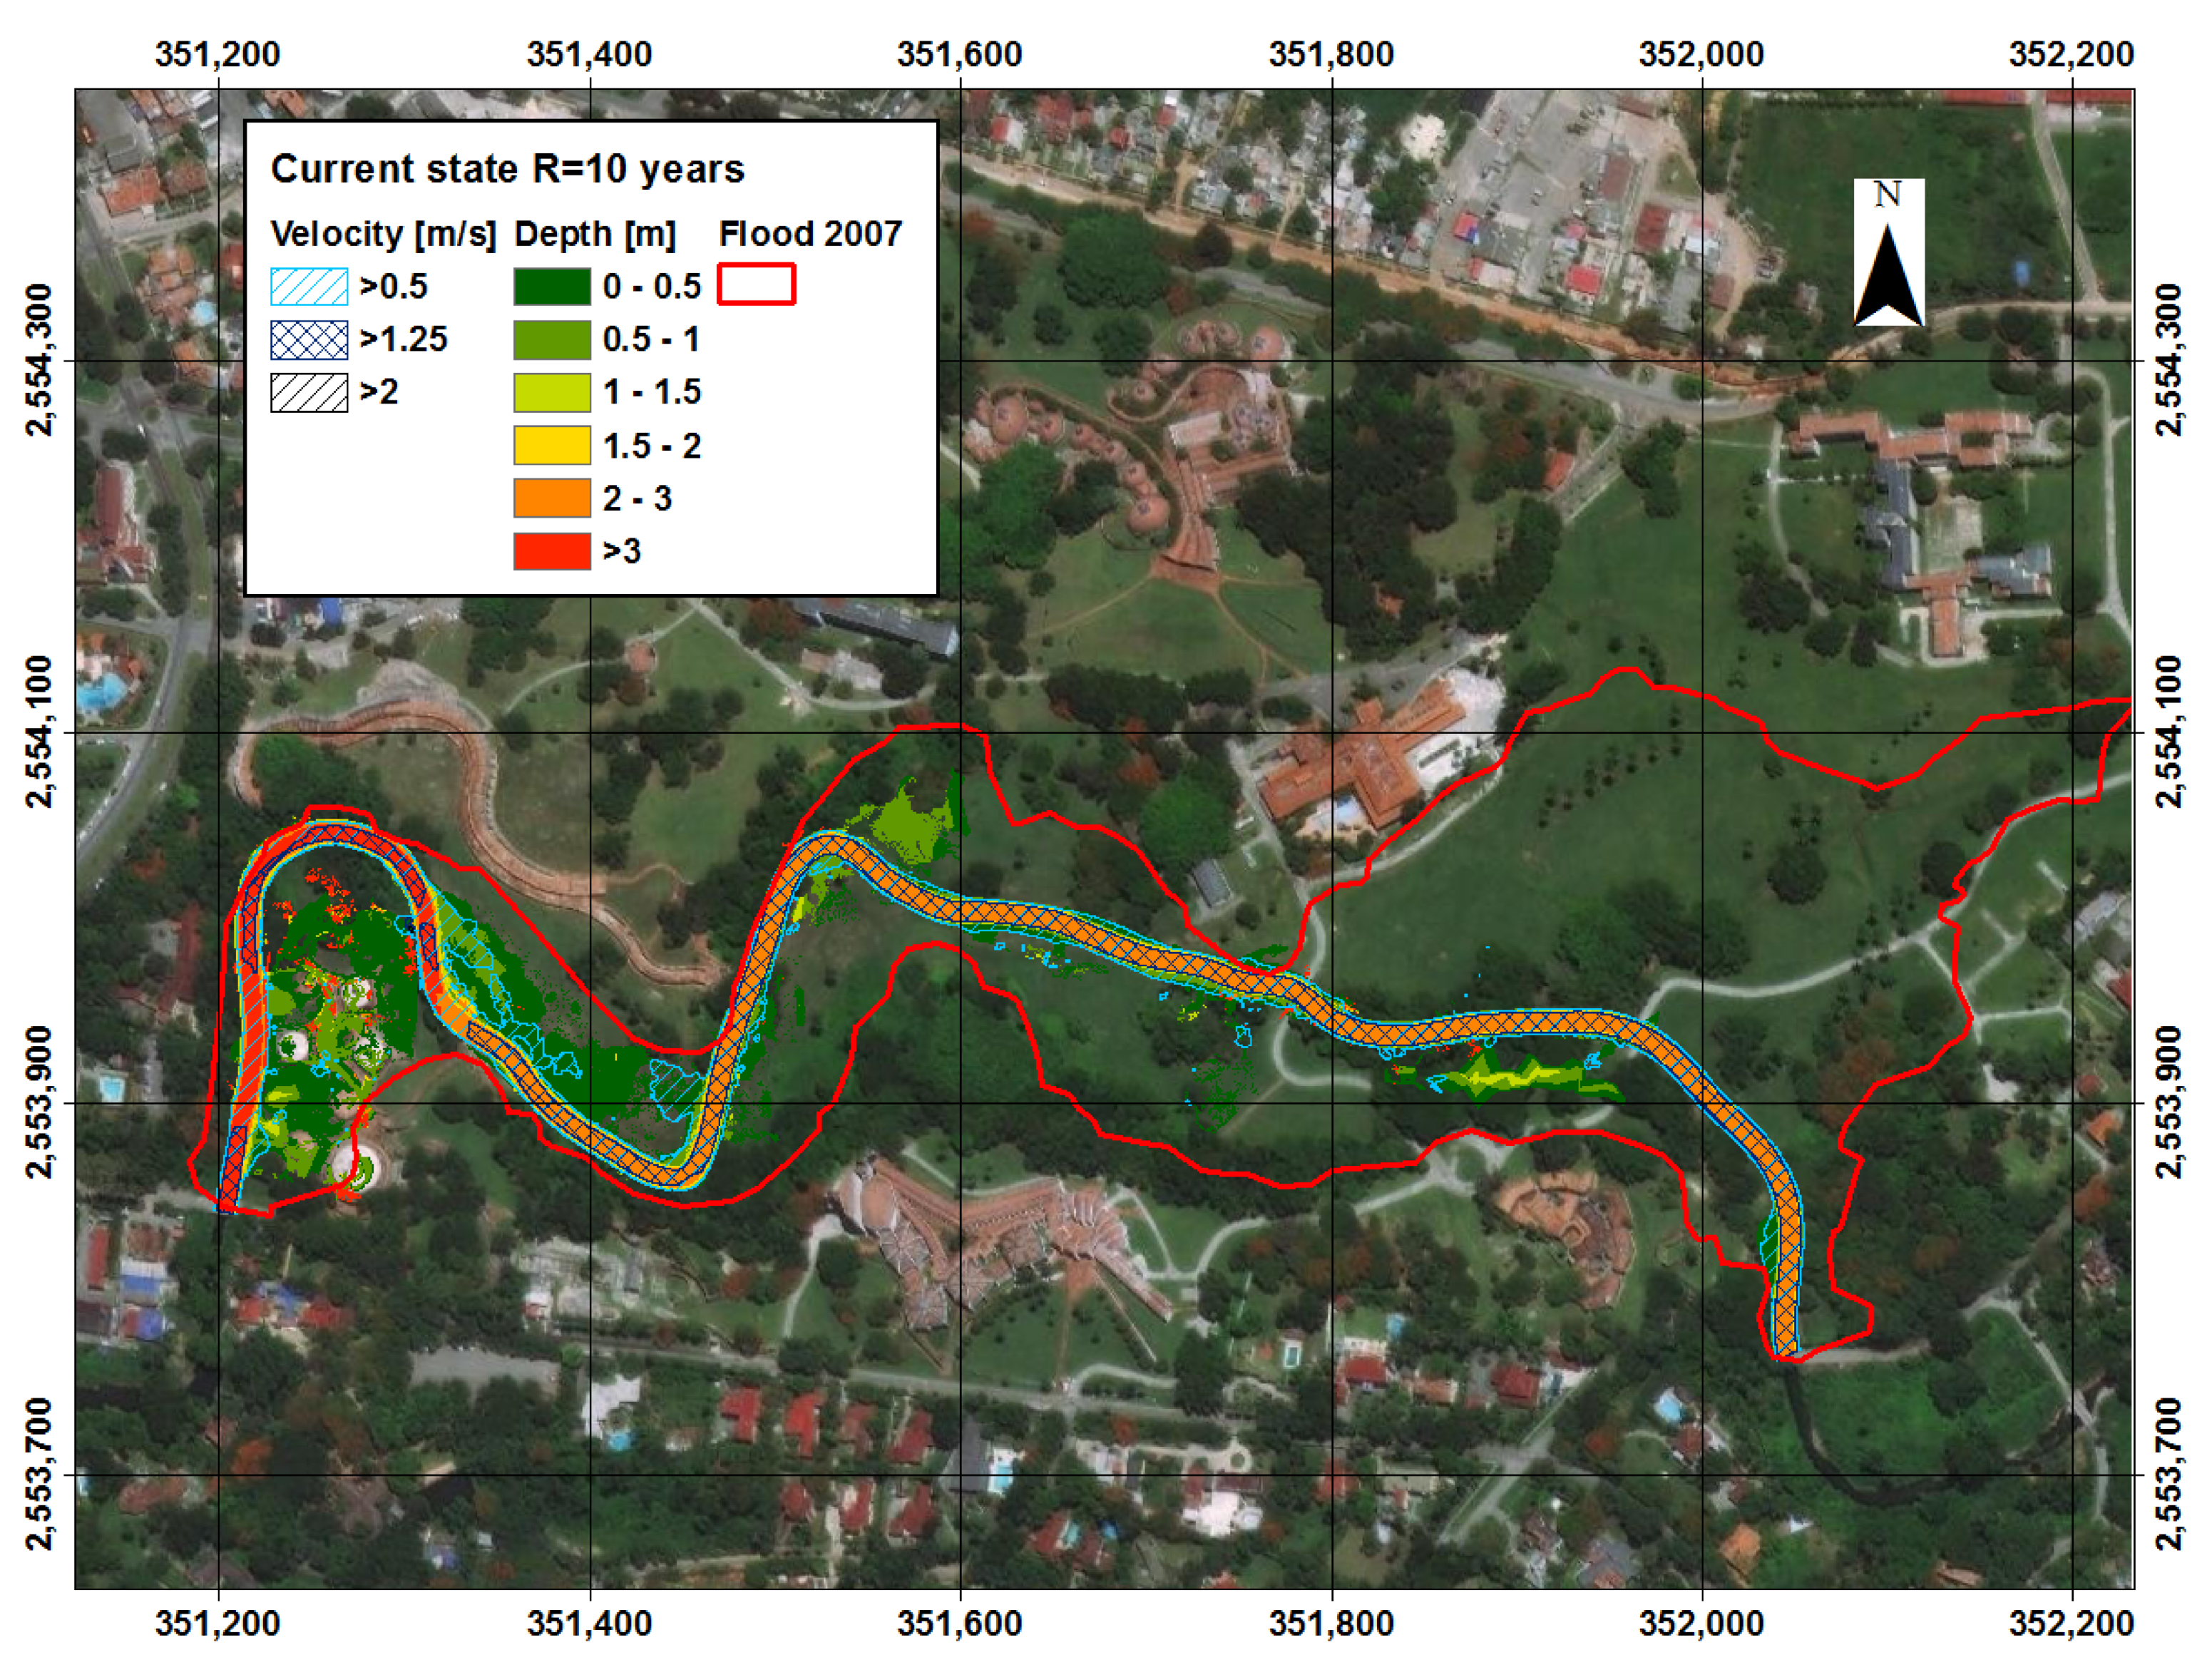
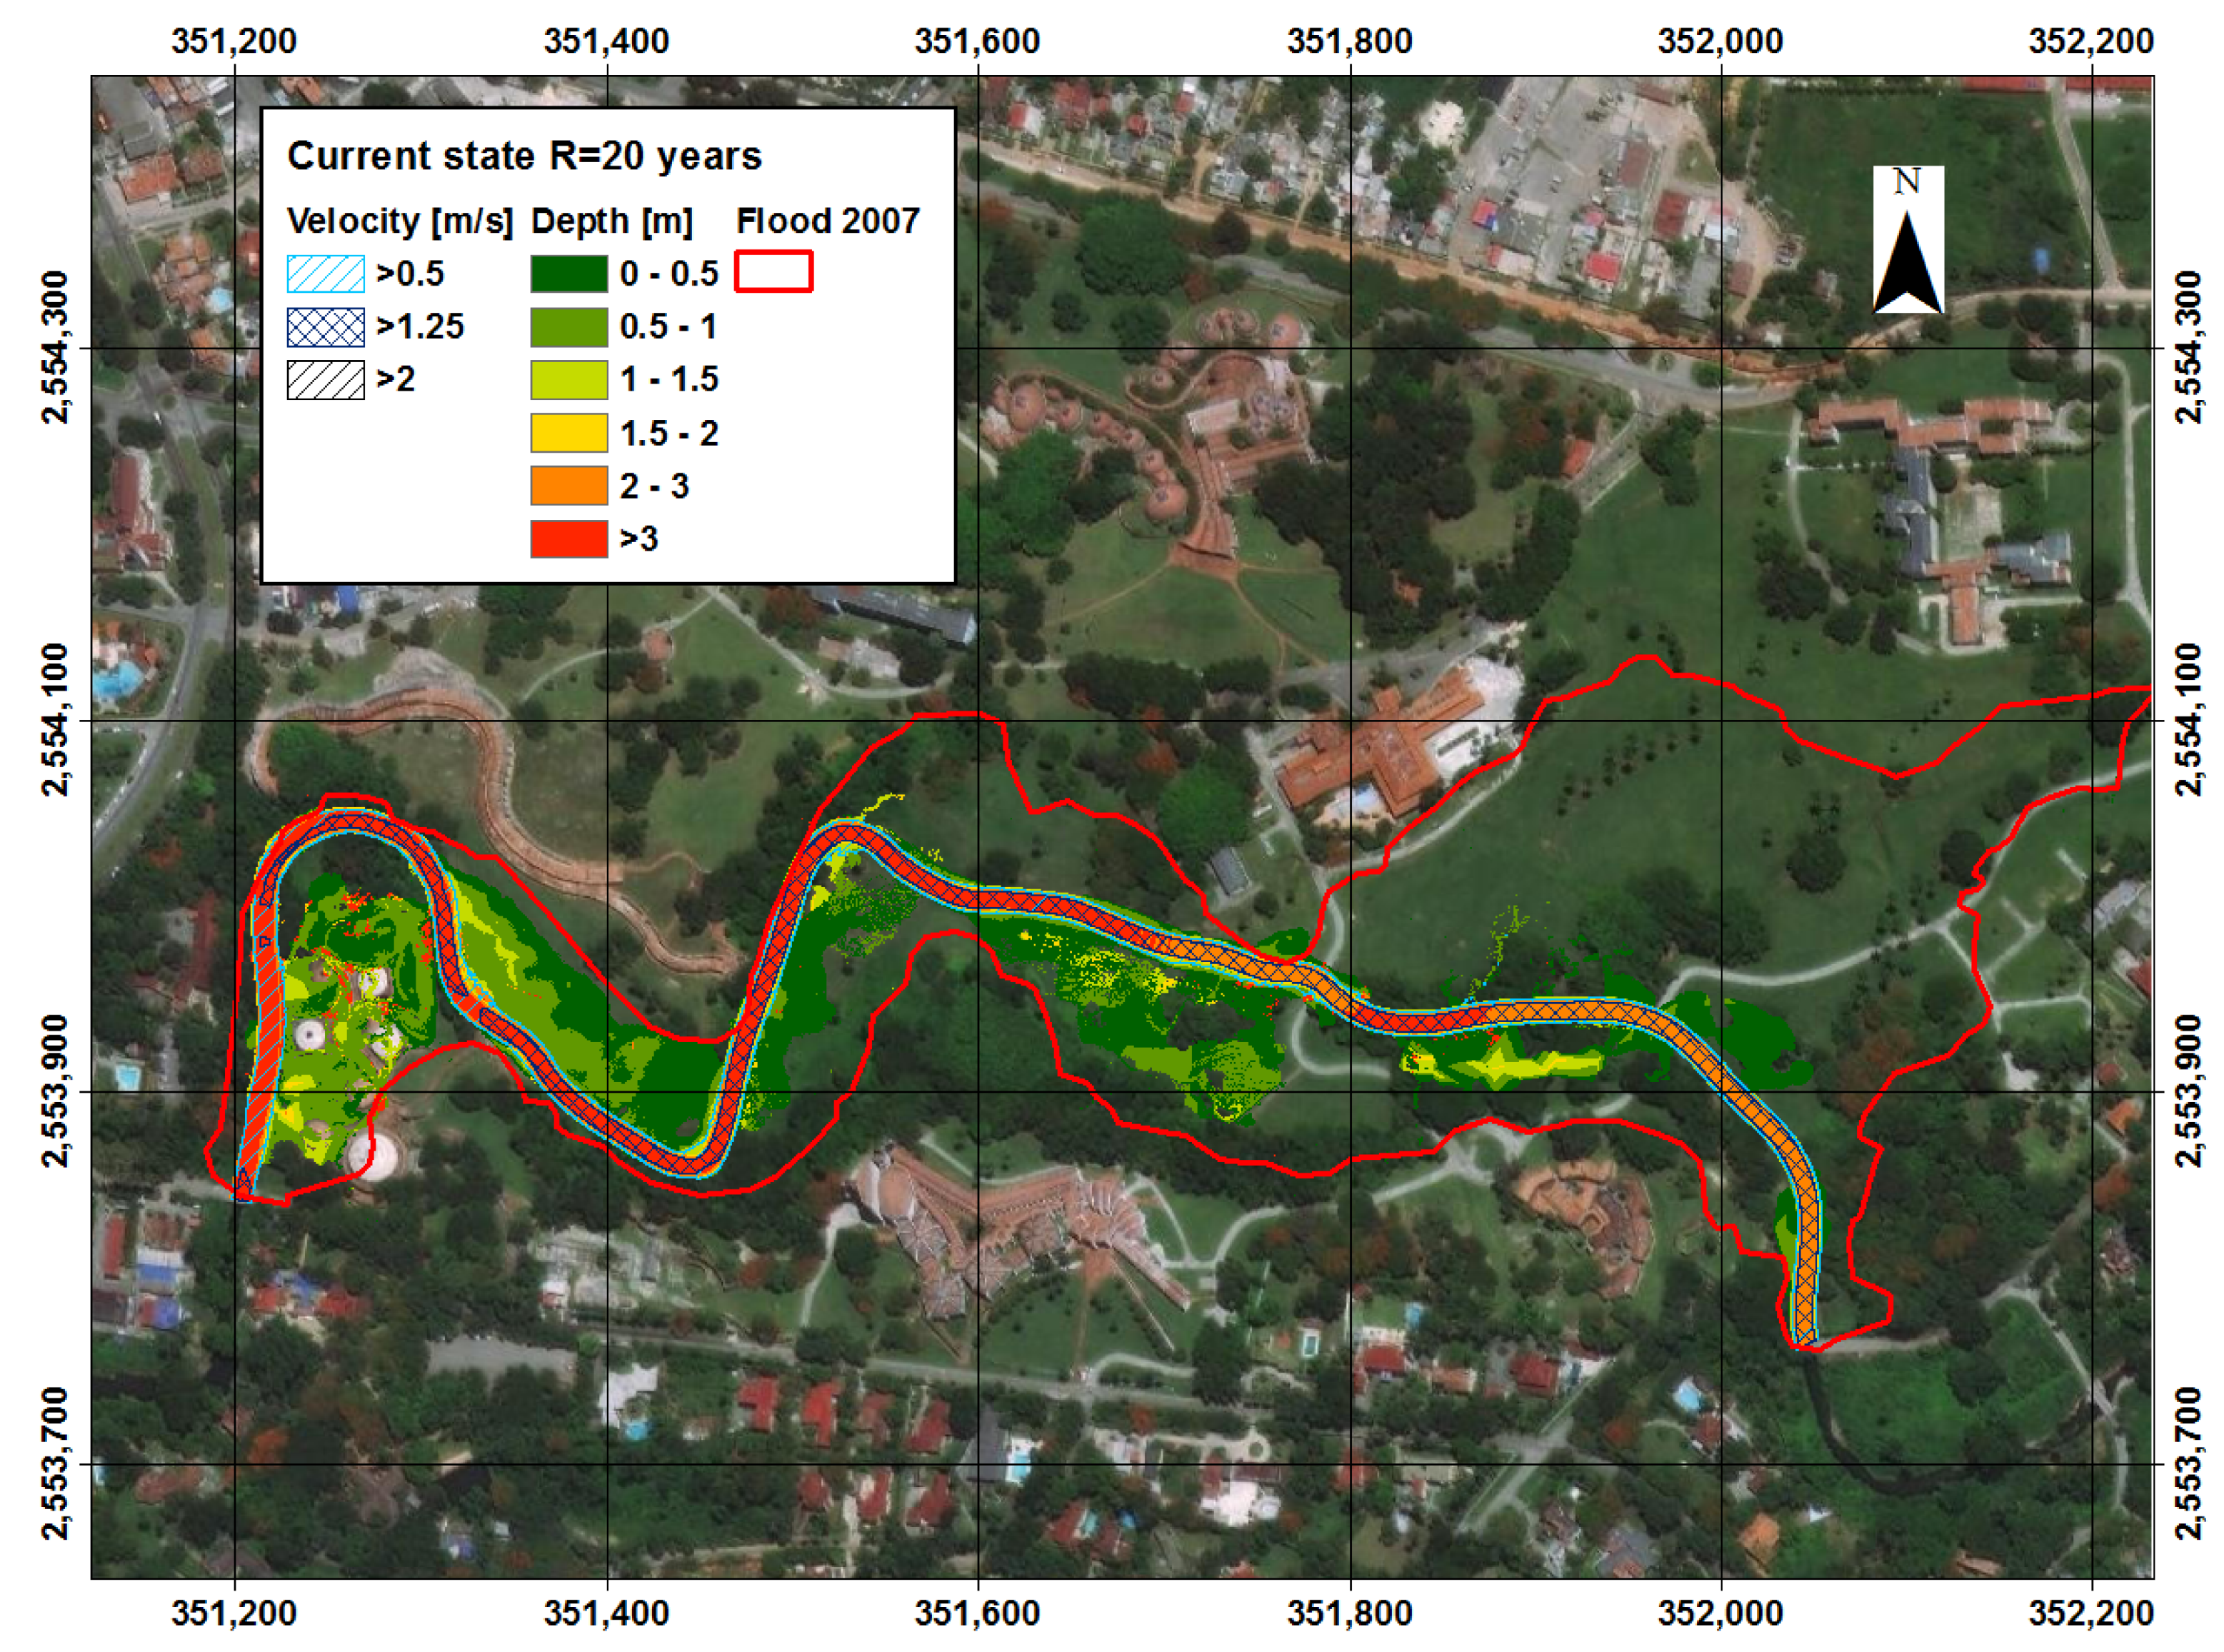
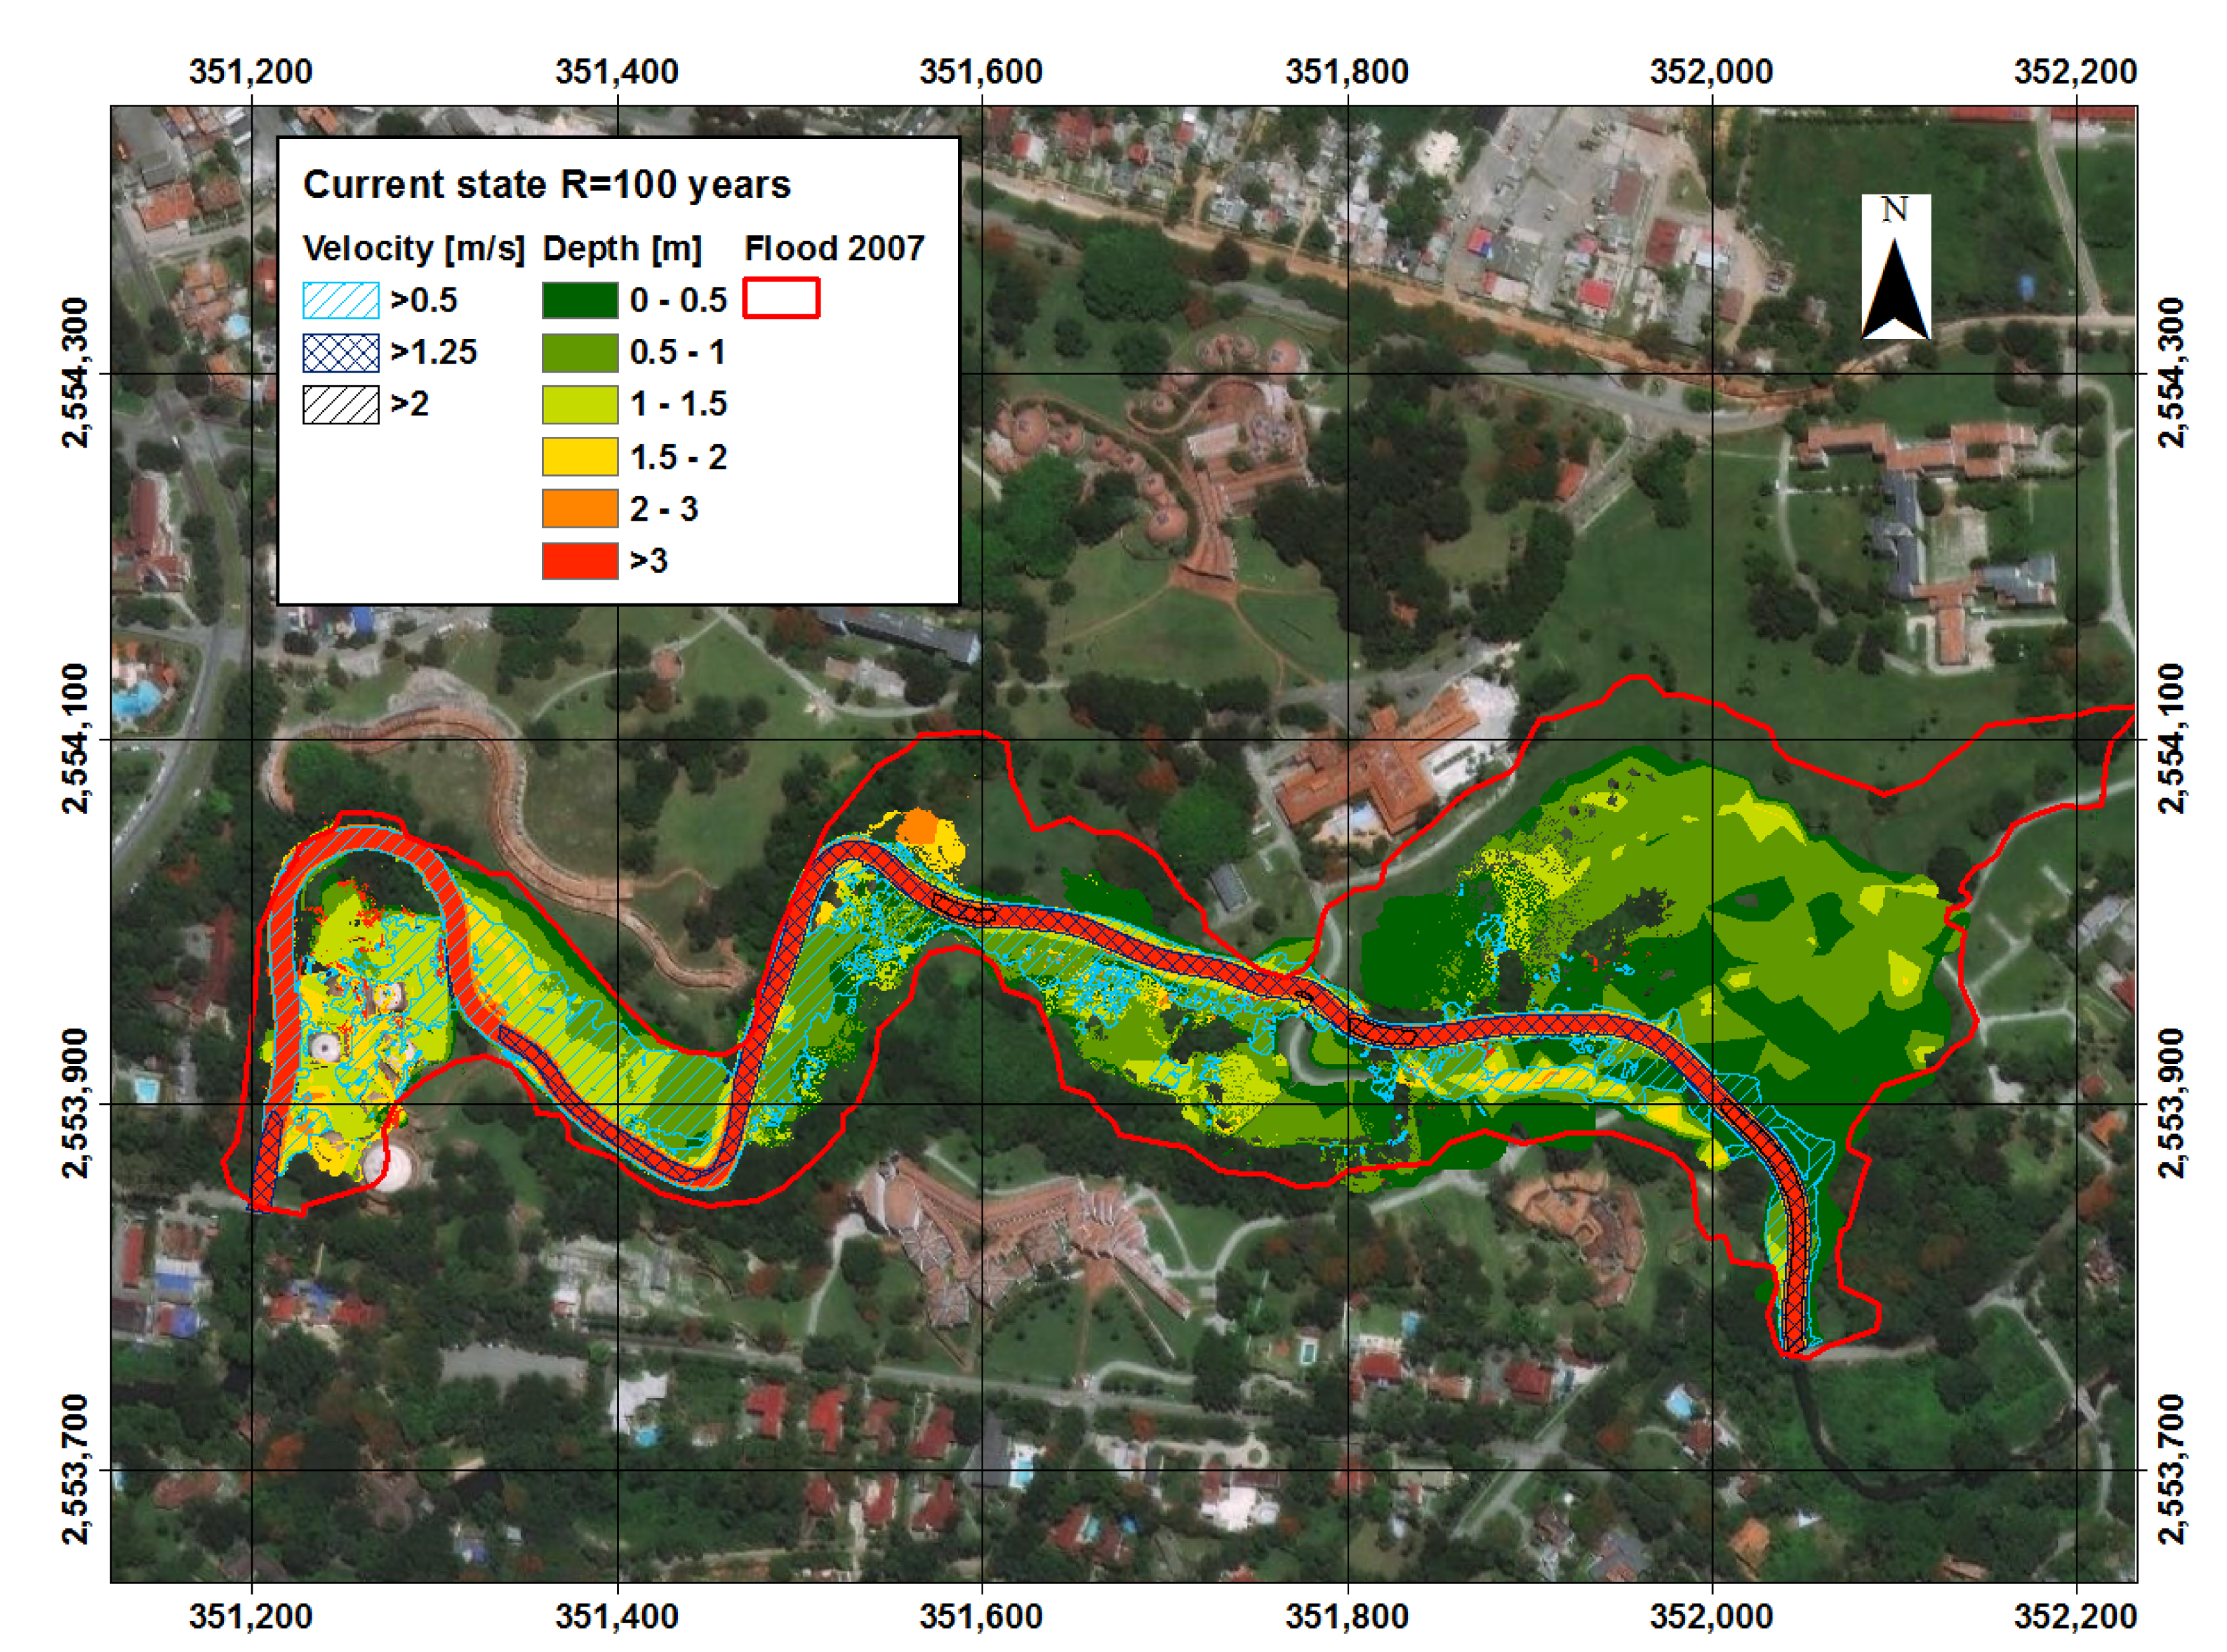
3.1. Present Flood Risk in ISA

The HEC-RAS 2D software performed well and reached a steady state condition in ca. two hours. In the first few minutes of the simulation, the results were quite unrealistic, with a vertical front of the wave spreading slowly into the park area. Due to this initial wave, a large area of ISA is flooded, and while most of this initial flooding water is returned into the Rio Quibù river soon enough, some of that water is collected by local soil depressions, and stagnates therein, increasing the flooded area. To avoid such issue, it was necessary to use a filter, to eliminate flooded area where velocity is close to 0 (0.02 ms−1 was found as a good trade-off). Figure 6, Figure 7, Figure 8 and Figure 9 report the so obtained velocity profiles and water depth (i.e., the largest values obtained during the simulation) for the current state of ISA (i.e., with river levee partially collapsed, and present size of Rio Quibù channel, Figure 4). It is also shown the reconstructed flood area for an event occurred in 2007, that will be discussed further on. In the scenario with R = 5 years of return period there is no flooding in the BS area, while for the three other scenarios (R = 10, 20, 100 years) the SB is reached by flooding water. The partial (i.e., damaged) wall, as expected, does not prevent the area from inundation. Under these three flooding scenarios, there is no large difference in terms of the flooded area, likely due to the low terrain altitude in the SB area. However, water depth and velocity increase with R.
Water depth for R = 10, 20 years reaches ca. dw = 0.5–1 m, and flow velocity (module) is always Uw < 0.5 ms−1. Within these two latter scenarios, the main flow is conveyed by the Rio Quibù river, and only a small fraction of water reaches the SB. For R = 100 years, dw = 1.5–2 m mostly, and flow velocity (module) is Uw > 0.5 ms−1 over a large area of the SB lot. However, even for the highest return period, no other ISA building is subject to flood, according to our model.

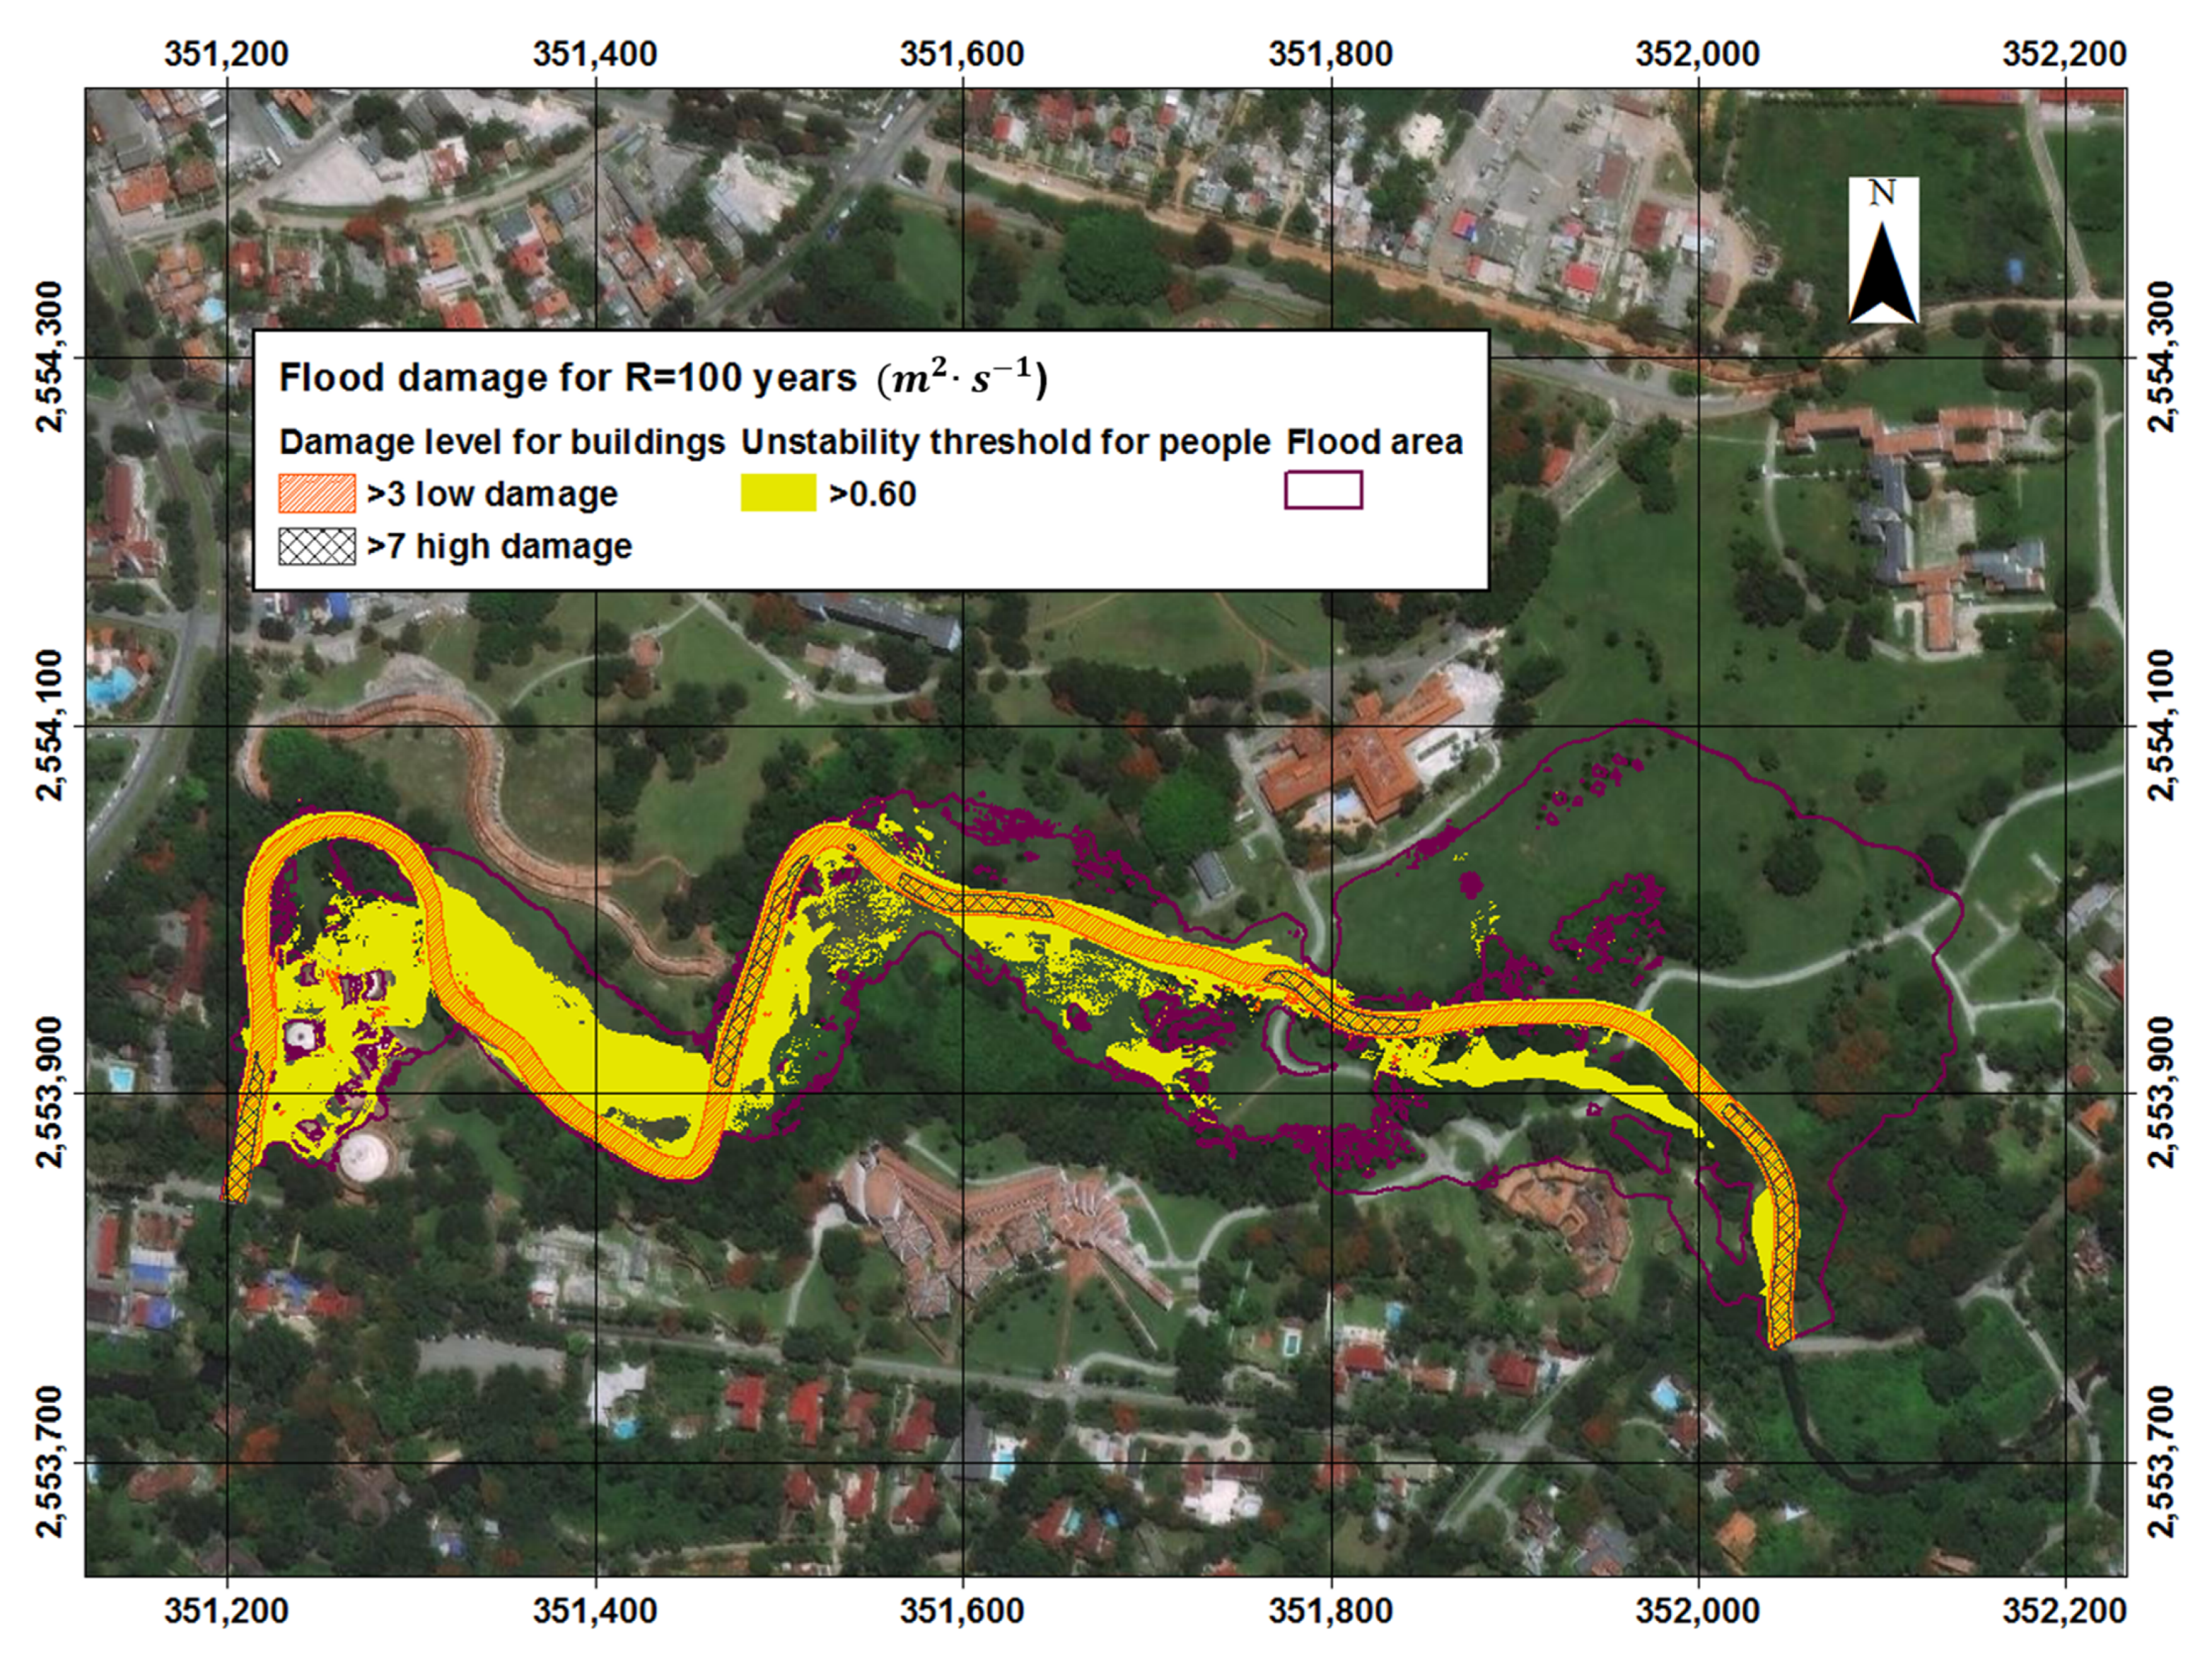
3.2. Flood Impact on Buildings, and Human Safety

Once we elaborated depth and velocity fields, it was possible to evaluate the vulnerability of the site. Particularly, we considered: (i) the safety of buildings against damage and (ii) safety of humans in terms of stability. Both such items can be quantified using a measure of vulnerability V.
V = U · h ,
with V (m2s−1), U (ms−1) water velocity, and h (m) water depth. To assess human instability during flood, i.e., the risk of being hurt by flow dragging, and possibly drowning, we used the results from Maijala [27]. The author therein reports of a laboratory experiment, aimed at assessing human stability during a flood. Some people of different weight and height stood into a pool, where increasing values of velocity, and water depth occurred. The author found that a critical value of Vpeople = 0.60 m2s−1 lead to instability. For buildings in masonry, Clausen and Clark [28] examined real data of flood damage and assessed the values Vbuild = 3.7 m2s−1, for partial and total damage of the structure, respectively.
Here, we evaluated the risk for people and buildings using these criteria, applied under the R = 100 years scenario (Figure 10). No buildings would undergo any damage during floods according to the abovementioned criteria. However, people would undergo the risk of instability/drowning inside the SB area and nearby the river. Nevertheless, due to the small size of the area, it seems quite unrealistic that people could be surprised by flood. Indeed, a flood warning system is available in the school, and people would likely be able to leave the area, even at short notice. However, this risk would become more likely whenever the SB would be used by students on a regular basis, especially in the absence of flood proofing measures.

3.3. Defence Measures. INRH Option, Original and Modified, A1, A2

We simulated here the potential inundation dynamics, after development of the defence measures designed by the INRH. Namely as reported, personnel of INRH hypothesized to reshape the bridge BR15, to reach 20 m in width, and they further suggested widening (20 m) of the river cross-sections from 295 m to 529 m upstream of bridge BR15. Also, INRH provided indication that the river segment from 15 m to 295 m needs to be widened “as much as possible”. As reported, we can assume river bottom width thereby as 12 m (against the present 8 m). The INRH project also includes the construction of a new river levee/wall bordering the SB lot, with altitude 5 m a.s.l., until 364 m upstream of the BR15.
In Figure 11, we report the modelled velocity profile under the reported adaptation measures, which we call measure A1, for the scenario R = 100 years (see Table 3 for a resume). Here, clearly, no flood occurs in the SB area given the shielding effect of the wall. Within the ISA park, Rio Quibù river overflows along both right, and left shores, even East of the SB, where the Rio Quibù river channel is wider than now (20 m, vs. 8 m now).
The velocity in the floodplains is low, Uw < 0.5 ms−1, unless for short traits nearby the channel, and no building is affected. Flow depth reaches mostly dw = 1–1.5 m or so.
As reported, the INRH project has been in the pipeline for ca. 15 years now, and was not realised hitherto, including possibly for its expected high cost. Informal discussion with the personnel of INRH in June 2019, revealed an expected cost nearby 2 M$. To explore other, possibly less expensive solutions, we evaluated a modified scenario, involving fewer radical changes in the area.
Clearly, protection of the SB area is complex. The SB is placed at a critically low altitude within a Rio Quibù meander. Also, natural overflow of the river occurs towards the SB, given that the right shore touches a hilly slope, with no chance for over flooding. Accordingly, the SB area’s protection can only be attained by posing a physical barrier to water flows, i.e., a levee/wall. Instead, the right shore of the Rio Quibù river upstream the SB area, presents large room for flooding before touching any building (Figure 10).
Accordingly, and considered that even when a wider stream section than now is modelled (20 m, see Figure 11) still inundation of the park occurs, one may hypothesize that channel excavation, and subsequent broadening therein may not be very efficient, and possibly not necessary.
We therefore simulated the potentially inundated area, under a design flood with R = 100 years by only considering as an adaptation measure the construction of the left shore levee (wall) at 5 m a.s.l., which we call measure A2.
The results are shown in Figure 12. Given that the wall is on in average more than 2 m above the terrain, the wall itself is enough to protect SB. In the right shore, visibly one has larger inundation than under option A1. Velocity reaches Uw > 0.5 ms−1, especially in the right bank east of the SB (where options A1 carries B0 = 12 m, and B295 = 20 m, vs. Bb = 8 m now). Flow depth reaches mostly dw = 1.5–2 m or so in some points.
Overall, however, the expected flooding area under option A2 does not exceed much the one designed under option A1. Again, under option A2, not one building is affected by the flood.

4. Discussion

4.1. Flood Mapping

The results covering flooded area under the given flood scenario (R years design events from INRH) could not be benchmarked against ground truth, given that no information was available concerning past flood events in the area (i.e., peak discharge/hydrograph, flooded area) in our knowledge. No stream flow measurement is available that we know of for the area, so peak flows during floods are not available. Nor information of precipitation is available, usable to reconstruct former floods. A reconstruction (i.e., hand-made sketch) of the flooded area related to a larger than normal flood event occurred in 2007 was available (reported in Figure 6, Figure 7, Figure 8, Figure 9, Figure 11 and Figure 12), together with some videos of the event. Generally speaking, the 2007 flood sketch well overlaps our maps (in terms of flooded area), although with slightly larger flooded areas. Analysis of the video archive, seemingly indicate acceptable correspondence of the flooded area, and also provides qualitative indication of low flow velocity, similarly to our results here. However, this analysis is only qualitative. From informal analysis of newspapers archives, one may infer that flood events occur with a frequency higher than that suggested by our results (i.e., from the return periods of the design events leading to extensive flooding). Again here, in lack of stream flow data, proper statistical assessment is not feasible. Possibly, underestimation of peak flow discharges (or underestimation of the corresponding frequency of occurrence, or return period) may occur within the INRH project. Flood design was based upon storm design, i.e., with use of critical storm duration and subsequent calculation of a storm intensity, based upon intensity duration frequency (IDF) curves [29]. Therein, INRH posed storm duration equal to a time of concentration of 24 h. Such value may be considerably high for Rio Quibù basin. Using 30 m ASTER GDEM and ARC GIS software, we were able to sketch the watershed area, and evaluate a main channel length of 13.6 km, with average slope of the basin of 0.57 %. We thereby assessed time of concentration of the catchment (most often used as an estimate of critical storm duration for flood design), using some empirical formula specific for urban basins [30,31,32,33,34,35]. We found thereby a time of concentration between four and 12 h (Table 4), with an average of seven hours. Whenever the time of concentration would be used as a proxy for critical storm duration for flood design, such a duration would be visibly smaller than that used as a reference in the INRH project.
Here, using the only IDF curve we could find in the literature for the La Havana area [29], dating back to 1983, we could carry out the exercise of estimating critical design storm for the Rio Quibù at the ISA school, and the corresponding discharge. Namely, we applied to the INRH design peak flow discharges, a ratio between the critical (design) discharge for seven and 24 h, as calculated from us using flood routing based upon the IDF as reported. This was done as a rough approximation, accounting for the fact that the INRH estimation comes from a complex assessment of a critical storm flood and the interaction with river hydraulics (channel geometry, bridges, reservoirs) above the ISA area, which was not possible here.
For a return period R = 100 years, we thereby estimated Q100 = 174 m3s−1 (vs. Q100 = 87.1 m3s−1 of INRH, see Table 2). Accordingly, design floods for large return periods may be larger than those previously assessed (and used for flood mapping here), and thereby actual flooding may be larger.
Such difference may even explain the difference between the observed and modelled flood occurrence and area, as reported from our informal analysis. Furthermore, it is important to recall that most formulas for time of concentration here presented were introduced for rural basins. In urban areas like here, paved surfaces cover large shares of the total, and rainwater is rapidly delivered into the sewage systems. The time of concentration could be even lower than calculated here, and peak flows even larger. Systematic investigation would be required here, albeit in lack of extensive data coverage, as reported.
Despite recent awareness of worsened (coastal) flood risk under climate change as reported, no recent studies about potentially modified IDF curves under climate change are available for the area, and again we had to rely upon information of IDF dating back to ca. 40 years ago.
Among others, Stephenson et al. [36] studied possible evolution in extreme precipitation over 51 stations across the Caribbean region (including Cuba) during 1960–2020 and found no significant trend.
Also, the downstream condition of sea level (plus high tide of 0.60), would need be updated based upon recent as possible sea level measurements, however not available as reported, and possibly with consideration of future sea level scenarios under IPCC projections [37,38], maybe adapted locally. An improvement of the model would be made including in the 2D modelling the Quibù area downstream ISA. This would require a large amount of data, and would allow use of sea level as downstream boundary condition, possibly reducing the uncertainty in water level assessment with 1D modelling as we did here.
Climate change is not the only significant process that could affect flood susceptibility in the future. Possible change in land use, e.g., new urban settlements, could have even an effect on time of concentration (shorter than now), and increase peak discharge (e.g., [39]). The only change in land use in the Quibù area that we were able to detect from satellite images, is related to a new urban settlement close to the Ciudad Libertad Airport [18], located North East of ISA, only 800 m away. To take into account the effect on peak discharge, we considered the presently green area around the airport (Figure 2) as impervious, and we assumed all precipitation therein would reach Quibù river. Even with this extreme assumption, we evaluated a negligible change of discharge of ca. +3%.
From pictures taken in-situ, video archives, and direct investigation, sediment transport seems not to be massive in Rio Quibù, even during flood events. Accordingly, we did not consider its possible detrimental effect hitherto. The river basin is mainly anthropic (urbanized, and agrarian) and slope is mostly mild, a condition that may confirm our observations. It is however important to stress the need to maintein and clean the river, especially to remove litter (plastic wastes, and similar objects) that, in addition to representing a sanitary risk, may contribute to clogging of bridges and hydraulic structures, thereby increasing flood risk.

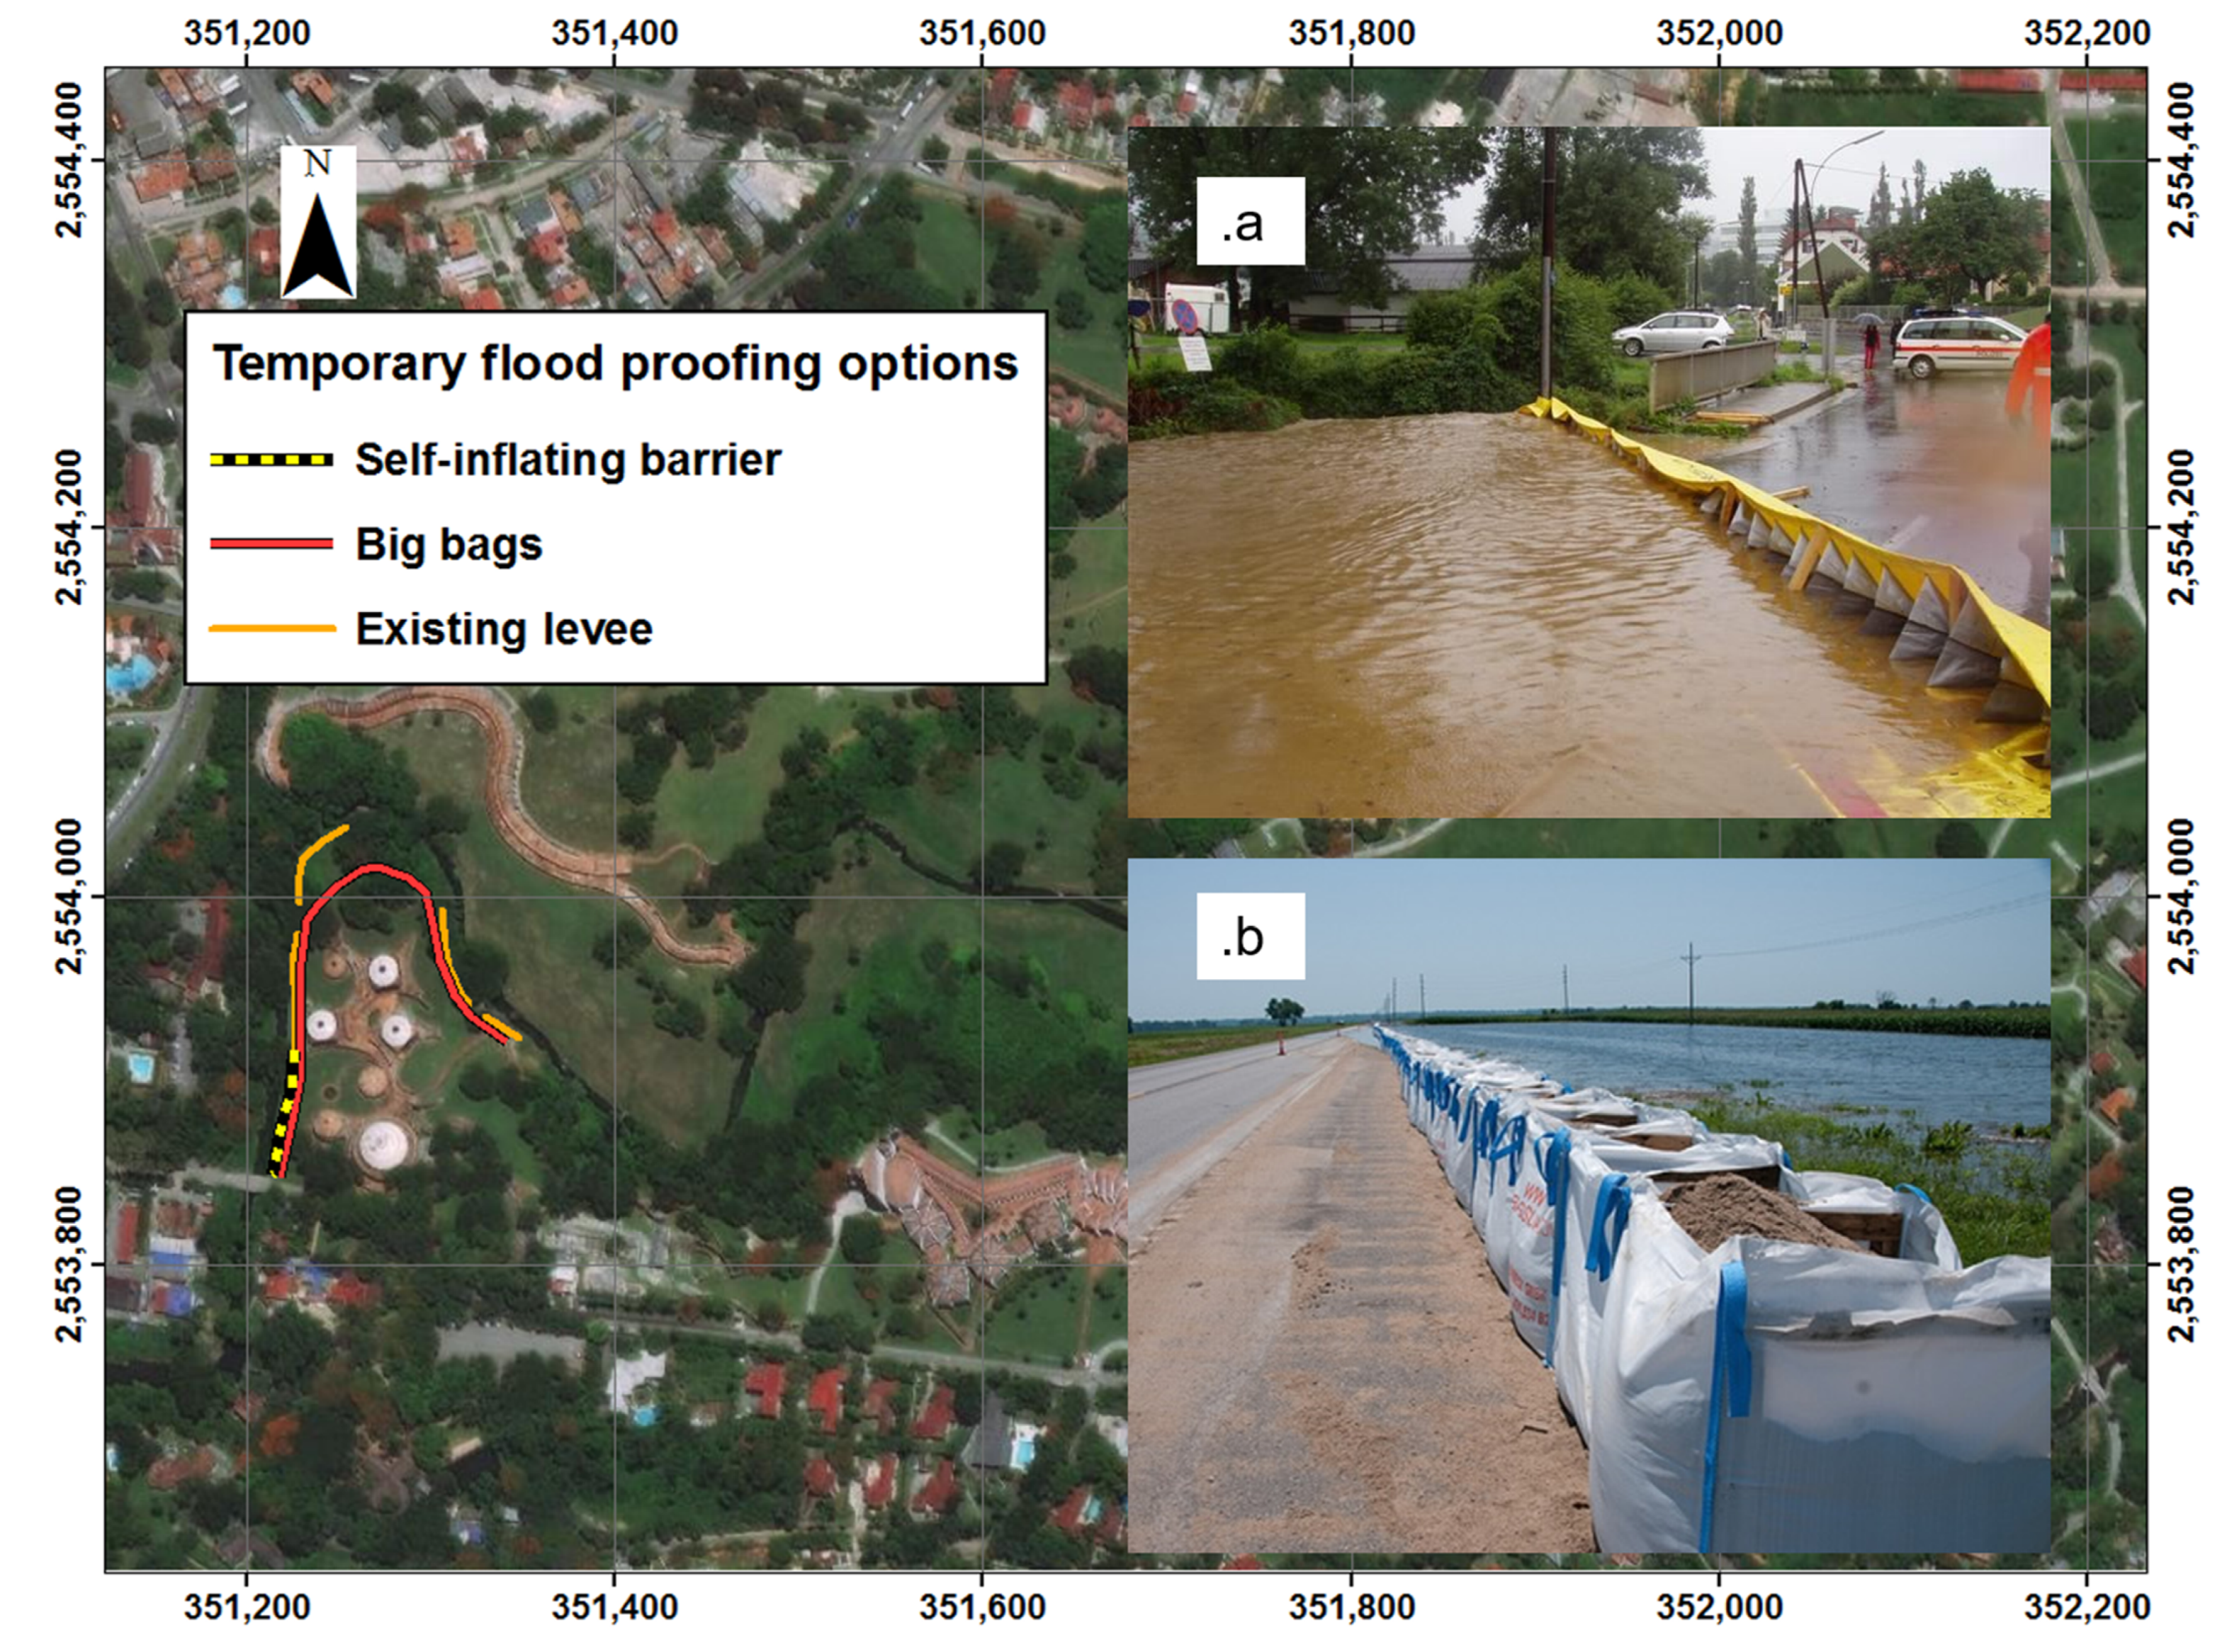
4.2. Flood Risk Reduction Using Temporary Flood Proofing TFP

Like the ones suggested by INRH of building a new levee with river bed enlargement, traditional flood control techniques generally entail massive amount of public works, economic resources, free land and local people acceptability. Accordingly, often such measures are not implemented, or largely delayed. Additionally, such options, albeit properly conceived from an engineering point of view, may not be optimal from an environmental, cultural, and landscape perspective. This is especially true considering that the ISA site seats within a park, including national monuments, with high cultural value.
An alternative strategy focusing on the choice of smaller works, and more recent flood proofing techniques may offer a set of options, which, compared to traditional strategies, may be more suitable in this context, and even more economically feasible.
The traditional approach to flood-control as proposed by the INRH, may thus be integrated and completed adding new options, to obtain a set of strategies usable as a basis for benchmarking and discussion.
Here, we thus present a set of flood proofing strategies, based upon recent literature [40], to broaden the set of options for decision-makers to reduce flood risk for the most exposed building of ISA, i.e., the School of Ballet.
Having in mind the defence of SB from floods, and the long-term partial re-use with the original teaching activities therein, and meanwhile preserving as much as possible the building and its surroundings in architectural and landscape terms, and liveability of the space, a two-step strategy may be envisioned.
First, one may consider transitory options to put in place rapidly as a defence against the ongoing ruining of the SB buildings, and area due to the action of water from the Eio Quibù. Temporary flood proofing (TFP) techniques may allow to defend an area from (low-medium return period) floods, without the need of building permanent, expensive structures. Also, they are usually less expensive, and have a lower environmental impact than permanent ones. The measures originally designed by INRH to cope with flooding in the ISA, were not implemented hitherto, as reported here, likely due to their high cost. As a result, activity in the area could not be started safely, even if the schools were restored. Here, in Table 5, we present some possible strategies of TFP type [40], suitable for the SB area.
Transient options may come from an appropriate selection, from available temporary flood proofing techniques that are compatible with the situation as depicted by the flood modelling exercise above (i.e., 1-2D depth and velocity fields). Here, we propose an application of two removable flood proofing techniques TFP, selected as suitable transitory solution for the ISA context, among the many potential options, i.e.,
(1)
Self-inflating flood barriers (Figure 13a). These are a most used temporary solution worldwide due to their many advantages. They can be stored in a small volume and then easily installed before a flood event, without the need for special machinery. They can reach an effective protection here, up to a water table of 1.5 m a.s.l., using a 15 m long model. Multiple modules can be placed side by side to form a continuous barrier along SB to protect it from minor flood events. Here we may consider barriers 0.35 m high, with low weight, making it much faster manual deployment, with respect to higher barriers (56 kg vs. 214 kg for barriers 1.5 m high). These barriers can be deployed along the most depressed (lowest) area, where water enters first (Figure 13, window a). Such a solution would provide flood proofing for the SB for most frequent floods, with ca. R = 5 years.
(2)
Temporary dikes containing reinforced earth/lose soil, often referred as “big bags” (Figure 13, window b). This technique can be seen as a semi-permanent version of sandbags, and it is made by a set of five semi-stiff cubic containers, connected to each other. These have to be filled by lose soil (in case using an excavator). Because of their size and weight (side 90 cm, and up to 2000 kg weight, once filled), it is not possible to set up such barriers just before a sudden flood, as it happens in small, urbanized, tropical basins like Quibù. For the same reason, however, they are much more stable and durable than sandbags. Here, we present a scenario where big bags are located around the SB for 360 m upstream of the 15th street bridge (Figure 13b), given that the existing wall may not be efficient for large floods. Considering an effective height of 80 cm, we estimated that such bags may provide flood proofing for an event with R = 10 years or so.

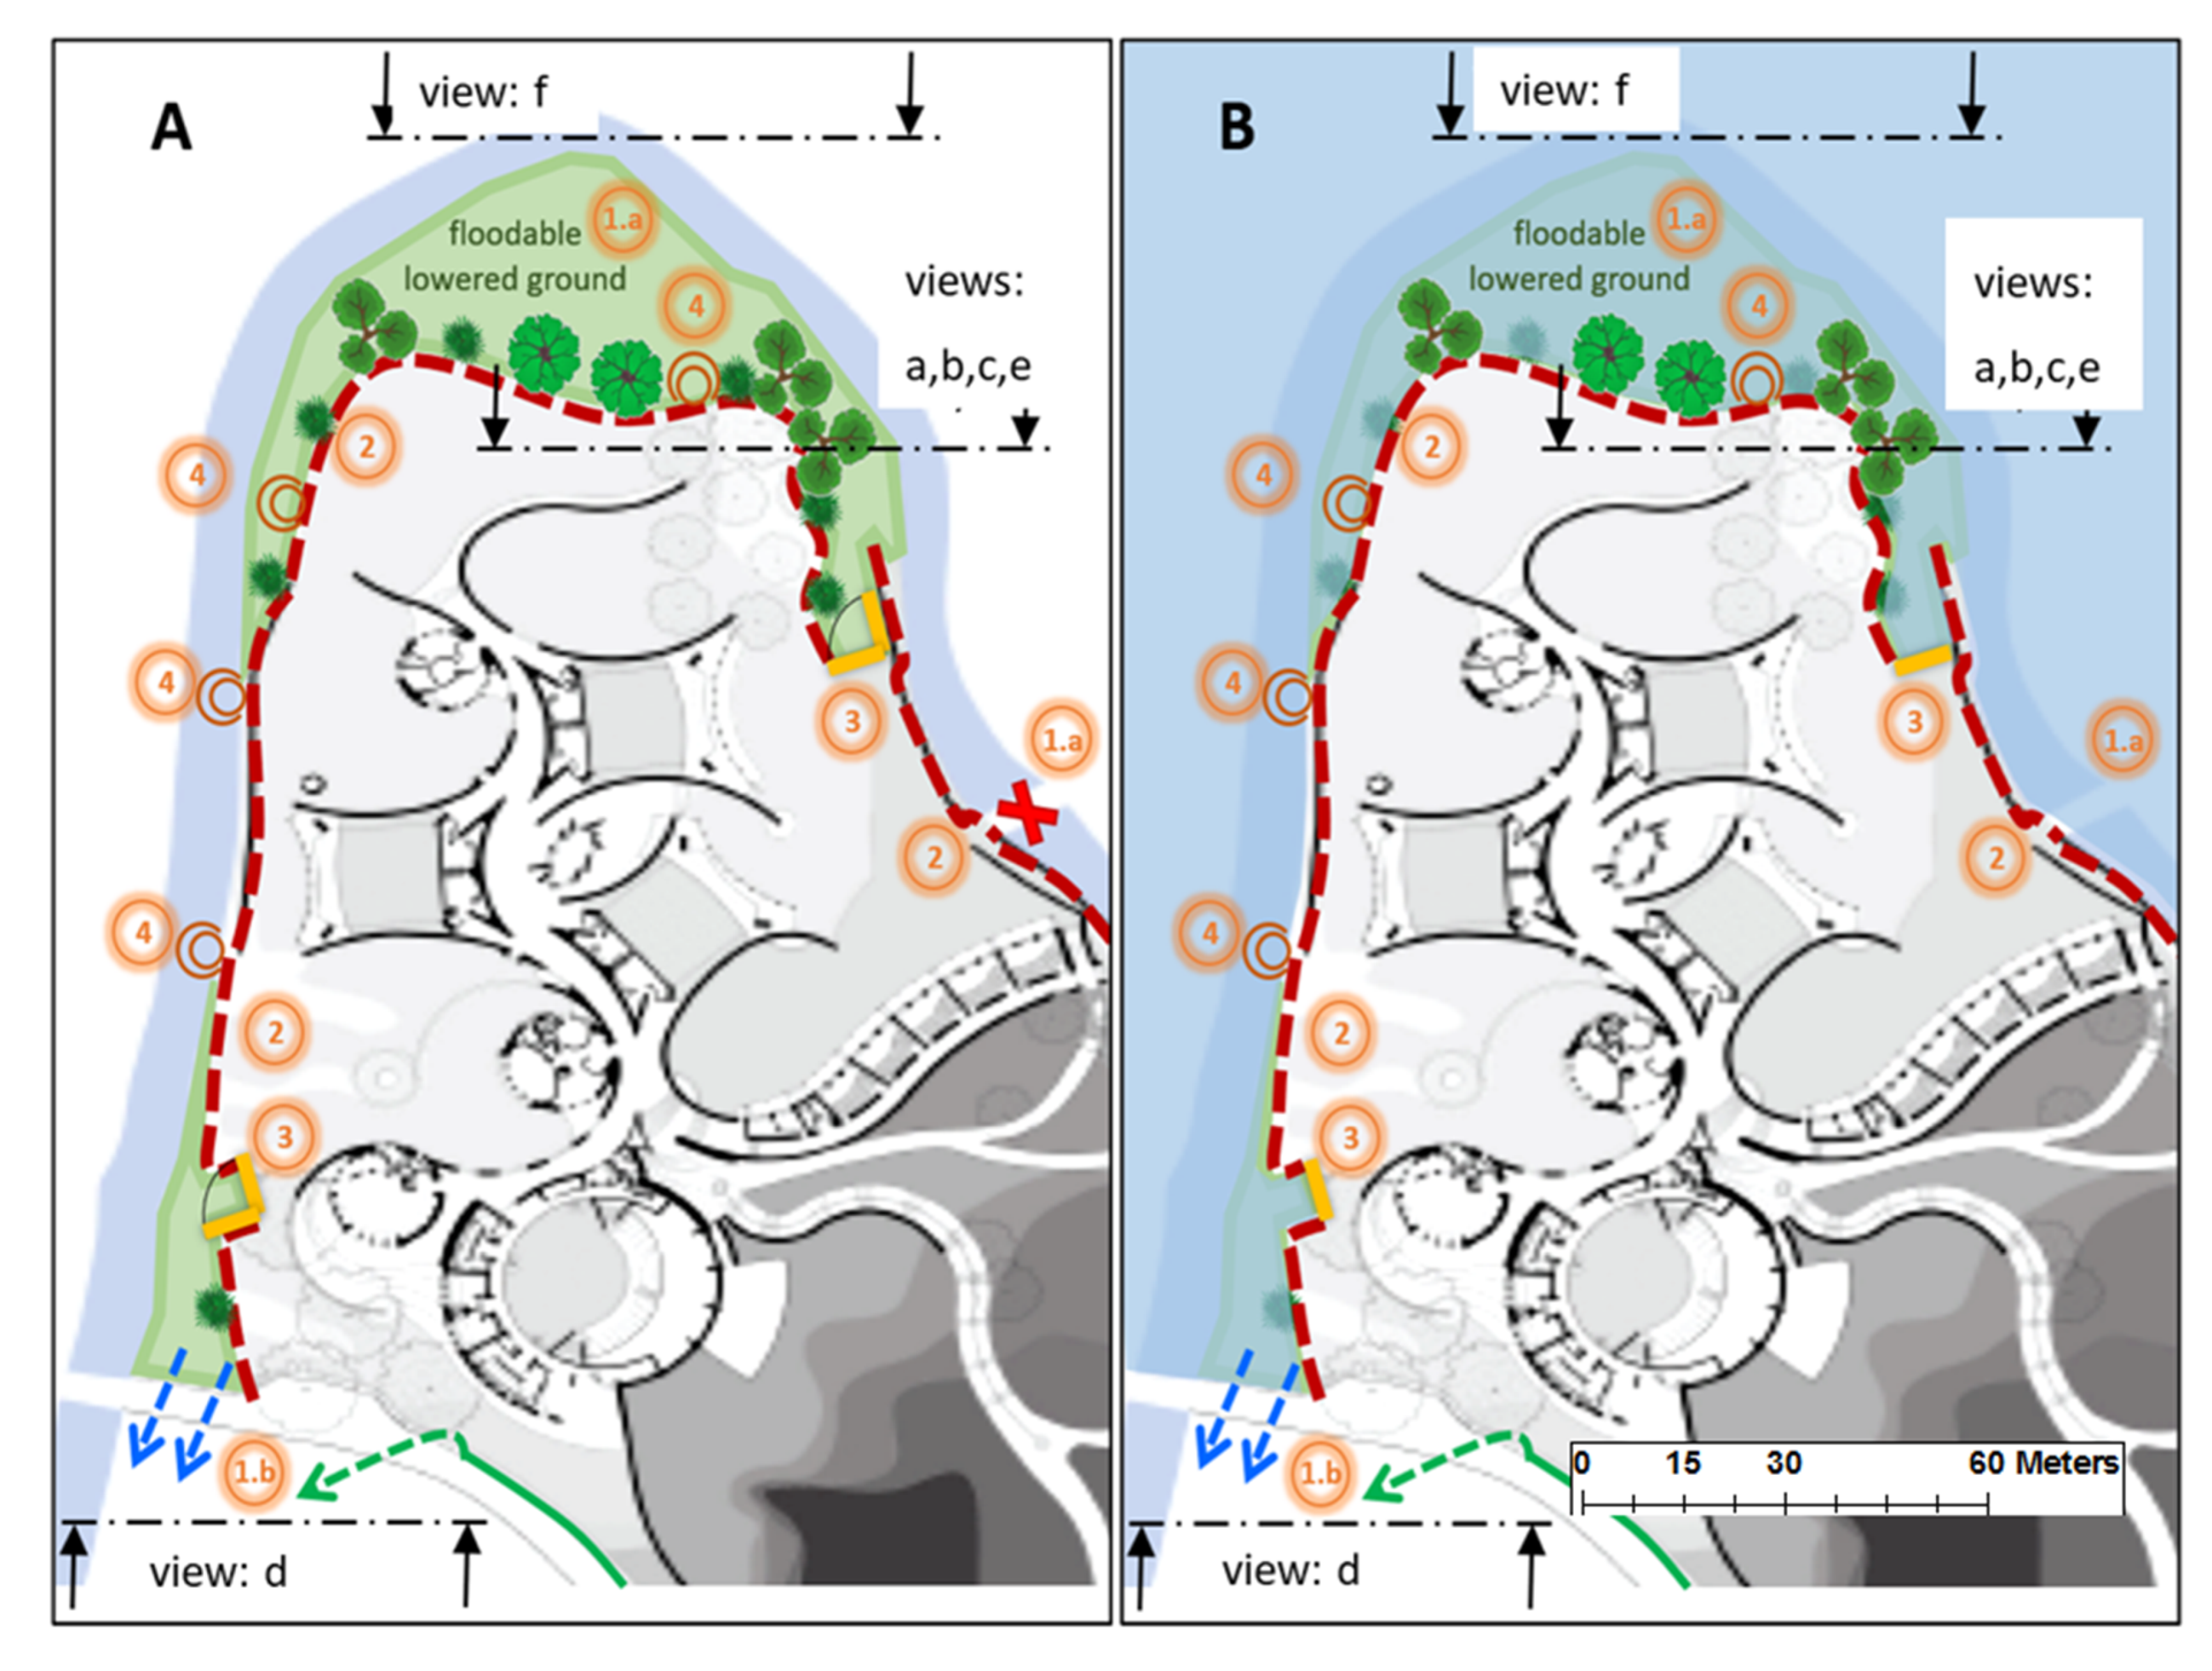
4.3. Flood Risk Reduction Using Small Permanent Structures (SPS)

Further to TFP techniques, long term options may be conceived, to improve the safety level of the SB, and to allow (planning, and realization of) the conservation works required to bring the building back to the original functions of teaching, and fruition of the park area for leisure. This is the use of light, or small permanent structures (SPSs) for buildings and infrastructures (and their adjacencies), which may be considered as a halfway solution between permanent, and temporary.
Longer term options SPS were also analysed here, again starting from the outputs obtained from our flood model. SPS likely would provide higher levels of safety, landscape protection and liveability of public spaces.
In Table 5, we also present some possible strategies of SPS type, suitable for the SB area.
To select within a range of options, we explored small (or light) permanent flood proofing techniques. Starting from the state of the area, and of the local environment (Figure 13, window a), and taking into consideration the technical preferences of the INRH (Figure 13, window b), we envisioned a mix of techniques to improve their proposal. Here, we report a number of strategies that can be implemented in the area, namely:
(1)
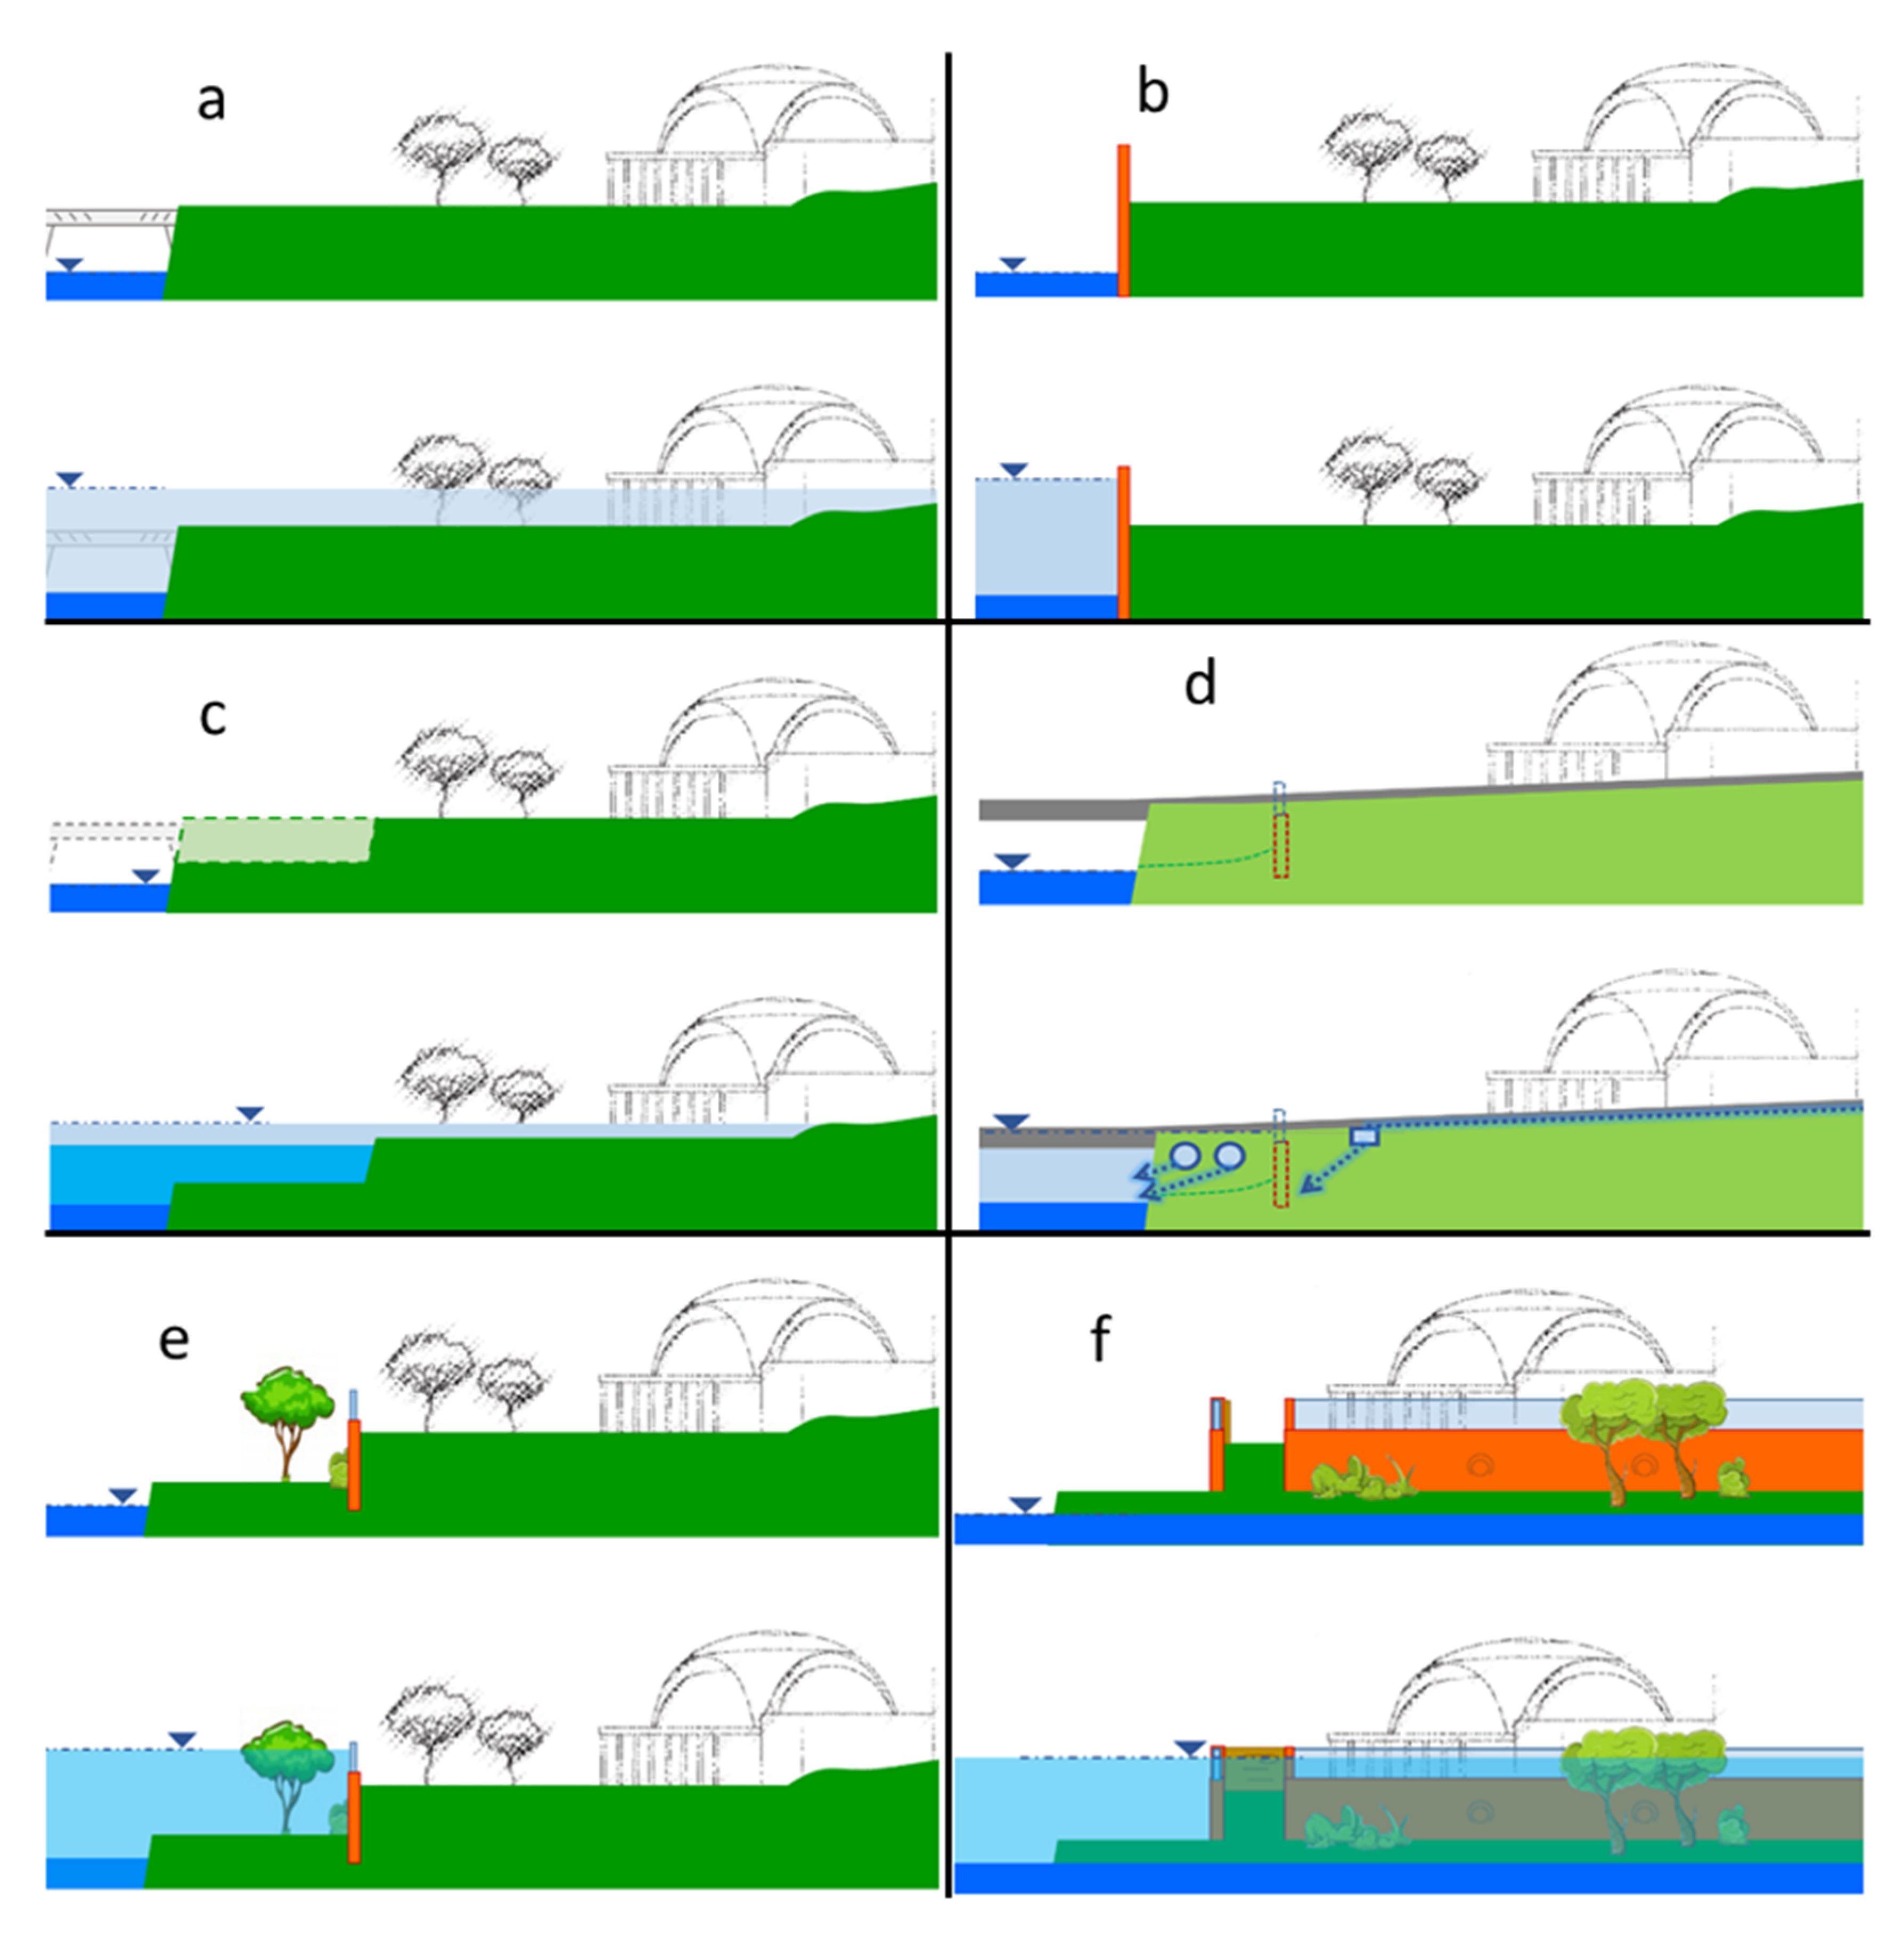
Small permanent ground lowering/levelling of free land. This is an intervention combining little soil removal to divert storm water from the area, and favouring the water flow through artificial drainage channels, before the bridge at the end of the park (15th road). This includes the demolition of a collapsed bridge in front of the school (reported in Figure 14). The new lowered ground would be flooded when necessary, but it would usually be accessible to people in the ISA area. See the intervention in Figure 14, 1.a soil and collapsed bridge removal, and in Figure 14, 1.b drainage channels, and sketches in Figure 15c,d.
(2)
Small permanent floodwalls. Here, we devise additional top barriers in glass, to be placed on top of the new reduced wall. This wall, smaller and cheaper when compared vs. the INRH one will give a reduced landscape impact, and better view over the area. The reduced wall, to be built in (Catalan) bricks, may have a mitigated visual impact, e.g., thanks to instalment of plant trees, and vegetation. See intervention number 2 in Figure 14, and the sketch in Figure 15.
(3)
Permanent, retractable doors. Fixed, retractable barriers/doors will allow to reach the Rio Quibù through a specific path, connecting with the floodable lowered ground. See intervention 3 in Figure 14, and sketch f in Figure 15.
(4)
Small permanent dry flood proofing. Here, back-flow valves in the drainage systems all around the school garden may be positioned on the new reduced wall, to allow water drainage during storms, and return to the river after floods. See intervention 4 in Figure 14 and sketch f in Figure 15.

5. Conclusions

The study here presented shows how one can assess flood risk to safeguard historical sites by compensating (at least partially) for poor data availability with detailed on-site surveys. Indeed, no information in the present literature was available covering hydraulic and hydrological features of the Rio Quibù, and we could use design flows from INRH project. However, the original study where such values were designed could not be retrieved. Interaction with the INRH personnel was necessary and useful to provide insights regarding the area of study.
Despite such, some abundant information about ISA geometry, collected merging laser scanners surveys for the park area, and water depth/velocity measurements within the Quibù channel, allowed us to build a high-resolution DTM of the ISA area, and characterize flow features of the Quibù creek.
Thereby, we could reasonably account for the main flow features, and obstacles, including walls, buildings, and vegetation at some extent. This made it possible for us to use a 2D flow model, useful to account for the river’s sinuosity in the ISA park, and generally of complex (i.e., not linear/one dimensional) motion patterns. We could not include in HEC-RAS 2D bridges, and hydraulic structures, so we used a 1D model to mimic the boundary condition given by the bridge BR15, possibly the most (only) relevant for flow patterns on the ISA area.
We then provide suggestions for the use of flood proofing techniques, temporary or semi-permanent, to be combined with a modified drainage system. This is necessary to convey local storm water, and especially to help reducing flood risk in the area.
Moderately impacting flood proofing techniques may provide an improvement of the presently available project from INRH, by (i) reducing in some cases the expected cost, and (ii) displaying lower impact from the architectural, environmental, and landscape point of view, an important asset within this area of high historical and artistic value.
Our study here provides a benchmark for researchers, designers, policy makers, and even construction companies, and can be used for future brainstorming and the selection of alternative flood countermeasures in the area. Our method could also be applied in similar projects, aiming at protecting heritage sites endangered by flood risk, ever increasing under ongoing climate change, and to tackle the flood proofing of historical and artistic value architectures, located within ungauged or poorly gauged catchments.
Scarce knowledge of recent changes in the weather drivers (i.e., extreme storms statistics) and boundary conditions for hydraulic simulation (i.e., sea level) is available in our understanding.
Such updated information would be necessary henceforth for more dependable flood mapping and the assessment of countermeasures.

Author Contributions

Conceptualization, D.B. and R.R.; methodology, L.S. and D.F.B.; software, L.S.; validation, L.S.; formal analysis, L.S. and D.F.B.; investigation, D.B., D.F.B., and A.G.; resources, D.D.C. and R.R.; data curation, A.G. and L.S.; writing—original draft preparation, L.S. and D.B.; writing —review & editing, D.B., D.D.C., and R.R.; visualization, L.S. and D.F.B.; supervision, D.D.C., R.R.; project administration D.D.C., R.R., and D.F.B.; funding acquisition, D.D.C., R.R., and D.F.B. All authors have read and agreed to the published version of the manuscript.

Funding

This work is in partial fulfilment of the Keeping ISA Modern project 2018–2020 funded by the Keeping It Modern grant initiative by the Getty Foundation [Grant no. R-ORG-201839332].

Data Availability Statement

The data presented in this study are available upon request from the corresponding author.

Acknowledgments

This work is the result of activity under the umbrella of the project Keeping ISA Modern funded by Getty Foundation under the Keeping It Modern initiative. The authors kindly acknowledge architect Maria Paola Borgarino, architects Sofia Celli, Riccardo Feder and Christian Zecchin for helping with data, and local activity. Eng. Andrea Soncini is acknowledged for preliminary work in fulfilment of the KIM project, Action 3. Some documents, and data regarding flood design were kindly provided by the Instituto Nacional de Recursos Hidràulicos INRH. Contribution to elaboration of flood proofing techniques form the students of the course of Bignami “Land planning for environmental risk management” at Politecnico di Milano, Faculty of Architecture for the academic year 2019–2020, is kindly acknowledged. We also want to thank the entire staff of ISA, particularly the Rector Alexis Seijo Garcia for the hospitality, and know-how shared during the project’s related activities in Habana. Climate-Lab of Politecnico di Milano (https://www.climatelab.polimi.it/en/) kindly acknowledged for support with hardware, and software for calculation.

Conflicts of Interest

The authors declare no conflict of interest.

Acronyms

ISAInstituto Superior de Arte
SBSchool of Ballet
INRHInstituto Nacional de Recursos Hidraulicos
BR15Puente de calle 15
DTMDigital terrain model
FRAFlood risk assessment
IDFIntensity duration curve
SWEsShallow water equations
DSWDiffusion wave equations
TFPTemporary flood proofing
SPSSmall permanent structures

References

  1. Wallemacq, P.; House, R. Economic losses, poverty and disasters 1998–2017. United Nations Off. Disaster Risk Reduct. 2017, 31. [Google Scholar] [CrossRef]
  2. Ward, P.; van Pelt, S.; de Keizer, O.; Aerts, J.; Beersma, J.; van den Hurk, B.; te Linde, A. Probabilistic flood risk assessment. J. Flood Risk Manag. 2014, 7, 141–151. [Google Scholar] [CrossRef]
  3. Dottori, F.; Szewczyk, W.; Ciscar, J.C.; Zhao, F.; Alfieri, L.; Hirabayashi, Y.; Bianchi, A.; Mongelli, I.; Frieler, K.; Betts, R.A.; et al. Increased human and economic losses from river flooding with anthropogenic warming. Nat. Clim. Chang. 2018, 8, 781–786. [Google Scholar] [CrossRef]
  4. Miller, J.D.; Hutchins, M. The impacts of urbanisation and climate change on urban flooding and urban water quality: A review of the evidence concerning the United Kingdom. J. Hydrol. Reg. Stud. 2017, 12, 345–362. [Google Scholar] [CrossRef] [Green Version]
  5. Perry, J. Climate change adaptation in natural world heritage sites: A triage approach. Climate 2019, 7, 105. [Google Scholar] [CrossRef] [Green Version]
  6. Guzman, P.; Fatorić, S.; Ishizawa, M. Monitoring climate change in world heritage properties: Evaluating landscape-based approach in the state of conservation system. Climate 2020, 8, 39. [Google Scholar] [CrossRef] [Green Version]
  7. Padli, J.; Habibullah, M.S.; Baharom, A.H. Determinants of flood fatalities: Evidence from a panel data of 79 countries. Soc. Sci. Humanit. 2013, 21, 81–98. [Google Scholar]
  8. Mark, O.; Jørgensen, C.; Hammond, M.; Khan, D.; Tjener, R.; Erichsen, A.; Helwigh, B. A new model of health risk from urban flooding. J. Flood Risk Manag. 2018, 11, S28–S42. [Google Scholar] [CrossRef]
  9. Haberl, R. Constructed wetlands: A chance to solve wastewater problems in developing countries. Water Sci. Technol. 1999, 40, 11–17. [Google Scholar] [CrossRef]
  10. Bocco, G.; Mendoza, M.; Velázquez, A. Remote sensing and GIS-based regional geomorphological mapping—A tool for land use planning in developing countries. Geomorphology 2001, 39, 211–219. [Google Scholar] [CrossRef]
  11. Mahmoud, S.H. Investigation of rainfall-runoff modeling for Egypt by using remote sensing and GIS integration. Catena 2014, 120, 111–121. [Google Scholar] [CrossRef]
  12. Bozza, A.; Durand, A.; Confortola, G.; Allenbach, B.; Bocchiola, D. Potential of remote sensing and open street data for flood mapping in poorly gauged areas: A case study in Gonaives, Haiti. Appl. Geomat. 2016, 8, 117–131. [Google Scholar] [CrossRef] [Green Version]
  13. Bui, D.T.; Hoang, N.D.; Martínez-Álvarez, F.; Ngo, P.T.T.; Hoa, P.V.; Pham, T.D.; Costache, R. A novel deep learning neural network approach for predicting flash flood susceptibility: A case study at a high frequency tropical storm area. Sci. Total. Environ. 2020, 701, 134413. [Google Scholar] [CrossRef]
  14. Islam, A.R.M.T.; Talukdar, S.; Mahato, S.; Kundu, S.; Eibek, K.U.; Pham, Q.B.; Linh, N.T.T. Flood susceptibility modelling using advanced ensemble machine learning models. Geosci. Front. 2020. [Google Scholar] [CrossRef]
  15. Avand, M.; Moradi, H. Using machine learning models, remote sensing, and GIS to investigate the effects of changing climates and land uses on flood probability. J. Hydrol. 2020, 125663. [Google Scholar] [CrossRef]
  16. Del Curto, D. Verso un Piano di Conservazione per le Scuole Nazionali d’Arte [Towards a Conservation Plan for National Art Schools]. Loomis, J. Una rivoluzione di forme; Mimesis: Sesto San Giovanni, Italy, 2019; pp. 234–243. ISBN 978-885-75-5126-5. [Google Scholar]
  17. Del Curto, D. Keeping it modern. In Il Piano di Conservazione e Gestione per L’architettura del Ventesimo Secolo [The Conservation Management Plan for 20th-Century Architecture]; Musso, S., Pretelli, M., Eds.; Restauro: Conoscenza, Progetto, Cantiere, Gestione; Edizioni Quasar—Società Italiana per il Restauro dell’Architettura: Rome, Italy, 2020; pp. 333–343. ISBN 978-88-5491-016-4. [Google Scholar]
  18. Maxar Technologies. Satellite Imagery. Available online: https://www.maxar.com/products/satellite-imagery (accessed on 22 October 2020).
  19. Instituto Nacional de Recursos Hidraulicos INRH. Reproyecciòn Protecciòn Contra Inundaciones Escuela de Ballet; Instituto Nacional de Recursos Hidraulicos: La Havana, Cuba, 2005; 46p. [Google Scholar]
  20. Hasdenteufel, P.; Mateo Rodriguez, J.M.; Baume, O.; Torres Gomez de Cadiz, R.J. La Geoecología Como Herramienta para la Gestión Ambiental: Estudio de Caso de la Cuenca Hidrográfica Superficial del río Quibú, Provincia Ciudad de La Habana, Cuba; Revista Universitaria de Geografía: Vigente, Argentina, 2008; Volume 17, pp. 309–329. ISSN 1852-4265. [Google Scholar]
  21. Ebanks, G.E. Urbanization in Cuba. PSC Discuss. Pap. Ser. 1998, 12, 10. [Google Scholar]
  22. Garcia-Armisen, T.; Prats, J.; Marrero, Y.; Servais, P. Faecal bacterial indicators removal in various wastewater treatment plants located in Almendares River watershed. Water Sci. Technol. 2008, 58, 773–779. [Google Scholar] [CrossRef]
  23. Escobar, L. Animales Muertos, Heces Y Plásticos Cubren El Río Quibú a Su Paso Por La Habana. 14ymedio, La Habana 2018. [Dead Animals, Faeces, and Plastic Fill the Rio Quibù River Along Its Track to La Havana]. Available online: https://www.14ymedio.com/cuba/Animales-muertos-plasticos-Quibu-Habana_0_2493350644.html (accessed on 1 November 2020).
  24. Fernandez, I.; Rua De Cabo, A.; Rodriguez Garcia, R.; Perez Hernandez, Y. Evaluacion espacial de la cuenca hidrografica del Rìo Quìbù. In Estructura Geográfica Ambiental y Sostenibilidad de las Cuencas Hidrográficas Urbanizadas de Cuba: El Ejemplo de la Cuenca del río Quibú, Provincia Ciudad de La Habana, Resultados del Proyecto Caesar, Ciudad de La Habana; Editorial Universitaria: Santiago, Chile, 2008. [Google Scholar]
  25. Gutierrez Hernandez, J.E.; Gonzalez, K. Estudio hidrológico general de la cuenca del río Quibú. Universidad de La Habana, La Habana, Cuba. Proyecto CAESAR INCO-DEV 2004, 29. [Google Scholar]
  26. Brunner, G.W. HEC-RAS River analysis system, Reference manual. Davis US Army Corps Eng. Hydrol. Eng. Cent. 2016, 75. [Google Scholar]
  27. Maijala, T. RESCDAM: Development of rescue actions based on dam-break flood analysis. In Grant Agreement No. Subv 99/52623 Community Action Programme in the Field of Civil Protection; Final Report; Finnish Environment Institute: Helsinki, Finland, 2001. [Google Scholar]
  28. Clausen, L.; Clark, P.B. The development of criteria for predicting dambreak flood damages using modelling of historical dam failures. In International Conference on River Flood Hydraulics; John Wiley & Sons Ltd. Hydraulics Research Limited: Wallingford, UK, 1990; pp. 369–380. [Google Scholar]
  29. Diaz Arenas, A. Tropical storms in Central America and the Caribbean: Characteristic rainfall and forecasting of flash floods. In Hydrology of Humid Tropical Regions with Particular Reference to the Hydrological Effects of Agriculture and Forestry Practice (Proceedings of the Hamburg Symposium, August 1983); IAHS: Oxfordshire, UK, 1983; Volume 140, pp. 39–51. [Google Scholar]
  30. Kirpich, Z.P. Time of concentration of small agricultural watersheds. Civ. Eng. 1940, 10, 362. [Google Scholar]
  31. Chow, V.T.; Maidment, D.R.; Mays, L.W. Applied Hydrology; McGraw-Hill: New York, NY, USA, 1988. [Google Scholar]
  32. Viparelli, C. Ricostruzione Dell’Idrogramma di Piena. Napoli: Istituto di Idraulica dell’Università di Palermo, Stab. Tip.; Genovese: Genova, Italy, 1961. [Google Scholar]
  33. Giandotti, M. Previsione delle piene e delle magre dei corsi d’acqua. Istituto Poligrafico dello Stato 1934, 8, 107–117. [Google Scholar]
  34. Ventura, G. Bonificazione della bassa pianura bolognese: Studio sui coefficienti udometrici. Tipo-litografia del Genio civile, 1905. [Google Scholar]
  35. Pasini, P. Coefficienti udometrici desunti dal lavoro delle macchine nelle bonifiche meccaniche. Stab. tipo-litografico del Genio civile, 1910. [Google Scholar]
  36. Stephenson, T.S.; Vincent, L.A.; Allen, T.; van Meerbeeck, C.J.; McLean, N.; Peterson, T.C.; Trotman, A.R. Changes in extreme temperature and precipitation in the Caribbean region, 1961–2010. Int. J. Climatol. 2014, 34, 2957–2971. [Google Scholar] [CrossRef]
  37. Pachauri, R.K.; Allen, M.R.; Barros, V.R.; Broome, J.; Cramer, W.; Christ, R.; Dubash, N.K. Climate Change 2014: Synthesis Report. Contribution of Working Groups I, II and III to the Fifth Assessment Report of the Intergovernmental Panel on Climate Change; IPCC: Geneva, Switzerland, 2014; p. 151. [Google Scholar]
  38. Zhai, P.; Pörtner, H.O.; Roberts, D.; Skea, J.; Shukla, P.R.; Pirani, A.; Connors, S. Global Warming of 1.5 °C: An IPCC Special Report on the Impacts of Global Warming of 1.5 °C Above Pre-industrial Levels and Related Global Greenhouse Gas Emission Pathways, in the Context of Strengthening the Global Response to the Threat of Climate Change, Sustainable Development, and Efforts to Eradicate Poverty; Masson-Delmotte, V., Ed.; World Meteorological Organization: Geneva, Switzerland, 2018; p. 32. [Google Scholar]
  39. Saghafian, B.; Farazjoo, H.; Bozorgy, B.; Yazdandoost, F. Flood intensification due to changes in land use. Water Resour. Manag. 2008, 22, 1051–1067. [Google Scholar] [CrossRef]
  40. Bignami, D.F.; Rosso, R.; Sanfilippo, U. Flood Proofing in Urban Areas; Springer: Cham, Switzerland, 2019. [Google Scholar]
Figure 1. ISA park with Quibù river path, present, partially collapsed levee, and School of Ballet. Source: Maxar Technologies [18]. Coordinates system: WGS 1984 UTM, Zone 17N.
Climate 09 00023 g001
Figure 2. Rio Quibù catchment. Paved (urbanized) area elaborated from satellite picture by Maxar Technologies [18]. Coordinates system: WGS 1984 UTM Zone 17N.
Climate 09 00023 g002
Figure 3. Adopted methodology. We report the main data available, and data gathered through field surveys, tools adopted, and software. Inputs, outputs, and main results also reported.
Climate 09 00023 g003
Figure 4. Digital Elevation Model of the ISA park with 0.5 m resolution. Notice the river bed, with altitude of ca. 0 m a.s.l. at outlet, and higher moving upstream. Coordinates system: WGS 1984 UTM Zone 17N.
Climate 09 00023 g004
Figure 5. Digital Elevation Model of the ISA park with 0.5 m resolution, after adaptation as suggested by INRH. Notice construction of a new levee (concrete wall, 5 m a.s.l.) surrounding the SB, of a larger than now river section at BR15 (left bottom), and upstream river stretch, until 529 m upstream of the bridge (U bend at centre of the Figure). Coordinates system: WGS 1984 UTM Zone 17N.
Climate 09 00023 g005
Figure 6. ISA park. Maximum velocity, water depth for a R = 5 years flood, in red line reconstructed 2007 flood area. Coordinates system: WGS 1984 UTM Zone 17N.
Climate 09 00023 g006
Figure 7. ISA park. Maximum velocity and water depth for a R = 10 years flood, in red line reconstructed 2007 flood area. Coordinates system: WGS 1984 UTM Zone 17N.
Climate 09 00023 g007
Figure 8. ISA park. Maximum velocity and water depth for a R = 20 years flood, in red line reconstructed 2007 flood area. Coordinates system: WGS 1984 UTM Zone 17N.
Climate 09 00023 g008
Figure 9. ISA park. Maximum velocity and water depth for a R = 100 years flood, in red line reconstructed 2007 flood area. Coordinates system: WGS 1984 UTM Zone 17N.
Climate 09 00023 g009
Figure 10. Flood damage for buildings and people for a R = 100 years flood. Coordinates system: WGS 1984 UTM Zone 17N.
Climate 09 00023 g010
Figure 11. ISA park. Adaptation scenario A1, hydraulic works as proposed by INRH, with building of a new wall of 5 m a.s.l., and widening of the rio Quibù river channel. Maximum velocity and water depth for a R = 100 years flood, in red line reconstructed 2007 flood area. Coordinates system: WGS 1984 UTM Zone 17N.
Climate 09 00023 g011
Figure 12. ISA park. Adaptation scenario A2, with building of a new wall of 5 m a.s.l., and river channel width like now. Maximum velocity and water depth for a R = 100 years flood, in red line reconstructed 2007 flood area. Coordinates system: WGS 1984 UTM Zone 17N.
Climate 09 00023 g012
Figure 13. ISA park. Temporary flood proofing options, TFP. (a) Self-inflating barriers dislocated for 75 m (5 units 15 m long connected to each other) along the most depressed area. (b) Big bags, 80 units along ca. 360 m. Coordinates system: WGS 1984 UTM Zone 17N.
Climate 09 00023 g013
Figure 14. ISA Park. Long term options SPS. (A) dry weather. (B) flood. The red sign on the right of subfigure A indicates a fallen bridge, submerged during floods. SPS options: 1.a Ground lowering, 1.b drainage system 2. Small permanent, glass-windowed flood wall. 3. Permanent, retractable doors. During dry weather, doors open to allow access the lowered ground, e.g., for maintenance. During flood time, doors close to avoid water entrance. 4. Small permanent dry flood proofing, with back-flow valves to allow water drainage during storms, and return to the river after floods. Valves underwater during flood events. Views from a-f refer to sections in Figure 15.
Climate 09 00023 g014
Figure 15. Qualitative sketches of long term options to defend the SB from rio Quibù floods. (a) State of the area before and after flood. (b) INRH project before and after flood. (c) Permanent improvement with lowering of free land. (d) Lowering of free land, and artificial drainage system. (e) Partial replacement of the wall with a glass-walled barrier, and instalment of vegetation. (f) Fixed retractable doors.
Climate 09 00023 g015
Table 1. Present state. Main hydraulic features of the rio Quibù river.
FeatureSymbol [.]ValueSource
Bottom slopesb [.]0.2INRH, validated in situ 2019
River bottom widthBb [m]8Average of measured sections in 2019
Channel sides slopesc [°]70Average of measured sections in 2019
River banks heighthb [m]2.5Average of measured sections in 2019
Manning coefficientn [m−1/3s]0.04INRH, in situ 2019
Table 2. Design storm, and peak flow in several sections of rio Quibù river for increasing return periods. In bold values related to BR15, used as input for hydraulic model. Provided by INRH.
Return period [y]51020100
Rainfall depth 24 h [mm]131171215341
Design peak discharge [m3s−1]
Calle 2334.043.255.882.4
Puente Rectorado35.445.158.285.9
Puente Calle 1535.945.859.087.1
Puente Ave. 14638.048.562.592.3
Puente Ave. 16441.157.273.9125
Puente Av. 541.157.273.9125
Table 3. INRH adaptation strategy. Main hydraulic features of the rio Quibù river. Distance taken upstream bridge BR15.
Rio Quibù River. Main Hydraulic Features, INRH ProjectSymbol [.]Value
Puente Calle 15 widthBP15 [m]20
River bottom width. 0–295 mB0 [m]12
River bottom width. 295–529 mB295 [m]20
Levee heighthl [ma.s.l.]5
Levee lengthLl [m]354 m (10–364 m)
Table 4. Time of concentration for Quibù basin according to empirical formulas.
Time of Concentration [h]
Kirpich (1940)3.6
Chow (1988)4.4
Viparelli (1961)3.8
Giandotti (1934)7.8
Ventura (1905)12.3
Pasini (1910)11.3
Average7.2
Table 5. Temporary/light flood proofing techniques suitable for protection of the SB. We briefly report strengths, and weaknesses for each option.
SPS/TFP Flood Proofing TechniquesStrengths/Weaknesses
A. Small permanent Floodwalls. SPS
Small elevations (berms) made of soil or other materials (concrete, bricks), just in front of building entrances (doors, basement window, etc.) or of transport infrastructures; light walls partially made in glass (both techniques are considered special kinds of light floodwalls).
Solution smoothing lacks of corresponding heavy solution
The homogeneity of the garden design could be partially affected
B. Small permanent Dry flood proofing. SPS
Air-bricks, that under flood conditions shut off automatically; concrete, brick and (external) masonry, waterproofing-sealer or hydro-repellent paints or protectors; waterproof non-opening windows made with glass blocks or with reinforced glass; back-flow (non-return) valves in sewage/drainage systems, for instance with flaps floating up to block back-flow from sewers (as a special kind of light dry flood proofing).
Water would not be able to come in contact with the building—facades and openings not changed
Facades and openings should be subjected to load and pressure verification-the closure of the openings cannot be permanent in all part of the building and could require additional actions in real time–access to the building would be denied or made more complicated during a flood.
C. Small permanent Wet flood proofing. SPS
Dual function flood vents that counterbalance the pressure on internal and external walls of buildings; hydro-repellent paints or materials on internal walls; elevation of critical appliances and electrical outlets (these techniques are among the principles on which permanent wet flood proofing is based).
Structure stability improved—not impacting on landscape
The uses of the spaces should be different from to that of a school
D. Small permanent lowering/levelling of free land. SPS
Artificial drainage channels and small slopes diverting water from buildings; moving flaps (sometimes to be opened when necessary) or drainage preferential ways favouring the water flows, avoiding stagnation (as a special kind of light ground lowering/levelling of free land).
Similar to heavy solution and to floodwalls light solution, but excluding spatial design (storage and diversion areas) and important ground movements. Based on canalization, drainage, water distancing.
Some workload necessary for design, and construction of small channels/ditches.
E. Floodwalls removable group 1. TFP
Stacking of individual base units filled with solid materials acting on gravity. Sandbags, temporary dikes containing reinforced earth/loose soil, as well as bags filled with innovative absorbent materials.
Conceptually easy to be put in place
These structures require some work, really time consuming if bag piles are high.
F. Floodwalls removable group 2. TFP
Self-deploying or self-supporting (reticular) mobile barriers.
Technically easy and quick to deploy (self-inflating)—easy to store
Possibly complex to deploy (reticular). Relatively time consuming (reticular). Need flat terrain (reticular)
G. Wet flood proofing Removable. TFP
Hydro-repellent sacs or similar protections systems for indoor movable goods, as big sealable plastic bags;
Easy to deploy in real time
Need for workforce
H. Ground lowering/levelling of free land Removable. TFP
Water diversion temporary activated pipes or bridges, composed by devices which do not stop but deviate water.
Easy to deploy
Need for maintenance
Publisher’s Note: MDPI stays neutral with regard to jurisdictional claims in published maps and institutional affiliations.

