Multisector Risk Identification to Assess Resilience to Flooding


1
Urban Water Unit, National Civil Engineering Laboratory, LNEC, Av. Brasil 101, 1700-066 Lisbon, Portugal
2
Lisbon City Council, Câmara Municipal de Lisboa, CML, Praça José Queirós 1–3° piso–Fração 5, 1800-237 Lisbon, Portugal
3
Almada City Council, Câmara Municipal de Almada, CMA, Rua dos Lusíadas, Bairro do Matadouro, 2805-027 Almada, Portugal
4
CERIS, Civil Engineering Research and Innovation for Sustainability, Instituto Superior Técnico, University of Lisbon, Av. Rovisco Pais 1, 1049-001 Lisbon, Portugal
*
Author to whom correspondence should be addressed.
Climate 2021, 9(5), 73; https://0-doi-org.brum.beds.ac.uk/10.3390/cli9050073
Submission received: 28 February 2021
/
Revised: 19 April 2021
/
Accepted: 21 April 2021
/
Published: 30 April 2021
(This article belongs to the Special Issue Climate Change Impacts at Various Geographical Scales)
Abstract
:Climate trends suggest an increase in the frequency of intense rainfall events and the aggravation of existing conditions in terms of flooding in urban areas. In coastal areas, conditions are aggravated by coexistence with coastal overtopping. Flood risk control is complex, and the interdependencies among the services and sectors in urban areas imply the need for adoption of approaches that embrace the interplay between service providers to ensure critical urban functions. Flooding incorporates several hazards. Assessment of resilience to multiple hazards in complex environments benefits from integrated and multi-sectoral approaches. A common constraint resides in the limited data and tools available for undertaking these complex assessments. This paper proposes a risk-based methodology to assess urban areas’ resilience to flooding by addressing sectors’ interdependencies in a context of limited data and ready-to-use tools. Multisector flood risk identification is pursued with the support of a geographic information system and is applied to Lisbon with a focus on the cascading effects of drainage system failures on buildings, populations, mobility, waste management, and electricity supply. The results demonstrate the potential for combining data and knowledge from different sources with dual modelling approaches, thus allowing one to obtain trends of exposure and vulnerability to flooding for current and climate change scenarios. This methodology facilitates dialogue among stakeholders and decision levels by contributing to capacity building, and it contributes to sustainable development.
1. Introduction
Climate change has the potential to aggravate existing conditions in urban areas and to increase the likelihood and consequences of extreme events, as well as to reduce the performance of urban water systems during less severe conditions [1]. Flooding is recognised as a leading source of risk events, with the potential to cause significant consequences for society, including the disruption of critical functions and economic activities, leading to social, economic, and environmental consequences [2,3,4].
The consequences of flood events are multidimensional, including adverse effects on water services, the health and safety of populations, socioeconomics, and the environment. Mobility, waste, and electricity supply are some of the sectors that are often affected by flooding, with the potential to propagate their effects in a cascade of events [5,6,7,8,9,10,11].
Two main climate change effects are significant contributors to flooding risk, especially in coastal areas: the increasing frequency of severe precipitation events and the increase in coastal overtopping due to storm surge effects and rising sea levels. The adoption of more resilient solutions can be difficult in consolidated urban areas, which have functional infrastructures with high asset values and construction density [11,12].
Currently, recurrent flooding happens due to local climate dynamics and the limited capacity of existing drainage infrastructures in urban areas. Many local communities are used to dealing with flood events or are at least regularly confronted with these. Even without the effects of climate change, there is an urgent need to address and reduce flood risk in current situations. The causes are common to many urban areas: The expansion of built areas and the increase in surface imperviousness [13], together with accepted design criteria that limit the transport capacity of drainage systems to low-rainfall-return periods, which are often not higher than 10-year return periods, imply the acceptance of risks without full realisation of the implications [2,14,15,16]. The weak interplay between land planning and water management also does not make an allowance for exceedance, i.e., when the drainage system capacity is reached and overland flows increase, often without room for water to flow on the surface without major consequences [15,17]. Even without the effects of climate change, levels of resilience can already be low, and the risk of flooding is not acceptable in many cities. Herein, the resilience concept adopted is “the ability to absorb, adapt, and recover from disruptive events in a path towards increasing sustainability” [7]. Any approach to tackle resilience in complex and dynamic systems implies the acceptance of several limitations on data, tools, and resources and explicit consideration of the uncertainties of meteorological events [8], even if quantification is not feasible. In such a situation, the use of diverse information and methods can increase the reliability and validity of the results [18].
The effects of floods on essential urban services are a major concern [5,6], and ensuring critical urban functions is essential for dealing with climate dynamics and the associated risks. Assessment of resilience to natural hazards benefits from integrated and multisectoral approaches that embrace each strategic urban sector and the interactions between them, and the application of risk management processes to address resilience has been recognised as a robust approach by several authors, as described in the literature [19]. A common constraint resides in the limited data and tools available for undertaking these complex assessments [19]. The challenge is to make the best use of available information and tools to build a consistent path to fostering both resilience and sustainability.
Assessments of resilience and of potential adaptation options depend on two key steps [12,20,21] in the characterisation of flood events: exposure to these hazards and estimation of vulnerability. The spatial identification of exposure and characterisation of vulnerability, which allow the estimation of the magnitude of the consequences, are key in proceeding to the assessment of the action priorities and the selection of adequate measures for increasing resilience. Incomplete hazard characterisation affects the robustness of subsequent analyses, from exposure to impact estimation and to measurement of effectiveness. Hydrodynamic flood modelling is a valuable tool for flood risk management when combining the characterisation of the hazards with spatial representation and other layers of information that are relevant to exposure and vulnerability assessment (e.g., [21,22]). However, such complex tools are often not readily available at the city scale.
The work presented herein is part of a broader approach (the RESCCUE project: resilience to cope with climate change in urban areas—a multisectoral approach focusing on water) to enabling the assessment, planning, and management of city resilience by incorporating new and existing knowledge of urban systems’ performance under climate change conditions in a water-centred multi-risk assessment of strategic urban service performance using a comprehensive resilience platform that incorporates technical approaches while involving stakeholders in the process and stimulating knowledge sharing and active participation [23]. This combination is recognised as key to resilience building, especially in multisectoral approaches [19,24,25].
The purpose of this paper is to propose a risk-based methodology to assess resilience to flooding-related hazards of essential functions and services in urban areas, addressing sectors interdependencies, in a context of limited data and ready-to-use tools. Multisector flood risk identification is pursued with support of a tailored geographic information system (GIS). The approach is applied to Lisbon city as a study case focusing on cascading effects of failures of the drainage system on buildings, resident population, and in three main sectors: mobility, wastes management, and electricity supply.
2. Lisbon City Overview and Data Sources
Lisbon city is part of the largest Portuguese metropolitan area, including 18 municipalities, and has the second-largest European port on the Atlantic Ocean. The city history goes back to pre-Roman settlements and is shaped by influences of many cultures over time and by the extensive Tagus estuary riverfront. Characteristic figures for Lisbon city are listed in Table 1. The climate is temperate, classified as a Mediterranean climate (Köppen climate classification: Csa), with dry and hot summers and wet and fresh winter periods.
Climate change trends for Lisbon include the increase in average air temperature, decrease in annual and non-wet season rainfall, increase in wet-season rainfall and intense rainfall events frequency, average sea level rise, and increase of coastal floods frequency. The combined action of intense rainfall, wind, and sea level rise with tides and storm surges is especially relevant for Lisbon’s context and geographical position [18].
Both the municipality and the Lisbon metropolitan area are involved and proactively committed to increase the resilience of the region and actively contribute to the 17 Sustainable Development Goals. Lisbon actively participates in numerous international initiatives including the C40 network, the 100 Resilient Cities, the Eurocities, the Covenant of Mayors, and Making Cities Resilient (MCR) Campaign, largely investing from strategic to practical actions to increase city sustainability [28,29,30,31]. Representatives of the sectors analysed are involved in the whole process. In Table 2, the list of main stakeholders and their level of involvement are presented.
Data utilised in this study were supplied by the involved stakeholders. Datasets used for the assessment of consequences of events were mainly from the National Statistics Institute (INE) 2011 Census (BGRI) [26], namely regarding resident population, and data collected and recorded in the municipality GIS system, e.g., existing buildings, infrastructures, and other land use data. The latter are regularly updated by the municipality services.
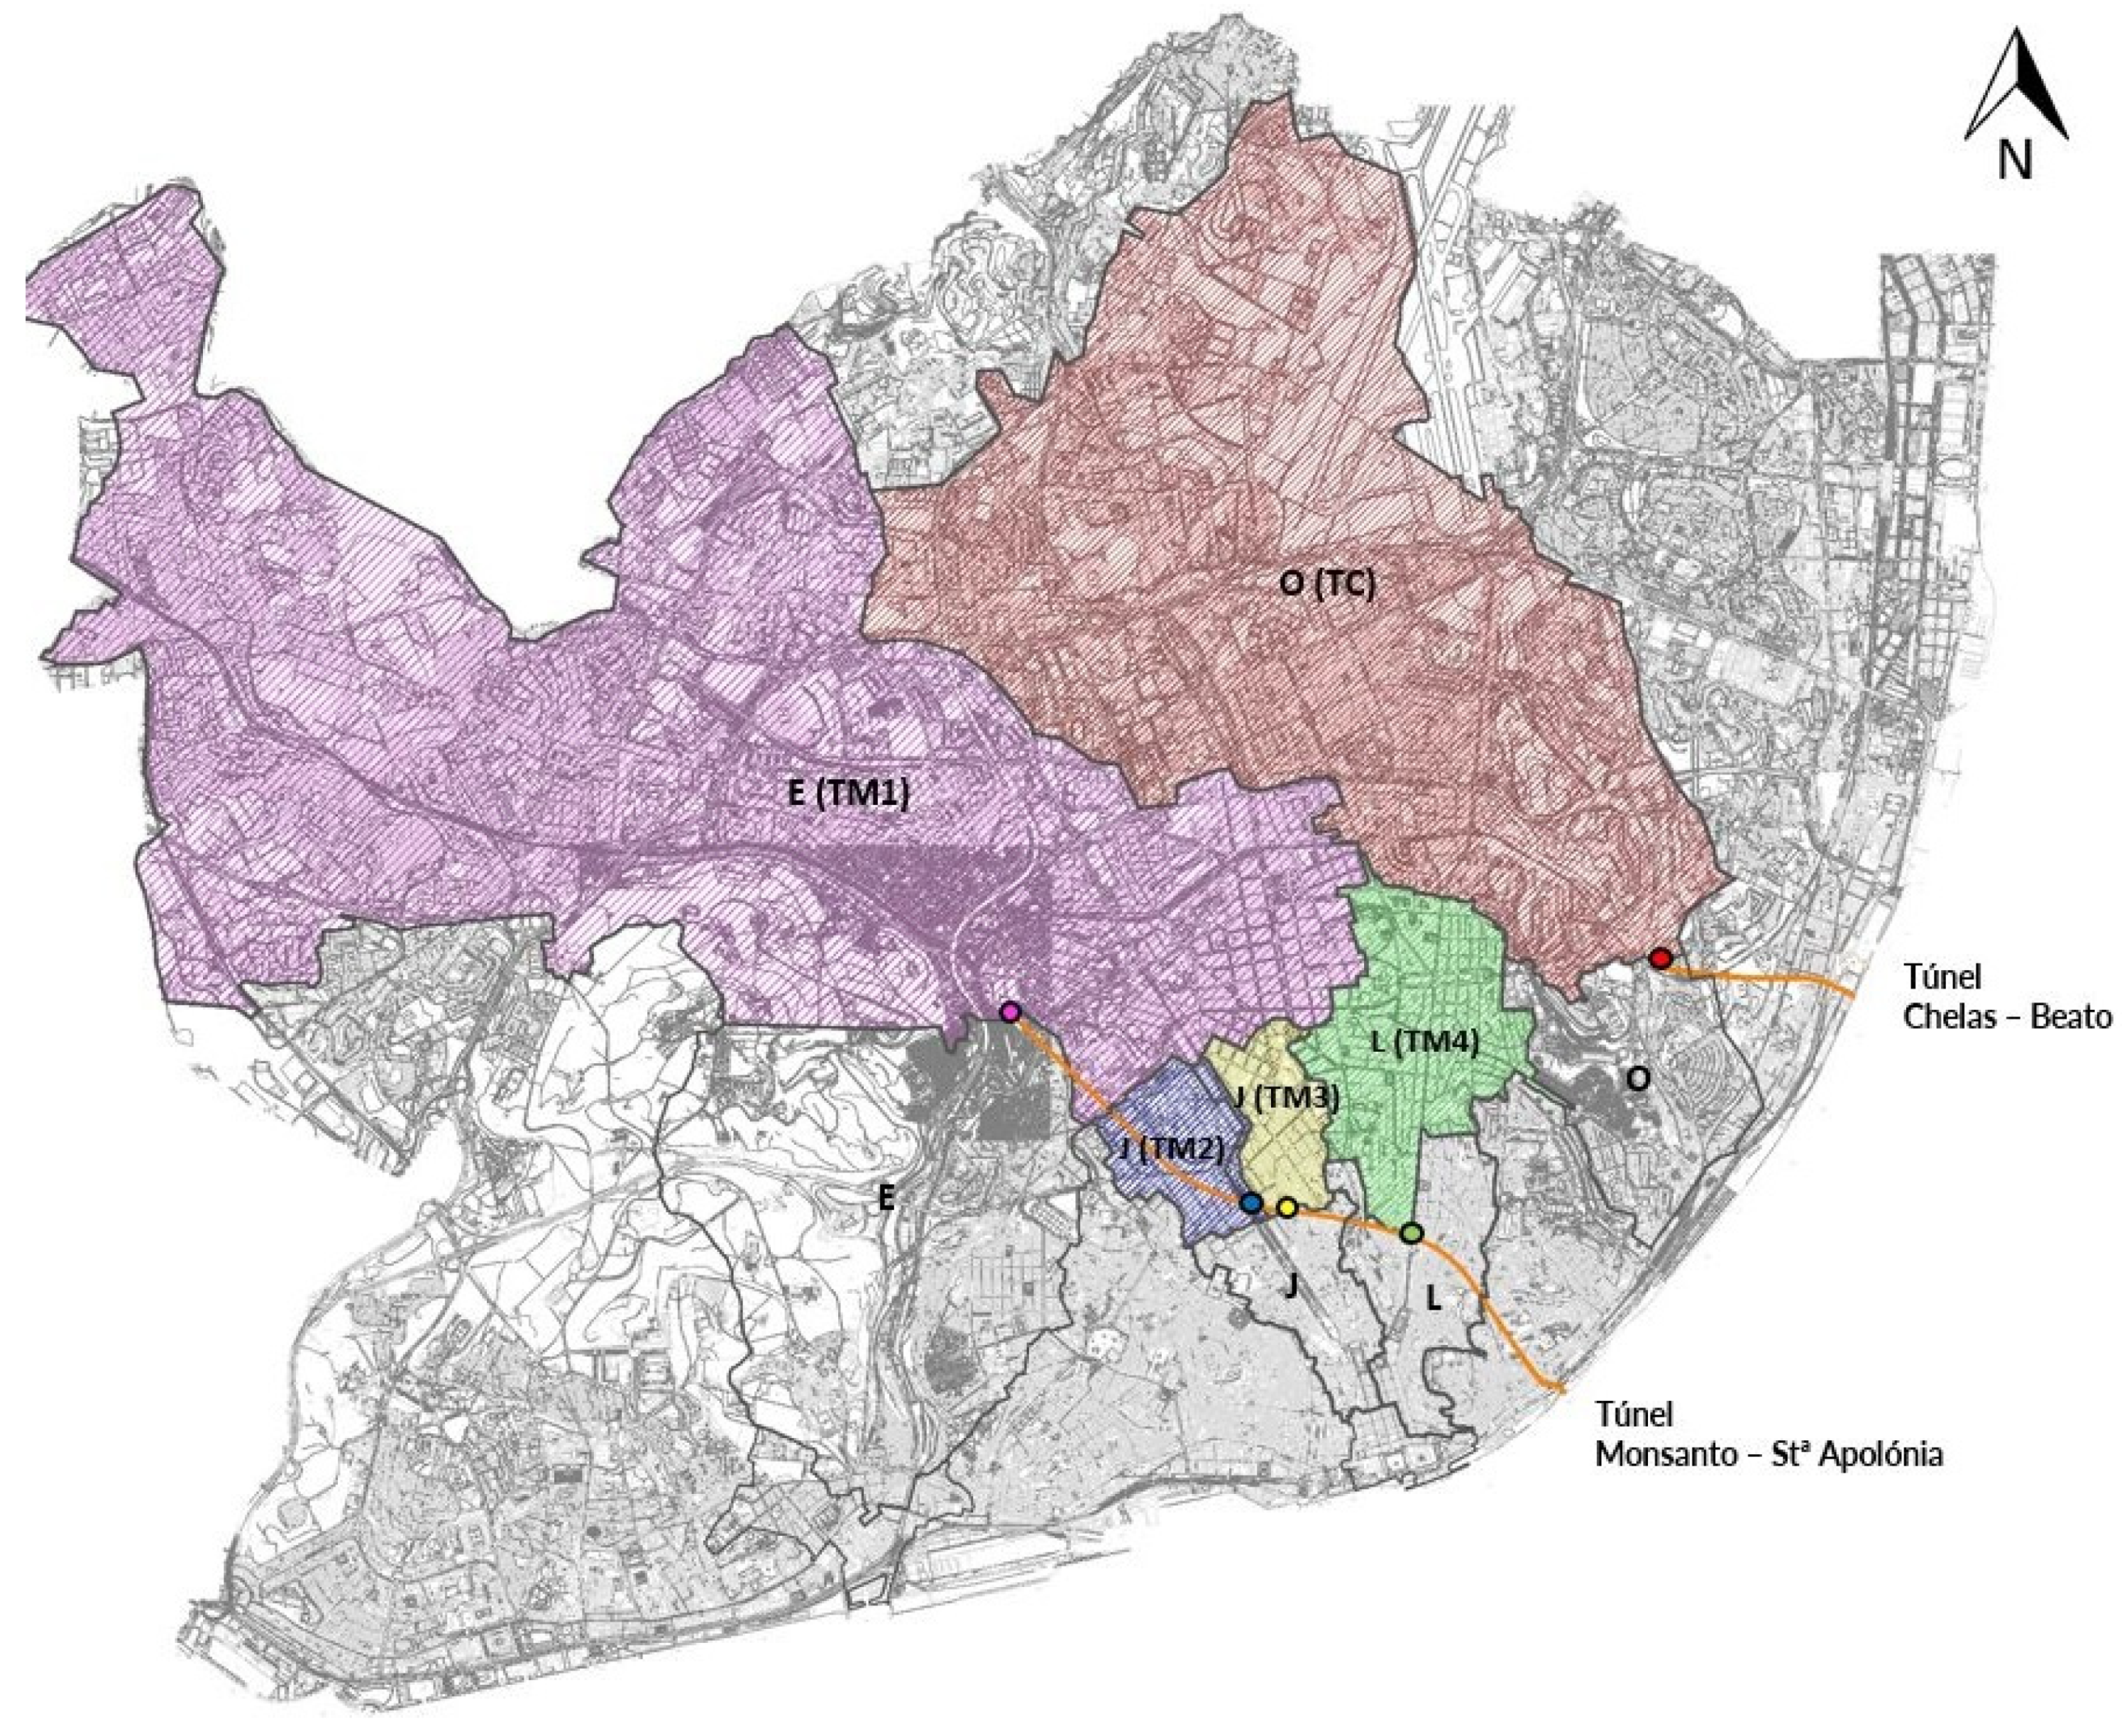
As for measures for increased resilience to climate change, the several options included in municipality planning instruments [32,33,34] were investigated. One of those considered to have good potential to reduce flooding risk is used herein to illustrate the potential of the approach used. This measure consists in the construction of large interceptor sewers to deviate flows from the upstream city areas, avoiding large rain-induced volumes to reach the downtown riverside catchments already experiencing frequent flooding. Figure 1 represents the new components to be built and areas from where flows are intercepted.
3. Methodology
3.1. Methodology Main Steps
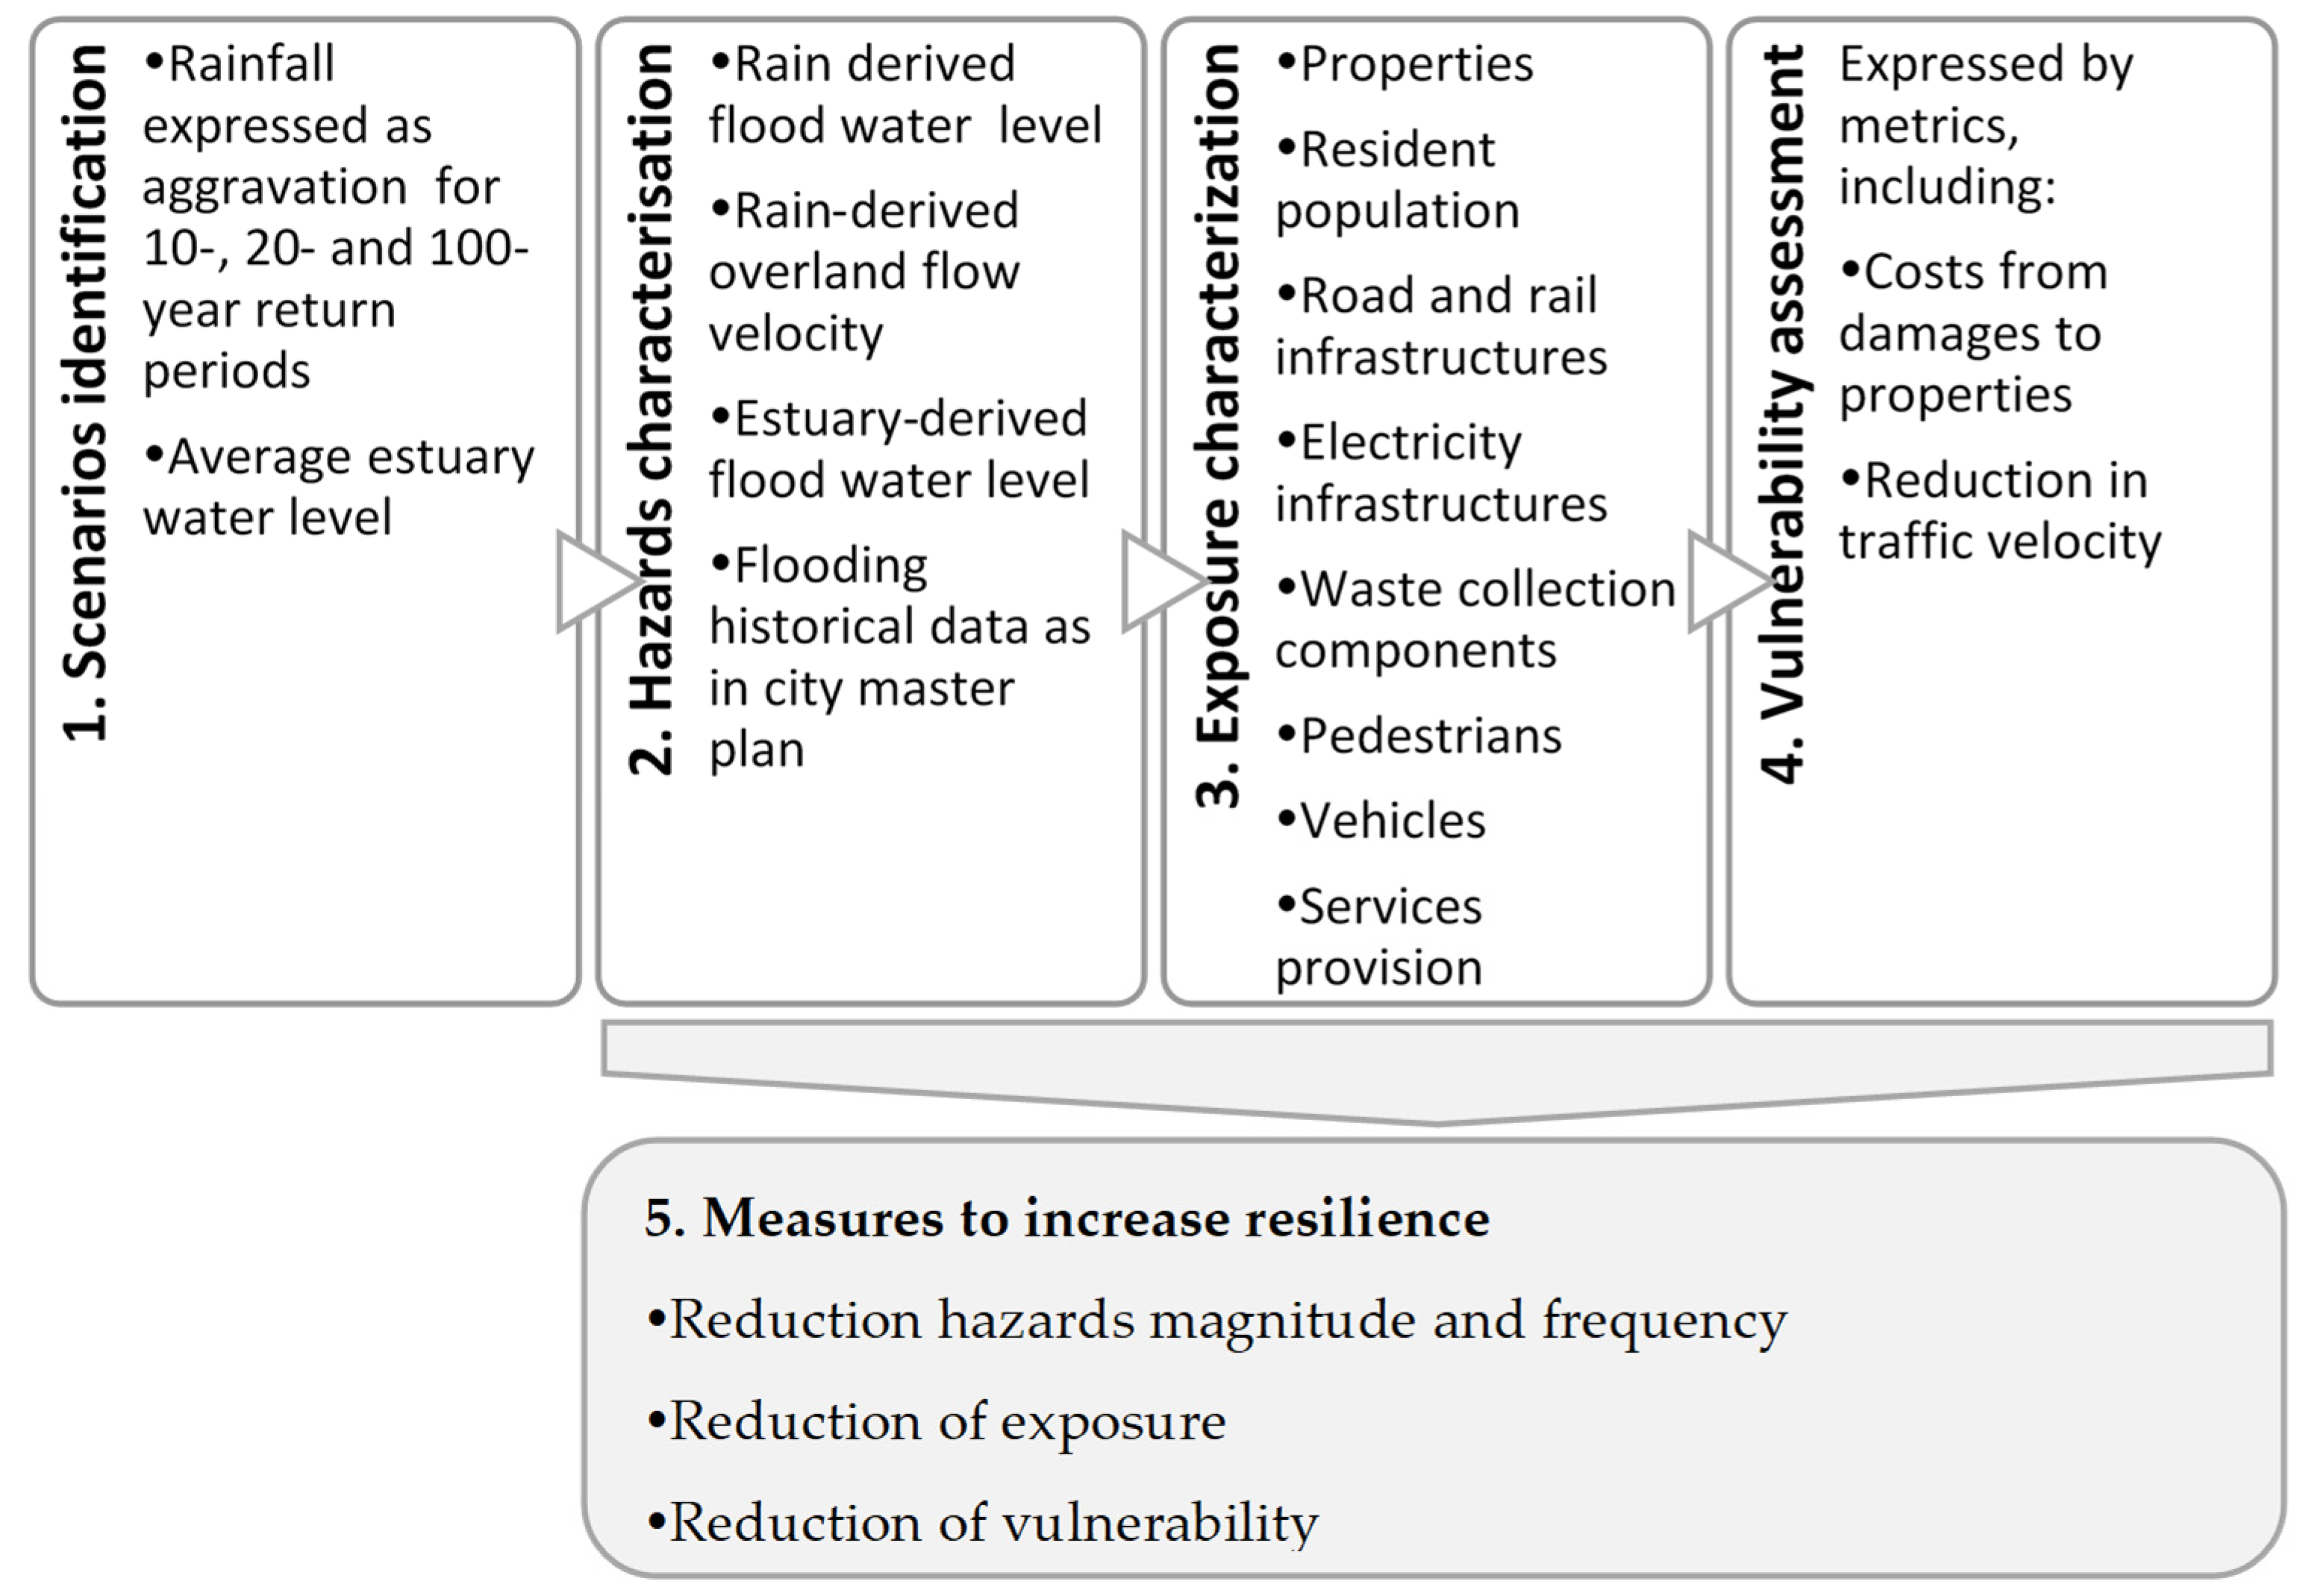
The methodology is grounded in a risk-based approach as presented in Figure 2, structured in five main steps. The aspects selected were those found to be compatible with the data available and municipality strategies.
The information available is also limited to allow to estimate risk levels, and the option is to direct potential action to measures allowing to increase resilience by reduction of hazardousness, exposure, and vulnerability to the selected hazards. As demonstrated by [36], strong knowledge results in higher confidence, and herein not enough information is available to allow a reliable estimation of risk figures. Reference [36] (p. 44) highlights the issues to address to strengthen knowledge: “the reasonability of the assumptions made; the amount and relevancy of data/information; the degree of agreement among experts; the degree to which the phenomena involved are understood and accurate models exist; the degree to which the knowledge has been thoroughly examined”. The methodology proposed in this paper is inspired by this type of approach.
The methodology is for the city and sub-catchments assessment scales and is intended to support strategic planning at the city level. Detailed analysis at the block or building scale is not included within the scope of the paper and is appropriate after priority areas and critical services are identified.
3.2. Scenarios Identification
The analysis and assessment of resilience to flood events need to be carried out for relevant scenarios, representative of expected changes in circumstances. For the proposed approach, it is necessary to select climate scenarios and possible future changes in city land use and infrastructure modifications pertinent to the risk of floods.
Scenarios for climate change were selected and quantified for setting the model inputs and boundary conditions. Available studies on climate change in Lisbon [37,38] allowed characterizing the current situation and a selection of climate change representative scenarios for rainfall and Tagus river estuary levels. These scenarios are aligned with those used by the Municipality for climate adaptation planning purposes.
Regarding rainfall, two climate scenarios were studied: the current climate situation and a future situation where climate change is accounted for. For both situations, three return periods were selected (10 years, 20 years, and 100 years) to consider the variations in precipitation intensity and corresponding likelihood. For the current situation, used as a baseline, I–D–F curves from national meteorological data were used [39]. The rainfall intensities for climate change scenarios were estimated on the same basis and by using the change factors obtained in reference [40].
Regarding estuary water level, to limit the number of hydraulic simulations to be carried out, an average estuary water level was adopted for each climate situation. The reference period for the future situation taking climate change into account is 2071–2100 (worst-case scenario) [37].
For modifications in city and infrastructure modifications, potential modifications in the land use and infrastructure should be selected to enable to assess the potential effect in resilience to flooding for both current climate characteristics and expected climate changes as represented in selected climate scenarios.
The final list of scenarios is a combination of selected climate and infrastructure settings.
3.3. Hazards Characterisation
GIS-based identification and mapping of flood-related hazards, risk factors, and risk sources methodology are detailed in [18]. It is based on a methodological triangulation approach to deal with data limitations, adding reliability and validity to results, and involves main sectoral stakeholders to ensure capturing relevant issues and perspectives. Three flooding-induced hazards are relevant for assessing flood resilience: rain-derived flood water level; rain-derived overland flow velocity; estuary-derived flood water level.
Limitations on data and tools can limit the development of this step, especially when detailed mathematical models of the drainage systems and surface flows are not available for the whole area under analysis. Detailed records of flooding events are also a valuable source of information, but often these records are not sufficiently detailed to enable the application of statistical methods.
To overcome the limitation in urban drainage mathematical modelling tools, a dual modelling approach was used: a simplified hydraulic model applied to simulate the primary drainage network allowing a citywide application and a more detailed hydraulic model of the drainage network and overland flow applied to sub-catchments of the city.
The dual modelling approach is detailed in reference [18], but in summary, the main characteristics are:
- Lisbon Municipality citywide drainage system (1D GIS Model): the 1D GIS Model is used to simulate the sewers’ capacity facing estimated wet weather flows for different return periods, testing the hydraulic behaviour of the system by applying the Manning–Strickler equation. The main output used for the study is the hydraulic capacity of the primary sewer system network.
- Lisbon Downtown catchments J and L (1D/2D Combined Model): the 1D/2D Combined Model SWMM+BASEMENT (CMSB) model allows integrating the performance results of the drainage system facing different return periods and tide levels into the surface runoff modelling. The main outputs of interest for the present study are the flooded areas, the surface water levels, and the hydraulics in the sewer network.
With this dual modelling approach, the magnitude of flood-related hazards is only obtainable for two critical downtown sub-catchments with the later model. Estimation of hazard magnitude is undertaken only for the current situation for the city, making use of flooding historical data as included in the city master plan [34]. To overcome this limitation in simulating future scenarios, a proxy of the flood occurrence is used, namely the sewer system hydraulic capacity used for the peak flow of the simulated events, which can be obtained for the whole city. Impact on aggravation of sewer system hydraulic capacity is a risk source for flooding and an indicator of the parts of the network that have lower transport capacity. In Table 3, the selected criteria and metrics to characterise flood-related hazards and risk sources, depending on the model used, are presented.
By simulating selected scenarios, defined as combinations of climate scenarios and systems’ configurations, data were obtained allowing us to proceed with the next steps, providing the information to analyse not only the current situation but also estimation of climate-change-induced deviations in the magnitude of the flood-related hazards for the scenarios.
3.4. Exposure Characterisation
Analysis of the information available for the sectors under study allows selecting the dimensions and metrics for exposure to flooding assessment. In the Lisbon study case, the following were selected:
- Exposure of buildings to flooding by water level classes.
- Exposure of the resident population in the exposed buildings.
- Exposure of pedestrians in terms of areas associated with the four hazard levels as a function of overland flow water level and velocity.
- Exposure of transports infrastructures—roads, i.e., road network exposure metric to flooding hazards, assessed as % of total length.
- Exposure of transports infrastructures—rails, i.e., rail network exposure metric to flooding hazards, assessed as % of total length.
- Exposure of transports infrastructures—stations, interfaces, and tunnels, i.e., components that can be critical due to passenger flows or limited escape routes for vehicles, assessed as % of total length.
- Exposure of electricity infrastructure—identification of installations located in areas where flooding events occur.
- Exposure of waste collection components using two main metrics, exposure to flooding of waste collection bins and locations by water level classes and hazard, as % of the total.
3.5. Vulnerability Assessment
The operationalization of vulnerability assessment in a data-scarce reality is limited to a broad evaluation of the degree to which exposed elements are affected by flooding events. Assessment of potential impacts is sought using a simplified approach allowing one to take advantage of the available data.
For the study case, the vulnerability assessment at the city scale was found to be limited given the need for data on flooding associated with scenarios under analysis (i.e., water depths or areas). Therefore, at this broader scale, it was found feasible to evaluate the impact for the whole city, only for the current situation, using the flooded areas as defined in the Lisbon master plan to obtain a broad estimation of the impacts, expressed as the number of buildings and resident population located in the different areas, very much as exposure results. At this scale, it was not possible to obtain impacts of flooding on properties, pedestrian or vehicle traffic, transports infrastructures, or wastes collection components.
Using a model including the simulation of surface flows allows obtaining a more detailed vulnerability assessment. For the study case, a more complete multisector impact assessment was undertaken to the downtown catchments using the following criteria and indicators:
- Potential damages to buildings—an appraisal of financial consequences using average values from the literature for similar urban settings is feasible. Indicators of impact are based on estimated average damage costs on properties as a function of flooding water level classes.
- Vulnerability of resident population—detailed data on population characteristics (e.g., distribution of elderly people and families with small children, population with limited mobility, low-income population) enables estimating vulnerable population affected. For the study case, the only indicator of impact obtained with available data was the number of residents in the affected buildings.
- Impacts on mobility network and traffic velocity—the main impact on mobility network considered is the impact on serviceability of transport infrastructures and the traffic of vehicles. It was practicable to derive the impact on traffic velocity for the downtown catchments J and L since estimates of flooding water level are available. Despite characterisation of hazards to pedestrians and vehicles since traffic flows are not available, direct estimates of consequences on these flows are not possible to obtain. The serviceability of the network was assessed using the classification of the roads adopted in Lisbon (scale 1 to 5). The impact of flooding water levels on traffic was obtained from published studies on traffic velocity [7] using the criteria given in Table 3 adapted to Lisbon. The values of velocity in this table are the “maximum acceptable velocity that ensures safe control of the vehicle given the depth of water”. Herein, larger vehicles were not included (e.g., buses or trucks), and impacts also depend on specific vehicle characteristics, such as “raised or watertight sensitive electronics and air intakes can allow safe driving in depths up to 45 cm, or even 90 cm. For smaller cars, the literature suggests that 15 cm depth may be sufficient to stall a car” [7] (p. 73).
- Impacts on waste collection—the approach to model the effect of flooding events on wastes management in Lisbon takes into consideration the events recognised as disruptive to the city and the data available, including location, number, and type of bins throughout the city. Failure of the drainage system causes disruptions on waste collection components, including bin overturn, dragging, floating, filling with water, and damage. Additionally, it can also cause delays in the collection services, but this is considered as a disruption derived from impacts on the transport infrastructure. The approach for wastes services and components follows the one used for traffic and transport infrastructures, which is a GIS-based surrogate model making use of available information and results from the flooding model, thus allowing obtaining results to support the decision on the course of action to face expected effects of climate dynamics. The historical flooding records together with mapping of bins and collection locations allow us to determine the exposure of bins and collection locations as well as their vulnerability to flooding as a function of the collection modes and positioning of bins but only for the current situation. For the downtown catchments J and L, the analysis of the selected scenarios were carried out using the results of the simulations using the 1D/2D CMSB model. Results together with mapping of bins and collection locations allowed estimation of exposure and vulnerability for both current situation and climate change scenarios, also considering the different solutions in place.
- Impacts on electricity supply—the electrical sector, deemed essential for the city, has a Quality Service Zone Type A for the design and planning of the network, implying the existence of incremental layers of resilience and the robustness of the grid while minimizing the impact in case of disruption. A Type A Zone has high-level redundancy in the electricity supply service [39]. Most infrastructures are not exposed to flooding-related hazards, and the few exposed have been refurbished after a flooding event. Therefore, in this case, the electricity supplier did model internally the performance of the network for the failure of exposed assets and obtained low levels of risk for the events under study. The approach was simplified and consisted of field visits with mixed teams to check the remaining exposure.
Application of these steps involved representatives of the sectors and included fieldwork to identify measures already in place and vulnerability in selected locations.
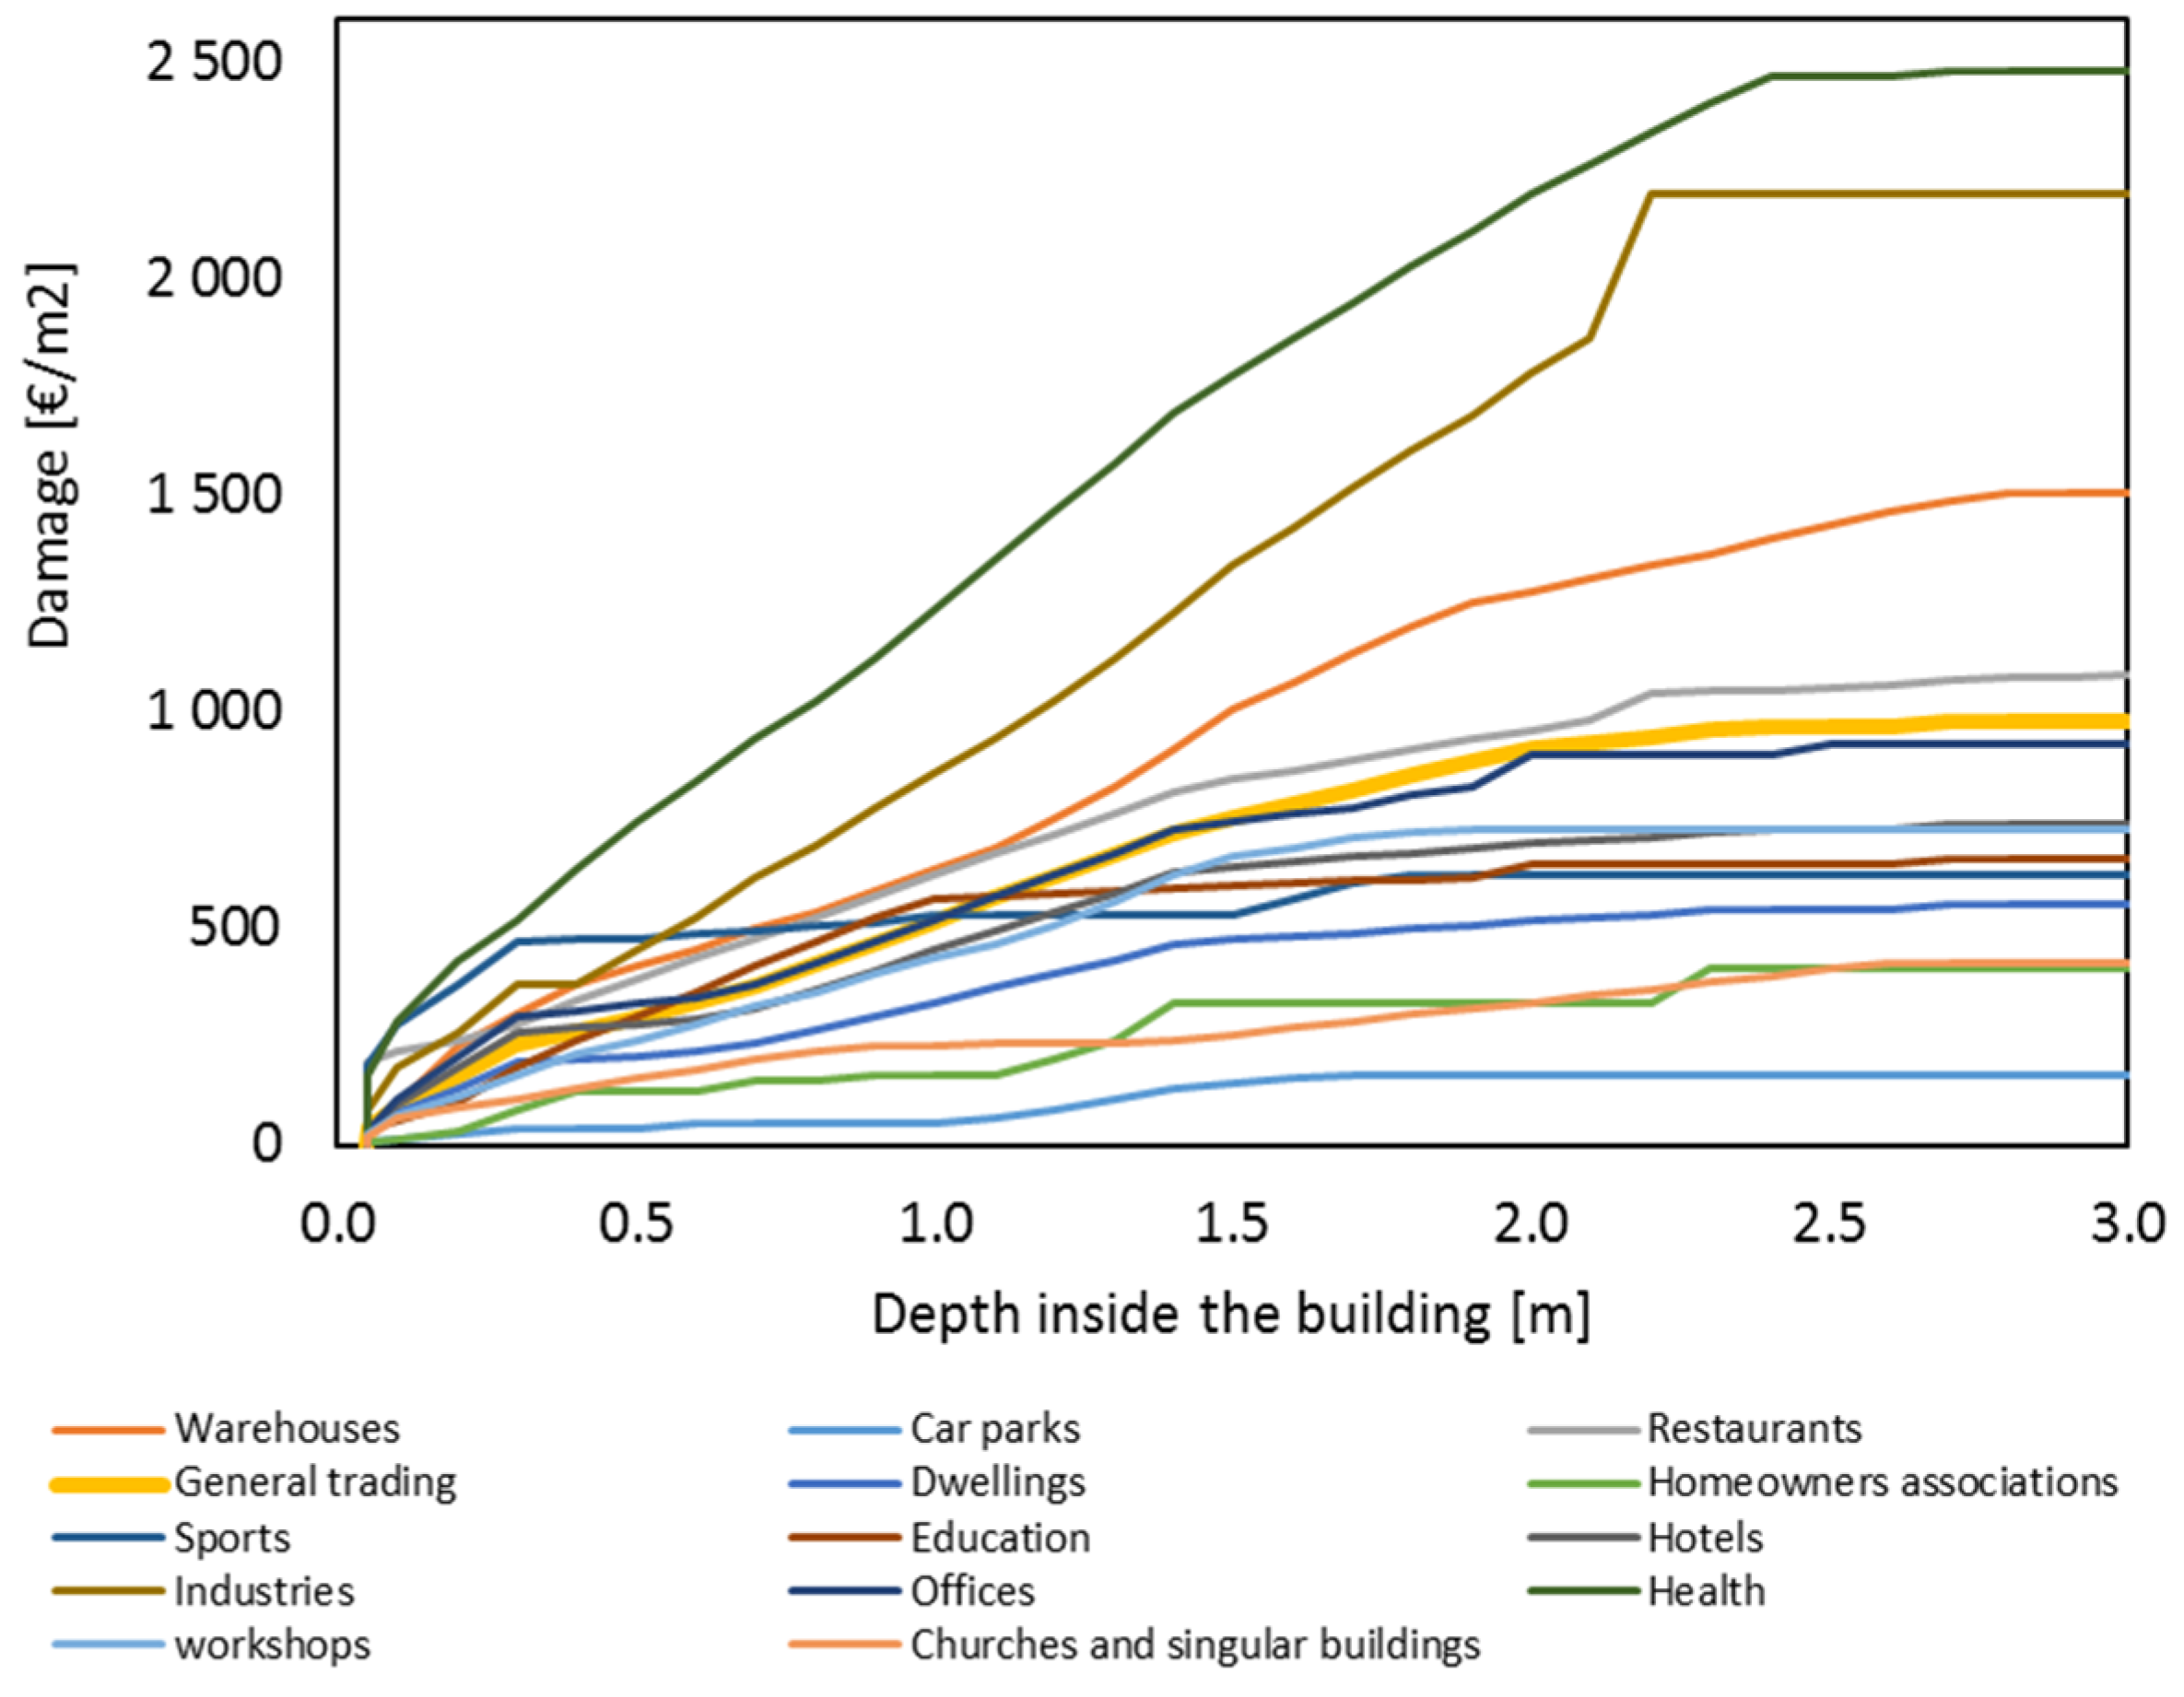
The estimation of average damage costs on properties as a function of flooding water level classes can be obtained from depth–damage curves. With these curves, the number of properties affected by flooding was obtained by identification of those properties where nearby flooding water level exceeds 0.2 m and then which are exposed to four classes of water level. Since no specific data for depth–damage curves is readily available for Lisbon, and despite the socio-economic differences of the two cities, the preliminary assessment of impact uses the depth–damage curves obtained for Barcelona [42] (Figure 3). Since these catchments are largely dominated by commercial activities especially on the ground floors, the curve for “general trading” was selected. For this case, a sealing ratio (water depth inside/water depth outside) of 0.21, 0.43, 0.63, and 0.84 was used respectively for classes of outside water depth (0.2–0.4), (0.4–0.6), (0.6–0.8), and (0.8–1.0).
Knowledge of traffic and pedestrian flows in the city can be used to estimate vulnerability if reliable figures are available. Flooding impact on pedestrians was estimated using a function of overland flow water depth and velocity, following the method detailed in reference [41] and using the flood hazard rating presented in Table 4. Flooding impact on vehicles (passenger cars) was estimated using the method presented in reference [9].
Using these criteria and results from hydraulic simulations, potential impacts on the use of road networks were estimated. Regarding tide-induced flooding, a similar analysis is not viable since information on flooding water levels is not available.
3.6. Measures to Increase Resilience
Selection, evaluation, and implementation of measures to increase resilience allow one to reduce flooding risk. Different types of risk control measures are reported by different authors, e.g., [44,45]. Frequently, types of measures are associated with risk factors, often divided into human, environmental, and equipment. Risk control measures can effectively contribute to control flood risk, authors in resilience often consider measures in three categories—resistance capacity, absorption capacity, and recovery capacity—while ensuring adaptation or building back better, e.g., [19,43,46]. Many possible measures exist, adapted to different applications, and a list of main general types includes [19,47]:
- Barriers—any physical impediment or containment method that tends to confine and/or restrict a potentially damaging condition, reducing the probability of events, or containment of event after its occurrence, reducing consequences.
- Redundancy—additional, identical, and redundant components in a system introduced to decrease the probability of failure of subsystems.
- Increase components or systems reliability—substitution of critical elements by more reliable ones.
- Increase components or systems effectiveness—substitution or improvement of system elements by more efficient ones, including upgrading of technology.
- Maintenance—adequate preventive or corrective maintenance activities can reduce failure rates and consequently the likelihood of events.
- Control and alarm systems—detection of failure states, the existence of unsafe conditions, using monitoring, testing or inspection, and actions to change the state of systems.
- Accident mitigation—safe shutdown, continuity in the availability of utility’s services, adequate confinement integrity, and emergency preparedness.
- Insurance and outsourcing—the option of risk-sharing with another party typically includes insurance and careful contract management, for instance, outsourcing.
- Avoidance of a risk—measures that involve, for instance, avoiding exposure and deciding not to locate a critical activity where hazardousness is significant.
- Economic and accounting policies—management practices including reserve funds to face events with a high consequence but low likelihood available as a resource for proper risk management.
- Adaptation of user and public behaviour—changes in behaviour of system users or the public allowing the risk reduction by decreasing the probability or the consequence of an event.
4. Results
4.1. Scenarios Identification
Combinations of climate scenarios and infrastructure settings are then the basis used for the sequent methodology steps. For the Lisbon study case, these working scenarios are identified in Table 5. Rainfall events used in simulations were standard design hyetographs as defined by national regulations, using as parameters the rainfall maximum intensity (Imax) and the concentration time for the catchments under analysis.
4.2. Hazards, Exposure, and Vulnerability: Citywide Assessment
4.2.1. Properties and Number of Residents
Results from the GIS surrogate model for the current situation are summarised in Table 6. Since the available information for flooding is only related to frequency, without any water depth data, it is not possible to have an approximated value of the financial damages. Looking at the scenario for tide-induced flooding, the number of exposed properties is expected to increase slightly. For rain-induced flooding, it is only possible to estimate exposure for the current situation.
Most parishes are affected by flooding historically. Population affected in riverfront parishes is already facing frequent rain-induced flooding. For tide-induced flooding, values for the simulated scenarios show a trend number in coastal parishes of an increasing number of inhabitants exposed for BAU situation, but values for both scenarios were found to not differ significantly considering the uncertainties in data and tools.
Citywide results (Table 7) show a similar increasing trend in aggravation of the use of sewer capacity throughout the city. Considering climate change drivers and the hazard classification adopted, it was found that the urban drainage performance is mostly aggravated for the T100 scenario, where it is worsening the hazard classification by 13.2% for the analysed sewers. For T010 and T020, this change is 11.7% and 9.0%, respectively. In riverfront parishes, aggravation is expected from both sources of flooding.
These values are a starting point to estimate consequences, much dependent on the water level at each location and buildings’ vulnerability to flooding. These results provide information for setting priorities in the implementation of adaptation measures.
4.2.2. Mobility Network and Traffic Velocity
Results from the GIS surrogate model for the current situation are summarised in Table 8. For rain-induced flooding, it is only possible to estimate exposure for the current situation, but globally higher exposure was found for rails than for roads. Looking at the scenario for tide-induced flooding, the number of exposed properties is expected to increase slightly.
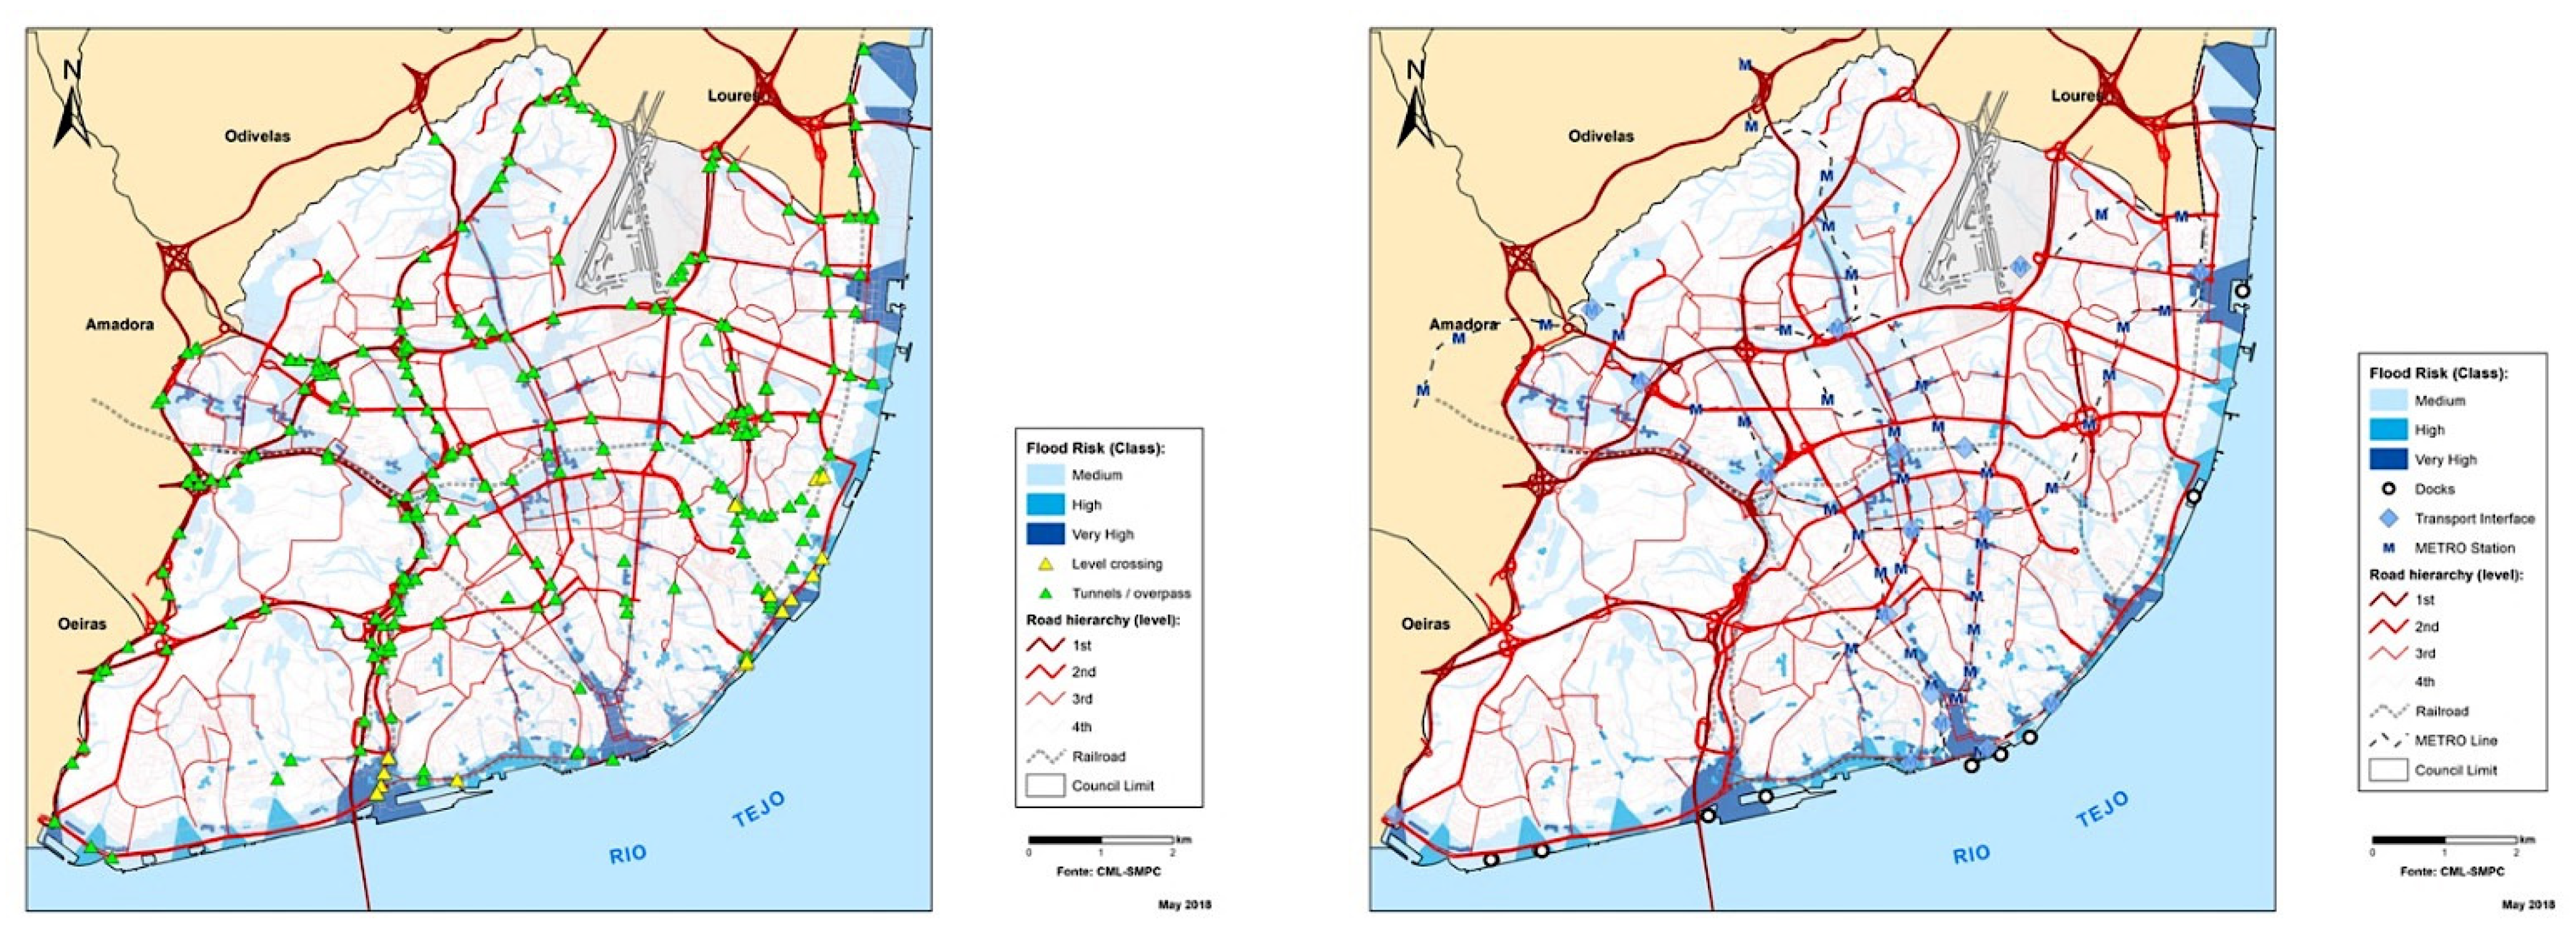
For the current situation, exposure of interfaces, underground stations, road tunnels, rail tunnels, and level crossings to rainfall-induced flooding hazards (moderate to very high) is quite significant with 65%, 52%, 28%, 33%, and 81%, respectively. These components of the transport infrastructures are critical and need to be investigated on an individual basis to assess vulnerability. Tunnels, for instance, are critical since often accumulation of water during wet weather is accompanied by failure of pumping systems ensuring drainage of the volumes accumulated as a result of the concentration of overland flows. In Figure 4, critical locations are represented per type.
4.2.3. Waste Collection
Globally, in Lisbon, there are 55,237 collection locations and 204,004 bins. These are serving the 547,733 inhabitants, 243,892 families, 52,500 buildings, and 350,000 households. The available collection types in Lisbon are:
- Large public bins (bring banks)—several bins for different types of wastes.
- Door-to-door (PaP)—inside buildings, bins, or bags, outdoor only at specific hours on specific days.
- Pneumatic—the network of underground vacuum conduits to collect wastes.
- Self-delivered (centres for deposition of wastes by consumers).
A significant number of those bins permanently outdoors and exposed to flooding have a locking system, limiting the movement of the bins, adding to the stability of these components when subject to flooding or overland flow. Some remaining situations not yet with this fixture are in limited numbers and are not localised by specific criteria. Improvement in terms of resilience can be achieved by upgrading those components localised in areas more exposed to flooding, using the results of this surrogate model. In door-to-door mode, property owners are responsible for locating the bins and repositioning inside the properties. Disturbances can annoy residents and business owners as well as traffic.
The summary of results for the whole city (Table 9) allows concluding that only 20% of the locations and 22% of bins are exposed to flooding in the current situation. The “door-to-door” system comprehends many locations and bins, respectively, 64% and 82% of the total installed. For door-to-door modes, vulnerability is low since bins are outdoors for a time limited to a few hours per week, depending on the type of waste. These results support the upgrading of the system with stabilization or restraining mechanisms, as well as an option for underground alternatives. These results indicate a significant residence to flooding of the waste collection system in Lisbon.
Experience from the management of the Lisbon wastes collection system allows concluding that the meteorological variable affecting most of these services is the wind.
4.2.4. Electricity Supply
The electrical energy supply infrastructure, namely a few underground primary and secondary substations, is exposed to damage when failures in the drainage system occur. Disruptions in components, such as transformers and electric buses, might interrupt the service of these facilities, without major impacts on interruption of supply given the high level of redundancy. After floods affecting a substation and a secondary substation at downtown catchments (2003), measures were implemented to reduce vulnerability, namely, by building barriers for water surrounding ventilation surface openings, by improving water extraction pumping, and by raising critical equipment to a higher level [43]. These locations were visited during the study by mixed teams, and correction measures were observed. From the overall analysis, it was concluded about the high resilience to flooding of electricity supply in Lisbon.
4.3. Hazards, Exposure, and Vulnerability: Lisbon Downtown Assessment
4.3.1. Properties and Number of Residents
Further developments are undertaken to the downtown catchments J and L, for which results of simulations of overland flow allow estimating consequences using other dimensions and metrics: exposure of buildings to flooding by water level classes; appraisal of financial consequences using average values from the literature for similar urban settings; and exposure of the resident population in the exposed buildings.
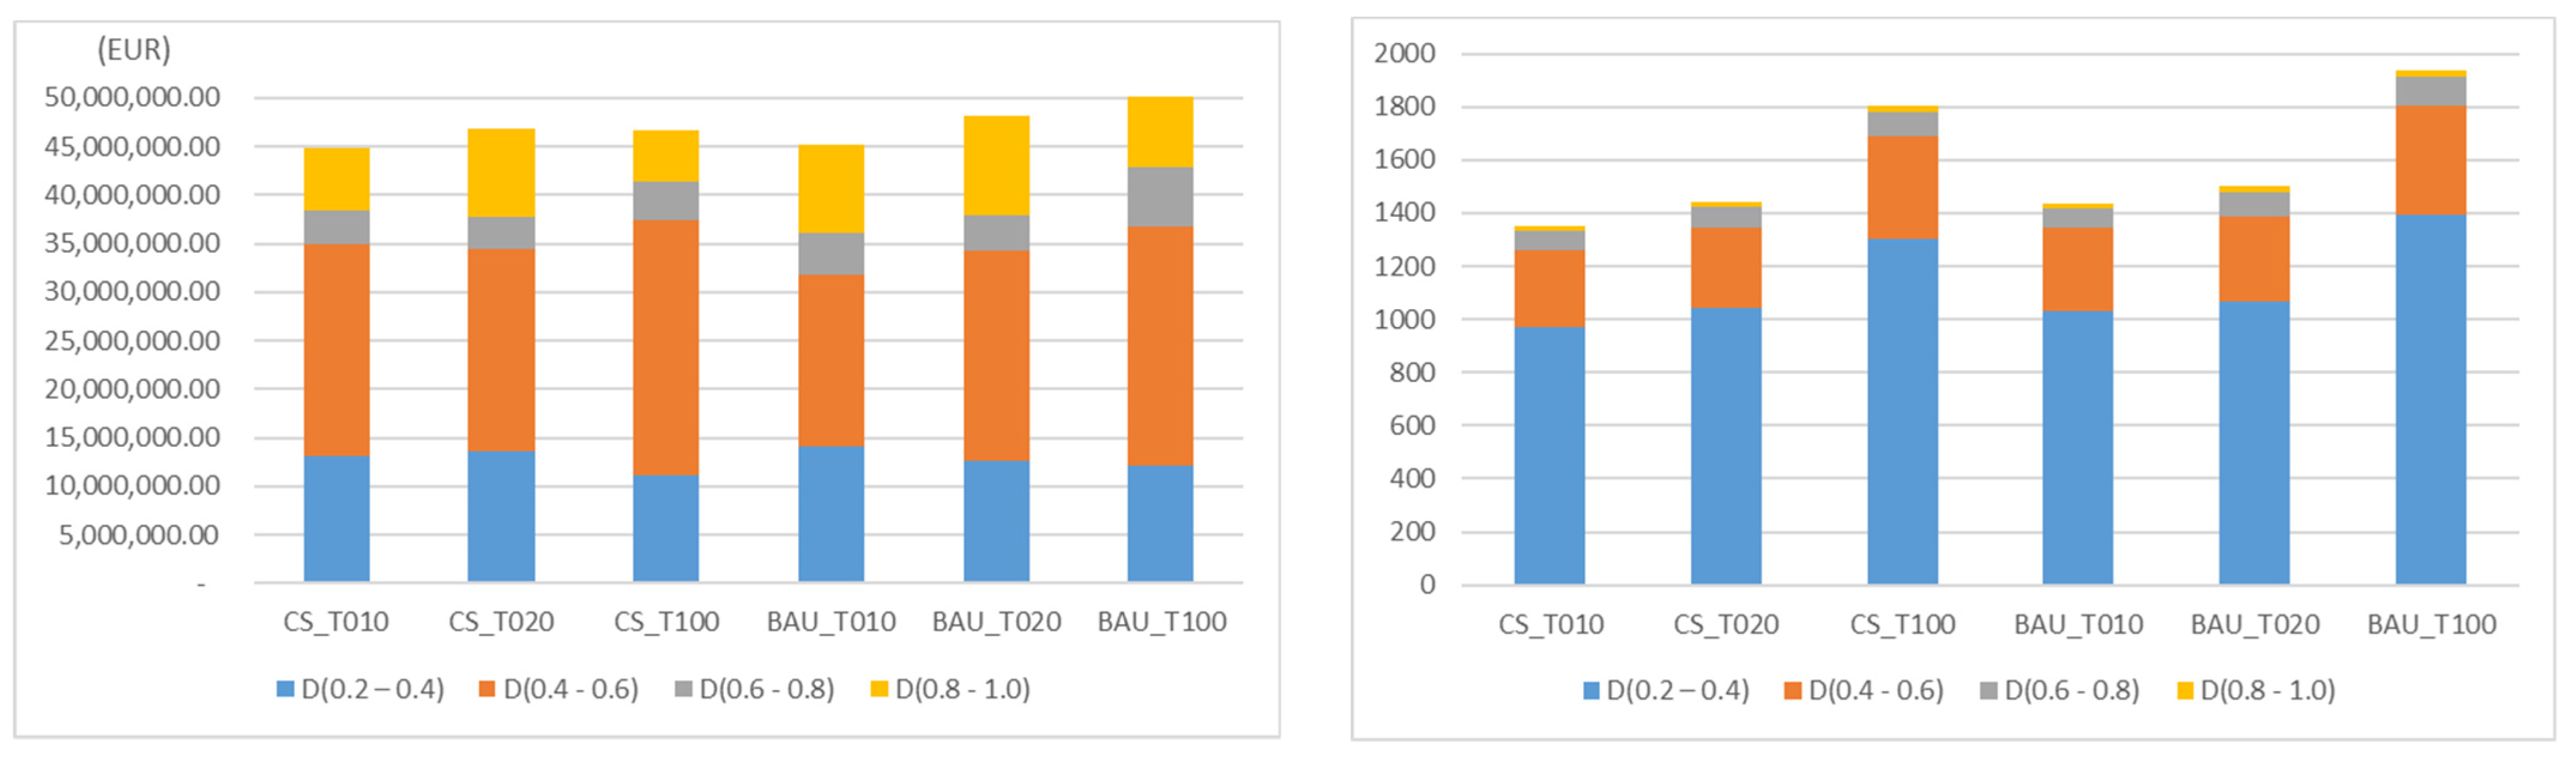
In Table 10, results for both current situation (CS) and climate change (BAU) scenarios are presented. In Figure 5, results for CS and BAU scenarios are compared in terms of estimated damages and the number of buildings. Aggravation of water level is small [18], and the impact of the climate change scenario is also leading to a slight increase for similar return periods.
In Figure 6, results for return period T = 100 years (T100) for climate change scenarios are presented. In these figures, the buildings affected by flooding according to hydraulic simulation results are identified.
4.3.2. Mobility Network and Traffic Velocity
For the downtown catchments J and L, differences found from the current situation for the BAU scenario, i.e., BAU-CS (Table 11), lead to relatively stable global values, with overall variations below 1% in length, with values up to 9% just obtained for local situations for T100 and water level up to 0.4 m. In Table 12, the impacts on transport infrastructure for CAS as a variation to CS are given. The construction of the interceptor sewers has the effect of somehow compensating the effect of climate change since the variations to the current situation are not relevant.
Comparing the global results for downtown catchments J and L obtained for CS, BAU, and CAS3 (Table 13), in terms of the total area flooded, variations are below 10% for all return periods and situations. Variations are considered to be within the error margins of the approach.
Table 14 provides an overview of the impact on the Lisbon downtown catchments traffic for studied scenarios. The aggravation with the return period is higher than the estimated impact of climate change scenarios, especially taking into consideration the uncertainties associated with these estimates.
For tide-induced hazards, results also show little variations for roads with no exposure to railways.
4.3.3. Waste Collection
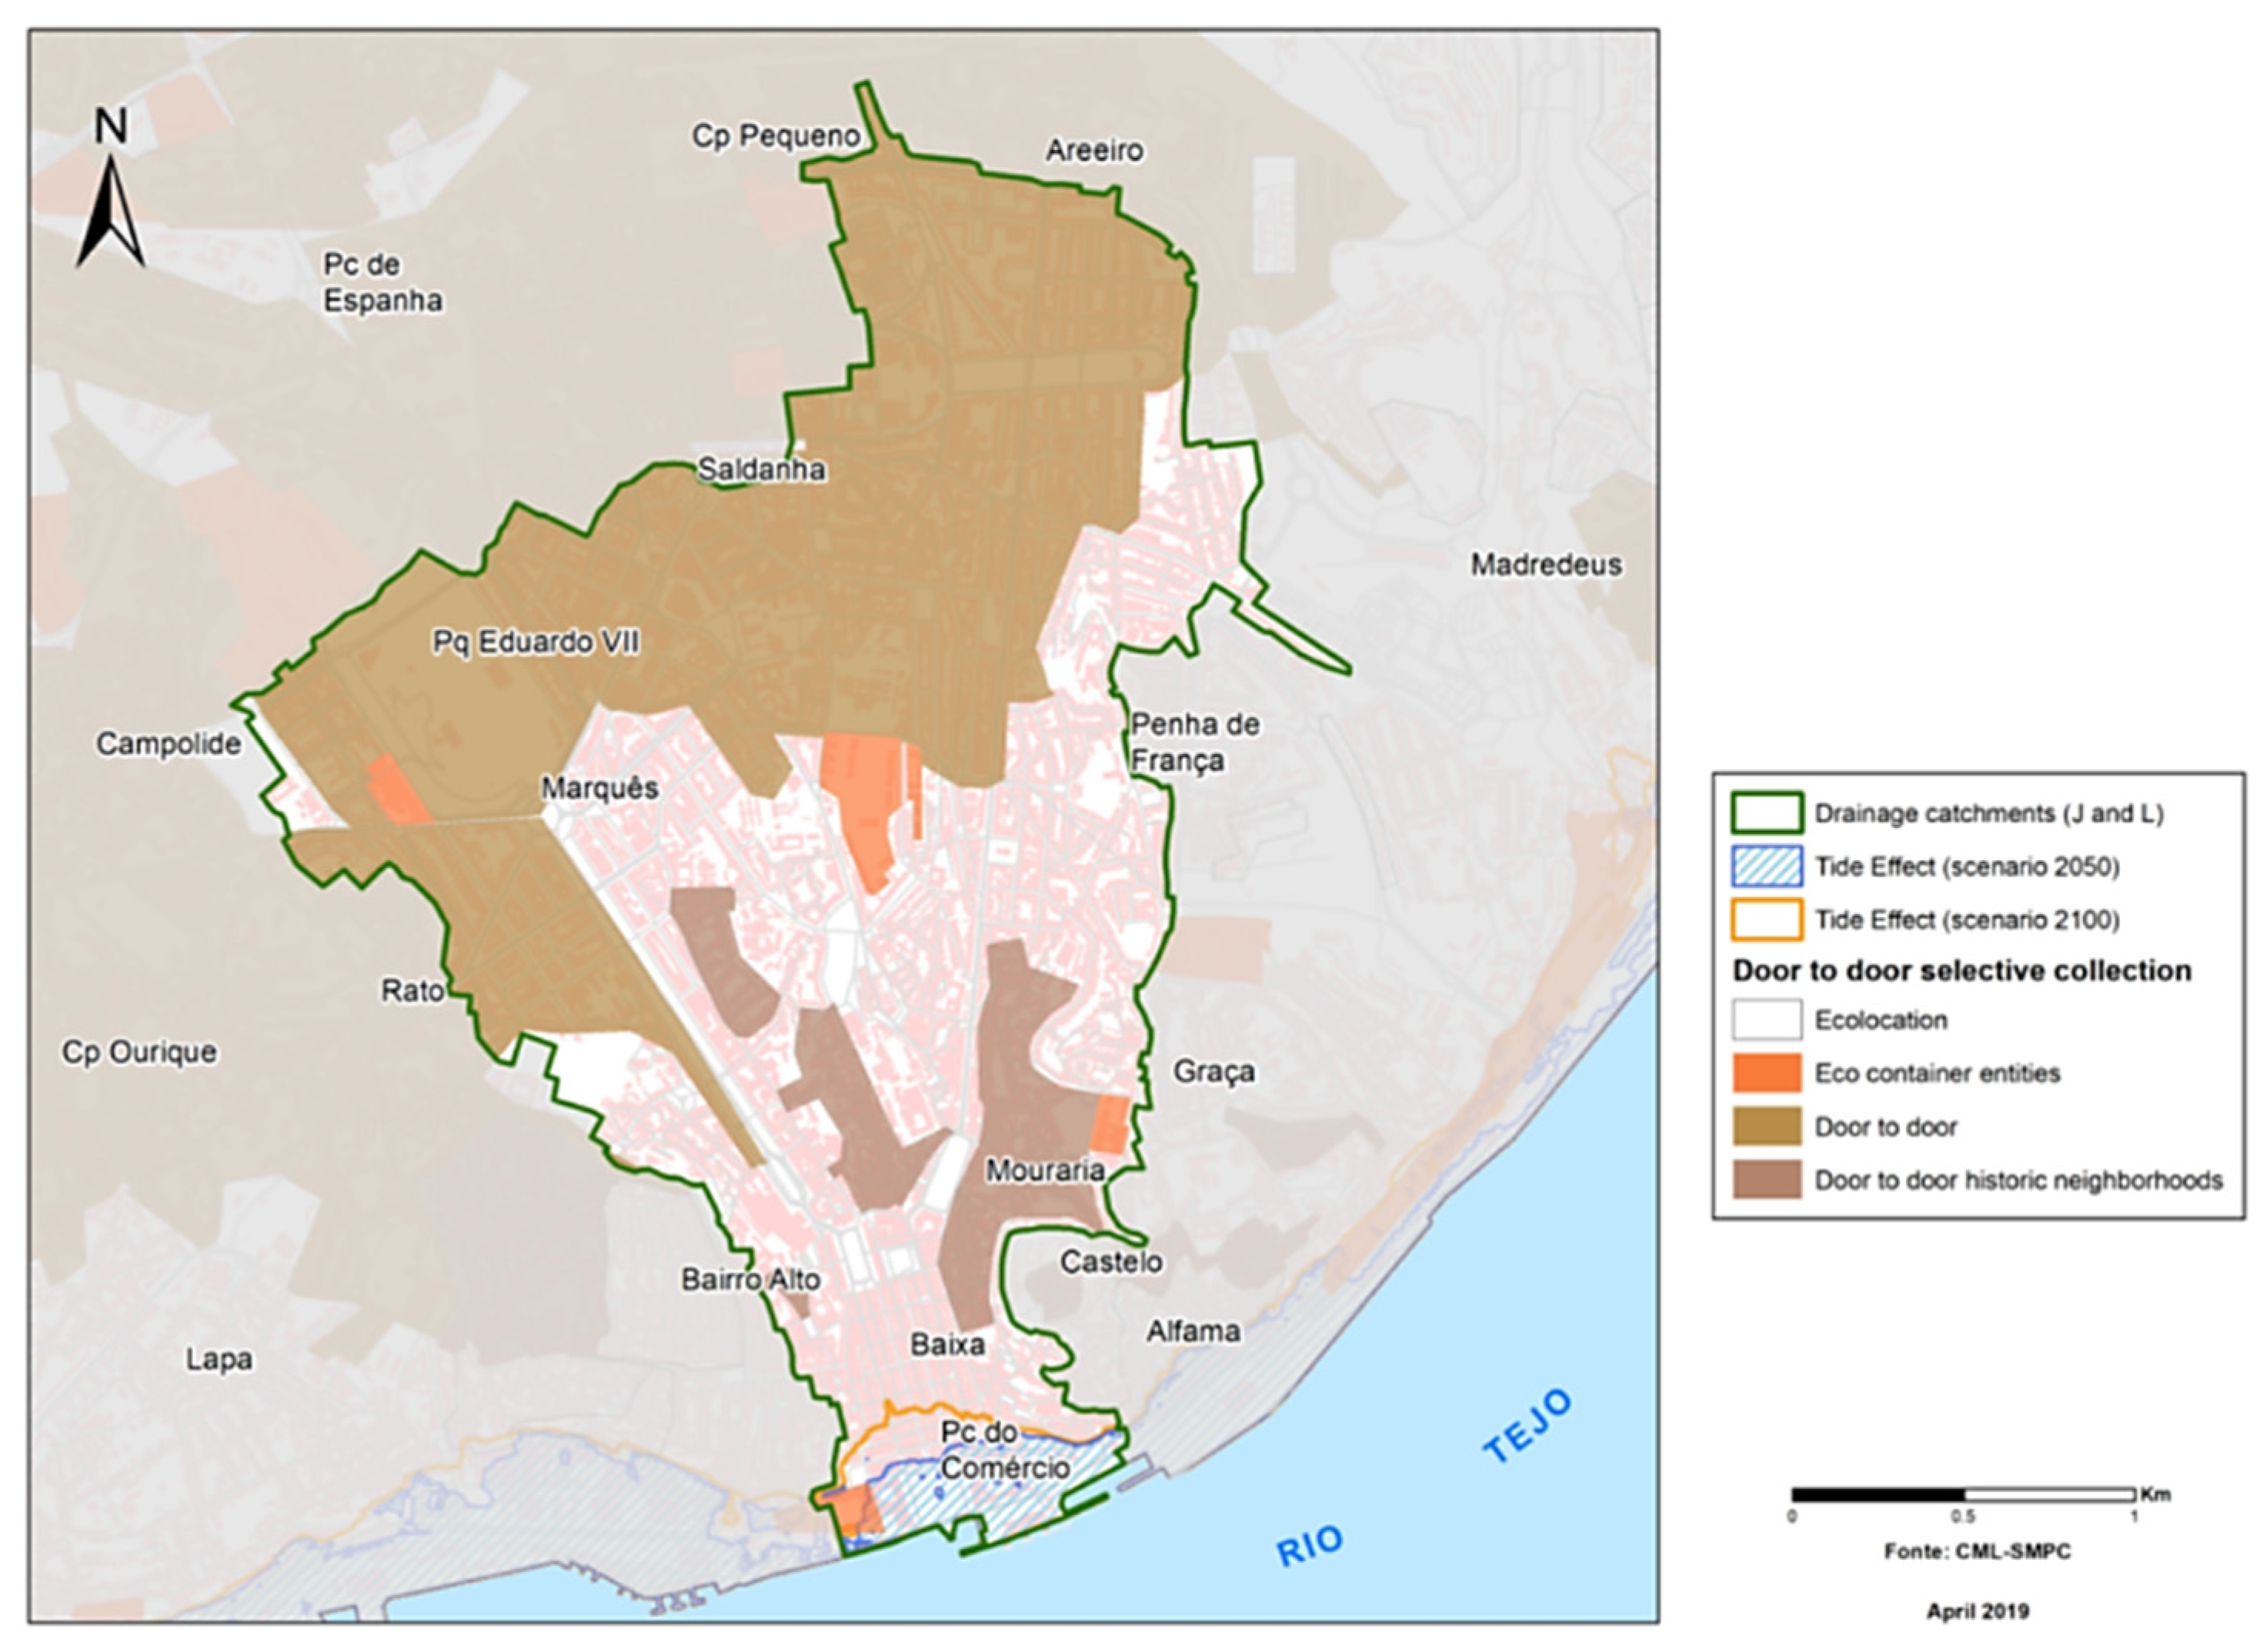
The available collection types in Lisbon downtown catchments J and L are the large public bins (bring banks), door-to-door (PaP), and self-delivered. Since in this area the use of a mechanism to avoid movement of bins permanently placed on the streets is almost generalized for most collection modes, apart from “door-to-door” mode, the vulnerability is low. The zoning of wastes collection modes and areas exposed to tide-induced flooding in catchments J and L are indicated in Figure 7. Results for the downtown catchments are given in Table 15 for locations and bins exposure to flooding, respectively, for rain-induced flooding and tide-induced flooding.
For the current situation, very few locations and bins are exposed to higher flooding water levels, globally up to 1% locations or bins above 0.4m and up to around 7% locations and 5% bins for water level lower than 0.4m. Numbers increase slightly with the return period. Comparing with the results for the whole city, the exposure downtown is significantly lower. For tide-induced flooding, the only exposed elements are in the “door to door” waste collection mode, up to 2% (BAU) locations and around 3% (BAU) bins.
Different types of bring banks exist. For underground locations, the consequence is the inflow of some water that needs to be removed when containers are emptied. Even so, only up 9% of this type of container is affected and only for water depth up to 0.4 m. Differences with scenarios are not relevant. For the “Ecoponto” type, a group of bins for different types of wastes, up to 19% of locations or bins are exposed up to 0.4 m and up to 4% are exposed up to 0.6 m water depth. These components are mostly equipped with the fixture to restrict movement. Glass containers are only exposed up to 0.4 m water depth (up to 9% of components), and vulnerability is not relevant for this level of hazard. The door-to-door bins are also exposed when placed outdoors, even if only for a limited time per week. Only up to 7% of the bins are exposed, but if affected by overland flows, they will be dragged and overturn.
The main difference from the current scenario to the BAU scenario is in the water level that increases, with a reverse for CAS. Exposure, in general, is maintained for all scenarios analysed.
For tide-induced flooding, exposure is limited to elements in the “door-to-door” waste collection mode, up to 2% (CS) and (BAU and CAS) locations and around 1% (CS) and 3% (BAU and CAS) bins.
5. Discussion
Climate dynamics and changes impose challenges to society as a whole and to urban areas given the concentration of population, services, wealth, heritage, and environment, among others, requiring dealing with the complexity of adopting the option of dealing with specifically associated hazards, while ensuring the involvement of multiple urban services and interested parties, to reduce the problem to a manageable dimension.
Amongst water-related risks, floods in urban areas have significant risk levels and are significantly dependent on climate-related events. Risk identification is assumed herein as a key phase for risk-based approaches as well as to assessing resilience. Limitations in data and ready-to-use tools often limit the development of these assessments and the methodologies. Even when sophisticated numerical models are available, the application implies simplifications, hypotheses, and assumptions, not always duly considered when conclusions are drawn. Data for severe events are rarely available, and results can be misleading.
The methodology applied allows proceeding with the spatial characterisation of exposure and vulnerability to flood-related hazards of essential functions and services providers in urban areas to support the assessment of the resilience to these specific hazards, considering interdependencies and cascading effects. The combination of data and knowledge from different sources with dual modelling approaches can provide helpful results about the exposure, vulnerability, and consequently, resilience, using metrics that relate with the urban functions and corresponding services, for different situations and scenarios.
Results are encouraging in demonstrating the potential of combining data and knowledge from different sources with dual modelling approaches, each somehow limited in scope, allowing one to obtain trends on exposure and vulnerability to flooding for current and climate change scenarios. These results are valuable to direct efforts in subsequent more detailed studies and to support decision making in adaptation strategy selection. Quantification of consequences was reached, using indicators based on available data, but the interpretation of results needs to consider the underlying levels of uncertainty. In line with the reference [18], a key feature of the approach is ensuring the involvement of multiple urban services and interested parties. The methodology can facilitate dialogue among stakeholders and between different decision levels and contribute to capacity building in these services. Interaction between stakeholders promoted the understanding achieved by stakeholders not familiar with water issues about the relevance of flood-related hazards for their modus operandi and the value of the information they can obtain from other stakeholders to increase the resilience and reliability of their services; the recognition of services or solutions proving to be important for services resilience, even if not implemented for this purpose; and the identification of priority areas, services, or installations given the levels of exposure or vulnerability obtained, while further detailed work has higher priority, facilitating decision making.
The methodology applied to Lisbon, combining data from different sources and tools to two main spatial scopes, allows concluding that even with limited data and tools insight into the problem can be gained as well as identification of pathways to increase resilience to flooding. Furthermore, the work presented enhances the importance of data availability for the assessment of urban resilience and supports the identification of data needs and the selection of adequate tools. Flooding in the current situation is regularly affecting several city functions and services, and, by comparison, the effect of climate change scenarios analysed is less significant. The results for the traditional engineering measure analysed intended to increase flooding resilience are not encouraging given the expected high cost associated with the implementation. The tools used for the design are similar to those used in this paper. The methodology can provide a relatively straightforward way to compare the overall benefits of measures to increase resilience.
Vulnerability assessment is relatively limited by data availability, but lessons learned from information on exposure and the type of element exposed, together with information from stakeholders, results in information for decision support.
For instance, from the overall analysis, it was concluded about the high resilience to flooding of electricity supply and wastes collection in Lisbon. In the latter, adoption of measures such as devices to restrict the movement of containers avoids situations as reported in reference [10], even if they were placed for other objectives.
Furthermore, results facilitate the planning of subsequent actions, for instance, proceeding with detailed vulnerability analysis in exposed structures or infrastructures. Regarding quantification of damages in buildings, interpretation of results used in the broad assessment carried out using the curves from Barcelona needs to consider the differences in the socio-economic context. It allowed concluding that further data are needed in existing databases to allow future use for assessment of consequences per building type and function, prioritizing critical and exposed structures, e.g., health care buildings and heritage buildings.
The involvement of stakeholders was instrumental to the application of the methodology and to increase awareness in the respective organisations on their exposure and vulnerability to flooding-related hazards and of the potential role each could play in adaptation. Ensuring a participatory approach has the potential to contribute to developing ownership of the strategies selected to increase flood resilience and to facilitate sharing of information.
The application of the methodology to other cities provides the opportunity to obtain results to support the decision in building a resilience path. Adaptation to include other sectors or available data is feasible if GIS tools are available.
Author Contributions
M.d.C.A. supervised this study, developed the methodology and its application, analysed the results, drafted the manuscript, and finalized it. M.J.T., M.M., and J.B. contributed to the application of the methodology and analysis of the results and provided suggestions on the draft manuscript. M.J.T. and M.M. were responsible for undertaking data collection and overall mapping in ArcMap ™ software. J.B. was responsible for undertaking the simulations of the drainage systems. All authors have read and agreed to the published version of the manuscript.
Funding
This research was funded by EUROPEAN UNION’S HORIZON 2020 RESEARCH AND INNOVATION PROGRAM, call H2020-DRS-2015 under the Grant Agreement number 700174 and acronym RESCCUE.
Acknowledgments
The work presented was developed within the EU H2020 RESCCUE project—resilience to cope with climate change in urban areas. Acknowledgment is due to Portuguese RESCCUE partners, as well as to all external contributors.
Conflicts of Interest
The authors declare no conflict of interest.
References
- IPCC. 5th Assessment Report; Intergovernmental Panel on Climate Change: Geneva, Switzerland, 2014. [Google Scholar]
- Ward, P.J.; Jongman, B.; Weiland, F.S.; Bouwman, A.; van Beek, R.; Bierkens, M.F.P.; Ligtvoet, W.; Winsemius, H.C. Assessing flood risk at the global scale: Model setup, results, and sensitivity. Environ. Res. Lett. 2013, 8, 10. [Google Scholar] [CrossRef]
- WEF. The Global Risks Report 2019, 14th ed.; World Economic Forum: Geneva, Switzerland, 2019. [Google Scholar]
- IPCC. Global Warming of 1.5 °C. Summary for Policymakers; Intergovernmental Panel on Climate Change: Geneva, Switzerland, 2018. [Google Scholar]
- Kachali, H.; Storsjö, I.; Haavisto, I.; Kovács, G. Inter-sectoral preparedness and mitigation for networked risks and cascading effects. Int. J. Disaster Risk Reduct. 2018, 30, 281–291. [Google Scholar] [CrossRef]
- Pearson, J.; Punzo, G.; Mayfield, M.; Brighty, G.; Parsons, A.; Collins, P.; Jeavons, S.; Tagg, A. Flood resilience: Consolidating knowledge between and within critical infrastructure sectors. Environ. Syst. Decis. 2018, 38, 318–329. [Google Scholar] [CrossRef] [Green Version]
- Pregnolato, M.; Ford, A.; Glenis, V.; Wilkinson, S.; Dawson, R. Impact of Climate Change on Disruption to Urban Transport Networks from Pluvial Flooding. J. Infrastruct. Syst. 2017, 23, 1–13. [Google Scholar] [CrossRef] [Green Version]
- Otto, A.; Kellerman, P.; Thieken, A.H.; Costa, M.M.; Carmona, M.; Bubeck, P. Risk reduction partnerships in railway transport infrastructure in an alpine environment. Int. J. Disaster Risk Reduct. 2019, 33, 385–397. [Google Scholar] [CrossRef]
- Martínez, E.; Gómez, M.; Russo, B.; Djordjevic, S. A new experiments-based methodology to define the stability threshold for any vehicle exposed to flooding. Urban Water J. 2017, 14, 930–939. [Google Scholar] [CrossRef]
- Martínez, E.; Russo, B.; Gómez, M.; Plumed, A. An approach to the modeling of stability of waste containers during urban flooding. J. Flood Risk Manag. 2020, 13, 1–18. [Google Scholar] [CrossRef] [Green Version]
- Serre, D.; Heinzlef, C. Assessing and mapping urban resilience to floods with respect to cascading effects through critical infrastructure networks. Int. J. Disaster Risk Reduct. 2018, 30, 235–243. [Google Scholar] [CrossRef]
- Rosenzweig, B.R.; McPhillips, L.; Chang, H.; Cheng, C.; Welty, C.; Matsler, M.; Iwaniec, D.; Davidson, C.I. Pluvial flood risk and opportunities for resilience. Wiley Interdiscip. Rev. Water 2018, 6, 1–18. [Google Scholar] [CrossRef]
- Sofia, G.; Roder, G.; Fontana, G.D.; Tarolli, P. Flood dynamics in urbanised landscapes: 100 years of climate and humans’ interaction. Sci. Rep. 2017, 7, 40527. [Google Scholar] [CrossRef]
- Mailhot, A.; Duchesne, S. Design criteria of urban drainage infrastructure under climate change. Asce J. Water Resour. Plan. Manag. 2010, 136, 201–208. [Google Scholar] [CrossRef]
- Mamo, T.G. Evaluation of the potential impact of rainfall intensity variation due to climate change on existing drainage infrastructure. Asce. J. Irrig. Drain. Eng. 2015, 141, 05015002. [Google Scholar] [CrossRef]
- Markholf, S.A.; Chester, M.V.; Helmrich, A.M.; Shannon, K. Re-imagining design storm criteria for the challenges of the 21st century. Cities 2021, 109. [Google Scholar] [CrossRef]
- Wilby, R.L.; Keenan, R. Adapting to flood risk under climate change. Prog. Phys. Geogr. 2012, 36, 31. [Google Scholar] [CrossRef]
- Almeida, M.D.; Telhado, M.J.; Morais, M.; Barreiro, J.; Lopes, R. Urban resilience to flooding: Triangulation of methods for hazard identification in urban areas. Sustainability 2020, 12, 6. [Google Scholar] [CrossRef] [Green Version]
- Wardekker, A.; Wilk, B.; Brown, V.; Uittenbroek, C.; Mees, H.; Driessen, P.; Wassen, M.; Molenaar, A.; Walda, J.; Runhaar, H. A diagnostic tool for supporting policymaking on urban resilience. Cities 2020, 101. [Google Scholar] [CrossRef]
- Hammond, M.J.; Chen, A.S.; Djordjević, S.; Butler, D.; Mark, O. Urban flood impact assessment: A state-Of-The-Art review. Urban Water J. 2015, 12, 14–29. [Google Scholar] [CrossRef] [Green Version]
- Heinzlef, C.; Becue, V.; Serre, D. A spatial decision support system for enhancing resilience to floods: Bridging resilience modelling and geovisualization techniques. Nat. Hazards Earth Syst. Sci. 2020, 20, 1049–1068. [Google Scholar] [CrossRef] [Green Version]
- Zerger, A.; Wealands, S. Beyond Modelling: Linking Models with GIS for Flood Risk Management. Nat. Hazards 2004, 33, 191–208. [Google Scholar] [CrossRef]
- Velasco, M.; Russo, B.; Martínez, M.; Malgrat, P.; Monjo, R.; Djordjevic, S.; Fontanals, I.; Vela, S.; Cardoso, M.A.; Buskute, A. The RESCCUE Project: RESilience to cope with Climate Change in Urban arEas—A multisectorial approach focusing on water–The RESCCUE Project. Water 2018, 10, 1356. [Google Scholar] [CrossRef] [Green Version]
- Heinzlef, C.; Robert, B.; Hémond, Y.; Serre, D. Operating urban resilience strategies to face climate change and associated risks: Some advances from theory to application in Canada and France. Cities 2020, 104. [Google Scholar] [CrossRef]
- Hernantes, J.; Maraña, P.; Gimenez, R.; Sarriegi, J.M.; Labaka, L. Towards resilient cities: A maturity model for operationalizing resilience. Cities 2019, 84. [Google Scholar] [CrossRef]
- INE. Censos 2011 Resultados Definitivos–Portugal. In Census 2011 Definitive Results; National Statistics Institute: Lisbon, Portugal, 2012. [Google Scholar]
- CML. Econ. Lisbon Numbers 2014 (A Economia de Lisboa em Números 2014). Available online: http://observatorio-lisboa.eapn.pt/ficheiro/Lisboa_em_numeros_2014_final_01.pdf (accessed on 20 April 2017).
- Telhado, M.J.; Baltazar, S.; Fernandes, F.; Cardoso, M.A.; Almeida, M.C.; Vieira, P.V. Lisbon Municipality Contribution to the Demonstration of the WCSP, RIDB, RRDB, GIS Applications for Risk Assessment in Lisbon; PREPARED Project: Nieuwegein, The Netherlands, 2014. [Google Scholar]
- The Rockfeller Foundation. Cities Taking Action. How the 100RC Network is Building Urban Resilience. 2017. Available online: http://100resilientcities.org/wp-content/uploads/2017/07/WEB_170720_Summit-report_100rc-1.pdf (accessed on 1 February 2020).
- Silva, M.M.; Costa, J.P. Urban Flood Adaptation through Public Space Retrofits: The Case of Lisbon (Portugal). Sustainability 2017, 9, 816. [Google Scholar] [CrossRef] [Green Version]
- Amaratunga, D.; Sridarran, P.; Haigh, R. Making Cities Resilient Report 2019: A Snapshot of How Local Governments Progress in Reducing Disaster Risks in Alignment with the Sendai Framework for Disaster Risk Reduction, UNDRR. 2019. Available online: https://www.unisdr.org/campaign/resilientcities/assets/toolkit/documents/UNDRR_Making%20Cities%20Resilient%20Report%202019_April2019.pdf (accessed on 4 February 2021).
- CML. Estratégia Municipal de Adaptação às Alterações Climáticas de Lisboa (EMAAC); Câmara Municipal de Lisboa: Lisboa, Portugal, 2017. [Google Scholar]
- CML. Plano de Ação Para a Energia Sustentável e Clima (PAESC); Câmara Municipal de Lisboa: Lisboa, Portugal, 2018. [Google Scholar]
- HIDRA; ENGIDRO; BLUEFOCUS. Plano Geral de Drenagem de Lisboa 2016–2030; Câmara Municipal de Lisboa: Lisboa, Portugal, 2015. [Google Scholar]
- HIDRA. Tender Process for Design and Construction of Lisbon Drainage Tunnels (Monsanto—Santa Marta—Santa Apolonia and Chelas—Beato) and Related Infrastructures. Volume II, Part 1: Report; Câmara Municipal de Lisboa: Lisbon, Portugal, 2018. [Google Scholar]
- Aven, T. Improving risk characterisations in practical situations by highlighting knowledge aspects, with applications to risk matrices. Reliab. Eng. Syst. Saf. 2017, 167, 42–48. [Google Scholar] [CrossRef]
- Antunes, C.; Catita, C.; Rocha, C. Estudo de Avaliação da Sobrelevação da Maré–Determinação da Cartografia de Inundação e Vulnerabilidade da Área Ribeirinha de Lisboa Afetada Pela Sobrelevação da Maré Como Consequência da Futura Subida do Nível Médio do Mar. Relatório Técnico EMAAC; Câmara Municipal de Lisboa: Lisbon, Portugal, 2017; 46p. [Google Scholar]
- Paradinas, C.; Monjo, R.; Gaitán, E.; Carravilla, C.; Torres, L. Projection of Climate Extremes in the City of Lisbon: A Comparative Study; RESCCUE Project: Barcelona, Spain, 2019. [Google Scholar]
- Brandão, C.; Rodrigues, R.; Costa, J. Análise de Fenómenos Extremos. Precipitações Intensas em Portugal Continental; Direcção dos Serviços de Recursos Hídricos: Lisboa, 2001. [Google Scholar]
- Monjo, R. (Ed.) Report on Extreme Events Prediction. Deliverable 1.3; RESCCUE EU H2020 Project: Barcelona, Spain, 2018; pp. 2–108. [Google Scholar]
- Defra, E.A. Flood Risk Assessment Guidance for New Development. Phase 2 Framework and Guidance for Assessing and Managing Flood Risk for New Development–Full Documentation and Tools; Defra and Environment Agency: London, UK, 2005. [Google Scholar]
- Evans, B.; Chen, A.; Djordjevic, S.; Webber, J.; Almeida, M.C.; Morais, M.; Telhado, M.J.; Silva, I.; Duarte, N.; Martínez-Gomariz, E.; et al. Impact Assessments of Multiple Hazards in Case Study Areas with Adaptation Strategies; RESCCUE Project: Barcelona, Spain, 2020. [Google Scholar]
- Martínez-Gomariz, E.; Forero-Ortiz, E.; Guerrero-Hidalga, M.; Castán, S.; Gómez, M. Flood Depth—Damage Curves for Spanish Urban Areas. Sustainability 2020, 12, 25. [Google Scholar] [CrossRef] [Green Version]
- Rausand, M.; Høyland, A. System Reliability Theory. Models, Statistical Methods, and Applications; Wiley Interscience: Hoboken, NJ, USA, 2004. [Google Scholar]
- Kumamoto, H. Satisfying Safety Goals by Probabilistic Risk Assessment; Springer: London, UK, 2007. [Google Scholar]
- Serre, D.; Barroca, B.; Balsells, M.; Becue, M. Contributing to urban resilience to floods with neighbourhood design: The case of Am Sandtorkai/Dalmannkai in Hamburg. J. Flood Risk Manag. 2018, 11, S69–S83. [Google Scholar] [CrossRef]
- Almeida, M.C.; Strehl, C.; Leitão, J.-P.; Mälzer, H.-J. Risk Reduction Measures. Supporting Document for Risk Reduction Database Structure, Report 2011.025; PREPARED Enabling Change Project: Eindhoven, The Netherlands, 2011. [Google Scholar]
Figure 1.
New interception sewers and associated drainage catchments and intersection locations [35].
Figure 1.
New interception sewers and associated drainage catchments and intersection locations [35].

Figure 2.
Risk-based approach adopted.

Figure 3.
Disaggregated depth–damage curves as determined for Barcelona [43].
Figure 3.
Disaggregated depth–damage curves as determined for Barcelona [43].

Figure 4.
Mapping of results for exposure and vulnerability to rainfall-induced flooding of transport infrastructures: left, including critical locations; right, including docks, interfaces, and metro stations.
Figure 4.
Mapping of results for exposure and vulnerability to rainfall-induced flooding of transport infrastructures: left, including critical locations; right, including docks, interfaces, and metro stations.

Figure 5.
Damage to properties (Lisbon downtown): estimated costs (left) and the number of buildings (right) affected per flooding water depth range (CS and BAU).
Figure 5.
Damage to properties (Lisbon downtown): estimated costs (left) and the number of buildings (right) affected per flooding water depth range (CS and BAU).

Figure 6.
Lisbon downtown: Identification of elements considered for damage assessment (BAU).

Figure 7.
Lisbon downtown: zoning of wastes collection and tide-induced flooding hazard areas.


| Area (Km2) | 85 | Economic Indicators (2013) | ||
|---|---|---|---|---|
| Population (2011) (inhab.) | Residents | 547,733 | GDP (millions of euros) | 63,902 |
| Commuter’s balance | +378,226 | Gross value added GVA (millions of euros) | 56,154 | |
| Disabled (%) | 17.1 | GDP per capita (thousands of euros) | 22.7 | |
| Tourism (2011) | Tourists/year | 2,949,579 | Apparent labour productivity (per person employed) (GVA/Employment, 2011) | 41.7 |
| Tourist nights/year | 6,789,166 | |||
| Age distribution | <15 years old | 12.9% | Employment indicators, 2011 | |
| >65 years old | 23.9% | Employment (thousands of persons) | 1385.8 | |
| Land slope | Average: 5.7° | Max.: 81° | Employment (% country) | 29% |
| Altitude (m) | Min: 0 | Max: 217 | Water distribution service connections | ≈80,000 |
| Land use values | Consolidated urban | 90% | Wastewater infrastructures | |
| Buildings (n.) | 52,496 | Combined sewer network served area (%) | 73 | |
| Vehicles/day (2012) | 648,615 | Treatment plants | 3 | |
Table 2.
Main stakeholders involved in the Lisbon city study case.
| Service | Stakeholders | Level of Involvement |
|---|---|---|
| Municipality * | Lisbon Municipality (CML) | High |
| Energy supply | Distribution System Operator (EDP D) | High |
| Rain and wastewater systems | CML and ADTA | High |
| Water supply | EPAL | Low |
| Public transport | CML, CARRIS, METRO | Medium |
| Communications | MEO Altice, Vodafone, NOS | Low |
* Includes a range of urban services, e.g., civil protection, wastes, public lighting, urban planning, mobility, and environment.
Table 3.
Definition of flood-related risk sources and hazards for different modelling approaches.
| Data/Model | Criteria: Metric, Scale Classes |
|---|---|
| Lisbon flood-prone areas from historical records | Flooded areas as defined in Lisbon master plan: frequency, 3 classes: medium, high, very high |
| Citywide 1D GIS-based | Use of sewer transport capacity: C = Qwet/Qfull (%), 4 classes, low C ≤ 0.5, moderate 0.5 < C ≤ 1.0, high 1.0 < C ≤ 1.5, very high C > 1.5 |
| Downtown catchments J and L 1D/2D CMSB | Water level: water depth, d(m), at critical time, 5 classes: very low d ≤ 0.2, low 0.2 < d ≤ 0.4, moderate 0.4 < d ≤ 0.6, high 0.6 < d ≤ 0.8, very high 0.8 < d ≤ 1.0 Hazard to pedestrians: flood hazard rating HR = d × (v + 0.5) + DF, d—water depth (m), v—overland flow velocity (m/s), DF—debris factor, 4 classes: low HR ≤ 0.75, moderate 0.75 < HR ≤ 1.25, high 1.25 < HR ≤ 2, very high HR > 2 [41] Hazard to vehicles: F (flow depth D, flow velocity), 3 classes: low D ≤ 0.28 and ≤ 0.40, moderate D ≤ 0.28 and 0.40 < ≤ 0.55, high D > 0.28 or > 0.55 [9] |
| Area as a function of simulated estuary water level available modelling results for the scenarios of estuary water level is from a study promoted by CML [37] |
Table 4.
Maximum safe velocity vs. flooding water level: criteria from [7].
Table 4.
Maximum safe velocity vs. flooding water level: criteria from [7].
| Class Average Flooding Water Level | ||||
|---|---|---|---|---|
| Vehicle type | 0.3 m | 0.5 m | 0.7 m | 0.9 m |
| 4WD cars approximation | 30 Km·h−1 | 5 Km·h−1 | 0 | 0 |
| Average vehicle function | 10 Km·h−1 | 0 | 0 | 0 |
| Small cars approximation | 0 | 0 | 0 | 0 |
Table 5.
Selected scenarios for assessment of resilience to flooding in Lisbon.
| Scenario ID | Climate Scenario Characteristics | City and Infrastructure Settings | |
|---|---|---|---|
| T 4 (Years), Imax (mm/h) | Tide Level; Period | ||
| CS 010 1 | 10, 32.8 | 1.95 m; 2011–2040 | Present land use and drainage system |
| CS 020 | 20, 37.5 | ||
| CS 100 | 100, 48.4 | ||
| BAU 010 2 | 10, 38.3 | 2.81 m; 2071–2100 | Present land use and drainage system |
| BAU 020 | 20, 44.2 | ||
| BAU 100 | 100, 57.7 | ||
| CAS 010 3 | 10, 38.3 | 2.81 m; 2071–2100 | Construction of new components in drainage system, namely large diversion tunnels to deviate flows from downtown areas |
| CAS 020 | 20, 44.2 | ||
| CAS 100 | 100, 57.7 | ||
1 Current situation; 2 Business as usual; 3 Climate adaptation strategy; 4 T: Rainfall event return period, Imax: Peak rainfall intensity obtained from the region I–D–F curves.
Table 6.
Citywide buildings’ exposure to flooding hazards for the current situation.
| Buildings Class | Buildings Per Class (n.) | Buildings Affected by Rain-Induced Flooding (CS) (% Class) | Buildings Affected by Tide-Induced Flooding (% Class) | ||||
|---|---|---|---|---|---|---|---|
| Flooding Frequency | Medium | High | Very High | CS | BAU | ||
| Buildings general | 61,315 | n. buildings | 12,034 | 2979 | 2637 | 1630 | 2704 |
| % | 19.6 | 4.9 | 4.3 | 2.7 | 4.4 | ||
| Under-ground | 235 | n. buildings | 63 | 17 | 28 | 21 | 33 |
| % | 26.8 | 7.2 | 11.9 | 8.9 | 14.0 | ||
| Other buildings | 367 | n. buildings | 91 | 6 | 11 | 6 | 12 |
| % | 24.8 | 1.6 | 3.0 | 1.6 | 3.3 | ||
| TOTAL | 61,917 | n. buildings | 12,188 | 3002 | 2676 | 1657 | 2749 |
| % | 19.7 | 4.8 | 4.3 | 2.7 | 4.4 | ||
Table 7.
Citywide assessment for the use of sewer capacity—comparison between CS and BAU.
| Use of Sewer Capacity | Return Period (%(BAU-CS)) | ||
|---|---|---|---|
| T010 | T020 | T100 | |
| Low | −7.1 | −9.1 | −6.6 |
| Moderate | −4.6 | +0.1 | −6.6 |
| High | +10.2 | +7.1 | +1.7 |
| Very high | +1.5 | +1.9 | +11.4 |
Table 8.
Citywide transport network exposure to flooding hazards.
| Network Type | Length (km) | Length Affected by Rain-Induced Flooding (% Total Per Type) | Length Affected by Tide-Induced Flooding (% Type) | ||||
|---|---|---|---|---|---|---|---|
| Flooding Frequency | Medium | High | Very High | CS | BAU | ||
| Total roads | 1519.7 | - | 23.9 | 5. 6 | 5.9 | 5.3 | 7.2 |
| Total rail | 34.4 | - | 50 | 19 | 12 | 27 | 31 |
Table 9.
Wastes collection exposure to flooding hazards: summary of citywide results.
| Affected by Rain-Induced Flooding | Affected by Tide-Induced Flooding | |||||
|---|---|---|---|---|---|---|
| Type | Total (n.) | Flooding Risk Class | Moderate | High | Very High | |
| Locations | 55,238 | n. | 11,208 | 2343 | 5275 | 1533 |
| % | 20 | 4 | 10 | 3 | ||
| Bins | 204,004 | n. | 45,508 | 8583 | 15,579 | 3033 |
| % | 22 | 4 | 8 | 2 | ||
Table 10.
Lisbon downtown: buildings’ (B, n.) and residents’ (R, n.) exposure and vulnerability (damage, D, EUR) to flooding hazards (CS and BAU).
Table 10.
Lisbon downtown: buildings’ (B, n.) and residents’ (R, n.) exposure and vulnerability (damage, D, EUR) to flooding hazards (CS and BAU).
| Scenario | Flood Class | Buildings Affected by Rain-Induced Flooding | Total Affected | |||||
|---|---|---|---|---|---|---|---|---|
| T | 0.2–0.4 | 0.4–0.6 | 0.6–0.8 | 0.8–1.0 | B (n.) | R (n.) | ||
| CS | 10 | B (n.) | 969 | 294 | 71 | 18 | 980 | 4004 |
| D (EUR) | 13,176,540 | 21,800,319 | 3,480,417 | 6,439,206 | ||||
| 20 | B (n.) | 1040 | 306 | 77 | 16 | 1046 | 4369 | |
| D (EUR) | 13,635,978 | 20,834,377 | 3,256,344 | 9,044,943 | ||||
| 100 | B (n.) | 1305 | 387 | 90 | 20 | 1317 | 4985 | |
| D (EUR) | 11,073,412 | 26,388,270 | 3,826,290 | 5,393,694 | ||||
| BAU | 10 | B (n.) | 1029 | 313 | 76 | 17 | 1034 | 4258 |
| D (EUR) | 14,062,735 | 17,668,270 | 4,361,386 | 9,098,274 | ||||
| 20 | B (n.) | 1064 | 325 | 90 | 22 | 1071 | 4270 | |
| D (EUR) | 12,553,724 | 21,656,284 | 3,677,089 | 10,288,854 | ||||
| 100 | B (n.) | 1391 | 410 | 110 | 25 | 1400 | 5412 | |
| D (EUR) | 12,111,490 | 24,571,751 | 6,130,864 | 9,058,417 | ||||
| CAS | 10 | B (n.) | 899 | 261 | 63 | 11 | 900 | 3677 |
| D (EUR) | 11,521,261 | 16,204,992 | 3,359,126 | 5,103,920 | ||||
| 20 | B (n.) | 1057 | 350 | 97 | 27 | 1077 | 4290 | |
| D (EUR) | 11,602,000 | 18,521,844 | 5,837,237 | 9,786,510 | ||||
| 100 | B (n.) | 1128 | 347 | 99 | 29 | 1134 | 4326 | |
| D (EUR) | 11,990,516 | 20,590,989 | 7,685,365 | 5,648,679 | ||||
Table 11.
Downtown road networks metrics for flooding hazards: comparison of BAU and CS.
| ∆ BAU-CS on Length Affected by Rain-Induced Flooding (% of Total Lenght) | ||||
|---|---|---|---|---|
| Flooding Level | 0.2 m ≤ d < 0.4 m | 0.4 m ≤ d < 0.6 m | 0.6 m ≤ d < 0.8 m | 0.8 m ≤ d < 1.0 m |
| T010 | ◄► 0.68 | ◄► 0.03 | ◄► −0.04 | ◄► −0.02 |
| T020 | ◄► 0.40 | ◄► 0.06 | ◄► 0.03 | ◄► 0.00 |
| T100 | ◄► 0.71 | ◄► 0.02 | ◄► 0.05 | ◄► 0.01 |
◄► stable.
Table 12.
Downtown road networks metrics for flooding hazards: comparison of CAS and CS.
| ∆ CAS-CS on Length Affected by Rain-Induced Flooding (% of Total Lenght) | ||||
|---|---|---|---|---|
| Flooding Level | 0.2 m ≤ d < 0.4 m | 0.4 m ≤ d < 0.6 m | 0.6 m ≤ d < 0.8 m | 0.8 m ≤ d < 1.0 m |
| T010 | ◄► −0.36 | ◄► −0.21 | ◄► −0.03 | ◄► −0.02 |
| T020 | ◄► −0.43 | ◄► −0.11 | ◄► −0.05 | ◄► 0.00 |
| T100 | ◄► −2.68 | ◄► −0.39 | ◄► −0.17 | ◄► 0.02 |
◄► stable.
Table 13.
Downtown road networks global results for rain-induced flooding exposure.
| CS_Flood (Km) | CS_Flood (%) | BAU_Flood (Km) | BAU_Flood (%) | CAS3_Flood (Km) | CAS3_Flood (%) | |
|---|---|---|---|---|---|---|
| T010 | 6.1 | 4.0% | 7.1 | 4.6% | 5.2 | 3.3% |
| T020 | 7.5 | 4.9% | 8.3 | 5.4% | 6.6 | 4.3% |
| T100 | 12.7 | 8.2% | 13.9 | 9.0% | 7.7 | 5.0% |
Table 14.
Lisbon downtown: roads limited speed due to flooding water level (CS, BAU, CAS).
| Scenario | Roads with Speed Limitations Due to Flooding Height (% Total Roads) | ||
|---|---|---|---|
| Return Period | Max Vehicle Speed 10 km·h−1 | Max Vehicle Speed 0 km·h−1 | |
| CS | T010 | 3.3 | 0.7 |
| T020 | 4.2 | 0.7 | |
| T100 | 7.0 | 1.2 | |
| BAU | T010 | 4.0 | 0.7 |
| T020 | 4.6 | 0.8 | |
| T100 | 7.7 | 1.3 | |
| CAS | T010 | 2.9 | 0.4 |
| T020 | 3.8 | 0.5 | |
| T100 | 4.4 | 1.7 | |
Table 15.
Downtown results for rain-induced flooding: locations and bins.
| CS Components Affected by Rain-Induced Flooding (% Class) | ||||||
|---|---|---|---|---|---|---|
| Type | Total (n.) | Flooding Level | 0.2 m ≤ d < 0.4 m | 0.4 m ≤ d < 0.6 m | 0.6 m ≤ d < 0.8 m | 0.8 m ≤ d < 1.0 m |
| Locations | 12,357 | T010 | 2.0 | 2.7 | 0.7 | 0.0 |
| T020 | 2.9 | 3.5 | 0.5 | 0.2 | ||
| T100 | 6.6 | 7.4 | 1.0 | 0.4 | ||
| Bins | 43,075 | T010 | 1.3 | 1.8 | 0.5 | 0.0 |
| T020 | 2.2 | 2.7 | 0.4 | 0.2 | ||
| T100 | 5.2 | 5.8 | 1.0 | 0.3 | ||
Publisher’s Note: MDPI stays neutral with regard to jurisdictional claims in published maps and institutional affiliations. |
© 2021 by the authors. Licensee MDPI, Basel, Switzerland. This article is an open access article distributed under the terms and conditions of the Creative Commons Attribution (CC BY) license (https://creativecommons.org/licenses/by/4.0/).
Share and Cite
MDPI and ACS Style
Almeida, M.d.C.; Telhado, M.J.; Morais, M.; Barreiro, J. Multisector Risk Identification to Assess Resilience to Flooding. Climate 2021, 9, 73. https://0-doi-org.brum.beds.ac.uk/10.3390/cli9050073
AMA Style
Almeida MdC, Telhado MJ, Morais M, Barreiro J. Multisector Risk Identification to Assess Resilience to Flooding. Climate. 2021; 9(5):73. https://0-doi-org.brum.beds.ac.uk/10.3390/cli9050073
Chicago/Turabian StyleAlmeida, Maria do Céu, Maria João Telhado, Marco Morais, and João Barreiro. 2021. "Multisector Risk Identification to Assess Resilience to Flooding" Climate 9, no. 5: 73. https://0-doi-org.brum.beds.ac.uk/10.3390/cli9050073
Note that from the first issue of 2016, this journal uses article numbers instead of page numbers. See further details here.