
Measuring Household Resilience to Cyclone Disasters in Coastal Bangladesh


1
Department of Geography and Environmental Studies, University of Rajshahi, Rajshahi 6205, Bangladesh
2
Department of Sociology, The Ohio State University, 238 Townshend Hall, 1885 Neil Ave. Mall, Columbus, OH 43210, USA
3
Faculty II—Geography, Institute for Spatial Analysis and Planning in Areas of Intensive Agriculture (ISPA), University of Vechta, Driverstraße 22, 49377 Vechta, Germany
4
Global South Study Center and Institute of Geography, University of Cologne, Albertus Magnus Platz, 50923 Cologne, Germany
*
Author to whom correspondence should be addressed.
Climate 2021, 9(6), 97; https://0-doi-org.brum.beds.ac.uk/10.3390/cli9060097
Submission received: 4 May 2021
/
Revised: 4 June 2021
/
Accepted: 11 June 2021
/
Published: 16 June 2021
(This article belongs to the Section Climate Adaptation and Mitigation)
Abstract
:The main objective of this paper is to measure the level of household resilience to cyclone and storm surges in the coastal area of Bangladesh. We draw on four general disaster frameworks in terms of addressing household-level resilience to cyclones and storm surges. We use a composite indicator approach organized around four components: (1) household infrastructure (HI); (2) household economic capacity (HEC); (3) household self-organization and learning (HSoL), and; (4) social safety nets (SSN). Drawing on a household survey (N = 1188) in nine coastal union parishads in coastal Bangladesh purposively selected as among the most vulnerable places in the world, we use principal components analysis applied to a standardized form of the survey data that identifies key household resilience features. These household index scores can be used for the assessment and monitoring of household capacities, training, and other efforts to improve household cyclone resilience. Our innovative methodological approach allows us to (a) identify patterns and reveal the underlying factors that accurately describe the variation in the data; (b) reduce a large number of variables to a much smaller number of core dimensions of household resilience, and (c) to detect spatial variations in resilience among communities. Aggregated to the community level, our new index reveals significant differences in community cyclone resilience in different areas of the coastal region. In this way, we can show that shoreline and island communities, in particular, have significant deficits in terms of household resilience, which seem to be mutually reinforcing one another and making for lower resilience.
1. Introduction
The Hyogo and Sendai frameworks for disaster risk reduction [1,2] underscore the importance of disaster resilience. Resilience has been defined as “the ability of a system to absorb change while retaining essential function; to have the ability for self-organization, and; to have the capacity to adapt and learn” [3]. Much of the discussion has focused on the capacity to cope with external disturbance and still retain basic function and structure [4,5,6,7]. Other researchers, however, have addressed proactive adaptations and transformational change, creating a broader conception of how people respond to, adapt to, and absorb cyclone disasters, climate change, and other physical and environmental hazards [8,9]. In response to cyclone damage, some may simply cope by borrowing money, selling off property, and reducing food consumption, while others proactively adapt by acting in advance to accumulate savings, create secure storage for seeds and household assets, securing cyclone disaster training, and the like. Still, others may engage in post-disaster transformational behavior by switching to more resilient crops, creating new businesses, getting vocational education, and migrating to better jobs [10,11,12,13].
A critical tool for measuring people’s capacities is a composite indicator of cyclone and storm surge resilience that can be used to benchmark, monitor, and guide efforts to cope, adapt and move forward in the response to a disaster. A key limitation of the major disaster resilience frameworks for constructing a composite indicator is their high level of abstractness. Typically, they are designed to deal with multiple types of disasters: cyclones, flash flooding, earthquakes, tsunami, civil unrest, genopoliticide, etc. While many capacities and processes that create resilience are generalizable, this abstractness has significant limits when addressing specific types of disasters. For this reason, our index focuses on cyclones and storm surges.
Because of its high vulnerability to cyclones and storm surges, coastal Bangladesh can be seen as a critical test-bed for the study of cyclone resilience. With over 60 million residents, 12.9 million of whom live below the poverty line [14], the coastal villages are highly vulnerable to major cyclones and storm surges and confront additional problems with riverine flooding, severe riverbank erosion, and long-term problems like waterlogging, salinization, arsenic contamination, land subsidence, and sea-level rise [15]. Nationally, over 10% of all crops are lost annually to flooding, over 100,000 people are affected, and over 30,000 are displaced by riverbank erosion [16]. In an average year, over 20% of the total Bangladesh land area suffers significant flood damage with the greatest damage in the coastal zone [17]. Some of the world’s most powerful and destructive cyclones impact this area. Globally, Bangladesh is the 5th most vulnerable country in the world to natural disasters as measured by the deaths and population affected, overwhelmingly due to cyclones and storm surges [18,19]. In the context of the increased rate of natural disasters in Bangladesh and new disaster risk management methods that center on strengthening resilient communities, an enhanced, in-depth understanding of the dynamics of disaster resilience has become increasingly necessary [5,20].
In this analysis, we address cyclone and related storm surge vulnerability, an item for which there is significant global data [18]. In literature, most of the frameworks for measuring disaster resilience are typically framed without reference to specific social actors or address only the community, regional or societal level. A major limitation of existing discussions is the lack of research at the household level, which is especially important in disaster planning and response. After all, the household is the primary social unit in most disaster response and recovery but this is not adequately reflected in existing research [20,21]. We focus on households as our primary unit of analysis. In particular, the paper aims to measure the level of household resilience to cyclone and storm surges in the coastal area of Bangladesh. This study seeks to improve current knowledge on the measuring of disaster resilience at the household level for policy-making with respect to disaster management and planning.
2. A Framework for Analyzing Cyclone Resilience
We develop a composite index of cyclone and storm surge resilience at the household level that addresses proactive adaptation and transformational possibilities as well as short-term coping and intermediate recovery efforts. Households need to be examined in terms of how they relate to key institutions and activities in the community as well as their control of particular convertible assets.
We draw on four leading disaster resilience frameworks by specifying their relevance to the response of households to cyclones and storm surge: the Sustainable Livelihoods Framework (SLF) [22], the Community Disaster Resilience Framework [23], the geographically oriented Disaster Resilience of Place (DROP) framework [24], and the Food and Agriculture Organization’s (FAO) disaster resilience tool [25,26]. We also supplement these with our own qualitative interviews in rural communities, leading us to identify four sets of resources and processes that households need to cope with, and adapt and respond proactively to cyclone and storm surges:
(1) Household infrastructure (HI) or the physical features of housing: the basic structure and materials, sanitation, sources of drinking water, and access to electricity. The International Federation of Red Cross (2012) found in their practical disaster relief operations that well-maintained and accessible infrastructure is critical to the ability of households to cope with and recover from cyclones and storm surges. Secure housing is important for surviving the brute force of the storm but also for a place to stay during recovery and launching proactive change.
(2) Household economic capital (HEC), which captures the ability of a household to use economic resources to achieve the desired state [27]. These are based on household income, the ability to produce enough food to have excess to sell, the ability to reduce dependence on local markets for purchasing food, and the ability to generate income from non-farm self-employment. The higher the household income, the lower the risk of losing the basis of the household’s livelihood during a crisis and having savings that tide people through a bad period. Immediately after a cyclone, household food stocks are quickly depleted and many households are forced into local food markets where prices rapidly escalate. Having the ability to produce excess food and to reduce dependence on local food markets enhances food security. In cyclone disasters, those who are self-employed outside of agriculture (e.g., construction, trading, services) are often less affected and able to earn income from repairs and daily activities while farmers have lost crops, livestock, seed, and equipment. Planting new crops and restoring farming operations may take months or even years.
(3) Household self-organization and learning (HSoL) means that a household can plan and initiate new adaptations, both for the individual household and collectively [22]. This facilitates smart coping, proactive adaptation as well as transformational behavior and discourages dysfunctional coping, such as selling off assets in a dead market. In these rural communities, the self-organization of households depends on the decision-making capacity of household heads, household control over land, access to machinery and means of transport, agricultural knowledge associated with mixed crop cultivation, and the independence from the local farming community that comes with having a household member who migrates elsewhere for earnings. This component is most important immediately after a cyclone and during recovery [28].
(4) Access to a social safety net (SSN) is based on having social capital in the form of interpersonal trust networks that can be used to gain help and mobilize resources. For households, this means access to a phone for making business deals, secure access to fresh water, access to health care facilities in the local community, the ability to contact local public authorities, such as the union parishad government or the agricultural extension office, access to a cyclone shelter, and friendship networks who can provide emergency and short-term assistance. While these are partially a feature of the local community, households have different access to these networks and social safety nets, which can provide help and assistance during cyclone disasters [29] and tools for mitigating the risks of such natural disasters [25].
Each component is estimated separately, to construct a composite index of household resilience. The different components of the resilience observed then reflect how all these factors generate change in a household’s resilience. In algebraic terms, cyclone resilience for household i can therefore be expressed logically as follows:
where Ri = household resilience to cyclone and storm surges, HI = household infrastructure, HEC = household economic capital (HEC), HSoL = household self-organization and learning, and SSN = social safety nets. We now turn to a method for constructing such a resilience index.
3. Research Design, Methodology, Data
Qualitative interviews. Our first step was to engage in key informant interviews with local officials and NGO representatives to understand the challenges and immediate responses of rural people in response to cyclones and storm surges. Because of our interest in proactive and transformation change, this also including discussions of new crops and agricultural technology, and other means to improve livelihoods. Once we had selected our study sites (see below), we interviewed nine local officials and long-term residents about resilient housing, experiences during and after cyclones, adult education, and daily practical skills, and six NGO officials about emergency response and recovery from cyclones and changes in agricultural practices, markets, and technology. As discussed below, our study area consisted of nine union parishads that experienced greater damage from cyclones Sidr (15 November 2007) and Aila (25 May 2009), creating a wealth of experiences with responding to cyclones and storm surges. Cyclone Sidr and Aila were the two top-most devastating cyclones and storm surges in the coastal area of Bangladesh to this date. Hence, as this paper aims to measure disaster resilience to cyclones and storm surges, the large data set, collected five years after Aila, is still a valuable source to understand the crucial components of households’ disaster resilience of cyclones and storm surges in the study area.
Household survey. Second, we conducted standardized household interviews in nine “villages” or union parishads in five districts of coastal Bangladesh between October and December 2014. A union parishad, which contains multiple settlements or mouzas, is the smallest governmental administrative unit in rural Bangladesh, superseded by upazilas (sub-districts), zilas (districts), and bibhag (divisions). Unions are more stable because of their governmental functions, making them a more viable unit of data collection than mouzas, for which there is very limited census or other data. The aim was to collect data on the union level and only one union per study site in order to better compare our survey data to statistics published by the Bangladesh Bureau of Statistics [14]. In one case, however, borders between unions were crossed (Koyra; Amadi and Bagali unions, where a major river divides the settled area).
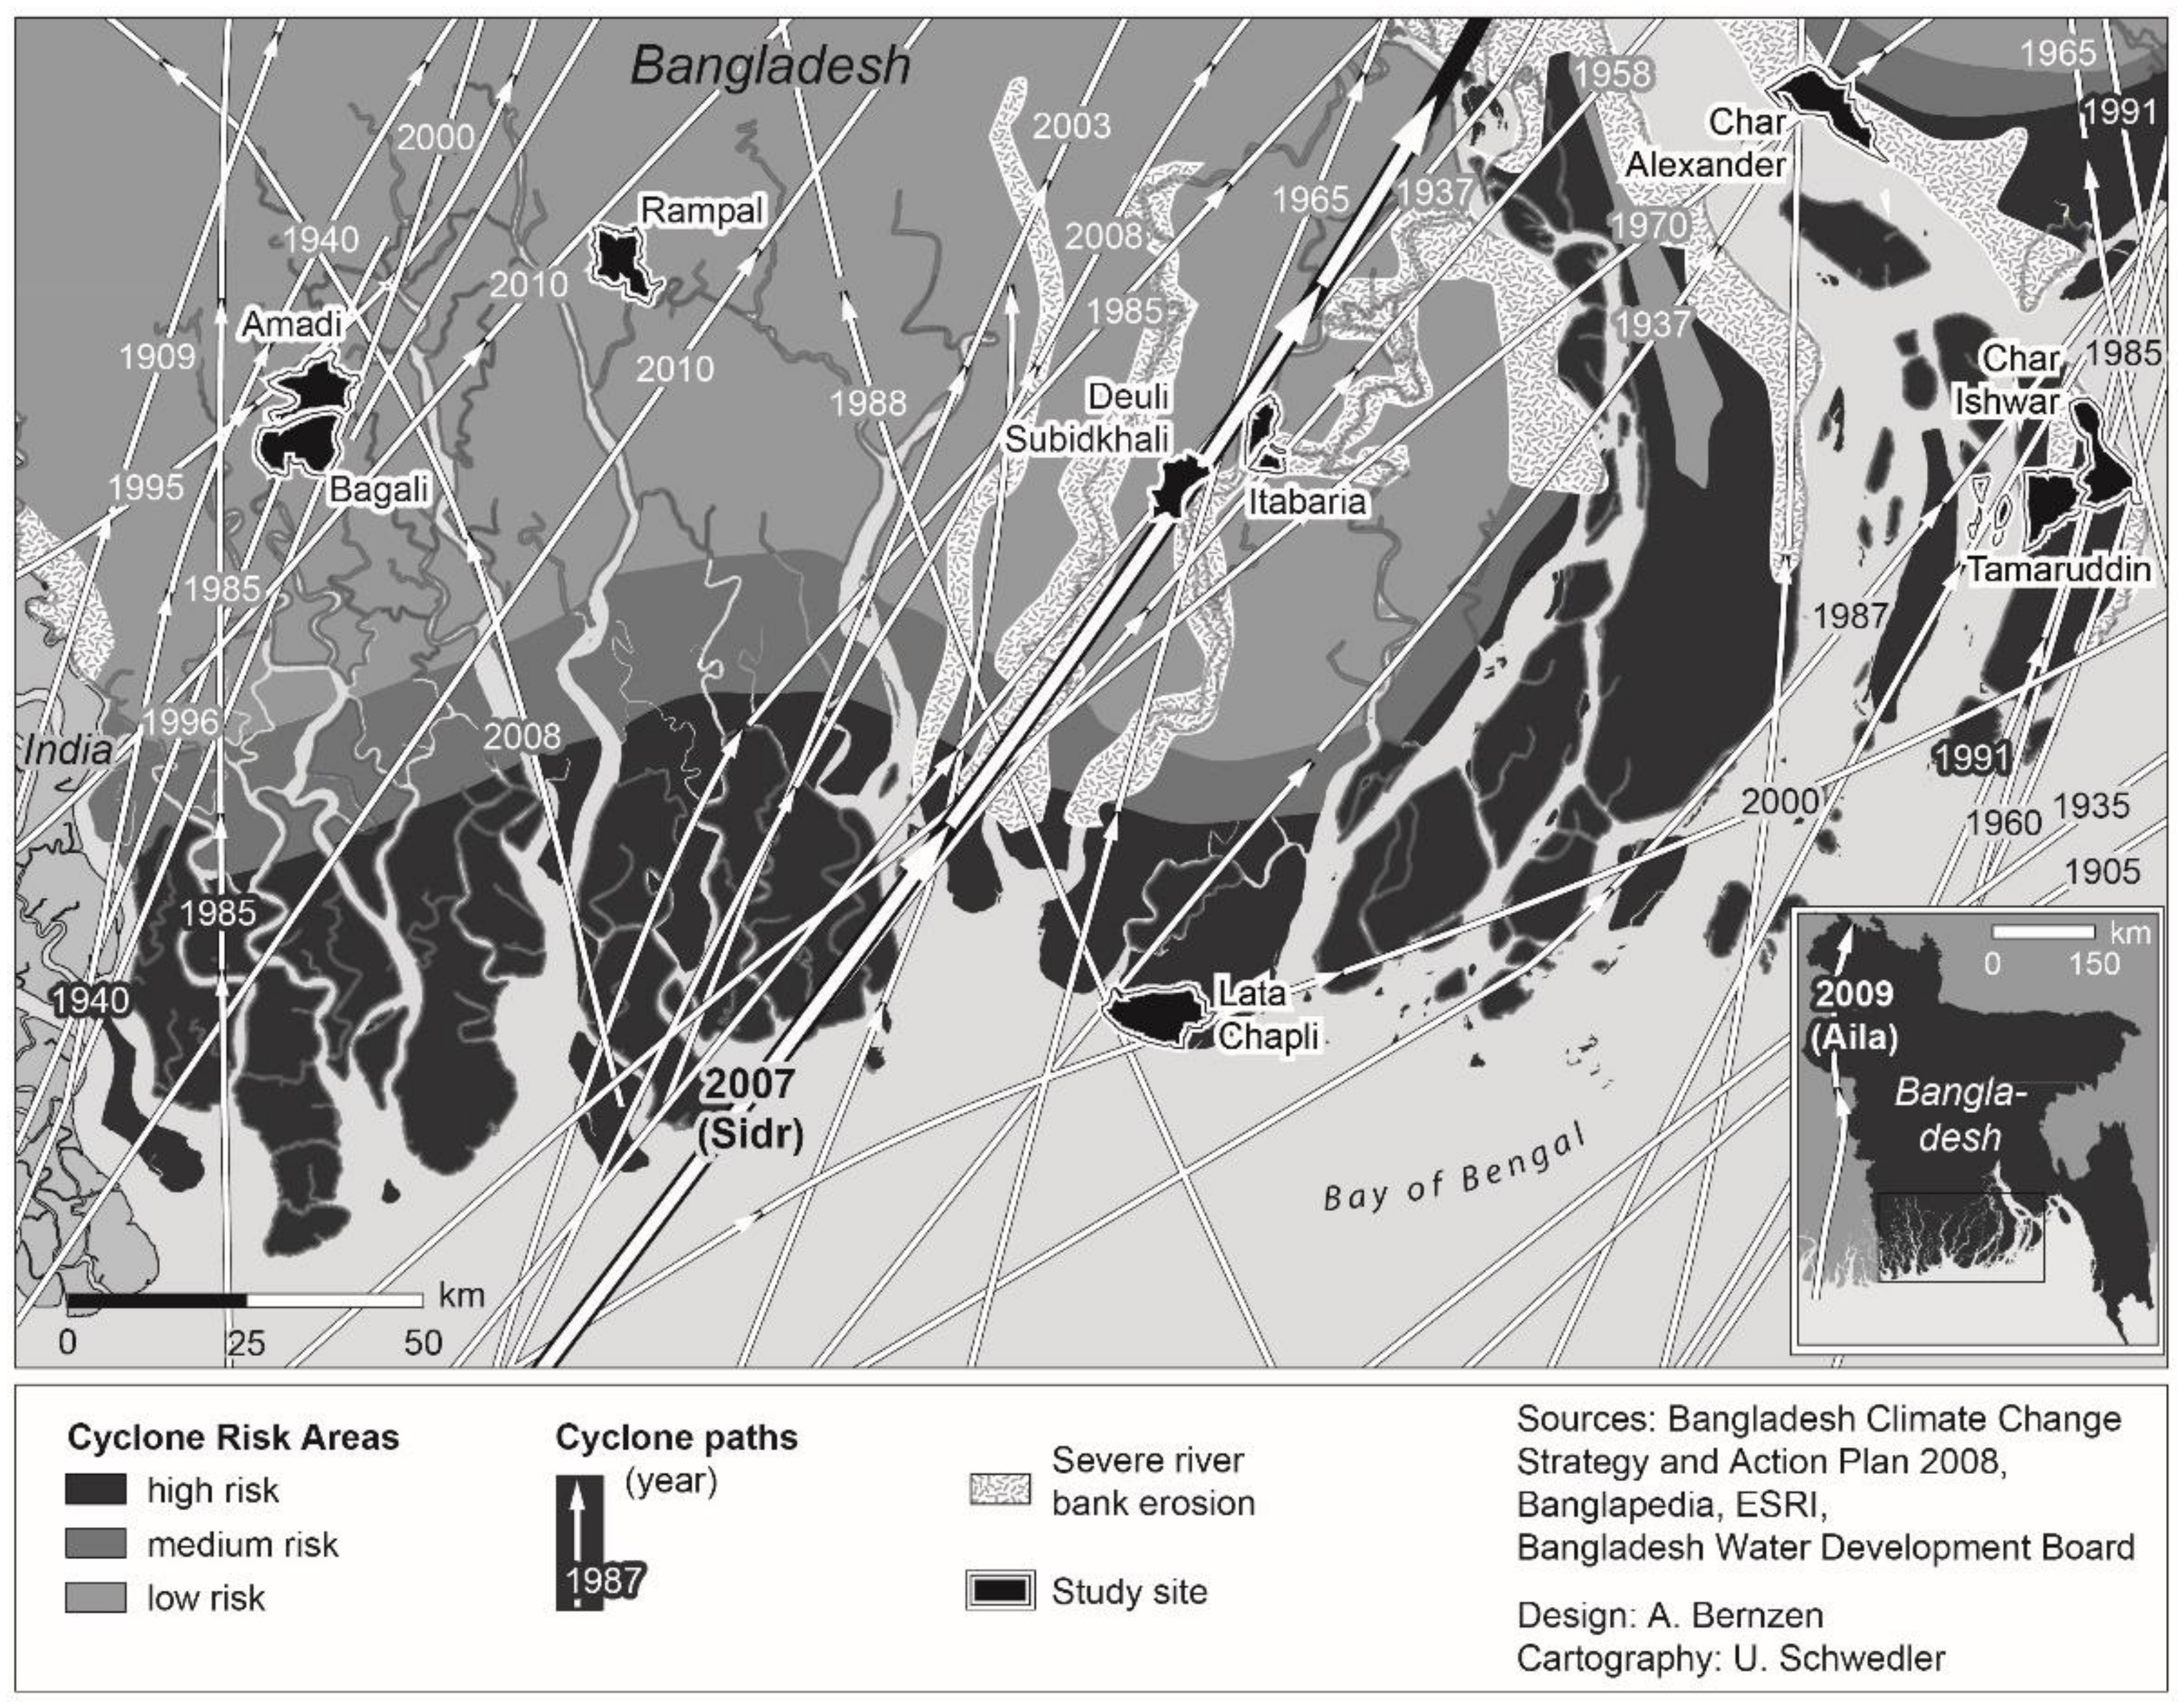
We purposely selected our nine study sites to maximize cyclone vulnerability based on the damage in recent cyclones Sidr and Aila and to create variety in terms of ecological exposures to cyclones and storm surges. We identified four unions from the immediate shoreline (Lata Chapli, Deuli Subaidkhali, Itabaria, and Char Alexander), three from inland areas (Bajali, Amadi and Jhojonia/Gabbunia), and two from the coastal islands (Char Ishwar, Tamarruddin), all of which experienced severe damage from these cyclones. All these union parishads represent rural communities on poldered land in different areas of the coastal zone of the Ganges-Meghna-Brahmaputra delta, which as a region features unique morphological dynamics that cannot be found along the eastern Chittagong coast of Bangladesh. Figure 1 shows the location of the nine unions where interviews were conducted with an overlay of cyclone paths over the past century.
At the union parishad level, we used quota sampling to guide household selection to ensure comparable coverage of each union and social diversity. The target sample size for interviews in each study site was 150 households, hence generating subsamples (representing between 1.7 and 2.8% of the union’s population, respectively) which in themselves allow for relatively meaningful statistical analyses. The final sample was 1188 households. To (geographically) cover the different locations of the settled union area, field assistants—students and graduates of Rajshahi University—were asked to identify all mouzas across the union, allocate a similar target subsample (quota of the 150) to each, and approach households by moving from the center of the settlement (e.g., market square) towards the outer edges of the settlement along a major road/track and, depending on the size of the mouza, contacting every third to fifth household (or the next household if no one was available at the targeted household). Insofar as similar households are likely to reside close to each other, this should provide greater social diversity. Participating households were further selected on the basis of a minimum residence period of 10 years to capture the affectedness by and perceptions of different natural events (such as cyclones) and adaptations to livelihood strategies (such as land-use change) over time. Overall, while covering a large variety of rural livelihood settings across the delta, the sampling strategy does not generate a representative sample of all coastal households in Bangladesh.
Each interview took approximately 60 to 90 min and consisted of 55 questions which included fixed choice and open-ended items. The questionnaire covered six sections with the following themes: (1) information on location and type of house; (2) social-demographic characteristics of the household members, (3) land access and land use, (4) food security, consumption, and livelihood adaptation, (5) social interaction and participation, (6) experience with livelihood problems and cyclone/natural disasters. Field assistants were trained by the authors prior to and during data collection and conducted face-to-face interviews in Bangla, asking the questions and recording the respondents’ self-reported answers on the survey sheet. A few variables like GIS locations were observed and recorded by the interviewer. Both male and female field assistants were employed as it was assumed that, due to cultural etiquette, female interviewers would have better access to female respondents of households. Interviews were held in most cases with the household head (85.3% of respondents; 973 male, 40 female) or his/her spouse (11.6% of respondents; 2 male, 136 female). In a small number of cases, other household members were present and helped to supplement head of household answers. The average number of persons living in the surveyed households was 5.16. After the data collection, field assistants entered the data into an online survey mask which exported the data directly into SPSS software.
Measurement and scaling. There is no agreed-upon methodology for measuring disaster resilience with some using indicators, scorecards, and tools of various sorts [30,31,32]. We favored a composite indicator approach because it provides clear monitoring tools and can be used to evaluate the return on investments. We used a set of measurement items from our survey and followed recent precedent [24,25,33] in using Principal Components Analysis (PCA) to scale these items so that a composite index could be built. Guided by our four resilience measurement frameworks and the four defined sets of resources, we used four to six questions to tap each dimension of a cyclone and related storm surge resilience, favoring items identified in our qualitative interviews as important to cyclone and storm surge resilience. Table 1 lists the 19 questions that capture our four dimensions. Each item has a precedent in previous studies and a clear rationale for why the resource might allow households to cope and adapt to cyclone/storm surge damage. In a few cases, we used two questions to ensure a robust measure. All are grounded in our qualitative interviews with local observers and NGO leaders.
These measures used different scales: 15 were categorical, 2 were ordinal and 1 was interval. To create comparable reference points, we normalized them using min-max methods, a common technique in index construction [33,58]. Min-Max assigns a value of 0 to the minimum value and 1 to the maximum value and rescales all other values between 0 and 1 by subtracting the minimum value and dividing by the range (i.e., the minimum subtracted from the maximum) using the following formula:
This makes the scales comparable but has the drawback that the resulting scale is not an absolute measurement of resilience.
All variables were also adjusted in orientation so that larger values corresponded to theoretically higher resilience. For example, housing condition is expressed in four ordinal categories: (1) pacca (made of concrete), (2) semi-pacca (floor and wall made of concrete and roof made of tin), (3) kaccha (made of bamboo/straw), and (4) others. Based on min-max scoring, pacca housing has the highest score (1) and “others” has the lowest score (0) with other values scaled in-between by subtracting the minimum value and dividing by the range. So semi-pacca scores 0.66 and kaccha 0.33.
A composite index. Disaster resilience is a multifaceted concept comprising many factors. Developing a comprehensive approach to assessing disaster resilience incorporating all its dimensions is challenging. Currently, there is no widely accepted methodological approach to assess disaster resilience [59]. Various methods exist to build composite indices, with the choice of method depending upon the type of problem, the nature of the data, and the objective of the analysis [60]. However, social scientists agree that the initial point for measuring disaster resilience in communities or households is to use benchmark tools for a better understanding of the components of resilience [24,49]. The widely accepted tool to measure disaster resilience is the composite index, for instance, Cutter et al.’s (2003) [35] Social Vulnerability Index (SoVI) [31], which is an aggregation of a set of variables from particular components used to summarize the characteristics of resilience to a specific disaster. Constructing a composite index is an effective way to assess the extent of disaster resilience with accuracy [53].
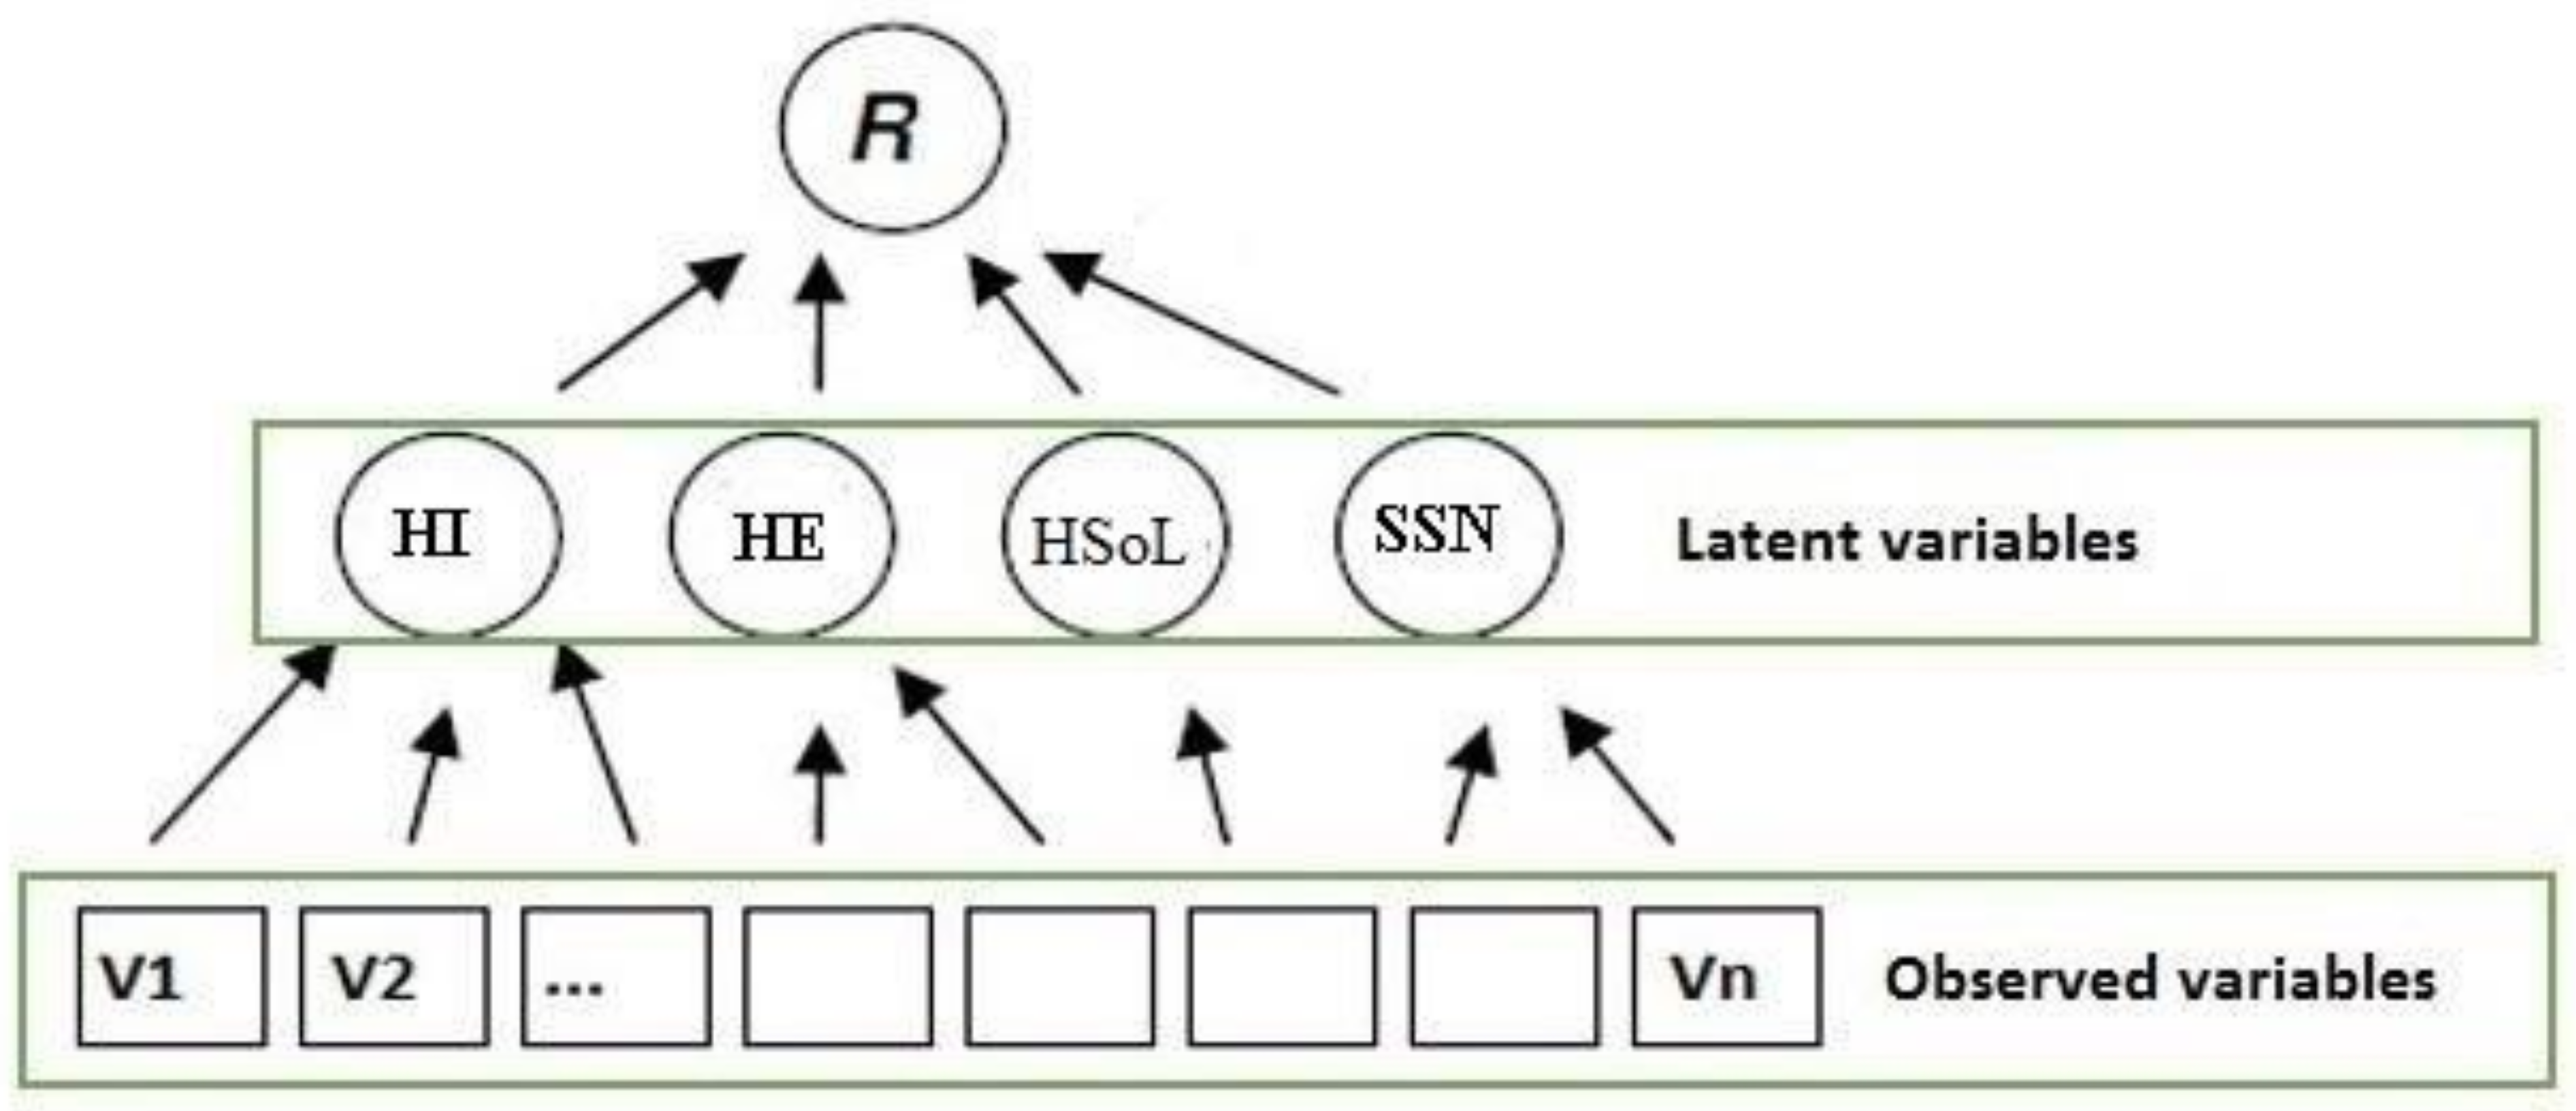
Composite indices have been constructed in multiple ways, including additive scales, structural equation models [61], and 2-stage latent variable models [25]. Additive scaling assumes that items have equal weight, which seems implausible without stronger theory and experience to guide this decision. A structural equation approach is appealing by combining factor analysis with regression but in this application is violated by the 15 measures which are categorical and mixed with ordinal and continuous measures. While a generalized latent variable model might be used [62], this assumes no earlier knowledge of the deterministic relationships among the observed variables. But our qualitative interviews gave us information on how the observed measures should fit together. Another approach is the 2-step factor analysis model used by Alinovi et al. (2010) [25] to measure Palestinian food security by first applying factor analysis and optimal scaling to separate subdimensions and then factor analysis to the results. Our approach is to use principal components, which aims to create a maximal linear combination of a set of variables or principal components. This involves minimal assumptions and can be seen as an informed inductive approach to finding the best linear combination to summarize the maximal variance in the data. In the PCA presented below, the first stage results generate a two-factor solution for each dimension, which fits the conceptual complexity and overlap of measurement items that discussions of disaster resilience dimensions suggest [20]. This leads to a second stage PCA of the four dimensions, similar to Alinovi et al. (2010) [25]. Figure 2 provides a conceptual outline of the logic.
Different multivariate techniques can be used in this type of two-staged estimation, such as factor analysis, PCA, correspondence analysis, multidimensional scaling, and optimal scaling [63]. We used PCA to construct the four dimensions and then again in the second stage to construct the overall composite index. PCA relies on the variation and co-variation of the data matrix to construct weights in the component index [41]. Vyas and Kumaranayake (2006) argue that the PCA weighting method is objective, computationally easy, and compatible with survey data and databases [64]. It is a widely used technique in the construction of composite scales such as ours.
4. Results and Discussion
Numerous methods have been used to construct composites, such as hierarchical and similar deductive approaches, principal components analysis (PCA), stakeholder-focused methods, and relational analyses [31]. This study uses a transparent weighting system to account for the variance in the data through PCA. The literature finds that PCA can handle multiple scales in the input matrices (e.g., categorical, ordinal, interval, etc.). Our input measures also met other conditions for PCA, such as sample size [65], factorability of the correlation matrix of variables, meaning that there are at least some correlations among the variables such that coherent factors can be extracted [49]. PCA identified patterns and revealed the underlying factors that accurately described the variation in the data [66]. PCA was performed on each component to identify the variables with the highest variance in this study. The first step in calculating the resilience index is constructing the four latent variables for each resilience dimension treated as a block. PCA was applied to the four to six observed variables used to represent each of the four resilience dimensions for household infrastructure, household economic capital, household self-organization and learning, and household social safety nets.
Several preconditions need to be met for PCA to be an appropriate method. The sample size needs to be over 200 [67]. The correlation matrix of the observed variables needs to display at least modest correlations so that coherent factors can be extracted [49]. To test this, the Kaiser-Meyer-Olkin (KMO) Measure of Sampling Adequacy (≥0.60) and Bartlett’s Test of Sphericity (p < 0.001) were used, both of which indicated acceptable [68] correlation matrices, as indicated below in our tables.
We extract only factors with an eigenvalue of 1.0 or more in line with Kaiser’s assumption (see Table 2 below). We report factor loadings for each observed variable, indicating the correlations between the observed variables and the latent factors [69]. To minimize the number of variables with high loadings on particular factors and to adjust for multiple scales in our measurement items, a varimax rotation was performed. To understand the influence of variables on each component of cyclone resilience, we checked the communality for 19 variables which consistently exceed a threshold value of 0.50. The loadings reported in Table 3, Tables 5, 7 and 9 from the structure matrix, which represent the correlations between the variables and the factors.
Household Infrastructure. HI relates to a household’s ability to weather cyclones and storm surges relatively intact and to protect household possessions and anyone remaining in the house during the storm. It also captures the household’s likely post-disaster access to safe drinking water, sanitation, and electric power. As mentioned, we use four observed measures: housing type, sanitation, sources of drinking water, and availability of electricity. All aimed at measuring household infrastructure, so that a high correlation among them produced a latent variable that fit the common pattern of the data.
The eigenvalues and variances suggest that there are two factors that represent these observed measures. These two latent factors are produced from a linear combination of the weights of the four observed variables, which explain 63.4% of the total variance. Table 3 shows the factor loadings of the observed variables on the latent Factors 1 and 2. All are positively correlated to the two factors with housing type playing a stronger loading in Factor 1 (0.719) and drinking water a stronger loading on Factor 2 (0.679).
Our understanding of this result is that housing and sources of drinking water are key attributes of the infrastructure of flood resilience. Well-designed affordable housing provides more than the provision of safe, decent, and inexpensive shelter; it is central to flood resilience [70]. A robust housing condition (e.g., pacca) and access to safe drinking water support the community social structure and economic livelihoods of households, minimizing the vulnerability of people to environmental stresses and health risks, and increasing personal security against threats of displacement linked to housing. In addition, better sanitation and access to electricity are important as well. Many GO’s (Upazila health complex) and NGO’s (ActionAid, CARE Bangladesh) have worked on this area to ensure sanitation and return electric power to the area after storms [71].
Household Economic Capital. The PCA extracted two factors as underlying latent factors that measure latent HEC. Table 4 shows eigenvalues of 1.497 and 1.023. These two factors explain 63% of the cumulative variance.
Table 5 presents the factor loadings of each observed HEC variable, showing that all positively correlate with Factor 1. But non-farm self-employment has a low loading, suggesting it is not important to this factor. Instead, it loads strongly on Factor 2 but neither of the food self-sufficiency measures loads strongly. Interestingly, household income makes an almost equal contribution to both factors. There may be two major groups—farmers, many of whom can produce subsistence food needed during a disaster, and non-farm self-employed, who may have good earnings during recovery but depend on local food markets during a disaster [46]. These two groups seem to have different sources of economic resilience.
Household Self-Organization and Learning. HSoL is important to the capacity to resist, absorb, and recover from a disaster [72]. The observed variables were short-term migration of household members, ability to use machines, household head’s ability to make decisions about land use, the ability of the husband and wife to make land-use decisions, and experience with mixed-crop cultivation (e.g., rice with shrimp or shrimp with freshwater fish). The PCA retained two factors for the HSoL as presented in Table 6, which accounted for 54.6% of the cumulative variance.
Table 7 shows that all the observed variables are positively correlated with the two latent factors, except for land-use decisions being made by the household head. Although land-use decisions by the household head and land-use decisions made jointly with the wife strongly correlate with Factor 1, land-use decisions made by the household head negatively correlate with Factor 2. This suggests that land-use decisions made by the household heads might reduce disaster resilience [71]. Factor 2 is strongly correlated with the household head engaging in temporary migration for wages and the use of machinery, suggesting that these are more adaptive households. Temporary migration of household members is an effective coping and sometimes proactive adaptation strategy widely used in response to flooding disasters in rural Bangladesh [73].
Social Safety Nets. The estimation of the SSN variable involved five observed variables: (1) access to business partners by mobile phone, (2) fresh water, (3) access to health facilities, (4) access to public authorities, (5) access to cyclone shelters, and (6) help from friends in past disasters. Two factors were extracted from our PCA, which accounted for 49.5% of the cumulative variance (Table 8).
Table 9 shows that business partnerships via mobile phones are the only factor with a strong loading on Factor 2 and that all other factors are correlated more strongly with Factor 1. Households can conduct business quickly by sending money through bKash (mobile bank) to their business partners [14,21,74], access current market information on crops and purchases, and use current information in making business decisions. This, however, is unrelated to the other factors, especially access to public authorities, cyclone centers, health facilities, and help from friends in past disasters, which are correlated strongly with Factor 1. During declared disasters, union parishad officials are often critical to the allocation of emergency assistance. Agricultural extension officers provide emergency seed and advice about replanting crops and restoring a farm to operations. Access to health and disaster centers both depend on where the household is located. Past help from friends and neighbors suggests integration into local community networks.
Constructing household disaster resilience. The final step is to construct a latent index for overall cyclone/storm surge resilience based on a PCA of the eight factors representing the four dimensions. Since all eight latent factors are normally distributed with means of zero and variances of one, PCA is an appropriate technique. A factor analysis was performed through the iterated principal factor method among the retained eight factors, which repeatedly re-estimated communalities. The PCA identified five factors, as shown in Table 10. Factor 1 alone explained over 21% of the cumulative variance. Factor 2 explained more than 15% with Factors 3, 4, and 5 accounting for 13%, 12%, and 11%, respectively, cumulatively accounting for 76% of the total variance (Table 10).
Table 11 shows that all latent factors of household resilience except for HSoLfactor1 (access to authorities, shelters, help) are positively correlated with Factor 1. Both HEC factors—independence from local food markets and non-farm self-employment—are strongly correlated with Factor 1 and moderately correlated with Factors 2 and 3. HECfactor2 (non-farm self-employment) is also strongly correlated with Factor 5. HSoLfactor1 (land use decisions) has stronger loadings on Factor 1 while HSoLfactor2 (migration and machinery) is more strongly related to Factors 2 and 5. HIfactor1 (housing type) is strongly correlated with Factor 1 while HIfactor2 (water and electricity) is more strongly related to Factor 4. SSNfactor1 (access to authorities, shelters, health care, help) is more strongly correlated with Factors 2 and 3. The negative correlation of SSNfactor2, which is rooted in mobile phone use for business, seems to reflect this distinctive sector of the rural community.
Household disaster resilience is not a one-dimensional concept. Several of the dimension factors load on multiple factors of the overall index and none seem to be a product of a single dimension, which is suggested in the literature. Although Factor 1 explains the largest share of the total variance, these other four factors are still important. The experience of building the FAO resilience tool [46] suggests that one way to address this is to use a weighted sum of the five factors presented in Table 10 to construct household-specific scores for the overall disaster resilience index. These factors are orthogonal to each other (as based on the PCA) and so there is no multicollinearity. To estimate general household disaster resilience, the five factors can be used in line with Thomson’s (1951) regression method (see Endnote) [75,76], by multiplying the household score by its own proportion of the variance explained.
Using the explained variance associated with each of the five dimensions, this suggests the following equation for estimating the household scores for general disaster resilience:
Household cyclone resilience = 0.211 ∗ Factor 1 + 0.155 ∗ Factor 2 + 0.138 ∗ Factor 3 + 0.123 ∗ Factor 4 + 0.114 ∗ Factor 5
This formula provides a household resilience score which can be used for assessing and benchmarking individual households to indicate their relative resilience.
5. Discussion of Spatial Characteristics—Assessing Resilience at the Community Level
Our resilience index can also be used to capture the relative cyclone/storm surge resilience of whole communities by looking at the share of households that are at or above the mean in cyclone resilience. We first categorized all households based on whether their general resilience score was above or below the mean index score for all households. To simplify this for purposes of visualization, we then classified all households with values above the mean as “high” and those below the mean as “low”. Indicating the wide disparities in cyclone resilience, over two-thirds (68%) of all households were below the mean and slightly under a third (32%) were above mean resilience. Table 12 shows the number of high and low cases and their respective shares in each of the nine study sites, which are grouped by the three ecological zones and indicate significant disparities among these communities.
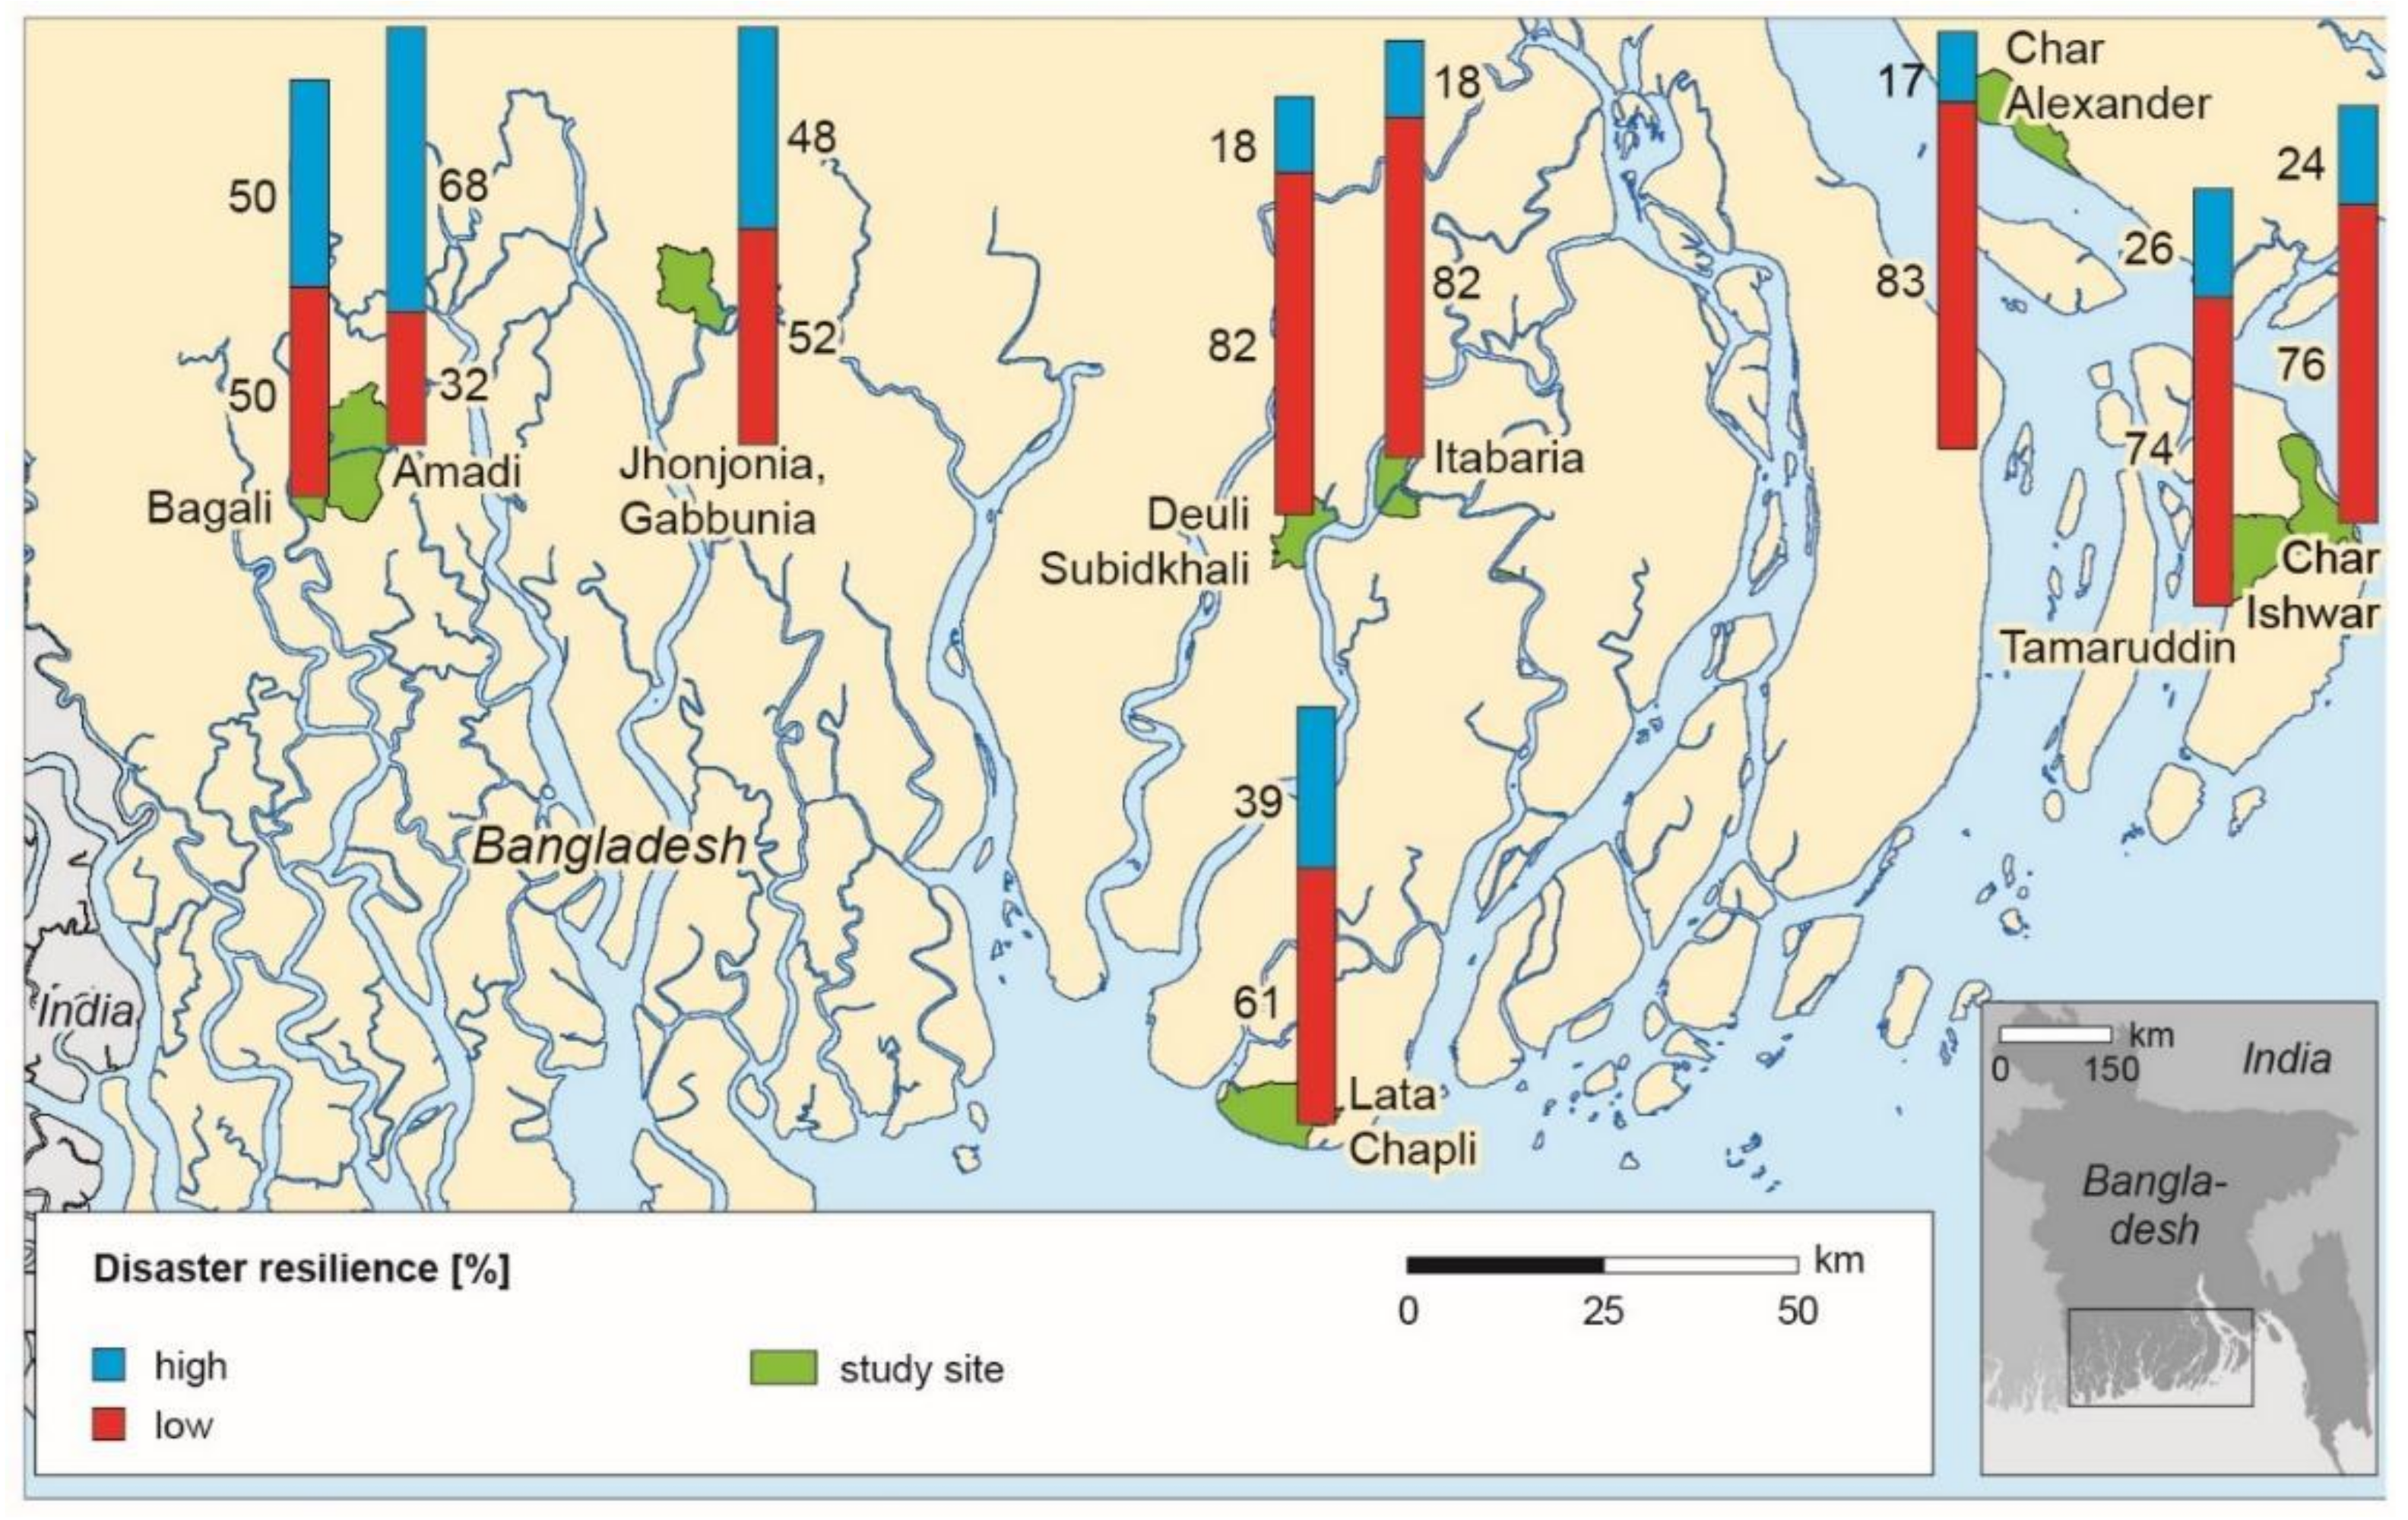
Five of the nine unions had greater than the mean number of low-resilient households. Char Alexander, Deuli Subidkhali, and Itabaria have the highest shares of low-resilient households (83%, 82%, 82%, respectively). All three unions experienced major destruction and subsequent population loss after cyclones Sidr and Aila struck these areas hard, destroying housing, sanitation, and access to safe drinking water [14]. Aila left considerable farmland in Deuli Subikdhali and Itabaria flooded with saltwater, which destroyed crops and salinized the soil for many years [5]. There still remains significant farmland that has been abandoned since it cannot support crops. Char Alexander has suffered chronic riverbank erosion including cyclone damage, which has swept away acres of farmland, destroyed polders and roads protecting farming communities, and threatens to engulf the only hospital in the Upazila (authors interview 2016). The island communities of Char Ishwar and Tamaruddin are remote from markets and communications, are off the electric grid and rely on diesel generators for power [20]. The agricultural people rely on cultivating peanuts, pulses, and mustard seeds, which have provided little income in recent years. Severe river erosion in Char Ishwar has in the past decade displaced over 10,000 people to Tamaruddin and other areas (author’s interviews 2016).
By contrast, Amadi, Bagali, and Jhonjhonia/Gabbunia have a relatively higher level of high resilience households to cyclones with 68, 50, and 48% of households respectively. All three unions are in the shrimp growing region and are proximate to Khulna, the 3rd largest city in Bangladesh which has a metro area population of just under 1 million. These inland rural communities have ecological, economic, and social service advantages. Being inland blunts the force of the storms. They also have little riverbank erosion and only moderate levels of soil salinity. Farmers are more likely to use high-yield varieties of rice (T. Aman-Transplanted Aman; T. Aus-Transplanted Aus) and mixed-crop cultivation, which boosts farm incomes and economic security [77]. Proximity to Khulna also means that NGOs are more likely to have permanent offices with field staff, to make rural visits, provide disaster training, and better agricultural extension [55]. Proximity also provides market access and better farm income.
Interestingly, the overall level of cyclone resilience is relatively high in Lata Chapli, when compared to that in other shoreline areas, such as Char Alexander, Itabaria, and Deuli Subidhkhali. Despite its high vulnerability to cyclones and storm surges, these people have developed greater household resilience than the other highly exposed shoreline and island villages. Why? We can only speculate here but it would seem that Lata Chapli provides economic and other advantages. It has access to mangrove forests where residents can collect wood, housing straw, honey, and other food [34]. They also have access to deep water fishing in the Bay of Bengal and tourist attractions, like Kuakata Beach, which draws visitors from all over the country and creates additional employment opportunities (e.g., renting boats, biking, consumer spending for food and lodging, etc.) for the rural residents.
Figure 3 summarizes these comparisons by showing bar charts of the shares of high and low resilient households in these nine communities placed next to their locations on a map of the coastal area. Overall, these differences suggest that the more modernized areas (inland, Lata Chapli) have greater cyclone/storm surge resilience than the more remote shoreline and island communities. Further analysis is needed to sort out the importance of these different factors, especially ecological and economic, in explaining these community differences.
6. Conclusions
In this paper, we have aimed to show that resilience to disasters caused by cyclones and storm surges is best represented by a multi-dimensional scale that combines measures of household infrastructure, economic capital, self-organization and learning, and social safety nets. These four major sets of resources interact with the ecological vulnerabilities of specific local communities to shape the resilience and livelihoods of people that live in rural coastal areas of Bangladesh. Most of our indicator items came from frameworks that have focused on sustainable livelihoods and related ideas about how coastal households and local communities respond positively to cyclones and other disasters. Based on the measures and variables derived from a comprehensive household survey, we were able to construct a composite index that identified the cyclone resilience of households that could be used in an aggregated form to compare the resilience of nine coastal communities representing the inland, island, and immediate coastline ecologies.
These measures provide benchmarks which can be used to identify deficits that need to be addressed at the household level as well as at the community level. To cope effectively, proactively adapt, and invest in transformational behavior requires that these households have better physical, economic, self-organization capacities, and social safety nets. These same issues show up at the community level. The shoreland and island communities have major deficits on all four of these indicators that seem to be mutually reinforcing and making for lower cyclone resilience. In contrast, communities with a larger share of employment opportunities in non-traditional economic sectors, such as tourism or shrimp farming, tend to have a larger share of relatively resilient households. This may be explained by better overall infrastructure, a wider range of income-generating activities, and a generally greater openness to change.
Improving physical infrastructures such as housing structures, sanitation, drinking water access, and access to electricity would improve the ability of less resilient households to weather storms and recover afterward. At the same time, they face economic deficits in terms of secure income, the ability to produce their own food, and their access to non-farm sources of income. They are also less likely to have household members migrating for wages, to use machinery or mixed crop methods [12]. Due in part to their geographic remoteness, they are less likely to have access to health care or cyclone shelters. While some in the community benefit from access to public authorities and help from friends, these benefits are unlikely to counterbalance these other disadvantages. Policymakers and NGOs can make use of these index results to guide programs and investments to improve the cyclone and storm surge resilience of the coastal peoples.
Because our focus has been on households, our resilience analysis has not emphasized capacities and processes that address the power-linked “root causes” of disasters or the mobilization of groups for transformational change. These aspects of disaster resilience are more relevant for the community, regional, and/or societal level analyses where groups, institutions, and larger societal developments shape the context within which these households cope, adapt, and absorb change. The type of disaster resilience assessment that we have provided needs to be complemented by analyses of these larger societal contexts where transformational changes might be devised and initiated. At the same time, households are a primary unit in disaster response and as such need to be considered in any attempt to benchmark, monitor, and assess disaster resilience.
Discussions of disaster resilience typically focus on one aspect of resilience: inputs, processes, outcomes, or outputs, each of which constitutes a legitimate object of inquiry [30]. Our primary focus has been on the resource inputs or capacities of households. Obviously, this is a limited focus that needs to be complemented by work on other aspects. An important direct extension of this work would be to see whether these capacities contribute to resilient outcomes or outputs for these households when faced with a cyclone disaster. Will they make good use of household infrastructure, livelihood alternatives, better organization, and available social networks? Only longitudinal assessment using a standardized framework of indicators, scorecards, or other assessment tools can provide a compelling answer.
A second direct extension would be to analyze the sources of the community differences in cyclone resilience, assessing how important ecological vulnerabilities are relative to the socio-economic capacities that we have emphasized. As our brief comparison showed, vulnerability and resilience are not identical. Lata Chapli displayed greater cyclone resilience than similarly exposed villages, suggesting the importance of untangling ecological and socio-economic factors in resilience.
How generalizable is our framework for disaster resilience assessment? Many of the measurement items that we have used are relevant for responding to cyclones and storm surges among rural households in coastal Bangladesh but would not be that relevant in urban slums or in responding to earthquakes or flash flooding. Disaster resilience always needs to be assessed relative to specific hazards, exposures, and vulnerabilities of specific places and peoples. Only through cumulative assessment across a variety of disasters can we assess how generalizable any particular framework or set of items is. In an analysis of five marginal livelihood groups in coastal Bangladesh, Mutahara et al. (2016) found that the resources identified by these groups as critical to their past survival of cyclones varied widely [78]. Although there were common features, such as having livelihood alternatives, some of the coping and adaptive methods that have proven their value are group and context-specific. Discussions of resilience need to be aware of these limitations and take them into account in framing any specific program of assessment, remedy, and action.
7. Note
“Factor scores reveal the composite (latent) scores for each subject on each factor” [75,76]. Factor scores are analogous to the Ŷ (Yhat) scores in the regression equation and are calculated by applying the factor pattern matrix to the measured variables. Factor scores are most commonly used for further statistical analyses in place of measured variables, especially when numerous outcome scores are available.
Author Contributions
Conceptualization, A.A.-M., B.B. and J.C.J.; Methodology, A.A.-M., J.C.J. and A.B.; Formal Analysis, A.A.-M. and J.C.J.; Investigation, A.A.-M., A.B. and B.B.; Resources, B.B. and J.C.J.; Writing—Original Draft Preparation, A.A.-M., J.C.J. and A.B.; Writing—Review & Editing, J.C.J., B.B., A.B.; Visualization, A.A.-M., J.C.J.; Supervision, B.B.; Project Administration, B.B., A.B. and J.C.J.; Funding Acquisition, B.B. and J.C.J. All authors have read and agreed to the published version of the manuscript.
Funding
The findings in this paper are based on research that was conducted within the Belmont Forum BanD-AiD project “Collaborative Research—Bangladesh Delta: Assessment of the Causes of Sea-level Rise Hazards and Integrated Development of Predictive Modeling Towards Mitigation and Adaptation”. Research was funded by the German Research Foundation (DFG #BR1678/13-1) and the National Science Foundation (NSF #1342644). Abdullah Al-Maruf received a three-year scholarship form the German Research Foundation (DAAD) to carry out his research at the University of Cologne.
Institutional Review Board Statement
The study was conducted through the Institute of Geography at the University of Cologne, Germany, which has no dedicated Institutional Review Board. However, data was generated according to the German Research Foundation’s “Principles for the Handling of Research Data” (https://www.dfg.de/en/research_funding/proposal_review_decision/applicants/research_data/ accessed on 2 May 2021) and its “Guidelines for Safeguarding Good Research Practice” (https://www.dfg.de/en/research_funding/principles_dfg_funding/good_scientific_practice/index.html accessed on 2 May 2021), to which all funded projects must adhere.
Informed Consent Statement
Informed consent was obtained from all subjects involved in the study.
Data Availability Statement
Supporting data of the findings of this study are available from the first author/corresponding author, upon reasonable request. Certain data cannot be made publicly available due to restrictions e.g., their containing information that could compromise the privacy of research respondents.
Conflicts of Interest
The authors declare no conflict of interest.
References
- UNISDR. Hyogo Framework for Action 2005–2015: Building the Resilience of Nations and Communities to Disasters; United Nations Office for Disaster Risk Reduction: Geneva, Switzerland, 2005. [Google Scholar]
- UNISDR. Sendai Framework for Disaster Risk Reduction 2015–2030; United Nations Office for Disaster Risk Reduction: Geneva, Switzerland, 2015. [Google Scholar]
- Adger, W.N.; Brown, K.; Waters, J. Resilience. In Oxford Handbook of Climate Change and Society; Dryzek, J.S., Norgaard, R.B., Schlosberg, D., Eds.; Oxford Handbooks; Oxford University Press: Oxford, UK; New York, NY, USA, 2011; pp. 696–710. ISBN 978-0-19-956660-0. [Google Scholar]
- Parvin, G.A.; Takahashi, F.; Shaw, R. Coastal Hazards and Community-Coping Methods in Bangladesh. J. Coast. Conserv. 2008, 12, 181–193. [Google Scholar] [CrossRef]
- Rahman, M.A.T.M.; Islam, S.; Rahman, S.H. Coping with Flood and Riverbank Erosion Caused by Climate Change Using Livelihood Resources: A Case Study of Bangladesh. Clim. Dev. 2015, 7, 185–191. [Google Scholar] [CrossRef]
- Rayhan, I. Assessing Household Vulnerability and Coping Strategies to Floods: A Comparative Study of Flooded and Non-Flooded Areas in Bangladesh, 2005; Cuvillier Verlag: Göttingen, Germany, 2008; ISBN 978-3-7369-2650-9. [Google Scholar]
- Sultana, N.; Rayhan, M.I. Coping Strategies with Floods in Bangladesh: An Empirical Study. Nat. Hazards 2012, 64, 1209–1218. [Google Scholar] [CrossRef]
- Choudhury, M.-U.-I.; Haque, C.E. “We Are More Scared of the Power Elites than the Floods”: Adaptive Capacity and Resilience of Wetland Community to Flash Flood Disasters in Bangladesh. Int. J. Disaster Risk Reduct. 2016, 145–158. [Google Scholar] [CrossRef]
- Younus, M.A.F.; Harvey, N. Community-Based Flood Vulnerability and Adaptation Assessment: A Case Study from Bangladesh. J. Environ. Assmt. Policy Manag. 2013, 15, 1350010. [Google Scholar] [CrossRef]
- Manyena, B.; Machingura, F.; O’Keefe, P. Disaster Resilience Integrated Framework for Transformation (DRIFT): A New Approach to Theorising and Operationalising Resilience. World Dev. 2019, 123, 1. [Google Scholar] [CrossRef]
- Ayeb-Karlsson, S.; van der Geest, K.; Ahmed, I.; Huq, S.; Warner, K. A People-centred Perspective on Climate Change, Environmental Stress, and Livelihood Resilience in Bangladesh. Sustain. Sci. 2016, 11, 679–694. [Google Scholar] [CrossRef] [Green Version]
- Bernzen, A.; Jenkins, J.C.; Braun, B. Climate Change-Induced Migration in Coastal Bangladesh? A Critical Assessment of Migration Drivers in Rural Households under Economic and Environmental Stress. Geosciences 2019, 9, 51. [Google Scholar] [CrossRef] [Green Version]
- Sultana, Z.; Mallick, B. Adaptation Strategies after Cyclone in Southwest Coastal Bangladesh—Pro Poor Policy Choices. AJRD 2015, 3, 24–33. [Google Scholar] [CrossRef] [Green Version]
- BBS—Bangladesh Bureau of Statistics; Ministry of Planning, Government of the People’s Republic of Bangladesh Household Income and Expenditure Survey (HIES). 2016. Available online: https://bbs.portal.gov.bd/sites/default/files/files/bbs.portal.gov.bd/page/b343a8b4_956b_45ca_872f_4cf9b2f1a6e0/Comparative%20Matrix%20HIES_fnl.pdf/ (accessed on 13 July 2019).
- Ahmed, B.; Kelman, I.; Fehr, H.; Saha, M. Community Resilience to Cyclone Disasters in Coastal Bangladesh. Sustainability 2016, 8, 805. [Google Scholar] [CrossRef] [Green Version]
- CEGIS. Prediction of Riverbank Erosion 2020 (Jamuna, Ganges and Padma Rivers); CEGIS: Dhaka, Bangladesh, 2018. [Google Scholar]
- Bangladesh Water Development Board. Annual Flood Report 2010–2019; Flood Forecast Warning Centre: Dhaka, Bangladesh, 2020.
- CRED-UNISR (Centre for the Epidemiology of Disasters). The Human Cost of Weather-Related Disasters 1995–2015. Available online: https://www.unisdr.org/2015/docs/climatechange/COP21_WeatherDisastersReport_2015_FINAL.pdf (accessed on 4 November 2016).
- Busby, J.; Smith, T.G.; Krishnan, N.; Wight, C.; Vallejo-Gutierrez, S. In Harm’s Way: Climate Security Vulnerability in Asia. World Dev. 2018, 112, 88–118. [Google Scholar] [CrossRef]
- Islam, R.; Walkerden, G. How Do Links between Households and NGOs Promote Disaster Resilience and Recovery? A Case Study of Linking Social Networks on the Bangladeshi Coast. Nat. Hazards 2015, 78, 1707–1727. [Google Scholar] [CrossRef]
- Al-Maruf, A. Enhancing Disaster Resilience through Human Capital: Prospects for Adaptation to Cyclones in Coastal Bangladesh. Ph.D. Thesis, Universität zu Köln, Köln, Germany, 2020. [Google Scholar]
- Department for International Development. Defining Disaster Resilience: A DFID Approach Paper; Department for International Development: London, UK, 1999.
- Mayunga, J.S. Measuring the Measure: A Multi-Dimensional Scale Model to Measure Community Disaster Resilience in the U.S. Gulf Coast. Ph.D. Thesis, Texas A&M University, College Station, TX, USA, 2009. [Google Scholar]
- Cutter, S.L.; Barnes, L.; Berry, M.; Burton, C.; Evans, E.; Tate, E.; Webb, J. A Place-Based Model for Understanding Community Resilience to Natural Disasters. Glob. Environ. Chang. 2008, 18, 598–606. [Google Scholar] [CrossRef]
- Alinovi, L.; Mane, E.; Romano, D. Measuring Household Resilience to Food Insecurity: Application to Palestinian Households. In Agricultural Survey Methods; Benedetti, R., Bee, M., Espa, G., Piersimoni, F., Eds.; John Wiley & Sons, Ltd.: Chichester, UK, 2010; pp. 341–368. ISBN 978-0-470-66548-0. [Google Scholar]
- Frankenberger, T.; Nelson, S. Background Paper for the Expert Consultation on Resilience Measurement for Food Security; FAO: Roma, Italy, 2013. [Google Scholar]
- Rose, A. Economic Resilience to Natural and Man-Made Disasters: Multidisciplinary Origins and Contextual Dimensions. Null 2007, 7, 383–398. [Google Scholar] [CrossRef]
- Ahsan, M.N.; Warner, J. The Socioeconomic Vulnerability Index: A Pragmatic Approach for Assessing Climate Change Led Risks–A Case Study in the South-Western Coastal Bangladesh. Int. J. Disaster Risk Reduct. 2014, 8, 32–49. [Google Scholar] [CrossRef]
- Hassan, R.; Islam, M.; Saifullah, A.; Islam, M. Effectiveness of Social Safety Net Programs on Community Resilience to Hazard Vulnerable Population in Bangladesh. J. Environ. Sci. Nat. Resour. 2015, 6, 123–129. [Google Scholar] [CrossRef] [Green Version]
- Schipper, E.L.F.; Langston, L. A Comparative Overview of Resilience Measurement Frameworks; Working Paper 422; Overseas Development Institute: London, UK, 2015. [Google Scholar]
- Beccari, B. A Comparative Analysis of Disaster Risk, Vulnerability and Resilience Composite Indicators. PLoS Curr. 2016. [Google Scholar] [CrossRef] [PubMed]
- Cutter, S.L. The Landscape of Disaster Resilience Indicators in the USA. Nat. Hazards 2016, 80, 741–758. [Google Scholar] [CrossRef]
- Cutter, S.L.; Ash, K.D.; Emrich, C.T. The Geographies of Community Disaster Resilience. Glob. Environ. Chang. 2014, 29, 65–77. [Google Scholar] [CrossRef]
- Akter, S.; Mallick, B. The Poverty–Vulnerability–Resilience Nexus: Evidence from Bangladesh. Ecol. Econ. 2013, 96, 114–124. [Google Scholar] [CrossRef]
- Cutter, S.L.; Boruff, B.J.; Shirley, W.L. Social Vulnerability to Environmental Hazards: Social Vulnerability to Environmental Hazards. Soc. Sci. Q. 2003, 84, 242–261. [Google Scholar] [CrossRef]
- Sutter, D.; Simmons, K.M. Tornado Fatalities and Mobile Homes in the United States. Nat. Hazards 2010, 53, 125–137. [Google Scholar] [CrossRef]
- Tierney, K.; Bruneau, M. Conceptualizing and Measuring Resilience: A Key to Disaster Loss Reduction. TR NEWS 2007, 250, 14–17. [Google Scholar]
- Twigg, J. Characteristics of a Disaster-Resilient Community: A Guidance Note; University College London Press: London, UK, 2007. [Google Scholar]
- Campell, B.; Mitchell, S.; Blackett, M. Responding to Climate Change in Viet Nam: Opportunities for Improving Gender Equality; A Policy Discussion Paper; UN Viet Nam & Oxfam: Ha Noi, Vietnam, 2009. [Google Scholar]
- Enarson, E.P. Women Confronting Natural Disaster: From Vulnerability to Resilience; Lynne Rienner Publishers: Boulder, CO, USA, 2012; ISBN 978-1-58826-831-0. [Google Scholar]
- Norris, F.H.; Stevens, S.P.; Pfefferbaum, B.; Wyche, K.F.; Pfefferbaum, R.L. Community Resilience as a Metaphor, Theory, Set of Capacities, and Strategy for Disaster Readiness. Am. J. Community Psychol. 2008, 41, 127–150. [Google Scholar] [CrossRef] [PubMed]
- Ranjan, E.S.; Abenayake, C.C. A Study on Community’s Perception on Disaster Resilience Concept. Procedia Econ. Financ. 2014, 18, 88–94. [Google Scholar] [CrossRef] [Green Version]
- Sherrieb, K.; Norris, F.H.; Galea, S. Measuring Capacities for Community Resilience. Soc. Indic. Res. 2010, 99, 227–247. [Google Scholar] [CrossRef]
- Thulstrup, A.W. Livelihood Resilience and Adaptive Capacity: Tracing Changes in Household Access to Capital in Central Vietnam. World Dev. 2015, 74, 352–362. [Google Scholar] [CrossRef]
- United Nations Development Programme-UNDP. Bangladesh: Disaster Risk Reduction as Development; UNDP: New York, NY, USA, 2014. [Google Scholar]
- FAO. Resilient Livelihoods-Disaster Risk Reduction for Food and Nutrition Security Framework Programme; FAO: Rome, Italy, 2013. [Google Scholar]
- Rose, A.; Krausmann, E. An Economic Framework for the Development of a Resilience Index for Business Recovery. Int. J. Disaster Risk Reduct. 2013, 5, 73–83. [Google Scholar] [CrossRef]
- UNFCCC. Non-Economic Losses in the Context of the Work Programme on Loss and Damage; UNFCCC: Bonn, Germany, 2013. [Google Scholar]
- Asadzadeh, A.; Kötter, T.; Zebardast, E. An Augmented Approach for Measurement of Disaster Resilience Using Connective Factor Analysis and Analytic Network Process (F’ANP) Model. Int. J. Disaster Risk Reduct. 2015, P4, 504–518. [Google Scholar] [CrossRef]
- Villamor, G.B.; van Noordwijk, M.; Djanibekov, U.; Chiong-Javier, M.E.; Catacutan, D. Gender Differences in Land-Use Decisions: Shaping Multifunctional Landscapes? Curr. Opin. Environ. Sustain. 2014, 6, 128–133. [Google Scholar] [CrossRef] [Green Version]
- Nibanupudi, H.K.; Shaw, R. Mountain Hazards and Disaster Risk Reduction; Disaster Risk Reduction; Springer: Tokyo, Japan, 2015; ISBN 978-4-431-55241-3. [Google Scholar]
- Boarini, R.; Kolev, A.; McGregor, A. Measuring Well-Being and Progress in Countries at Different Stages of Development: Towards a More Universal Conceptual Framework; OECD Publishing: Paris, France, 2014. [Google Scholar]
- Béné, C.; Frankenberger, T.; Nelson, S. Design, Monitoring and Evaluation of Resilience Interventions Conceptual and Empirical Considerations; IDS: Brighton, UK, 2015; ISBN 978-1-78118-248-2. [Google Scholar]
- Paterson, J.; Berry, P.; Ebi, K.; Varangu, L. Health Care Facilities Resilient to Climate Change Impacts. IJERPH 2014, 11, 13097–13116. [Google Scholar] [CrossRef] [PubMed] [Green Version]
- Paul, S.K. Post-Cyclone Livelihood Status and Strategies in Coastal Bangladesh. Rajshahi Univ. J. Life Earth Agric. Sci. 2015, 41, 1–20. [Google Scholar] [CrossRef] [Green Version]
- Paul, S.K.; Routray, J.K. Household Response to Cyclone and Induced Surge in Coastal Bangladesh: Coping Strategies and Explanatory Variables. Nat. Hazards 2011, 57, 477–499. [Google Scholar] [CrossRef]
- Ahsan, M.N.; Ahmed, M.F.; Bappy, M.H.; Hasan, M.N.; Nahar, N. Climate Change Induced Vulnerability on Living Standard—A Study on South-Western Coastal Region of Bangladesh. J. Innov. Dev. Strategy 2011, 5, 6. [Google Scholar]
- Tarabusi, E.; Guarini, G. An Unbalance Adjustment Method for Development Indicators. Soc. Indic. Res. 2013, 112, 19–45. [Google Scholar] [CrossRef]
- Kotzee, I.; Reyers, B. Piloting a Social-Ecological Index for Measuring Flood Resilience: A Composite Index Approach. Ecol. Entomol. 2016, 60, 45–53. [Google Scholar] [CrossRef]
- Nardo, M.; Saisana, M.; Saltelli, A.; Tarantola, S.; Hoffmann, A.; Giovannini, E. Handbook on Constructing Composite Indicators: Methodology and User Guide; OECD: Paris, France, 2005. [Google Scholar]
- Bollen, K.A. Structural Equations with Latent Variables; Wiley Series in Probability and Mathematical Statistics; Wiley: New York, NY, USA, 1989; ISBN 978-0-471-01171-2. [Google Scholar]
- Skrondal, A.; Rabe-Hesketh, S. Generalized Latent Variable Modeling: Multilevel, Longitudinal, and Structural Equation Models; Chapman & Hall/CRC Interdisciplinary Statistics Series; Chapman & Hall/CRC: Boca Raton, FL, USA, 2004; ISBN 978-1-58488-000-4. [Google Scholar]
- Saisana, M.; Tarantola, S. State-of-the-Art Report on Current Methodologies and Practices for Composite Indicator Development; Joint Research Center: Ispra, Italy, 2002. [Google Scholar]
- Vyas, S.; Kumaranayake, L. Constructing Socio-Economic Status Indices: How to Use Principal Components Analysis. Health Policy Plan. 2006, 21, 459–468. [Google Scholar] [CrossRef] [Green Version]
- Hogarty, K.Y.; Hines, C.V.; Kromrey, J.D.; Ferron, J.M.; Mumford, K.R. The Quality of Factor Solutions in Exploratory Factor Analysis: The Influence of Sample Size, Communality, and Overdetermination. Educ. Psychol. Meas. 2005, 65, 202–226. [Google Scholar] [CrossRef]
- Kazmierczak, A.; Cavan, G. Surface Water Flooding Risk to Urban Communities: Analysis of Vulnerability, Hazard and Exposure. Landsc. Urban Plan. 2011, 103, 185–197. [Google Scholar] [CrossRef]
- Williams, B.A.; Onsman, A.; Brown, G.T. Exploratory Factor Analysis: A Five-Step Guide for Novices. Australas. J. Paramed. 2010, 8, 1–13. [Google Scholar] [CrossRef] [Green Version]
- Al-Mughamis, N.S.; Alayoub, A.A.; Meraj, H.; Waqas, A. Development and Validation of Attitude Toward Nutrition Counselling Questionnaire for Use among Kuwaiti Healthcare Professionals. BMC Res. Notes 2020, 13, 62. [Google Scholar] [CrossRef]
- Pittayachawan, S. Introduction to Quantitative Methods. 2016. Available online: https://www.academia.edu/30809332/Introduction_to_quantitative_methods (accessed on 9 August 2018).
- Vale, L.J. The Politics of Resilient Cities: Whose Resilience and Whose City? Build. Res. Inf. 2014, 42, 191–201. [Google Scholar] [CrossRef]
- Pramanik, S.; Jalil, B.; Maleck, A. Non-Farm Self-Employment and Household Income. PSTU J. 2014, 2, 23–31. [Google Scholar]
- Barquet, K.; Thomalla, F.; Boyland, M.; Osbeck, M. Using Learning to Harness Social and Organizational Culture for Disaster Risk Reduction; Stockholm Environment Institute: Stockholm, Sweden, 2016; p. 24. [Google Scholar]
- Mallick, B. Necessity of Acceptance? Searching for a Sustainable Community-Based Disaster Mitigation Approac—The Example ofa Coastal City in Bangladesh. Solut. Coast. Disasters 2011, 753–766. [Google Scholar] [CrossRef]
- Al-Maruf, A. Climate Adaptation for a Sustainable Economy: Lessons from Bangladesh, an Emerging Tiger of Asia; Hossain, M., Ahmad, Q.K., Islam, M.M., Eds.; Asian Political, Economic and Social Issues; Nova Science Publishers: New York, NY, USA, 2020; ISBN 978-1-5361-6927-0. [Google Scholar]
- Wells, R.D. Factor scores and factor structure. In Advanced in Social Science Methodology; Thompson, B., Ed.; JAI: Greenwich, UK, 1999; Volume 5, pp. 123–138. ISBN 978-0-7623-0262-8. [Google Scholar]
- Thomson, G. The Factorial Analysis of Human Ability. Br. J. Educ. Psychol. 1939, 9, 188–195. [Google Scholar] [CrossRef]
- Department of Agriculture Extension (DAE). Annual Report; Government of the People’s Republic of Bangladesh, Ministry of Agriculture: Dhaka, Bangladesh, 2011.
- Mutahara, M.; Haque, A.; Khan, M.S.A.; Warner, J.F.; Wester, F. Development of a Sustainable Livelihood Security Model for Storm-Surge Hazard in the Coastal Areas of Bangladesh. Stoch. Environ. Res. Risk Assess. 2016, 30, 1301–1315. [Google Scholar] [CrossRef] [Green Version]
Figure 1.
Study sites, risk areas and cyclone paths in coastal Bangladesh. Source: Own design.

Figure 2.
Path diagram of the household disaster resilience composite index Source: Adapted by Abdullah Al-Maruf from Alinovi et al. (2010) [25].
Figure 2.
Path diagram of the household disaster resilience composite index Source: Adapted by Abdullah Al-Maruf from Alinovi et al. (2010) [25].

Figure 3.
Level of household disaster resilience in study villages. Source: Own design Abdullah Al-Maruf; cartography Ulrike Schwedler.
Figure 3.
Level of household disaster resilience in study villages. Source: Own design Abdullah Al-Maruf; cartography Ulrike Schwedler.


Table 1.
Variables selected to measure the four dimensions of household cyclone resilience.
| Component | Variable & Scale | Justification |
|---|---|---|
| Household infrastructure (HI) | 1. Housing type (1–4) | Akter and Mallick, 2013 [34]; Cutter et al., 2003 [35]; Sutter and Simmons, 2010 [36]; Tierney and Bruneau, 2007 [37]; Twigg, 2007 [38] |
| 2. Presence of sanitation (1–4) | Akter and Mallick, 2013 [34]; Campell et al., 2009 [39] | |
| 3. Access to clean water (0–1) | Akter and Mallick, 2013 [34]; Campell et al., 2009 [39] | |
| 4. Access electricity (0–1) | Cutter et al., 2003 [35] | |
| Household economic capital (HEC) | 5. Household income (1–4) | Akter and Mallick, 2013 [34]; Cutter et al., 2003 [35]; Enarson, 2012 [40]; Norris et al., 2008 [41]; Ranjan and Abenayake, 2014 [42]; Sherrieb et al., 2010 [43]; Thulstrup, 2015 [44]; UNDP, 2014 [45] |
| 6. Ability to sell produced food (0–1) | FAO, 2013 [46] | |
| 7. Less dependence on purchased food (1–5) | Rose and Krausman, 2013 [47] | |
| 8. Non-farm self-employment (0–1) | Rose and Krausman, 2013 [47]; Sherrieb et al., 2010 [43] | |
| Household self-organization and learning (HSoL) | 9. Temporary migration of household members for money (0–1) | Islam and Walkerden, 2015 [20]; UNISDR, 2015 [2] |
| 10. Access to machinery (0–1) | UNFCCC, 2013 [48] | |
| 11. Land-use decisions by household head (0–1) | Asadzadeha et al., 2015 [49] | |
| 12. Land-use decisions by husband and wife jointly (0–1) | Villamor et al., 2014 [50]; UNISDR, 2015 [2] | |
| 13. Application of mixed crop (0–1) cultivation methods | Nibanupudi and Shaw, 2015 [51] | |
| Social safety nets (SSN) | 14. Business partnership by mobile phone (0–1) | Boarini et al., 2014 [52] |
| 15. Social discussion disputes (0–1) | Bene et al., 2015 [53] | |
| 16. Access healthcare (0–1) | Paterson et al., 2014 [54] | |
| 17. Access public authorities (0–1) | Paul, 2015 [55] | |
| 18. Access cyclone shelter (0–1) | Paul and Routray, 2011 [56] | |
| 19. Help from friends (0–1) | Ahsan et al., 2011 [57] |
Table 2.
Eigenvalues and variances explained with extracted factors of household infrastructure (HI).
Table 2.
Eigenvalues and variances explained with extracted factors of household infrastructure (HI).
| Component | Initial Eigenvalues | Extraction Sums of Squared Loadings | Rotation Sums of Squared Loadings | ||||||
|---|---|---|---|---|---|---|---|---|---|
| Total | Variance % | Cumulative % | Total | Variance % | Cumulative % | Total | Variance % | Cumulative % | |
| 1 | 1.369 | 34.231 | 34.231 | 1.369 | 34.231 | 34.231 | 1.275 | 31.871 | 31.871 |
| 2 | 1.167 | 29.168 | 63.400 | 1.167 | 29.168 | 63.400 | 1.261 | 31.529 | 63.400 |
| 3 | 0.839 | 20.964 | 84.363 | ||||||
| 4 | 0.625 | 15.637 | 100.000 | ||||||
KMO Measure of Sampling Adequacy: 0.67; Bartlett’s Test: X2 = 1036, p < 0.001.
Table 3.
Factor loadings on HI.
| Variable | Component | |
|---|---|---|
| Factor 1 | Factor 2 | |
| Housing type | 0.719 | 0.339 |
| Sanitation | 0.547 | 0.468 |
| Access to electricity | 0.544 | 0.609 |
| Sources of drinking water | 0.506 | 0.679 |
Table 4.
Eigenvalues and variance explained with extracted factors of household economic capital (HEC).
Table 4.
Eigenvalues and variance explained with extracted factors of household economic capital (HEC).
| Component | Initial Eigenvalues | Extraction Sums of Squared Loadings | Rotation Sums of Squared Loadings | ||||||
|---|---|---|---|---|---|---|---|---|---|
| Total | Variance % | Cumulative % | Total | Variance % | Cumulative % | Total | Variance % | Cumulative % | |
| 1 | 1.497 | 37.423 | 37.423 | 1.497 | 37.423 | 37.423 | 1.469 | 36.732 | 36.732 |
| 2 | 1.023 | 25.583 | 63.006 | 1.023 | 25.583 | 63.006 | 1.051 | 26.273 | 63.006 |
| 3 | 0.848 | 21.205 | 84.211 | ||||||
| 4 | 0.632 | 15.789 | 100.000 | ||||||
KMO Measure of Sampling Adequacy: 0.61; Bartlett’s Test: X2 = 1200, p < 0.001.
Table 5.
Factor loadings on HEC.
| Variable | Component | |
|---|---|---|
| Factor 1 | Factor 2 | |
| Household income per month | 0.561 | 0.316 |
| Ability to sell excess produced food | 0.777 | 0.156 |
| Less dependency on purchased food | 0.748 | −0.241 |
| Non-farm self-employment | 0.136 | 0.917 |
Table 6.
Eigenvalues and variance explained with extracted factors of household self-organization and learning (HSoL).
Table 6.
Eigenvalues and variance explained with extracted factors of household self-organization and learning (HSoL).
| Component | Initial Eigenvalues | Extraction Sums of Squared Loadings | Rotation Sums of Squared Loadings | ||||||
|---|---|---|---|---|---|---|---|---|---|
| Total | Variance % | Cumulative % | Total | Variance % | Cumulative % | Total | Variance % | Cumulative % | |
| 1 | 1.565 | 31.290 | 31.290 | 1.565 | 31.290 | 31.290 | 1.532 | 30.632 | 30.632 |
| 2 | 1.165 | 23.295 | 54.585 | 1.165 | 23.295 | 54.585 | 1.198 | 23.953 | 54.585 |
| 3 | 0.978 | 19.554 | 74.139 | ||||||
| 4 | 0.824 | 16.486 | 90.625 | ||||||
| 5 | 0.469 | 9.375 | 100.000 | ||||||
KMO Measure of Sampling Adequacy: 0.67; Bartlett’s Test: X2 = 1631, p < 0.001.
Table 7.
Factor loadings on HSoL.
| Variable | Component | |
|---|---|---|
| Factor 1 | Factor 2 | |
| Temporary migration | 0.139 | 0.744 |
| Using machines | 0.297 | 0.655 |
| Land-use decisions by the household head | 0.856 | −0.155 |
| Land-use decisions by husband and wife jointly | 0.839 | 0.250 |
| Application of mixed crops | 0.143 | 0.308 |
Table 8.
Eigenvalues and variance explained with extracted factors of social safety nets (SSN).
| Component | Initial Eigenvalues | Extraction Sums of Squared Loadings | Rotation Sums of Squared Loadings | ||||||
|---|---|---|---|---|---|---|---|---|---|
| Total | Variance % | Cumulative % | Total | Variance % | Cumulative % | Total | Variance % | Cumulative % | |
| 1 | 1.471 | 29.414 | 29.414 | 1.471 | 29.414 | 29.414 | 1.468 | 29.362 | 29.362 |
| 2 | 1.009 | 20.184 | 49.598 | 1.009 | 20.184 | 49.598 | 1.012 | 20.237 | 49.598 |
| 3 | 1.000 | 19.998 | 69.597 | ||||||
| 4 | 0.949 | 18.983 | 88.579 | ||||||
| 5 | 0.571 | 11.421 | 100.000 | ||||||
KMO Measure of Sampling Adequacy: 0.68; Bartlett’s Test: X2 = 1246, p < 0.001.
Table 9.
Factor loadings on SSN.
| Variable | Component | |
|---|---|---|
| Factor 1 | Factor 2 | |
| Business partnership by mobile | 0.088 | 0.986 |
| Discussions about access to fresh water | 0.312 | −0.083 |
| Access to health facilities | 0.337 | 0.054 |
| Access to public authorities | 0.807 | 0.153 |
| Access to cyclone shelter | 0.775 | 0.057 |
| Help from friends | 0.665 | 0.240 |
Table 10.
Eigenvalues and variance explained with extracted factors (shaded) of HI, HEC, HsoL, and SSN on the overall cyclone resilience index.
Table 10.
Eigenvalues and variance explained with extracted factors (shaded) of HI, HEC, HsoL, and SSN on the overall cyclone resilience index.
| Component | Initial Eigenvalues | Extraction Sums of Squared Loadings | Rotation Sums of Squared Loadings | ||||||
|---|---|---|---|---|---|---|---|---|---|
| Total | Variance % | Cumulative % | Total | Variance % | Cumulative % | Total | Variance % | Cumulative % | |
| 1 | 1.688 | 21.094 | 21.094 | 1.688 | 21.094 | 21.094 | 1.465 | 21.071 | 21.071 |
| 2 | 1.238 | 15.477 | 36.571 | 1.238 | 15.477 | 36.571 | 1.084 | 15.355 | 36.426 |
| 3 | 1.111 | 13.765 | 50.336 | 1.111 | 13.765 | 50.336 | 1.213 | 13.563 | 49.989 |
| 4 | 1.013 | 12.314 | 62.650 | 1.013 | 12.314 | 64.984 | 1.110 | 12.171 | 64.984 |
| 5 | 1.001 | 11.400 | 74.050 | 1.001 | 11.400 | 76.237 | 1.255 | 11.253 | 76.237 |
| 6 | 0.804 | 10.049 | 84.099 | ||||||
| 7 | 0.690 | 8.626 | 92.726 | ||||||
| 8 | 0.582 | 7.274 | 100.000 | ||||||
KMO Measure of Sampling Adequacy: 0.69; Bartlett’s Test: X2 = 2208, p < 0.001.
Table 11.
Factor loadings of HI, HEC, HSoL, and SSN on the overall cyclone resilience index.
| Component | Factor 1 | Factor 2 | Factor 3 | Factor 4 | Factor 5 |
|---|---|---|---|---|---|
| HEfactor1 | 0.660 | 0.283 | 0.338 | 0.285 | 0.006 |
| HSLfactor1 | 0.611 | 0.333 | 0.114 | −0.342 | 0.366 |
| HIfactor1 | 0.559 | 0.444 | 0.138 | 0.062 | 0.243 |
| HSLfactor2 | 0.293 | 0.561 | 0.204 | 0.345 | 0.578 |
| SSNfactor1 | 0.160 | 0.526 | 0.654 | 0.243 | −0.042 |
| SSNfactor2 | 0.379 | 0.341 | −0.634 | 0.027 | 0.047 |
| HIfactor2 | 0.353 | 0.156 | 0.242 | 0.766 | 0.229 |
| HEfactor2 | 0.433 | 0.343 | 0.160 | 0.135 | 0.659 |
Table 12.
Level of cyclone resilience of households in the study sites at the union level (N = 1188).
Table 12.
Level of cyclone resilience of households in the study sites at the union level (N = 1188).
| Study Site | Number of Cases (n) and Percentage (%) | Level of Disaster Resilience | Total | |
|---|---|---|---|---|
| Low | High | |||
| Inland Unions: | ||||
| Jhonjonia, Gabbunia | N | 79 | 73 | 152 |
| % | 52 | 48 | 100.0 | |
| Amadi | N | 27 | 47 | 74 |
| % | 32 | 68 | 100.0 | |
| Bagali | N | 43 | 43 | 86 |
| % | 50 | 50 | 100 | |
| Shoreline Unions: | ||||
| Lata Chapli | N | 95 | 61 | 156 |
| % | 61 | 39 | 100.0 | |
| Itabaria | N | 111 | 24 | 135 |
| % | 82 | 18 | 100.0 | |
| Deuli Subdikhali | N | 127 | 28 | 155 |
| % | 82 | 18 | 100.0 | |
| Char Alexander | N | 123 | 25 | 148 |
| % | 83 | 17 | 100.0 | |
| Island Unions: | ||||
| Tamaruddin | N | 103 | 35 | 138 |
| % | 74 | 26 | 100.0 | |
| Char Ishwar | N | 109 | 35 | 144 |
| % | 76 | 24 | 100.0 | |
| Total | N | 817 | 371 | 1178 |
| % | 68 | 32 | 100.0 | |
p < 0.001; Chi-square = 636.49 (8).
Publisher’s Note: MDPI stays neutral with regard to jurisdictional claims in published maps and institutional affiliations. |
© 2021 by the authors. Licensee MDPI, Basel, Switzerland. This article is an open access article distributed under the terms and conditions of the Creative Commons Attribution (CC BY) license (https://creativecommons.org/licenses/by/4.0/).
Share and Cite
MDPI and ACS Style
Al-Maruf, A.; Jenkins, J.C.; Bernzen, A.; Braun, B. Measuring Household Resilience to Cyclone Disasters in Coastal Bangladesh. Climate 2021, 9, 97. https://0-doi-org.brum.beds.ac.uk/10.3390/cli9060097
AMA Style
Al-Maruf A, Jenkins JC, Bernzen A, Braun B. Measuring Household Resilience to Cyclone Disasters in Coastal Bangladesh. Climate. 2021; 9(6):97. https://0-doi-org.brum.beds.ac.uk/10.3390/cli9060097
Chicago/Turabian StyleAl-Maruf, Abdullah, J. Craig Jenkins, Amelie Bernzen, and Boris Braun. 2021. "Measuring Household Resilience to Cyclone Disasters in Coastal Bangladesh" Climate 9, no. 6: 97. https://0-doi-org.brum.beds.ac.uk/10.3390/cli9060097
Note that from the first issue of 2016, this journal uses article numbers instead of page numbers. See further details here.