
Hydroclimatic Variability in the Bilate Watershed, Ethiopia


1
Taiwan International Graduate Program (TIGP), Earth System Science Program, Academia Sinica, Taipei 115, Taiwan
2
Graduate Institute of Hydrological and Oceanic Sciences, National Central University, Taoyuan 320, Taiwan
3
Arba Minch Water Technology Institute, Arba Minch University, Arba Minch P.O. Box 21, Ethiopia
*
Author to whom correspondence should be addressed.
Climate 2021, 9(6), 98; https://0-doi-org.brum.beds.ac.uk/10.3390/cli9060098
Submission received: 22 May 2021
/
Revised: 11 June 2021
/
Accepted: 16 June 2021
/
Published: 17 June 2021
(This article belongs to the Special Issue The Water Security and Management under Climate Change)
Abstract
:It is important to understand variations in hydro-meteorological variables to provide crucial information for water resource management and agricultural operation. This study aims to provide comprehensive investigations of hydroclimatic variability in the Bilate watershed for the period 1986 to 2015. Coefficient of variation (CV) and the standardized anomaly index (SAI) were used to assess the variability of rainfall, temperature, and streamflow. Changing point detection, the Mann–Kendell test, and the Sen’s slope estimator were employed to detect shifting points and trends, respectively. Rainfall and streamflow exhibited higher variability in the Bega (dry) and Belg (minor rainy) seasons than in the Kiremt (main rainy) season. Temperature showed an upward shift of 0.91 °C in the early 1990s. Reduction in rainfall (−11%) and streamflow (−42%) were found after changing points around late 1990s and 2000s, respectively. The changing points detected were likely related to the ENSO episodes. The trend test indicated a significant rise in temperature with a faster increase in the minimum temperature (0.06 °C/year) than the maximum temperature (0.02 °C/year). Both annual mean rainfall and streamflow showed significant decreasing trends of 8.32 mm/year and 3.64 mm/year, respectively. With significant increase in temperature and reduction in rainfall, the watershed has been experiencing a decline in streamflow and a shortage of available water. Adaptation measures should be developed by taking the increasing temperature and the declining and erratic nature of rainfall into consideration for water management and agricultural activities.
1. Introduction
Climate change has been influencing hydroclimatic systems and caused various impacts with different magnitude and frequency of hydrological extremes to water resources management, agricultural activities [1,2,3], and economic development [4]. Although warming and cooling are distinct in temporal and spatial regions, substantial warming was observed in Sub-Saharan African countries [5]. Millions of people in Africa are affected by droughts and floods due to hydroclimatic variability. Drought impacts to developing countries with low adaptive capacities are often acute in crop failures, hunger, and loss of life and property. In the mid-1980s, the horn of Africa suffered a shortage of water, which led to economic losses of several hundred million dollars [6]. Rainfall deficits in 1984, 2009, and 2015 were among the most severe droughts that impacted agricultural production and human life in Ethiopia [7]. On the other hand, extreme floods in 1988, 1996, and 2006 caused massive loss of life and properties in the country [8]. For example, an overflow from the Bilate River at the end of July 2006 affected 5370 households in the Humbo Woreda [9,10]. This flood damage has been substantial and exceptional in the watershed.
The Ethiopian economy mainly depends on agriculture, which contributes approximately 43% of total gross domestic product (GDP) and generates 90% foreign exchange earnings [11]. However, the dependence of the country’s economy on rainfed practices has caused agricultural productions to be highly vulnerable to climate hazards such as floods and droughts. Ethiopia’s climate varies spatially and temporally due to the migration of the Inter-Tropical Convergence Zone (ITCZ) [12,13] and its complicated topographic and geographical features [14,15]. The mean annual rainfall in Ethiopia ranges from 141 mm in the arid region of the country’s eastern borders to 2275 mm in the southwest highland [16]. The river flow varies considerably from one stream to another due to seasonal rainfall variation [17] and distinct concentration–time [18]. Changes and fluctuations in hydroclimatic variables significantly affected water resources and food security, particularly in the arid and semi-arid areas [14,19]. Therefore, assessing and understanding historical climate variability and trend is essential to provide crucial information for better practices on food production and overall economic growth.
Many studies worldwide have assessed variability, trends, and changing points of hydroclimatic variables. A study for the Awash River Basin of Ethiopia concluded that precipitation, temperature, and discharge showed spatial and temporal variation, opposite trends, and shifts in mean values across stations [20]. Investigations in hydroclimatic trends in the upper Blue Nile basin found statistically significant upward and downward streamflow trends, but the rainfall did not show any statistically significant trend [21]. Changing points for annual rainfall time series in the upper Blue Nile Basin during 1901–2013 were detected using the standard normal homogeneity test (SNHT) and Pettitt test methods. The pattern of hydroclimatic data in the Mono River Basin of West Africa showed an increasing trend of mean temperature and a non-significant decreasing trend of rainfall [22,23]. A study in the Blue Nile Basin found an increase of river flow in the minor rainy season, while no increasing or decreasing tendency was observed in the dry season [24].
The Bilate watershed is vulnerable to climate change, and variability due to its economy mainly depends on agriculture with a less adaptive capacity [25]. Without sufficient adaptive capacity, the impacts of droughts and floods are substantial [26]. The sustainability of the Bilate River water resources is deteriorating due to climate variability [27]. Water demand in the Bilate watershed has been increasing rapidly and has become more urgent than ever because of population growth, increased agricultural activities, and urban water use [28]. Rainfall variability and meteorological droughts have been investigated [29]. Another study [30] examined the temporal and spatial variability of rainfall distribution. Even though previous studies have conducted trends and variability of hydroclimatic elements, no studies have addressed the variability of temperature and streamflow and lacking changing point detection of hydroclimatic elements in the Bilate watershed.
The objective of this study was to understand variations in hydrometeorological variables of the Bilate watershed by evaluating variability, changing point, and trend of rainfall, temperature, and streamflow on seasonal and annual scales from 1986 to 2015. The implication of these variabilities affecting changes in watershed hydrological cycles was further investigated after identifying changing points in temperature, rainfall, and streamflow. The variability of these elements was tested using the coefficient of variation (CV) and standardized anomaly index (SAI). The non-parametric Mann–Kendall (MK) test and Sen’s Slope estimator were employed for the trend test, and the changing point detection methods including Buishand’s range (BR), standard normal homogeneity (SNH), and Pettitt’s tests were used to detect abrupt changes. Water balance calculation was then applied to examine changes in hydrological cycles. Our findings were compared with recent studies [2,18,19,31,32,33,34] in adjacent watersheds to enhance our understanding of the variability and changes in the hydrometeorological variables of the Bilate watershed, which are vital to the decision making on the planning of climate adaptation measures.
2. Materials and Methods
2.1. Study Area
The Bilate watershed is one of the largest catchments in the Ethiopian Rift Valley Lakes Basin, with a catchment area of 5518 km2. The Bilate River is the main contributor to Lake Abaya, and its source is the Gurage Mountains in central Ethiopia [12,35]. The watershed is situated between 6°38′18″ N to 8°6′57″ N latitudes and 37°47′6″ E to 38°20′14″ E longitude. Its elevation ranges from 1176 m in the south to 3328 m in the north (Figure 1). The watershed has three seasons classified based on rainfall amount. They are called Kiremt/main rainy season (June–September), Bega/dry season (October–January), and Belg/minor rainy season (February–May). Rainfall distribution shows a bimodal pattern with peaks in Kiremt and Belg. These seasons determine the agricultural activities of farmers [36]. Seasonal rainfall in the area is highly variable and difficult to predict, while the temperature is slightly seasonal [26].
Mean annual rainfall in the Bilate watershed ranges from 769 mm in the lowlands to 1339 mm in the highlands. The mean annual temperature varies from 11 °C to 22 °C at Hossana, the upper stream, and 16 °C to 30 °C at Bilate Tena, the watershed’s lower stream. The daily river flows are between 1.2 and 31.25 m3/s at Alaba Kulito and 3 to 45.7 m3/s at Bilate gauging station in the upper and lower streams, respectively [35].
The Bilate watershed is characterized by mixed cultivation and supports irrigation to grow commercial plants such as tobacco, vegetables, and maize. Demand for water irrigation is increasing, and medium-sized private investors have been accessing below the required water demand [37].
2.2. Datasets
Observed daily rainfall from twelve stations and temperature from nine stations during 1986 to 2015 were collected from the Ethiopian National Meteorological Agency (NMA). The daily streamflow data of the Bilate Tena gauging station from 1986–2015 and 30 m by 30 m digital elevation model (D.E.M.) were collected from the Ministry of Water, Irrigation, and Electricity of Ethiopia. The DEM was used to delineate the study area.
2.3. Methods
This study used different variability and trend analysis techniques to analyze the hydroclimatic time series of streamflow data at the Bilate gauging station, basin-averaged rainfall from twelve stations, and basin-averaged temperature from nine stations. Variability analysis involves using a standardized anomaly index (SAI) [38] and the coefficient of variation (CV) [39], while trends and abrupt changes detection using the Mann–Kendall (MK) test [40,41], Sen’s slope estimator [42], and three change-point detection methods. The spatial distribution of annual and seasonal precipitation was presented by the inverse distance weighted interpolation (IDW) [43]. It is suitable for the interpolation of highly variable climatic data. It also assumed that the non-sampled point attribute’s value is a weighted average of the known values in the vicinity and that weights are inversely proportional to the distance between the prediction site and sampled location [44]. The leave one out cross-validation (LOOCV) method [45], which is done by removing one data point at a time and using the remaining data to interpolate for the location of the removed point, can be applied for IDW validation. The performance of the IDW can be further evaluated by the Pearson’s correlation coefficient [46] and the root mean square error (RMSE) methods [47]. In this study, the IDW method was selected to present areal rainfall estimation. Hydrometeorological variabilities were mainly conducted by using basin-averaged rainfall and temperature data.
2.3.1. Variability Analysis
The variability of rainfall, temperature, and streamflow was analyzed using the coefficient of variation (CV) and standardized anomaly index (SAI).
Coefficient of Variation (CV)
The coefficient of variation measures the total deviation from the mean value. It is calculated as the ratio between the standard deviation and the long-term data mean, multiplied by 100% [48]. The CV is used to compare long-term variations of hydroclimatic variables in seasonal and annual scales [49].
where CV is the coefficient of variation; μ is the mean hydroclimatic variable; and δ is the standard deviation over the period. Degree of variability was classified as less (CV < 20), moderate (20 < CV < 30), and high (CV > 30). In general, a higher CV shows a more considerable variation in hydroclimatic variables and vice versa [50].
Standardized Anomaly Index (SAI)
The standardized anomaly index helps to identify dry and wet years with long-term mean rainfall and examines the nature of trends [1,50]. It is obtained by calculating the difference between the annual total and the mean long-term rainfall for a given year divided by the long-term data’s standard deviation. The seasonal scale rainfall anomaly can also be calculated using this index, which is expressed as:
where SAI = standardized rainfall anomaly; x = annual rainfall in year t; = long-term annual mean rainfall over a given period of observation; and = standard deviation of rainfall data. According to classifications given in [51], values of SAI are classified as shown in Table 1.
2.3.2. Changing Point Detection Test
Studying whether or not there are sudden changes in time series and identifying the shift is essential for understanding a river basin’s sensitivity to climate variability and impacts on water resource availability [52]. We utilized Buishand’s range (BR) [53], standard normal homogeneity (SNH) [54], and Pettitt’s [55] changing point detection methods to investigate the presence of sharp shifts in annual and seasonal time series of hydroclimatic variables in the Bilate watershed.
A non-parametric Pettitt test detects a significant change in the time series average if the change’s exact time is unknown. This test has been widely used to identify observed changes in climatic and hydrological datasets. The Pettitt test is more sensitive to breaks in the middle of the time series [56,57]. Under a null hypothesis, this test assumes that there is no changing point and the alternative hypothesis considers a date at which there is a change in the data. If the p-value is less than the 0.05 significance level, the null hypothesis is rejected to accept the alternative hypothesis [21].
The standard normal homogeneity test (SNHT), unlike the Pettitt test, is more sensitive to breaks that appeared at the beginning and end of the data series. The null hypotheses and alternative hypothesis assumptions of the SNH test are the same as those of the Pettitt test. This method detects a change in a time series of data by comparing the mean of the record’s first observations with the last to form the test statistic [22]. According to the test statistics’ critical values for different detection tests listed in Table 2 in [58], the changing point based on the total number of observations may be the sample where the test statistics reach the maximum value. When the critical value is less than the test statistic, the null hypothesis can be rejected, depending on the sample size.
The Buishand range (BR) method detects the changing point based on cumulative deviations from the mean. This method assumes that the testing variable’s values have the same mean, and under the alternate hypothesis, it takes the existence of possible changes in the mean value [53]. Overall, a series may be considered as having a changing point or be inhomogeneous if at least two tests reject the null hypothesis; and considered homogeneous or no changing point if no test out of three tests rejects the null hypothesis.
After detecting the changing point of rainfall and streamflow, we further examined the stationarity of precipitation and streamflow before and after the changing point using frequency analysis. We calculated the exceedance probability of rainfall and streamflow, which were plotted using daily data, defined the rainfall (Ri) and discharges (Qi) arranged in descending order, where R1 and Q1 being the largest values of rainfall and streamflow, respectively. The exceedance probability was calculated as [59]:
where n represents the number of days of rainfall and streamflow, and i indicates the rank.
2.3.3. Trend Analysis
Detection of trends in hydroclimatic variables can be performed using parametric and non-parametric tests. Parametric tests are robust but require the available data for normal distribution, stationarity, and serial independence [60]. It is rarely used for climatic and hydrological data because some are biased and contain outlier observations [61]. Non-parametric statistical analyses are not affected by the normal distribution of data, are less sensitive to outliers, and are better suited to normally undistributed data [1,61,62]. This characteristic makes a non-parametric test for the trend detection of hydroclimatic variables advantageous over a parametric analysis. We applied the Mann–Kendall (MK) test [40,41], which is one of the most widely known non-parametric trend detection tests used for hydroclimatic time series [63].
The expressions for the Mann–Kendall test statistics (S) is given by:
where n is the number of the dataset; and are consecutive data values on years j and i, where j > i; and sgn () is computed using Equation (5).
The variance, Var(s) is calculated by:
where n denotes the number of observations; m represents the number of tied groups; and indicates the number of observations in the i-th data group. The standard test statistic Zs was computed using:
The test was used for hydroclimatic variables on a seasonal and annual basis with a confidence level of 95%. According to this test, the null hypothesis (H0) designates that there is no trend in the series, while the alternative hypothesis (H1) describes that there is a trend [64]. Test statistic Zs evaluates the statistical significance of the trend. If Zs is positive, it indicates an upward trend while negative denotes decreasing trends [65]. The trend is reflected as significant at a significance level of 0.05 when > 1.96 [66]. In this study, a 0.05 significance level for the analysis of the hypothesis was considered.
A non-parametric Sen’s slope estimator [42] was used to estimate the time series trends’ magnitude and direction. The slope (β) is calculated using the equation given by.
where β represents the median of the slope values between data points and at time step i and j, respectively (i < j). The value of β indicates the magnitude of the trend, the sign of β specifies the direction of the data trend, a positive value of β shows an upward trend, and a negative implies a downward trend. The Sen slope estimation method is more robust than linear regression, which reduces the outliers’ effect or missing values and performs better, even for normally distributed data [67].
2.3.4. Calculation of Potential Evapotranspiration (PET) and Evapotranspiration (ET)
In this study, the daily potential evapotranspiration (PET) was calculated using the Hargreaves method (Equation (9)), which uses the minimum and maximum temperatures as input. In addition, we calculated evapotranspiration (ET) with the Budyko-type relation (Equation (10)) [68,69] and the basin water storage (ΔS) with the water balance equation [70].
where PET denotes the Hargreaves potential evapotranspiration (mm/day); Ra represents extraterrestrial radiation (mm/day) that depend on latitude, sunshine hours, and solar constant; λ is the latent heat of vaporization (MJ/Kg); and Tmin and Tmax indicate the minimum and maximum temperature (°C).
where w is a parameter that depends on the watershed characteristics. For tropical climates, Pike proposed w = 2 [71].
3. Results
3.1. Climatology of Study Area
Monthly mean maximum temperature increases from August (23.81 °C) and peaks in February (27.86 °C), then gradually decreasing and reaching the lowest point in July (23.48 °C) were observed in the Bilate watershed, as shown in Figure 2. With the increase in elevation (Figure 1), the temperature dropped from the south toward the north of the watershed. Substantial amounts of rainfall were mainly observed during the Kiremt (49.4%, June–September) and the Belg (36.5%, February–May) seasons, as shown in Figure 2. Streamflows of the Kiremt, Belg, and Bega seasons account for 53.6%, 27.4%, and 19.0%, respectively, of annual flow.
The complex topographical features play an essential role in Ethiopia’s climate [14]. The country has a diverse topography that ranges from 125 m below sea level at the Danakil Depression to 4620 m above sea level at RasDejen. The country is also dominated by a plateau with a mountain range separated by the East African Rift Valley [72]. These physiographic variations create a significant difference in climatological condition both spatially and temporally. Subsequently, the mean annual rainfall of Ethiopia is characterized by 141 mm in the lowlands and 2275 mm in the highlands [16].
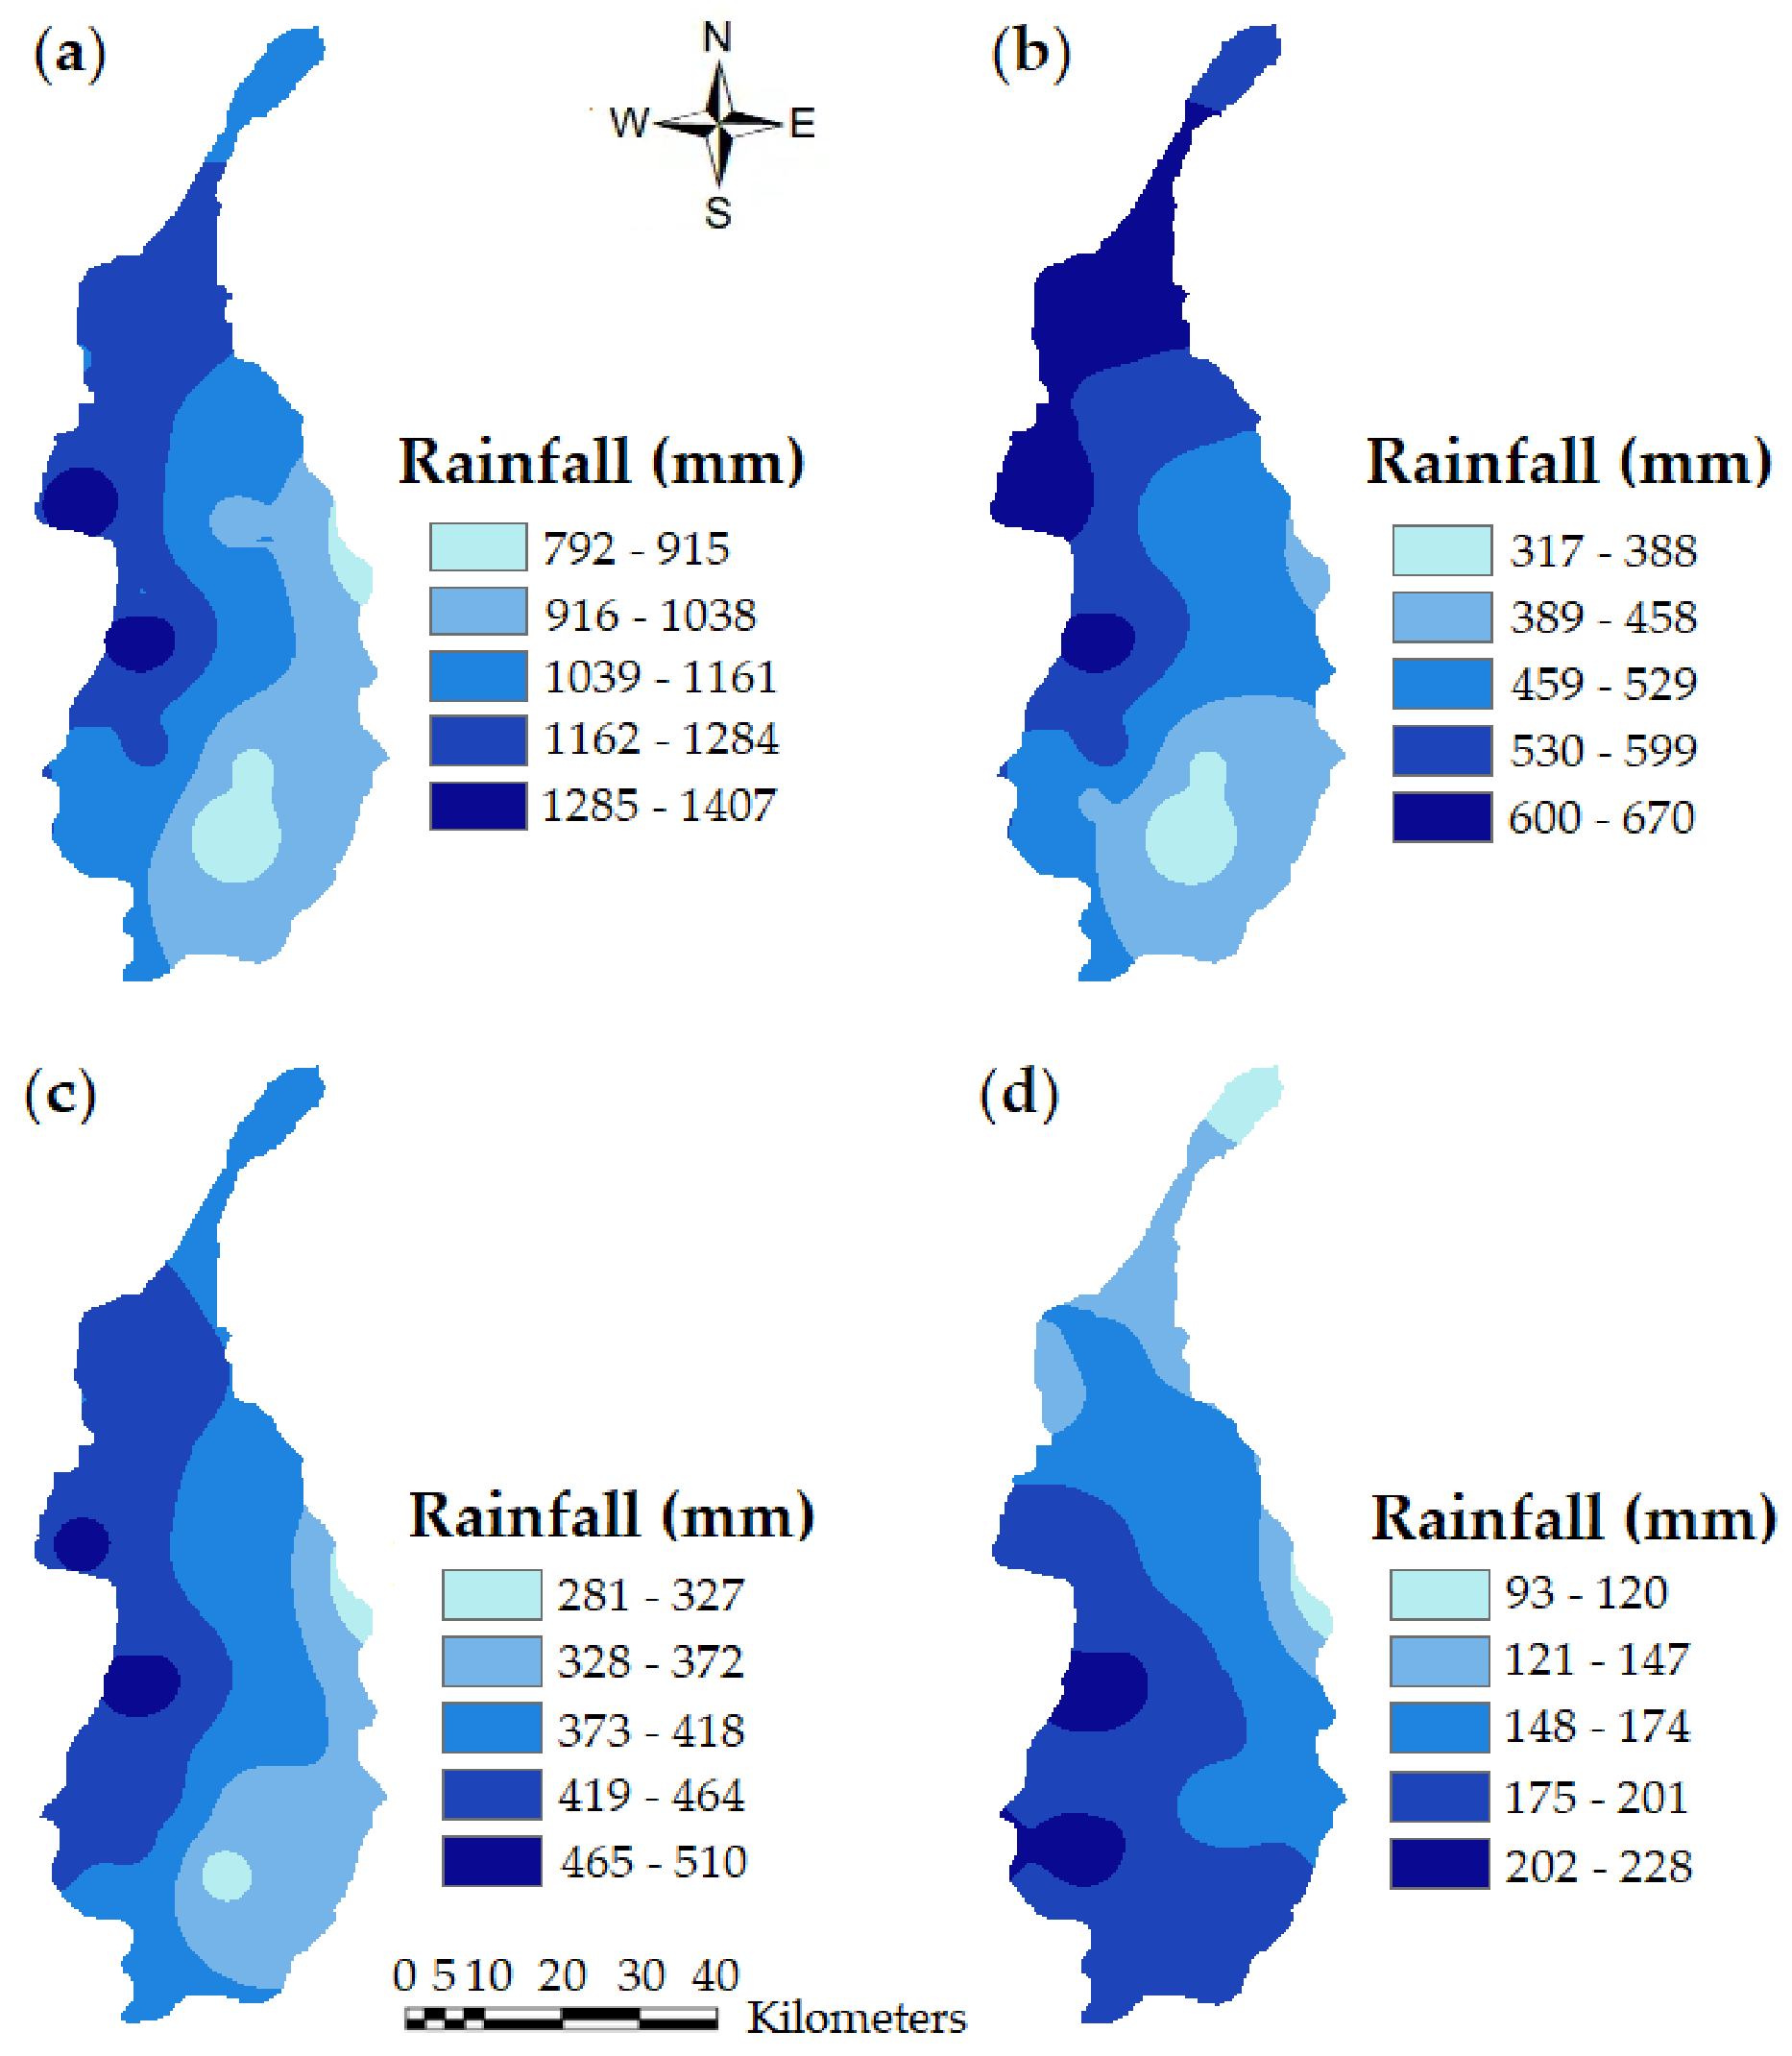
The spatial distribution of annual and seasonal precipitation in the Bilate catchment is shown in Figure 3. Considerable spatial variation mainly related to elevation differences in the watershed can be observed. The annual rainfall was higher (1162 mm to 1407 mm) in the highland areas north and west of the watershed than those in the lowlands, which received below 916 mm (Figure 3a). The Kiremt rainfall declined from the northwest about 650 mm to the southeast of 320 mm (Figure 3b). In the Belg, the northern, central, and western parts received more than 400 mm (Figure 3c). The eastern and southeastern watersheds received less than 373 mm. The lowest seasonal rainfall throughout the watershed, below 230 mm, was recorded during the Bega (Figure 3d). This spatial variation in rainfall distribution in the watershed is mainly attributed to the orographic effect.
3.2. Variability Analysis
3.2.1. Temperature Variability Analysis
Temperature plays a vital role in water loss over a catchment. Increasing temperature reduces soil moisture by evapotranspiration and subsequently affects runoff amount due to drier soils [18]. Annual and seasonal temperature were analyzed from 1986 to 2015 to assess temperature variability in the watershed. The daily minimum temperature varied from the lowest of 10.9 °C in the highland area around Hossana to the highest of 30.38 °C in the lowlands of the watershed nearby Bilate Tena.
The CV of annual minimum temperature was 6%, which is much higher than those of average temperature (2.7%) and the maximum temperature (1.5%). A high variability in the minimum temperature over the past 30 years was observed in the study area. Figure 4 depicts anomalies of annual maximum, average, and minimum temperatures. The slopes of linear-fitting regressions for the minimum and average temperatures were higher than those for maximum temperature. A rise in the minimum temperature was more significant than that in the maximum temperature. In general, the increase in temperatures was consistent among the three temperatures, and the minimum temperature had a relatively persistent positive anomaly after 1994 than the others. Similar findings were observed in the Southern Ethiopia region adjacent to our study area [73].
3.2.2. Rainfall Variability Analysis
Results of seasonal rainfall variability analysis showed higher CVs of 59% and 31% in the Bega and the Belg, respectively, than the 21% in the Kiremt. Regarding spatial variations, higher annual and seasonal rainfall CVs were mainly observed in lowlands around the Bilate and Bilate Tena stations having relatively lower rainfall amounts. The highland areas around Hossana and Fonko stations exhibited less variability than the lowlands. These results agree with studies in the Rift Valley Lake Basin [33,74] and across Ethiopia [37].
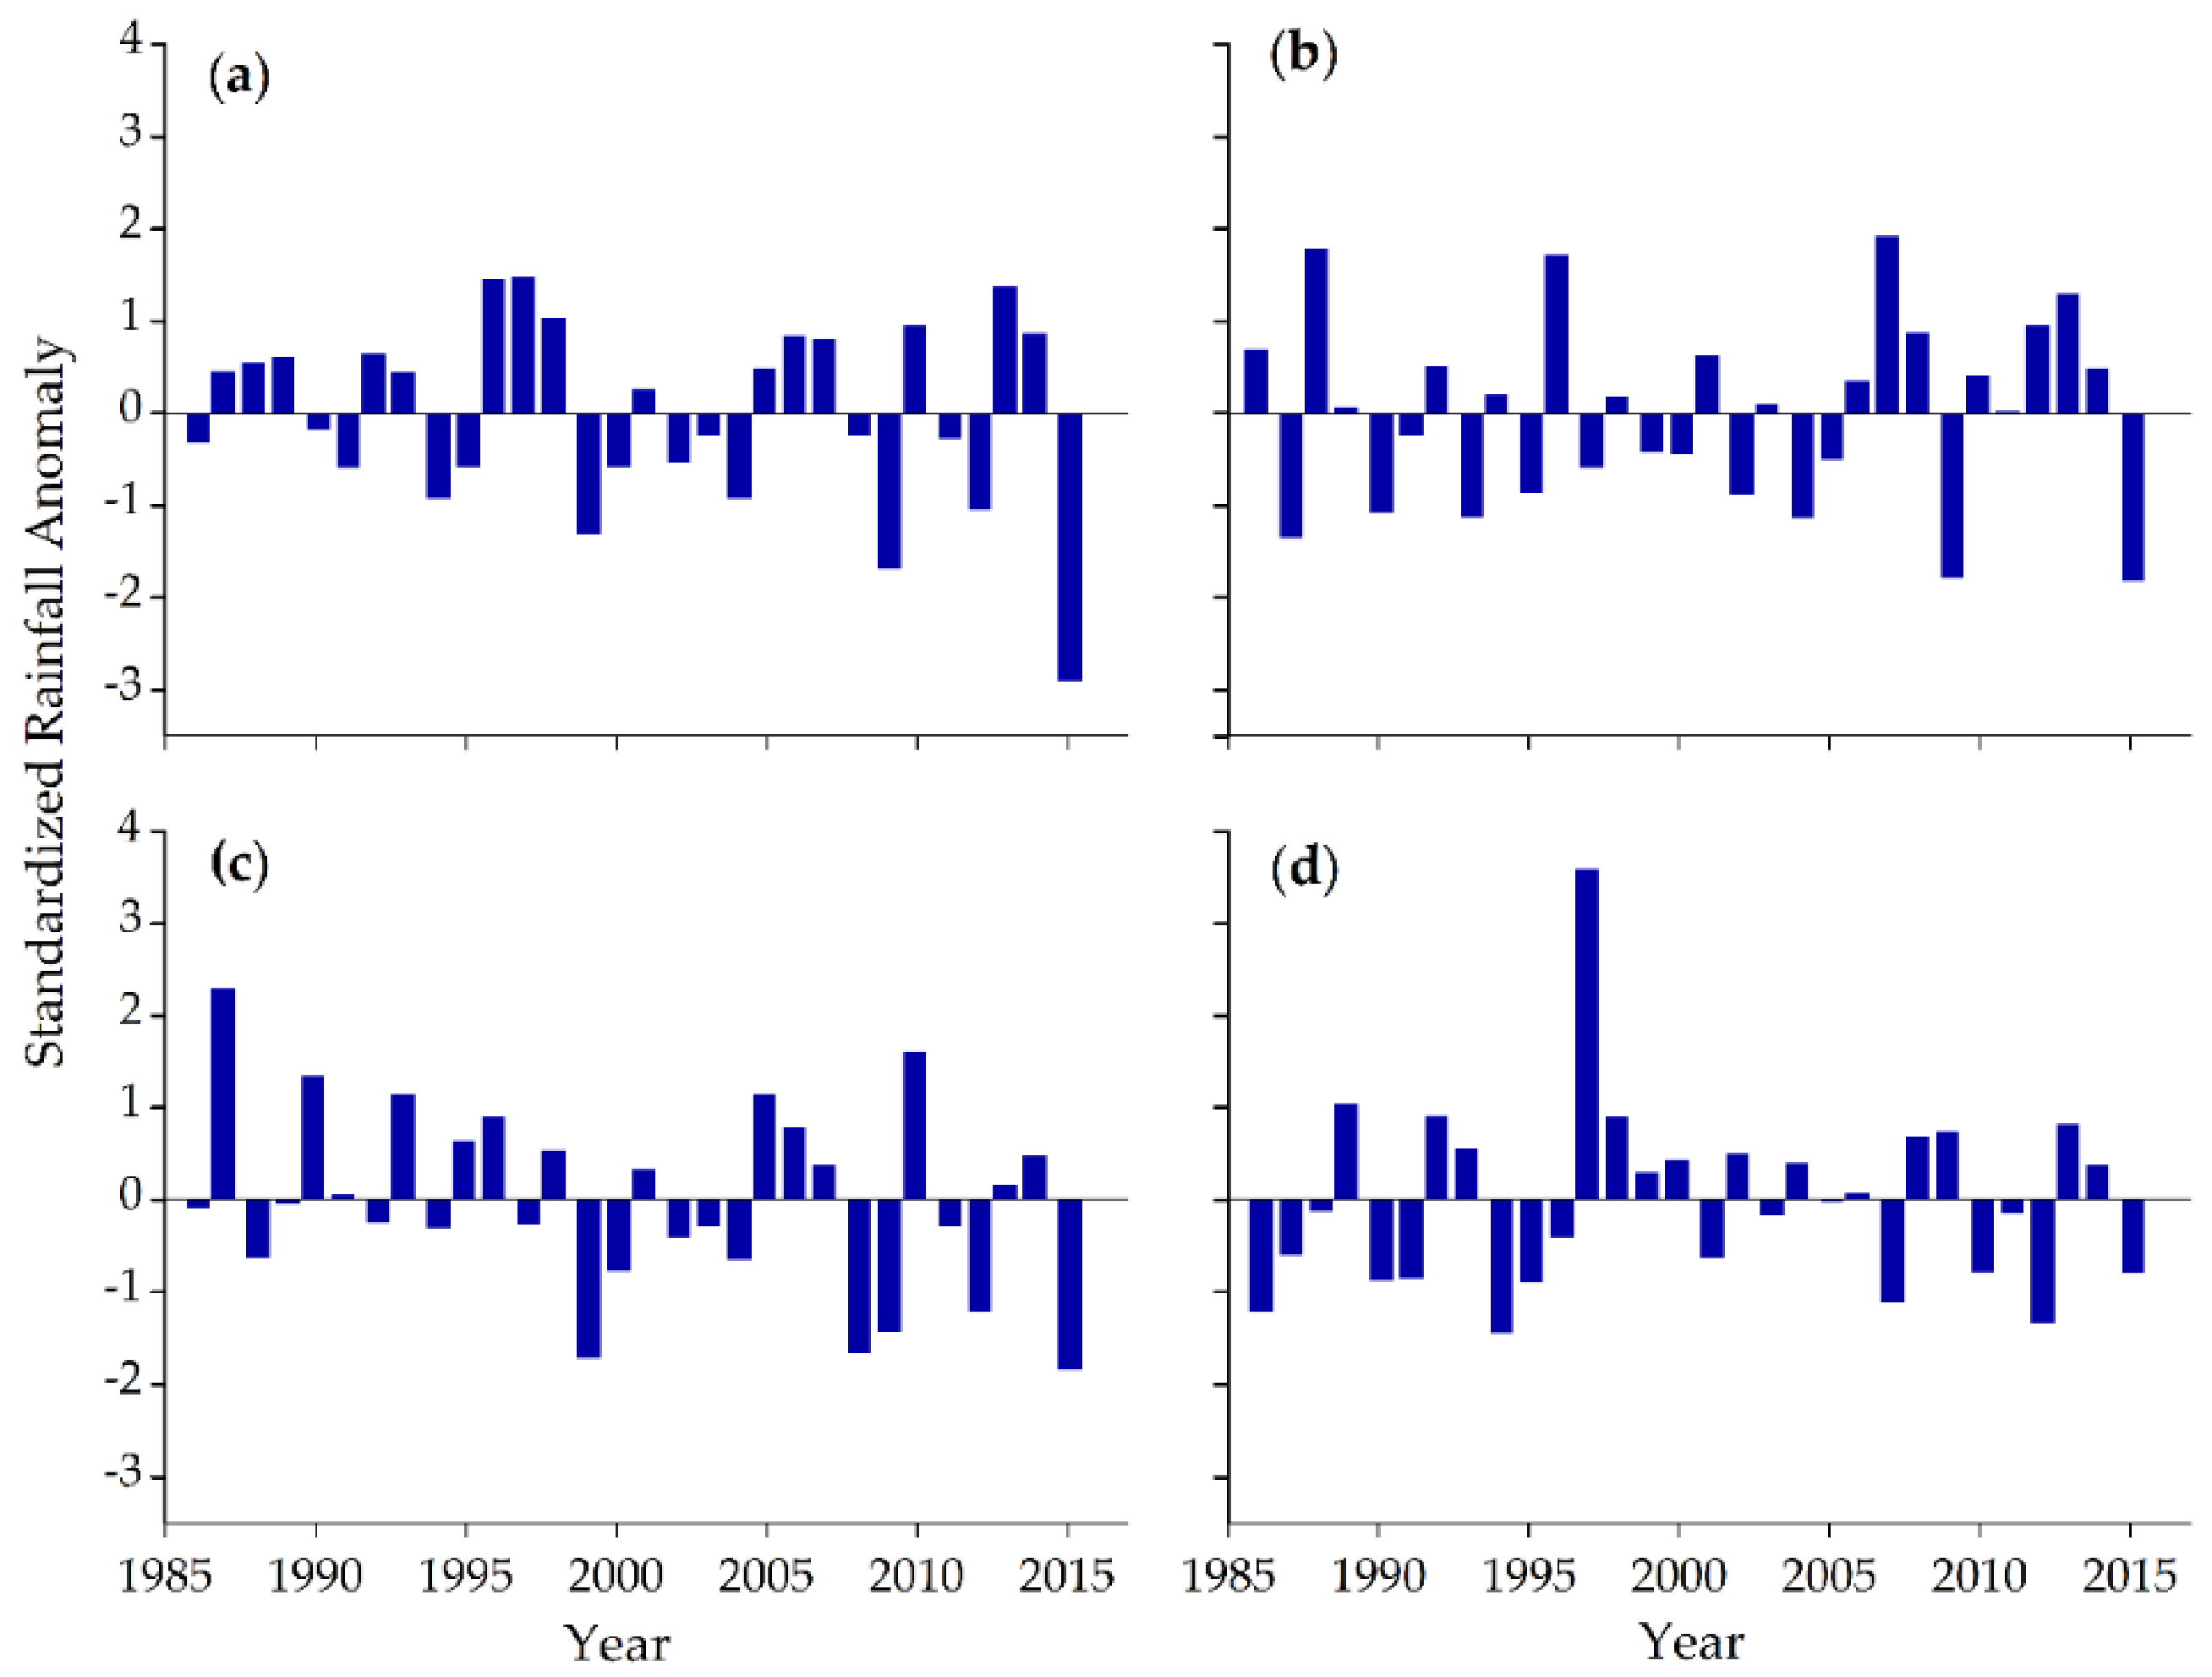
In addition to the CVs, the SAI was employed to assess annual rainfall variability in time domain. The annual and seasonal rainfall anomalies are presented in Figure 5. The most considerable annual positive rainfall deviation of 1.49 SAI was observed in 1997, while the largest negative anomaly of −2.91 SAI was detected in 2015 (Figure 5a). The return period of wet/dry years was roughly two to three years as positive/negative anomalies appeared in Figure 5 for annual and seasonal rainfall, which is similar to the results presented in [30]. Since the 1990s, it seems that the appearance of negative anomalies are more distinct, showing a trend of having much less rainfall in dry years (Figure 5a). Similar findings were exhibited in the Rift Valley Lakes Basin [33] and Ethiopia overall [75].
As presented in Figure 5, the seasonal rainfall SAI revealed that 43.3% of the study period exhibited below-average rainfall in the Kiremt season. The Belg and the Bega showed that 53.3% of the study period rainfall was below the long-term average. Our findings also demonstrated that the dry Kiremt season is associated with El Niño events, and the wet season is associated with La Niña events; the opposite is true for the Belg. For instance, the dry Kiremt years of 1987, 2009, and 2015 matched El Niño events, while the wet Kiremt years of 1988, 1996, and 2007 coincided with La Niña events (Figure 5b). The wet Belg year in 1987 matched El Niño events. The dry Belg year in 1999 with SAI of −1.72 coincided with the La Niña events (Figure 5c). This result indicated that ENSO’s warming phase exhibited a declining rainfall in the Kiremt season while intensifying in the Belg season in the Bilate watershed. On the other hand, the La Niña events increased rainfall during the Kiremt season and decreased in the Belg. Similarly, in the upper Blue Nile Basin and Ethiopian highlands, the amount of precipitation and streamflow in the Kiremt reduced during El Niño and intensified in La Niña events [76,77].
3.2.3. Streamflow Variability Analysis
Patterns of seasonal streamflow variability were similar to those observed in rainfall. The streamflow CVs were 51% and 47% in the Belg season and Bega, season, respectively, which were higher than those of annual (35%) and Kiremt season (32%). A comparable result was reported in the Rift Valley region of Ethiopia [19]. The higher variability of seasonal streamflow, especially in the Belg, which is one of the crop growing seasons, exacerbates the scarcity of available water and challenges in agricultural activities.
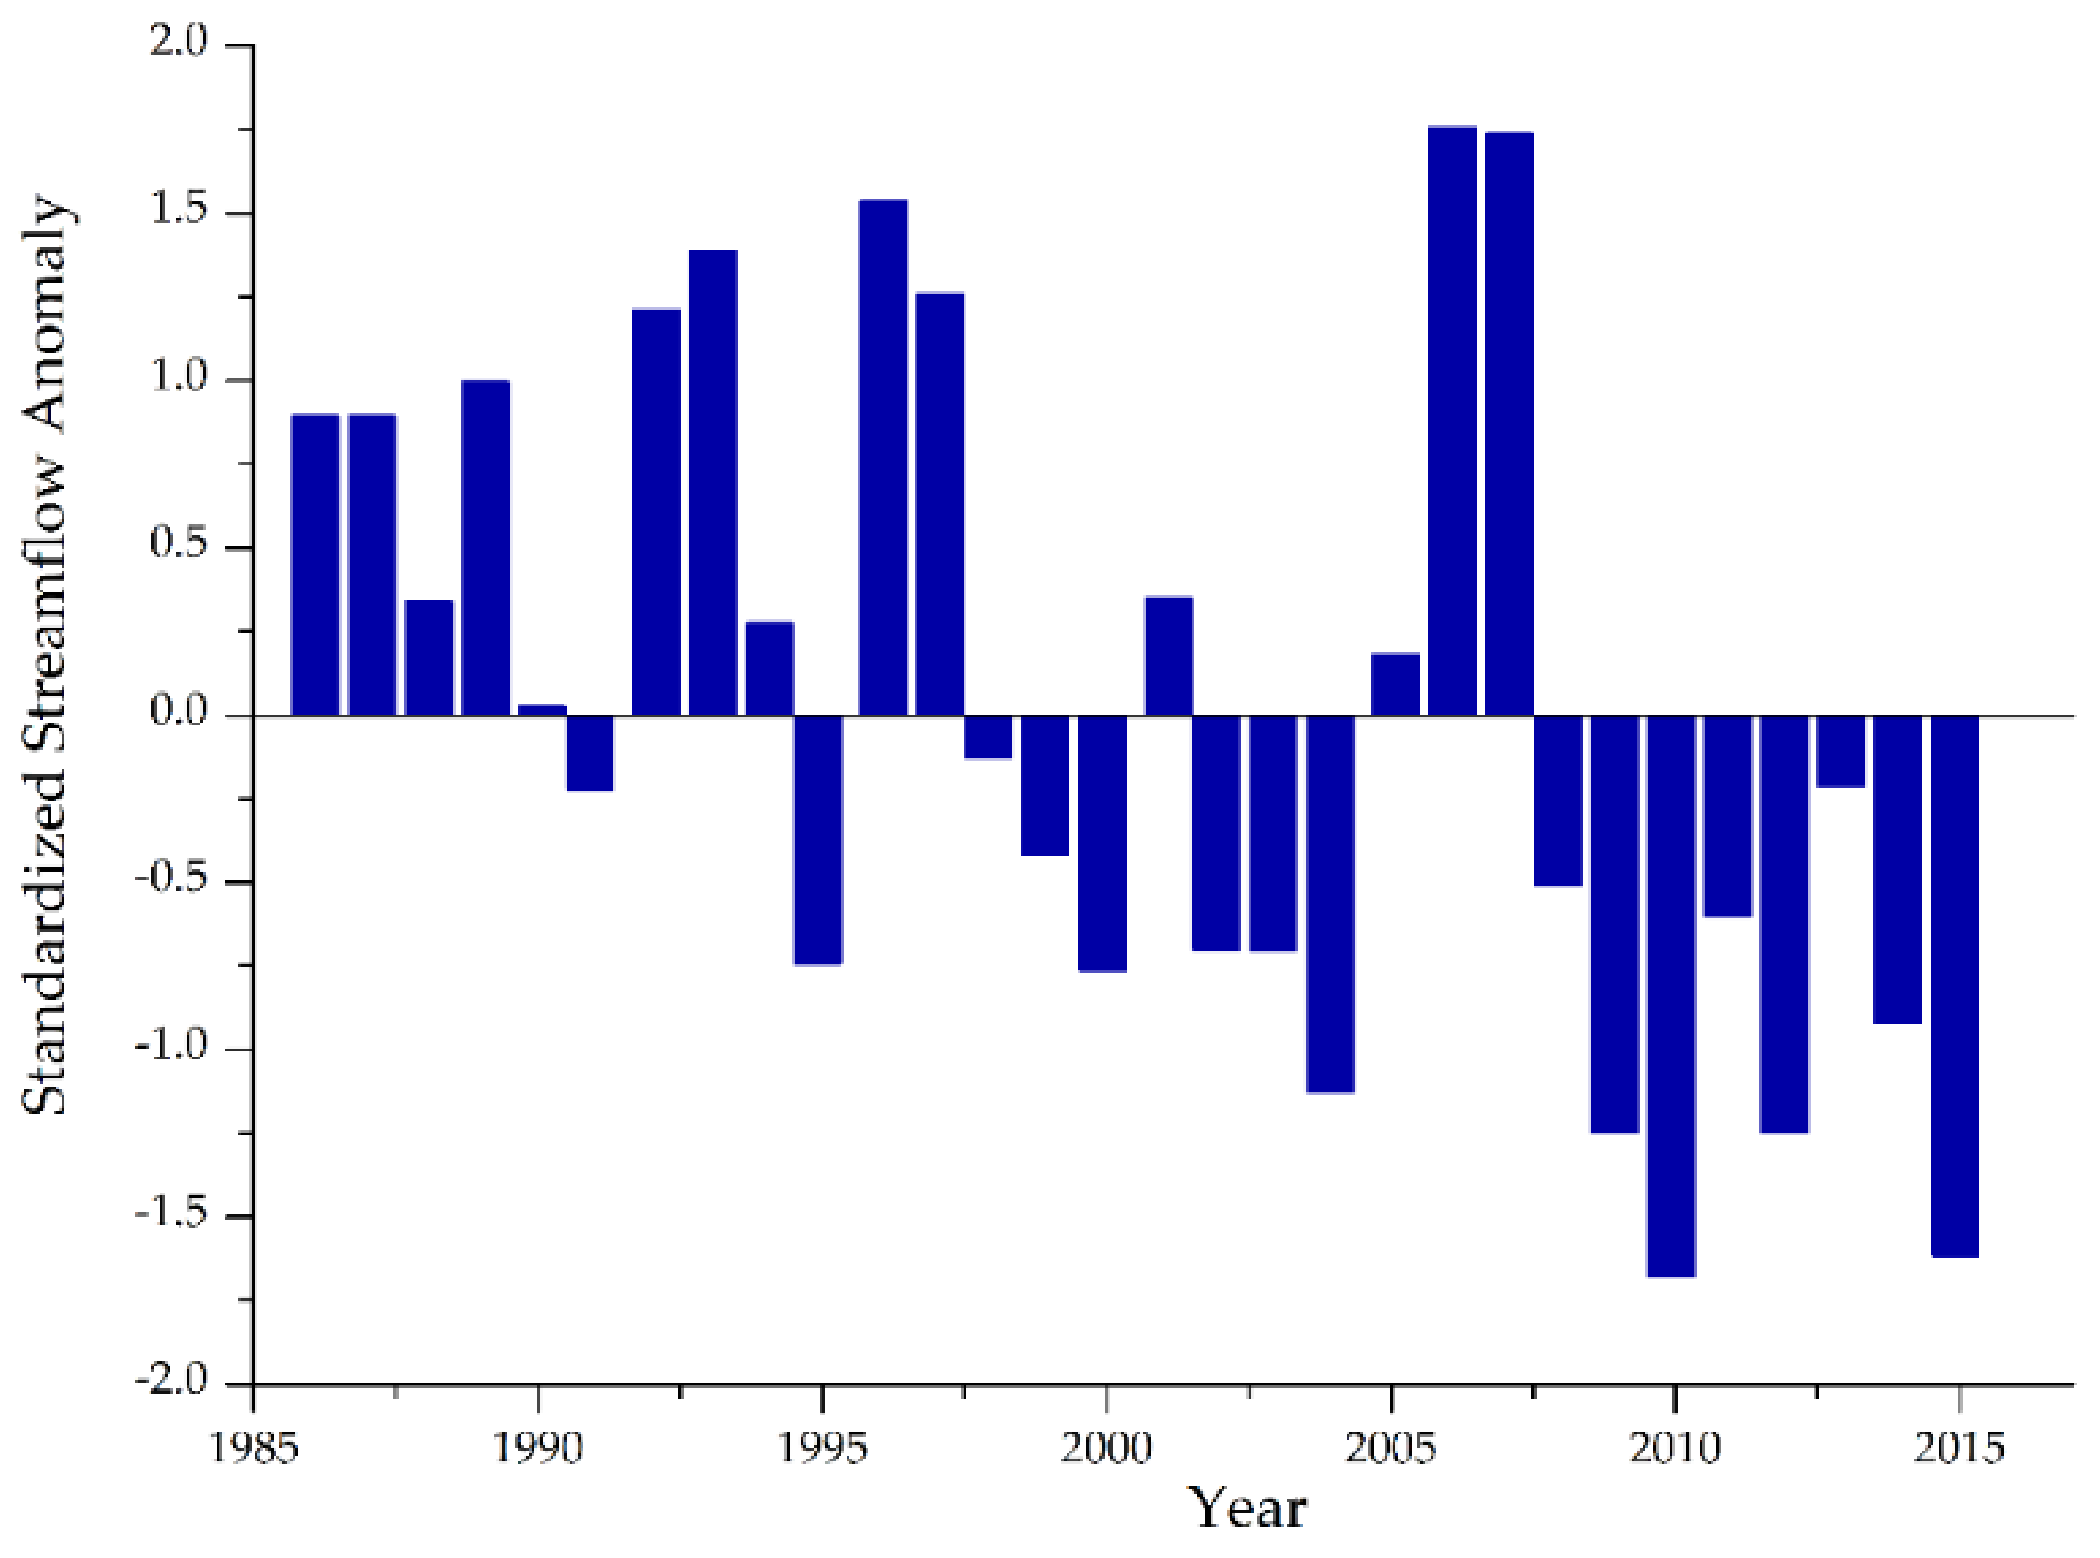
Interannual streamflow variability was the most critical characteristic in the Bilate watershed. Figure 6 shows the streamflow SAI of Bilate gauging station from 1986 to 2015. The number of years having negative anomalies was more than those with positive SAI, suggesting that the watershed was experiencing more dry years than wet ones. The findings also designated the 2000s as drier years than the 1990s. Taking years after 2000 as an example, there were 12 years with negative streamflow SAIs, which were more than nine years with negative rainfall SAIs (Figure 5a). The Bilate catchment is getting drier in streamflow.
3.3. Changing Point Detection Tests
The Pettitt’s, SNH, and BR test were adopted to detect shifts of hydroclimatic variables in annual and seasonal temperature, rainfall, and streamflow. Abrupt changes can be attributed to changing climate and human activities such as large water development projects [32]. In this study, changing points in temperature, rainfall, and streamflow in the Bilate watershed were examined for the period 1986–2015.
3.3.1. Temperature Changing Point Detection Test
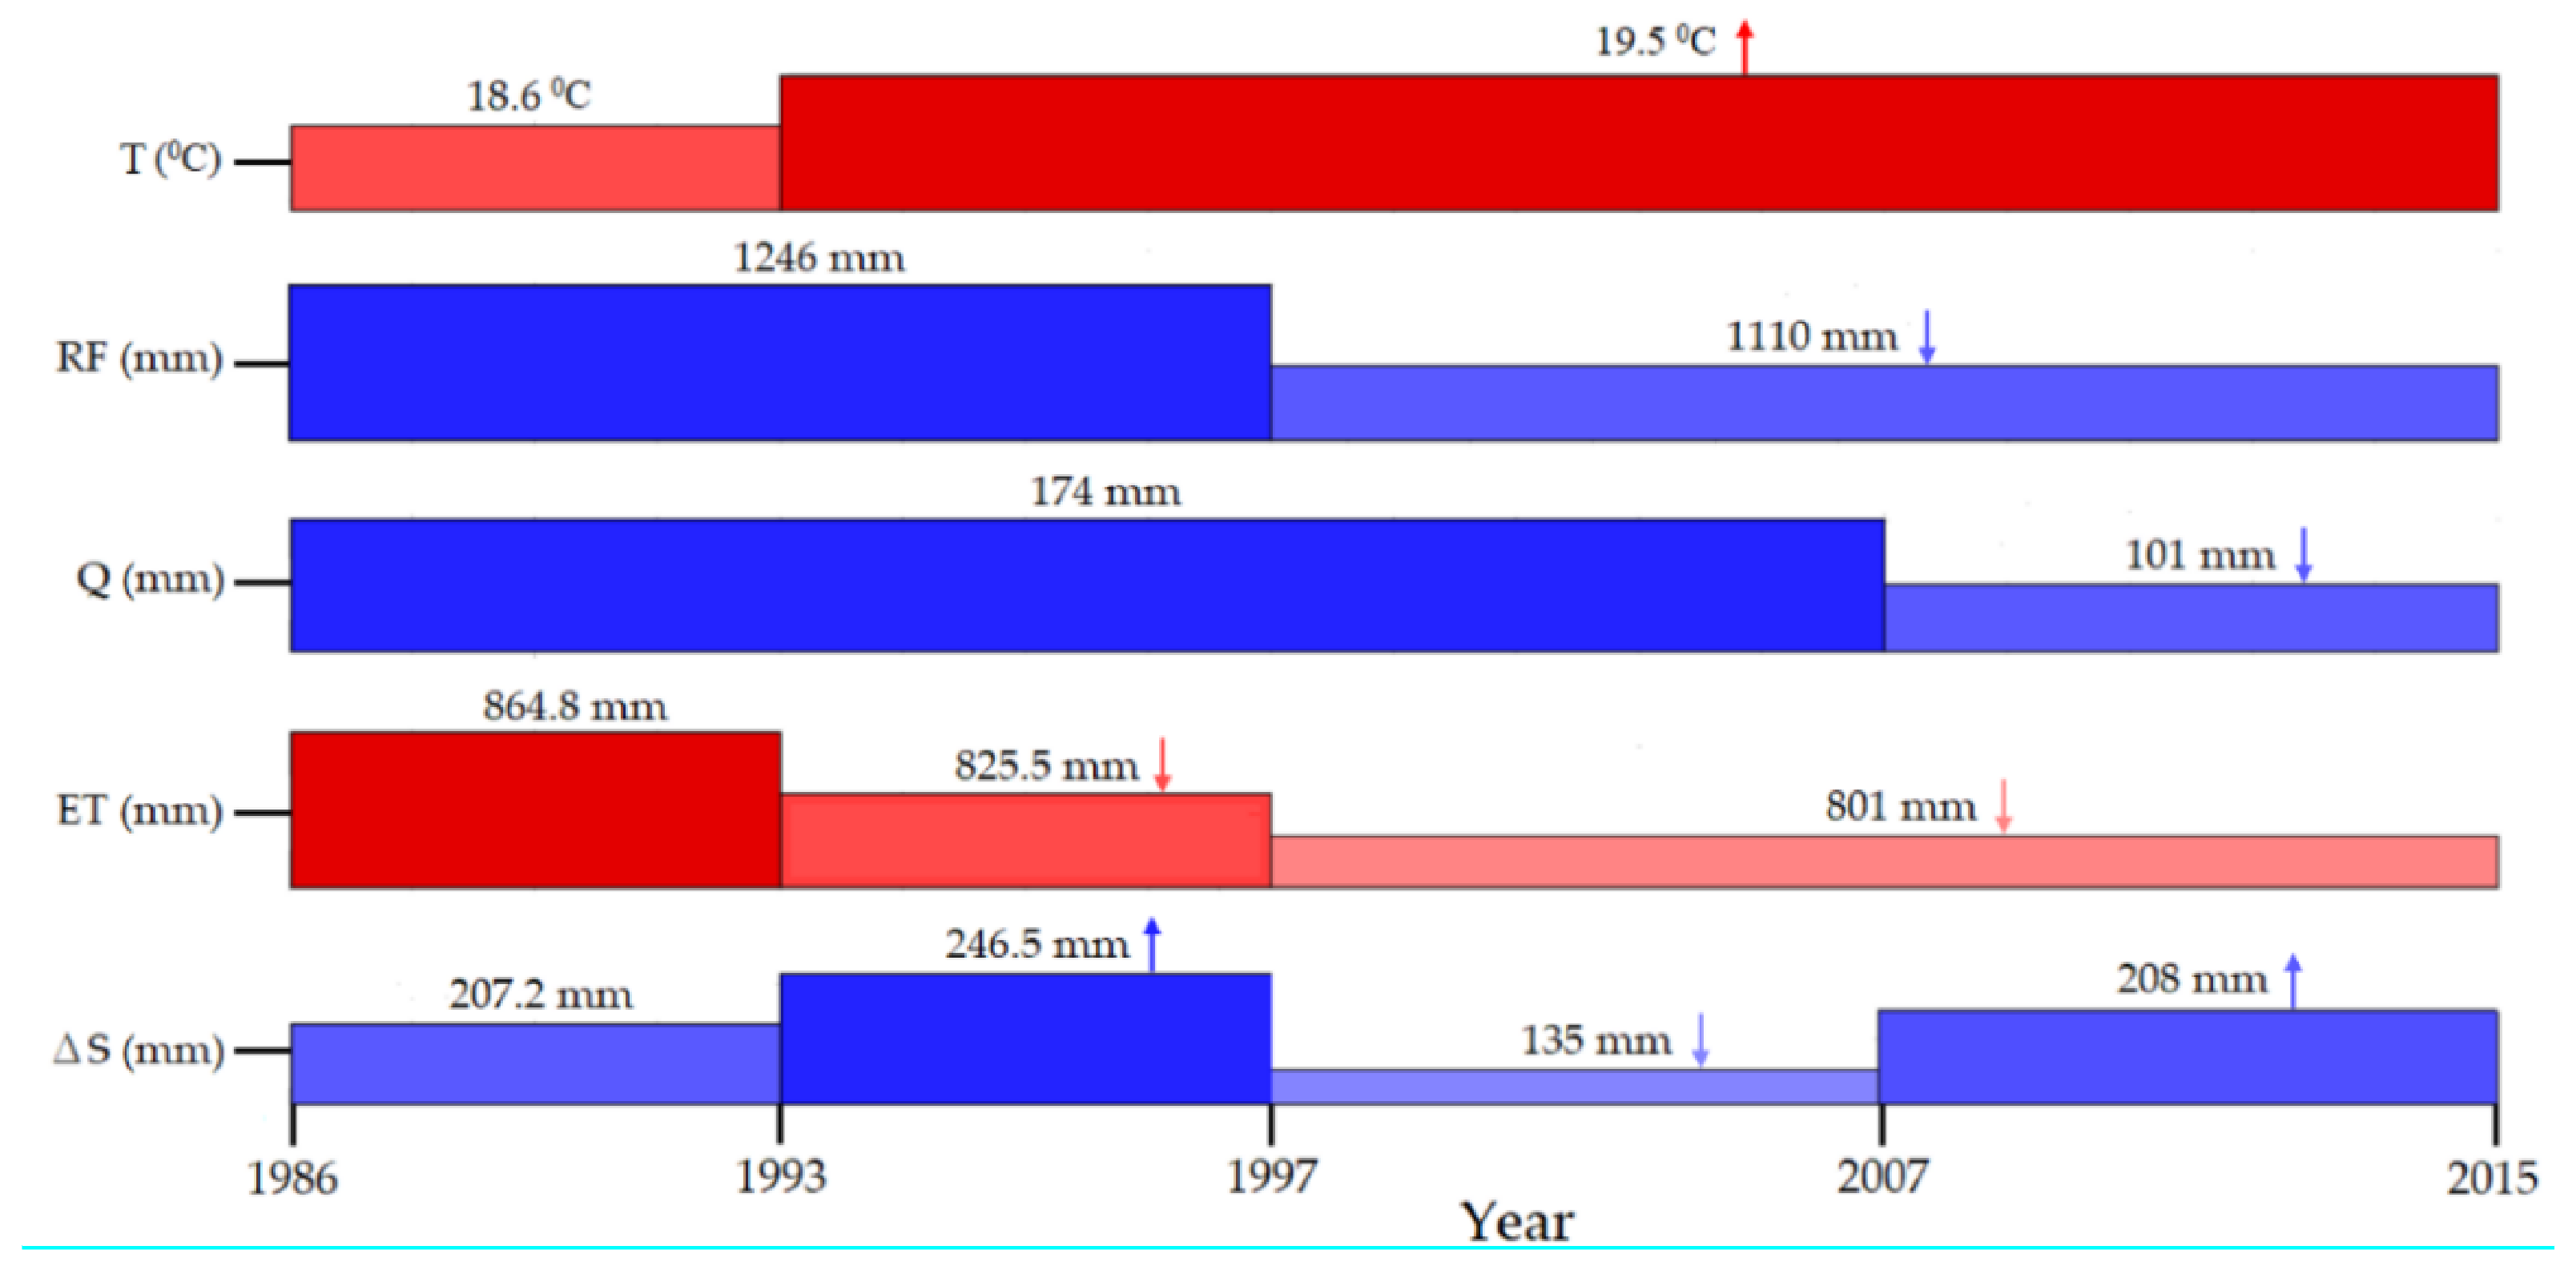
As shown in Figure 7, temperature shifts were detected in 1993 for both annual and Belg season by three different tests. The annual mean temperature before and after the changing point were 18.59 °C and 19.50 °C, respectively. During the Kiremt season, mean temperatures of 17.79 °C and 18.68 °C were observed before and after, respectively, the changing point of 1994. After the abrupt change, the Belg and Bega temperatures increased by 0.98 °C and 0.85 °C, respectively. Such considerable temperature changes might be caused by droughts in Ethiopia observed over the past three decades [75].
3.3.2. Rainfall Changing Point Detection Test
Unlike the increase shift in mean temperature, abrupt changes in annual and Belg rainfall were detected in 1997 by all three tests as shown in Figure 8, while there was no significant change in Kiremt and Bega rainfall. Reduction in annual rainfall from 1246 mm to 1110 mm was mainly attributed to the decrease in the Belg rainfall from 502.3 mm to 378.0 mm. In the Bilate catchment, the Belg season is one of the rainy seasons, and accounts for about 36.5% of the total annual rainfall. The downward shift in rainfall during the Belg season since 1997 has resulted in extreme drought and increased mortality rate of cattle by 49% in southern Ethiopia around the Bilate watershed [78]. Because rainfall has a great impact on streamflow, the decline in rainfall can directly affect the streamflow and exacerbate water stress.
3.3.3. Streamflow Changing Point Detection Test
Abrupt changes of reduction in streamflow were detected for annual and the Belg season in 2007 as shown in Figure 9. The annual mean streamflow decreased from 174 mm to 101 mm, and in the Belg season from 41.3 mm to 20 mm. Although the Kiremt season streamflow also designated a shift from 103.5 mm to 69.1 mm, it appeared in 1997. Previous studies in other basins reported a decline of discharge after the changing point. For instance, the Modjo watershed of central Ethiopia study from 1981 to 2015 indicated decreased annual mean flow from 685.96 mm to 119.04 mm after 2000. The Kiremt streamflow also significantly reduced from 545.08 mm to 105.9 mm after the shifting point [79]. The decrease in streamflow exacerbates water scarcity in the Bilate watershed.
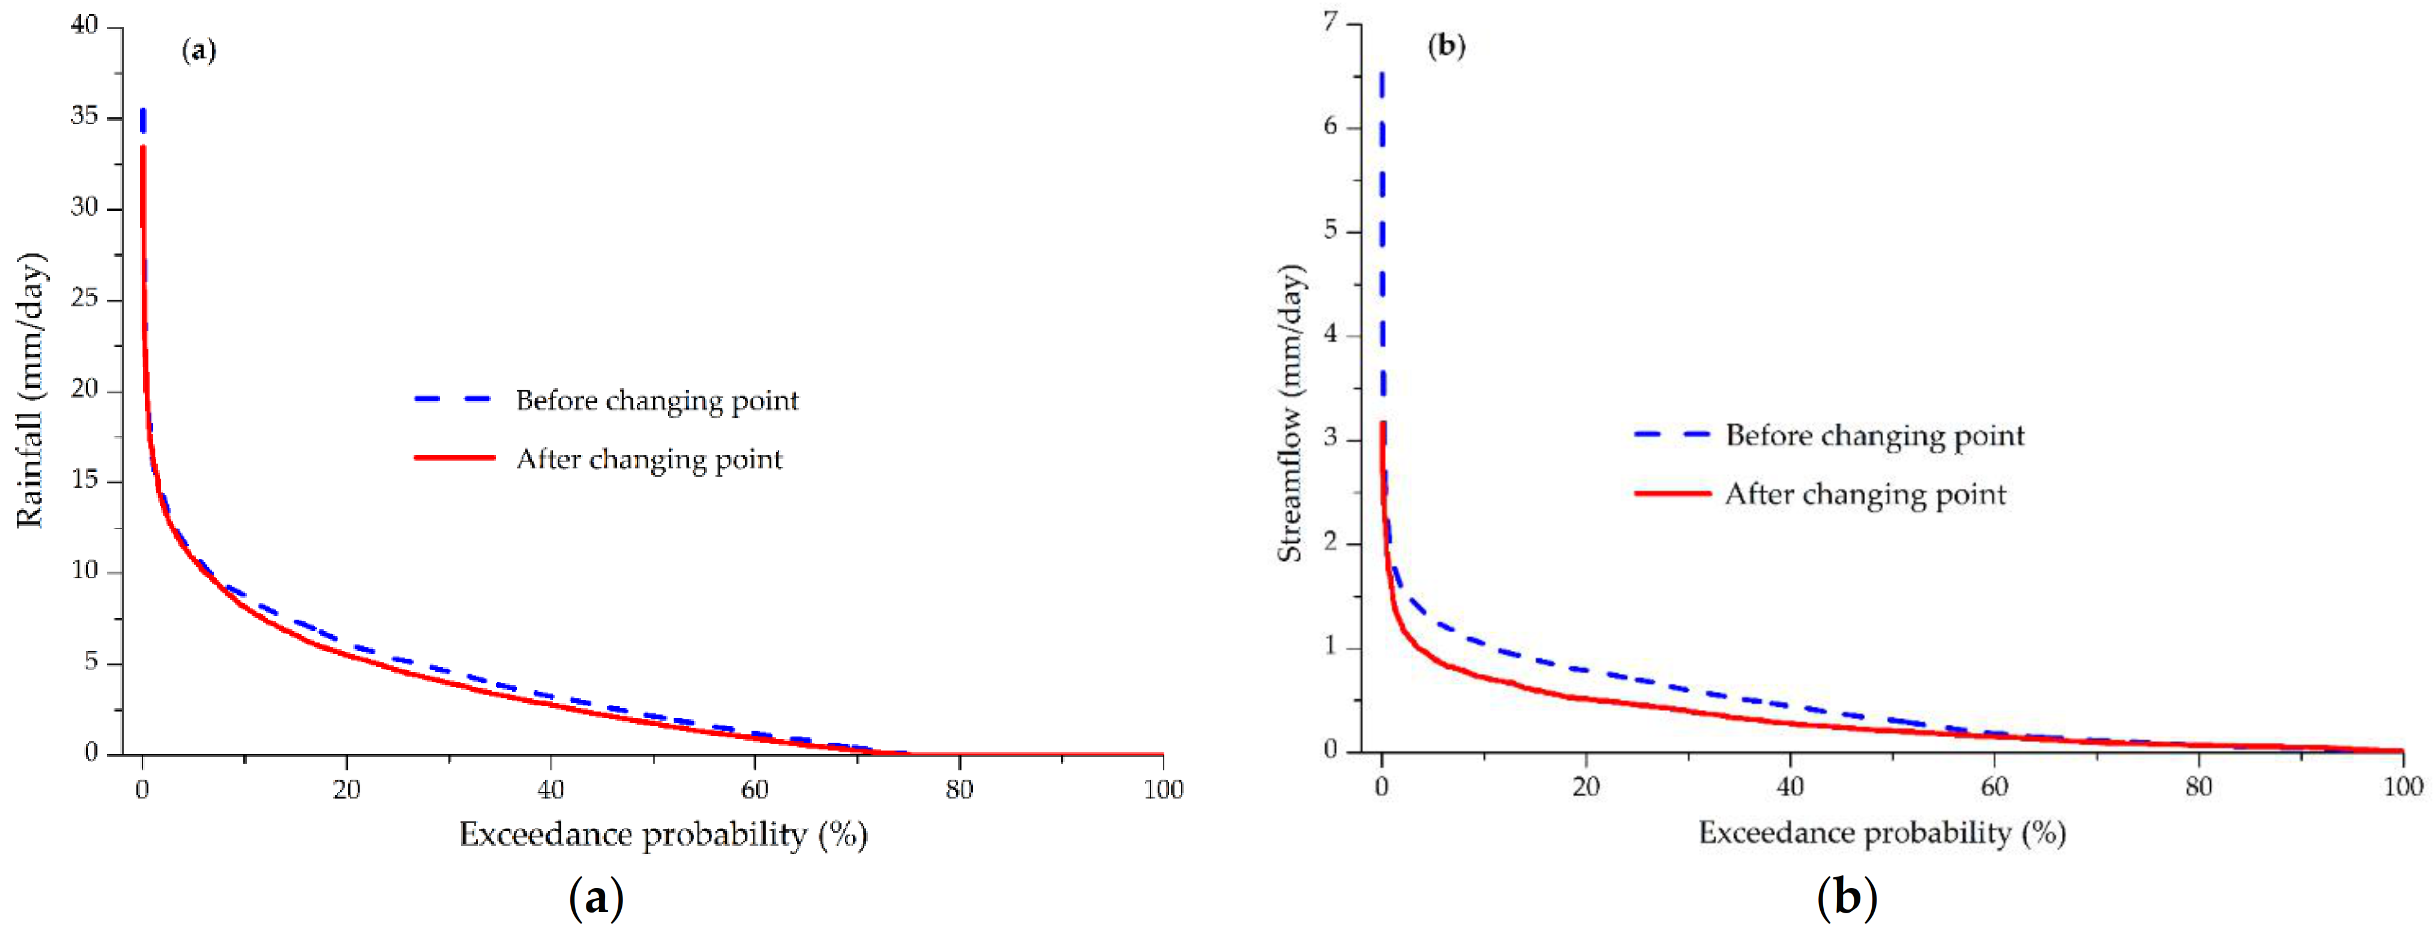
The stationarity of rainfall and streamflow before and after the changing point was examined by frequency analysis, as shown in Figure 10 and Table 2. The magnitude of precipitation and streamflow of a particular exceedance probability decreased after an abrupt shifting point. For example, the rainfall (Figure 10a) reduced after the changing point by 6.7% and 18.2% for the exceeded probability of 0.1% and 50%, respectively. Frequency analysis of streamflow (Figure 10b) also attests that the magnitude after the changing point was lower than before the changing point. As streamflow equaled or exceeded 0.1% and 50% of the time, its magnitude dropped by 29.7% and 33.3%, respectively. This reduction showed that there is a shortage of available water in the Bilate watershed after the changing point. Therefore, appropriate water conservation structures are recommended to minimize the water scarcity issue.
3.4. Implication of Changes in Hydrological Cycles
After detecting abrupt changes in temperature, rainfall, and streamflow, we further investigated the effects of such changes in evapotranspiration (ET) and basin water storage (ΔS) to understand the implication of changes in hydrological cycles in the Bilate watershed. Based on the years of shifts in hydroclimatic parameters, we divided the study years into four periods.
As presented in Figure 11, the findings indicated a large ET and small ΔS during 1986–1993. This low amount of ΔS was caused by a higher ET loss due to higher temperature differences between the maximum and minimum temperature. During 1993–1997, the ΔS exhibited an increasing pattern due to a reduction in ET. To examine which factor influences ET reduction with the increasing temperature in the watershed, we performed trend tests for ET, PET, and temperature terms in the Hargreaves equation. As shown in Table 3, the M–K test indicated a decreasing trend of PET and ET. The term (Tmax − Tmin) in the Hargreaves equation showed a significant decrease by 0.046 °C/year while (Tmax + Tmin)/2 increased by 0.044 °C/year. The more significant decreasing rate in (Tmax − Tmin) than the increase of (Tmax + Tmin)/2 resulted in reducing PET calculated by the Hargreaves method. This reduction in the PET leads to a decline in ET estimated by the Budyko-type relation. Reduction in rainfall after 1997 further induced a decrease in ET and ΔS due to limited water supply. From 1997–2015, a decline in rainfall further induced a decrease in ET, which outweighed the increasing temperature. Our results suggest that the scarcity of available water is getting worse, along with abrupt changes in temperature, rainfall, and streamflow. The accelerated reduction of ET and ΔS after 1997 may be related to severe drought caused by intensive El Niño events [80,81]. During 2007–2015, the ΔS exhibited an increasing pattern due to declined discharge as the ΔS is calculated as the residual of rainfall, streamflow, and evapotranspiration.
3.5. Trend Analysis
3.5.1. Temperature Trend Analysis
Results of the trend analysis indicate that the annual and seasonal maximum, average, and minimum temperatures increased significantly, as shown in Table 4. The annual minimum temperature rose faster (0.06 °C/year) than the maximum temperature (0.02 °C/year). Higher minimum temperature is beneficial to crops due to reduced chilling effects [82]. Previous studies in northern Ethiopia also found an increase in average maximum temperature of 0.04 to 0.051 °C/year from 1983 to 2016 [83].
Table 5 presents the M–K test and Sen’s slope results of the seasonal and annual mean temperatures before the changing point (1986–1993), after the changing point (1994–2015), and full period (1986–2015). Significant increasing trends were detected for seasonal and annual mean temperature during the full period with the increasing rate of the Bega > the annual > the Belg > the Kiremt. Before the changing point, the seasonal mean temperature showed an insignificant increasing trend during the Bega and Kiremt seasons. After the changing point, all seasonal and annual temperatures exhibited a significant increasing trend, except for the Belg, which increased insignificantly with 0.01 °C/year. The Bega had the largest increasing rate before and after the changing point and during the full period. A study in Ethiopia between 1983 and 2012 [75] found a substantial increase in drought occurrences and temperature intensification. It is recommended that farmers should look for additional small-scale water sources and adopt drought-resistant crops to cope with the drought.
3.5.2. Rainfall Trend Analysis
Table 6 shows the M–K test and Sen’s slope results of annual and seasonal rainfall before/after the changing point and during the full period. Annual and the Belg season rainfall significantly decreased by 8.32 mm/year and 5.57 mm/year during 1986–2015. Before the changing point (1986–1997), there was a significant reduction in the Kiremt and Belg rainfall. However, after the shifting point (1998–2015), only the Bega showed a significant decline. The mixed decreasing and increasing trend in annual and seasonal rainfall before and after the changing point might result from the high variability of the Bilate catchment’s rainfall. Ethiopia’s central Rift Valley region also experienced mixed trends; for instance, the Kiremt and Belg seasons and annual rainfall showed a decreasing trend, but a statistically insignificant increasing trend was demonstrated in the Bega season from 1983–2014 [19].
3.5.3. Streamflow Trend Analysis
Seasonal and annual streamflow trends before the changing point (1986–2007), after the changing point (2008–2015), and during the entire study period (1986–2015) were examined and summarized, as shown in Table 7. The Kiremt season designated a significant reduction with 2.33 mm/year before the changing point and 7.15 mm/year after the changing point. Before the changing point, the Belg season and annual streamflow significantly decreased. The entire study period exhibited a statistically significant decreasing trend for the annual streamflow with a 3.64 mm/year. The seasonal time scale also significantly decreased, with the most considerable reduction of 2.04 mm/year in the Kiremt season. This finding indicates that the amount of surface water in the watershed decreases from time to time. The decline in streamflow in the watershed is mainly caused by reduced rainfall. Such a significant reduction of available water resources can result in water stress and failure of crop yield.
4. Discussion
4.1. Variability Analysis of Hydroclimatic Variables
With enormous domestic and agricultural water demands [26,28], the Bilate watershed is highly water-stressed and vulnerable to climate change. The Belg (FMAM) and the Kiremt (JJAS) seasons account for 85% of annual rainfall, with peaks in July and August and the lowest was in December (Figure 2). With the mean minimum of 11.25 °C to the mean maximum of 27.86 °C, the study area has a high diurnal variation. The high diurnal temperature variation of Ethiopian river basins was also found in the Gilgel Abay watershed of the Blue Nile Basin [14]. Temperature anomaly also designated the increased frequency of hot days and nights than cold days and nights. Similar findings were exhibited in the Blue Nile Basin [50] and the entirety of Ethiopia [8,75].
In the Bilate watershed, the El Niño events are negatively correlated with the Kiremt rainfall and positively with the Belg rainfall. However, the La Niña episodes showed a positive relationship with the Kiremt and a negative with the Belg rainfall. As shown in the previous studies, the weakening of Kiremt rain resulted in a devastating drought and the 1984 famine in Ethiopia was correlated with El Niño [84]. The rainfall anomaly also witnessed interannual variability in the Bilate watershed with more profoundly below-mean rainfall since the 1990s, which indicated that the study area was relatively drier in the 20th century. Recent studies in the Rift Valley Lakes Basin, which encompasses the Bilate watershed, also showed higher rainfall variability and frequent drought events [29,33]. The rainfall variability and reduction in amount affect the agricultural activities over the Bilate watershed [30]. Annual and seasonal streamflow variability is consistent with the rainfall, which is in line with the results presented in [76,84,85]. Therefore, factors that modulate the rainfall variability should be considered when studying the inter-annual streamflow alterations in the Bilate.
4.2. Detection of Hydroclimatic Variables Changing Points
The abrupt change in hydroclimatic variables showed an upward shift in temperature and a downward change in rainfall and streamflow. The changing point of annual and seasonal mean temperature occurred in 1993. Similarly, the Kulfo watershed in the southern part of the Bilate watershed exhibited an average temperature increasing shift in 1993 [32]. This abrupt increase in temperature in the area might contribute to droughts in the 1990s. Ethiopia suffered a drought in 1993/94, and food shortages reached five million tons [86]. We found similar results in studies in the nearby Gidabo catchment, Rift Valley Lakes Basin [18], and the Omo-Ghibe Basin west of the Rift Valley Lakes Basin [31].
Unlike temperature, rainfall and streamflow showed a sudden downward shift in the Bilate watershed. Belg and annual rainfall designated a significant decreasing change in 1997 by 24.7% and 11%, respectively. The decrease in rainfall after 1997 in the Bilate resulted in lower food production and disease outbreaks such as malaria and cholera [36].
Studies in the nearby Gidabo catchment [18], Omo-Gibe Basin [31], and the Upper Blue Nile Basin [22] presented comparable findings. The streamflow analysis identified a downward shift with a more considerable reduction in the Belg season by 53% after the changing point. This downward shift also resulted in one of the most extreme drought years in history, mainly affecting southern Ethiopia. About 26,000 livestock died during the 2008 drought in the region [87]. The decrease in streamflow was more significant than rainfall. The higher streamflow reduction than rainfall might result from a combined effect of a decline in the rain and other anthropogenic impacts [82,88].
The changing points in the study area could be related to climatic factors such as El Niño and La Nina events. For instance, the decreasing shift in rainfall after 1997 in the Bilate watershed matched with the 1997/98 intense El Niño year [36]. As La Niña reduces the Belg season rainfall in southern Ethiopia, the abrupt downward shift of the Bilate watershed streamflow in 2007/2008 attributed to the intense La Niña episodes [89]. Therefore, we suggest that the shifting points captured by the changing point detection methods in the Bilate watershed are related to these ENSO events. Similarly, the ENSO phenomenon shifted climatic variable patterns over different regions of the world. For example, studies on surface air temperatures in Saudi Arabia [90] and climate extremes in southern China [91] showed a significant change for most stations in the 1997/1998 El Niño year. In addition, studies in Malaysia exhibited a changing point of rainfall and temperature in 1997/98 and in 2001/2002, which were related to El Niño and La Niña events [92,93]. However, the other oscillations like Atlantic Multi-decadal Oscillation (AMO) and Indian Ocean Dipole (IOD) have a weak correlation with southern Ethiopian rainy seasons [37,84]. In addition, [94] revealed that AMO and IOD had less influence on the urban center of Ethiopian rainy seasons and annual rainfall extremes. Therefore, the shifting points captured by the changing point detection methods are less likely related to AMO and IOD.
4.3. Hydroclimatic Variables Trend Analysis
To examine the effects of changing points on the trend of hydro-climatic variables in the Bilate watershed, we carried out an M–K test for the entire period, before and after the changing point. The M–K test showed a statically insignificant trend except in the Belg season for temperature before the changing point (Table 5) and for the streamflow after the changing point except in the Kiremt season (Table 7), but it exhibited a significant trend in all seasonal and annual basis for the entire study period. This insignificant trend in most seasons before and after the changing point indicates a decrease in the statistical significance of hydroclimatic variable trends as the data years are limited or below ten years, which the World Meteorological Organization (WMO) recommends for data-scarce regions [95]. Correspondingly, a study in Chile estimating annual maximum and minimum flow trends [96] revealed higher uncertainty and less significance of trend results for the limited data length than longer years.
The Rift Valley Lakes Basin encompasses Bilate, Kulfo, and other watersheds with varied topography and climate patterns. Recent hydroclimatic variable trend studies on the two watersheds, the Kulfo [32] in the south and the Mojo [34] north of the Bilate watershed, were compared with our findings. The Bilate, Kulfo, and Mojo watersheds drainage areas are 5518 km2, 127.09 km2, and 1984.96 km2. The following discussions are based on numbers presented in Table 8 adopted from data presented in recent studies for the Kulfo [32] and the Mojo [34] watersheds.
The increasing trend of annual average temperature in the Bilate watershed is higher than that in the Kulfo (Table 8). The increase in temperature overall Ethiopia is 0.025 °C/year since 1960 [8]. This study’s trend test revealed that the climate has become warmer in the Bilate watershed during the past 30 years than in the other catchments. The annual mean minimum temperature is more profoundly increasing in the Bilate than the other two watersheds. The increasing rate in the minimum temperature in the Bilate watershed is higher than the maximum, which agrees with the findings in central Ethiopia [8]. The higher increasing rate in the minimum temperature indicated that the overall increase in the watershed’s annual temperature is mainly attributed to the minimum temperature increase.
The Bilate had a decrease in annual rainfall by 8.32 mm/year, but the Mojo and the Kulfo were increased by 3.85 mm/year and 3.89 mm/year, respectively. The most considerable decrease in the Belg rainfall in the Bilate accounted for a declining trend in the annual rainfall. However, the increase in annual rainfall in the Mojo watershed was attributed to the increase in Kiremt rainfall, and the Kulfo is regulated by the Bega rainfall (Table 8). The substantial decrease in annual and seasonal rainfall in the Bilate watershed indicated that the watershed is drier than the Mojo and the Kulfo watersheds.
The Bilate and the Mojo watersheds’ annual mean streamflow decreased by 3.64 mm/year and 0.04 mm/year. However, the Kulfo showed an increasing trend by 0.25 mm/year. During the Kiremt season, the streamflow reduction in the Bilate is more than that in the Mojo. On the other hand, the Kulfo showed a slightly increasing trend (Table 8). A declining and increasing annual streamflow trend in the Bilate and Kulfo watershed was consistent with the annual rainfall trend. However, there was a slight reduction in annual streamflow as rainfall increased in the Mojo watershed due to overexploitation of water for industrial activities [79]. The more considerable streamflow decrease in the Bilate watershed than the other two watersheds implies that the Bilate is profoundly under water scarcity than the Mojo and Kulfo watersheds. Therefore, it is highly recommended to adopt watershed management schemes against water scarcity issues in the Bilate watershed.
5. Conclusions
This study investigated the change and variability of rainfall, temperature, and streamflow in the Bilate watershed from 1986 to 2015. The data were analyzed using the coefficient of variation, standardized anomaly index, Mann–Kendall trend test, Sen’s slope estimator, and three changing point detection tests (Pettitt, SNH, and BR). Variations in rainfall and streamflow are consistent of having high variability during the Belg and the Bega seasons compared to the Kiremt season. This higher seasonal rainfall and streamflow variation, especially in the Belg season, one of the crop growing seasons, impacts water availability and agricultural production. The variability of the maximum and the minimum temperatures were less significant than those of the rainfall and streamflow. However, the basin has experienced drier conditions since the 1990s, which indicates that water scarcity in the 20th century in the Bilate watershed was more severe than it was in previous years.
Results of changing point analysis in rainfall and streamflow exhibited a significant decreasing change in the annual and Belg time series at a 5% significance level. However, temperature designated an upward shift. The changing point analysis revealed that the rainfall and streamflow detection points of both annual and Belg season shifting points occurred in the 1997/1998 and 2007/2008 El Niño and La Niña years. These changing points are possibly related to ENSO episodes.
The Mann–Kendall trend test and Sen’s slope estimator showed a significant increasing temperature trend with a faster increasing rate of minimum temperature than the maximum. This indicates the overall rise in the watershed’s annual temperature, mainly attributed to the minimum temperature increase. On the other hand, the annual and Belg rainfall exhibited a substantial decrease in the entire study period, while the Bega and Kiremt showed an insignificant decreasing trend. Besides, the annual and seasonal streamflow revealed a significant decreasing trend. Thus, a consistent decreasing pattern in annual and seasonal rainfall and streamflow was observed. The significant increase in temperature and substantial decline in rainfall caused streamflow reduction and resulted in water scarcity in the Bilate watershed.
The Bilate River is the primary water source for domestic and agricultural usages of the surrounding communities. Thus, the erratic nature of rainfall and water scarcity could severely affect agricultural productivity during the crop growing seasons. Therefore, concerned bodies in the Bilate watershed should construct appropriate multipurpose infrastructures such as reservoirs and water harvesting ponds to store the excess water in the rainy seasons for the dry season. The reduction and variability of streamflow in the Bilate catchment require urgent considerations of adopting better water management strategies, developing adaption measures against impacts of climatic change, and implementing regulations for watershed conservations. Results of this study improved our understanding of annual and seasonal hydroclimatic variability in the Bilate watershed. Further investigation is recommended to quantify land-use and climate change effects using rainfall-runoff modeling and proper utilization of the scarce water resources in the watershed.
Author Contributions
Y.A.O. was responsible for data analysis and writing the draft. M.-H.L. supervised and instructed the analyses of the results and modified the manuscript. All authors have read and agreed to the published version of the manuscript.
Funding
This study was partially supported by the Ministry of Science and Technology, Taiwan (MOST 109-2116-M-008-030).
Data Availability Statement
Data will be available upon request to the authors.
Acknowledgments
This study was partially supported by the Ministry of Science and Technology, Taiwan (MOST 109-2116-M-008-030). We are grateful to the National Meteorological Agency of Ethiopia (NMA) for providing the data on temperature and rainfall. The same gratitude goes to the Department of Water, Irrigation, and Electricity (MoWIE) for providing the hydrological and spatial data.
Conflicts of Interest
The authors declare no conflict of interest.
References
- Alemu, M.M.; Bawoke, G.T. Analysis of spatial variability and temporal trends of rainfall in Amhara region, Ethiopia. J. Water Clim. Chang. 2020, 11, 1505–1520. [Google Scholar] [CrossRef]
- Tadese, M.T.; Kumar, L.; Koech, R.; Zemadim, B. Hydro-Climatic Variability: A Characterisation and Trend Study of the Awash River Basin, Ethiopia. J. Hydrol. 2019, 6, 35. [Google Scholar] [CrossRef] [Green Version]
- Sharma, T.; Vittal, H.; Karmakar, S.; Ghosh, S. Increasing agricultural risk to hydro-climatic extremes in India. J. Environ. Res. Lett. 2020, 15, 1–10. [Google Scholar] [CrossRef]
- Roy, A.; Haider, M.Z. Stern review on the economics of climate change: Implications for Bangladesh. Int. J. Clim. Chang. Strateg. Manag. 2019, 11, 100–117. [Google Scholar] [CrossRef]
- Pichs-Madruga, O.R.; Sokona, Y.; Farahani, E.; Kadner, S.; Seyboth, K.; Adler, A.; Baum, I.; Brunner, S.; Eickemeier, P.; Kriemann, J.; et al. (Eds.) IPCC. Mitigation of Climate Change. Contribution of Working Group III to the Fifth Assessment Report of the Intergovernmental Panel on Climate Change; Cambridge University Press: Cambridge, UK; New York, NY, USA, 2014; pp. 1–1435. [Google Scholar]
- Boko, M.; Niang, I.; Nyong, A.; Vogel, C.; Githeko, A.; Medany, M.; Osman Elasha, B.; Tabo, R.; Yanda, P. Climate change: Impacts, adaptation and vulnerability. Contribution of working group II to the fourth assessment report of the intergovernmental panel on climate change. J. Environ. Qual. 2007, 37, 433–467. [Google Scholar]
- Viste, E.; Korecha, D.; Sorteberg, A. Recent drought and precipitation tendencies in Ethiopia. J. Theor. Appl. Climatol. 2013, 112, 535–551. [Google Scholar] [CrossRef] [Green Version]
- Ministry of Environment and Forest (MEF). Ethiopia’s Second National Communication to the United Nations Framework Convention on Climate Change (UNFCCC); Ministry of Environment and Forest (MEF): Addis Ababa, Ethiopia, 2015; pp. 1–235.
- Prevention, D. Preparedness Agency (DPPA) Flash Appeal for the 2006 Flood Disaster in Ethiopia; Joint government and humanitarian Partners: Addis Ababa, Ethiopia, 2006; pp. 1–29. [Google Scholar]
- Moges, S.; Alemu, Y.; Mcfeeters, S. Flooding in Ethiopia: Recent History and 2006 Flood: Implications for the Nile Basin in Water Resources Management in Ethiopia: Implications for the Nile Basin; Helmut Kloos, W.L., Ed.; Cambria Press: Amherst, MA, USA, 2010; pp. 285–305. [Google Scholar]
- Tazeze, A.; Haji, J.; Ketema, M. Climate change adaptation strategies of smallholder farmers: The case of Babilie District, East Harerghe Zone of Oromia Regional State of Ethiopia. J. Econ. Sustain. Dev. 2012, 3, 1–12. [Google Scholar]
- Thiemann, S.; Förch, G. Water resources assessment in the Bilate river catchment-precipitation variability. In Proceedings of the Lake Abaya Research Symposium, Arba Minch, Ethiopia, 4–7 June 2005; pp. 53–78. [Google Scholar]
- Korecha, D.; Barnston, A.G. Predictability of June–September rainfall in Ethiopia. J. Mon. Weather Rev. 2007, 135, 628–650. [Google Scholar] [CrossRef]
- Ayele, H.S.; Li, M.-H.; Tung, C.-P.; Liu, T.-M. Impact of climate change on runoff in the Gilgel Abbay watershed, the upper Blue Nile Basin, Ethiopia. Water 2016, 8, 380. [Google Scholar] [CrossRef] [Green Version]
- Nyssen, J.; Vandenreyken, H.; Poesen, J.; Moeyersons, J.; Deckers, J.; Haile, M.; Salles, C.; Govers, G. Rainfall erosivity and variability in the Northern Ethiopian Highlands. J. Hydrol. 2005, 311, 172–187. [Google Scholar] [CrossRef]
- Berhanu, B.; Seleshi, Y.; Melesse, A.M. Surface water and groundwater resources of Ethiopia: Potentials and challenges of water resources development. In Nile River Basin: Ecohydrological Challenges, Climate Change and Hydropolitics; Springer: Berlin, Germany, 2014; pp. 97–117. [Google Scholar] [CrossRef]
- Dralle, D.N.; Karst, N.J.; Thompson, S.E. Dry season streamflow persistence in seasonal climates. J. Water Resour. Res. 2016, 52, 90–107. [Google Scholar] [CrossRef] [Green Version]
- Belihu, M.; Abate, B.; Tekleab, S.; Bewket, W. Hydro-meteorological trends in the Gidabo catchment of the Rift Valley Lakes Basin of Ethiopia. J. Phys. Chem. Earth 2018, 104, 84–101. [Google Scholar] [CrossRef]
- Matewos, T.; Tefera, T. Local level rainfall and temperature variability in drought-prone districts of rural Sidama, central rift valley region of Ethiopia. J. Phys. Geogr. 2020, 41, 36–53. [Google Scholar] [CrossRef]
- Gedefaw, M.; Wang, H.; Yan, D.; Song, X.; Yan, D.; Dong, G.; Wang, J.; Girma, A.; Ali, B.A.; Batsuren, D. Trend analysis of climatic and hydrological variables in the Awash River Basin, Ethiopia. Water 2018, 10, 1554. [Google Scholar] [CrossRef] [Green Version]
- Tekleab, S.; Mohamed, Y.; Uhlenbrook, S. Hydro-climatic trends in the Abay/upper Blue Nile basin, Ethiopia. J. Phys. Chem. Earth 2013, 61, 32–42. [Google Scholar] [CrossRef]
- Elzeiny, R.; Khadr, M.; Zahran, S.; Rashwan, E. Homogeneity Analysis of Rainfall Series in the Upper Blue Nile River Basin, Ethiopia. J. Eng. Res. 2019, 3, 46–53. [Google Scholar] [CrossRef]
- Djan’na, H.K.; Tall, M.; Amoussou, E.; Mumtaz, M.; Adounkpe, J.; Atchonouglo, K. Trend Analysis of Hydroclimatic Historical Data and Future Scenarios of Climate Extreme Indices over Mono River Basin in West Africa. Am. J. Rural Dev. 2020, 8, 37–52. [Google Scholar] [CrossRef]
- Tesemma, Z.K.; Mohamed, Y.A.; Steenhuis, T.S. Trends in rainfall and runoff in the Blue Nile Basin: 1964–2003. J. Hydrol. Process. 2010, 24, 3747–3758. [Google Scholar] [CrossRef] [Green Version]
- Tekle, A. Assessment of climate change impact on water availability of Bilate watershed, Ethiopian Rift Valley Basin. In Proceedings of the AFRICON 2015, Addis Ababa, Ethiopia, 14–17 September 2015; pp. 1–5. [Google Scholar]
- Esayas, B.; Simane, B.; Teferi, E.; Ongoma, V.; Tefera, N. Climate variability and farmers’ perception in Southern Ethiopia. J. Adv. Meteorol. 2019, 2019, 1–19. [Google Scholar] [CrossRef]
- Girma, M.M.A.; Seleshi, B. Irrigation Practices in Ethiopia: Characteristics of Selected Irrigation Schemes; IWMI: Addis Ababa, Ethiopia, 2007; Volume 124. [Google Scholar]
- Molla, D.D.; Tegaye, T.A.; Fletcher, C.G. Simulated surface and shallow groundwater resources in the Abaya-Chamo Lake basin, Ethiopia using a spatially-distributed water balance model. J. Hydrol. Reg. Stud. 2019, 24, 1–17. [Google Scholar] [CrossRef]
- Moloro, T.L. Spatio-Temporal Analysis of Rainfall Variability and Meteorological Drought: A Case Study in Bilate River Basin, Southern Rift Valley, Ethiopia. Int. J. Environ. Sci. Nat. Res. 2018, 14, 76–89. [Google Scholar] [CrossRef]
- Wodaje, G.G.; Eshetu, Z.; Argaw, M. Temporal and spatial variability of rainfall distribution and evapotranspiration across altitudinal gradient in the Bilate River Watershed, Southern Ethiopia. J. AJEST 2016, 10, 167–180. [Google Scholar] [CrossRef]
- Jaweso, D.; Abate, B.; Bauwe, A.; Lennartz, B. Hydro-meteorological trends in the upper Omo-Ghibe river basin, Ethiopia. Water 2019, 11, 1951. [Google Scholar] [CrossRef] [Green Version]
- Pingale, S.M.; Mekonnen, A.; Hatiye, S.D. Trends and abrupt changes in hydro-climatic variables in a Kulfo catchment, Ethiopia. In Proceedings of the 18th International Conference on Sustainable Water Resources Development, Arba Minch, Ethiopia, 8–9 June 2018; pp. 1–17. [Google Scholar]
- Tesfamariam, B.G.; Gessesse, B.; Melgani, F. Characterizing the spatiotemporal distribution of meteorological drought as a response to climate variability: The case of rift valley lakes basin of Ethiopia. J. Weather. Clim. Extrem. 2019, 26, 1–15. [Google Scholar] [CrossRef]
- Eshetu, M. Hydro-Climatic Variability and Trend Analysis of Modjo River Watershed, Awash River Basin of Ethiopia. J. Hydrol. Curr. Res. 2020, 11, 1–8. [Google Scholar]
- Hussen, B.; Mekonnen, A.; Pingale, S.M. Integrated water resources management under climate change scenarios in the sub-basin of Abaya-Chamo, Ethiopia. J. Model. Earth Syst. Environ. 2018, 4, 221–240. [Google Scholar] [CrossRef]
- Wolde-Georgis, T.; Aweke, D.; Hagos, Y. The Case of Ethiopia Reducing the Impacts of Environmental Emergencies through Early Warning and Preparedness: The Case of the 1997–98 El Niño; National Meteorological Service Agency (NMSA): Addis Ababa, Ethiopia, 2000; pp. 1–73. [Google Scholar]
- Wagesho, N.; Goel, N.; Jain, M. Temporal and spatial variability of annual and seasonal rainfall over Ethiopia. J. Hydrol. Sci. J. 2013, 58, 354–373. [Google Scholar] [CrossRef]
- Kraus, E. Subtropical droughts and cross-equatorial energy transports. J. Mon. Weather. Rev. 1977, 105, 1009–1018. [Google Scholar] [CrossRef] [Green Version]
- Everitt, B.; Skrondal, A. The Cambridge Dictionary of Statistics, 4th ed.; Cambridge University Press Cambridge: Cambrige, UK, 2002; Volume 106. [Google Scholar]
- Kendall, M. Rank Correlation Methods, 4th ed.; Charles Griffin: London, UK, 1975. [Google Scholar]
- Mann, H.B. Nonparametric tests against trend. J. Econom. Soc. 1945, 13, 245–259. [Google Scholar] [CrossRef]
- Sen, P.K. Estimates of the regression coefficient based on Kendall’s tau. J. Am. Stat. Assoc. 1968, 63, 1379–1389. [Google Scholar] [CrossRef]
- Bartier, P.M.; Keller, C.P. Multivariate interpolation to incorporate thematic surface data using inverse distance weighting (IDW). J. Comput. Geosci. 1996, 22, 795–799. [Google Scholar] [CrossRef]
- Lu, G.Y.; Wong, D.W. An adaptive inverse-distance weighting spatial interpolation technique. J. Comput. Geosci. 2008, 34, 1044–1055. [Google Scholar] [CrossRef]
- Nalder, I.A.; Wein, R.W. Spatial interpolation of climatic normals: Test of a new method in the Canadian boreal forest. Agric. For. Meteorol. 1998, 92, 211–225. [Google Scholar] [CrossRef]
- Spiegel, M.R.; Stephens, L. Theory and Problems of Statistics, Schaum’s Outline Series; McGraw-Hill: New York, NY, USA, 1961; pp. 1–549. [Google Scholar]
- Phogat, V.; Yadav, A.; Malik, R.; Kumar, S.; Cox, J. Simulation of salt and water movement and estimation of water productivity of rice crop irrigated with saline water. Paddy Water Environ. 2010, 8, 333–346. [Google Scholar] [CrossRef]
- Sokal, R.R. The Principles and Practice of Statistics in Biological Research, 3rd ed.; W.H. Freeman: New York, NY, USA, 1995; Volume 15, pp. 451–554. [Google Scholar]
- Bekele, D.; Alamirew, T.; Kebede, A.; Zeleke, G.; Melese, A.M. Analysis of rainfall trend and variability for agricultural water management in Awash River Basin, Ethiopia. J. Water Clim. Chang. 2017, 8, 127–141. [Google Scholar] [CrossRef] [Green Version]
- Asfaw, A.; Simane, B.; Hassen, A.; Bantider, A. Variability and time series trend analysis of rainfall and temperature in northcentral Ethiopia: A case study in Woleka sub-basin. J. Weather. Earth Clim. Extrem. 2018, 19, 29–41. [Google Scholar] [CrossRef]
- Eshetu, G.; Johansson, T.; Garedew, W. Rainfall trend and variability analysis in Setema-Gatira area of Jimma, Southwestern Ethiopia. Afr. J. Agric. Res. 2016, 11, 3037–3045. [Google Scholar] [CrossRef]
- Xiong, L.; Guo, S. Trend test and change-point detection for the annual discharge series of the Yangtze River at the Yichang hydrological station. J. Hydrol. Sci. 2011, 49, 99–112. [Google Scholar] [CrossRef] [Green Version]
- Buishand, T.A. Some methods for testing the homogeneity of rainfall records. J. Hydrol. Reg. Stud. 1982, 58, 11–27. [Google Scholar] [CrossRef]
- Alexandersson, H.; Moberg, A. Homogenization of Swedish temperature data. Part I: Homogeneity test for linear trends. Int. J. Climatol. 1997, 17, 25–34. [Google Scholar] [CrossRef]
- Pettitt, A.N. A non-parametric approach to the change-point problem. J. R. Stat. Soc. 1979, 28, 126–135. [Google Scholar] [CrossRef]
- Zarenistanak, M.; Dhorde, A.G.; Kripalani, R. Trend analysis and change point detection of annual and seasonal precipitation and temperature series over southwest Iran. J. Earth Syst. Sci. 2014, 123, 281–295. [Google Scholar] [CrossRef]
- Praveen, B.; Talukdar, S.; Mahato, S.; Mondal, J.; Sharma, P.; Islam, A.R.M.T.; Rahman, A. Analyzing trend and forecasting of rainfall changes in India using non-parametrical and machine learning approaches. J. Sci. Rep. 2020, 10, 1–21. [Google Scholar] [CrossRef]
- Jaiswal, R.; Lohani, A.; Tiwari, H. Statistical analysis for change detection and trend assessment in climatological parameters. J. Environ. Process. 2015, 2, 729–749. [Google Scholar] [CrossRef] [Green Version]
- Adeboye, O.B.; Alatise, M.O. Performance of probability distributions and plotting positions in estimating the flood of river Osun at Apoje Sub-basin, Nigeria. Int. J. Agric. Eng. 2007, 9, 1–21. [Google Scholar]
- Kundzewicz, Z.W.; Radziejewski, M. Methodologies for trend detection. J. IAHS 2006, 308, 538. [Google Scholar]
- Huth, R. Parametric versus non-parametric estimates of climatic trends. J. Theor. Appl. Climatol. 2004, 77, 107–112. [Google Scholar] [CrossRef]
- Yue, S.; Pilon, P.; Cavadias, G. Power of the Mann–Kendall and Spearman’s rho tests for detecting monotonic trends in hydrological series. J. Hydrol. 2002, 259, 254–271. [Google Scholar] [CrossRef]
- Douglas, E.; Vogel, R.; Kroll, C. Trends in floods and low flows in the United States: Impact of spatial correlation. J. Hydrol. 2000, 240, 90–105. [Google Scholar] [CrossRef]
- Hussain, F.; Nabi, G.; Boota, M.W. Rainfall trend analysis by using the Mann-Kendall test & Sen’s slope estimates: A case study of district Chakwal rain gauge, barani area, northern Punjab province, Pakistan. Int. J. Agric. Eng. 2015, 27, 3159–3165. [Google Scholar]
- Al-Hasani, A. Trend analysis and abrupt change detection of streamflow variations in the lower Tigris River Basin, Iraq. Int. J. River Basin Manag. 2020, 1–12. [Google Scholar] [CrossRef]
- Ahmad, I.; Tang, D.; Wang, T.; Wang, M.; Wagan, B. Precipitation trends over time using Mann-Kendall and spearman’s rho tests in swat river basin, Pakistan. J. Adv. Meteorol. 2015, 2015, 1–15. [Google Scholar] [CrossRef] [Green Version]
- Weldegerima, T.M.; Zeleke, T.T.; Birhanu, B.S.; Zaitchik, B.F.; Fetene, Z.A. Analysis of rainfall trends and its relationship with SST signals in the Lake Tana Basin, Ethiopia. J. Adv. Meteorol. 2018, 2018, 1–10. [Google Scholar] [CrossRef] [Green Version]
- Aguilar, C.; Polo, M. Generating reference evapotranspiration surfaces from the Hargreaves equation at watershed scale. J. Hydrol. Earth Syst. Sci. 2011, 15, 2495–2508. [Google Scholar] [CrossRef] [Green Version]
- Dingman, S.L. Physical Hydrology, 3rd ed.; Waveland Press: Long Grove, IL, USA, 2015; pp. 1–657. [Google Scholar]
- Senay, G.; Leake, S.; Nagler, P.; Artan, G.; Dickinson, J.; Cordova, J.; Glenn, E. Estimating basin scale evapotranspiration (ET) by water balance and remote sensing methods. J. Hydrol. Process. 2011, 25, 4037–4049. [Google Scholar] [CrossRef]
- Pike, J. The estimation of annual runoff from meteorological data in a tropical climate. J. Hydrol. 1964, 2, 116–123. [Google Scholar] [CrossRef]
- Enyew, B.; Steeneveld, G. Analysing the impact of topography on precipitation and flooding on the Ethiopian highlands. J. Geol. Geosci. 2014, 3, 1–6. [Google Scholar] [CrossRef] [Green Version]
- Teyso, T.A.; Anjulo, A. Reports. Spatio-temporal Variability and Trends of Rainfall and Temperature over Gamo Gofa Zone, Ethiopia. J. Sci. Res. 2016, 12, 1–11. [Google Scholar] [CrossRef]
- Hessebo, M.T.; Woldeamanuel, T.; Tadesse, M. Spatial and temporal climate variability and change in the Bilate catchment, central Rift Valley lakes region, Ethiopia. J. Phys. Geogr. 2019, 42, 1–27. [Google Scholar] [CrossRef]
- Suryabhagavan, K. GIS-based climate variability and drought characterization in Ethiopia over three decades. J.Weather. Clim. Extrem. 2017, 15, 11–23. [Google Scholar] [CrossRef]
- Abtew, W.; Melesse, A.M. Dessalegne. El Niño southern oscillation link to the Blue Nile River basin hydrology. J. Hydrol. Process. 2009, 23, 3653–3660. [Google Scholar] [CrossRef]
- Seleshi, Y.; Zanke, U. Recent changes in rainfall and rainy days in Ethiopia. Int. J. Climatol. 2004, 24, 973–983. [Google Scholar] [CrossRef]
- Ndikumana, J. Coping Mechanisms and Their Efficacy in Disaster-Prone Pastoral Systems of the Greater Horn of Africa: Effects of the 1995-97 Drought and the 1997-98 El Niño Rains and the Responses of Pastoralists and Livestock; International Livestock Research Institute: Nairobi, Kenya, 2000; pp. 1–111. [Google Scholar]
- Zena, K.; Adugna, T.; Fufa, F. Trend Analysis of Climate variables, Streamflow and their Linkage at Modjo River Watershed, Central Ethiopia. J. Environ. Syst. Res. 2020, 1–35. [Google Scholar] [CrossRef]
- Wolde-Georgis, T. El Nino and drought early warning in Ethiopia. J. Afr. Stud. 1997, 1, 1–10. [Google Scholar]
- Schultz, H. Water in a warmer world—Is atmospheric evaporative demand changing in viticultural areas. In Proceedings of the BIO Web of Conferences, Geisenheim, Germany, 19 February 2019; pp. 1–5. [Google Scholar]
- Getahun, Y.S.; Li, M.-H.; Chen, P.-Y. Assessing Impact of Climate Change on Hydrology of Melka Kuntrie Subbasin, Ethiopia with Ar4 and Ar5 Projections. Water 2020, 12, 1308. [Google Scholar] [CrossRef]
- Berhane, A.; Hadgu, G.; Worku, W.; Abrha, B. Trends in extreme temperature and rainfall indices in the semi-arid areas of Western Tigray, Ethiopia. J. Environ. Syst. Res. 2020, 9, 1–20. [Google Scholar] [CrossRef] [Green Version]
- Degefu, M.A.; Rowell, D.P.; Bewket, W. Teleconnections between Ethiopian rainfall variability and global SSTs: Observations and methods for model evaluation. J. Meteorol. Atmos. Phys. 2017, 129, 173–186. [Google Scholar] [CrossRef] [Green Version]
- Samy, A.; Ibrahim, M.G.; Mahmod, W.E. Analysis of Stream Flow Trends in Sub-basins of the Upper Blue Nile Basin. In Recent Advances in Environmental Science from the Euro-Mediterranean and Surrounding Regions; Kallel, A., Ksibi, M., Ben Dhia, H., Khélifi, N., Eds.; Springer: Cham, Germany, 2018; Volume 1, pp. 819–822. [Google Scholar]
- Devereux, S. Food Insecurity in Ethiopia: A Discussion Paper for DFID; Institute of Development Studies: Brighton, UK, 2000; Volume 14, pp. 1–16. [Google Scholar]
- Mohammed, Y.; Yimer, F.; Tadesse, M.; Tesfaye, K. Meteorological drought assessment in north east highlands of Ethiopia. Int. J. Clim. Chang. Strateg. Manag. 2018, 10, 142–160. [Google Scholar] [CrossRef] [Green Version]
- Zhao, J.; Huang, S.; Huang, Q.; Wang, H.; Leng, G. Detecting the dominant cause of streamflow decline in the Loess Plateau of china based on the latest Budyko equation. Water 2018, 10, 1277. [Google Scholar] [CrossRef] [Green Version]
- Gunta, S.; Manjunatha, B.; Bhta, H.G. Monthly to Inter-Decadal Rainfall Variability of the Southern Regional Sate of Ethiopia, Links with El Niño-Southern Oscillation. Glob. J. Sci. Front. Res. 2019, 19, 21p. [Google Scholar]
- Almazroui, M.; Hasanean, H.; Al-Khalaf, A.; Basset, H.A. Detecting climate change signals in Saudi Arabia using mean annual surface air temperatures. Theor. Appl. Climatol. 2013, 113, 585–598. [Google Scholar] [CrossRef]
- Fischer, T.; Gemmer, M.; Liu, L.; Su, B. Change-points in climate extremes in the Zhujiang River Basin, South China, 1961–2007. J. Clim. Chang. 2012, 110, 783–799. [Google Scholar] [CrossRef]
- Suhaila, J.; Yusop, Z. Trend analysis and change point detection of annual and seasonal temperature series in Peninsular Malaysia. Meteorol. Atmos. Phys. 2018, 130, 565–581. [Google Scholar] [CrossRef]
- Ho Ming, K.; Yusof, F. Homogeneity Tests on Daily Rainfall Series in Peninsular Malaysia. Int. J. Contemp. Math. Sci. 2012, 7, 9–22. [Google Scholar]
- Moges, S.A.; Taye, M.T.; Willems, P.; Gebremichael, M. Exceptional pattern of extreme rainfall variability at urban centre of Addis Ababa, Ethiopia. Urban Water J. 2014, 11, 596–604. [Google Scholar] [CrossRef] [Green Version]
- World Meteorological Organization Geneva. World Meteorological Organization (WMO) Guidelines on the Calculation of Climate Normals; World Meteorological Organization: Geneva, Switzerland, 2017. [Google Scholar]
- Medina, Y.; Muñoz, E. Estimation of Annual Maximum and Minimum Flow Trends in a Data-Scarce Basin. Case Study of the Allipén River Watershed, Chile. Water 2020, 12, 162. [Google Scholar] [CrossRef] [Green Version]
Figure 1.
Map of the study area: (a) the continent of Africa; (b) the entire Rift Valley Lakes Basin; (c) DEM and meteorological stations of the Bilate watershed.
Figure 1.
Map of the study area: (a) the continent of Africa; (b) the entire Rift Valley Lakes Basin; (c) DEM and meteorological stations of the Bilate watershed.

Figure 2.
Monthly mean rainfall and temperatures (minimum, average, and maximum) for the period 1986–2015.
Figure 2.
Monthly mean rainfall and temperatures (minimum, average, and maximum) for the period 1986–2015.

Figure 3.
Spatial distribution of annual and seasonal mean rainfall (mm) for the period 1986–2015: for (a) the annual, (b) the Kiremt, (c) the Belg, and (d) the Bega seasons.
Figure 3.
Spatial distribution of annual and seasonal mean rainfall (mm) for the period 1986–2015: for (a) the annual, (b) the Kiremt, (c) the Belg, and (d) the Bega seasons.

Figure 4.
Annual temperature anomaly of the Bilate watershed for the period 1986–2015: for (a) the maximum temperature, (b) the average temperature, and (c) the minimum temperature.
Figure 4.
Annual temperature anomaly of the Bilate watershed for the period 1986–2015: for (a) the maximum temperature, (b) the average temperature, and (c) the minimum temperature.

Figure 5.
Standardized rainfall anomaly of the Bilate watershed for the period 1986–2015 for (a) the annual, (b) the Kiremt, (c) the Belg, and (d) the Bega seasons.
Figure 5.
Standardized rainfall anomaly of the Bilate watershed for the period 1986–2015 for (a) the annual, (b) the Kiremt, (c) the Belg, and (d) the Bega seasons.

Figure 6.
Standardized streamflow anomalies at Bilate gauging station for the period 1986–2015.

Figure 7.
Changing point detection of temperature in the Bilate watershed for the period 1986–2015: (a) the annual and (b) the Belg season.
Figure 7.
Changing point detection of temperature in the Bilate watershed for the period 1986–2015: (a) the annual and (b) the Belg season.

Figure 8.
Changing point detection of rainfall in the Bilate watershed for the period 1986–2015: (a) the annual and (b) the Belg season.
Figure 8.
Changing point detection of rainfall in the Bilate watershed for the period 1986–2015: (a) the annual and (b) the Belg season.

Figure 9.
Changing point detection of streamflow in the Bilate watershed for the period 1986–2015: (a) the annual and (b) the Belg season.
Figure 9.
Changing point detection of streamflow in the Bilate watershed for the period 1986–2015: (a) the annual and (b) the Belg season.

Figure 10.
Exceedance probability curve of the Bilate watershed: (a) rainfall for the period 1986–1997 (before changing point) and 1998–2015 (after changing point), and (b) streamflow for the period 1986–2007 (before changing point) and 2008–2015 (after changing point).
Figure 10.
Exceedance probability curve of the Bilate watershed: (a) rainfall for the period 1986–1997 (before changing point) and 1998–2015 (after changing point), and (b) streamflow for the period 1986–2007 (before changing point) and 2008–2015 (after changing point).

Figure 11.
Implication of changes in hydrological cycles of the Bilate watershed. The symbol ↑ represents increasing trends while ↓ represents decreasing trends.
Figure 11.
Implication of changes in hydrological cycles of the Bilate watershed. The symbol ↑ represents increasing trends while ↓ represents decreasing trends.


Table 1.
Classifications of SAI.
| SAI Value | Category |
|---|---|
| 2.00 and above 1.50 to 1.99 1.00 to 1.49 −0.99 to 0.99 −1.49 to −1.00 −1.99 to −1.50 −2.00 and less | Extremely Wet Very wet Moderately Wet Near Normal Moderately Dry Severely Dry Extremely Dry |
Table 2.
Rainfall and streamflow exceedance probability of the Bilate watershed.
| EP (%) | Rainfall (mm) | Streamflow (mm) | ||
|---|---|---|---|---|
| before CP | after CP | before CP | after CP | |
| 0.1 | 27.67 | 25.82 | 3.7 | 2.6 |
| 1 | 16.6 | 16.4 | 1.9 | 1.5 |
| 10 | 8.76 | 8.15 | 1 | 0.7 |
| 25 | 5.28 | 4.67 | 0.7 | 0.5 |
| 50 | 2.14 | 1.75 | 0.3 | 0.2 |
| 75 | 0.06 | 0.02 | 0.1 | 0.1 |
| 99 | 0.0 | 0.0 | 0.0 | 0.0 |
EP refers to the exceedance probability, and CP refers to the changing point.
Table 3.
M-K trend test of annual PET, ET, (Tmax − Tmin), and (Tmax + Tmin)/2.
| PET | ET | Tmax − Tmin | (Tmax + Tmin)/2 | |
|---|---|---|---|---|
| Sen’s Slope | −0.38 | −2.71 | −0.046 | 0.044 |
| Zs | −0.88 | −5.86 | −5.86 | 5.89 |
| Trend | - | - | - | + |
+ indicates an increasing trend while - indicates a decreasing trend.
Table 4.
The M–K test and Sen’s slope results of the maximum (Tmax), the average (Tavg), and the minimum (Tmin) temperatures for the period 1986–2015.
Table 4.
The M–K test and Sen’s slope results of the maximum (Tmax), the average (Tavg), and the minimum (Tmin) temperatures for the period 1986–2015.
| Seasons | Tmax | Tavg | Tmin | |||
|---|---|---|---|---|---|---|
| Zs | Sen’s Slope | Zs | Sen’s Slope | Zs | Sen’s Slope | |
| Bega | 1.67 | 0.021 | 4.82 * | 0.047 | 4.02 * | 0.068 |
| Belg | 2.28 * | 0.031 | 3.68 * | 0.041 | 4.00 * | 0.058 |
| Kiremt | 2.18 * | 0.024 | 4.39 * | 0.039 | 4.07 * | 0.059 |
| Annual | 2.93 * | 0.019 | 5.89 * | 0.044 | 3.64 * | 0.056 |
* indicates statistically significant trends.
Table 5.
The M–K test and Sen’s slope results of seasonal and annual mean temperatures before the changing point (1986–1993), after the changing point (1994–2015), and full study period (1986–2015).
Table 5.
The M–K test and Sen’s slope results of seasonal and annual mean temperatures before the changing point (1986–1993), after the changing point (1994–2015), and full study period (1986–2015).
| Seasons | Full Period | Before CP | After CP | |||
|---|---|---|---|---|---|---|
| Zs | Sen’s Slope | Zs | Sen’s Slope | Zs | Sen’s Slope | |
| Bega | 4.82 * | 0.047 | 1.09 | 0.05 | 3.01 * | 0.04 |
| Belg | 3.68 * | 0.041 | −3.48 * | −0.06 | 1.65 | 0.01 |
| Kiremt | 4.39 * | 0.039 | 0.36 | 0.02 | 4.38 * | 0.03 |
| Annual | 5.89 * | 0.044 | −0.38 | −0.01 | 2.81 * | 0.02 |
* indicates statistically significant trends, and CP refers to the changing point.
Table 6.
The M–K test and Sen’s slope results of seasonal and annual rainfall before the changing point (1986–1997), after the changing point (1998–2015), and full study period (1986–2015).
Table 6.
The M–K test and Sen’s slope results of seasonal and annual rainfall before the changing point (1986–1997), after the changing point (1998–2015), and full study period (1986–2015).
| Seasons | Full Period | Before CP | After CP | |||
|---|---|---|---|---|---|---|
| Zs | Sen’s Slope | Zs | Sen’s Slope | Zs | Sen’s Slope | |
| Bega | −0.31 | −0.34 | 2.15 * | 7.76 | −5.15 * | −3.56 |
| Belg | −6.11 * | −5.57 | −2.18 * | −9.85 | 0.17 | 0.22 |
| Kiremt | −1.46 | −0.89 | −2.36 * | −9.25 | 0.0 | 0.07 |
| Annual | −7.53 * | −8.32 | −1.21 | −8.56 | −1.28 | −5.84 |
* indicates statistically significant trends, and CP refers to the changing point.
Table 7.
The M–K test and Sen’s slope results of seasonal and annual mean streamflow before the changing point (1986–2007), after the changing point (2008–2015), and full study period (1986–2015).
Table 7.
The M–K test and Sen’s slope results of seasonal and annual mean streamflow before the changing point (1986–2007), after the changing point (2008–2015), and full study period (1986–2015).
| Seasons | Full Period | Before CP | After CP | |||
|---|---|---|---|---|---|---|
| Zs | Sen’s Slope | Zs | Sen’s Slope | Zs | Sen’s Slope | |
| Bega | −0.21 * | −0.47 | −0.09 | −0.07 | −0.16 | −0.43 |
| Belg | −6.42 * | −1.08 | −2.17 * | −0.79 | −1.37 | −0.53 |
| Kiremt | −8.77 * | −2.04 | −3.98 * | −2.33 | −3.62 * | −7.15 |
| Annual | −8.19 * | −3.64 | −3.42 * | −3.45 | −1.84 | −7.50 |
* indicates statistically significant trends, and CP refers to the changing point.
Table 8.
Comparisons of M–K test results for temperature, rainfall, and streamflow in the Bilate, Kulufo, and Mojo watersheds.
Table 8.
Comparisons of M–K test results for temperature, rainfall, and streamflow in the Bilate, Kulufo, and Mojo watersheds.
| Parameters | Kiremt | Belg | Bega | Annual | ||||||||
|---|---|---|---|---|---|---|---|---|---|---|---|---|
| Bilate | Mojo | Kulfo | Bilate | Mojo | Kulfo | Bilate | Mojo | Kulfo | Bilate | Mojo | Kulfo | |
| Tmax (°C) | 0.02 | 0.06 | 0.03 | 0.03 | 0.05 | 0.01 | 0.02 | NA | 0.0 | 0.02 | 0.06 | 0.02 |
| Tavg (°C) | 0.03 | NA | 0.04 | 0.04 | NA | 0.04 | 0.05 | NA | 0.02 | 0.04 | NA | 0.02 |
| Tmin (°C) | 0.06 | 0.01 | 0.01 | 0.06 | 0.02 | 0.01 | 0.07 | NA | 0.0 | 0.06 | 0.01 | 0.0 |
| Rainfall (mm) | −0.89 | 2.64 | 1.01 | −5.57 | −0.03 | 0.23 | −0.34 | NA | 1.99 | −8.32 | 3.85 | 3.89 |
| Streamflow (mm) | −2.04 | −0.10 | 0.22 | −1.08 | 0.0 | 0.27 | −0.47 | NA | 0.21 | −3.64 | −0.04 | 0.25 |
NA refers to no data.
Publisher’s Note: MDPI stays neutral with regard to jurisdictional claims in published maps and institutional affiliations. |
© 2021 by the authors. Licensee MDPI, Basel, Switzerland. This article is an open access article distributed under the terms and conditions of the Creative Commons Attribution (CC BY) license (https://creativecommons.org/licenses/by/4.0/).
Share and Cite
MDPI and ACS Style
Orke, Y.A.; Li, M.-H. Hydroclimatic Variability in the Bilate Watershed, Ethiopia. Climate 2021, 9, 98. https://0-doi-org.brum.beds.ac.uk/10.3390/cli9060098
AMA Style
Orke YA, Li M-H. Hydroclimatic Variability in the Bilate Watershed, Ethiopia. Climate. 2021; 9(6):98. https://0-doi-org.brum.beds.ac.uk/10.3390/cli9060098
Chicago/Turabian StyleOrke, Yoseph Arba, and Ming-Hsu Li. 2021. "Hydroclimatic Variability in the Bilate Watershed, Ethiopia" Climate 9, no. 6: 98. https://0-doi-org.brum.beds.ac.uk/10.3390/cli9060098
Note that from the first issue of 2016, this journal uses article numbers instead of page numbers. See further details here.