1. Introduction
Iran’s climate is relatively arid, marked by low rainfall and high evapotranspiration capacity. Precipitation varies greatly between different regions, but averages about 250 mm per year for the country. Most precipitation occurs from October to March [
1].
The low amount of precipitation and high interannual variability over most of Iran lead to frequent droughts, with destructive effects in sectors such as agriculture, environment, and water resources. One factor that affects the climate of this area is El Niño–Southern Oscillation (ENSO), defined in terms of temperature and pressure patterns over the Equatorial Pacific Ocean. ENSO phase impacts precipitation, temperature, and risk of drought over Iran [
2,
3,
4,
5,
6,
7,
8,
9].
Nazemosadat and Cordery [
7] demonstrated ENSO effects on autumn and winter rainfall, which accounts for about 80% of Iran’s water resources. In autumn, a strong relationship was found between the Southern Oscillation Index (SOI)—a measure of ENSO phase—and rainfall over northwestern Iran. Nazemosadat and Ghasemi [
8] showed that, compared to neutral conditions, warm (El Niño) ENSO phases substantially reduce the occurrence probability and intensity of autumnal drought periods, particularly for southern districts of country, and increase that of wet periods, while cool (La Niña) ENSO phases have the opposite effects. Bahrami et al. [
10] concluded that differences in mean precipitation between different ENSO phase transitions are statistically significant in major parts of the Middle East, including the center and east, while temperatures did not show a significant correlation with ENSO in most areas.
Precipitation over Iran and elsewhere in the Middle East occurs primarily during the cold season and involves the orographic capture of eastward-propagating mid-latitude cyclones from the Atlantic Ocean and Mediterranean Sea. The North Atlantic storm track greatly influences the weather activity in the Mediterranean region [
11,
12,
13,
14]. For the study of such impacts as they vary by ENSO phase, a formulation of wave activity flux may be appropriate to investigate the intensity and direction of Rossby wave trains to the region. The Mediterranean storm track is at the southern branch of the wave activity originating from the North Atlantic storm track [
15,
16,
17]. Such transfer of activity can play a large part in cyclogenesis in the Mediterranean region via downstream development [
18]. Orlanski and Chang [
19] and Chang [
20] show that because of its significant contribution to the eddy kinetic energy budget, the ageostrophic geopotential flux can be used for studying and tracking of the wave packets. Nasr-Esfahany et al. [
21] compared composites of eddy kinetic energy between critical positive and negative months of the North Atlantic Oscillation (NAO), where criticality is measured by the deviation of the monthly index from its mean value. Among several conclusions, they found that the transfer of energy from the west of North Atlantic Ocean to the Mediterranean region is greater in the critical negative months than in the critical positive months. Rezaeian et al. [
22] showed that the impact of the North Atlantic storm track on the Mediterranean storm track is noticeably greater under negative NAO.
The association between ENSO and meteorological parameters in different parts of the world is well documented. However, the statistical significance of these associations in the context of changes in the Mediterranean storm track during different ENSO phase transitions has not been previously determined. Moreover, the atmospheric circulation and precipitation during these ENSO transition periods is not well recognized. Only one study by Bahrami et al. [
10] addressed this issue; however, the details of subtypes are not discussed by them, and they examined the whole Middle East and West Asia. In this current study, we considered subtypes of ENSO phase transitions and investigated the pressure pattern variations as well as Rossby wave source and wave propagation regions, breaking and transference of waves into the storm tracks. The impact on the Iran autumn precipitation anomaly for each of the eight subtypes of ENSO phase transition (detailed in next section) has been investigated.
The main aim of this study was to determine the association between ENSO phase transition (from El Niño to La Niña and vice versa) and the Mediterranean storm track during autumn, as well as with atmospheric circulation and precipitation over Iran.
The structure of the present study is as follows. First, we discuss the criteria for the different types of ENSO phase transition, as well as the meteorological data and analysis methods used in the paper. In the Results section, we show composite anomalies of autumn Northern Hemisphere wave activity flux, sea level pressure, and Iran’s precipitation over the selected cases, and compute the statistical significance of observed departures. Finally, we present the Discussion and Conclusions.
2. Data and Methodology
ENSO Transitions
There are different measures of ENSO phase, including Oceanic Niño Index (ONI), SOI, Multivariate ENSO Index (MEI), and Trans-Niño Index (TNI) [
23,
24]. Since ONI, developed by the United States National Oceanic and Atmospheric Administration Climate Prediction Center (CPC), is widely used as an indicator of ENSO teleconnections in different countries and regions [
25], we adopted it here. ONI is based on the running three-month mean sea surface temperature anomaly for the Nino 3.4 region in the Equatorial Pacific. An El Niño (or alternately, La Niña) event is characterized by ONI that is above the threshold of 0.5 °C (or alternately, below −0.5 °C) for five consecutive months. Generally, substituting other indices such as SOI or MEI does not greatly affect the list of El Niño years [
26].
Here, we studied circulation and weather patterns in Iran for autumns in 1950–2019 during the years in which ENSO transitioned from warm to cold or vice versa. These transition types are denoted as type 1 and type 2, respectively. On the basis of Iran’s climate seasonality, we considered October, November, and December (OND) as autumn season in this research. In
Table 1, El Niño (alternately, La Niña) phases are considered as strong when ONI Index is above 1 (below −1), and conversely as weak if equal or below 1 (equal to or above −1). Therefore, eight different subtypes of transition phases (four subtypes of type 1 and four subtypes of type 2, listed in
Table 1) were obtained.
Overall, out of the 70 years in 1950–2019, there were 10 that qualified as type 1 and 11 as type 2 transitions. The conditions and characteristics of each case were studied individually and also averaged across the four subtypes of each of the two types, as detailed in the next section.
3. Methodology
Two datasets used in this study. First, all available precipitation data for the periods of 1950 to 2019 were collected from the Iran Department of Meteorology to check the precipitation anomaly during ENSO phase transitions, relative to the 30-year climatology period 1981–2010. Second, monthly mean sea level pressure (SLP), wind components, geopotential height, and land-surface precipitation were obtained from the NCEP/NCAR reanalysis for 1950–2019 (
https://www.esrl.noaa.gov/psd/data/gridded, accessed on 15 September 2020).
For the calculation of precipitation anomaly relative to the long-term mean, the equation below is used.
In this equation,
pi and
P are
ith year seasonal precipitation and mean seasonal precipitation for desired station, respectively; then, seasonal precipitation anomaly was calculated:
Composites of SLP mean and anomalies and also precipitation around Iran were made according to the two types of ENSO transition. Each type was also divided into four subtypes according to
Table 1. Wave activity and its flux were visualized by using the formulation introduced by Takaya and Nakamura [
27], who treated waves as small-amplitude perturbations on a mean flow pattern. In accordance with their method, for small-amplitude perturbation superimposed on a basic flow, wave activity satisfies a conservation law is formulated as
where
is the density of wave activity and
its flux. The term
disappears if the wave and basic flow are both conservative. The divergence and convergence of
indicates wave packet emission and decay, respectively. Accordingly, in this study the formulation of Takaya and Nakamura [
27] was used to investigate the storm track and its intensity over the North Atlantic Ocean, Mediterranean Sea, and Iran. Specifically, we mapped the horizontal components of the phase-independent flux of wave activity pseudomomentum, denoted as
in Takaya and Nakamura [
27] and referred to here as wave activity flux (WAF), and its divergence. These were mapped at the 300 hPa pressure level, corresponding to the upper troposphere. As discussed in [
27], this can help depict the source and propagation regions of atmospheric waves that modulate midlatitude winter precipitation.
Student’s
t-test was used to evaluate the statistical significance of the values and compare the means. For this purpose, a two tailed test for null hypothesis with no differences between means applied to compare the composites of wave activity flux divergence, SLP, and precipitation between type 1 and type 2 of ENSO phase transition at the 99%, 95%, as well as 75% confidence level, either for one type 1 subtype compared to the corresponding type 2 subtype (
Table 1), or between all type 1 and type 2 years without distinction of subtype.
The area between 44° to 64° east longitude and 22° to 42° north latitude was considered for studying the precipitation anomaly in and around Iran. A larger area was chosen for considering WAF and SLP anomalies in order to study circulations from the North Atlantic Ocean through the Mediterranean to Iran.
4. Results
4.1. Precipitation Responses over Iran from Station Data
Table 2 and
Table 3 show the mean climatology and observed autumn precipitation data received from the Iran Department of Meteorology for all subtypes of ENSO phase transition type 1 and type 2, respectively. Differences between the annual precipitation in the studied years and the long-term mean can also be seen in the last columns. According to
Table 2, during all 10 type 1 transition years, the mean precipitation was lower than the climatological average. The subtypes of SE-SL had the most negative anomalies, with an average seasonal rainfall reduction of −60.32 mm per year per station. Over all cases of phase transition type 1, total precipitation had an average anomaly of −44.189 mm per year per station compared to the 30-year climatology mean. By contrast,
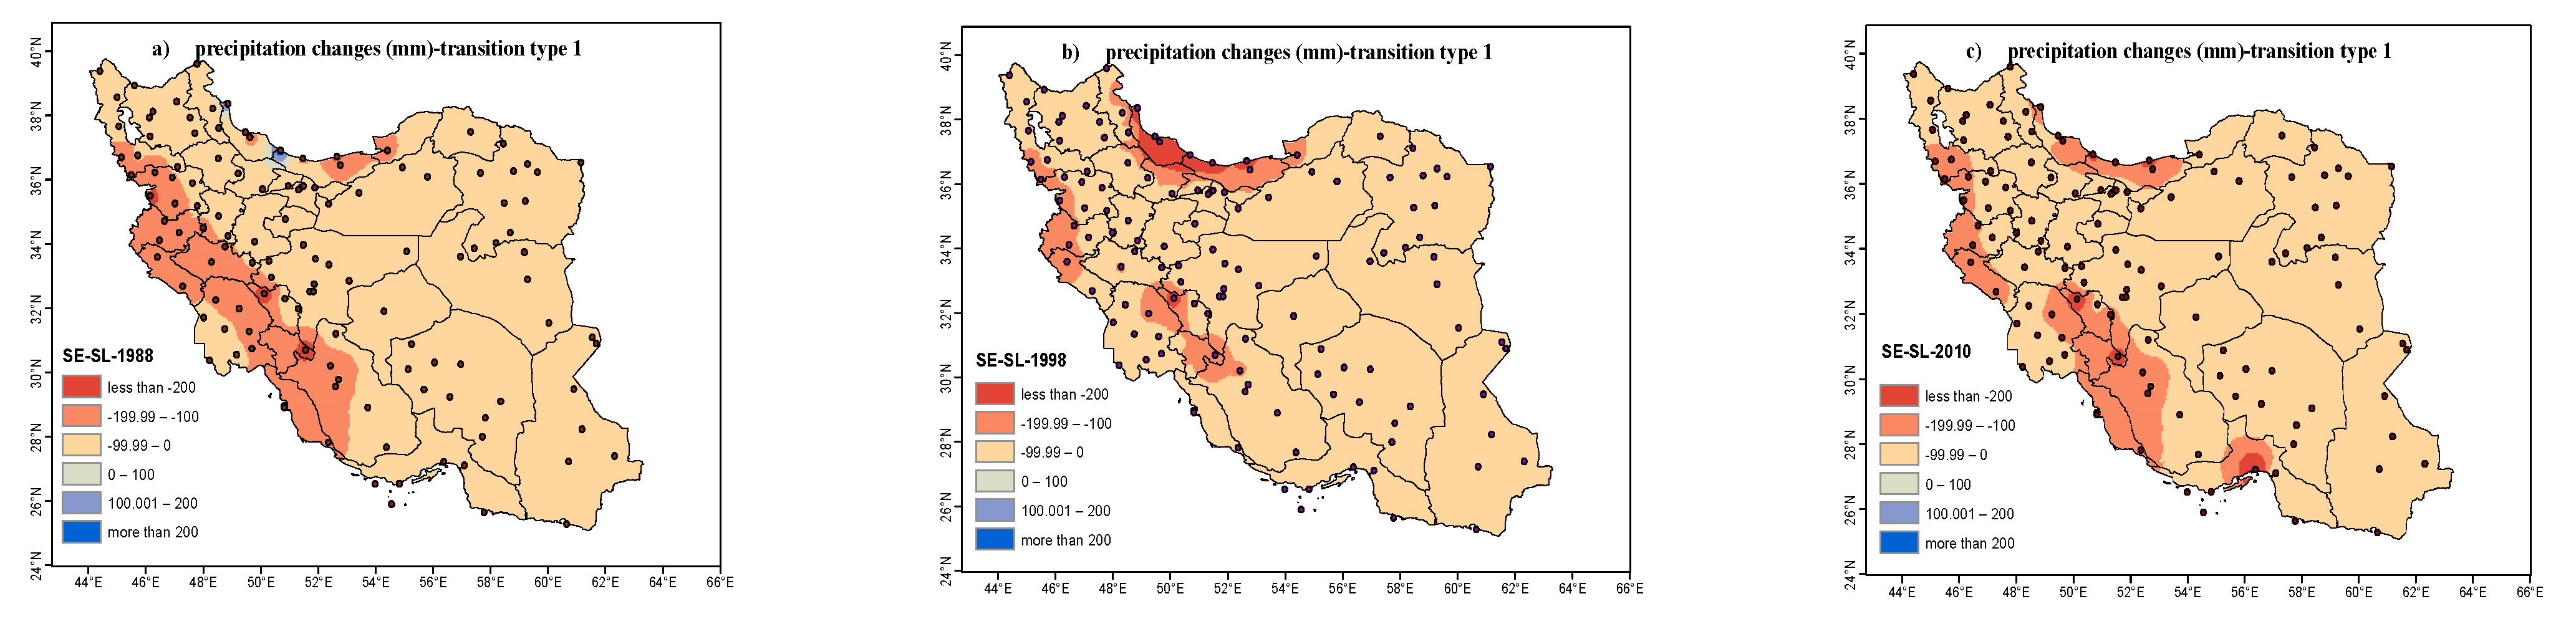
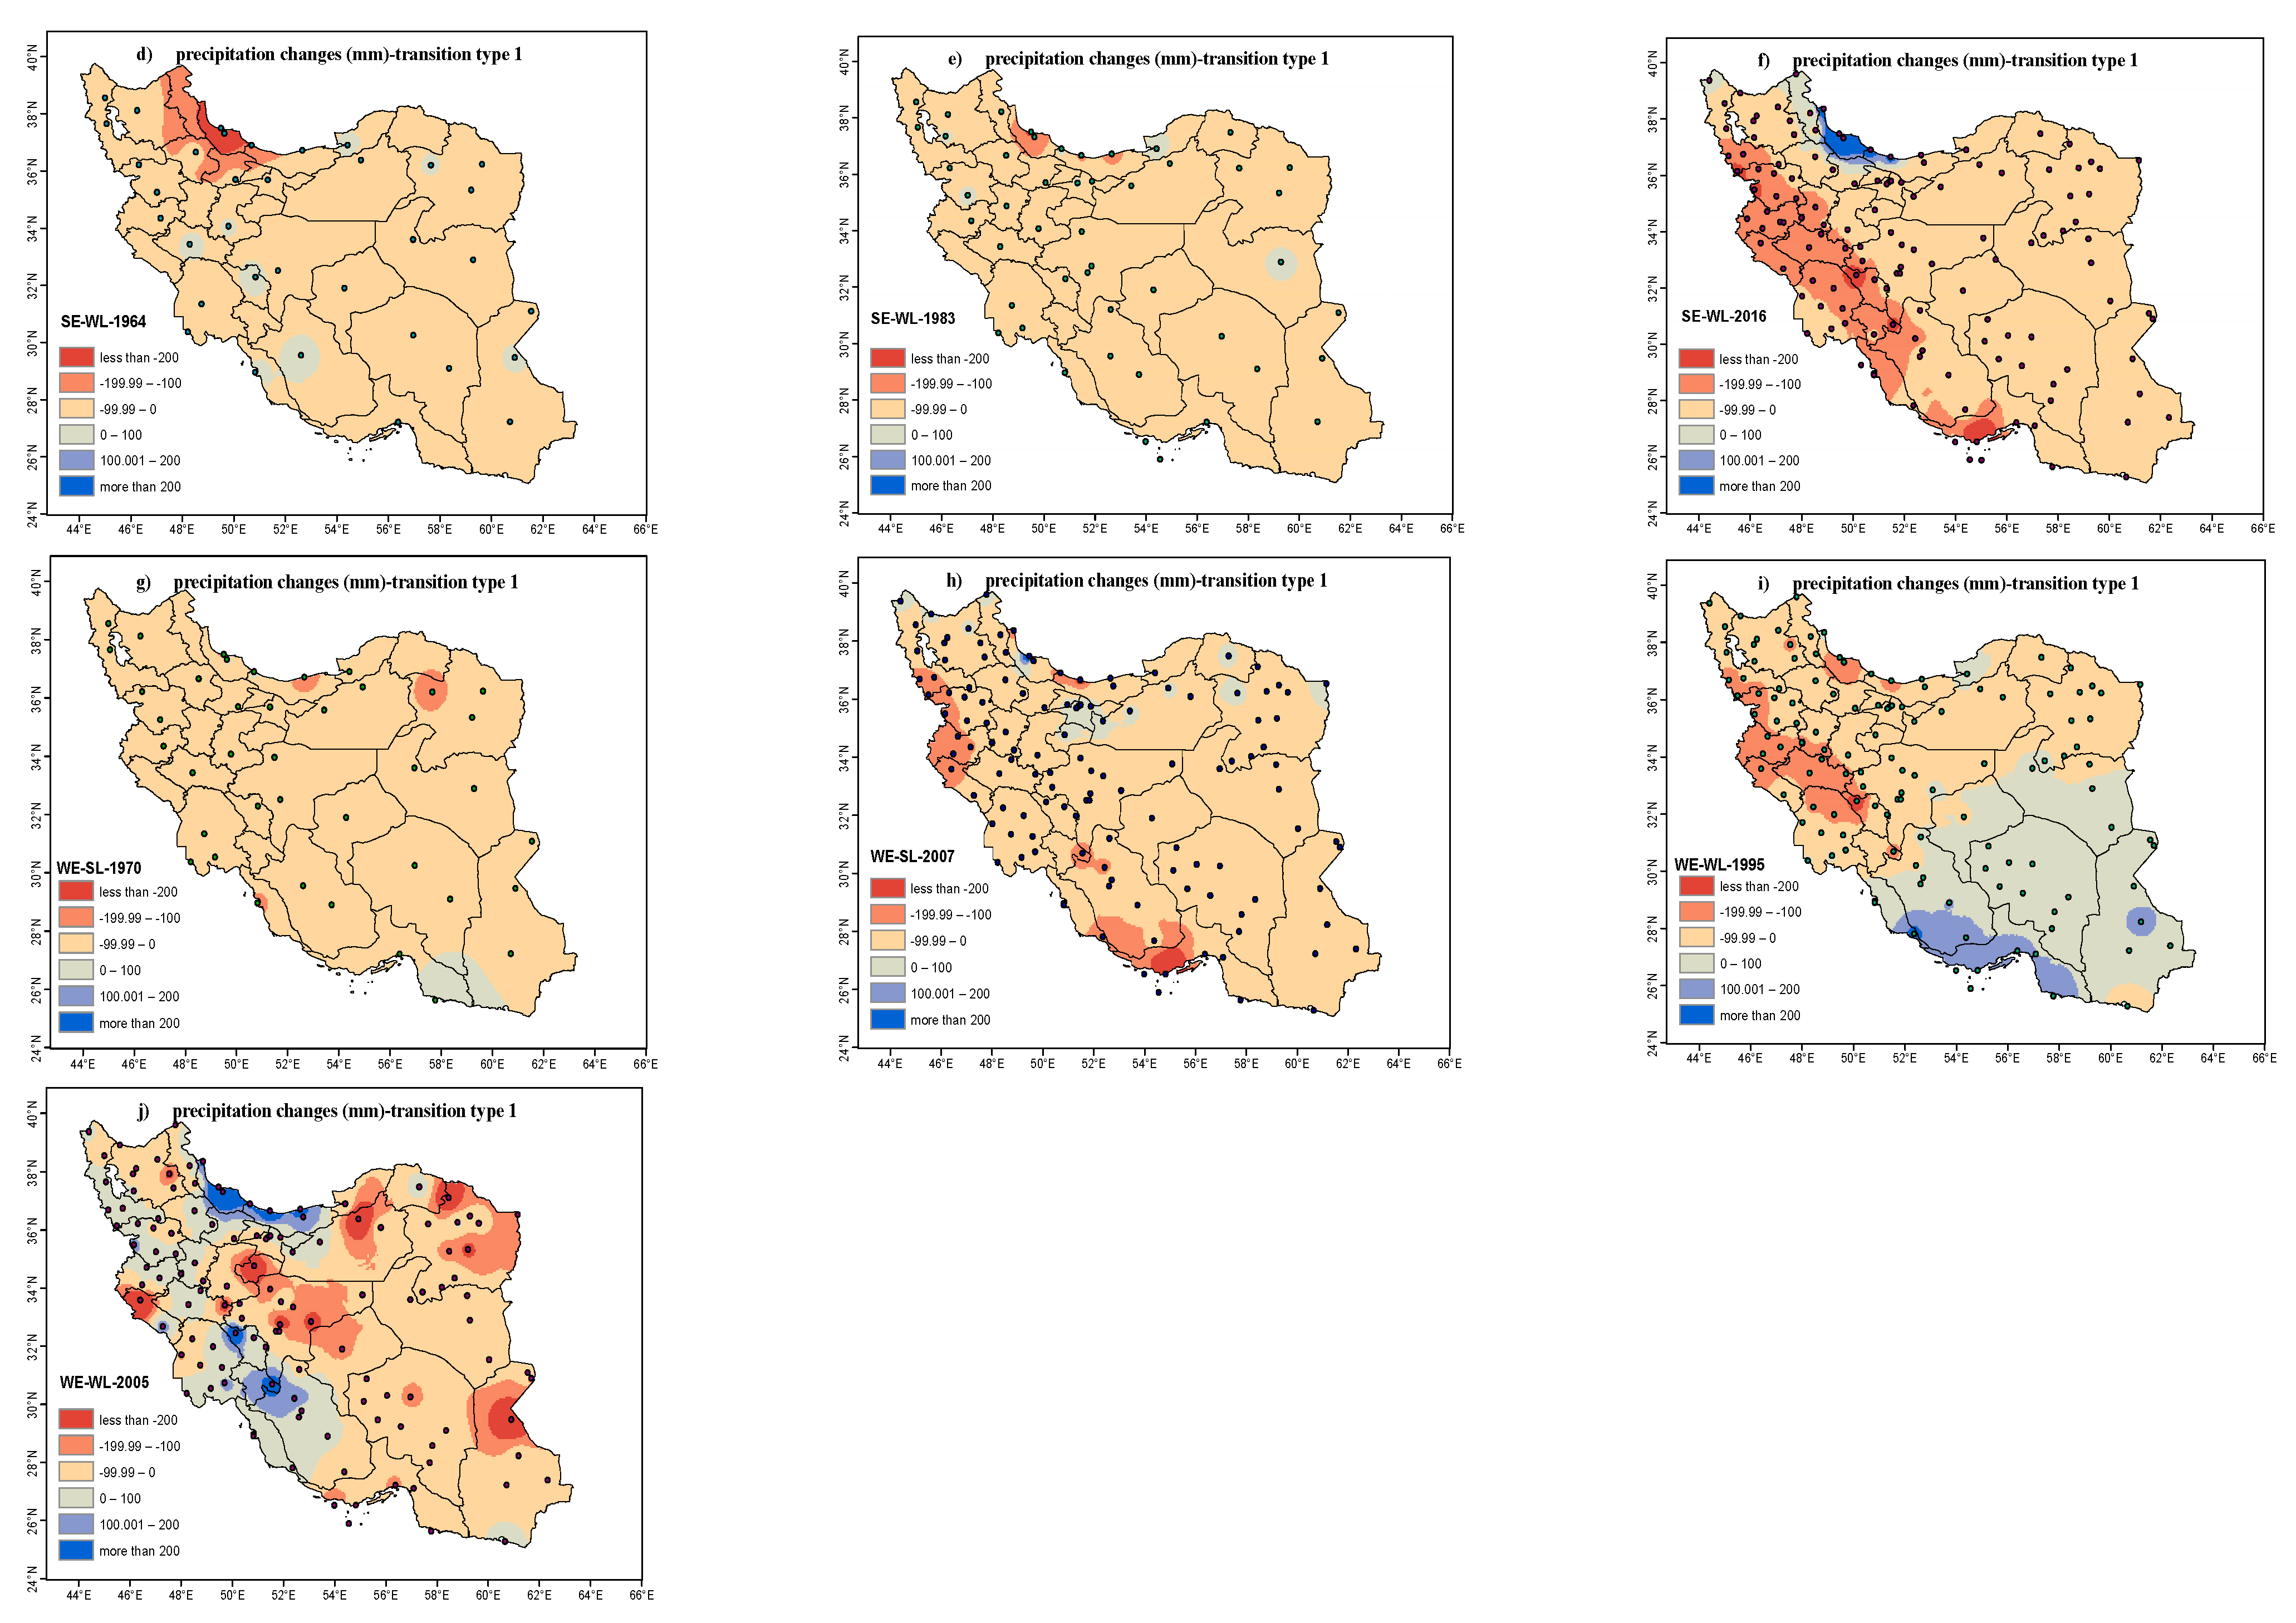
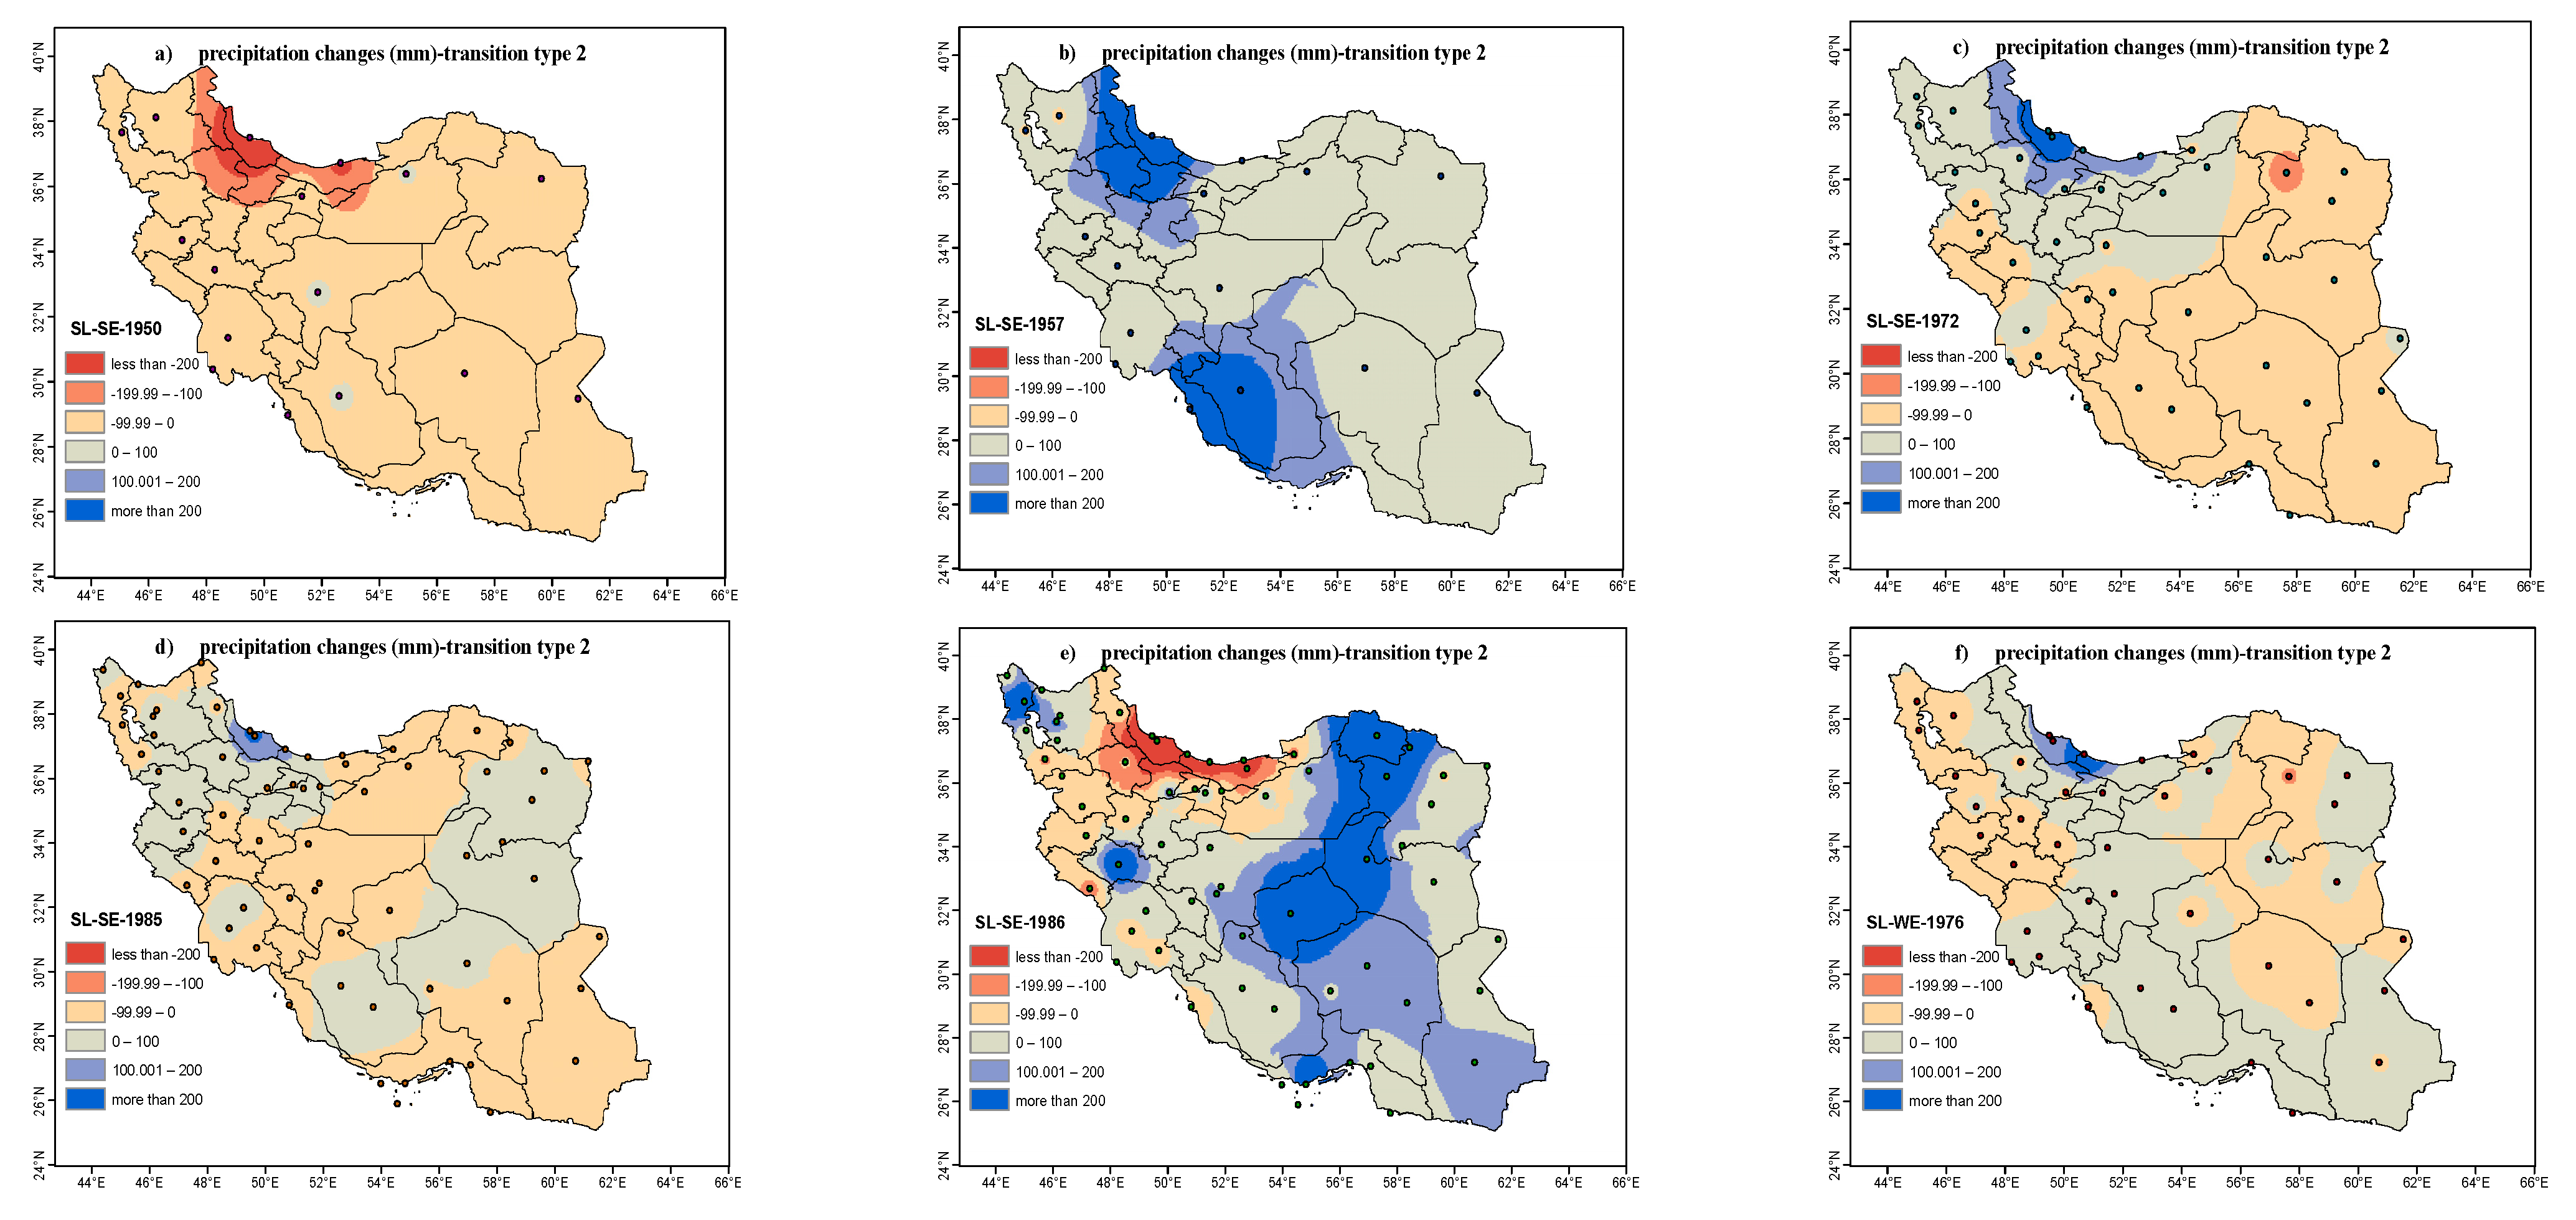
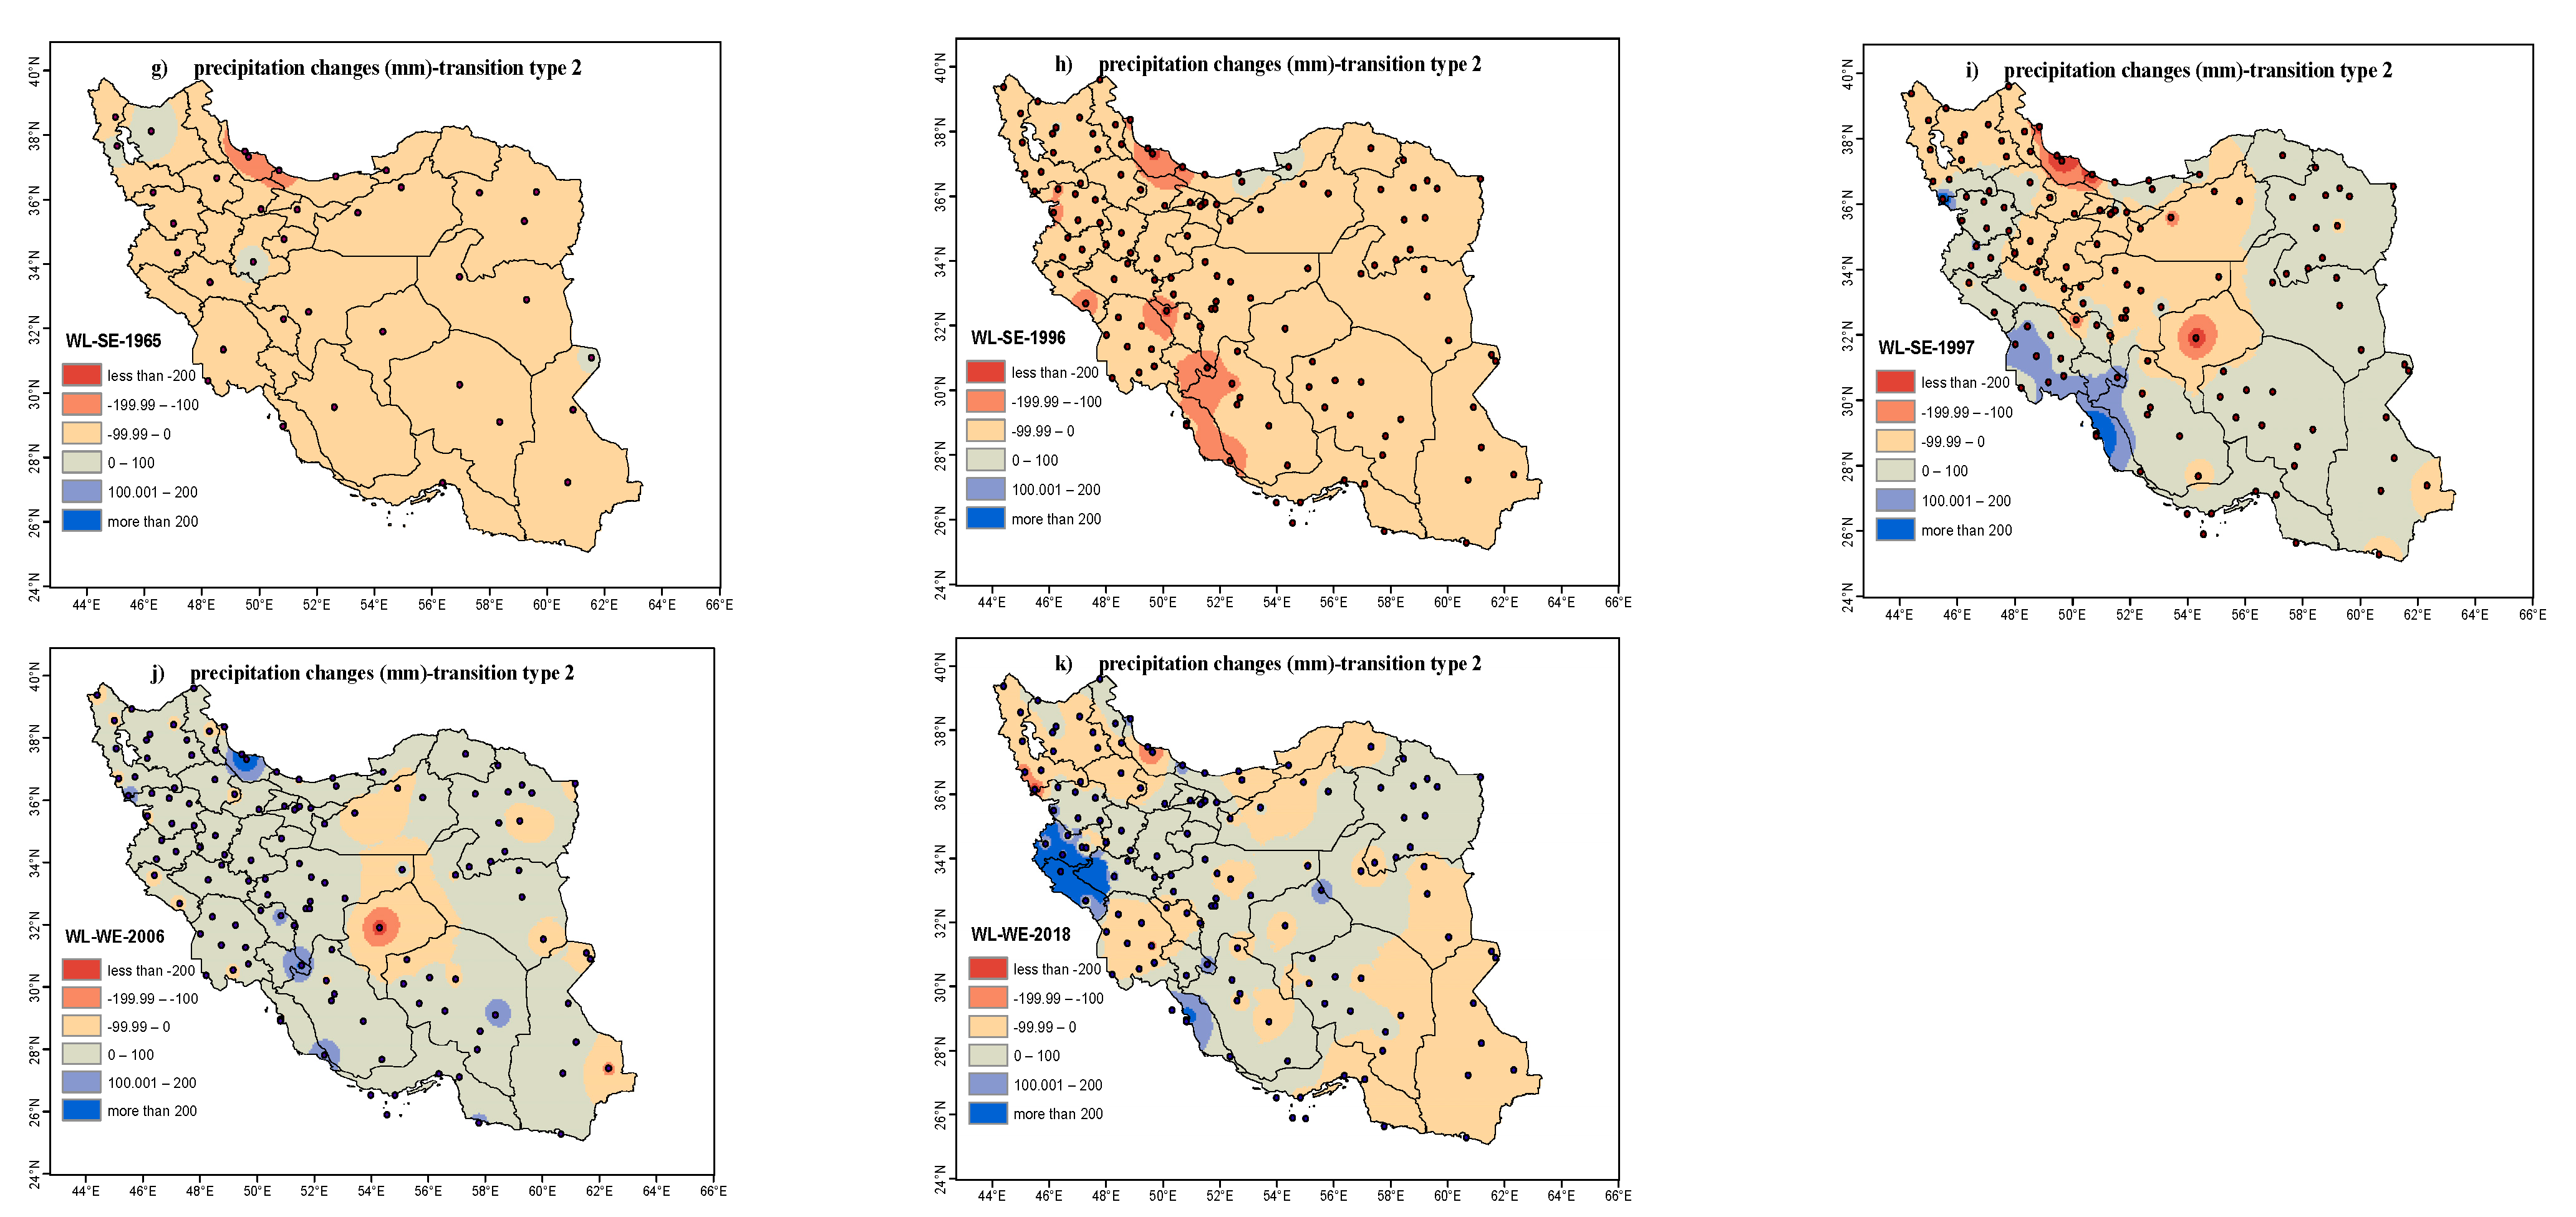
Table 3 reveals that most but not all (8 out of 11) type 2 transition years had more precipitation than climatology. The greatest increases in precipitation was related to the WL-WE subtype, which had a mean positive anomaly of 42.65 mm per year per station, while the case of WL-SE did not show any consistent changes (in 1997 the amount of rainfall increased, and in the other two years, especially in 1996, major decreases occurred). On average, over the years of type 2 transition, precipitation was 15.65 mm per year per station above the climatology. In order to provide a better sense of how consistent these patterns are spatially, we have provided interpolated maps of precipitation anomaly (yearly values minus long term values) for all ENSO transition years of both types in
Figure 1 and
Figure 2. We found that the type 1 transition years consistently featured below normal autumn precipitation over most of the country, while most but not all type 2 transition years featured mostly above normal precipitation.
4.2. Wave Activity Flux
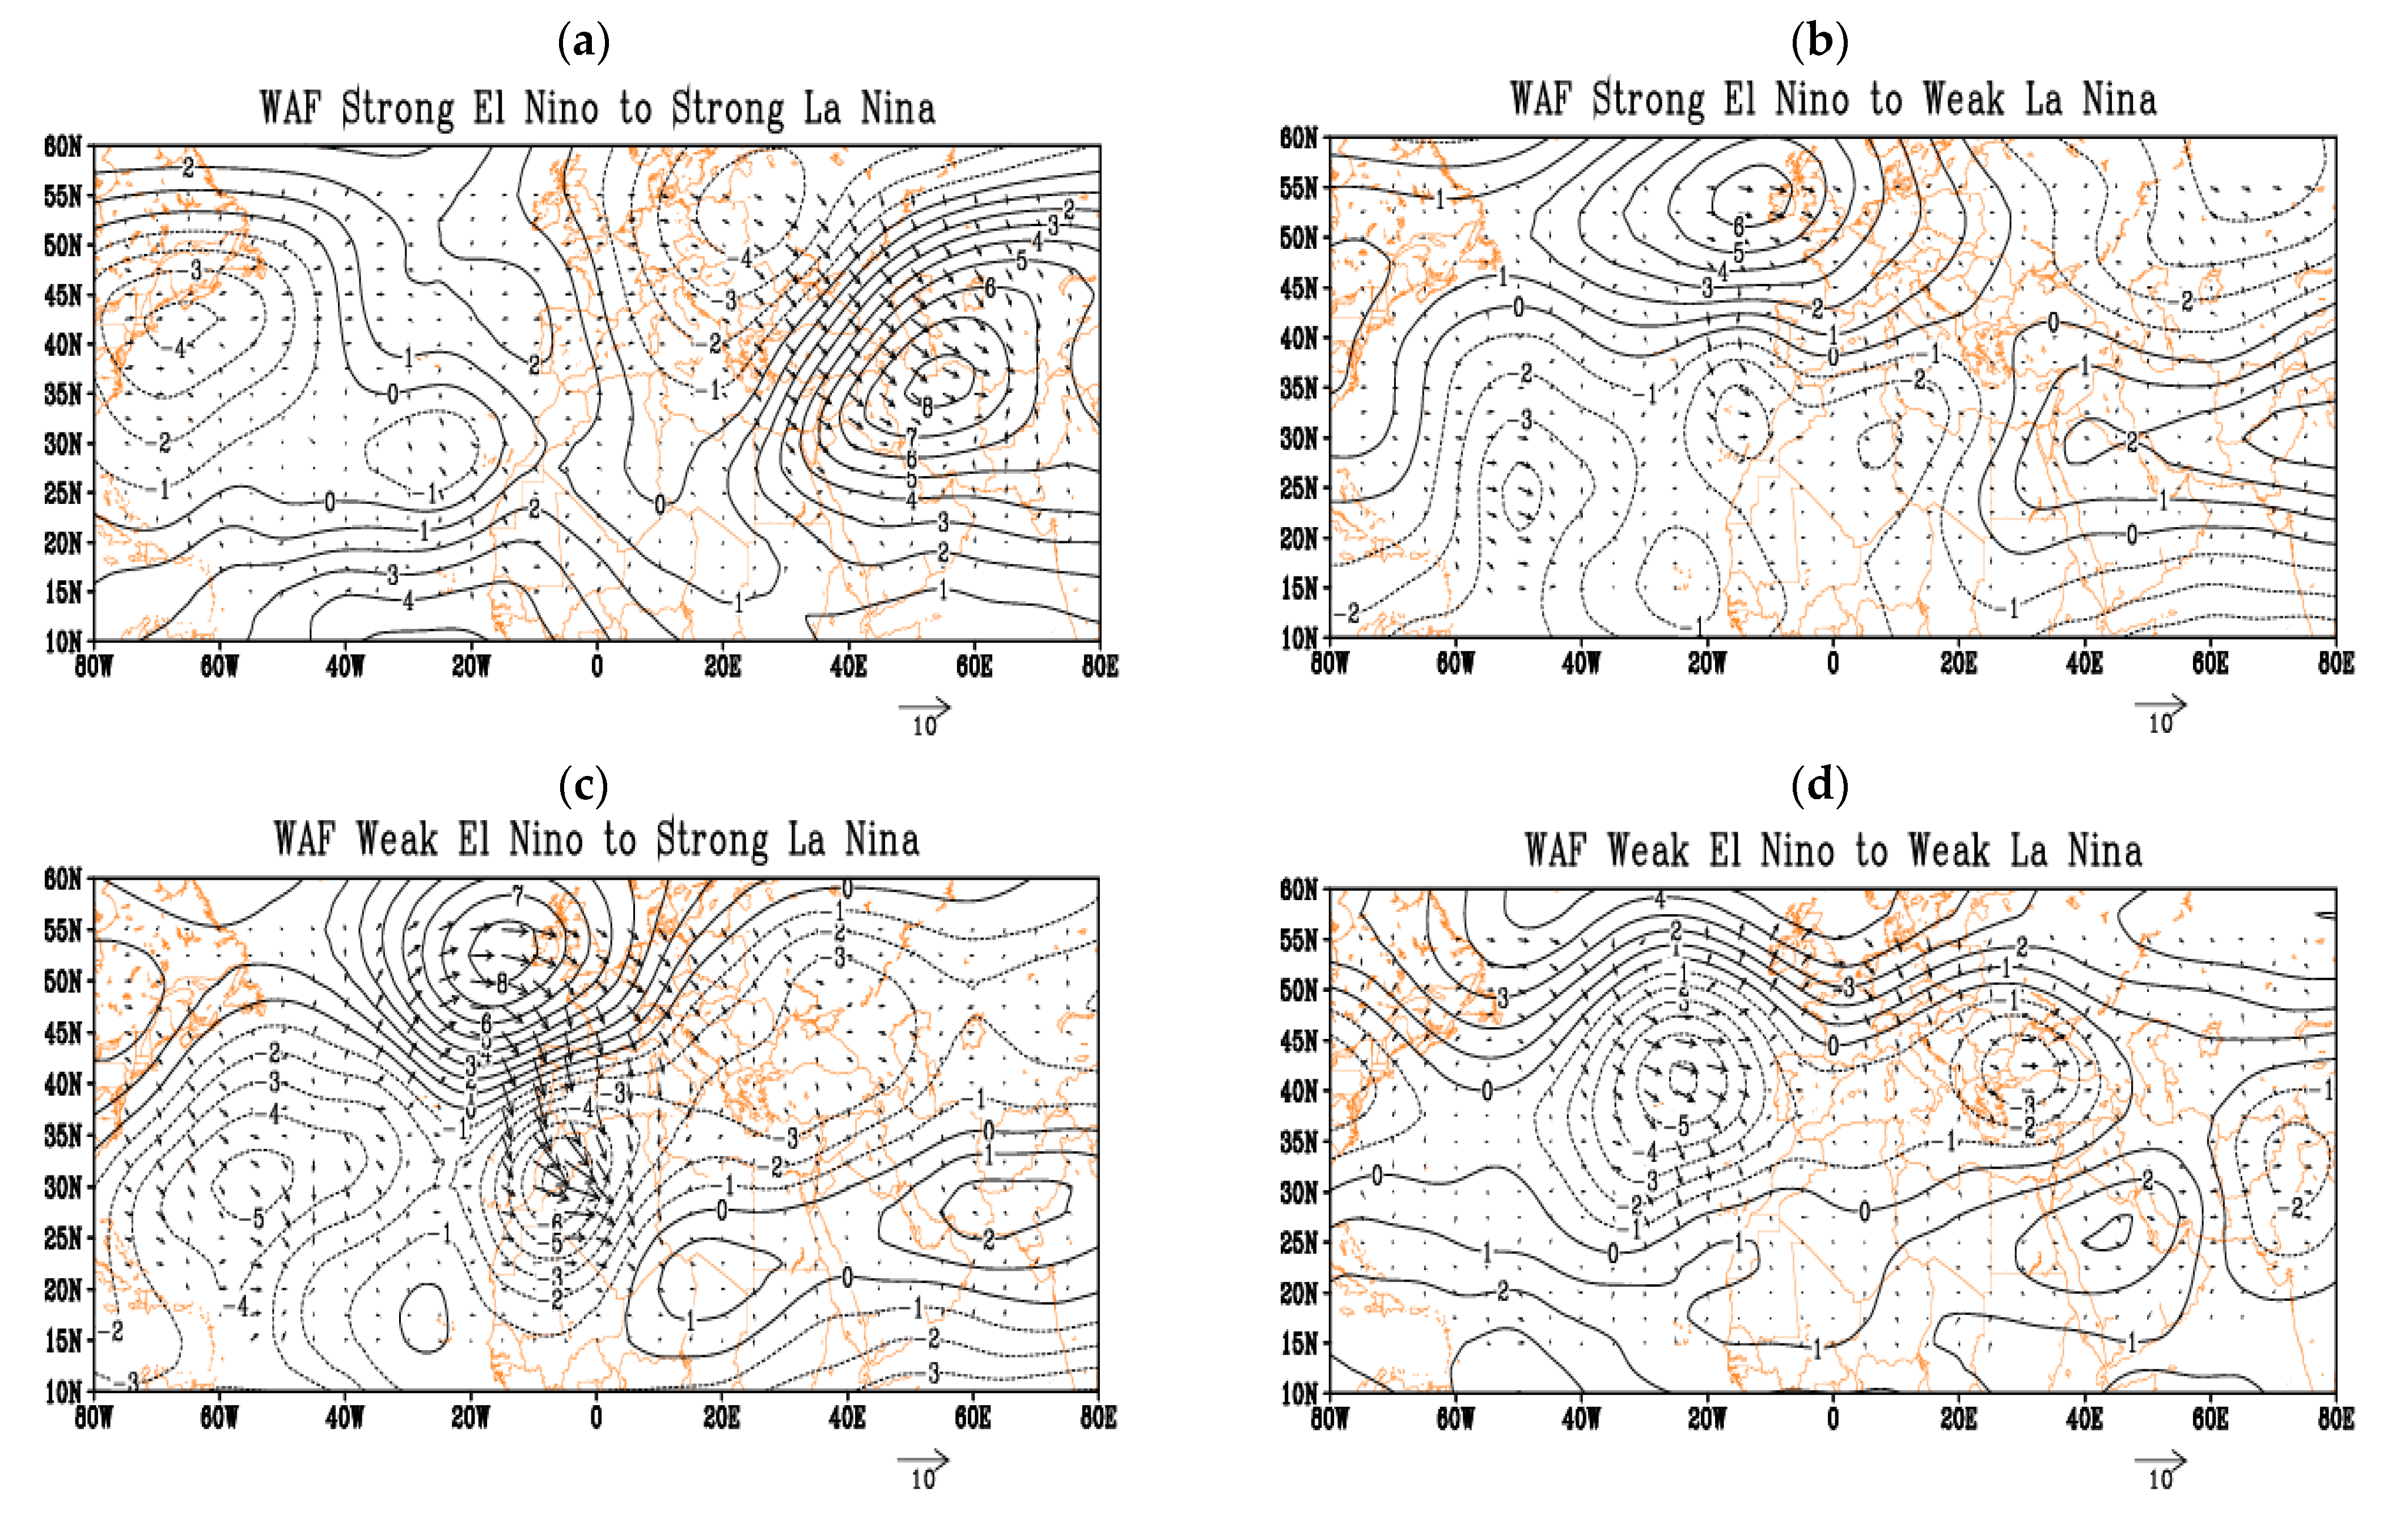
We mapped WAF anomaly averaged over the different ENSO phase transition types and subtypes (
Figure 3 and
Figure 4). In these figures, arrows and contours show anomalies of horizontal WAF and its divergence, respectively. The solid (dashed) lines in the figures show positive (negative) values indicating flux divergence (convergence). As seen in the figures, the Atlantic Ocean is the location of anomalous wave convergence, which travels from North America into the region. The notable feature over the North Atlantic in all cases of ENSO phase transition type 1, in contrast with the situation of phase transition type 2, is the reception area over the center and southern part of the North Atlantic. This is a specific feature of the wave activity flux during transition phase type 1. In this regard,
Figure 3a shows a pair of divergence/convergence centers over the Atlantic and northern Europe, centered between 10° W and 20° E. In this case, Europe and the center part of the Mediterranean Sea are the reception areas of the waves. All panels of
Figure 3 also show a convergence center of waves over Mediterranean, known as an important region that transfers energy to North Africa and Middle East [
21]. The other notable point for phase transition type 1 is that the Middle East and Iran are the location of convergence–divergence of the waves. Over all the type 1 transition years, we found enhanced WAF along a northwest–southeast axis from near Ireland to the vicinity of Iran, with increased WAF divergence at either end of this axis (
Figure 3e).
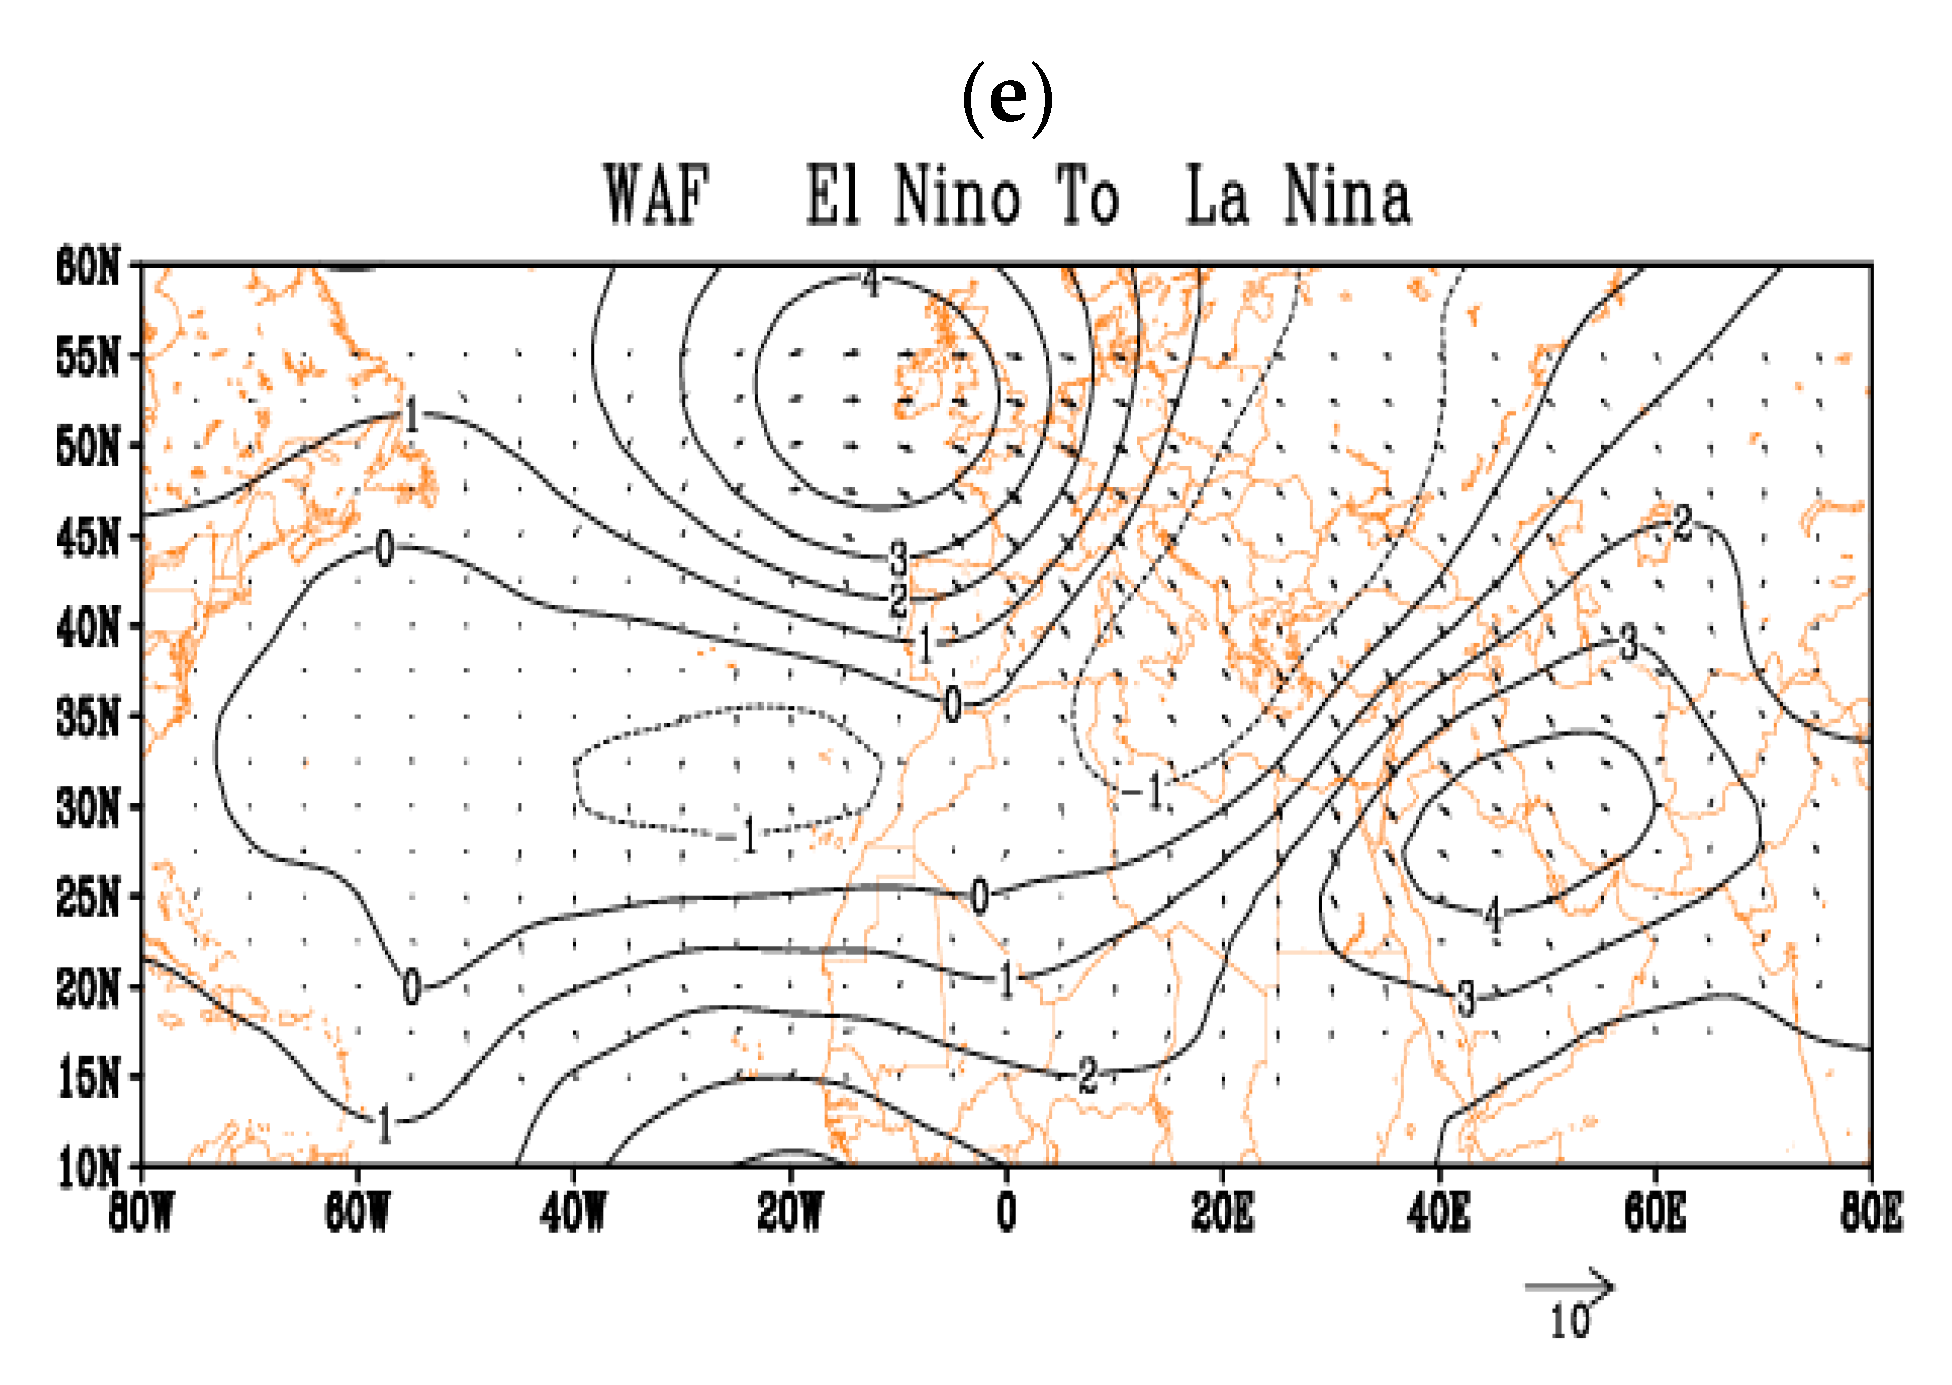
In type 2 transitions, as
Figure 4 shows, wave activity values were generally larger than type 1 over the Atlantic Ocean, but with a north to south flow pattern that does not generally reach the Middle East. According to this figure, the major wave transmission area showed a wide divergence region from the center and northern parts of the ocean to the east and northeast, which is totally in contrast with type 1. The divergence center at the west of the Atlantic therefore resides in a lower latitude position relative to its counterpart in the other type of phase transition. Moreover, we found an area of anomalous wave divergence over the eastern part of the Atlantic in type 2, centered on 30° N, while according to
Figure 3, this region is more of a wave reception area for type 1. The solid line in
Figure 4 represents divergence area over the Mediterranean Sea, which pairs with the wide convergence area over Middle East including Iran, creating the exclusive feature of the Mediterranean storm track in all cases of ENSO phase transition type 2 (which is in contrast with all cases of type 1). The other important point to note is the location of Iran at the border of a divergence–convergence area under type 2 transitions, which suggests this region receives the most Rossby waves.
To evaluate the significance of the obtained results, we used Student’s
t-test (2-tailed) for each pair of subtypes (in effect by comparing
Figure 3a and
Figure 4a;
Figure 3b and
Figure 4b;
Figure 3c and
Figure 4c;
Figure 3d and
Figure 4d) and also for the two transition types overall (comparing
Figure 3e and
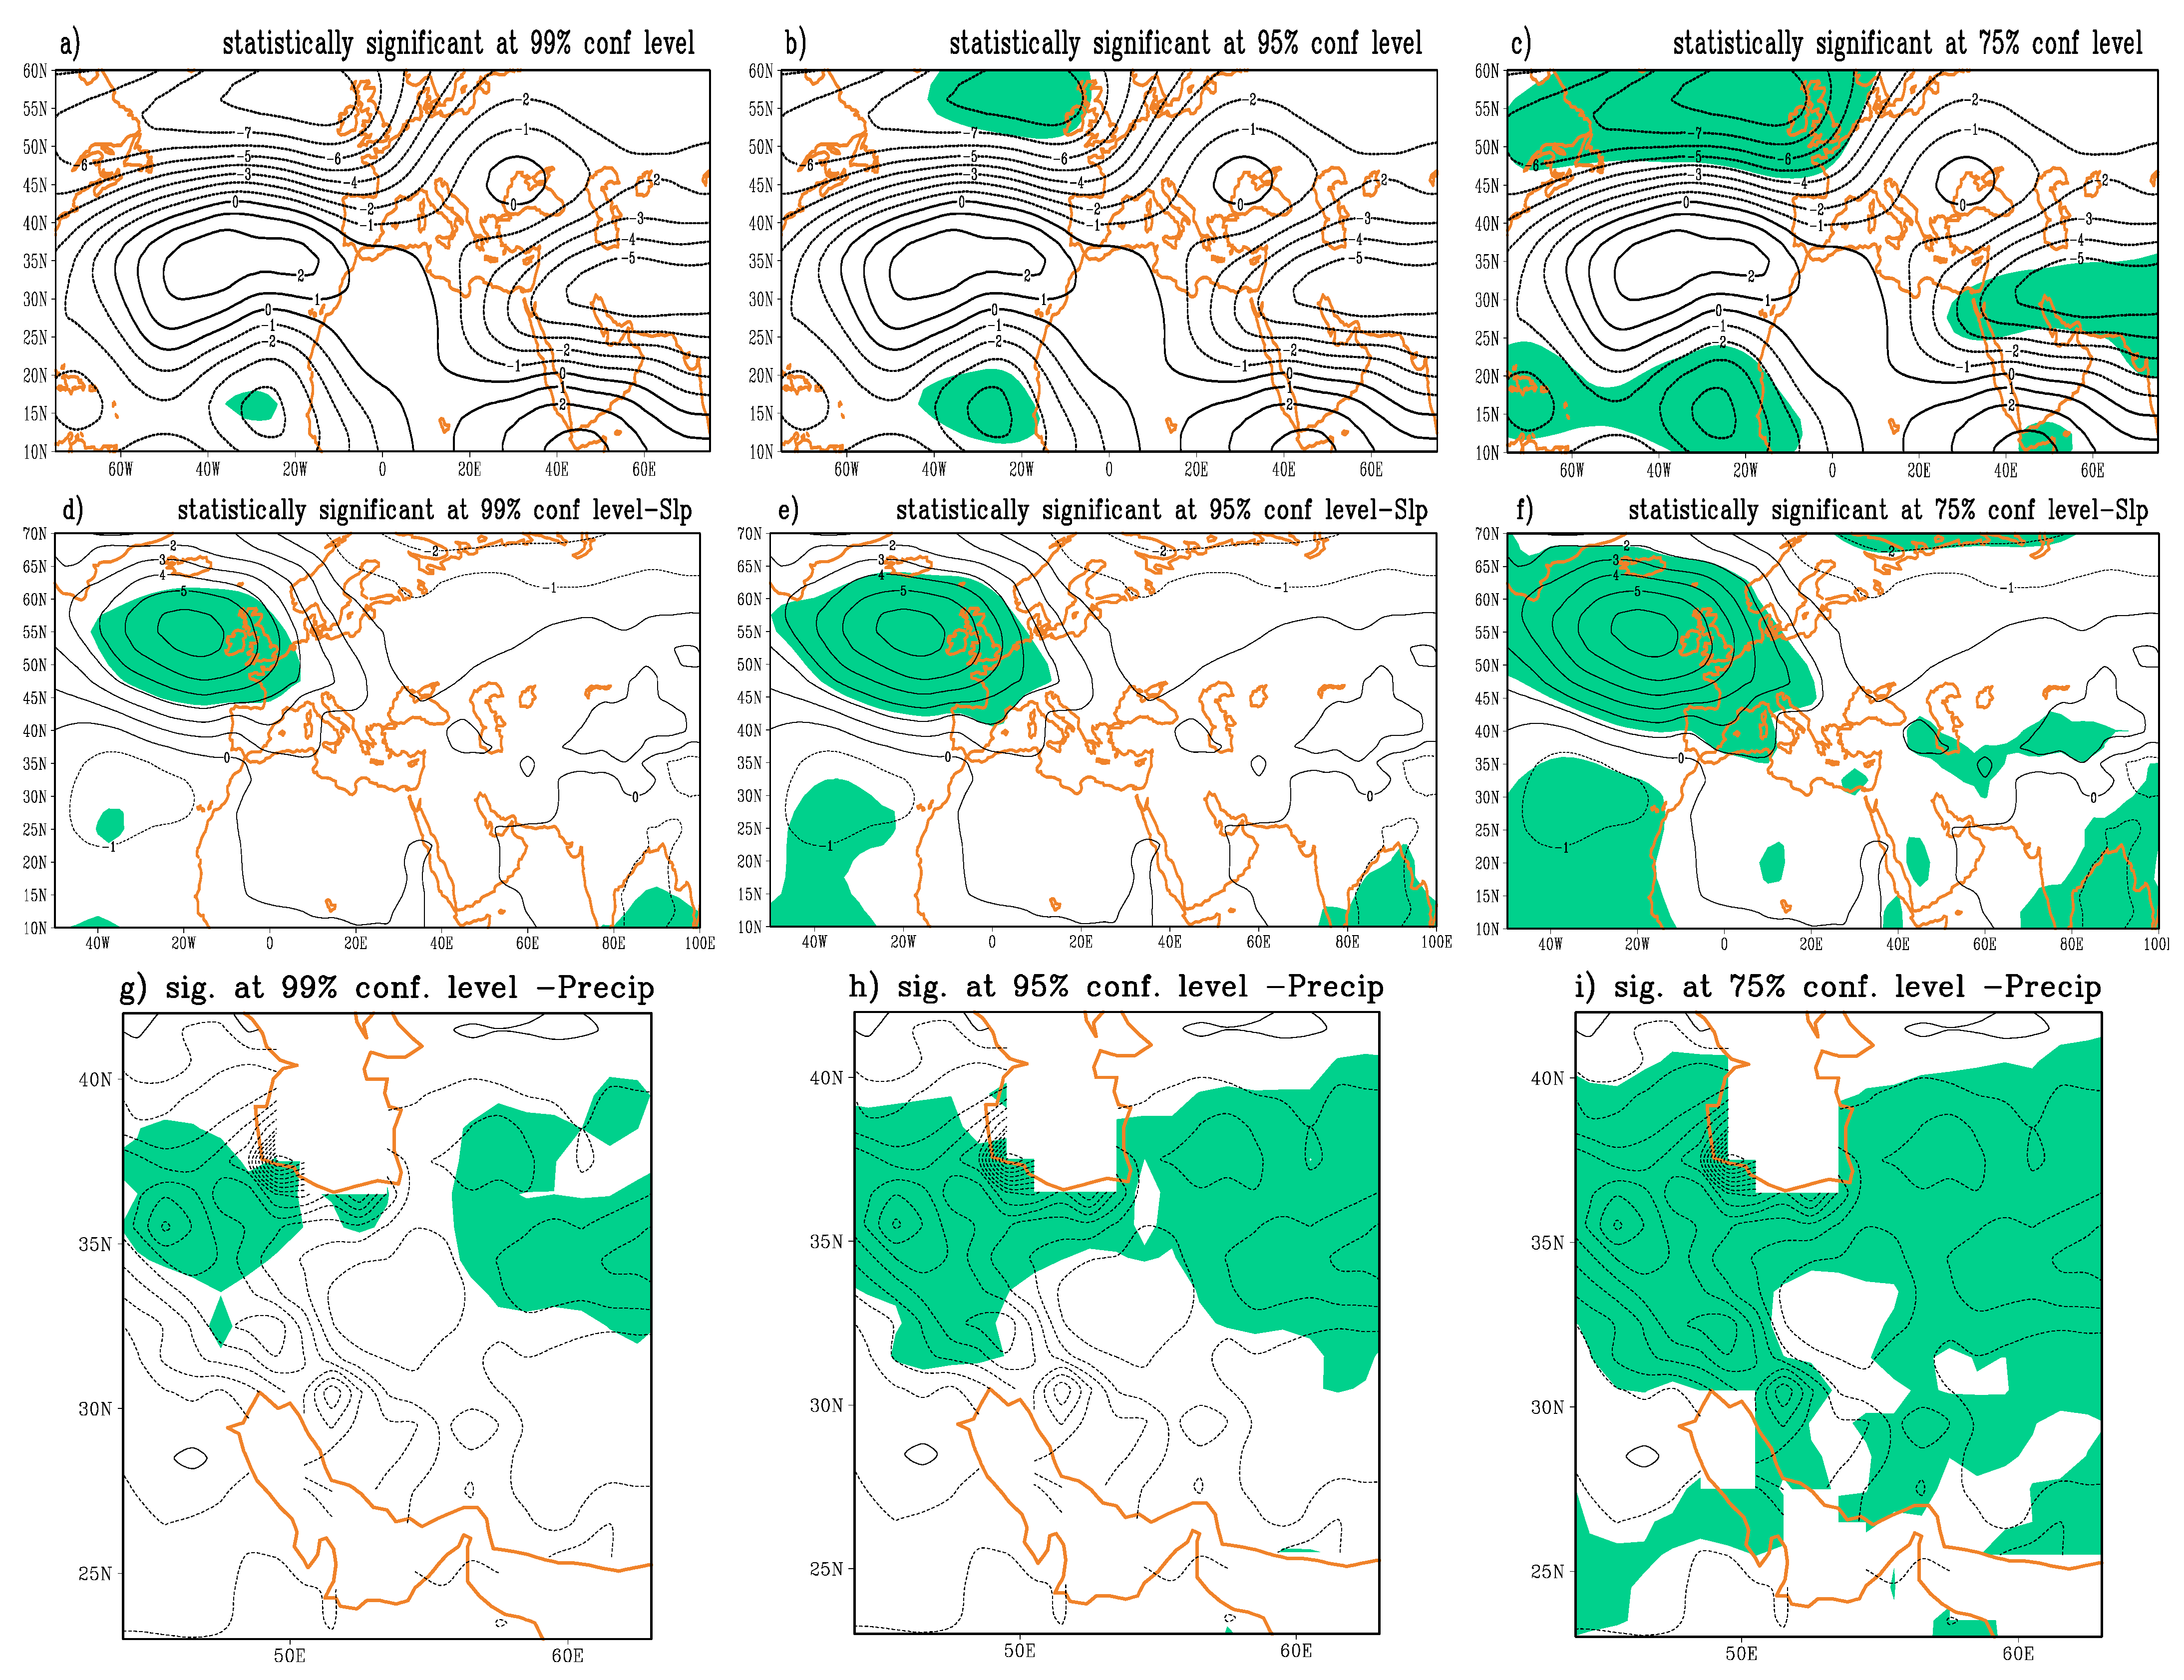
Figure 4e). The areas with differences in wave activity flux divergence overall across the two types of ENSO phase transition with statistical significance at the different confidence levels have been shown in Figure 9a–c (areas marked in green). For subtypes, due to the large number of analyses, the results are summarized in
Table 4. As stated in this table, the most significant differences found for the SE (SL) to SL (SE) and for the SE (SL) to WL (WE) transitions, over Iran region and Atlantic Ocean at 95% and 75% confidence levels, respectively. The most notable point obtained is the statistically significant values over the southeast North Atlantic Ocean in all subtypes (see
Table 4 for details). Overall, Figure 9a indicates that only a small part of the southeast North Atlantic Ocean was significant at 99% confidence level, while at 95% (Figure 9b), areas located over the North Atlantic near longitude 20° W were significant too. Generally, the divergence of Rossby wave activity parameter was statistically significant across much of the northern and southern North Atlantic at 75% confidence level or higher, while differences in middle latitudes were completely nonsignificant. Statistically significant differences at 75% confidence level were also found in a band over much of the Middle East, from northeast Egypt across central and southern Iran and into northern India (Figure 9).
4.3. Sea Level Pressure
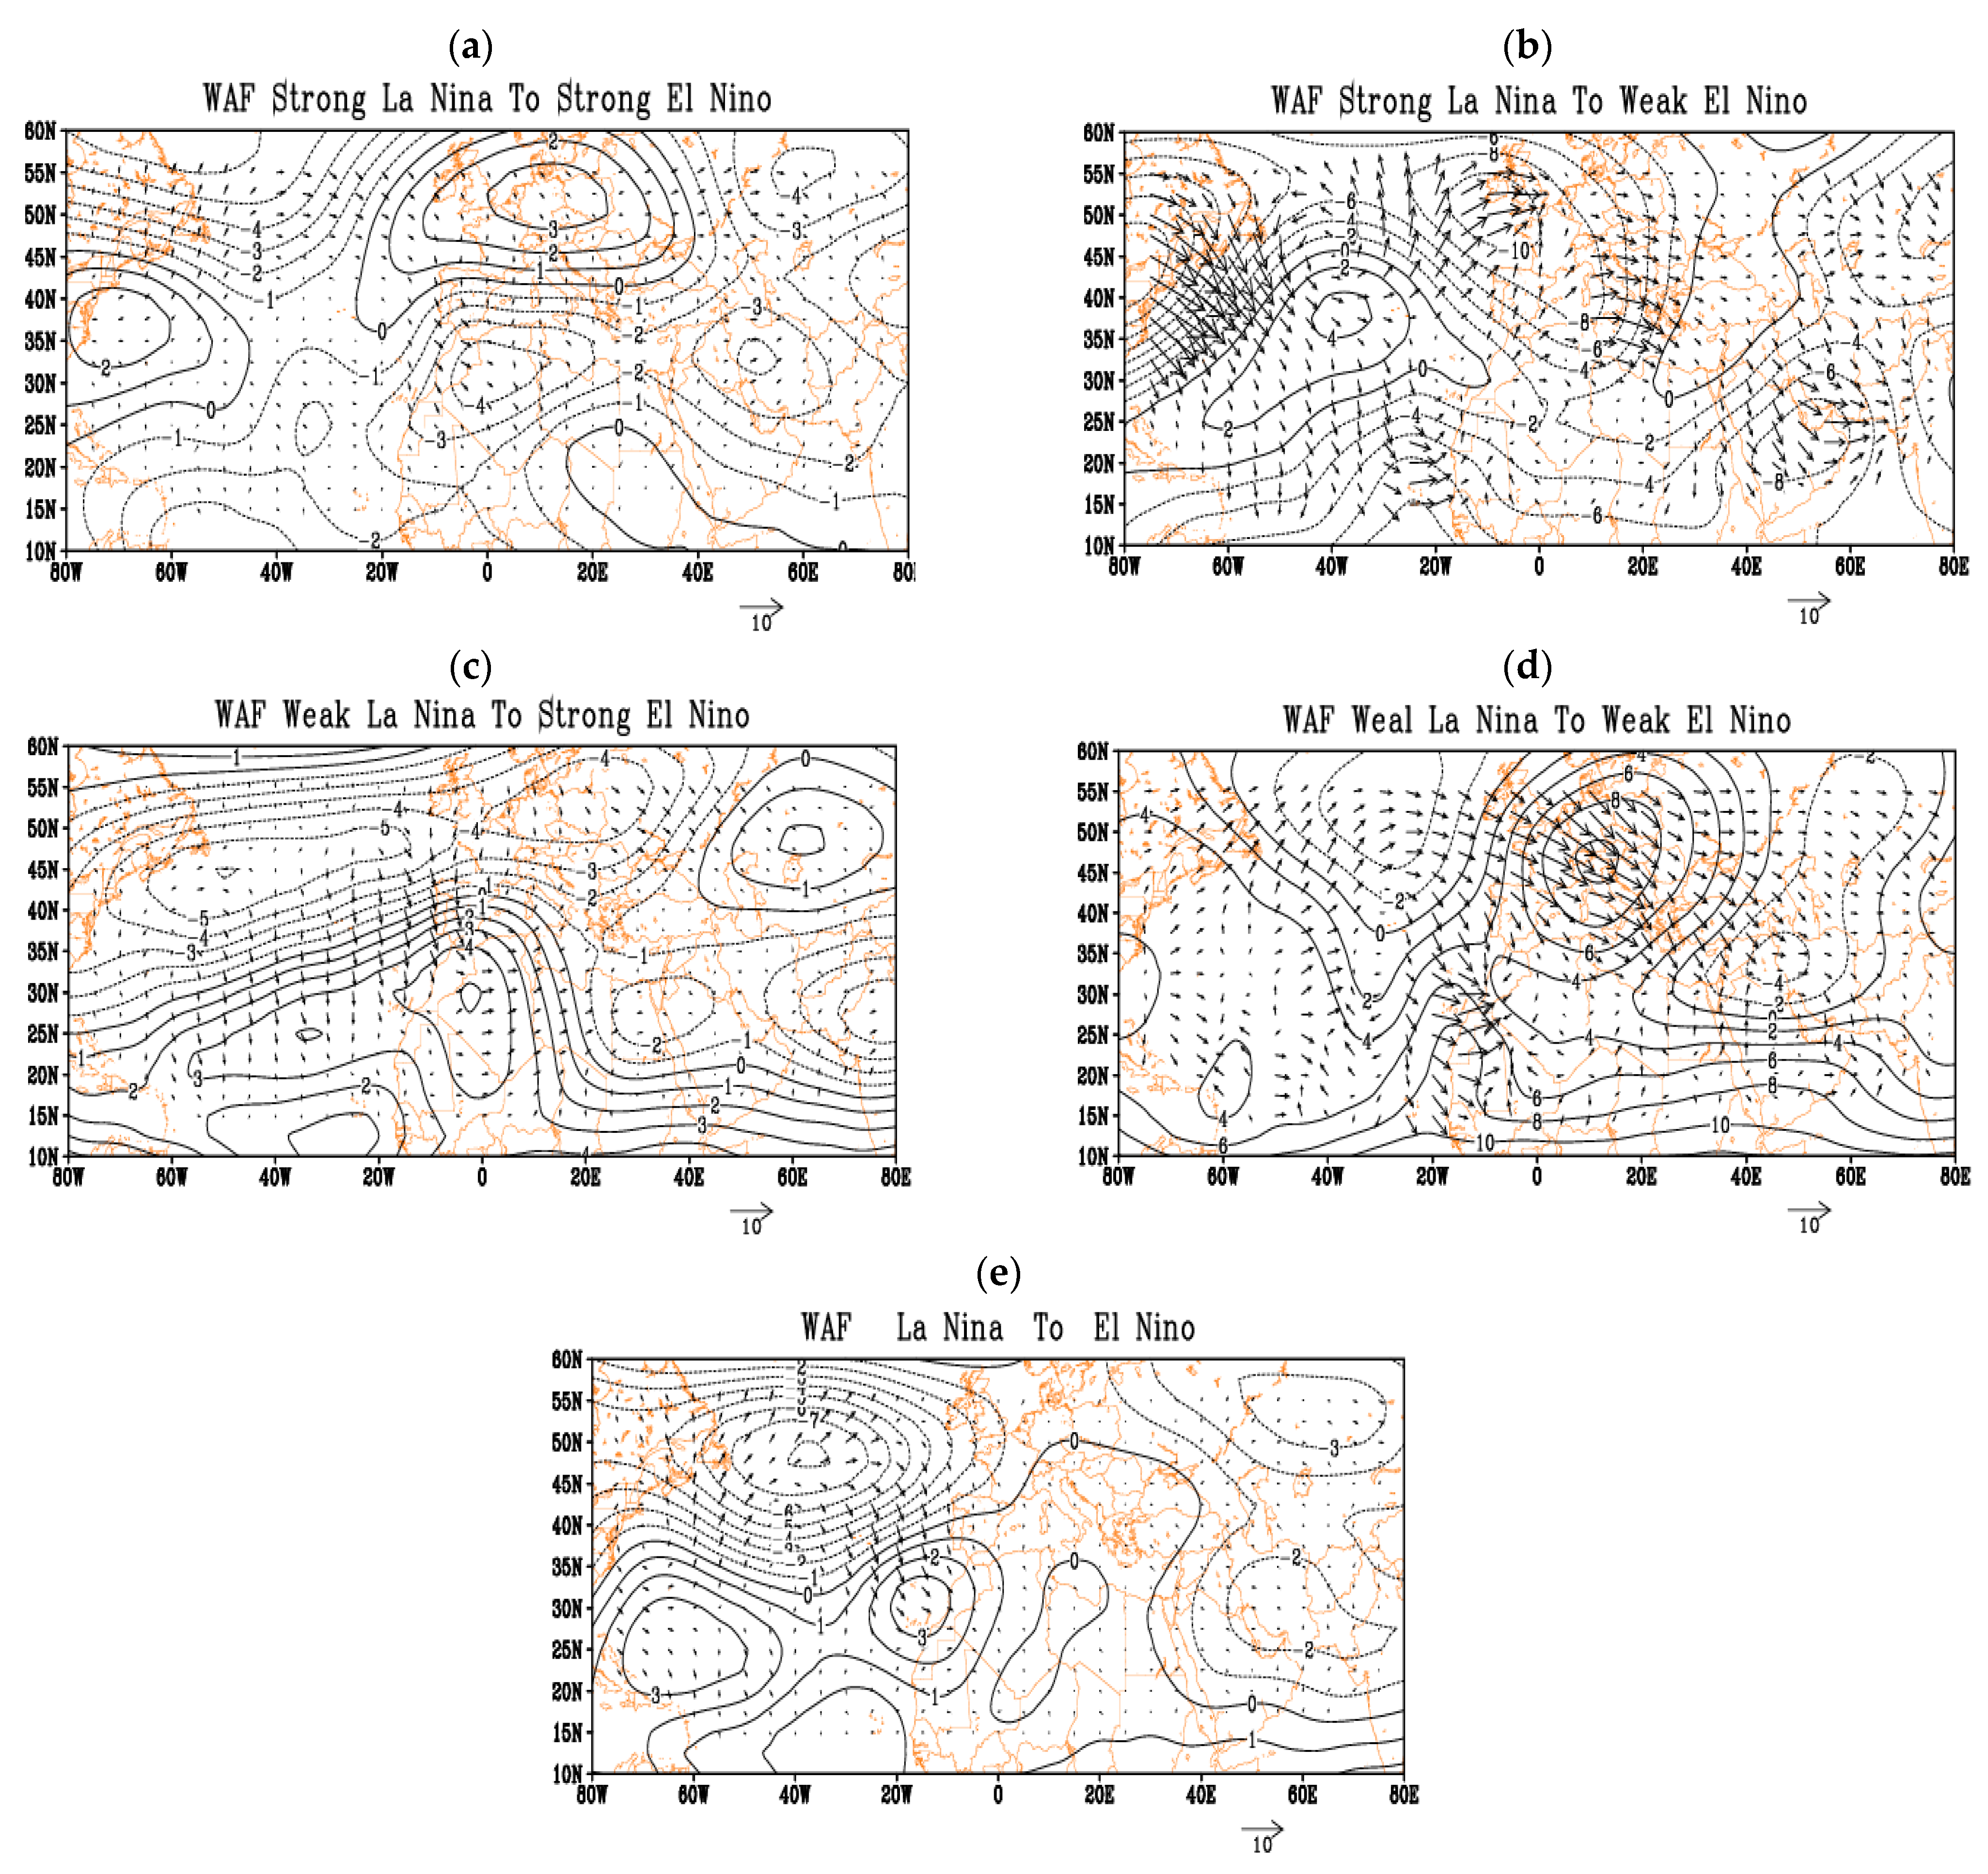
We studied pressure anomalies in the study area, covering −50° to 100° E longitude and 10° to 70° N latitude. In particular, we investigated the variation in all permanent and semi-permanent pressure centers in different subtypes of ENSO transition phases as well as their potential impact on Iran (
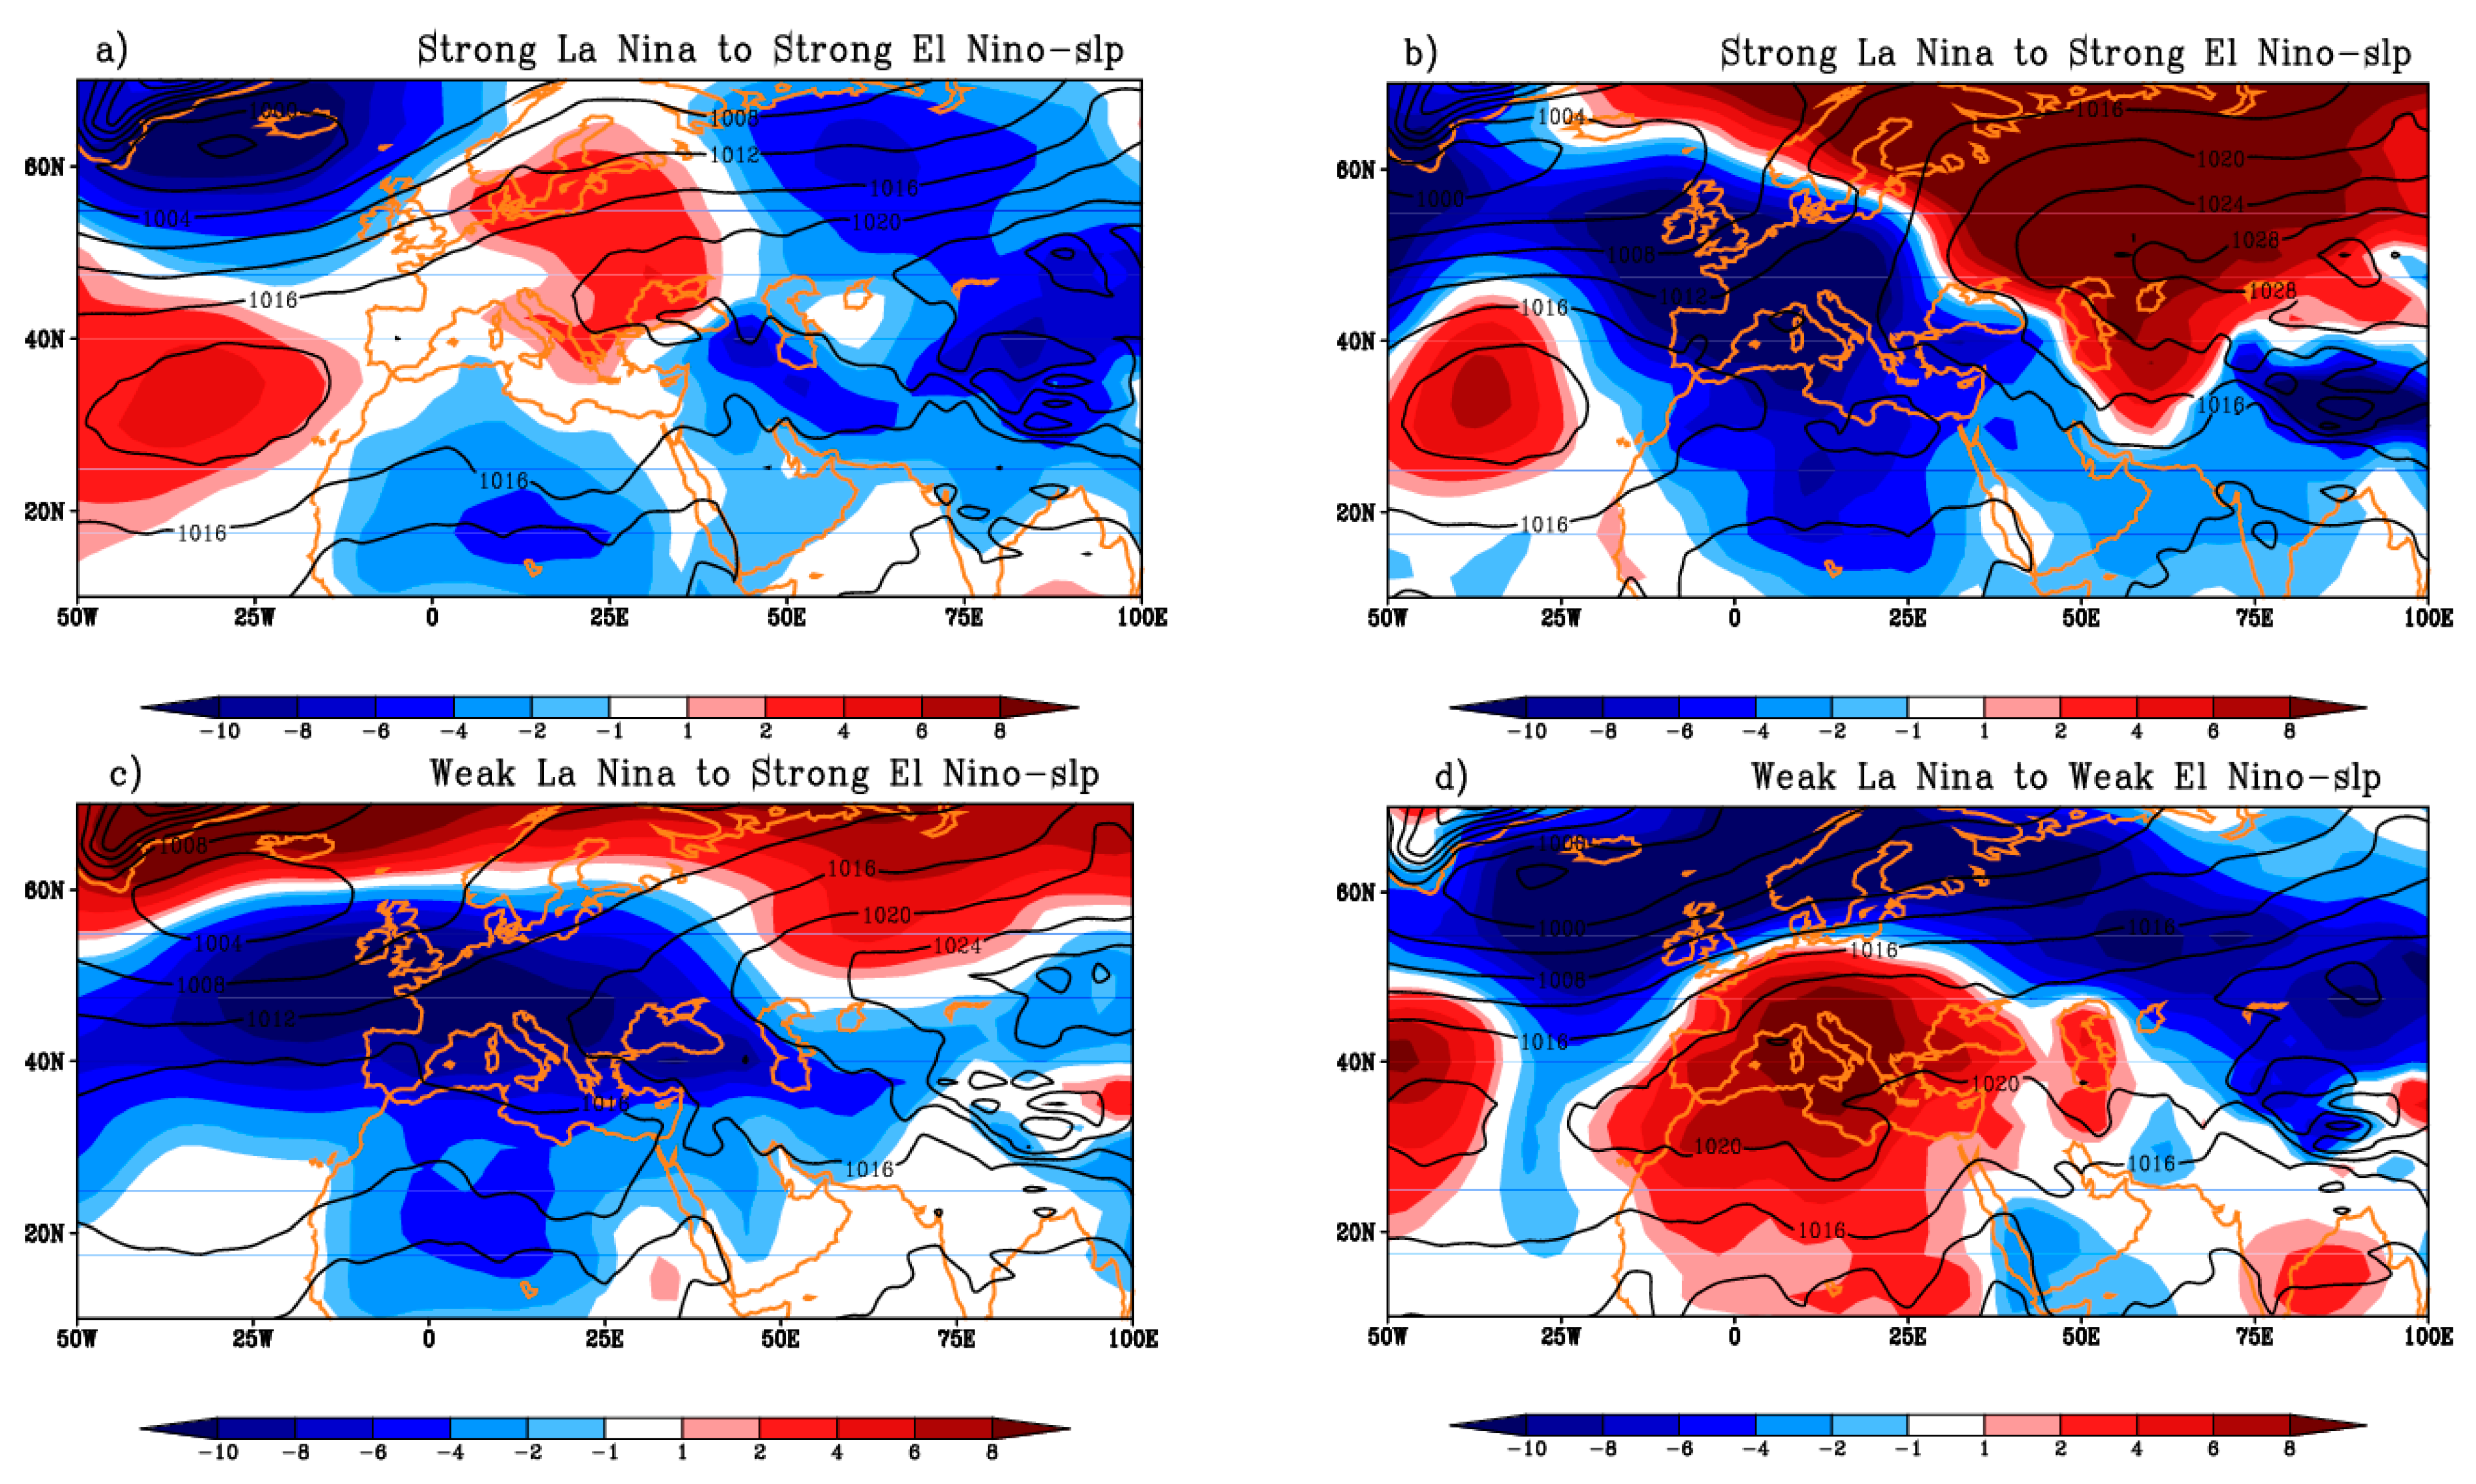
Figure 5). In
Figure 5 and
Figure 6, contours show mean value of sea level pressure (SLP), and blue (red) shaded areas show SLP positive (negative) anomalies. Accordingly,
Figure 5a shows weakening of the Iceland low pressure center over north Atlantic, and also weakening of Siberian and Azores high pressure compared with long term mean in the case of ENSO phase changing from strong El Niño to strong La Niña. In this case, Iceland low pressure (or alternately, Azores high pressure) weakened to the southeast (east) of its location up to +8 (−4) hPa. Moreover, in this period at mid- and high latitudes, warm anomalies led, to which the Siberian high pressure weakened up to −4 hPa. For this transition subtype, the SLP indicated less than normal values over all parts of Iran, while effective pressure patterns on these regions (Iceland low, Azores and Siberian high) weakened from the long-term mean. For ENSO phase transition from strong El Niño to weak La Niña, Siberian high reached into the north and northeast Iran slightly, so that in these regions, pressure was about 2 hPa above average, while other parts of country saw no change. Moreover, the Azores high and especially the Iceland low weakened. As we can see in
Figure 5b, Iceland low pressure weakened to the south and east in such a way that it stretched to the northern Mediterranean and Central Europe. Composite of SLP mean and anomalies for ENSO phase transition from weak El Niño to strong La Niña showed that the Iceland low (Azores high) pressure behaved as in the case of SE-WL and was sharply weakened by moving to east and south. Meanwhile, the Siberian anticyclone was strengthened by spreading to south and west of its permanent location. In all parts of Iran, pressure values were less than normal, such that the pressure anomaly varied from −2 hPa in the south to −8 hPa in the northeast (
Figure 5c). Finally, in the case of change from weak El Niño to weak La Niña, the Siberian high affecting northeast Iran was stronger than average by about 2 hPa, and the pressure centers of Iceland low (Azores high) weakened by about −8 (8) hPa (
Figure 5d).
In general, for ENSO phase transition type 1 autumn, all three pressure centers (Iceland, Azores, and Siberian) were weakened. However, the Iceland low pressure played a more effective role than the other two pressure centers by expanding eastward and weakening up to +8 hPa. Averaging across all four subtypes, the SLP anomaly pattern generally exhibited neutral or negative values over the all parts of Iran, while effective pressure patterns in the regions of the Iceland low and Azores and Siberian high weakened from the long-term mean
Figure 5e).
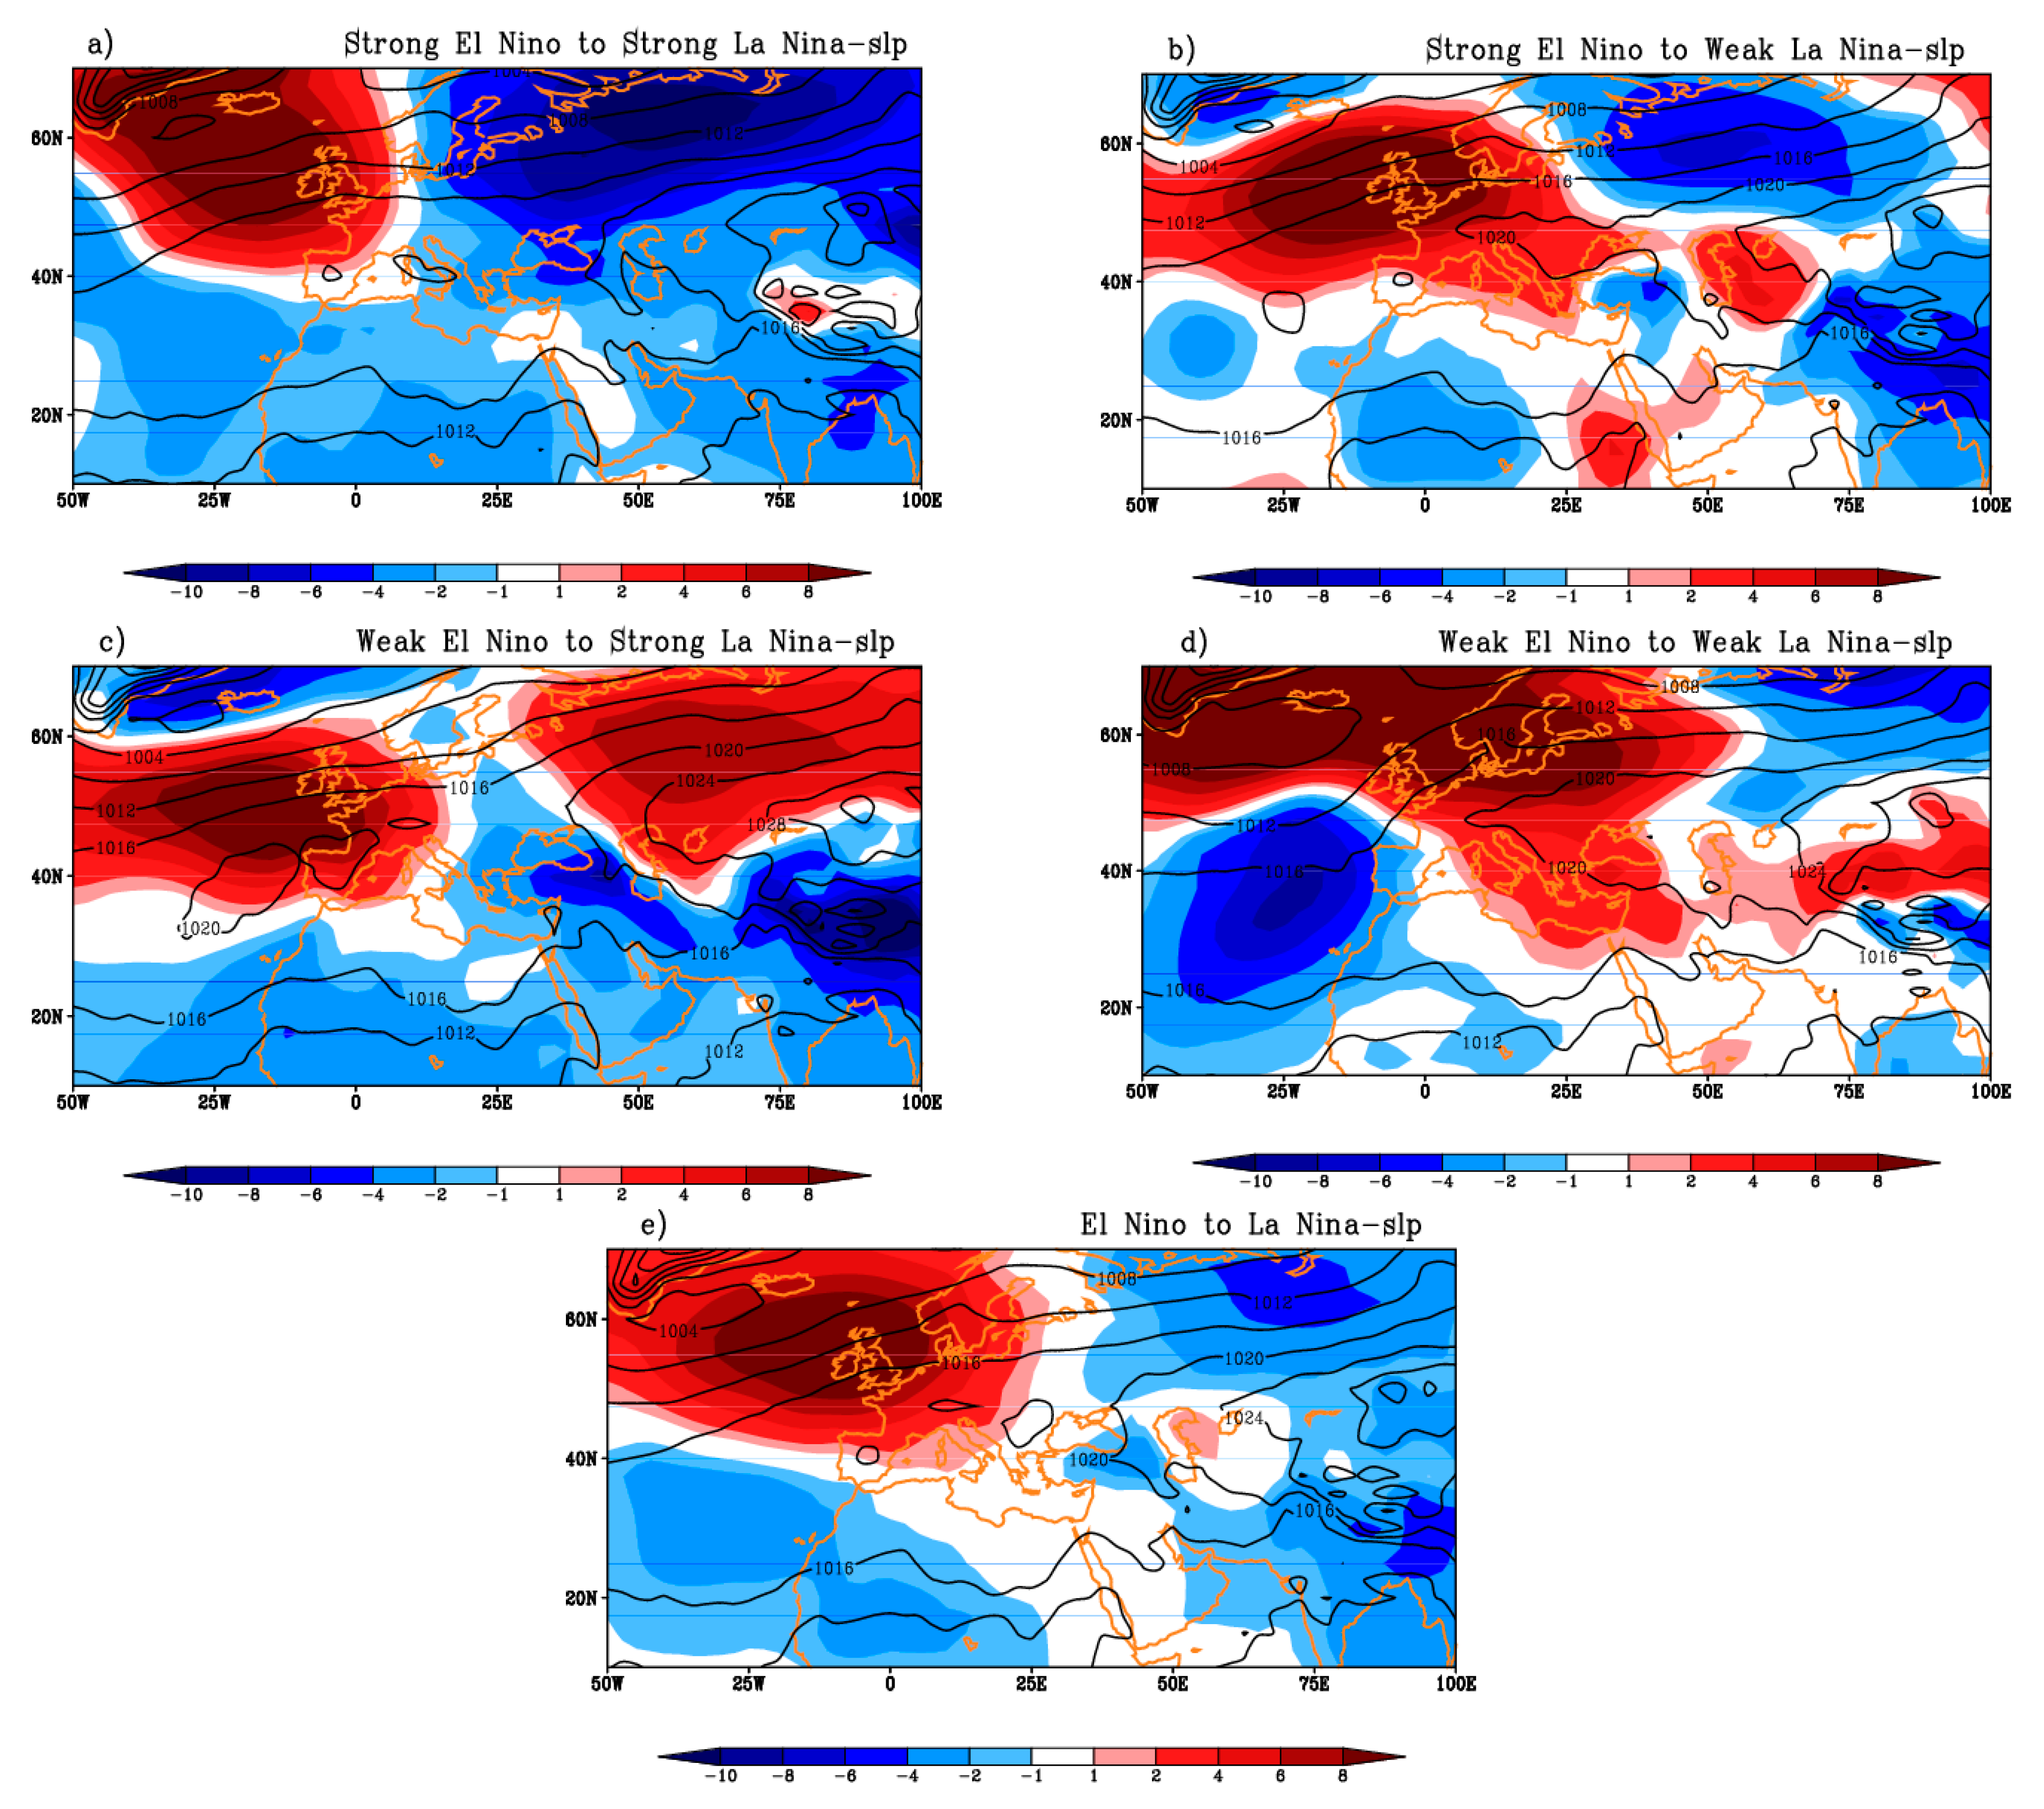
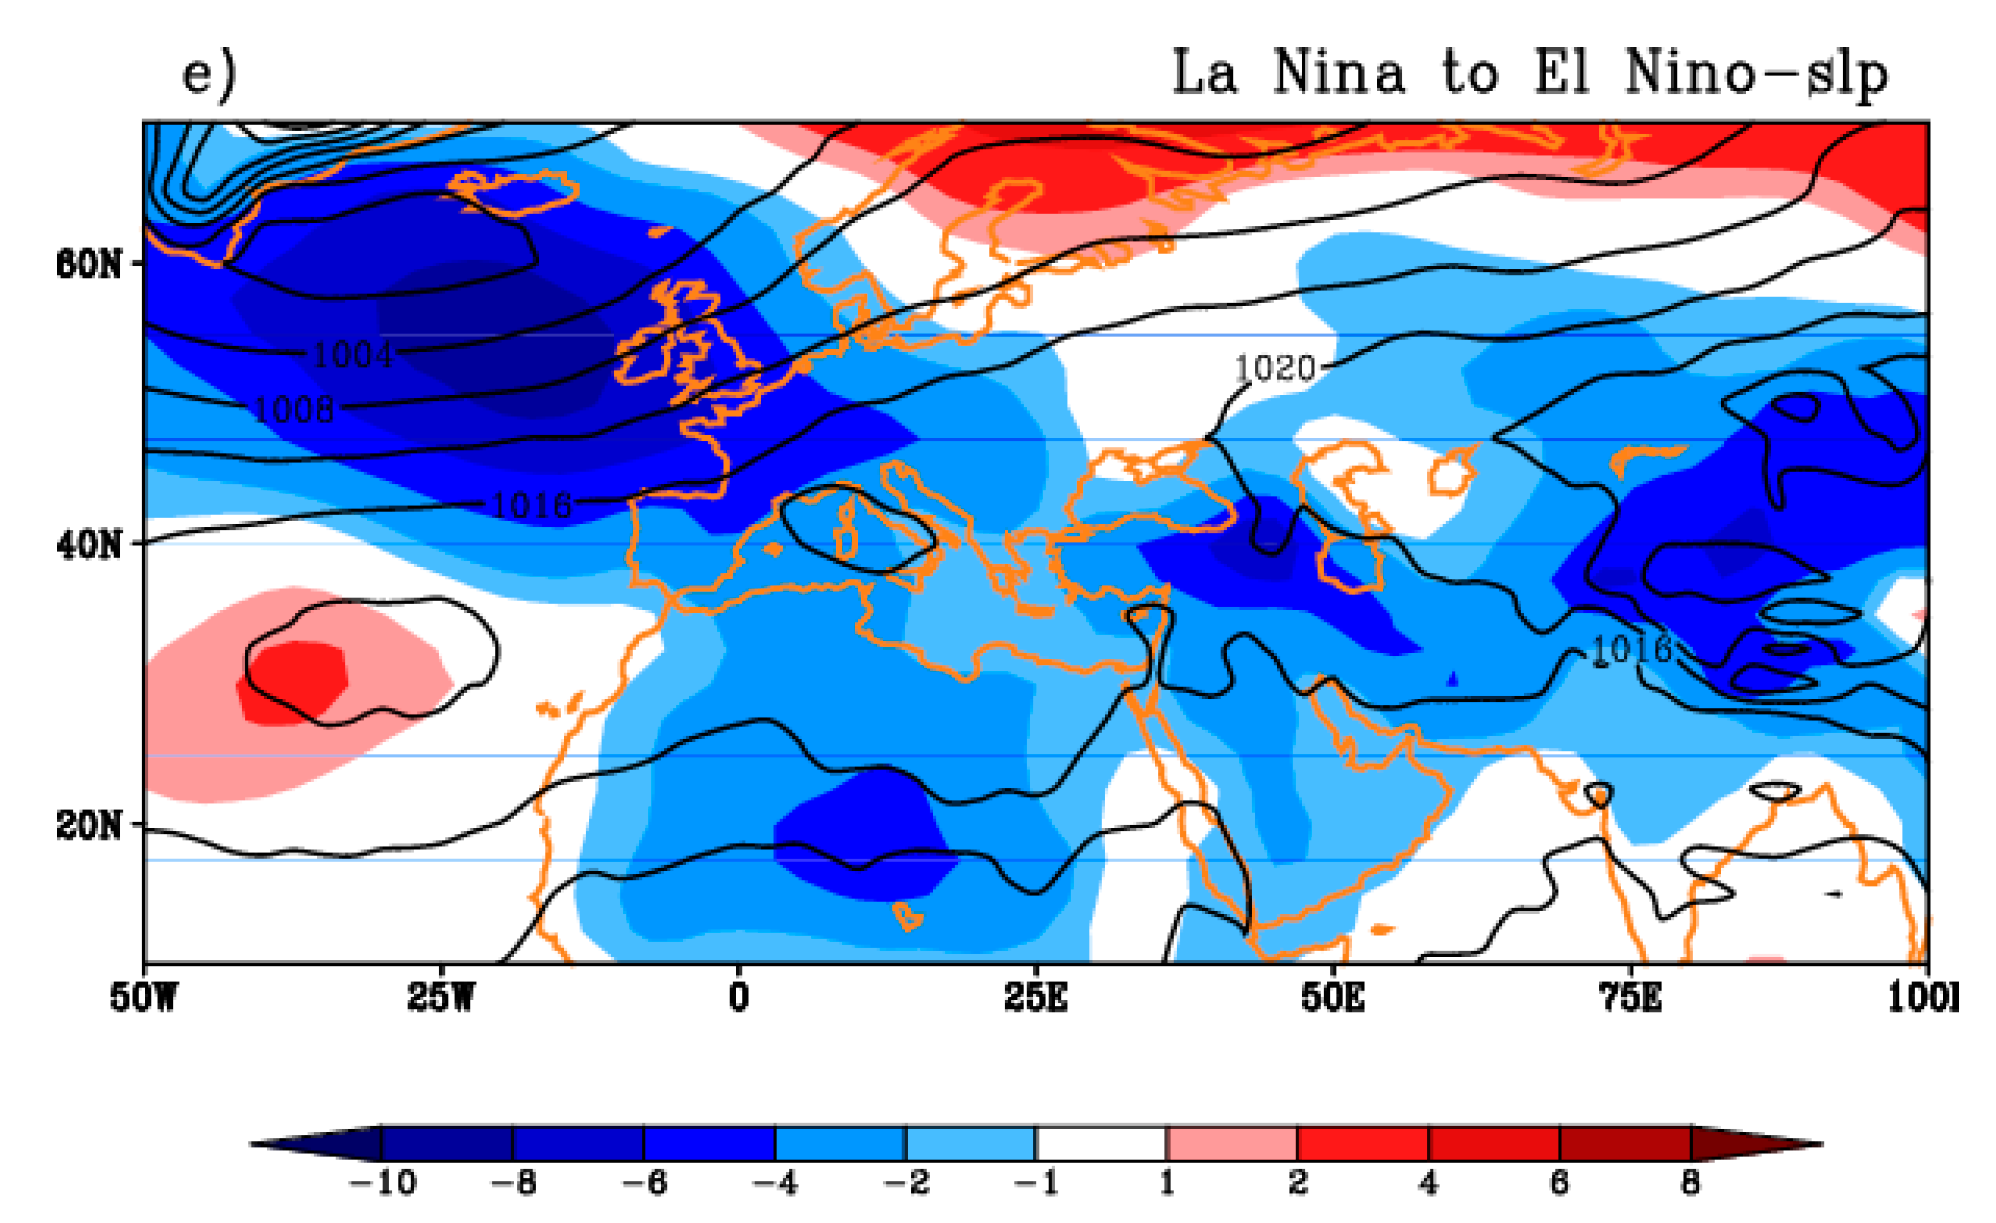
As
Figure 6 shows, strengthening of the Iceland low pressure to the south and east was the most remarkable feature in all cases of transition from La Niña to El Niño, which was more pronounced in the case of SL-WE. In this case, Iceland low tongues extended to the central Europe and Mediterranean Sea. The Mediterranean Sea low pressure deepened and experienced strong negative anomaly up to −8 hPa. With the exception of WL-WE, similar conditions were observed in all other subtypes. In the case of weak La Niña to weak El Niño transition, although the Iceland low spread eastward and to some extent south, it did not greatly affect the Mediterranean Sea. However, the Mediterranean Sea was then affected by expansion of Azores high pressure and experienced strong positive pressure anomaly. In the case of SL-WE, as in 1976, simultaneously with the reinforcement and displacement of Siberian anticyclone to the south and east, we found higher than normal values of pressure over eastern half of Iran. The most obvious point in the case of ENSO phase transition from weak La Niña to strong El Niño is the strong negative pressure anomaly from 50° W to 75° E and 20° to 45° N, including most parts of Atlantic, center of Europe, and North Africa, as well as the Mediterranean Sea, West Asia, and also Iran. In all parts of Iran, pressure anomaly was negative, varying from −2 hPa in the south to −10 hPa in the northwest (
Figure 6c). According to
Table 1, the year 2006 was the only case that ENSO phase changed from weak La Niña to weak El Niño. In this year, the pressure center of Azores high was shifted west and also strengthened (
Figure 6d). Pressure over the Mediterranean Sea increased 8 hPa relative to long mean, while Siberian high weakened and Iceland low pressure was reinforced by moving to the south. The pressure anomaly over northwest/southwest parts was respectively positive/negative, with no change in other parts.
Figure 6e shows the composite and anomaly values of SLP in the average of all four subtypes of phase transition type 2. According to this figure the pressure centers over the north and south of the Atlantic Ocean were strengthened, while the Siberian high weakened. The most notable pattern for type 2 transition years was the positive correlation between Iceland low and Azores high and also negative correlation between them and Siberian high. The reinforcement of the Iceland low pressure with northwest–southeast axis along to the Mediterranean Sea up to −8 hPa with the strengthening of Azores high simultaneously with the southwestern weakening of Siberian high appear to be the most important synoptic factors potentially affecting the autumn rainfall over Iran during ENSO phase transition type 2 years.
In order to evaluate the statistical significance of the SLP variations shown in
Figure 5 and
Figure 6, we used Student’s
t-test, for which results are summarized in
Table 5 (significant regions are shaded green in Figure 9d–f).
According to
Table 5, pressure changes over north and South Atlantic Ocean during all subtypes were significant, especially in the case of SE (SL) to SL (SE) at 95% confidence level. The most significant values in the case of WE (WL) to SL (SE) were related to the Mediterranean region and the center of the Atlantic Ocean. Moreover, the most significant values over Iran were found during the case of SE (SL) to SL (SE).
Generally, as Figure 9d–f shows over all subtypes, the highest statistical significance for difference in SLP was observed over the Iceland low pressure area at the 99% confidence level (shaded area in green). At the 95% confidence level, the Azores high pressure area further south in the Atlantic showed negative and also significant values, while the other areas under study did not show any significant values at this level. At 75% confidence level, we could also see significant differences over northern parts of Iran, west Mediterranean, and some parts of the Siberian high. Sea level pressure variations for other regions, including the southern half of Iran and the eastern Mediterranean, did not show significant values at 75% confidence level (Figure 9). Therefore, the pressure anomalies observed in the Azores high and Iceland low pressure and also east Mediterranean Sea, as well as the pressure variations in the northern parts of Iran, as expressed previously, all showed some significance for difference between type 1 and type 2 ENSO transition years.
4.4. Precipitation
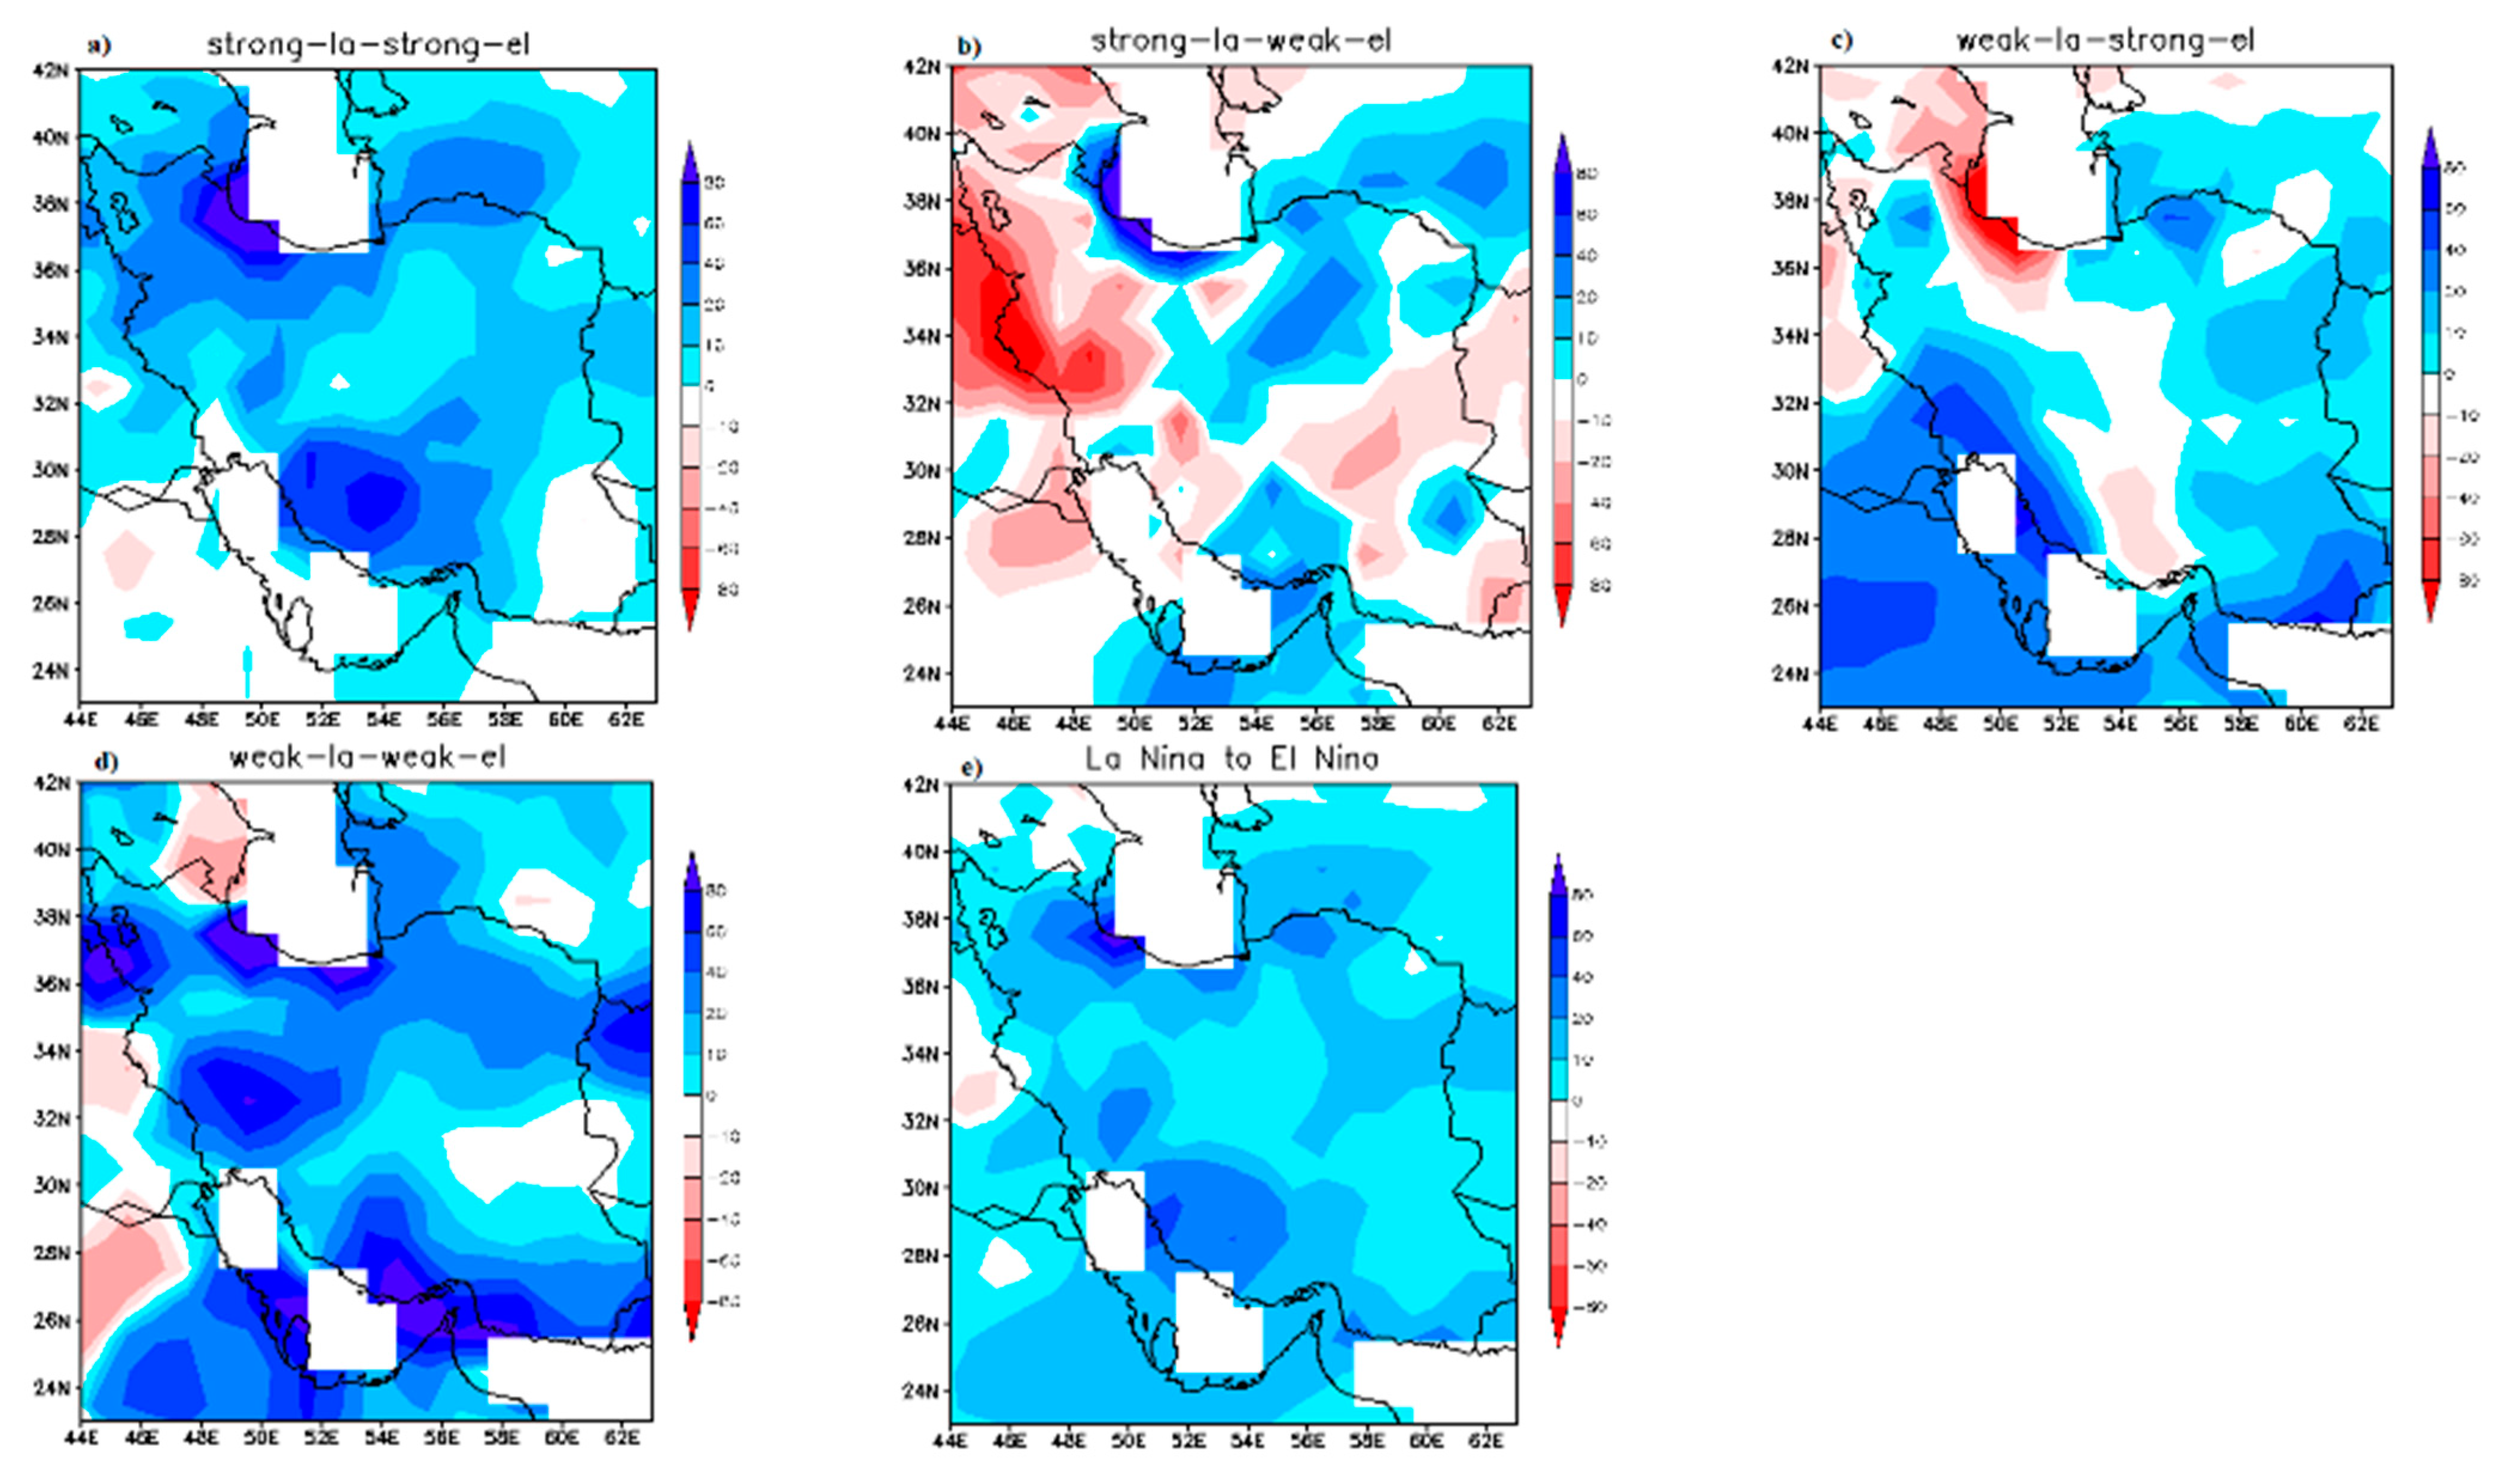
Figure 7 shows the reanalysis precipitation anomalies for all cases of ENSO phase transition type 1 (listed in
Table 1). Shaded areas indicate positive (negative) anomalies in blue (red). Rainfall in most parts of Iran decreased significantly in type 1 transition years compared to the long-term average, especially in the cases of SE-SL and SE-WL. During SE-SL case (
Figure 7a), maximum negative anomalies of −80 mm/month were detected over the west, southwest, and north of Iran. Generally, precipitation anomaly in all parts of country was negative and varied from −10 mm in the southeast and central areas to −80 mm/month in western parts
Figure 7b reveals the precipitation anomaly in the case of SE-WL. As the figure shows, almost the whole country experienced a negative precipitation anomaly of up to −60 mm/month. According to
Table 1, in 1954, 1970, and 2007, ENSO phase changed from weak El Niño to strong La Niña, and in these years, precipitation in the center and southwest of Iran increased compared to the long-term mean by about 60 mm/month, while in other parts of country it decreased or showed no change (
Figure 7c). In the case of WE-WL, precipitation in the southern half of country was substantially higher than the long-term mean, while on the contrary, precipitation was lower than normal in the west, northwest, and northeast, and was near normal in the central regions (
Figure 7d). On average, during ENSO phase transition type 1 years, autumn precipitation in all of Iran was below or similar to average (
Figure 7e).
The most remarkable point in precipitation anomaly during all cases of type 2 transitions is the considerable precipitation enhancement compared to climatology and especially compared to type 1. This enhancement was seen in particular for the two subtypes of WL-WE and SL-SE. As
Figure 8a,d respectively shows, precipitation throughout the whole country enhanced by about 10 up to 80 mm/month. In the case of SL-WE, precipitation anomalies varied between different parts of Iran. Some areas in the south, north, northeast, and center had a positive anomaly up to 60 mm/month, while in other regions, precipitation was below normal, particularly in the west, where a
60 mm/month anomaly was found (
Figure 8b). During transition from weak La Niña to strong El Niño, precipitation anomaly in nearly all regions was positive (
Figure 8c). Generally, when ENSO phase changed from any type of La Niña to any type of El Niño, mean precipitation anomaly was positive in all regions of studied area, by 10 to 80 mm/month (
Figure 8e). These results from the NCEP/NCAR reanalysis, which provided gridded precipitation estimates that covered the entire study period, were consistent with those found using the available station data, which were shown earlier.
Statistical significance of precipitation differences between the two types (ENSO phase transition type 1 and type 2) and also all eight subtypes was calculated at different confidence levels. Areas of different significance levels are given in
Table 6 and
Figure 9g–i. Significant values were found at 85% and 95% confidence level over the whole and northern part Iran, respectively, in the case of SE (SL) to SL (SE), and then during WE (WL) to WL (WE) almost over the whole country at 75% and 85%. The other important point obtained in this section is the statistically significant values over south and east of Iran during the WE (WL) to SL (SE) at 85% confidence level (
Table 6).
The differences between
Figure 7e and
Figure 8e for two transition types across subtypes showed some areas of statistically significant differences between the averages
Figure 9g–i). As
Figure 9g shows, differences at 99% confidence level were statistically significant over areas located at 44° to 51° east longitude and 34° to 38.5° north latitude in the northwest and northeast of Iran. At the 95% confidence level (
Figure 9h), in addition to areas of northwest and northeast, some regions in the west and east were also statistically significant. At the 75% confidence level, nearly all of Iran, with the exception of some of the center of the country, showed statistically significant precipitation differences (
Figure 9i).
In general, the results show that there was significantly more autumn precipitation during type 2 as compared to type 1 ENSO phase transitions over nearly all parts of Iran, which could be a useful contributor for future seasonal forecasts.
5. Discussion
Synoptic–dynamic patterns affecting Iran’s autumn rainfall during different types of ENSO phase transitions were analyzed using NCEP-NCAR reanalysis data after first confirming the association of precipitation anomalies with ENSO transitions using station precipitation data. Our study showed that Iran’s climate was significantly affected by different phases of ENSO transition, which is broadly in agreement with previous findings on the general relationship of ENSO with Iran’s climate [
7].
We also found that the Atlantic Ocean was a location of wave convergence that travels from North America into the region, in agreement with the previous findings by Rezaeian et al. [
22]. That study examined the relation between the Mediterranean storm track and the North Atlantic Oscillation, finding an impact of the North Atlantic storm track on the Mediterranean storm track, especially under negative NAO conditions.
Over the center and some southern parts of the North Atlantic Ocean, a statistically significant relative reception area was found in all cases of ENSO transition type 1, in contrast with the situation of phase transition type 2 when this area acted as a relative wave sink. It could be concluded that these convergence centers over the Atlantic were special features of the wave activity status during transition phase type 1. The other important point for phase transition type 1 was that the Middle East and Iran were the location of convergence–divergence of the waves. Since the region of convergence–divergence (alternately, divergence–convergence) was the area that received minimum (maximum) wave packet, in the period of ENSO transition phase from all types of El Niño to all types of La Niña, no significant wave convergence zone was found in the area under study, which was in contrast with the type 2 cases. In type 2, wave activity values were greater than type 1 over the Atlantic Ocean, and the main wave emission area included a wide divergence region from the center and southern part of the ocean to the east and northeast, which was in contrast with type 1.
The composite analysis of SLP showed the significant weakening of the Iceland low and Azores high pressure up to 10 and −6 hPa, respectively, for ENSO transition type 1, especially for phase changes from SE to SL and WE to WL. In general, these changes showed a negative and positive correlation with the anomaly of pressure on Iran, respectively. Moreover, the two pressure centers strengthened more than −10 and 8 hPa, respectively, in type 2. In addition, we found that the Siberian high pressure in both types, but particularly in type 2, weakened to the southwest. Student’s
t-test revealed that the most statistically significant pressure differences at 99% were related to the Iceland low pressure over the North Atlantic Ocean. Moreover, the pressure variations over the Azores high were significant at the 95% confidence level. Areas of northern Iran and also the eastern Mediterranean and south Siberian high had significant pressure differences at the 75% confidence level. As a summary, one of the most important results obtained in this study was the significance of pressure anomalies in Iceland–Azores and Siberian pressure centers at different statistical levels. Negative (positive) correlation of Iceland low pressure in transition phase type 1 (type 2), positive (negative) correlation of Azores high in type 1 (type 2), and also positive correlation of Siberian high pressure in both types with SLP anomalies over Iran were found, which is consistent with the results obtained in the study of Bahrami et al. (2018) [
10] for the northern Middle East, including Iran. However, unlike the previous research, in this study, we also concluded that the southwest extension of the Siberian high pressure tongue towards the region was statistically significant at the 75% confidence level.
Analysis of precipitation anomaly showed significant negative values over the northwest of Iran during phase transition type 1. Maximum anomaly values belonged to the case of SE-SL and then SE-WL. In these two cases, the whole country had negative to normal precipitation values, while in the two other cases, some parts of center and south of Iran had above-average precipitation. The results obtained from the case of SE-SL are more consistent with the pervious study by Bahrami et al. [
9], which found that when ENSO changes from strong El Niño to weak La Niña, autumn rainfall decreases strongly, up to 100%, for more than 70% of Iran’s synoptic stations. Moreover, for type 1 transitions, areas located at 44° to 51° east longitude and 34° to 38.5° north latitude in the northwest and northeast of Iran experienced a significant negative precipitation anomaly that was statistically significant at the 99% confidence level. During phase transition type 2 years, autumn precipitation was enhanced in most regions of Iran compared with long-term mean in phase transition type 2. The most positive precipitation anomaly in type 2 was related to the case of WL-WE, followed by SL-ST. Overall, during type 2 transition years, almost all regions of Iran had positive precipitation anomaly. The northwest parts had the maximum positive anomaly up to 60 mm/month, and also the most statistically significant departures from type 1. Perhaps because we focused on a subset of transition years, our results are in contrast with Ahmadi-Givi et al. [
4], who studied ENSO’s effect on the seasonal precipitation of Iran and concluded that there is no certain relation between rainfall anomalies over Iran and the different phases of ENSO activity. Our results are more consistent with [
28], which concluded that the ENSO impact on southwest and central Asia precipitation is greatest in the transition seasons of autumn and spring. In fact, it was already known that the El Niño (La Niña) events represent moist (dry) conditions over the Middle East region [
29], but in this research, we quantified how rainfall fluctuations over Iran can be affected by the transition of ENSO phases.
Given that ENSO phase evolution is fairly predictable at least once a spring ‘predictability barrier’ is crossed [
30,
31], our research provides a basis for improved seasonal forecasting of precipitation anomalies over Iran. Such capabilities could potentially assist in water resources planning by providing warning of probable drought or flood conditions, as has been proposed and implemented elsewhere in South Asia [
32,
33,
34,
35].
6. Conclusions
The main purpose of this study was to investigate the behavior of wave activity flux as well as sea level pressure during different cases of ENSO phase transitions and their possible impact on Iran autumn precipitation.
Through the study of wave activity flux (WAF) pattern fluctuation during different phases of ENSO transition, we found that the WAF and its divergence on average leave different signals across transition types. In type 1 transitions, a significant wave propagation area was found over the northeastern part of the Atlantic, which was responsible for a remarkable value of wave activity flux sent eastward to northern Europe, while for type 2, the main divergence area was located on southern North Atlantic and affected the Mediterranean Sea, Central Europe, and North Africa through eastward and northeastward wave propagation. Thus, for type 1 transitions, the Mediterranean region acts as a wave receiver area, while for type 2, waves propagate from the Mediterranean Sea to the east toward the Middle East and Iran. Hence, in type 2/type 1 transitions, Iran tended to be located at the border of a divergence–convergence/convergence–divergence area, respectively, which suggests that this region then received more/fewer Rossby waves.
By study of the SLP variation, significant pressure anomalies over Iceland–Azores and Siberian pressure centers at different significance levels were found. Negative (alternately, positive) correlation between Iceland low pressure and Iran in transition phase type 1 (type 2) was detected. Moreover, positive (negative) correlation of Azores high in type 1 (type 2) as well as positive correlation of Siberian high pressure in both types with SLP anomalies over Iran was found.
Using the Student t-test, the most statistically significant SLP anomalies were observed over Iceland low and Azores high pressure at the 99% and 95% confidence levels, respectively. Over the northern parts of Iran, western Mediterranean, and some parts of the Siberian high region, SLP difference between transition types was significant at 75% confidence level.
Finally, the composite analysis of precipitation anomaly showed significant negative values over the northwest of Iran during ENSO phase transition type 1. During type 2, although in some sub-cases the precipitation did not show regular positive changes (which may have been due to the small number of years in some sub-cases), on average, almost all of Iran showed positive precipitation anomaly. The difference between the type 1 and type 2 precipitation averages was statistically significant at the 99% confidence level for the northern part of the country. Generally, using reanalysis data and confirmed by station observations, during ENSO phase transition type 1, the whole country experienced low precipitation, while in type 2, on average, most regions of Iran had above average precipitation, and the difference in mean precipitation between the two transition types was statistically significant at 75% confidence level or higher over most of the country. One of the most important results in this study was therefore the statistical significance of precipitation anomaly in different types of ENSO phase transition.
On the basis of our analysis, when ENSO changes from El Niño to La Niña (type 1)/from La Niña to El Niño (type 2), wave activity flux is significantly low (alternately, high) over the Atlantic Ocean and also is high (alternately, low) over the Mediterranean Sea, causing Iran to receive fewer/more Rossby waves. Thus, Iran is the location of divergence/convergence of waves during these periods, which is an effective factor in respectively reducing/increasing rainfall over the region. Moreover, pressure patterns showed completely different behavior between the transition types. Significant weakening/strengthening of the Iceland low pressure area in contrast to strengthening/weakening of Azores high pressure and consequently increasing/decreasing of pressure values over Iran compared to the long-term average are suggested as another important factor leading to a marked negative (positive) precipitation anomaly over Iran during nearly all cases of ENSO phase transition type 1 (type 2).
Finally, the most important finding of our work is the significant rainfall reduction during all years of four sub-cases of ENSO transition phase type 1, while some type 2 transition years experienced normal/less than normal values, which should be examined in more detail in future studies. Moreover, our study suggested that the autumn precipitation anomaly difference over Iran is statistically significant at a 99% confidence level, especially for the northern half of the country.
Author Contributions
Conceptualization, F.B. and A.R.S., methodology, F.B. and A.R.S., software: F.B., validation, N.Y.K. and A.R.S., formal analysis: F.B. and N.Y.K., investigation, F.B. and A.R.S., resources, T.M. and F.S.S., Data curation, N.Y.K. and T.M., Writing original draft preparation, F.B. and A.R.S., Writing Review and editing, F.B. and N.Y.K., visualization, F.S.S., supervision, N.Y.K. and A.R.S., project administration, F.B., funding acquisition, N.Y.K. All authors have read and agreed to the published version of the manuscript.
Funding
The authors received no financial support for the research, authorship, and/or publication of this article.
Institutional Review Board Statement
Not applicable.
Informed Consent Statement
Not applicable.
Data Availability Statement
Conflicts of Interest
The authors declare no conflict of interest.
Ethics Approval
This material is the authors’ own original work that has not been previously published elsewhere, and also the paper is not currently being considered for publication elsewhere.
References
- Nazemosadat, M.J.; Samani, N.; Barry, D.A.; Niko, M.M. Enso forcing on climate change in Iran: Precipitation analysis. Iran. J. Sci. Technol. Trans. B Eng. 2006, 30, 555–565. [Google Scholar]
- Ghasemi, A.R. Meteorological Drought in Iran and Its Association with the El Nino Southern Oscillation and the Caspian Sea Surface Temperature. Master’s Thesis, Department of Arid Region Management, University of Shiraz, Shiraz, Iran, 2003. [Google Scholar]
- Ahmadi-Givi, F.; Parhizkar, D.; Hajjam, S. The study of the ENSO’s Effect on the Seasonal Precipitation of Iran in the Period 1971–2000. J. Earth Space Phys. 2010, 35. Available online: https://jesphys.ut.ac.ir/article_21447.html (accessed on 1 January 2010).
- Azmoodehfar, M.H.; Azarmsa, S.A. Assessment the Effect of ENSO on Weather Temperature Changes Using Fuzzy Analysis (Case Study: Chabahar). APCBEE Procedia 2013, 5, 508–513. [Google Scholar] [CrossRef] [Green Version]
- Alizadeh-Choobari, O. Contrasting global teleconnection features of the eastern Pacific and central Pacific El Niño events. Dyn. Atmos. Oceans 2017, 80, 139–154. [Google Scholar] [CrossRef]
- Nikraftar, Z.; Khaniani, A.S. Assessing the impact of cold and warm enso on drought over Iran. Earth Obs. Geomat. Eng. 2018, 2, 45–55. Available online: https://eoge.ut.ac.ir/article_66950_1a455a59e5fb212b5d6ce937cdbc2b80.pdf (accessed on 1 December 2017).
- Nazemosadat, M.J.; Cordery, I. On the relationships between enso and autumn rainfall in Iran. Int. J. Climatol. 2000, 20, 47–61. [Google Scholar] [CrossRef]
- Nazemosadat, M.J.; Ghasemi, A.R. Quantifying the ENSO-related shifts in the intensity and probability of drought and wet periods in Iran. J. Clim. 2004, 17, 4005–4018. [Google Scholar] [CrossRef]
- Bahrami, F.; Saadatabadi, A.R.; Meshkatee, A.H.; Kamali, G. Autumn rainfall anomalies and regional atmospheric circulation along establishment of weak la Nina after strong el Niño in Iran. Iran. J. Geophys. 2020, 13, 1–15. [Google Scholar]
- Bahrami, F.; Saadatabadi, A.R.; Meshkatee, A.H.; Kamali, G. The Impact of ENSO Phase Transition on the Atmospheric Circulation, Precipitation and Temperature in the Middle East Autumn. Asia-Pac. J. Atmos. Sci. 2020, 56, 439–453. [Google Scholar] [CrossRef]
- Hurrell, J.W.; Van Loon, H. Decadal variations in climate associated with the north Atlantic oscillation. Clim. Chang. 1997, 36, 301–326. [Google Scholar] [CrossRef]
- Rodwell, M.J.; Rowell, D.P.; Folland, C.K. Oceanic forcing of the wintertime North Atlantic Oscillation and European climate. Nat. Cell Biol. 1999, 398, 320–323. [Google Scholar] [CrossRef]
- Eshel, G.; Farrell, B.F. Mechanisms of Eastern Mediterranean Rainfall Variability. J. Atmos. Sci. 2000, 57, 3219–3232. [Google Scholar] [CrossRef]
- Eshel, G.; Cane, M.A.; Farrell, B.F.; Eshel, G.; Cane, M.A.; Farrell, B.F. Forecasting Eastern Mediterranean Droughts. Mon. Weather Rev. 2000, 128, 3618–3630. [Google Scholar] [CrossRef] [Green Version]
- Chang, E.K.M.; Yu, D.B. Characteristics of Wave Packets in the Upper Troposphere. Part I: Northern Hemisphere Winter. J. Atmos. Sci. 1999, 56, 1708–1728. [Google Scholar] [CrossRef]
- Lee, S. Barotropic effects on atmospheric storm tracks. J. Atmos. Sci. 2000, 57, 1420–1435. [Google Scholar] [CrossRef]
- Hakim, G.J. Developing wave packets in the north pacific storm track. Mon. Weather. Rev. 2003, 131, 2824–2837. [Google Scholar] [CrossRef]
- Trigo, I.F.; Davies, T.D.; Bigg, G.R. Objective Climatology of Cyclones in the Mediterranean Region. J. Clim. 1999, 12, 1685–1696. [Google Scholar] [CrossRef] [Green Version]
- Orlanski, I.; Edmund, K.; Chang, M. Ageostrophic geopotential uxes in downstream and upstream development of baroclinic waves. J. Atmos. Sci. 1993, 50, 212–225. [Google Scholar] [CrossRef] [Green Version]
- Edmund, K.; Chang, M. Wave packets and life cycles of troughs in the upper troposphere: Examples from the south-ern hemisphere summer season of 1984/85. Mon. Weather. Rev. 2000, 128, 25–50. [Google Scholar] [CrossRef]
- Nasr-Esfahany, M.A.; Ahmadi-Givi, F.; Mohebalhojeh, A.R. An energetic view of the relation between the Mediterranean storm track and the North Atlantic Oscillation. Q. J. R. Meteorol. Soc. 2011, 137, 749–756. [Google Scholar] [CrossRef]
- Rezaeian, M.; Mohebalhojeh, A.R.; Ahmadi-Givi, F.; Nasr-Esfahany, M. A wave-activity view of the relation between the Mediterranean storm track and the North Atlantic Oscillation in winter. Q. J. R. Meteorol. Soc. 2016, 142, 1662–1671. [Google Scholar] [CrossRef]
- Trenberth, K.E.; Stepaniak, D.P. Indices of El Nino evolution. J. Clim. 2001, 14, 1697–1701. [Google Scholar] [CrossRef] [Green Version]
- Hanley, D.E.; Bourassa, M.A.; O’Brien, J.J.; Smith, S.R.; Spade, E.R. A Quantitative Evaluation of ENSO Indices. J. Clim. 2003, 16, 1249–1258. [Google Scholar] [CrossRef]
- Glantz, M.H.; Ramirez, I.J. Reviewing the Oceanic Niño Index (ONI) to Enhance Societal Readiness for El Niño’s Impacts. Int. J. Disaster Risk Sci. 2020, 11, 394–403. [Google Scholar] [CrossRef]
- Penalba, O.C.; Rivera, J.A. Precipitation response to El Niño/La Niña events in Southern South America–emphasis in regional drought occurrences. Adv. Geosci. 2016, 42, 1–14. [Google Scholar] [CrossRef] [Green Version]
- Takaya, K.; Nakamura, H. A formulation of a phase-independent wave-activity flux for stationary and migratory quasigeostrophic eddies on a zonally varying basic flow. J. Atmos. Sci. 2001, 58, 608–627. [Google Scholar] [CrossRef]
- Mariotti, A. How ENSO impacts precipitation in southwest central Asia. Geophys. Res. Lett. 2007, 34, 0094–8276. [Google Scholar] [CrossRef]
- Kumar, K.N.; Ouarda, T.B.M.J.; Sandeep, S.; Ajayamohan, R.S. Wintertime precipitation variability over the Arabian Peninsula and its relationship with ENSO in the CAM4 simulations. Clim. Dyn. 2016, 47, 2443–2454. [Google Scholar] [CrossRef]
- Larson, S.M.; Kirtman, B.P. Drivers of coupled model ENSO error dynamics and the spring predictability barrier. Clim. Dyn. 2016, 48, 3631–3644. [Google Scholar] [CrossRef]
- Tippett, M.K.; Ranganathan, M.; L’Heureux, M.; Barnston, A.G.; Delsole, T. Assessing probabilistic predictions of ENSO phase and intensity from the North American Multimodel Ensemble. Clim. Dyn. 2017, 53, 7497–7518. [Google Scholar] [CrossRef] [Green Version]
- Mason, S.J.; Stephenson, D.B. How do we know whether seasonal climate forecasts are any good? In Seasonal Climate: Forecasting and Managing Risk; Nato Science Series: IV: Earth and Environmental Sciences; Springer: Berlin/Heidelberg, Germany, 2008; Volume 82, pp. 259–289. [Google Scholar] [CrossRef]
- Barnston, A.G.; Li, S.; Mason, S.J.; DeWitt, D.G.; Goddard, L.; Gong, X. Verification of the First 11 Years of IRI’s Seasonal Climate Forecasts. J. Appl. Meteorol. Clim. 2010, 49, 493–520. [Google Scholar] [CrossRef]
- Charles, S.P.; Wang, Q.J.; Ahmad, M.-U.-D.; Hashmi, D.; Schepen, A.; Podger, G.; Robertson, D.E. Seasonal streamflow forecasting in the upper Indus Basin of Pakistan: An assessment of methods. Hydrol. Earth Syst. Sci. 2018, 22, 3533–3549. [Google Scholar] [CrossRef] [Green Version]
- Krakauer, N.Y. Year-ahead predictability of South Asian Summer Monsoon precipitation. Environ. Res. Lett. 2019, 14, 044006. [Google Scholar] [CrossRef]
| Publisher’s Note: MDPI stays neutral with regard to jurisdictional claims in published maps and institutional affiliations. |
© 2021 by the authors. Licensee MDPI, Basel, Switzerland. This article is an open access article distributed under the terms and conditions of the Creative Commons Attribution (CC BY) license (https://creativecommons.org/licenses/by/4.0/).


 ,
, 


