Article

Performance Evaluation and Comparison of Satellite-Derived Rainfall Datasets over the Ziway Lake Basin, Ethiopia

by
Aster Tesfaye Hordofa
1,*,
Olkeba Tolessa Leta
2,
Tena Alamirew
3,
Nafyad Serre Kawo
4 and
Abebe Demissie Chukalla
5
1
Africa Centre of Excellence for Water Management, Addis Ababa University, Addis Ababa 1176, Ethiopia
2
Bureau of Watershed Management and Modeling, St. Johns River Water Management District, 4049 Reid Street, Palatka, FL 32177, USA
3
Ethiopian Institute of Water Resources, Addis Ababa University, Addis Ababa 1176, Ethiopia
4
School of Natural Resources, University of Nebraska-Lincoln, Lincoln, NE 68583, USA
5
The Department of Land and Water Management, IHE Delft Institute for Water Education, 2611 Delft, The Netherlands
*
Author to whom correspondence should be addressed.
Submission received: 14 May 2021 / Revised: 26 June 2021 / Accepted: 28 June 2021 / Published: 8 July 2021
(This article belongs to the Special Issue Application of Climatic Data in Hydrologic Models)

Abstract

:
Consistent time series rainfall datasets are important in performing climate trend analyses and agro-hydrological modeling. However, temporally consistent ground-based and long-term observed rainfall data are usually lacking for such analyses, especially in mountainous and developing countries. In the absence of such data, satellite-derived rainfall products, such as the Climate Hazard Infrared Precipitations with Stations (CHIRPS) and Global Precipitation Measurement Integrated Multi-SatellitE Retrieval (GPM-IMERG) can be used. However, as their performance varies from region to region, it is of interest to evaluate the accuracy of satellite-derived rainfall products at the basin scale using ground-based observations. In this study, we evaluated and demonstrated the performance of the three-run GPM-IMERG (early, late, and final) and CHIRPS rainfall datasets against the ground-based observations over the Ziway Lake Basin in Ethiopia. We performed the analysis at monthly and seasonal time scales from 2000 to 2014, using multiple statistical evaluation criteria and graphical methods. While both GPM-IMERG and CHIRPS showed good agreement with ground-observed rainfall data at monthly and seasonal time scales, the CHIRPS products slightly outperformed the GPM-IMERG products. The study thus concluded that CHIRPS or GPM-IMERG rainfall data can be used as a surrogate in the absence of ground-based observed rainfall data for monthly or seasonal agro-hydrological studies.

1. Introduction

Climate change and variability trend analyses need consistent and long-term time series climate data [1,2,3,4,5,6,7,8] that are required to study the impact of climate change on the agro-hydrological system [9,10,11]. Such climate studies can benefit from the freely available Global Climate Models (GCMs) outputs such as rainfall data. In addition, complete and long-term rainfall data with high spatial and temporal resolutions are of importance for water resources planning and optimization of crop water productivity especially in water-scarce areas [12,13,14,15,16,17,18,19].
The application of the GCMs rainfall data requires long-term observed-rainfall data for the downscaling and bias correction of coarse resolutions GCMs products into fine resolutions [9,10]. Ground-based rainfall measurement is the most common approach and well recognized as an accurate dataset [20,21]. However, records from the ground-based station are inconsistent over several parts of the world, including Ethiopia [22,23]. Furthermore, available weather stations are inadequate and unevenly distributed to capture rainfall spatial heterogeneity, including less accessibility in remote areas [1,24]. This is a prominent problem, especially in developing countries, including the Ziway Lake Basin [25,26].
The advancement and application of remote sensing technologies offer the possibility of using remotely sensed rainfall data in places where ground-based observed rainfall data are not available [24,27,28,29,30,31]. Several satellite-based rainfall products have been developed with promising approaches for obtaining rainfall estimates at regional and global scales, including blending the ground-based observed rainfall data with remotely sensed data [32]. Some of those satellite-based rainfall products include Tropical Precipitation Measuring Mission Multi-Satellite Precipitation Analysis (TMPA) [33], Precipitation Estimation from Remote Sensed Information using Artificial Neural Networks (PERSIAN) [34], Climate Hazards Infrared Precipitation with Stations (CHIRPS) [35], and Global Precipitation Measurement Integrated Multi-SatellitE Retrieval (GPM-IMERG) [36,37].
Globally, several researchers have evaluated the performance of GPM-IMERG rainfall data using ground-based observations or other existing satellite-based rainfall products [28,38,39,40,41]. For example, Tong et al. [38] evaluated the monthly performance of the GPM-IMERG rainfall product using gauge observations at both grid and basin scales for the Nanliu River Basin, Beibu Gulf (Southern coast of China). They concluded that the IMERG showed a high accuracy when detecting light rainfall. Anjum et al. [28] demonstrated IMERG-final run rainfall product estimates by comparing it with gauges and TMPA-based real-time data over the northern highlands of Pakistan at annual, monthly, seasonal, and daily time scale. Their study report showed that the IMERG-final run reasonably well performed than the TMPA-based rainfall estimates. Morsy et al. [40] compared TMPA and IMERG rainfall datasets in the arid environment of El-Qaa Plain, Sinai. They concluded that the IMERG data exhibit superior performance than TMPA in all rainfall intensities. Similarly, Kawo et al. [41] evaluated GPM-IMERG early and late run rainfall estimates with ground gauged rainfall at monthly and seasonal time scales over the Lake Hawassa catchment, Ethiopia. They found that both IMERG-early and late run captured the observed rainfall patterns and values during the rainy season than the dry season.
Many studies have also evaluated the performance of CHIRPS and compared it with ground-based observations at different spatial and temporal scales [31,42,43,44,45,46,47,48,49,50]. For instance, Wu et al. [50] evaluated the performance of the CHIRPS rainfall dataset against ground-based observed rainfall data over the Yunnan Province, China at monthly, annual, and seasonal scales. They found that CHIRPS data performed well in estimating annual and monthly precipitation. Luo et al. [43] evaluated TRMM and CHIRPS rainfall products in the Lower Lancang-Mekong River Basin. They reported that TRMM rainfall products outperformed the CHIRPS rainfall products. Further, Taye et al. [44] evaluated the performance of CHIRPS and Multi-Source Weighted-Ensemble Precipitation (MSWEP) at a monthly time scale over the upper Blue Nile Basin, Ethiopia. They found that CHIRPS better simulated the magnitude of drought than MSWEP in the different elevation zones of the Upper Blue Nile Basin. Goshime et al. [46] conducted a performance evaluation of CHIRPS rainfall product with the gauged rainfall at monthly and daily temporal resolutions over the Lake Ziway Basin, Ethiopia, and concluded that CHIRPS performed better at the monthly time scale. While several studies have been conducted on evaluating the performance of IMERG and CHRIPS, the previous studies have not simultaneously evaluated and compared the performance of the three IMERG runs (early, late, and final) and CHIRPS at different time scales (monthly and seasonal). Therefore, evaluating and comparing the performance of the recently available different rainfall products at two-time scales is of interest for in-depth and better understanding of their performance and appropriately choosing them as a surrogate when ground-based rainfall observations are lacking. Such studies might also help to identify at what time resolution the satellite-based rainfall estimates can appropriately be used as they play a key role in simulating long-term agro-hydrological modeling and in forecasting changes in freshwater supply and agricultural crop yields [51,52]. Thus, the objectives of this study were to evaluate the accuracy of the satellite-based areal rainfall data over the Ziway Lake Basin at different time scales. We evaluated and compared the CHIRPS and GPM-IMERG of early, late, and final runs with the ground-based observed rainfall data from 12 gauging stations. The evaluation was performed at monthly and seasonal time scales from 2000 to 2014. This study might be useful for the alternative application of remotely sensed precipitation products in simulating the agro-hydrological modeling and climate change trend assessment of the Ziway Lake Basin and elsewhere with similar agro-hydrological conditions, in the Central Rift Valley Lake Basin of Ethiopia.

2. Data and Methods

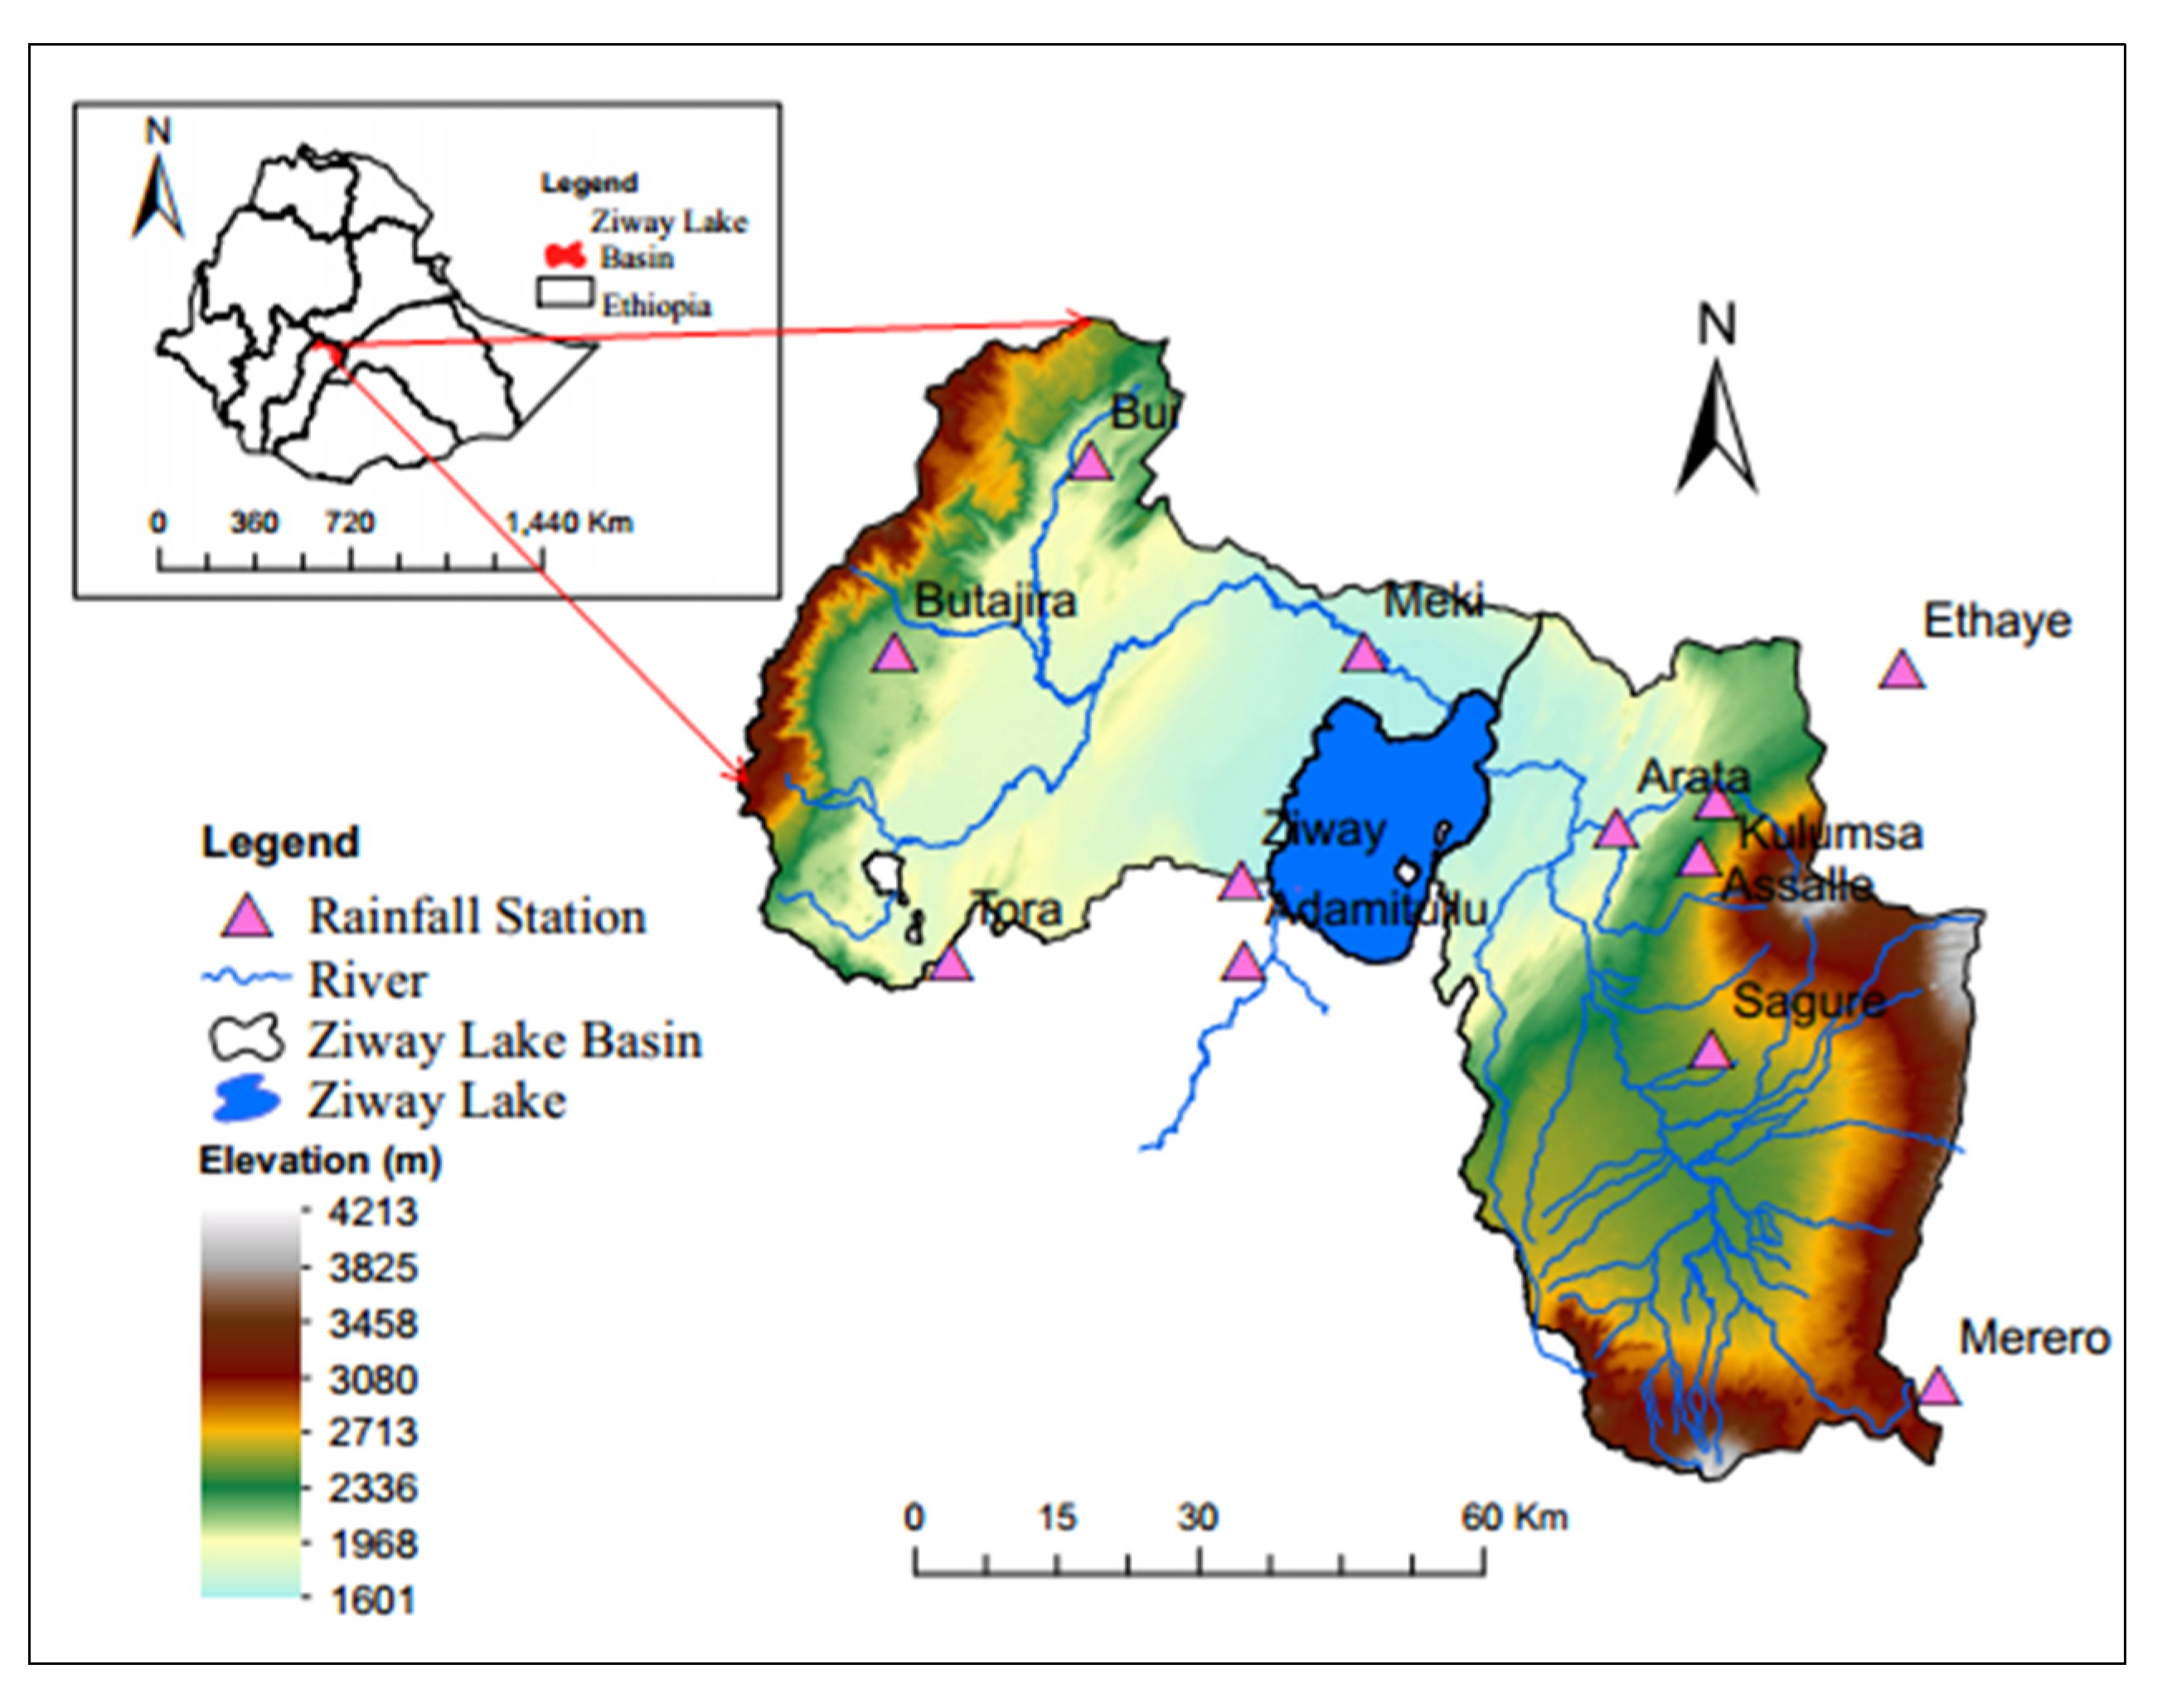
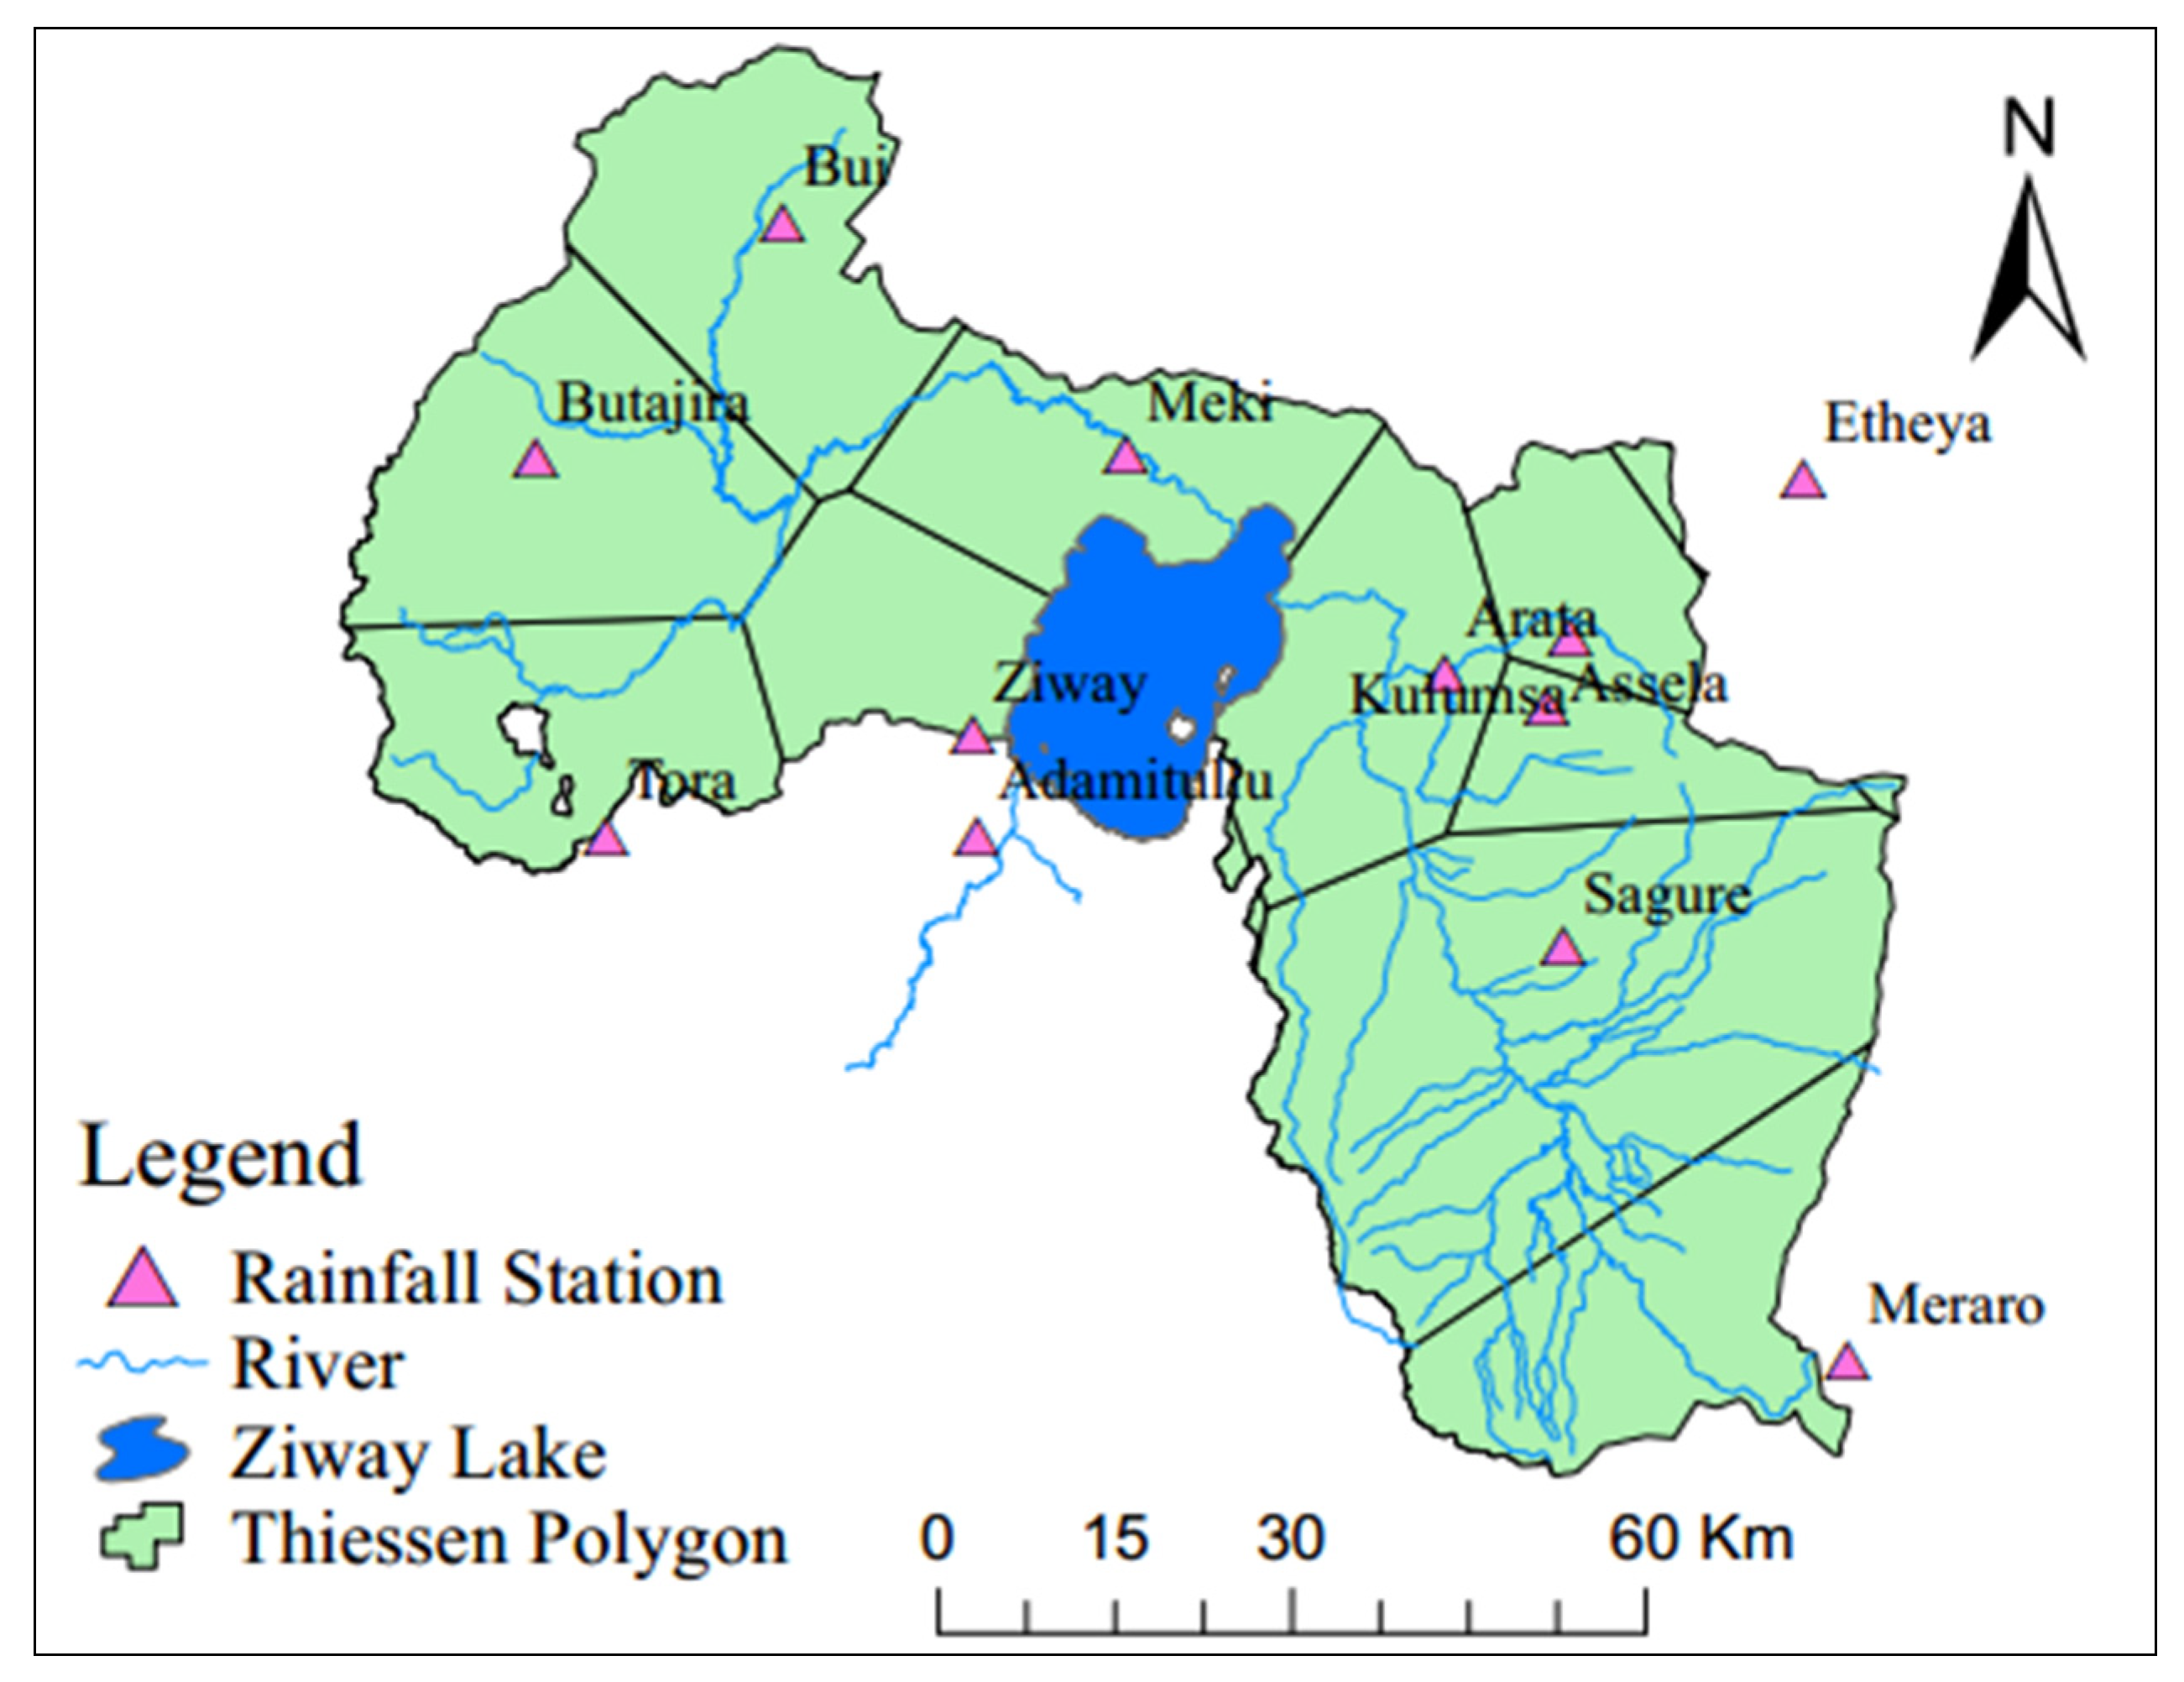
2.1. Study Area Description

Lake Ziway Basin (LZB) is located between 38°00′−39°30′ East longitude and 7°00′−8°30′ North latitude in the Adami Tullu-Jiddo Kombolcha Woreda of the East Shewa Zone, Oromia region, Ethiopia. The basin is about 150 km south of the capital city, Addis Ababa. The town of Ziway (recently named Batu) is situated on the lake’s western shore. The altitude of Lake Ziway is approximately 1636 m above mean sea level (amsl), with a maximum water depth of 4 m, a total basin area of about 7300 km2 (Figure 1) and a lake volume of 1.5 million cubic meters [53]. The majority of the basin is characterized by low to moderately undulating topography but bounded by a steep slope and abrupt faults in the eastern and southeastern escarpments, ranging from 4200 to 1600 m (Figure 1). Lake Ziway Basin experiences the monsoon agro-climate zone characteristics. The rainfall patterns are generally affected by the annual oscillation of the inter-tropical convergence zone that forms wet summer from June to September [54]. The mean annual rainfall of the basin spatially varies from 500 to 1150 mm, with a noticeable temporal variation at a monthly time scale. The mean annual temperature ranges from approximately 15 °C for the highlands to 25 °C close to the lake.

2.2. Data

2.2.1. Ground Observed Data

In this study, the monthly and seasonal rainfall ground-based observed data from 2000 to 2014 were used as a point of reference for evaluating the CHIRPS and GPM-IMERG. We obtained the data from the Ethiopian National Meteorological Agency (NMA). We originally obtained nineteen climate stations distributed over the Ziway Lake basin with different elevation. However, after performing quality and checking consistency of the data, we selected 12 stations that had good quality and consistent temporal coverage (Table 1). Then, we applied Thiessen polygon method in order to calculate the areal weighted rainfall values of the Ziway Lake Basin (ZLB) from the 12 selected stations. Such approach accounts for the areal coverage of each rain gauge station, the spatial distribution and variability of rainfall for the basin [55]. The areal coverage (Thiessen polygon) of the 12 stations is shown in Figure 2.

2.2.2. Satellite Precipitation Products

In this study, we considered and evaluated two Satellite Precipitation Products (SPPs). These are CHIRPS and GPM-IMERG.

CHIRPS Database

CHIRPS was launched in early 2014 by the Climate Hazards Group at the University of California, Santa Barbara (UCSB). The CHIRPS precipitation dataset globally covers 50° S−50° N with a horizontal resolution of 0.05° for both daily and monthly time scales. CHIRPS datasets were originally developed to support the United States Agency for International Development Famine Early Warning Systems Network (FEWS NET) [35] and African Rainfall Climatology [55,56]. Nowadays, the CHIRPS dataset is available in two sets of spatial resolutions i.e., 0.25° × 0.25° and 0.05° × 0.05° from 1981 to the present.
The CHIRPS dataset is developed based on a blend of three data sources [35]: (i) the Climate Hazards Precipitation Climatology (CHPclim) [57], a global precipitation climatology at 0.05° latitude and longitude resolution (estimated for each month based on station data, averaged satellite observations, elevation, latitude and longitude) [35,58]; (ii) quasi-global geostationary Thermal Infrared Radiation (TIR) satellite observations, TMPA 3B42 product [33], and (iii) atmospheric model precipitation fields from the National Oceanic and Atmospheric Administration (NOAA) Climate Forecast System (CFS) version 2.0 [59].
According Funk et al. [35], the CHIRPS algorithm encompasses four development processes: (i) a pentad (5 day) rainfall estimate, which is generated from the three-hourly quasi-global geostationary TIR data of Climate Prediction Center (CPC) and the National Climatic Data Center; (ii) a TMPA-3B42 rainfall product, which is used to calibrate the IR pentad estimate; (iii) the calibrated IR pentad product is then multiplied with the Climate Hazards Precipitation Climatology and subsequently divided by the long-term mean to produce the Climate Hazards Group (CHG) IR Precipitation (CHIRP) data; (iv) the pentadal CHIRP values are disaggregated to daily precipitation estimates based on the daily NOAA Climate Forecast System (CFS) fields rescaled to 0.05° resolution. Finally, CHIRPS is produced through blending the rainfall stations with the CHIRP data sets and using a modified inverse distance-weighted algorithm [35].
The CHIRPS datasets include rainfall information from a large number of gauges, which is about 1200 stations globally. It should be mentioned that a relatively large number of rain gauge stations were used in East Africa [35]. More than 50 rain gauge stations from the Ethiopian NMA were blended with the CHIRPS products for up-to-date evaluations of the rainfall conditions throughout the major growing seasons of the country. The 50 stations are updated every 10 days [60] and used to correct the CHIRPS datasets [35,49,61] Detailed information regarding the CHIRPS rainfall products was provided in Funk et al. [35]. In this study, we used a higher resolution CHIRPS dataset with a spatial resolution of 0.05° × 0.05° and a daily time scale, which was freely downloaded from (ftp://ftp.chg.ucsb.edu/pub/org/chg/products/CHIRPS-2.0/).

IMERG Database

The GPM-IMERG algorithm combines information from the GPM satellite group to estimate precipitation over the majority of the Earth’s surface. The GPM-IMERG was launched by the National Aeronautics and Space Administration (NASA) and the Japan Aeronautics and Exploration Agency (JAXA) in 2014 [62]. This algorithm is particularly valuable over the majority of the Earth’s surface that lacks precipitation-measuring instruments on the ground. In the latest release of IMERG (Version 06; V06), the algorithm fuses the early precipitation estimates based on the TRMM satellite (2000−2014) with more recent precipitation estimates collected during the operation based on the GPM satellite (2014–2021). The three gridded products are commonly used for scientific research and operational purposes. There are three different daily IMERG products, which include IMERG Day 1 Early Run (near real-time with a latency of 6 h), IMERG Day 1 Late Run (reprocessed near real-time with a latency of 18 h), and IMERG Day 1 Final Run (gauged-adjusted with a latency of four months) products. In this study, we used the three IMERG products (IMERG-early IMERG-late and IMERG-final run products, with a fine spatial resolution (0.1° × 0.1°), a high temporal resolution (30 min), and a spatial coverage from 60° S to 60° N, which was freely downloaded from (https://giovanni.gsfc.nasa.gov/giovanni/ (accessed on 4 February 2021)).

2.3. Performance Evaluation Criteria

To identify the best datasets in the study area, we evaluated the performance of CHIRPS and three IMERG (early, late, and final) products against the ground-based rainfall data. We evaluated the monthly and seasonal time scale. We obtained monthly and seasonal rainfall by adding up the daily values on a monthly and seasonal basis in Microsoft Excel 2019 [63], Jupyter Notebook and ArcMap used to visualize data. In Ethiopia, the climate varies mostly with altitude. The lowland areas have hot and arid climatic conditions while plateau areas experience a cold climate, and the season category does not constant over the regions [64,65]. Therefore, in this study, we characterized the performance of CHIRPS and IMERG rainfall datasets for the four seasons of the ZLB. These include Kiremt (summer; from June to August), Tseday (spring; from September to November), Bega (winter; from December to February), and Belg (Autumn; from March to May). Then, we evaluated the temporal variations of rainfall for each product.
We consistently used four statistical metrics that include Percent Bias (PBIAS), Root Mean Square Error (RMSE), Nash–Sutcliffe Efficiency (NSE), and Pearson linear Correlation Coefficient (r) to quantitatively compare the performance of the CHIRPS and the three GPM-IMERG rainfall products. PBIAS describes the systematic bias of the CHIRPS and IMERG products. Positive values of PBIAS indicate an overestimation of the rainfall quantity, whereas negative values show an underestimation of the rainfall quantity [28,66,67]. RMSE measures the absolute error magnitude of the CHIRPS and IMERG products, with the smaller the RMSE value, the closer the CHIRPS and IMERG measurements to the ground-observed rainfall. NSE is a normalized statistic that determines the relative magnitude of the residual variance compared to the measured data variance. NSE values range between −∞ and 1, with value 1 indicating a perfect fit between the satellite-based and observed rainfall [42,68]. The degree of linear correlation between the CHIRPS and IMERG and the ground-based rainfall evaluated with r values ranging from −1 to 1 r value of 0 indicates no correlation between the CHIRPS and IMERG products and the observed rainfall. On the other hand, r values of 1 and −1 show perfect positive and negative correlations, respectively [69,70], as summarized in (Table 2). In addition to statistical metrics, we used graph for comparison of SPPs and observed rainfall.

3. Results and Discussion

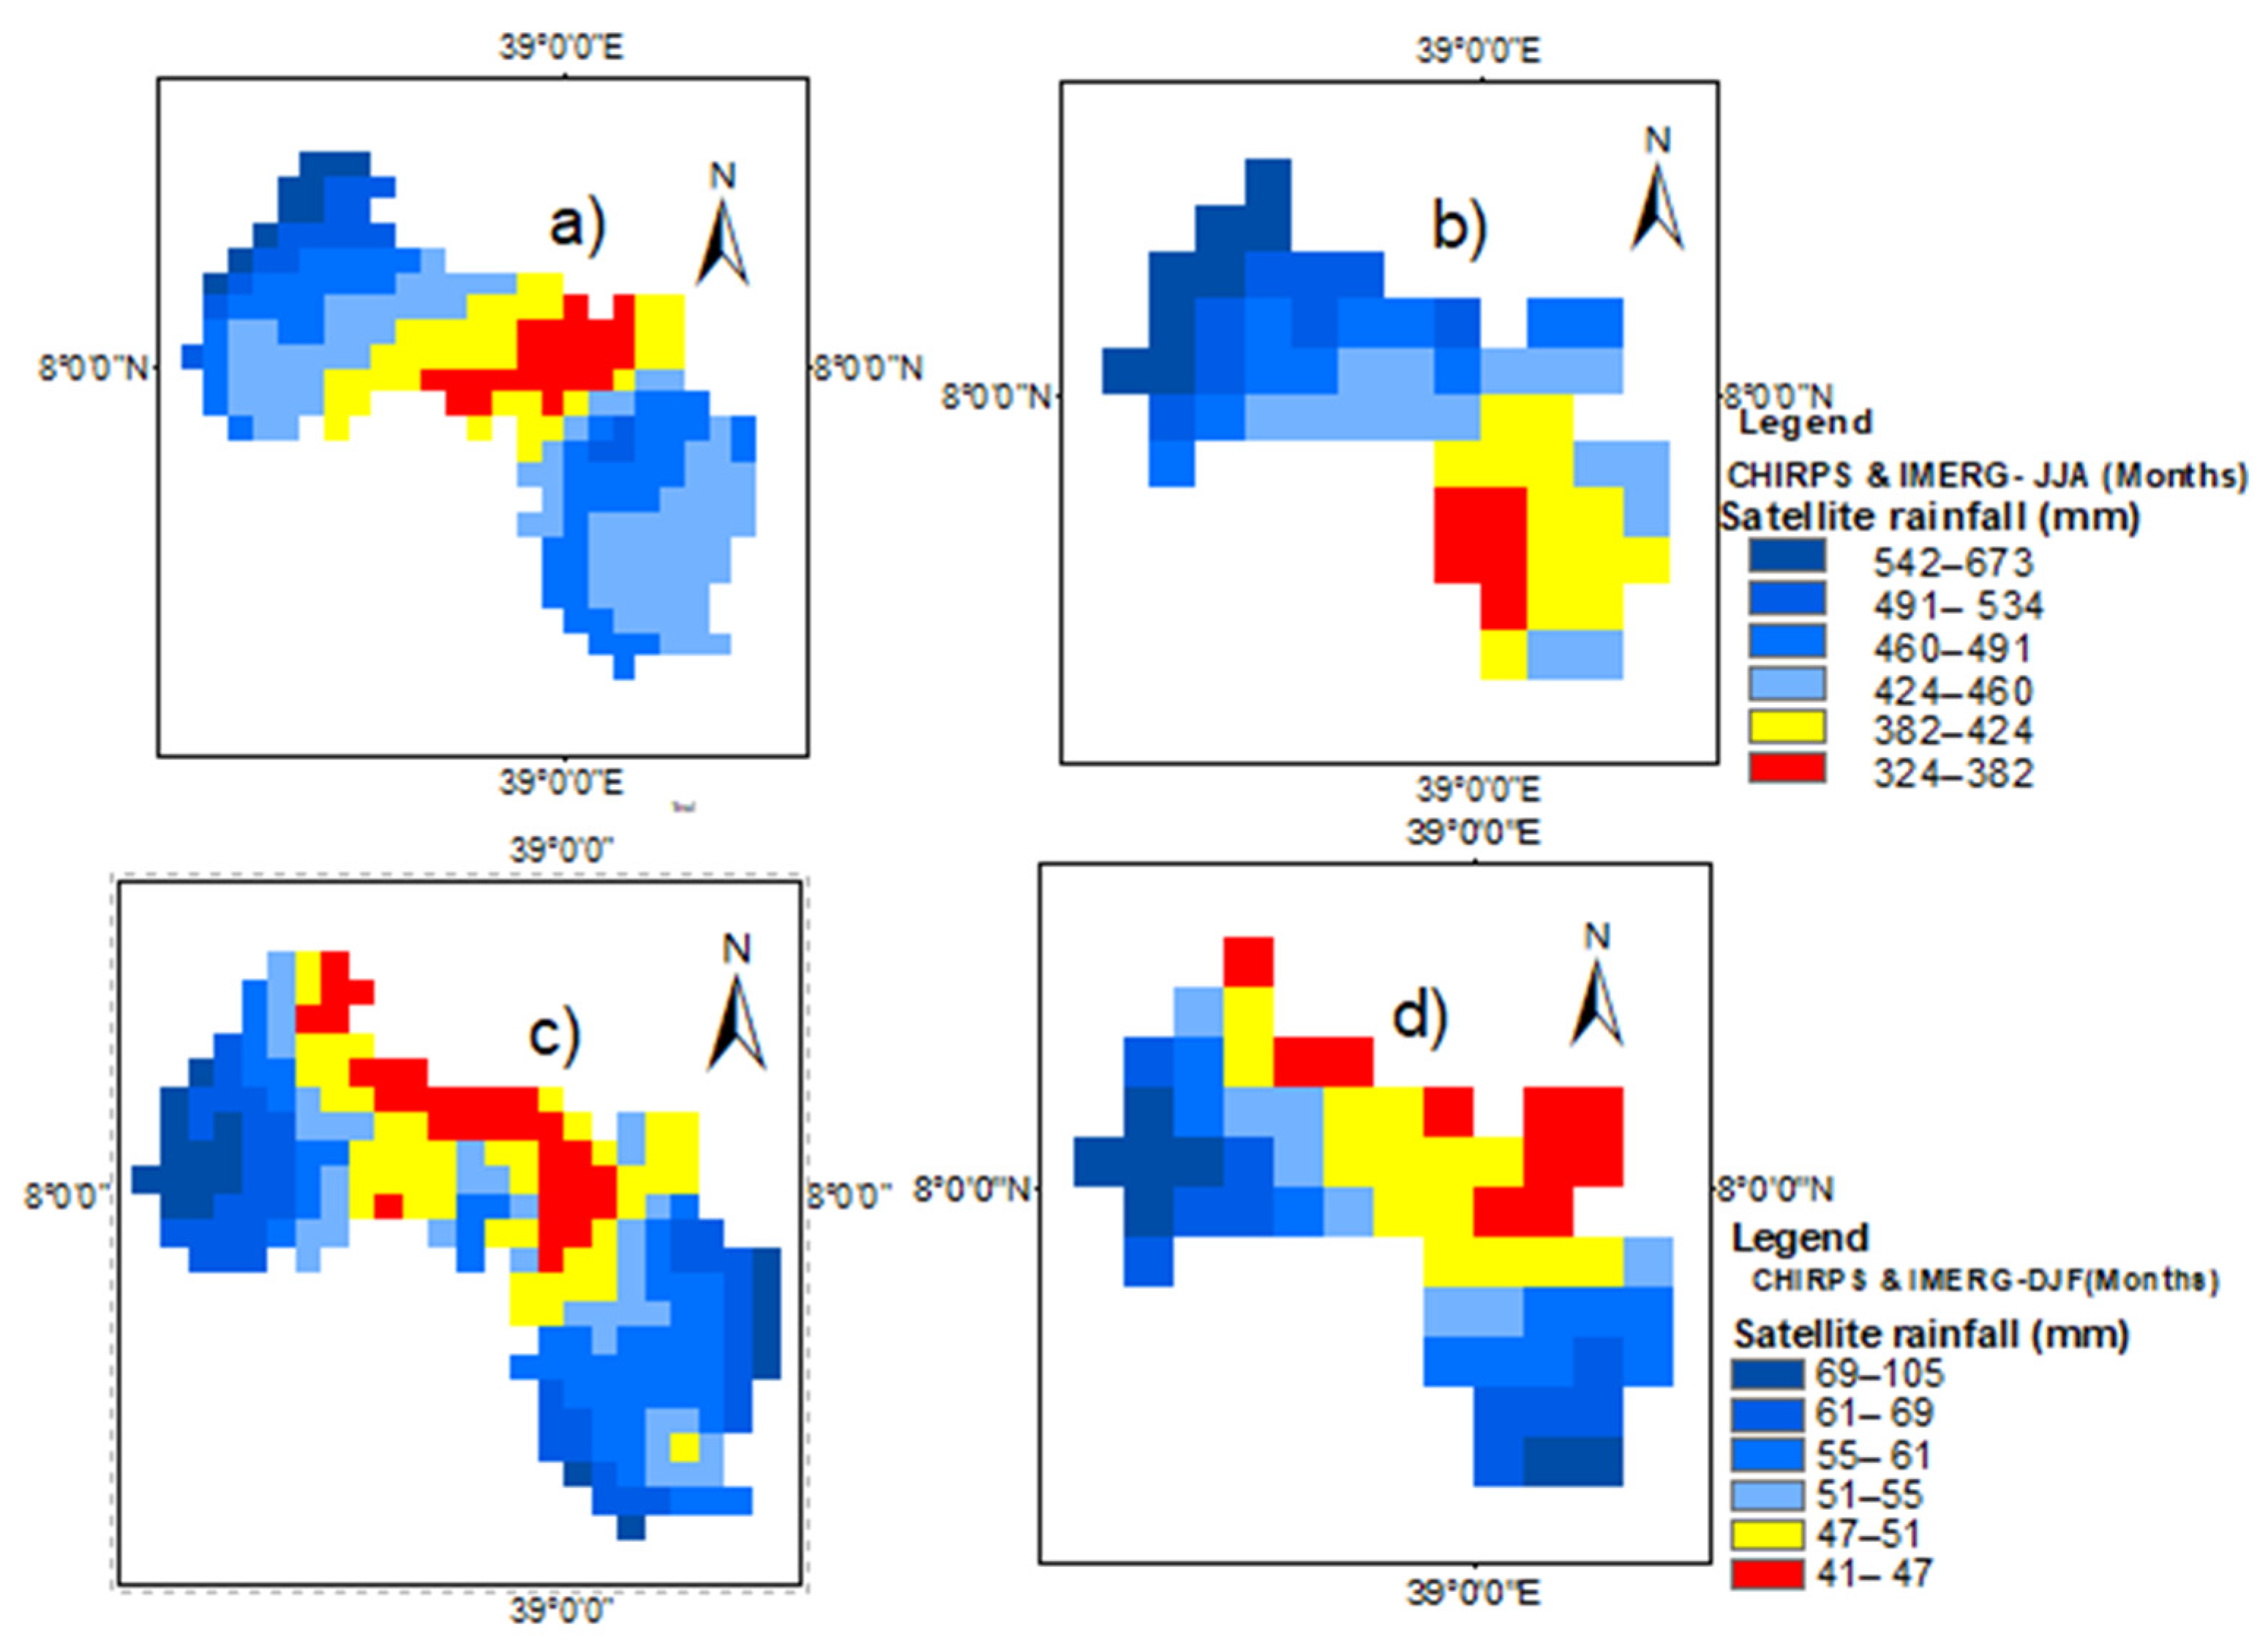
3.1. Spatial Rainfall Pattern Evaluation

The Ziway Lake Basin seasonal average rainfall distribution of the CHIRPS and IMERG map was compared visually from the 2000–2014 period. Figure 3 shows the seasonal average rainfall distribution for the main rainy (summer) and dry (winter) seasons. In summer (Figure 3a,b), both CHIRPS and IMERG show that the western part of the basin, which is the eastern highlands of Gurage Zone, receives more rainfall than the eastern part of the basin, which is the western highlands of the Arsi Zone. The spatial rainfall distribution of both CHRIPS and IMERG is consistent with ground-observed rainfall [64]. During the winter season (DJF), a similar rainfall pattern was observed in the western and eastern parts of the basin (Figure 3c,d). Up to 105 mm of rainfall amount is received for the eastern and western part of the basin whereas the central and southern part of the basin receives rainfall up to 45 mm. Overall, both CHRIPS and IMERG showed a decreasing rainfall pattern towards the center i.e., from west to the central part of Ziway Lake Basin (lowland). According to Hailesilassie et al. [64], the observed rainfall is mainly concentrated in the southern and western parts of the basin, while the eastern and central rift valley (low land areas) where the lake is located generally experience low rainfall amounts. CHIRPS relatively well captured that pattern when compared to IMERG, which is probably due to its high spatial resolution and blending of more stations’ data [47].

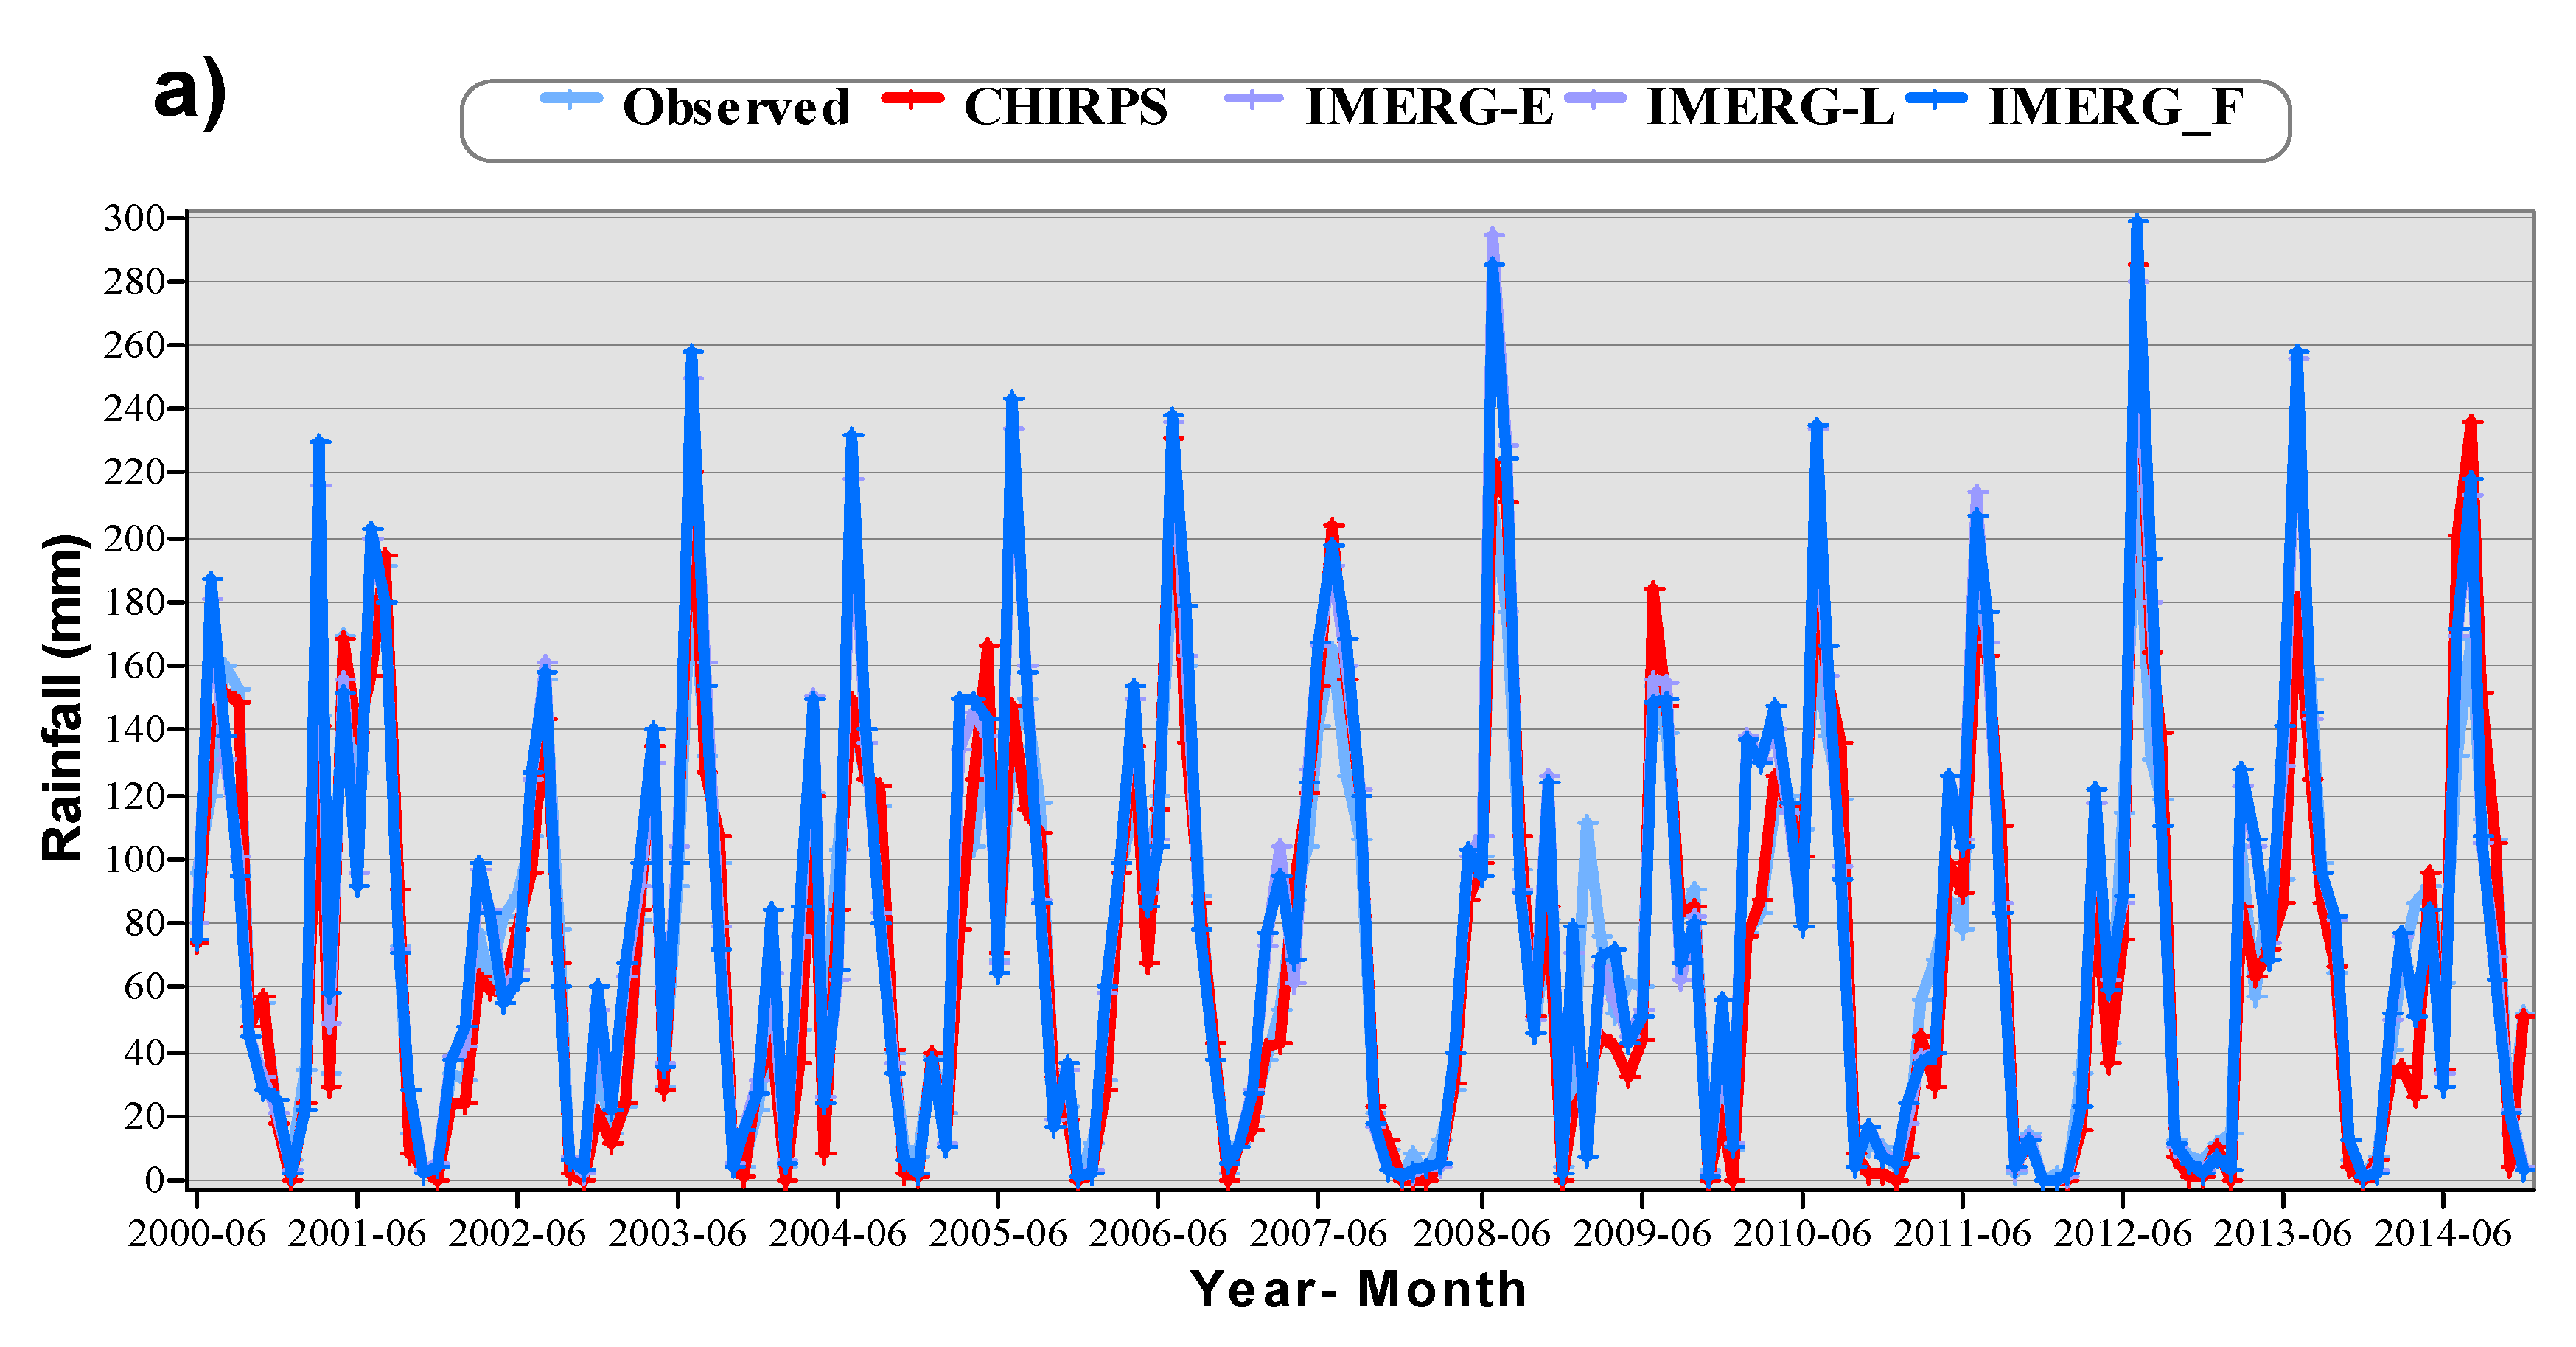
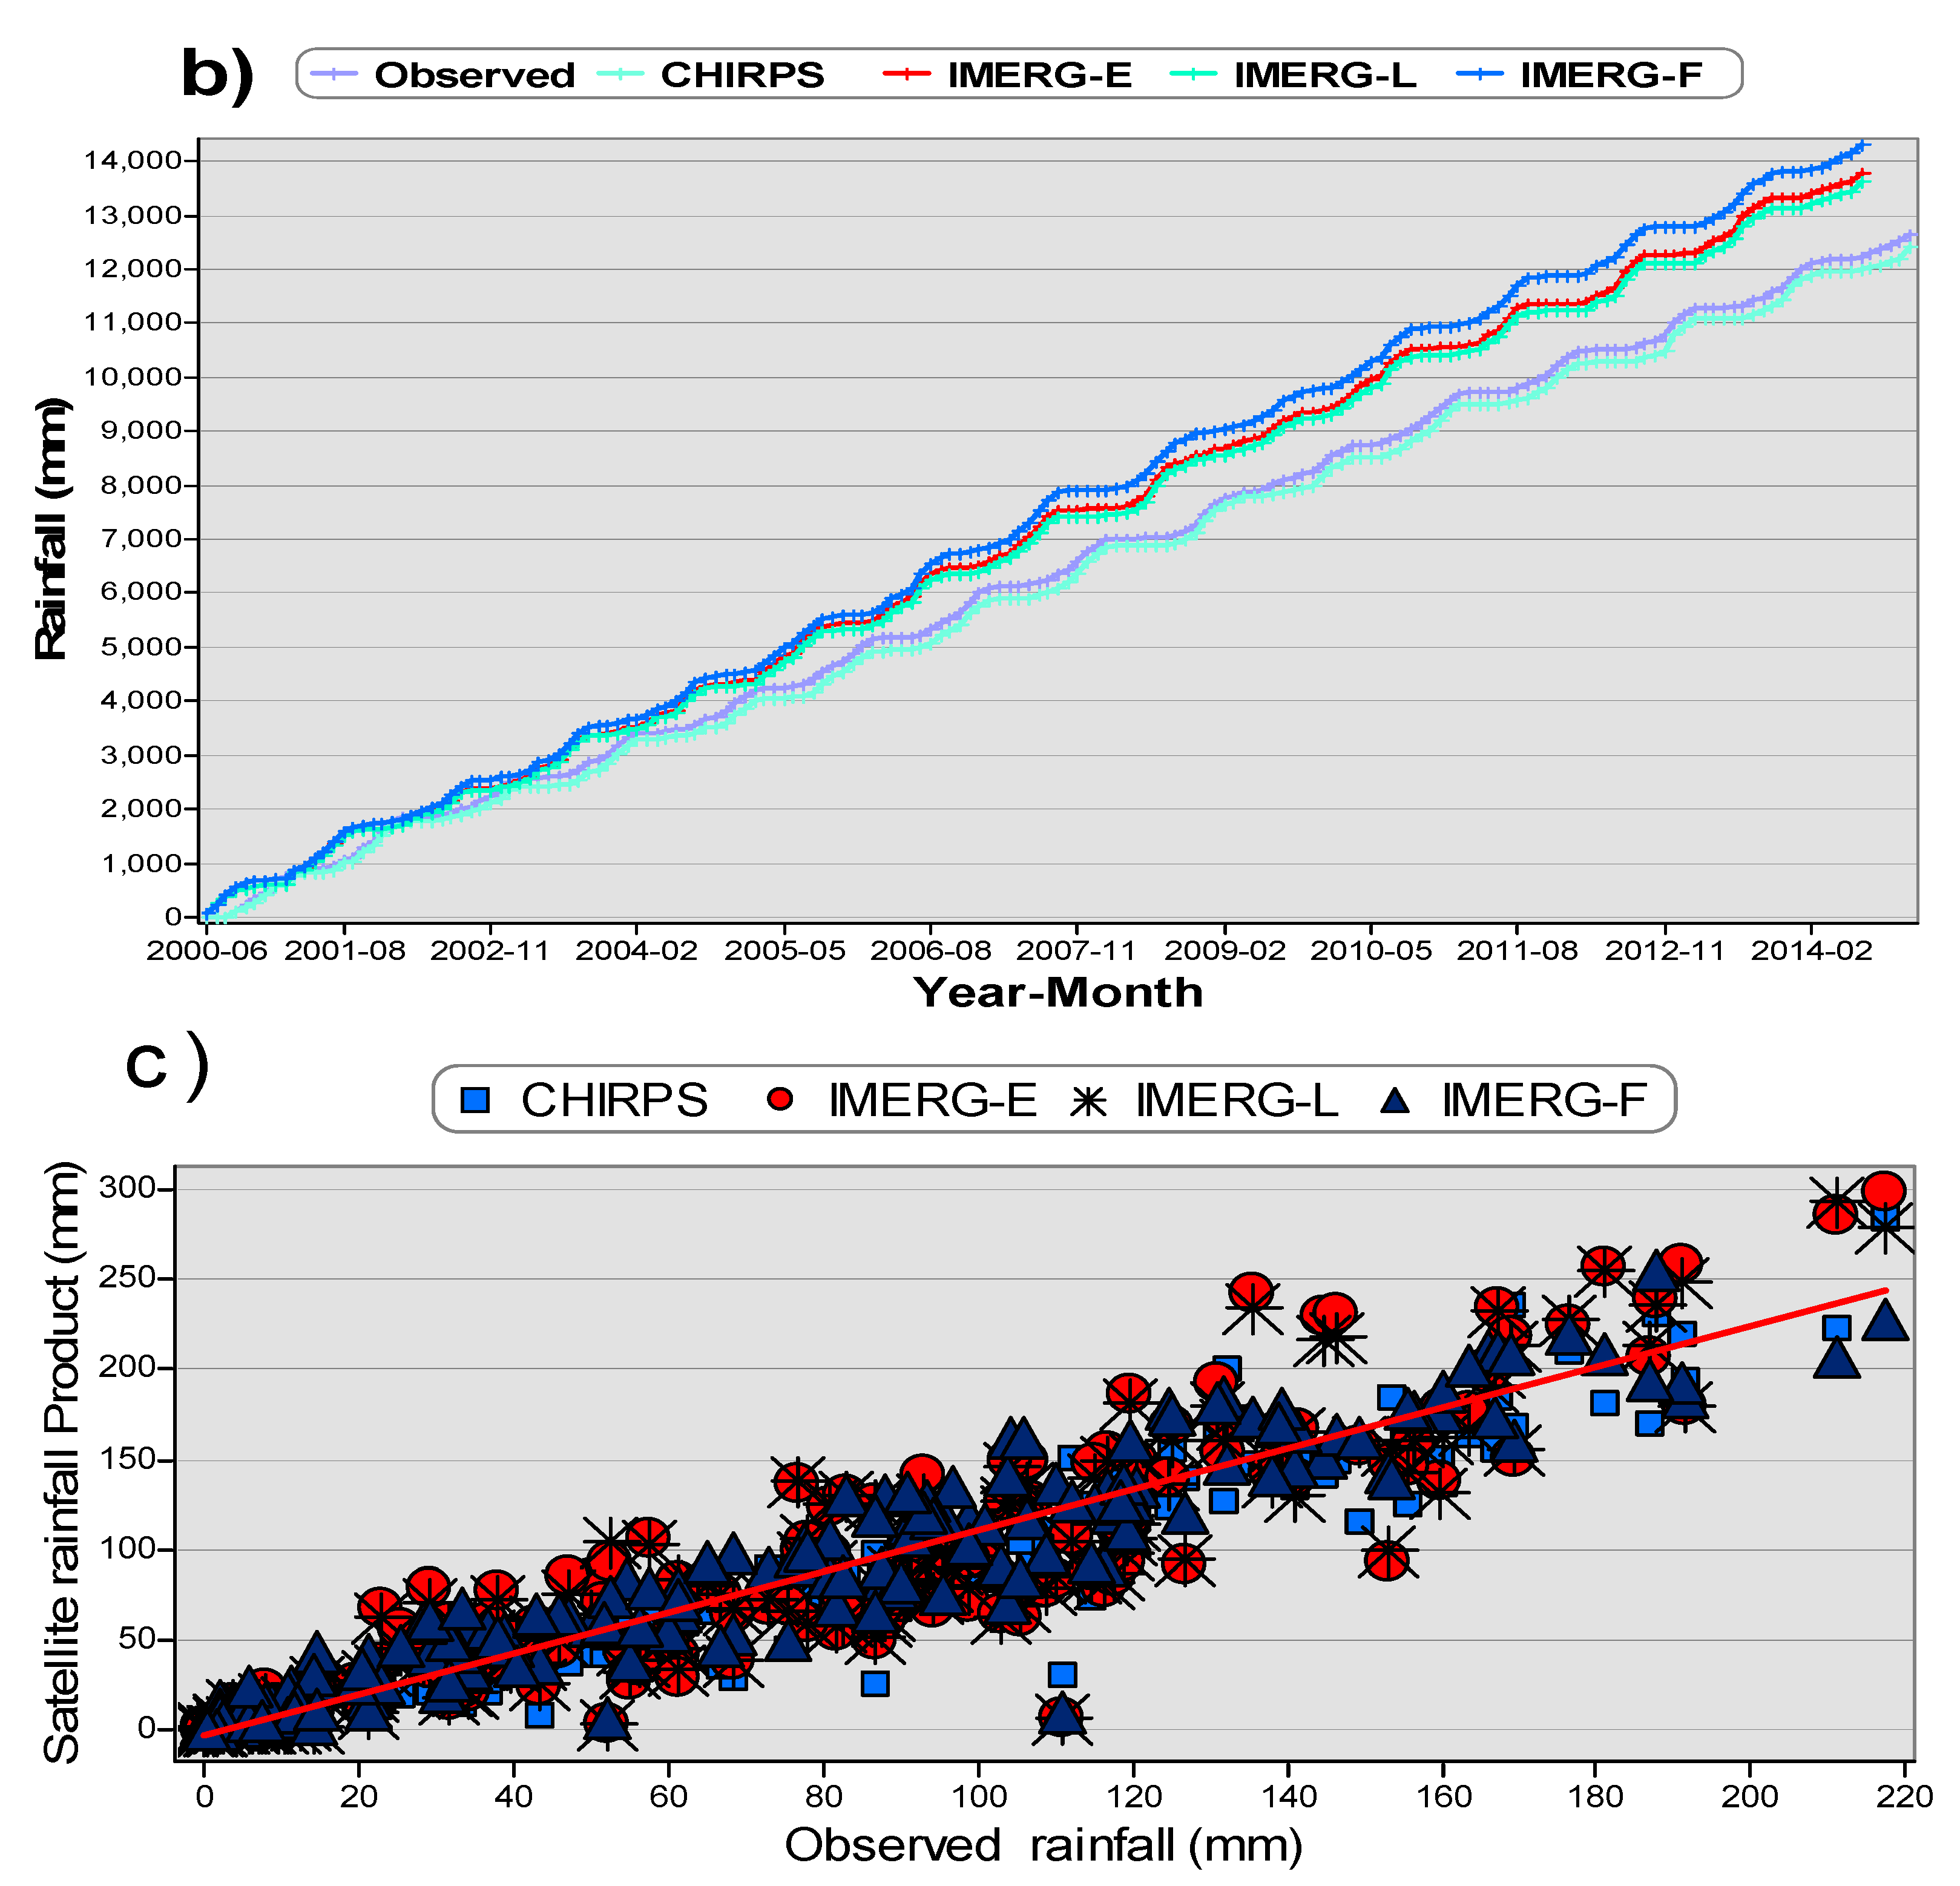
3.2. Monthly Rainfall Evaluation

Comparison of the CHIRPS and IMERG (early, late, and final run) monthly rainfall data showed a good performance over the Ziway Lake Basin. CHIRPS rainfall generally showed a stronger correlation with the observed rainfall when compared to the three-run IMERG’s rainfall (Table 3). The Correlation Coefficient between the early, late, and final IMERG run rainfall and the observed rainfall was high i.e., 0.93, 0.92, and 0.85, respectively. Compared with all IMERG (early, late, and final) products, CHIRPS products showed the highest Correlation Coefficient (0.96) and low Percent Bias (2.22%). In comparison with the IMERG products, the monthly CHIRPS product relatively better represented the ground-observed rainfall values over ZLB with relatively higher r and NSE; and lower RMSE and RBIAS. This is consistent with the previous studies of that confirmed the applicability of CHIRPS precipitation datasets at a monthly time scale in ground-observed data-scarce regions [22,31,46,49,64].
Figure 4a shows the monthly rainfall values while Figure 4b, c shows the cumulative and scatter values, respectively. The CHIRPS and IMERG-L rainfall product showed the best performance to capture the temporal pattern of monthly rainfall. However, both IMERG-E and IMERG-F products did not well capture the temporal variability of observed rainfall over the study area, indicating that both somehow overestimated the observed rainfall values. As visualized from the cumulative rainfall (Figure 4b), the CHIRPS and IMERG-L captured the monthly cumulative observed rainfall values. The IMERG-E and IMERG-F run smoothly captures the temporal cumulative observed rainfall compared to the CHIRPS and IMERG-L product. As the scatter plot (Figure 4c) indicated, the monthly CHIRPS and IMERG-L rainfall values are close to the monthly observed rainfall values. The CHIRPS data showed capability to represent the monthly maximum observed values compared to all the IMERG’s runs. IMERG-L data generally outperformed the IMERG-E and IMERG-F data (Table 3).

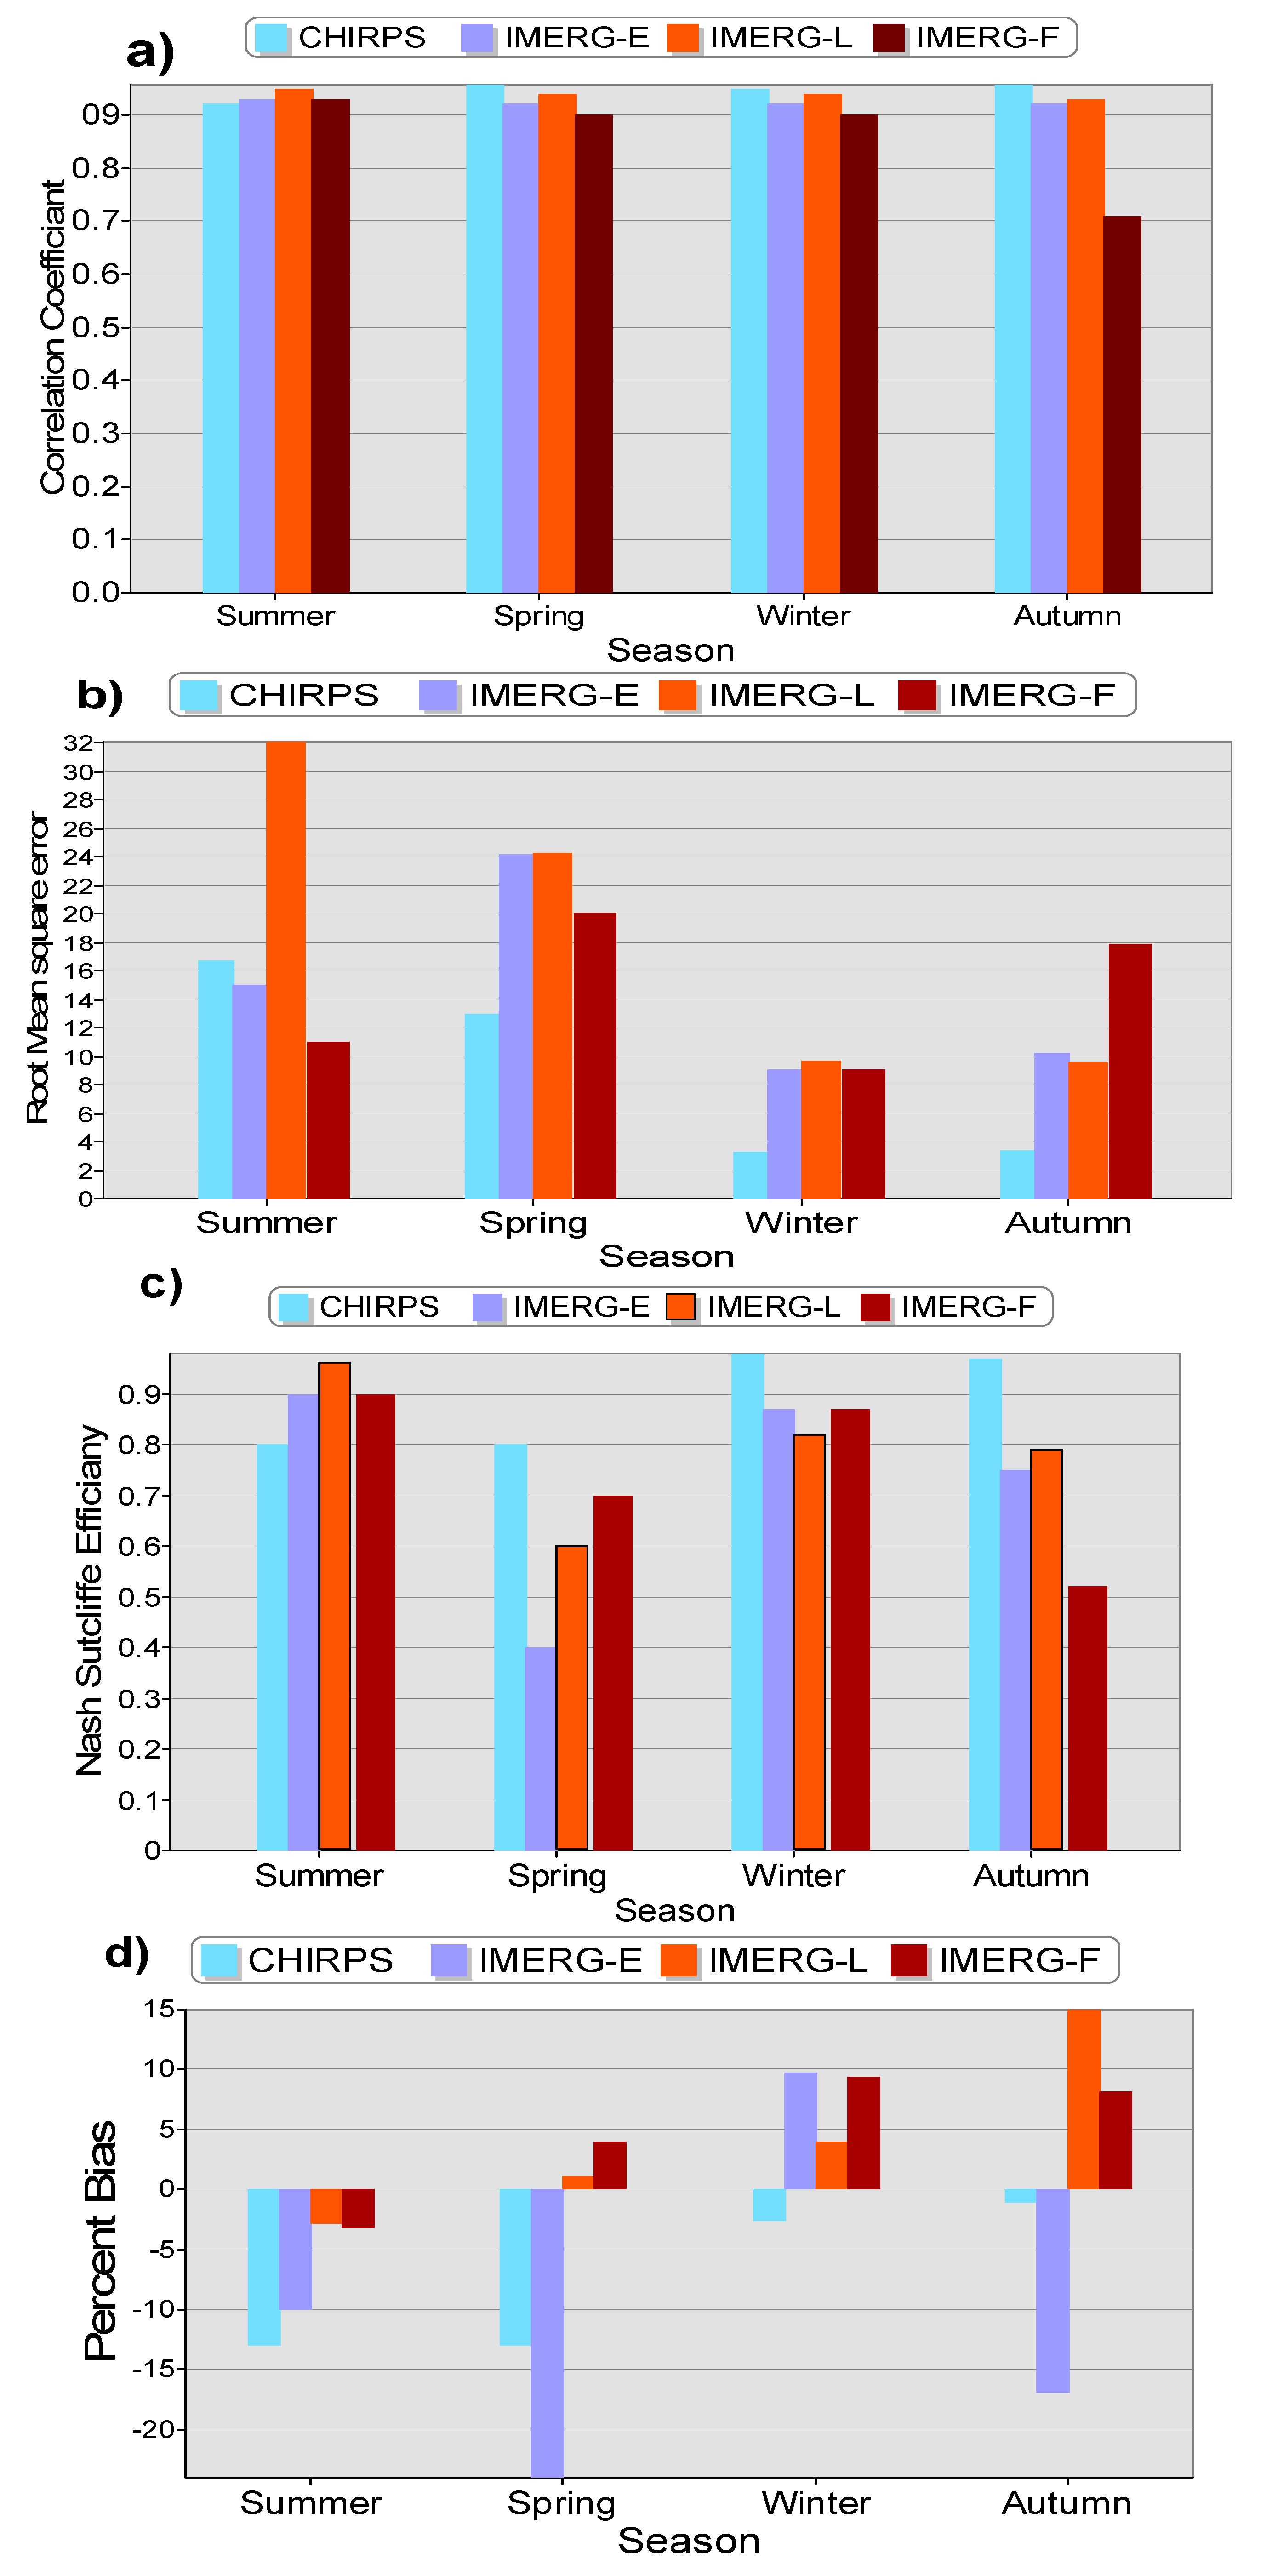
3.3. Seasonal Rainfall Evaluation

Figure 5 shows statistical metrics used for seasonal rainfall evaluation of the SPPs versus the ground stations. There were some slight differences between these products on r, RMSE, NSE, and PBIAS (Figure 5a–d). The figure shows that the CHIRPS, the IMERG-E, IMERG-L, and IMERG-F performed well. Moreover, the IMERG-E, IMERG-L, and IMERG-F performance indicated a better relationship during the summer season with an r and NSE values of (0.96 and 0.9 and (0.95 and 0.96), respectively, whereas CHIRPS well-performed with a high r value of 0.92 and low bias error (−2.6) (Figure 5a–d). The three IMERG runs underestimated the summer rainfall by −2.9% to −10%, while CHIRPS underestimated the summer season rainfall by −12% (Figure 5d). All IMERG runs overestimated observed rainfall by 4% to 9.7% in the winter season, whereas CHIRPS underestimated the observed values by −2.6% (Figure 5d). When compared to IMERG runs, CHIRPS achieved higher correlations with observed rainfall during spring, winter, and autumn seasons with r values of 0.93, 0.97, and 0.93 (Figure 5a), respectively. The RMSE values indicated that the CHIRPS data relatively had a small value compared to all IMERG runs, especially during the winter and autumn seasons (Figure 5b). During the spring season, the three IMERG runs had the same r values (0.92) and CHIRPS had (0.93) (Figure 5a).
A number of previous studies reported the good performance of SPPs at monthly time scales [25,28,41,46,50,68,69,70]. In general, CHIRPS showed slightly better performance than the other three IMERG runs for monthly and seasonal time scales. Previous studies have already confirmed the superiority of CHIRPS than IMERG runs for different parts of the world [40,71,72,73], including Ethiopia [31,47,49]. For example, Wedajo et al. [47] reported better rainfall estimation by CHIRPS compared with IMERG and TAMSAT3 and 3B42/3 products for the Dhidhessa River Basin, Ethiopia. Dinku et al. [49] reported better rainfall estimation capability of CHIRPS for east Africa compared to the African Rainfall Climatology version 2 (ARC2) and TAMSAT3 products. The better performance of CHIRPS has been attributed to the capability of the algorithm to integrate satellite, rain gauges, and reanalysis products, combined with its higher spatial and temporal resolutions than IMERG products [35].
Overall, the statistical evaluation results indicate that both CHIRPS and IMERG are capable of estimating and detecting observed monthly and seasonal rainfall values of the ZLB. Therefore, the monthly and seasonal CHIRPS and IMERG-F data are a reliable source for simulating monthly and seasonal agro-hydrological processes, estimating the seasonal crop water requirement, and accounting the stocks and fluxes of water in the Ziway Lake Basin.

4. Conclusions

In this study, we evaluated and compared the performance of IMERG and CHIRPS rainfall products against ground-observed rainfall data over the Ziway Lake Basin. The analyses covered the period from 2000 to 2014 at monthly and seasonal time scales. We used four statistical evaluation parameters: Correlation Coefficient, Nash–Sutcliffe Efficiency, Percent Bias, and Root Mean Square Error. The two rainfall products performed well for both monthly and seasonal time scales. Overall, while the CHIRPS’s rainfall datasets showed slightly better performance over the IMERG’s datasets, both datasets can be used at a monthly or coarser temporal resolution when ground-based rainfall data are not available. This can greatly contribute to continuous spatiotemporal monitoring of drought and helping the water managers and agricultural planners implementing mitigation measures and improving the livelihood of the stakeholders in the basin.
The follow up research should focus on the evaluation and comparison of the grid point satellite dataset with interposed ground station data, considering point to point performance evaluation at daily time basis. Future evaluation studies should also include the Climate Hazards Group Infrared Precipitation (CHIRP) satellite-only product.

Author Contributions

Conceptualization, A.T.H.; data curation and analysis, A.T.H. and N.S.K.; Formula analysis and Methodology, A.T.H.; writing–original draft, A.T.H.; writing–review, A.T.H.; editing, A.T.H., O.T.L. and A.D.C.; supervision O.T.L., T.A. and A.D.C. All authors have read and agreed to published version of the manuscript.

Funding

This work was financially supported by the Africa Center of Excellence for Water Management, Addis Ababa University.

Acknowledgments

The authors would like to thanks the National Meteorological Agency (NMA) of Ethiopia for providing the weather data. We would also like to express our sincere gratitude to the Africa Centre of Excellence for Water Management, Addis Ababa University for the support to conduct this research.

Conflicts of Interest

The authors declare no conflict of interest.

References

  1. Nikolopoulos, E.I.; Destro, E.; Maggioni, V.; Marra, F.; Borga, M. Satellite Rainfall Estimates for Debris Flow Prediction: An Evaluation Based on Rainfall Accumulation–Duration Thresholds. J. Hydrometeorol. 2017, 18, 2207–2214. [Google Scholar] [CrossRef]
  2. Intergovernmental Panel on Climate Change (IPCC). Summary for Policymakers. Climate change 2014: Part of the Working Group III Contribution to the Fifth Assessment Report of the IPCC, Geneva, Switzerland. Available online: http://pure.iiasa.ac.at/11125 (accessed on 20 April 2021).
  3. Hoegh-Guldberg, O.; Jacob, D.; Bindi, M.; Brown, S.; Camilloni, I.; Diedhiou, A.; Djalante, R.; Ebi, K.; Engelbrecht, F.; Guiot, J.; et al. Impacts of 1.5 C Global Warming on Natural and Human Systems. Global warming of 1.5 C. An IPCC Special Report. Available online: http://hdl.handle.net/10138/311749 (accessed on 15 June 2021).
  4. Bayissa, Y.; Tadesse, T.; Demisse, G.; Shiferaw, A. Evaluation of Satellite-Based Rainfall Estimates and Application to Monitor Meteorological Drought for the Upper Blue Nile Basin, Ethiopia. Remote. Sens. 2017, 9, 669. [Google Scholar] [CrossRef] [Green Version]
  5. Asfaw, A.; Simane, B.; Hassen, A.; Bantider, A. Variability and time series trend analysis of rainfall and temperature in northcentral Ethiopia: A case study in Woleka sub-basin. Weather. Clim. Extrem. 2018, 19, 29–41. [Google Scholar] [CrossRef]
  6. Ayalew, D. Variability of rainfall and its current trend in Amhara region, Ethiopia. Afr. J. Agric. Res. 2012, 7, 1475–1486. [Google Scholar] [CrossRef]
  7. Pachauri, R.K.; Allen, M.R.; Barros, V.R.; Broome, J.; Cramer, W.; Christ, R.; Church, J.A.; Clarke, L.; Dahe, Q.; Dasgupta, P.; et al. Climate change 2014: Synthesis report. Contribution of Working Groups I, II and III to the fifth assessment report of the Intergovernmental Panel on Climate Change. Ipcc 2014. [Google Scholar] [CrossRef]
  8. Chartzoulakis, K.; Bertaki, M. Sustainable Water Management in Agriculture under Climate Change. Agric. Agric. Sci. Procedia 2015, 4, 88–98. [Google Scholar] [CrossRef] [Green Version]
  9. Emami, F.; Koch, M. Agricultural Water Productivity-Based Hydro-Economic Modeling for Optimal Crop Pattern and Water Resources Planning in the Zarrine River Basin, Iran, in the Wake of Climate Change. Sustainability 2018, 10, 3953. [Google Scholar] [CrossRef] [Green Version]
  10. Hassan, I.; Kalin, R.M.; White, C.J.; Aladejana, J.A. Selection of CMIP5 GCM Ensemble for the Projection of Spatio-Temporal Changes in Precipitation and Temperature over the Niger Delta, Nigeria. Water 2020, 12, 385. [Google Scholar] [CrossRef] [Green Version]
  11. Rakhimova, M.; Liu, T.; Bissenbayeva, S.; Mukanov, Y.; Gafforov, K.S.; Bekpergenova, Z.; Gulakhmadov, A. Assessment of the Impacts of Climate Change and Human Activities on Runoff Using Climate Elasticity Method and General Circulation Model (GCM) in the Buqtyrma River Basin, Kazakhstan. Sustainability 2020, 12, 4968. [Google Scholar] [CrossRef]
  12. Huntingford, C.; Lambert, F.H.; Gash, J.; Taylor, C.M.; Challinor, A.J. Aspects of climate change prediction relevant to crop productivity. Philos. Trans. R. Soc. B Biol. Sci. 2005, 360, 1999–2009. [Google Scholar] [CrossRef] [Green Version]
  13. Fischer, G.; Tubiello, F.N.; van Velthuizen, H.; Wiberg, D. Climate change impacts on irrigation water requirements: Effects of mitigation, 1990–2080. Technol. Forecast. Soc. Chang. 2007, 74, 1083–1107. [Google Scholar] [CrossRef] [Green Version]
  14. Ficklin, D.; Luo, Y.; Luedeling, E.; Zhang, M. Climate change sensitivity assessment of a highly agricultural watershed using SWAT. J. Hydrol. 2009, 374, 16–29. [Google Scholar] [CrossRef]
  15. Legesse, S.; Tadele, K.; Mariam, B.G. Potential Impacts of Climate Change on the Hydrology and Water resources Availability of Didessa Catchment, Blue Nile River Basin, Ethiopia. J. Geol. Geosci. 2015, 4. [Google Scholar] [CrossRef]
  16. Jia, K.; Ruan, Y.; Yang, Y.; Zhang, C. Assessing the Performance of CMIP5 Global Climate Models for Simulating Future Precipitation Change in the Tibetan Plateau. Water 2019, 11, 1771. [Google Scholar] [CrossRef] [Green Version]
  17. Gedefaw, M.; Wang, H.; Yan, D.; Qin, T.; Wang, K.; Girma, A.; Batsuren, D.; Abiyu, A. Water Resources Allocation Systems under Irrigation Expansion and Climate Change Scenario in Awash River Basin of Ethiopia. Water 2019, 11, 1966. [Google Scholar] [CrossRef] [Green Version]
  18. Kang, Y.; Khan, S.; Ma, X. Climate change impacts on crop yield, crop water productivity and food security—A review. Prog. Nat. Sci. 2009, 19, 1665–1674. [Google Scholar] [CrossRef]
  19. Worku, T.; Khare, D.; Tripathi, S.K. Spatiotemporal trend analysis of rainfall and temperature, and its implications for crop production. J. Water Clim. Chang. 2019, 10, 799–817. [Google Scholar] [CrossRef]
  20. Dawit, M.; Halefom, A.; Teshome, A.; Sisay, E.; Shewayirga, B.; Dananto, M. Changes and variability of precipitation and temperature in the Guna Tana watershed, Upper Blue Nile Basin, Ethiopia. Model. Earth Syst. Environ. 2019, 5, 1395–1404. [Google Scholar] [CrossRef]
  21. Mohammed, Y.; Yimer, F.; Tadesse, M.; Tesfaye, K. Variability and trends of rainfall extreme events in north east highlands of Ethiopia. Int. J. Hydrol. 2018, 2. [Google Scholar] [CrossRef]
  22. Gebere, S.B.; Alamirew, T.; Merkel, B.J.; Melesse, A.M. Performance of High Resolution Satellite Rainfall Products over Data Scarce Parts of Eastern Ethiopia. Remote. Sens. 2015, 7, 11639–11663. [Google Scholar] [CrossRef] [Green Version]
  23. Salerno, J.; Diem, J.E.; Konecky, B.L.; Hartter, J. Recent intensification of the seasonal rainfall cycle in equatorial Africa revealed by farmer perceptions, satellite-based estimates, and ground-based station measurements. Clim. Chang. 2019, 153, 123–139. [Google Scholar] [CrossRef]
  24. Karger, D.N.; Schmatz, D.R.; Dettling, G.; Zimmermann, N.E. High-resolution monthly precipitation and temperature time series from 2006 to 2100. Sci. Data 2020, 7, 1–10. [Google Scholar] [CrossRef]
  25. Al-Wagdany, A.S. Inconsistency in rainfall characteristics estimated from records of different rain gauges. Arab. J. Geosci. 2016, 9, 1–10. [Google Scholar] [CrossRef]
  26. Musie, M.; Sen, S.; Chaubey, I. Hydrologic Responses to Climate Variability and Human Activities in Lake Ziway Basin, Ethiopia. Water 2020, 12, 164. [Google Scholar] [CrossRef] [Green Version]
  27. Serinaldi, F.; Kilsby, C.G.; Lombardo, F. Untenable nonstationarity: An assessment of the fitness for purpose of trend tests in hydrology. Adv. Water Resour. 2018, 111, 132–155. [Google Scholar] [CrossRef]
  28. Anjum, M.N.; Ahmad, I.; Ding, Y.; Shangguan, D.; Zaman, M.; Ijaz, M.W.; Sarwar, K.; Han, H.; Yang, M. Assessment of IMERG-V06 Precipitation Product over Different Hydro-Climatic Regimes in the Tianshan Mountains, North-Western China. Remote. Sens. 2019, 11, 2314. [Google Scholar] [CrossRef] [Green Version]
  29. Xu, M.; Kang, S.; Wu, H.; Yuan, X. Detection of spatio-temporal variability of air temperature and precipitation based on long-term meteorological station observations over Tianshan Mountains, Central Asia. Atmos. Res. 2018, 203, 141–163. [Google Scholar] [CrossRef]
  30. Tang, G.; Clark, M.P.; Papalexiou, S.M.; Ma, Z.; Hong, Y. Have satellite precipitation products improved over last two decades? A comprehensive comparison of GPM IMERG with nine satellite and reanalysis datasets. Remote Sens. Environ. 2020, 240, 111697. [Google Scholar] [CrossRef]
  31. Fenta, A.A.; Yasuda, H.; Shimizu, K.; Ibaraki, Y.; Haregeweyn, N.; Kawai, T.; Belay, A.S.; Sultan, D.; Ebabu, K. Evaluation of satellite rainfall estimates over the Lake Tana basin at the source region of the Blue Nile River. Atmos. Res. 2018, 212, 43–53. [Google Scholar] [CrossRef]
  32. Ma, Z.; Tan, X.; Yang, Y.; Chen, X.; Kan, G.; Ji, X.; Lu, H.; Long, J.; Cui, Y.; Hong, Y. The First Comparisons of IMERG and the Downscaled Results Based on IMERG in Hydrological Utility over the Ganjiang River Basin. Water 2018, 10, 1392. [Google Scholar] [CrossRef] [Green Version]
  33. Huffman, G.J.; Bolvin, D.T.; Nelkin, E.J.; Wolff, D.B.; Adler, R.F.; Gu, G.; Hong, Y.; Bowman, K.P.; Stocker, E.F. The TRMM Multisatellite Precipitation Analysis (TMPA): Quasi-Global, Multiyear, Combined-Sensor Precipitation Estimates at Fine Scales. J. Hydrometeorol. 2007, 8, 38–55. [Google Scholar] [CrossRef]
  34. Hsu, K.L.; Gao, X.; Sorooshian, S.; Gupta, H.V. Precipitation estimation from remotely sensed information using artificial neural networks. J. Appl. Meteorol. 1997, 36, 1176–1190. [Google Scholar] [CrossRef]
  35. Funk, C.; Peterson, P.; Landsfeld, M.; Pedreros, D.; Verdin, J.; Shukla, S.; Husak, G.; Rowland, J.; Harrison, L.; Hoell, A.; et al. The climate hazards infrared precipitation with stations—A new environmental record for monitoring extremes. Sci. Data 2015, 2, 150066. [Google Scholar] [CrossRef] [PubMed] [Green Version]
  36. Hou, A.Y.; Kakar, R.K.; Neeck, S.; Azarbarzin, A.A.; Kummerow, C.D.; Kojima, M.; Oki, R.; Nakamura, K.; Iguchi, T. The global precipitation measurement mission. Bull. Am. Meteorol. Soc. 2014, 95, 701–722. [Google Scholar] [CrossRef]
  37. Huffman, G.J.; Bolvin, D.T.; Braithwaite, D.; Hsu, K.; Joyce, R.; Xie, P.; Yoo, S.H. NASA global precipitation meas-urement (GPM) integrated multi-satellite retrievals for GPM (IMERG). Algorithm Theor. Basis Doc. (ATBD) Version 2015, 4, 26. [Google Scholar]
  38. Tong, K.; Zhao, Y.; Wei, Y.; Hu, B.; Lu, Y. Evaluation and Hydrological Validation of GPM Precipitation Products over the Nanliu River Basin, Beibu Gulf. Water 2018, 10, 1777. [Google Scholar] [CrossRef] [Green Version]
  39. Xiao, S.; Xia, J.; Zou, L. Evaluation of Multi-Satellite Precipitation Products and Their Ability in Capturing the Characteristics of Extreme Climate Events over the Yangtze River Basin, China. Water 2020, 12, 1179. [Google Scholar] [CrossRef] [Green Version]
  40. Morsy, M.; Scholten, T.; Michaelides, S.; Borg, E.; Sherief, Y.; Dietrich, P. Comparative Analysis of TMPA and IMERG Precipitation Datasets in the Arid Environment of El-Qaa Plain, Sinai. Remote. Sens. 2021, 13, 588. [Google Scholar] [CrossRef]
  41. Kawo, N.S.; Hordofa, A.T.; Karuppannan, S. Performance evaluation of GPM-IMERG early and late rainfall estimates over Lake Hawassa catchment, Rift Valley Basin, Ethiopia. Arab. J. Geosci. 2021, 14, 1–14. [Google Scholar] [CrossRef]
  42. Prakash, S. Performance assessment of CHIRPS, MSWEP, SM2RAIN-CCI, and TMPA precipitation products across India. J. Hydrol. 2019, 571, 50–59. [Google Scholar] [CrossRef]
  43. Luo, X.; Wu, W.; He, D.; Li, Y.; Ji, X. Hydrological Simulation Using TRMM and CHIRPS Precipitation Estimates in the Lower Lancang-Mekong River Basin. Chin. Geogr. Sci. 2019, 29, 13–25. [Google Scholar] [CrossRef] [Green Version]
  44. Taye, M.; Sahlu, D.; Zaitchik, B.; Neka, M. Evaluation of Satellite Rainfall Estimates for Meteorological Drought Analysis over the Upper Blue Nile Basin, Ethiopia. Geoscience 2020, 10, 352. [Google Scholar] [CrossRef]
  45. Pang, J.; Zhang, H.; Xu, Q.; Wang, Y.; Wang, Y.; Zhang, O.; Hao, J. Hydrological evaluation of open-access precipitation data using SWAT at multiple temporal and spatial scales. Scales Hydrol. Earth Sci. 2020, 24, 3603–3626. [Google Scholar] [CrossRef]
  46. Goshime, D.W.; Absi, R.; Ledésert, B. Evaluation and Bias Correction of CHIRP Rainfall Estimate for Rainfall-Runoff Simulation over Lake Ziway Watershed, Ethiopia. Hydrology 2019, 6, 68. [Google Scholar] [CrossRef] [Green Version]
  47. Wedajo, G.K.; Muleta, M.K.; Awoke, B.G. Performance evaluation of multiple satellite rainfall products for Dhidhessa River Basin (DRB), Ethiopia. Atmos. Meas. Tech. 2021, 14, 2299–2316. [Google Scholar] [CrossRef]
  48. Esayas, B.; Simane, B.; Teferi, E.; Ongoma, V.; Tefera, N. Trends in Extreme Climate Events over Three Agroecological Zones of Southern Ethiopia. Adv. Meteorol. 2018, 2018, 1–17. [Google Scholar] [CrossRef]
  49. Dinku, T.; Funk, C.; Peterson, P.; Maidment, R.; Tadesse, T.; Gadain, H.; Ceccato, P. Validation of the CHIRPS satellite rainfall estimates over eastern Africa. Q. J. R. Meteorol. Soc. 2018, 144, 292–312. [Google Scholar] [CrossRef] [Green Version]
  50. Wu, W.; Li, Y.; Luo, X.; Zhang, Y.; Ji, X.; Li, X. Performance evaluation of the CHIRPS precipitation dataset and its utility in drought monitoring over Yunnan Province, China. Geomat. Nat. Hazards Risk 2019, 10, 2145–2162. [Google Scholar] [CrossRef] [Green Version]
  51. Korres, N.; Norsworthy, J.; Burgos, N.; Oosterhuis, D. Temperature and drought impacts on rice production: An agronomic perspective regarding short- and long-term adaptation measures. Water Resour. Rural. Dev. 2017, 9, 12–27. [Google Scholar] [CrossRef]
  52. Guo, H.; Chen, S.; Bao, A.; Hu, J.; Gebregiorgis, A.S.; Xue, X.; Zhang, X. Inter-comparison of high-resolution satellite precipitation products over Central Asia. Remote Sens. 2015, 7, 7181–7211. [Google Scholar] [CrossRef] [Green Version]
  53. Legesse, D.; Ayenew, T. Effect of improper water and land resource utilization on the central Main Ethiopian Rift lakes. Quat. Int. 2006, 148, 8–18. [Google Scholar] [CrossRef]
  54. Alhamshry, A.; Fenta, A.A.; Yasuda, H.; Kimura, R.; Shimizu, K. Seasonal Rainfall Variability in Ethiopia and Its Long-Term Link to Global Sea Surface Temperatures. Water 2020, 12, 55. [Google Scholar] [CrossRef] [Green Version]
  55. Mair, A.; Fares, A. Comparison of Rainfall Interpolation Methods in a Mountainous Region of a Tropical Island. J. Hydrol. Eng. 2011, 16, 371–383. [Google Scholar] [CrossRef]
  56. Novella, N.S.; Thiaw, W.M. African Rainfall Climatology Version 2 for Famine Early Warning Systems. J. Appl. Meteorol. Clim. 2013, 52, 588–606. [Google Scholar] [CrossRef]
  57. Funk, C.; Michaelsen, J.; Marshall, M.T. Mapping Recent Decadal Climate Variations in Precipitation and Temperature across Eastern Africa and the Sahel. Remote Sens. Drought Innov. Monit. Approaches 2012, 24, 331. [Google Scholar] [CrossRef]
  58. Kisaka, M.O.; Mucheru-Muna, M.; Ngetich, F.K.; Mugwe, J.; Mugendi, D.N.; Mairura, F. Rainfall Variability, Drought Characterization, and Efficacy of Rainfall Data Reconstruction: Case of Eastern Kenya. Adv. Meteorol. 2015, 2015, 1–16. [Google Scholar] [CrossRef] [Green Version]
  59. Saha, S.; Moorthi, S.; Pan, H.-L.; Wu, X.; Wang, J.; Nadiga, S.; Tripp, P.; Kistler, R.; Woollen, J.; Behringer, D.; et al. The NCEP Climate Forecast System Reanalysis. Bull. Am. Meteorol. Soc. 2010, 91, 1015–1058. [Google Scholar] [CrossRef]
  60. Nega, W.; Hailu, B.T.; Fetene, A. An assessment of the vegetation cover change impact on rainfall and land surface temperature using remote sensing in a subtropical climate, Ethiopia. Remote. Sens. Appl. Soc. Environ. 2019, 16, 100266. [Google Scholar] [CrossRef]
  61. Taye, M.T.; Dyer, E.; Hirpa, F.A.; Charles, K. Climate Change Impact on Water Resources in the Awash Basin, Ethiopia. Water 2018, 10, 1560. [Google Scholar] [CrossRef] [Green Version]
  62. Ma, Z.; Xu, J.; Zhu, S.; Yang, J.; Tang, G.; Yang, Y.; Shi, Z.; Hong, Y. AIMERG: A new Asian precipitation dataset (0.1°/half-hourly, 2000–2015) by calibrating the GPM-era IMERG at a daily scale using APHRODITE. Earth Syst. Sci. Data 2020, 12, 1525–1544. [Google Scholar] [CrossRef]
  63. Ehsani, M.R.; Behrangi, A.; Adhikari, A.; Song, Y.; Huffman, G.J.; Adler, R.F.; Bolvin, D.T.; Nelkin, E.J. Assessment of the Advanced Very High-Resolution Radiometer (AVHRR) for Snowfall Retrieval in High Latitudes Using CloudSat and Machine Learning. J. Hydrometeorol. 2021, 1. [Google Scholar] [CrossRef]
  64. Hailesilassie, W.T.; Ayenew, T.; Tekleab, S. Analysing Trends and Spatio-Temporal Variability of Precipitation in the Main Central Rift Valley Lakes Basin, Ethiopia. Environ. Earth Sci. Res. J. 2021, 8, 37–47. [Google Scholar] [CrossRef]
  65. Conway, D. Some aspects of climate variability in the north east Ethiopian highlands—Wollo and Tigray. SINET Ethiop. J. Sci. 2000, 23, 139–161. [Google Scholar] [CrossRef] [Green Version]
  66. Gupta, S.K.; Ritchey, N.A.; Wilber, A.C.; Whitlock, C.H.; Gibson, G.G.; Stackhouse, P.W., Jr. A climatology of surface radiation budget derived from satellite data. J. Clim. 1999, 12, 2691–2710. [Google Scholar] [CrossRef]
  67. Lutz, A.F.; Ter Maat, H.W.; Biemans, H.; Shrestha, A.B.; Wester, P.; Immerzeel, W. Selecting representative climate models for climate change impact studies: An advanced envelope-based selection approach. Int. J. Clim. 2016, 36, 3988–4005. [Google Scholar] [CrossRef] [Green Version]
  68. McCuen, R.H.; Knight, Z.; Cutter, A.G. Evaluation of the Nash–Sutcliffe Efficiency Index. J. Hydrol. Eng. 2006, 11, 597–602. [Google Scholar] [CrossRef]
  69. Farlie, D.J.G. The Performance of Some Correlation Coefficients for a General Bivariate Distribution. Biometrika 1960, 47, 47. [Google Scholar] [CrossRef]
  70. Chicco, D.; Jurman, G. The advantages of the Matthews correlation coefficient (MCC) over F1 score and accuracy in binary classification evaluation. BMC Genom. 2020, 21, 6. [Google Scholar] [CrossRef] [Green Version]
  71. Rivera, J.A.; Marianetti, G.; Hinrichs, S. Validation of CHIRPS precipitation dataset along the Central Andes of Argentina. Atmos. Res. 2018, 213, 437–449. [Google Scholar] [CrossRef]
  72. Saeidizand, R.; Sabetghadam, S.; Tarnavsky, E.; Pierleoni, A. Evaluation of CHIRPS rainfall estimates over Iran. Q. J. R. Meteorol. Soc. 2018, 144, 282–291. [Google Scholar] [CrossRef] [Green Version]
  73. Tramblay, Y.; Thiemig, V.; Dezetter, A.; Hanich, L. Evaluation of satellite-based rainfall products for hydrological modelling in Morocco. Hydrol. Sci. J. 2016, 61, 2509–2519. [Google Scholar] [CrossRef] [Green Version]
Figure 1. A map of the Ziway Lake Basin, including elevation, rivers, rainfall stations, and Lake Ziway itself.
Climate 09 00113 g001
Figure 2. Thiessen Polygon network of the Ziway Lake Basin.
Climate 09 00113 g002
Figure 3. Spatial distribution of main rainy and dry season rainfall (a,c) for CHIRPS, (b,d) for IMERG for the period 2000–2014.
Climate 09 00113 g003
Figure 4. Monthly areal rainfall (a), cumulative rainfall depths (b), the correlation between monthly satellite-derived (CHIRPS and IMERG-(early, late, and final) run) and observed rainfall (c) from (2000–2014) over the Ziway Lake Basin.
Climate 09 00113 g004aClimate 09 00113 g004b
Figure 5. Seasonal performance evaluation indices of CHIRPS, IMERG-E, IMERG-L, and IMERG-F run: Correlation Coefficient (a), Root Mean Square Error (b), Nash–Sutcliffe Efficiency (c), and Percent Bias (d) for the period 2000–2014.
Climate 09 00113 g005
Table 1. List of the twelve rainfall stations over the Ziway Lake Basin.
Station NameLatitude
(in Degree)
Longitude
(in Degree)
Elevation (m)
Adamitulu7.8638.701653
Arata7.9839.061777
Assela7.9639.142413
Bui8.3338.552020
Butajira8.1538.372000
Etheya8.1339.332129
Kulumsa8.0139.162211
Meki8.1538.821662
Merero7.4539.372940
Sagure7.7739.152480
Tora7.8638.422001
Ziway7.9338.701640
Table 2. List of the statistical metrics, used for the evaluation of satellite rainfall products.
Evaluation MetricsDescriptionEquationUnitRangeBest Value
Percent Bias (PBIAS)Measure the average tendency of the SPPs P B I A S = 1 = 1 n ( P S i P G i ) 1 i = 1 n P S × 100 NA(∞~∞)0
Root Mean Square (RMSE)Measure the average magnitude of errors R M S E = i = 1 n ( P S i P G i ) 2 × 1 N mm[0~∞)0
Nash–Sutcliffe Efficiency (NSE)Determines the magnitude of the residual variance N S E = 1 i = 1 n ( P S i P G i ) 2 i = 1 n ( P G i P G m e a n ) 2 NA(∞~1]1
Correlation Coefficient (r)Indicate the relationship between observed rainfall data and the SPPs products r = i = 1 n ( P G i P G m e a n ) i = 1 n ( P S i P S m e a n ) ( P G P G m e a n ) 2 ( P S P S m e a n ) 2 NA[−1~1]1
where: PSi is rainfall from satellite and PGi the observed rainfall at ith time step (daily, weekly, monthly, or seasonal) with N pairs of data, PGmean and PSmean are mean observed rainfall and mean satellite rainfall, respectively.
Table 3. Monthly statistical performance evaluation satellite rainfall products for the Ziway Lake Basin.
SPPsrNSERMSE (mm)PBIAS (%)
CHIRPS0.960.9217.452.22
IMERG-E0.920.7228.199.67
IMER-L0.930.7626.128.48
IMERG-F0.850.6034.4713.0
Publisher’s Note: MDPI stays neutral with regard to jurisdictional claims in published maps and institutional affiliations.

