Article

Analysis of Urban Greening Scenarios for Improving Outdoor Thermal Comfort in Neighbourhoods of Lecce (Southern Italy)

1
Dipartimento di Scienze e Tecnologie Biologiche ed Ambientali, University of Salento, 73100 Lecce, Italy
2
Atmospheric Pollution Division, Environmental Department, Research Center for Energy, Environment and Technology (CIEMAT), 28040 Madrid, Spain
3
Faculty of Technology, LAB University of Applied Sciences, Mukkulankatu 19, 15210 Lahti, Finland
4
School of Computing, Engineering and Built Environment, Glasgow Caledonian University, Glasgow G4 0BA, UK
*
Author to whom correspondence should be addressed.
Submission received: 27 May 2021 / Revised: 2 July 2021 / Accepted: 9 July 2021 / Published: 12 July 2021
(This article belongs to the Special Issue Forest-Climate Ecosystem Interactions)

Abstract

:
This study analyses the interactions and impacts between multiple factors i.e., urban greening, building layout, and meteorological conditions that characterise the urban microclimate and thermal comfort in the urban environment. The focus was on two neighbourhoods of Lecce city (southern Italy) characterised through field campaigns and modelling simulations on a typical hot summer day. Field campaigns were performed to collect greening, building geometry, and microclimate data, which were employed in numerical simulations of several greening scenarios using the Computational Fluid Dynamics-based and microclimate model ENVI-met. Results show that, on a typical summer day, trees may lead to an average daily decrease of air temperature by up to 1.00 °C and an improvement of thermal comfort in terms of Mean Radiant Temperature (MRT) by up to 5.53 °C and Predicted Mean Vote (PMV) by up to 0.53. This decrease is more evident when the urban greening (in terms of green surfaces and trees) is increased by 1266 m2 in the first neighbourhood and 1988 m2 in the second one, with respect to the current scenario, proving that shading effect mainly contributes to improving the urban microclimate during daytime. On the contrary, the trapping effect of heat, stored by the surfaces during the day and released during the evening, induces an increase of the spatially averaged MRT by up to 2 °C during the evenings and a slight deterioration of thermal comfort, but only locally where the concentration of high LAD trees is higher. This study contributes to a better understanding of the ecosystem services provided by greening with regard to microclimate and thermal comfort within an urban environment for several hours of the day. It adds knowledge about the role of green areas in a Mediterranean city, an important hot spot of climate change, and thus it can be a guide for important urban regeneration plans.

1. Introduction

The growing impact of global warming is causing cities to encounter increasingly intense phenomena such as the Urban Heat Island (UHI). Among other things, UHI leads to negative consequences on human wellbeing, one of which is the thermal discomfort. Outdoor human thermal comfort in cities not only depends on air temperature but on the combined effect of air temperature, wind speed, air humidity, and radiation. The outdoor thermal comfort evaluation is usually performed combining micro-meteorological measurements or modelling and a guided user questionnaire survey on thermal perception and preference, as recently briefly summarized by Gatto et al. [1]. Recently, the improvement of thermal comfort has become one of the cornerstones of urban design and planning; in this perspective, urban greening, including forests, road trees, trees in parks, gardens, and trees in abandoned corners [2], plays an important role by providing a multitude of benefits to urban populations in reducing air, water, noise pollution, and the urban heat island, working as natural air conditioners, preventing solar radiation from heating the buildings and surfaces, cooling the air by evapotranspiration and reducing wind speed [3,4].
Urban greening alters the microclimate by means of several processes. The absorbed solar radiation energy induces an evaporation of water from vegetation to atmosphere (evapotranspiration processes) and then the atmosphere is cooled; in addition, the shade of vegetation protects other urban surfaces from solar radiation and prevents the increase of air and surface temperatures [3,5,6]. All these processes are usually modelled in Computational Fluid Dynamics (CFD) simulations [7]. The influence of urban greening on air quality can be positive or negative depending on different factors such as urban morphology, green features, location of emissions, meteorology, etc. (e.g., [8,9,10,11,12]). Therefore, careful planning of urban green spaces is absolutely essential, and the use of numerical modelling, allowing the simulation of different scenarios and the combination of several factors, can help to understand the right way to plan and manage urban greenery, so as to enhance its positive effects [13].
This study aims to investigate the effects of urban greening on air temperature and thermal comfort in urban and suburban neighbourhoods of Lecce city (Italy). The CFD microclimate model ENVI-met is employed because of its capacity to combine the simulation of processes induced by urban greening with atmospheric processes occurring in the upper atmospheric layer of built environments [14]. Different scenarios are evaluated by removing/adding trees in critical areas tailored to decrease high air temperatures characterizing the study areas, improve the thermal comfort, and provide some useful planting guidelines for urban planners. The thermal comfort is evaluated in terms of the mean radiant temperature (MRT) and the predicted mean vote (PMV)—two indices widely employed in research literature. A brief overview of indices employed for the evaluation of thermal comfort is given in Yang et al. [13].
The novelty of this study is that it compares the effects of tree species, characterised by different crown structure, height, and Leaf Area Density (LAD) in two different neighbourhoods of the same city. This provides a better understanding of the factors that influence the greening performance in terms of provision of ecosystem services and where improvements can be made as part of an urban regeneration plan aimed at mitigating climate change.

2. Materials and Methodology

This study was conducted through field measurements aimed at characterising the geometry of the urban environment, greening, and meteorology (see Section 2.2). In particular, the experimental measurement campaign (see Section 2.5), which led to the data collection of air temperature (Tair), was performed to validate the ENVI-met model simulations (see Section 2.4).

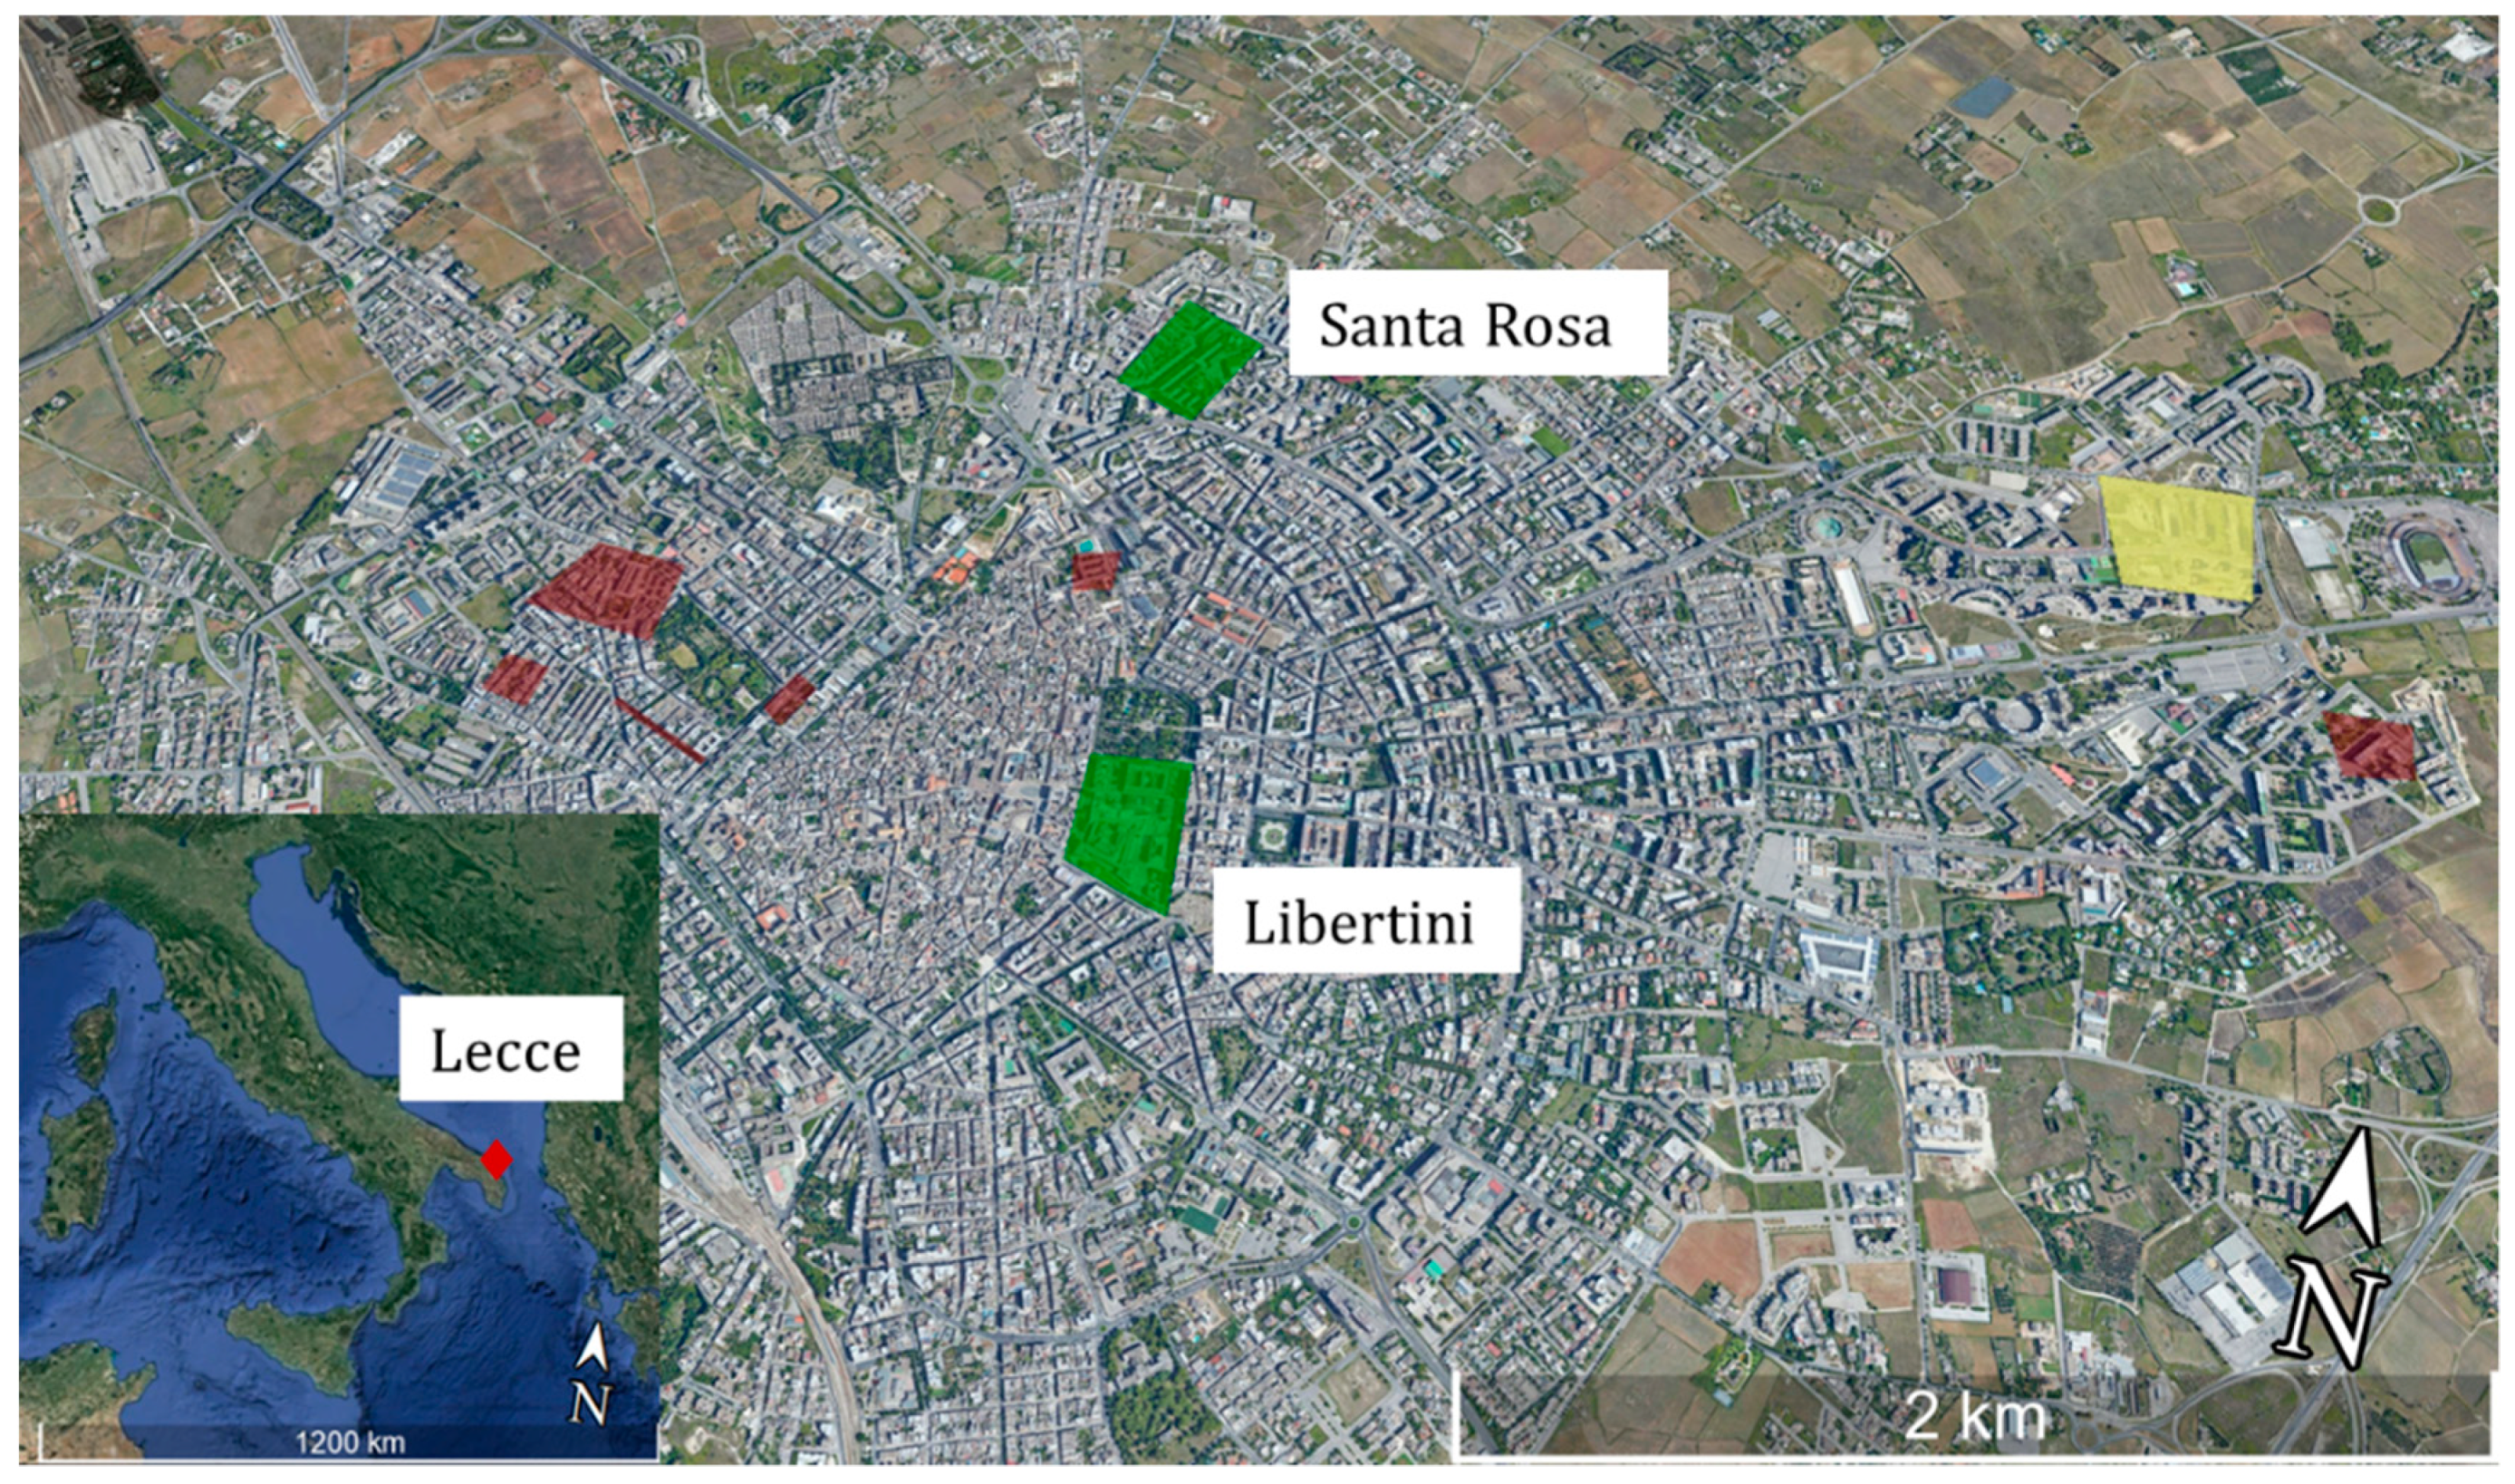
2.1. Study Area: An Overview on Lecce City

The neighbourhoods analysed here are located in Lecce (Figure 1), a medium-size city located on the central part of the Salentine Peninsula, in south-eastern Apulia Region. With about 94,000 inhabitants (http://demo.istat.it/popres/index.php?anno=2020&lingua=ita, accessed on 20 April 2021), Lecce is the main town of the second province in the region by population and one of the most important cities of Apulia. The geometry and morphology of the city are typical of the Mediterranean, with two-to-three-storey buildings and narrow street canyons. Lecce is built on flat land, at about 40–50 m above sea level and it is particularly interesting to study because it is part Mediterranean region, which has recently been described as a climate change “hot spot”, where warming is particularly pronounced in summer and changes in precipitation patterns have been documented during the 20th century [15,16]. Based on the Köppen-Geiger classification, the most widely used quantitative classification of world climates, Lecce belongs to the Warm Mediterranean Climate ‘Csa’ class, with temperate-hot climate and specifically with average temperature of the coldest month between 6 °C and 10 °C, annual average between 14.5 °C and 17 °C, and 4 months with average > 20 °C.
In addition to the studies of climatic aspects on a larger scale, Lecce has been the subject of smaller-scale studies that have investigated the effect of urban morphology and greening on the urban microclimate in several neighbourhoods (Figure 1). Maggiotto et al. [17] investigated the air temperature in four neighbourhoods using field measurements and modelling simulations. Observations showed that the city is characterized by higher air temperatures compared to surrounding areas, and air temperature has a large variability within the city and is very sensitive to urban morphology. Di Sabatino et al. [18] investigated the effects of Tilia cordata Mill. on local meteorology along a road not far from the city centre and specifically on wind flow and turbulence, by also evaluating building façades and ground temperatures with infrared images. The analysis showed that the presence of trees in street canyons may trap heat closer to the ground and this effect is accentuated during the night hours due to the trapping effect. Moreover, a reduced wind speed was observed. Martinelli and Matzarakis [19] investigated its courtyard thermal comfort in terms of Physiologically Equivalent Temperature (PET) using the RayMan model [20] and using micrometeorological data from a 30-year period 1980–2009. Results showed Lecce has the lowest PET excursion and steadier conditions throughout the year, presumably because of the stabilizing influence of the sea. Specifically, results showed 108 days with median PET < 13 °C and 85 days with median PET > 29 °C. Recently, Gatto et al. [1] evaluated the effect of urban greening on thermal comfort (in terms of Mean Radiant Temperature MRT and Predicted Mean Vote PMV) following a methodology based on field measurements and simulations with ENVI-met (the same as that followed in this study). Results showed that, on a typical summer day, the greening has a positive effect on thermal comfort by decreasing PMV of 2 points and MRT by 7 °C and that these variations are also related to urban morphology and greening type. Buccolieri et al. [21] investigated the effect of greening in the “Santa Rosa” neighbourhood (also studied here) on the dispersion of nitrogen oxides (NOx) and on CO2 storage. A further neighbourhood, “167”, is under investigation and will be the subject of a future publication.

2.2. Description of the Neighbourhoods

The first neighbourhood, referred to as “Santa Rosa”, is located in the suburban northern part of the city; the second one, referred to as “Libertini”, is located in the city centre (Figure 1). Santa Rosa is a residential neighbourhood, sparser than Libertini, with several sensitive spots (a church, a primary school, and a small square with a playground) and university buildings. Libertini is a dense area that includes part of the Old Town, a limited traffic road usually overcrowded with pedestrians, and a traffic-busy street canyon (a) (Figure 2).
To characterize the building heights and the main greening features, field measurements were performed in both neighbourhoods. Specifically, buildings heights were measured using a laser rangefinder (LEICA DISTOTMpro4, Swiss Technology by Leica Geosystems, St. Gallen, Switzerland; www.leicadisto.it, accessed on 4 April 2021). The measurement operation took place in indirect mode. This procedure is used when the distance to be measured is difficult to reach; in this case, the DISTO calculates the desired length based on three auxiliary measurements according to the Pythagorean Theorem.
Concerning the greening features, the Leaf Area Index (LAI, m2m–2) of tree crowns was estimated from measurements of the photo-synthetically active radiation (PAR) acquired by an Accu-PAR LP80 ceptometer (https://www.metergroup.com/environment/products/accupar-lp-80-leaf-area-index/, accessed on 4 April 2021). All measurements were taken parallel to the ground. Five replicas were done just near the crown (where the sensor measured unobstructed PAR) and at its base (where it was supposed that the LAI is maximum). The leaf area density (LAD, m2m–3) was thus estimated by dividing LAI with the depth of the tree crown.
Regarding the Santa Rosa neighbourhood, Buccolieri et al. [21] reported part of the experimental campaign, which is summarised here and compared with the Libertini one.
The main characteristics of urban morphology including greening features of the two neighbourhoods here modelled are as summarized below:
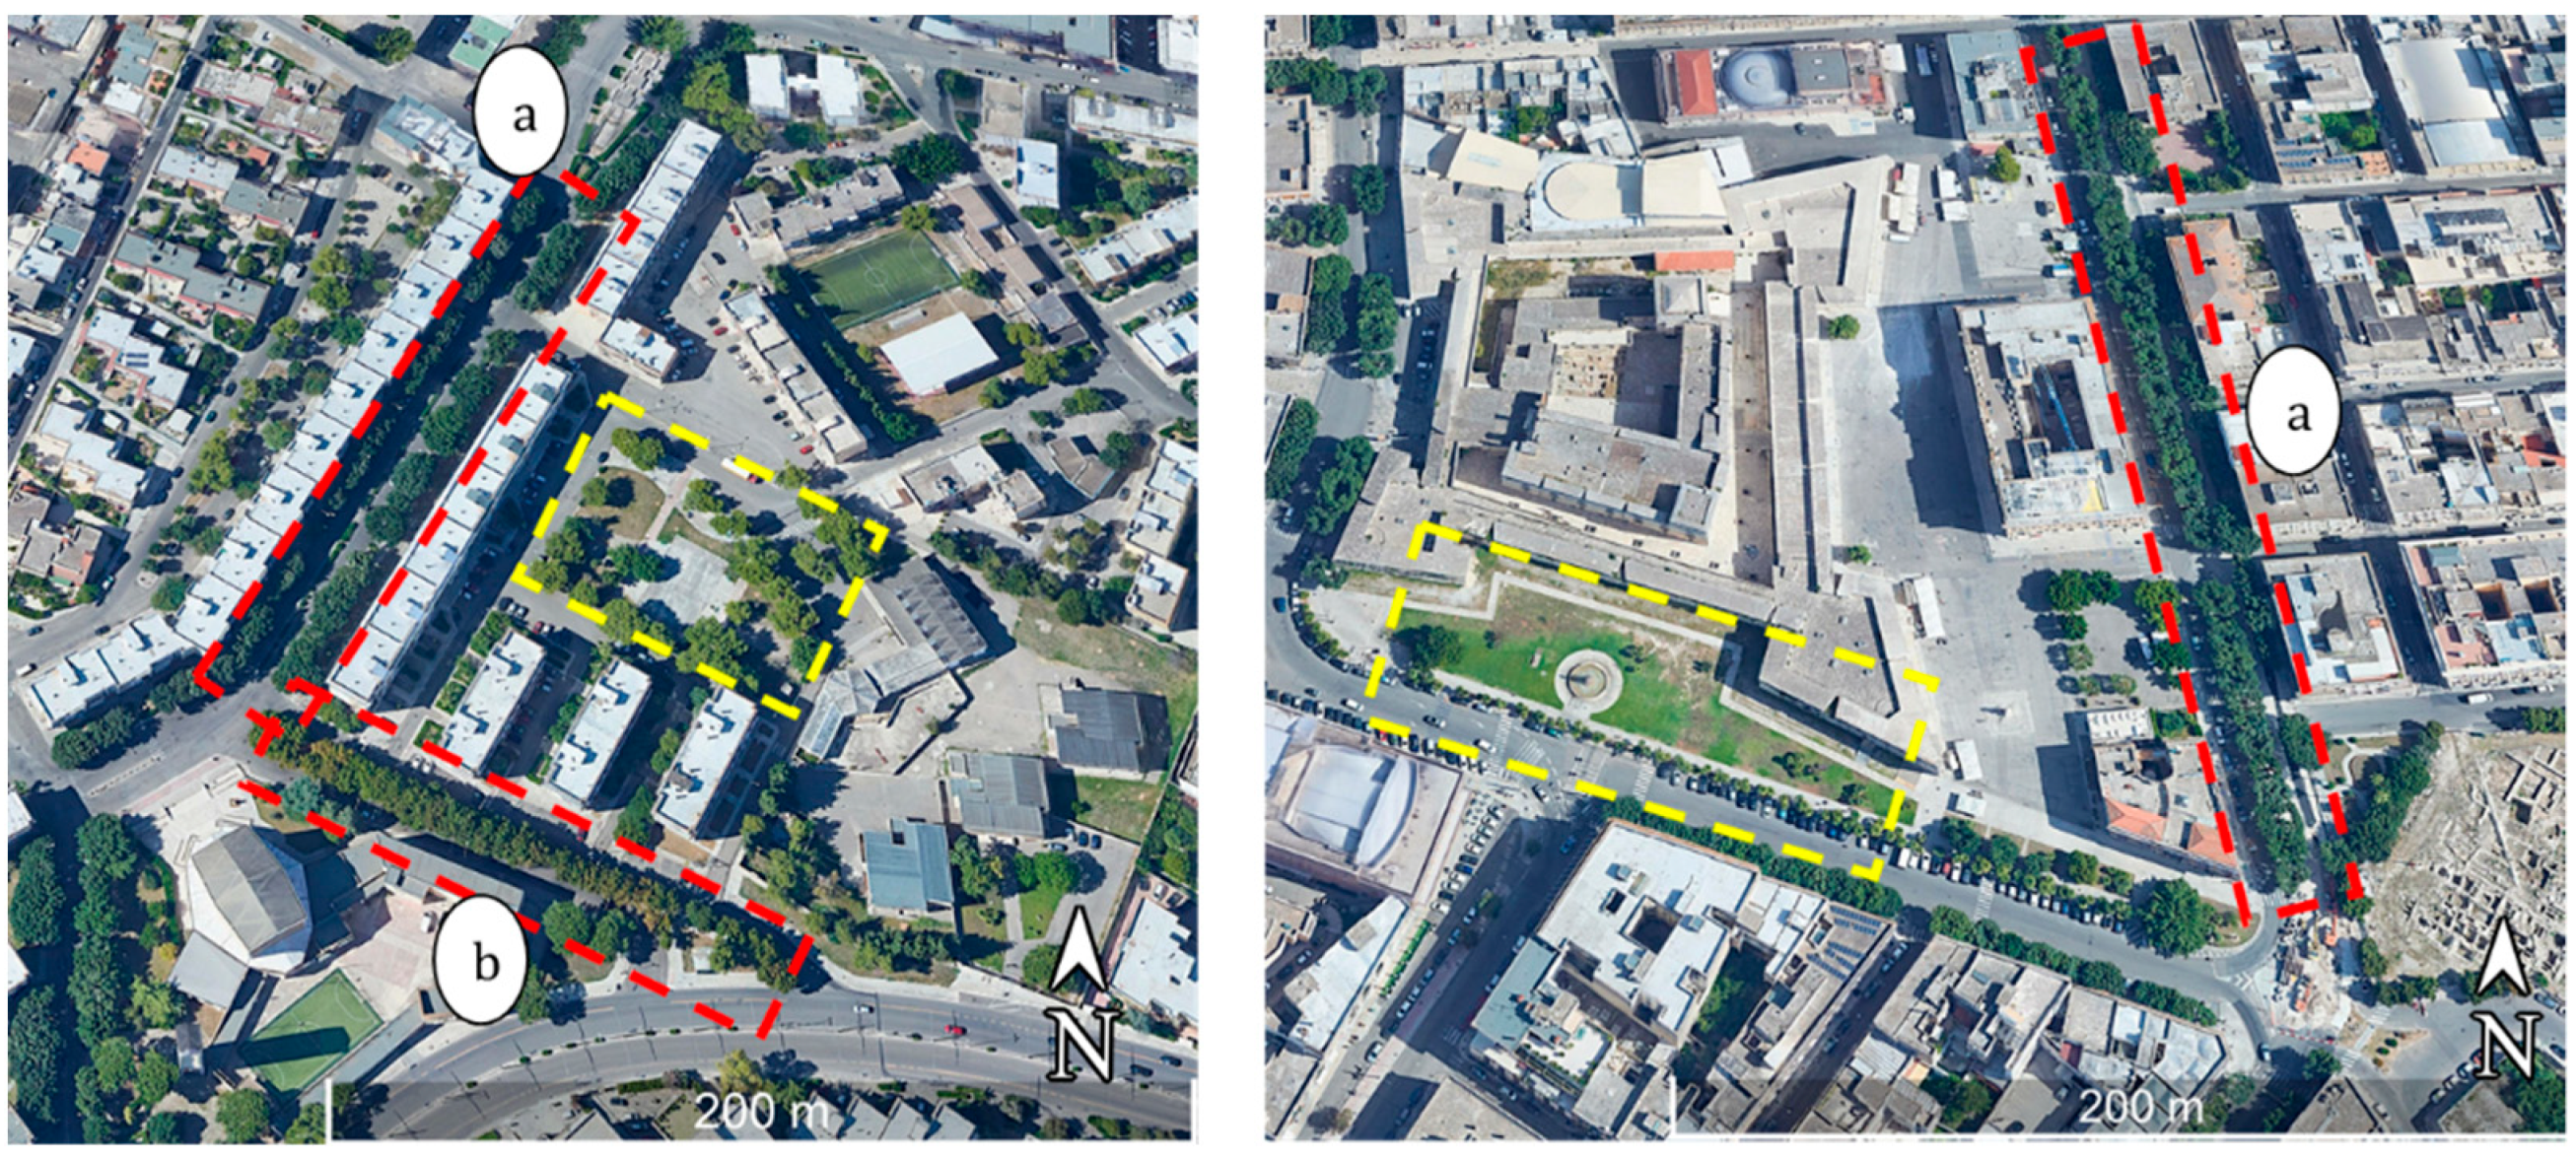
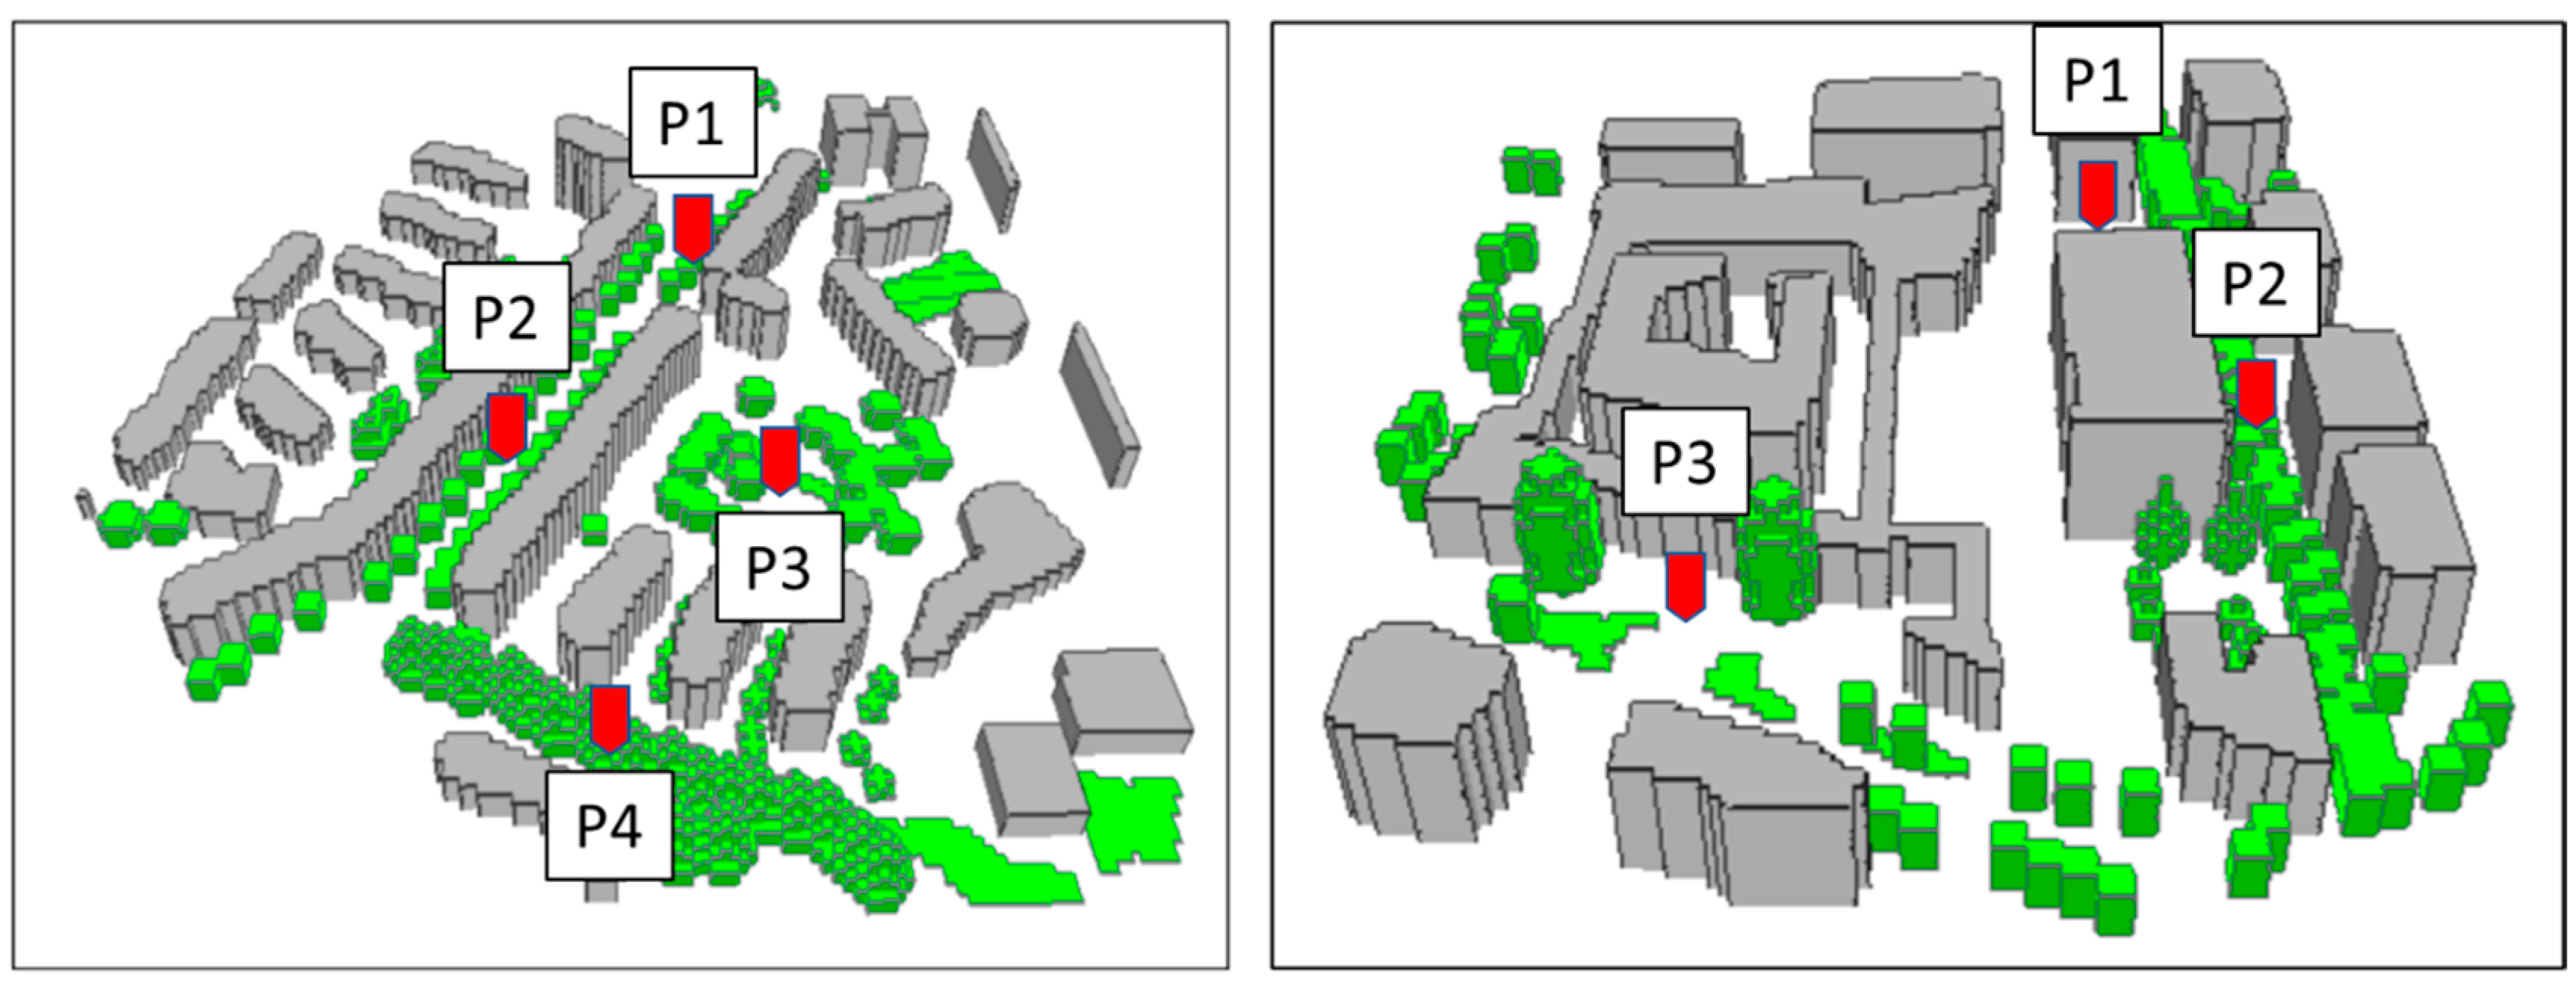
  • Santa Rosa has a dimension of 300 m × 300 m, with two street canyons (highlighted in red in Figure 2) with an aspect ratio H/W (where H is the mean height of the buildings and W the mean width of the street) equal to 0.6. The neighbourhood is characterized by buildings heights ranging from 8 m to 26 m with an average height of 13 m. The street canyon “a” is 172 m long and about 25 m wide, and it is characterized by two lateral rows of 20 trees of Quercus ilex L. (evergreen species) with an average height of 10 m, a 5 m high and wide crown, and a LAD of 0.71 m2/m3; they are planted along a concrete pavement with a small flowerbed for each; the street canyon “b” has some side openings and it is 118 m long; it is characterized by a central row of Tilia sp. (deciduous species) with an average height of 15 m, a 6 m high and 7 m wide crown, and a LAD of 1.00 m2/m3. Overall, the area is characterized by a great variety of greening:
    -
    in Santa Rosa Square (highlighted in yellow in Figure 2), there is an aggregate of trees including Pinus halepensis Mill., Prunus armeniaca L., Ceratonia siliqua L., Pittosporum tobira (Thunb.) W.T. Aiton.;
    -
    in the street parallel to the street canyon “a” (located on the left), there is a row of Cercis siliquastrum L. and several Pinus halepensis Mill. and Quercus ilex L., as well as a Platanus hybrida Brot. and an individual of Grevillea robusta A.Cunn. ex R.Br.
  • Libertini has a dimension of 250 m × 300 m and is characterized by a 180 m long and 25 m wide street canyon (highlighted in red in Figure 2), with an aspect ratio H/W of 0.75 and two lateral rows of Quercus ilex L. with a LAD of 0.40 m2/m3 and a 5 m wide crown. The buildings heights range from 11 m to 16 m with an average height of 13 m. Some trees of Pinus halepensis Mill. and 2 of Lagunaria patersonia (Andrews) G. Don. are present in Libertini Square (to the left side of the street canyon), 3 Ficus rubiginosa Desf. ex Vent. in an area before the square at the bottom of the map, and 10 Quercus ilex L. in a large area (highlighted in yellow in Figure 2) characterised mainly by unirrigated turfs.

2.3. Scenarios Investigated

Three scenarios were investigated for each (Figure 3): (i) a no greening scenario, (ii) the current scenario, and (iii) a modified scenario aiming at redeveloping the areas based on scientific evidence and guidelines reported in Gatto et al. [1]:
  • in Santa Rosa, part of the cemented area was converted into a green area (grass), specifically 1117 m2 of which 220 m2 is in Santa Rosa Square, and 610 m2 is distributed on both sides of the street canyon “a” where the Quercus ilex L. flowerbed was extended, and the remaining ones in other small areas of the area. In street canyon “b”, five trees of Tilia sp. (149 m2, with the same characteristic of the others already present in the area) were added;
  • in Libertini, according of the same criteria, 1011 m2 of green area (grass) replaced the concrete surface and specifically 434 m2 in the square (highlighted in yellow in Figure 2), 216 m2 along the street canyon “a” where the Quercus ilex L. flowerbed was extended, and the remaining ones in other small portions of the area. Moreover, in the highlighted square, 17 new trees with a conic crown with a LAD of 2.3 m2/m3 (977 m2) were added. Another seven were added in Libertini Square.
Figure 3. Investigated scenarios (indicated by green areas) for the two neighbourhoods Santa Rosa and Libertini.
Climate 09 00116 g003

2.4. Model Description and Simulation Set-Up

The investigated scenarios were simulated by means of ENVI-met (http://www.envi-met.info/doku.php?id=kb:review, accessed on 13 May 2021), a prognostic non-hydrostatic model able to analyse the surface–plant–air interactions. It solves Reynolds-averaged Navier-Stokes equations using a 1.5 order turbulence closure k-ε model and is composed of a 3D main model with a one dimensional (1D) atmospheric boundary layer (ABL) model, which permits to extend the analysis from the ground surface up to 2500 m. Evapotranspiration processes are simulated during the entire daily cycle on the basis of biological and thermo-physical properties of plants and soils.
The simulation set-up, summarised in Table 1, is the same as adopted and validated in Gatto et al. [1] and Buccolieri et al. [21]. This choice is aimed at making the studies comparable and to further contribute to in-depth guidelines for policy makers. Hourly air temperature Tair and relative humidity were forced at the model boundary to drive the simulation with meteorological input obtained from a 10 m high meteorological station (ARPA-Puglia, https://www.arpa.puglia.it/pagina2839_meteo.html, accessed on 5 May 2021) located about 1 km from Libertini and 3 km from Santa Rosa. The day 12 June 2018 was selected as representative of the 24-h period of the meteorological campaign (June 2018), since the temperature profile was reasonably correlated with the average temperature profile. Wind velocity and wind direction conformed to the other cases studied.

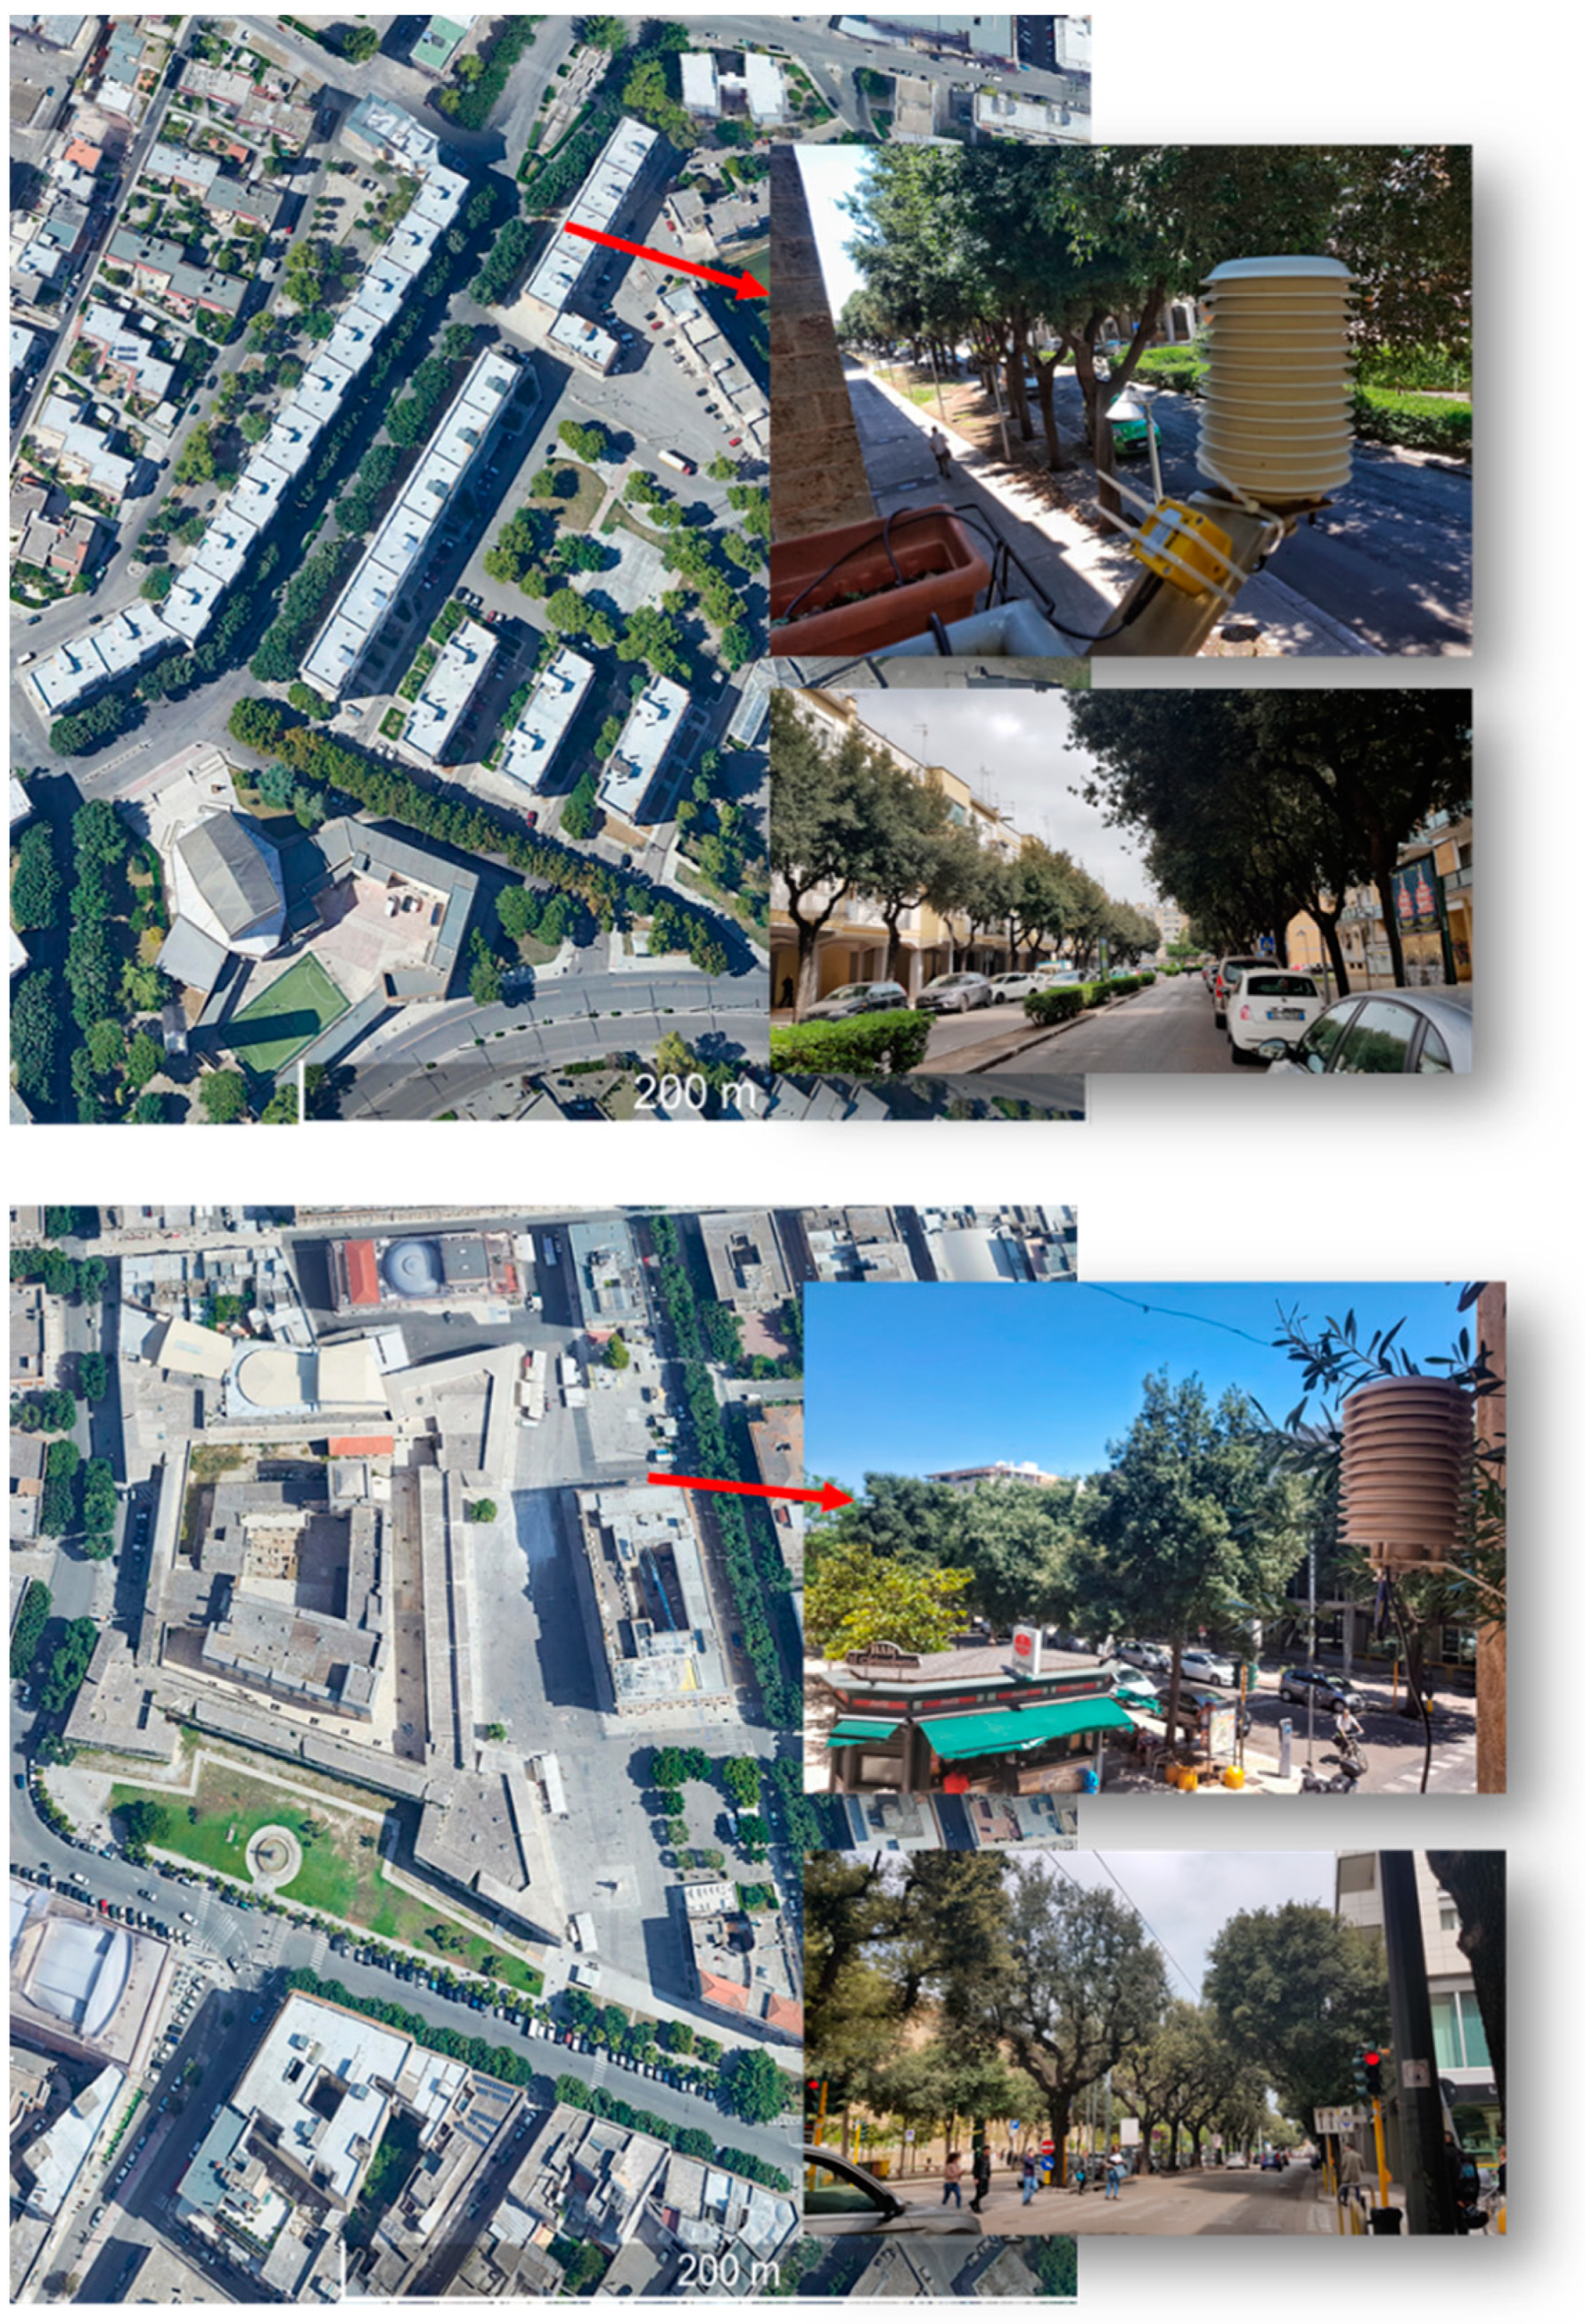
2.5. Micrometeorological Measurements

To evaluate the simulation performance in both the neighbourhoods investigated, modelling results were compared against Tair measurements recorded continuously in June 2018 using Vaisala HMP45C thermo-hygrometers (Figure 4) at Point 1 shown in Figure 5. The sensors were mounted on the banister of a balcony at the first floor of a building, 5 m above ground level to be representative of the urban canyon conditions. This was considered a reasonable compromise overcoming some of the inherent difficulties in positioning instruments in urban street canyons such as security from vandalism and limited access permission. The sensors were connected to a Campbell CR3000 data logger, which stored 10 min averaged values.

2.6. Calculated and Analyzed Parameters

Microclimate and thermal comfort analysis were carried out at z = 1.4 m, taken here as pedestrian level [22], extracting daily contours of Tair at strategically important points within the areas (Figure 5) and calculating MRT, which can be defined as the radiation heat absorbed by humans [23], and PMV, which takes into consideration both micrometeorological parameters and personal factors such as heat resistance of clothing and human activity. The choice of the indices investigated was also partly motivated by the need to compare the results with those already obtained in Gatto et al. [1].
MRT was calculated by simulating the short and long-wave radiant flux densities from the 3-dimensional environment and it was investigated here because it is considered to have a major impact on the estimation of many thermo-physiological indices describing human thermal comfort, including PMV, PET, Standard Effect Temperature (SET), and Universal Thermal Comfort Index (UTCI) [14]. PMV was simulated on the basis of meteorological parameters of Tair, Rh, wind velocity (v), and MRT. As a recent literature review on ENVI-met [24] confirms, PMV is now an index adopted worldwide and used in various studies because it considered comprehensively Tair, RH, WS, MRT, and personal factors such as clothing heat resistance and human activity. Outdoor PMV ranges from −4 (very cold) to 4 (very hot), with 0 being neutral. For outdoor conditions, these values differ from the indoor theoretical limits (−3; +3) (ASHRAE Standard 55-2010 Thermal environmental conditions for human occupancy), and summer heat stress situations or extreme cold conditions can produce PMV values much higher than +4 (+8 and more) and much lower than −4 (−8 and less), as can be inferred from the PMV maps shown in Figure 8 of Gatto et al. [1]. Specifically, spatial maps for 3 h (12:00, 16:00 and 20:00), considered interesting by analysing the daily Tair profile and also investigated in other studies [24], were extracted. The intention is, in fact, to investigate the spatial distribution of variables in different parts of the day and two warmer hours (where heat stress is more significant in summer and greater the impact of vegetation) and a less warm hour like sunset (where the impact of vegetation is less) were chosen. To better discriminate the species-specific thermal performance and compare it with data already available in the literature, the Heat Reduction Potential (HRP) index was calculated in specific areas (Figure 2) at three selected hours. Specifically, the HRP equation was used in Morakinyo et al. [25] to evaluate the thermal performance of several tree forms in specific urban morphologies (street canyons). It was defined as the potential time-dependent human thermal comfort improvement in a vegetated area against the reference area and, therefore, represents the cooling potential of trees relative to the heat-stress. Morakinyo et al. [25] assessed thermal comfort using the PET thermal comfort index because its performance had already been evaluated in a subtropical hot-humid climate. In this study, the equation was modified using the PMV index, both to test its effectiveness and to compare the results with a previous study [1]. It is therefore estimated as:
H R P P M V = ( P M V S A t P M V S A w t P M V A A w t ) × 100
where:
  • HRPPMV = Heat Reduction Potential in terms of thermal comfort (%)
  • PMVSAt = PMV in the selected area with trees
  • PMVSAwt = PMV in selected area without trees
  • PMVAAWT = PMV in the whole area without trees

3. Results

3.1. Model Validation

In Gatto et al. [1], the performance of ENVI-met with the chosen setup was validated. To further assess the model performance, several standard parameters were calculated for Tair, namely the mean, the standard deviation (st.dev.), the higher value, the normalized mean square error NMSE, the fractional bias FB, and the correlation coefficient R. According to COST Action 732 [26], recommended criteria are: NMSE ≤ 1.5; −0.3 ≤ FB ≤ 0.3. Results of the statistical analysis are presented in Table 2 and show a quite satisfactory model performance. The comparison shows that ENVI-met was able to reproduce the Tair behaviour (see Figure 5 of Gatto et al. [1]), as can be also seen from the statistical analysis (Table 2), with a lower overestimation (especially in Santa Rosa). The limitation of this model evaluation is that measurements in only one point are available in each neighbourhood. However, the recent review by Tsoka et al. [14] summarized the main studies performed with ENVI-met concluding that most studies have evaluated the model performance during summer rather than in winter, with Tair the most widely evaluated variable with the existing evidence suggesting the model can generally accurately capture the diurnal profile of this parameter.

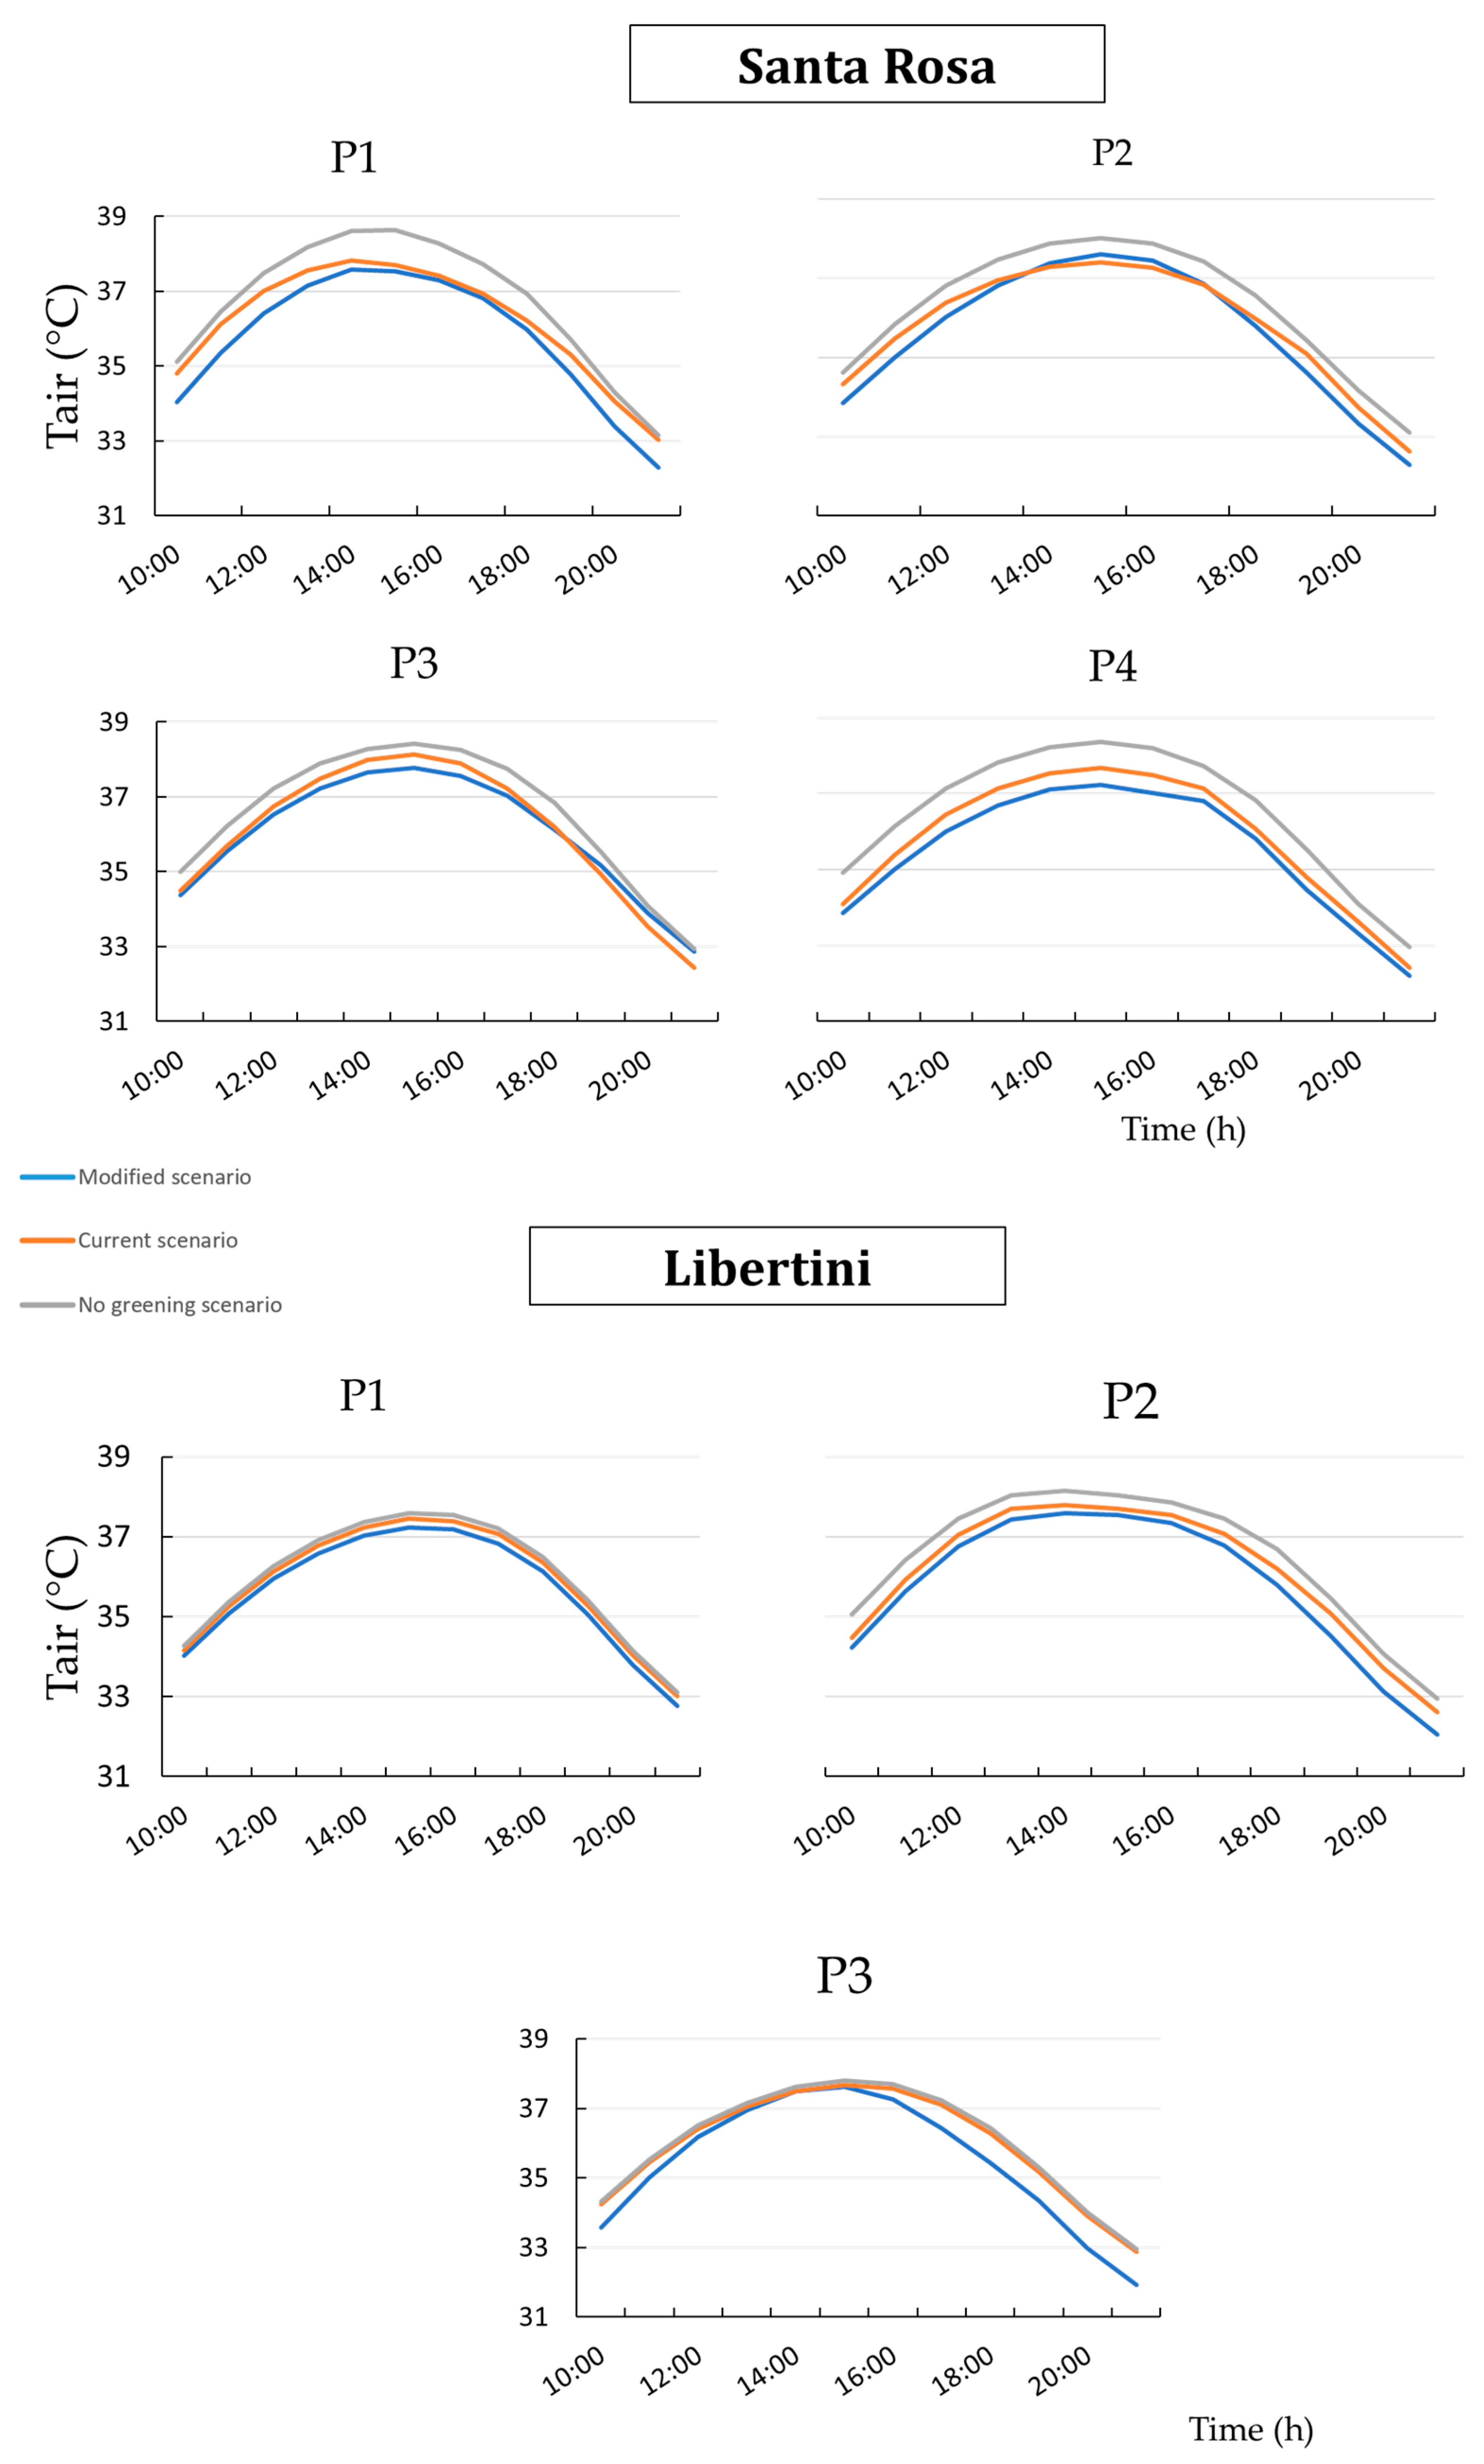
3.2. Temporal Profiles of Air Temperature

Figure 6 shows the temporal profiles of Tair calculated at Points 1, 2, 3, and 4 in Santa Rosa and 1, 2, and 3 in Libertini (see Figure 5 for the position of the points) during the chosen summer day. In general, at each point, both in Santa Rosa and Libertini, Tair is lower in the presence of trees with respect to the no-greening scenarios. The general profile trend of all the scenarios investigated is similar: a gradual increase of Tair occurs from 6:00 to 13:00 local time, followed by a small plateau until 16:00, and then a decrease until 5:00 (the first hours are not shown in the graphs).
Main results are as summarized below:
  • Santa Rosa: Comparing the no greening scenario with the current one, the Tair average daily decrease is about 0.55 °C at all points, with a maximum decrease of 0.92 °C recorded at 15:00 at P1. At P2, the maximum decrease is 0.60 °C at 16:00; at P3 it is 0.68 °C at 18:00; and at P4 it is 0.73 °C at 18.00. Looking at the modified scenario, the Tair average daily decrease is more variable between the points; it is about 1.00 °C at P1 and P4, 0.68 °C at P2, and 0.55 °C at P3. On average, it is higher than the current one by about 0.25 °C. The maximum decrease of 1.10 °C is recorded at 15:00 at P1. At P2, the maximum decrease is 0.84 °C at 20:00; at P3 is 0.71 °C at 18:00; and at P4 it is 1.18 °C at 16:00. So, in general, it is possible to observe a maximum decrease in the presence of trees in the central hottest hours of the day;
  • Libertini: Comparing the no-greening scenario with the current one, the Tair average daily decrease is about 0.25 °C in all points and it is more evident at P2 (street canyon) where the maximum decrease of 0.57 °C is recorded at 10:00. At P1 and P3, the maximum decrease is 0.15 °C at 16:00. As for Santa Rosa, looking at the modified scenario, the Tair average daily decrease is more variable between the points; it is about 0.74 °C at P2, 0.61 °C at P1, and 0.34 °C at P3. On average, it is higher than the current one by about 0.35 °C. The maximum decrease of 1.00 °C is recorded at P3 at 18:00. At P2, it is 0.95 °C at 20:00 and at P1 it is 0.38 °C at 18:00.

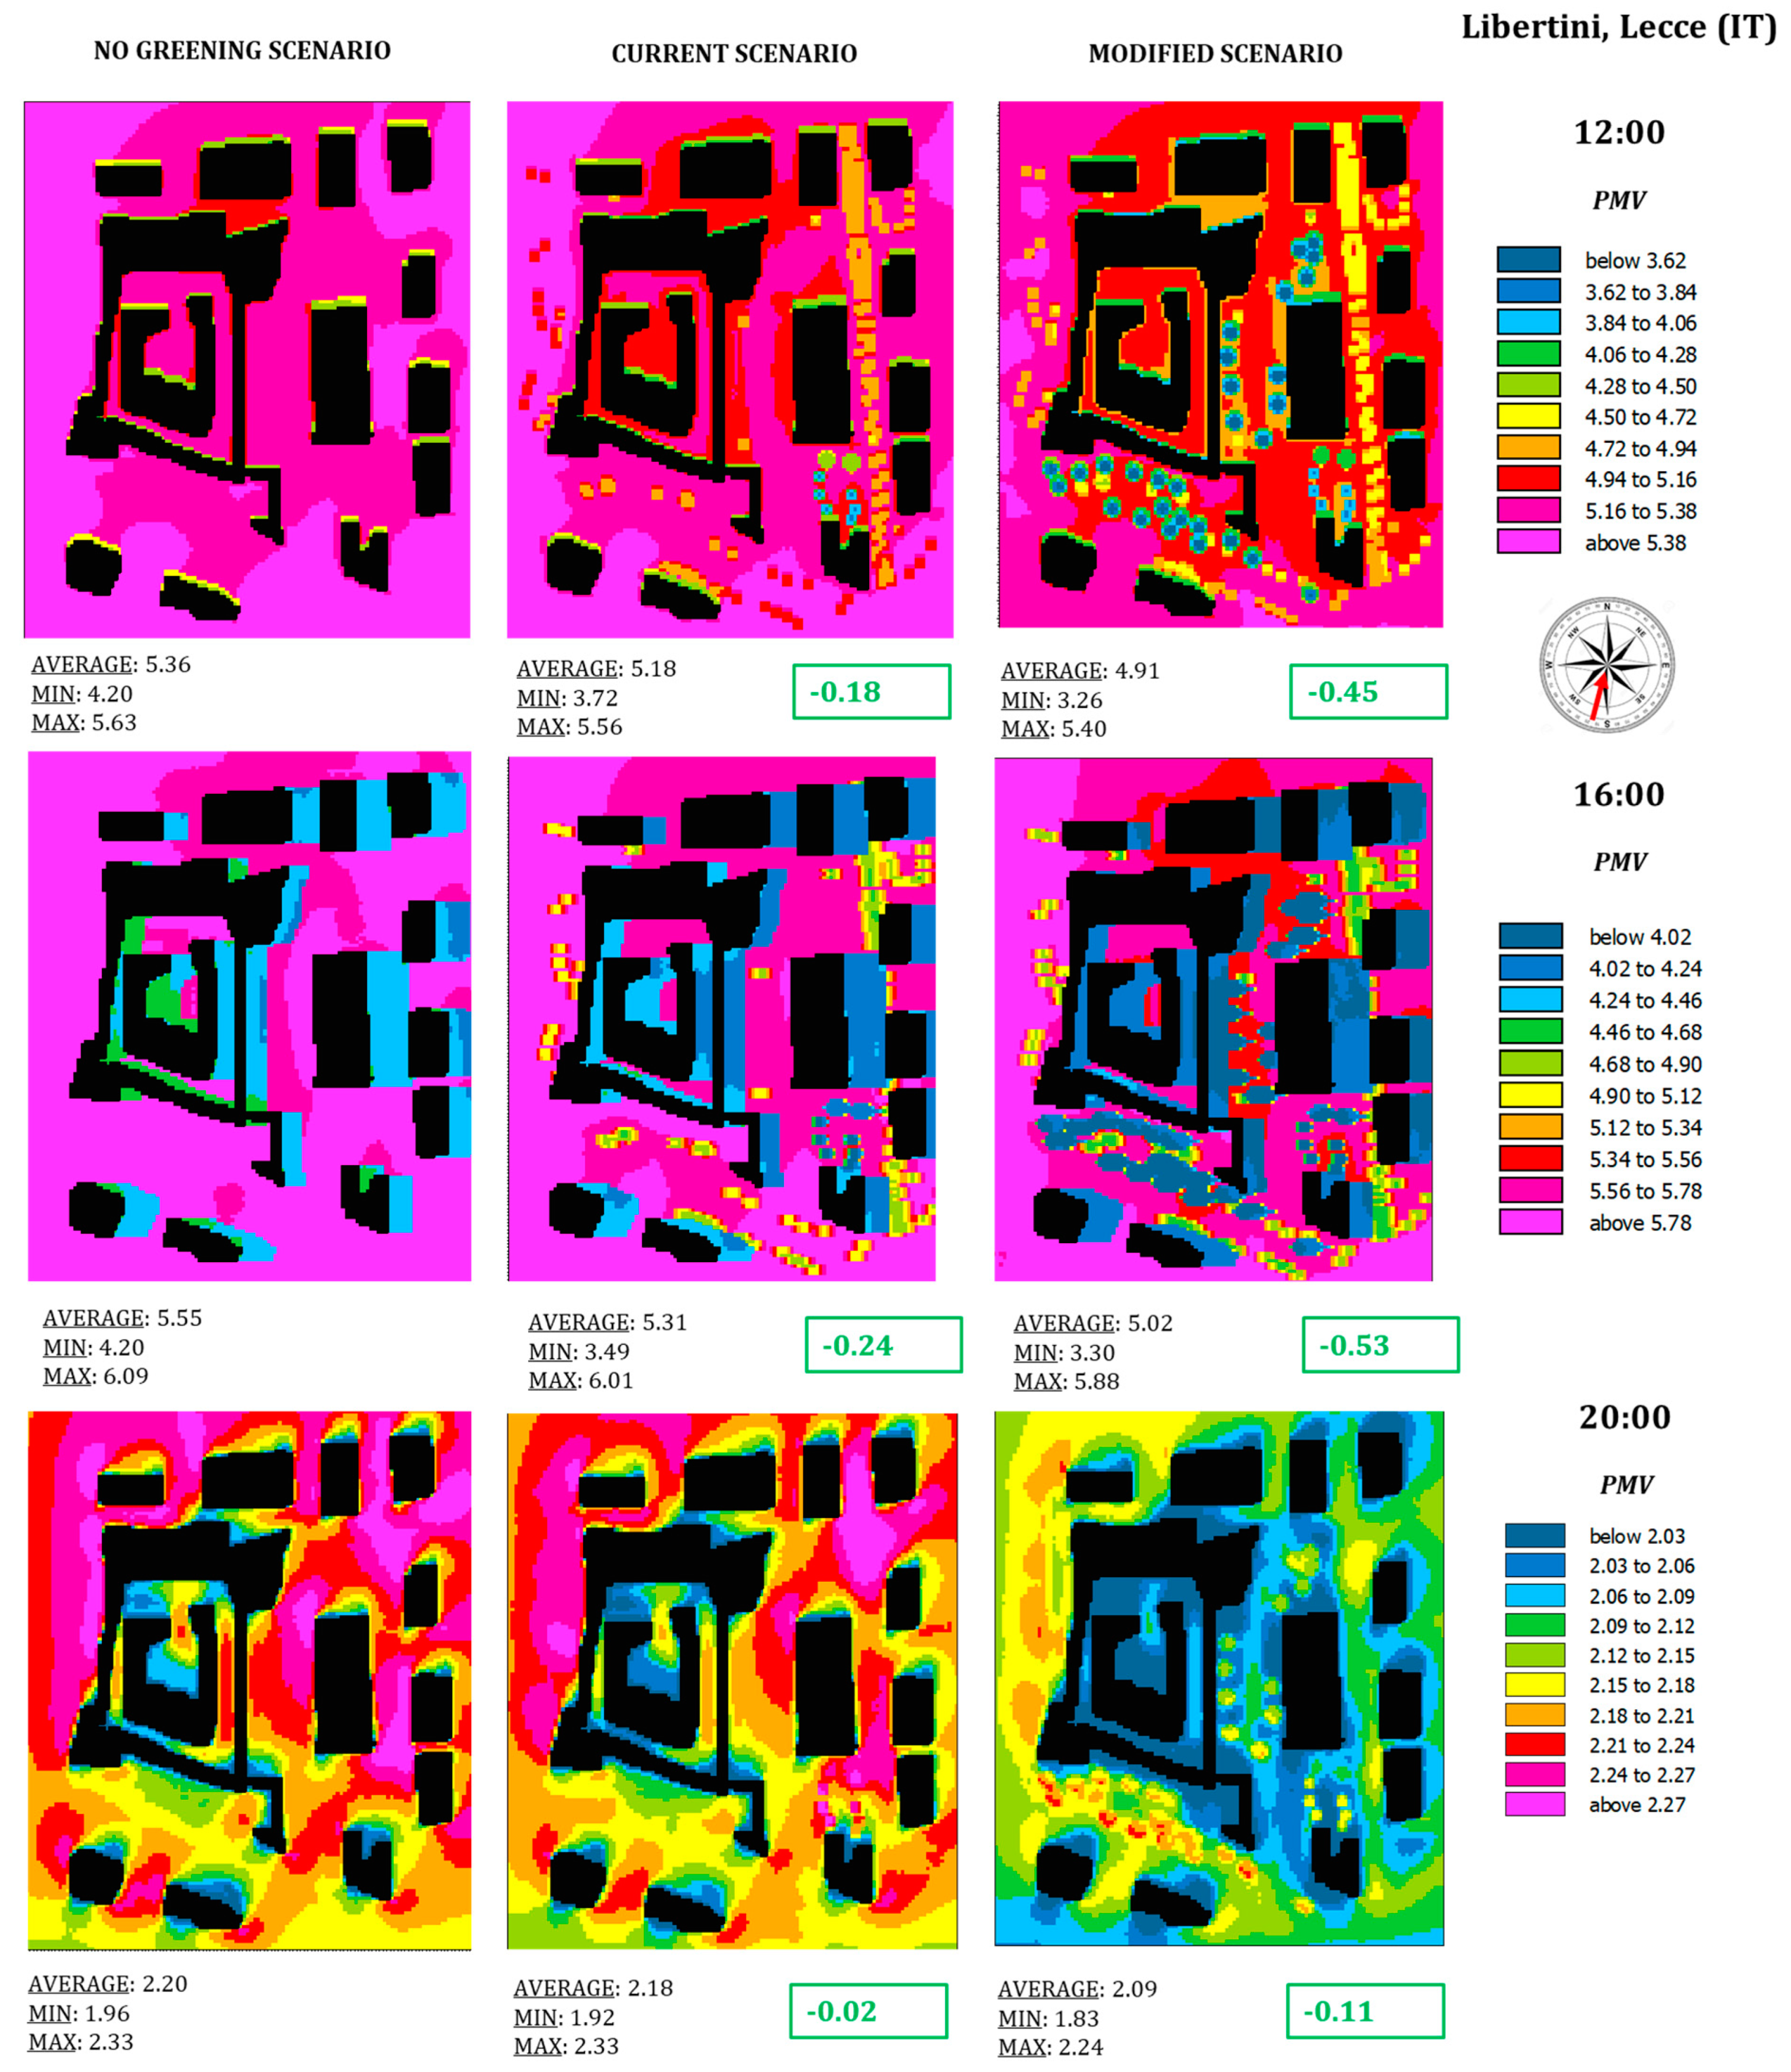
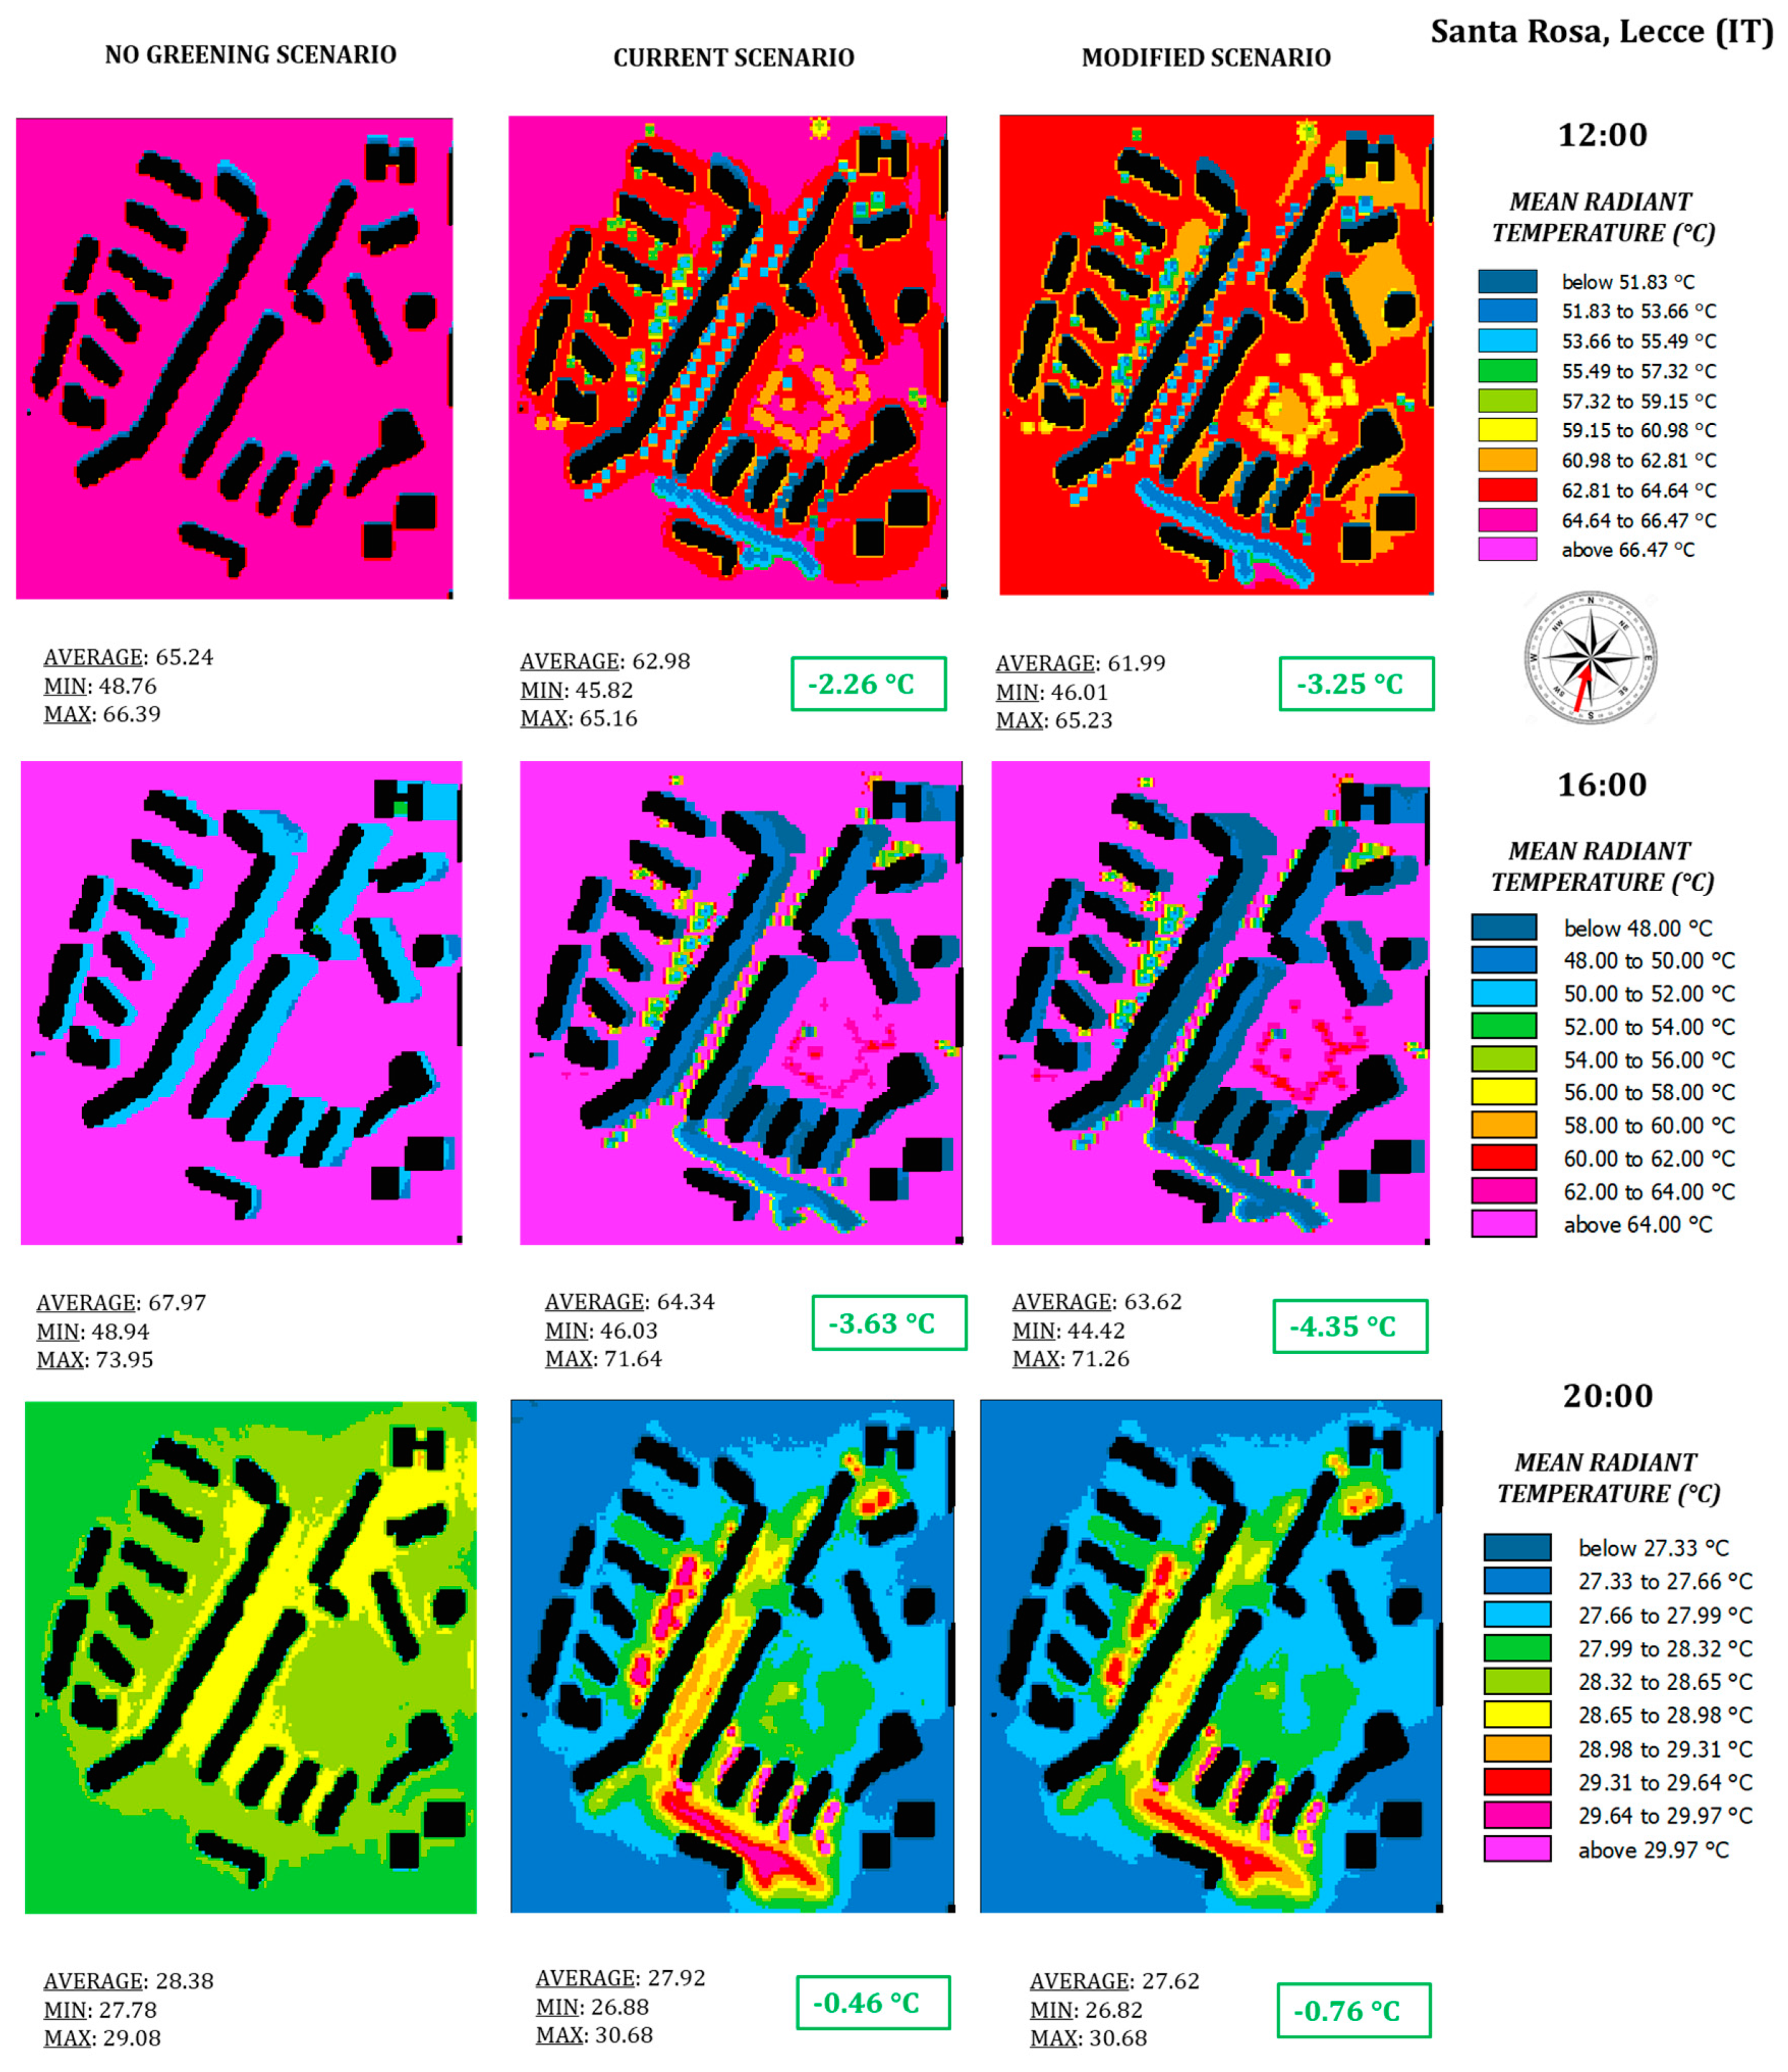
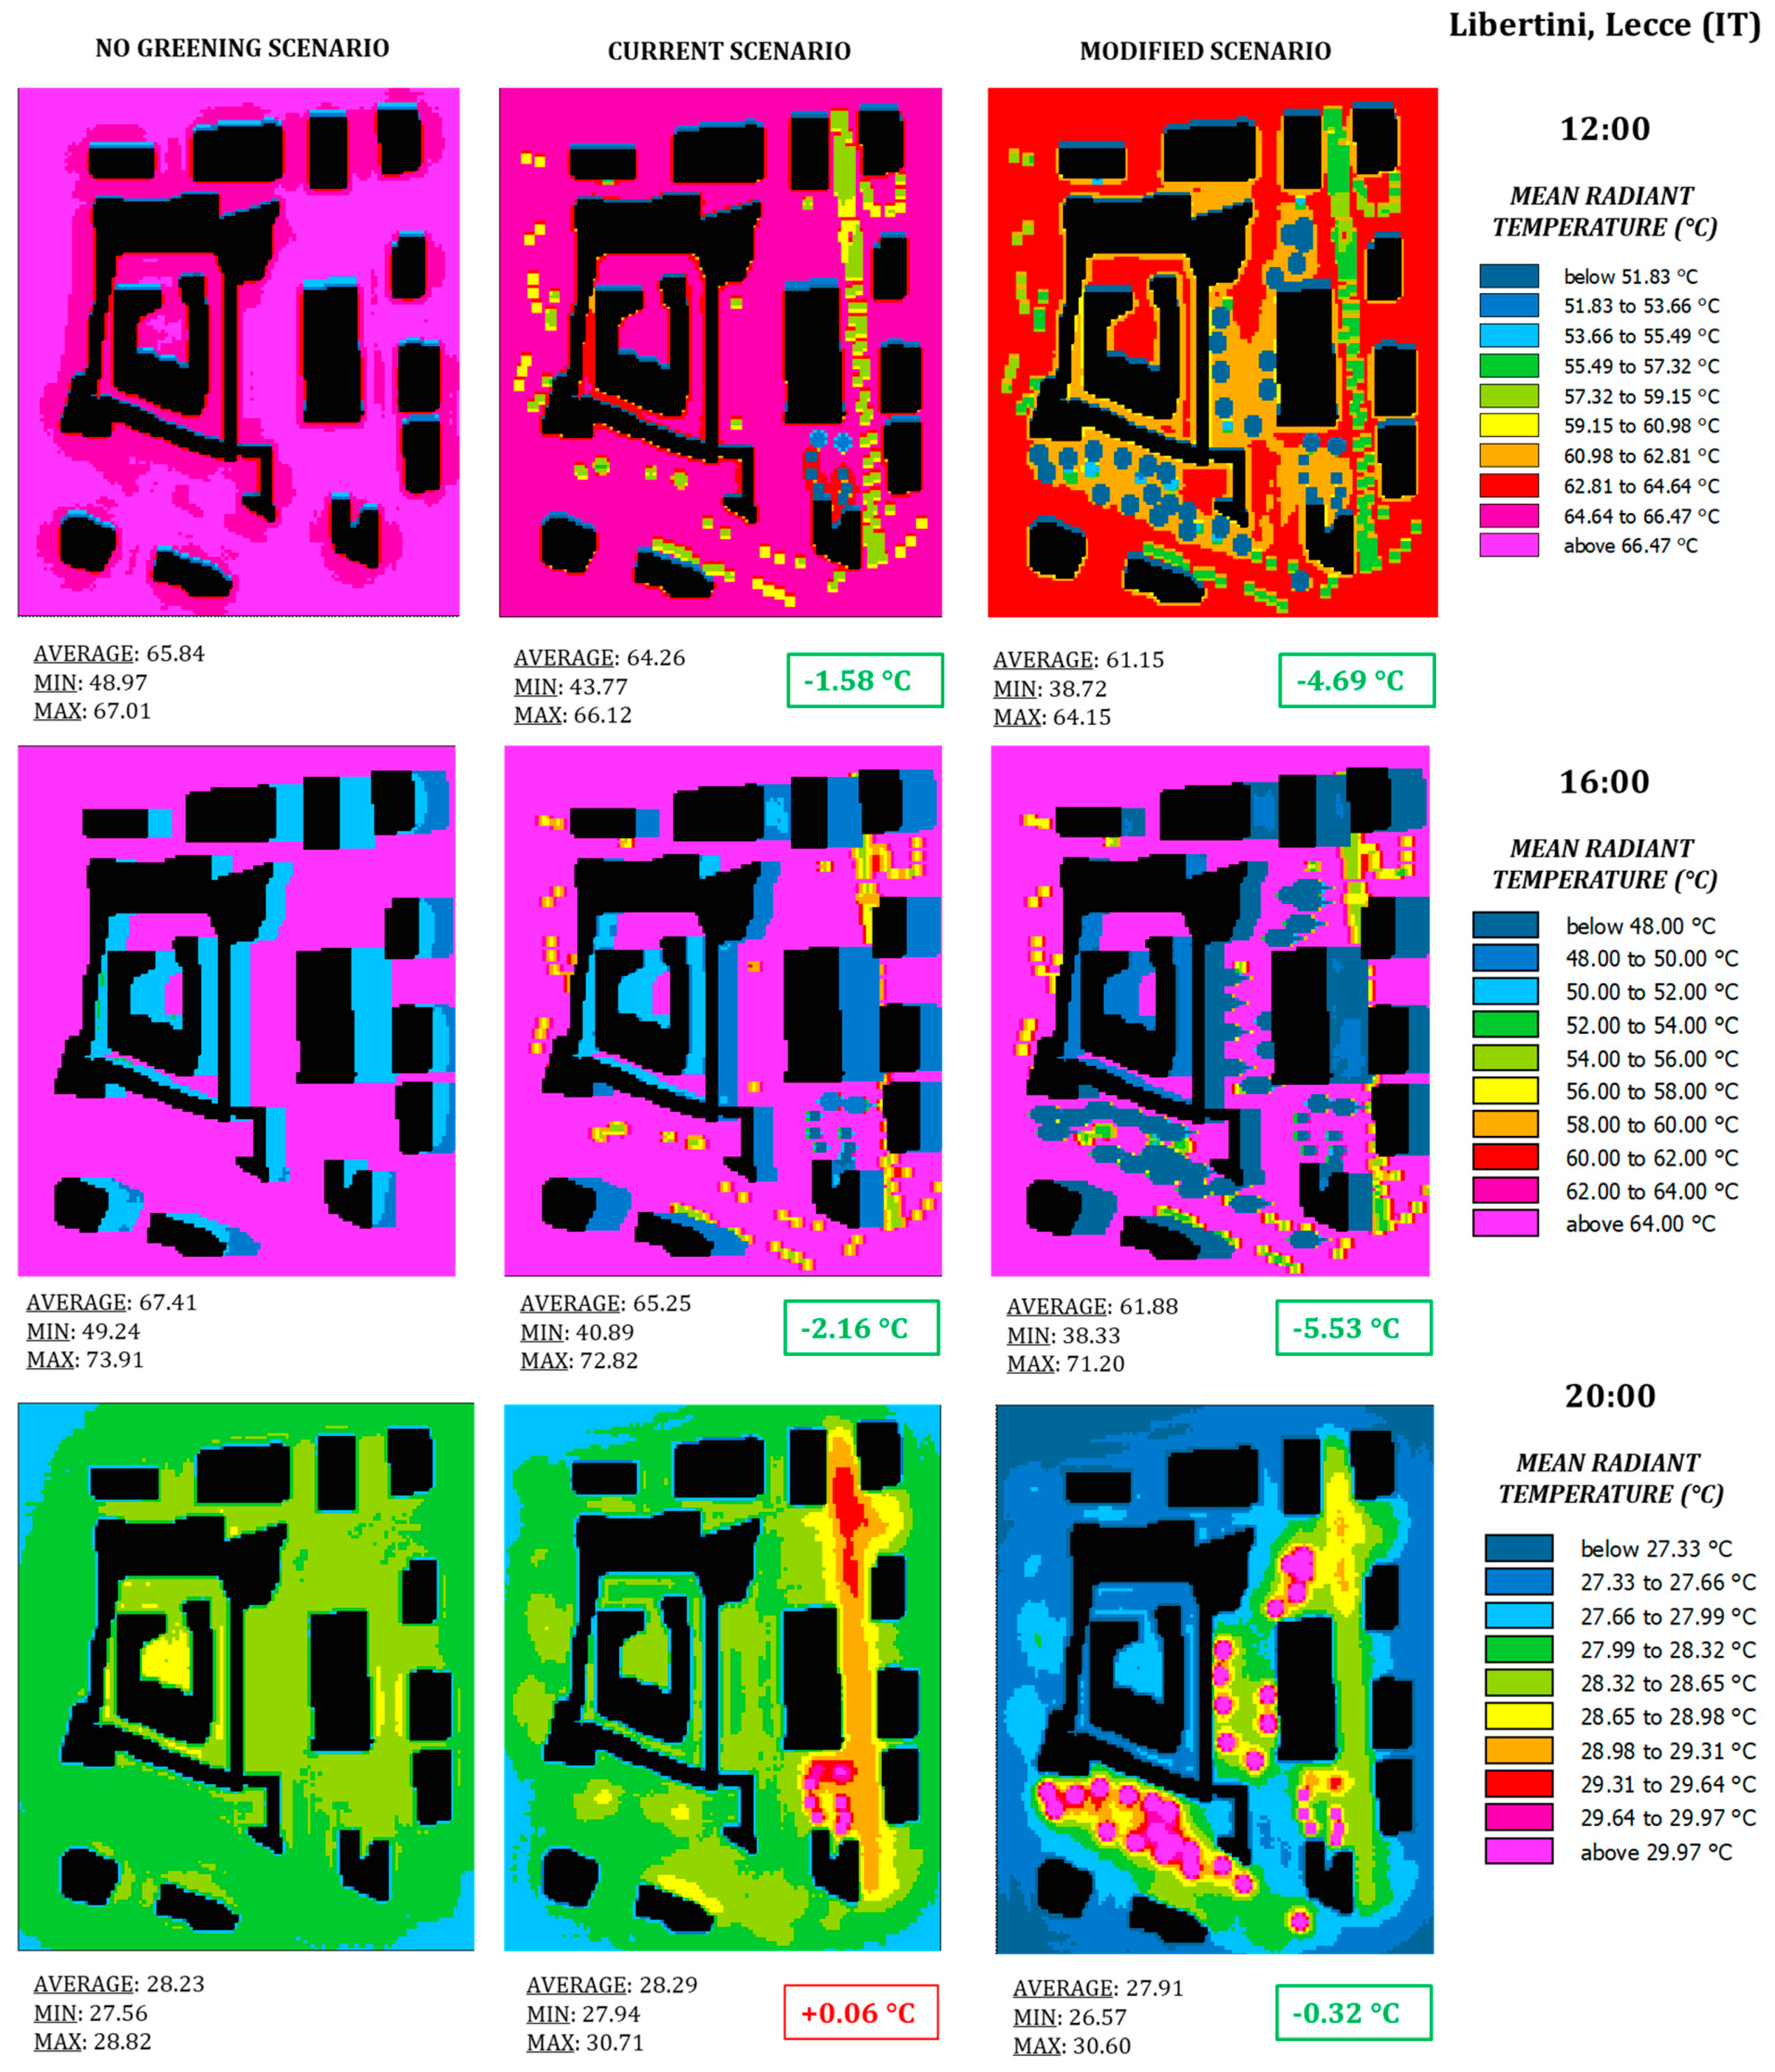
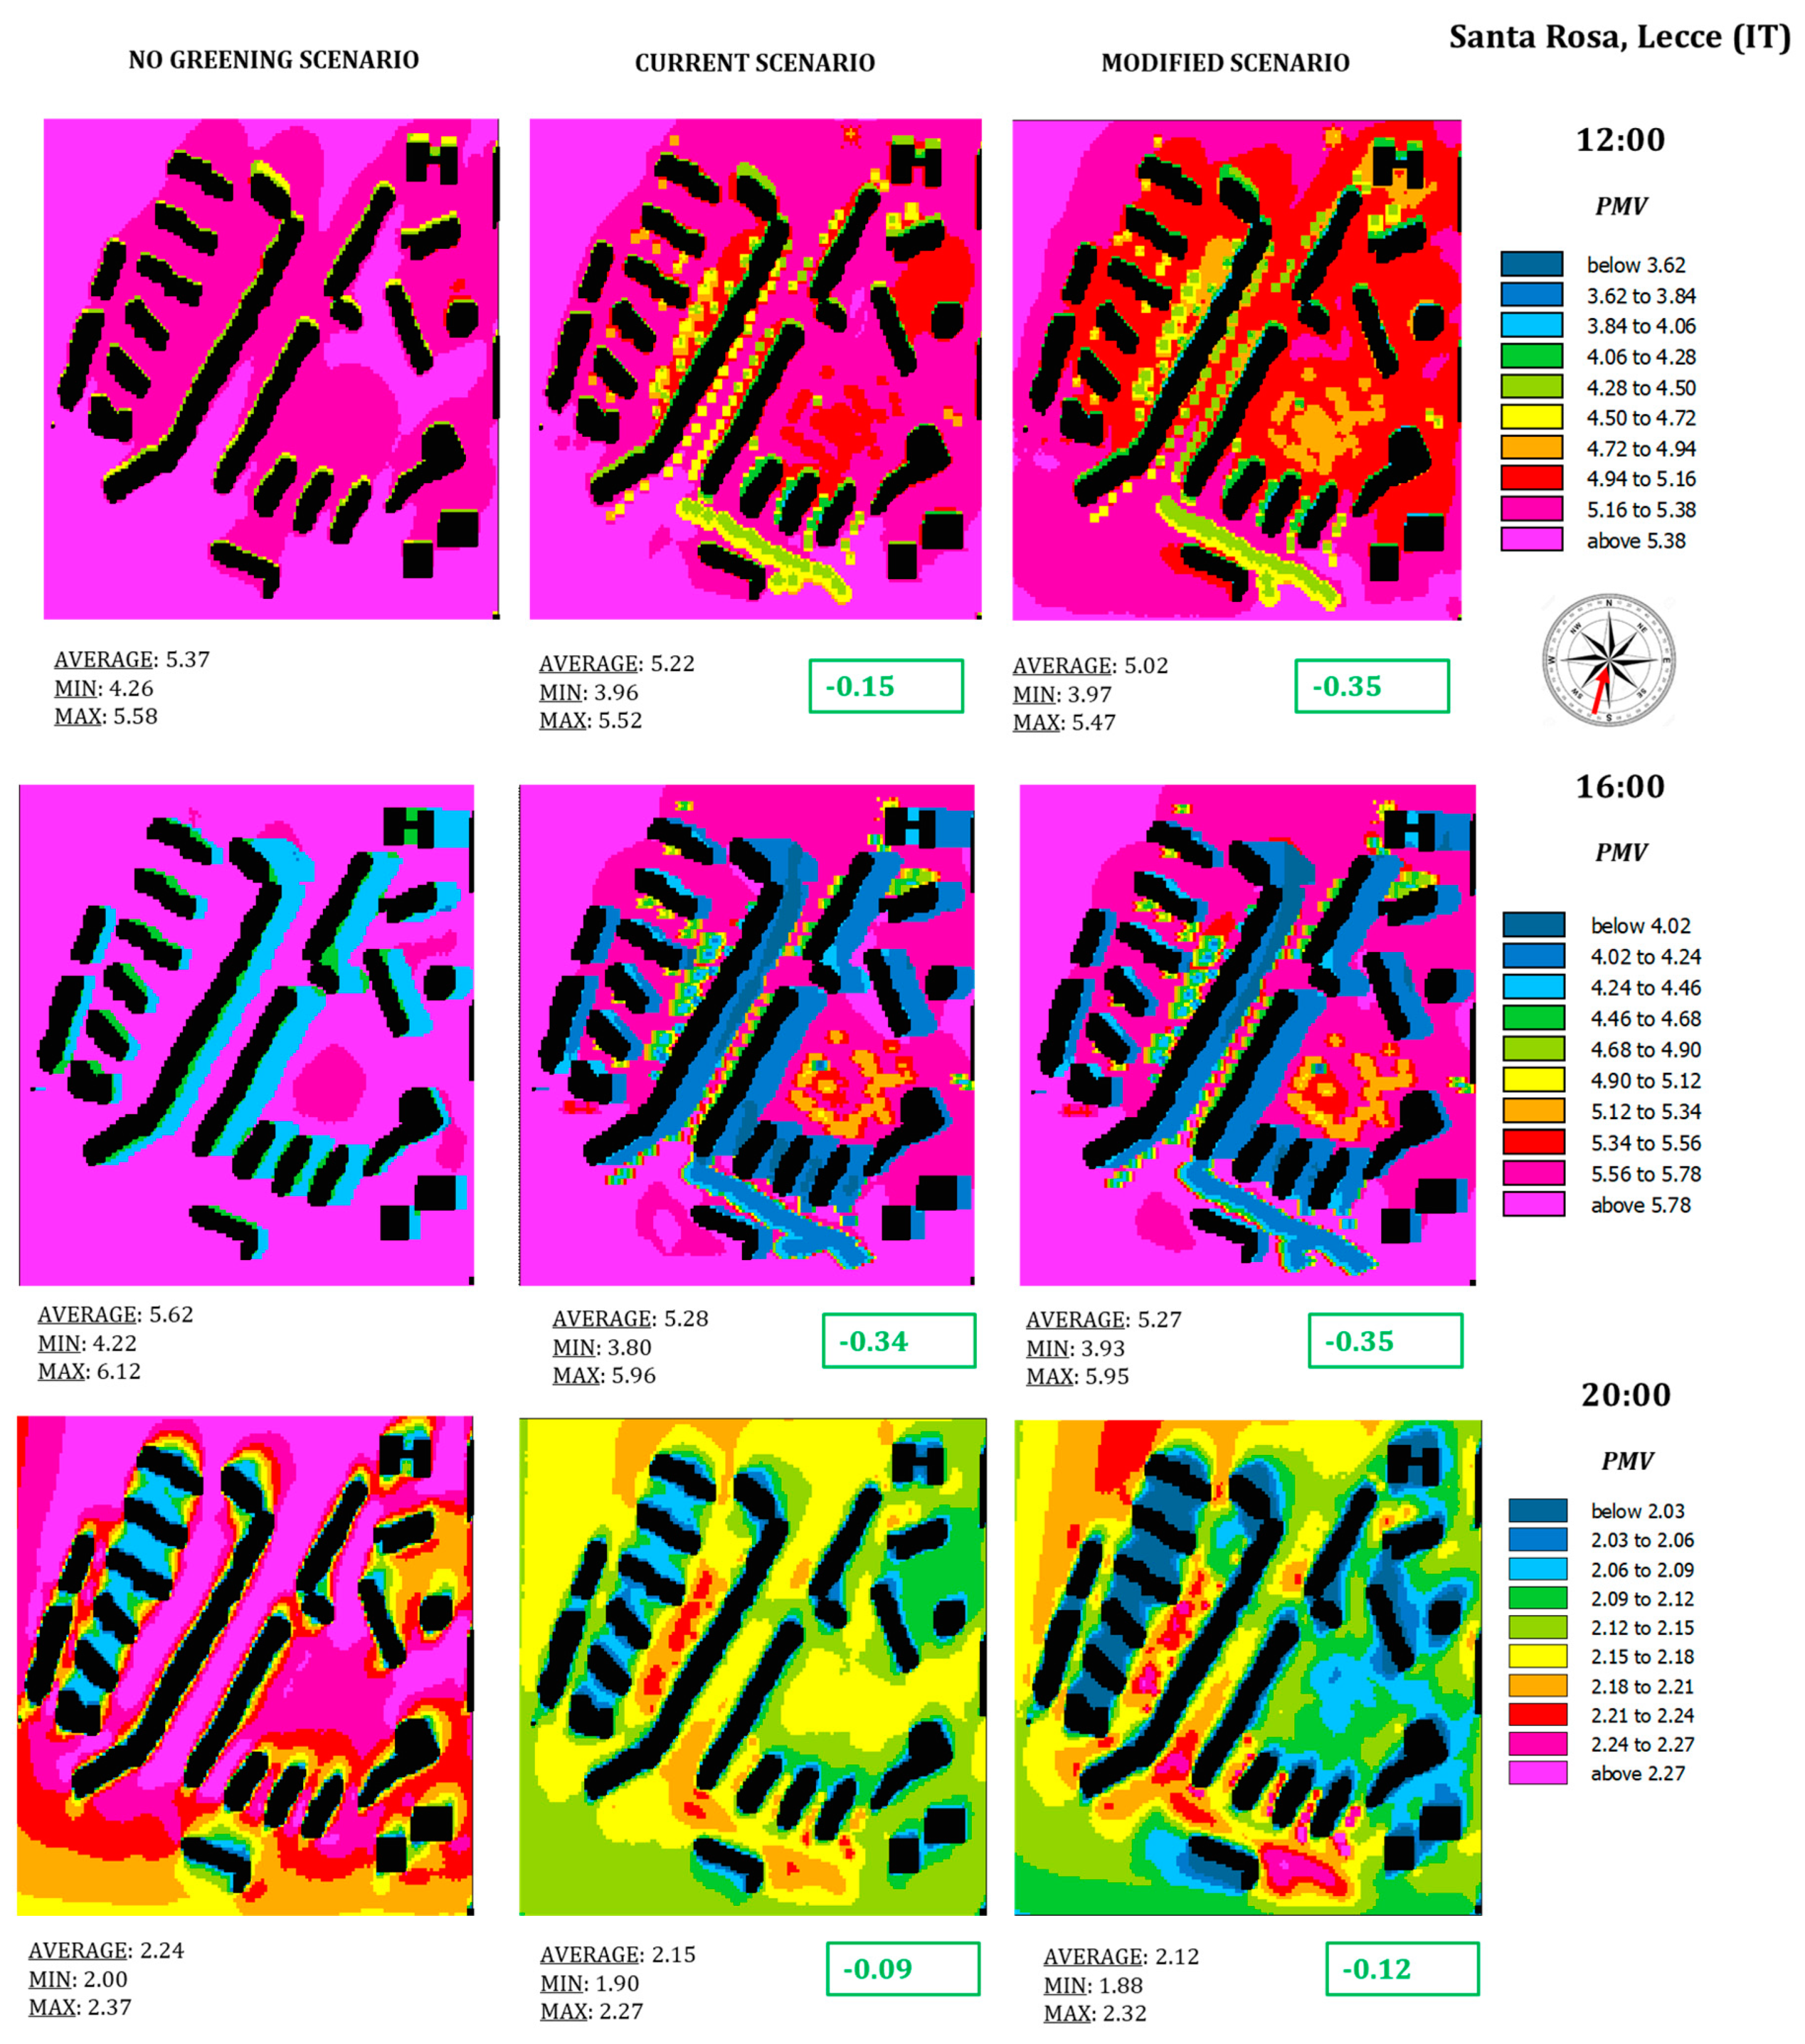
3.3. Spatial Distribution of Mean Radiant Temperature and Predictive Mean Vote

Here the analysis is extended to the investigation of the spatial distribution of MRT (Figure 7) and PMV (Figure 8) at 12:00 (noon), 16:00 (mid-afternoon), and 20:00 (evening) to better understand how tree morphology and location, combined with different urban geometries, influence the thermal comfort during the day in the whole area.
In general, the trees cooling effect between different scenarios is greater in daytime than that at evening-time as already observed from the temporal variation of Tair at different points. The difference in cooling effect between different scenarios decreases after sunset. The main results are summarized below:
  • on observing the spatial averages during the hot hours of the day (12:00, 16:00), the presence of trees induces a decrease of MRT in both Santa Rosa and Libertini. This decrease is most pronounced at 16:00, where it possible to observe a spatially averaged (average) decrease of 3.63 °C and 4.35 °C in the current and modified scenario in Santa Rosa, respectively, and 2.16 °C and 5.53 °C in Libertini. It is therefore also observable that there is a clear improvement in the modified scenario compared to the current one equal to 0.72 °C in Santa Rosa and 3.37 °C in Libertini;
  • on observing the spatial averages at 20:00, the decrease of MRT in the presence of trees is less marked, and nil in the current scenario in Libertini. Specifically, the spatial average is strongly influenced by what occurs in areas where the greening is most present. In fact, in the presence of trees, there is a localised increase in the street canyons in Santa Rosa, which is more evident in the street canyon “b” (≃1 °C) in both current and modified scenarios. In Libertini, it is possible to see that this increase in the street canyon “a” in the current scenario (≃0.60 °C) is less evident in the modified one, where there instead appears to be an increase in the investigated square and where new trees with high LAD were added (≃2 °C).
Looking at the spatial distributions of PMV (Figure 8) at 12:00, 16:00, and 20:00, it is notable that they are distributed in the range of 3.62–5.38, 4.02–5.78 and 2.03–2.27 points, respectively. According to PMV value scale (Section 2.6), during daylight hours a condition of extreme heat stress was experienced with values greater than 3 points while, with values from 2 to 3 points, during and after sunset, a moderate heat stress was experienced. In line with what was observed in the MRT analysis, thermal comfort, expressed in terms of PMV, improves in the presence of trees in both Santa Rosa and Libertini in all 3 h investigated. The main results are summarized as follows:
  • there does not appear to be much difference between 12:00 and 16:00, although in this case, even an improvement in the modified scenario compared to the current one is noteworthy. In both Santa Rosa and Libertini, the maximum decrease is at 16:00 and is 0.35 and 0.53 respectively. The PMV decrease is strongest in the street canyon “b” in Santa Rosa and it appears localized where the trees are in Libertini;
  • the improvement in thermal comfort at 20:00 is visible over the whole area but the rate of decrease of PMV is reduced compared to daylight hours. In Santa Rosa the decrease is almost unchanged between the current scenario and the modified one and is about 0.10, while in Libertini it is almost zero in the current scenario and equal to 0.10 in the modified one.

4. Discussion

To better understand and discuss the local effects of trees, the HRP index was calculated in the selected street canyons and squares (Figure 2) and results are summarized in Table 3.

4.1. Day-Time Hours of a Typical Summer Day

The presence of trees induced a positive effect leading to a Tair average daily decrease of about 0.40 °C and 1.00 °C in the current and modified scenario in Santa Rosa, respectively, and 0.57 °C and 0.74 °C in the current and modified scenario in Libertini. This improvement was also evident when looking at MRT and PMV, with a maximum decrease of MRT values equal to 4.35 °C and 5.53 °C and a maximum decrease of PMV values equal to 0.35 and 0.53 points at 16:00 in the modified scenario in Santa Rosa and Libertini, respectively. Such an improvement in the modified scenario is due to the increase of green areas replacing the paved area and to the increase of number of trees.
Beyond the species, the canopy density, expressed in terms of LAD, and the crown geometry, are very important parameters determining the cooling effect of trees, as already found in scientific literature [27,28,29]. The tree’s shade reduces the incoming short-wave radiation and the mean radiant temperature, which shows a direct relationship with thermal comfort [30,31]. By combining the effect of tree species, geometry and arrangement, and urban geometry, it can be concluded that:
  • HRP index in the street canyons “a” of Santa Rosa and Libertini are characterised by similar aspect ratios and by the presence of a double lateral row of Quercus ilex L. with similar crown geometry (5 m high and wide crown) and LAD equal to 0.71 m2/m3 in Santa Rosa and 0.40 m2/m3 in Libertini. The greening induces a greater thermal comfort in Santa Rosa, with a maximum percentage of improvement at 16:00 equal to 15% in the current scenario and to 20% in the modified one, compared to 6% and 11% in the current and modified scenario, respectively, of Libertini. Libertini is denser and located in the city centre where the air recirculation is expected to be worse than at the edge of the city (where Santa Rosa is located); the presence of trees in already dense areas was shown to worsen the street canyon ventilation in some circumstances [7,18], and thus, in this case, the positive effect of trees in improving thermal comfort is counterbalanced by the heat trapping effect;
  • HRP index of the street canyon “b” of Santa Rosa and San Pio (see Gatto et al. [1]) characterised by similar aspect ratios and by the presence of Tilia sp. with a 7 m wide crown and a LAD of 1 m2/m3 in Santa Rosa and a 3 m wide crown and a LAD of 0.3 m2/m3 in San Pio. For the current scenario in Santa Rosa and the modified scenario in San Pio, both with a central row of Tilia sp., an HRP value of 23% and 4% were recorded, respectively;
  • HRP index in the modified scenario compared to the current one in the investigated square of Libertini: by adding 17 new trees with a conic crown with a LAD of 2.3 m2/m3 (+977 m2 of green space), an improvement of 11% is noteworthy;
  • shading effect in street canyons and squares: The effect is enhanced in denser geometries. For the same reason, in general, the effect of greening is found to be larger in street canyons rather than in the squares; further, in Santa Rosa Square, the thermal comfort improvement (in terms of both MRT and PMV) is smaller than in street canyons due to the presence of Pinus halepensis Mill., which has a smaller shade projection effect than that provided by Quercus sp. [32,33];
  • ventilation: the wind direction is 210°, which is a parallel to the street canyon “a” in Santa Rosa and oblique to the street canyon “a” in Libertini. This promotes better heat dispersion in Santa Rosa and thus explains the better HRP compared with Libertini neighbourhood;
  • evapotranspiration effect: Tair decrease and thermal comfort improvement in the presence of trees is also due to the evapotranspiration effect, which helped cool the air, as already observed in other studies [5]. This decrease is consistent with results obtained in other Italian cities (Teramo, Rome, Palermo, Avola, Perugia), where, in the presence of greening, a decrease in the range between 0.5 °C and 3.0 °C was observed [34,35,36,37,38];
  • replacing the asphalt surface with grass contributes to reduced MRT of about 0.50 °C.

4.2. Evening-Time Hours of a Typical Summer Day

During the evening, the decrease of the cooling effect by trees, visible from the HRP index and the spatial distribution of MRT and PMV, could be due to the fact that trees, after the stomata closure due to the lack of radiation, have almost no cooling effect from transpiration [28].
The local increase of MRT and PMV where trees are more concentrated and have a greater LAD (e.g., the street canyon “b” in Santa Rosa and the square in Libertini) could be due to the trapping of heat stored by the surfaces during the day and released during the evening. This increase could be positive especially during cold winters and, therefore, it should be additionally investigated in other urban geometries and different meteorological conditions. Similar results were found by Di Sabatino et al. [18] in other streets of Lecce. The notable increase in street canyon “b” can be explained by the additional street canyon effect which, due to the already reduced ventilation with the surrounding atmosphere, enhanced the trapping of heat below the crown; ventilation here is also reduced due to the wind blowing perpendicular.

5. Conclusions

This paper contributes to a better understanding of the ecosystem services related to microclimate and thermal comfort provided by urban greening (and specifically trees). This is an important target for developing climate change mitigation strategies in increasingly fragile and vulnerable contexts such as cities.
Specifically, this work deals with the study of the effects of trees on air temperature and thermal comfort in two neighbourhoods of Lecce (Italy), the first located in a suburban area and the second in the city centre.
Based on the findings of the study, it is suggested that policy makers and urban planners give preference to selecting trees with a large and dense crown in open areas (such as squares), because the cooling effect is determined more by the tree cover (in terms of LAD and number of specimens), dimension, and shape of tree crown rather than the tree species. Further, the lowering of LAD decreases the shading effect by tree crowns in the daytime, but enhances the nocturnal cooling of the space beneath the crowns. In the case of street canyons, it is always preferable to conduct micrometeorological analyses since ventilation is critical to heat dispersion (parallel wind leads to a better thermal comfort).
The introduction of greening in an urban regeneration plan may be strategic in achieving the Sustainable Development Goals (SDGs), foreseen in Agenda 2030, as suggested by the present study, but it must be based on ad-hoc evaluation because the effects of urban greening depend on multiple factors.

Author Contributions

Conceptualization—E.G. and R.B.; Formal analysis—E.G.; Investigation—E.G., F.I., G.R., and R.B.; Methodology—J.L.S., R.E. and R.B.; Supervision—R.B.; Visualization—E.G.; Writing, original draft—E.G.; Writing, review & editing—O.S.C., J.L.S., E.A., R.E. and R.B. All authors have read and agreed to the published version of the manuscript.

Funding

The first author (E.G.) acknowledges the PhD financial support of the Italian Ministry of University and Research (MIUR) by the PON project “Dottorati Innovativi con caratterizzazione Industriale-project code DOT1412034–Borsa n. 2”, PhD course in “Scienze e Tecnologie Biologiche ed Ambientali”–XXXIII cycle-University of Salento.

Institutional Review Board Statement

Not applicable.

Informed Consent Statement

Not applicable.

Data Availability Statement

Data sharing is not applicable.

Conflicts of Interest

The authors declare no conflict of interest.

References

  1. Gatto, E.; Buccolieri, R.; Aarrevaara, E.; Ippolito, F.; Emmanuel, R.; Perronace, L.; Santiago, J.L. Impact of Urban Vegetation on Outdoor Thermal Comfort: Comparison between a Mediterranean City (Lecce, Italy) and a Northern European City (Lahti, Finland). Forests 2020, 11, 228. [Google Scholar] [CrossRef] [Green Version]
  2. Salbitano, F.; Borelli, S.; Conigliaro, M.; Chen, Y. FAO “Guidelines on Urban and Peri-Urban Forestry”; FAO Forestry Paper No. 178; Food and Agriculture Organization of the United Nations: Rome, Italy, 2017. [Google Scholar]
  3. Santamouris, M.; Ban-Weiss, G.; Osmond, P.; Paolini, R.; Synnefa, A.; Cartalis, C.; Muscio, A.; Zinzi, M.; Morakinyo, T.E.; Ng, E.; et al. Progress in urban greenery mitigation science–assessment methodologies advanced technologies and impact on cities. J. Civ. Eng. Manag. 2018, 24, 638–671. [Google Scholar] [CrossRef] [Green Version]
  4. Semeraro, T.; Scarano, A.; Buccolieri, R.; Santino, A.; Aarrevaara, E. Planning of Urban Green Spaces: An Ecological Perspective on Human Benefits. Land 2021, 10, 105. [Google Scholar] [CrossRef]
  5. Salmond, J.A.; Tadaki, M.; Vardoulakis, S.; Arbuthnott, K.; Coutts, A.; Demuzere, M.; Dirks, K.N.; Heaviside, C.; Lim, S.; Macintyre, H. Health and climate related ecosystem services provided by street trees in the urban environment. Environ. Health 2016, 15, S36. [Google Scholar] [CrossRef] [Green Version]
  6. Aram, F.; Higueras Garcìa, E.; Solgi, E.; Mansournia, S. Urban green space cooling effect in cities. Heliyon 2018, 5, e01339. [Google Scholar] [CrossRef] [PubMed] [Green Version]
  7. Buccolieri, R.; Santiago, J.L.; Rivas, E.; Sanchez, B. Review on urban tree modelling in CFD simulations: Aerodynamic, deposition and thermal effects. Urban For. Urban Green. 2018, 31, 212–220. [Google Scholar] [CrossRef]
  8. Janhäll, S. Review on urban vegetation and particle air pollution—Deposition and dispersion. Atmos. Environ. 2015, 105, 130–137. [Google Scholar] [CrossRef]
  9. Abhijith, K.V.; Kumar, P.; Gallagher, J.; McNabola, A.; Baldauf, R.; Pilla, F.; Broderick, B.; Di Sabatino, S.; Pulvirenti, B. Air pollution abatement performances of green infrastructure in open road and built-up street canyon environments—A review. Atmos. Environ. 2017, 162, 71–86. [Google Scholar] [CrossRef]
  10. Santiago, J.-L.; Rivas, E.; Sanchez, B.; Buccolieri, R.; Martin, F. The Impact of Planting Trees on NOx Concentrations: The Case of the Plaza de la Cruz Neighborhood in Pamplona (Spain). Atmosphere 2017, 8, 131. [Google Scholar] [CrossRef] [Green Version]
  11. Buccolieri, R.; Jeanjean, A.P.R.; Gatto, E.; Leigh, R.J. The impact of trees on street ventilation, NOx and PM2.5 concentrations across heights in Marylebone Rd street canyon, central London. Sustain. Cities Soc. 2018, 41, 227–241. [Google Scholar] [CrossRef]
  12. Tomson, M.; Kumar, P.; Barwise, Y.; Perez, P.; Forehead, H.; French, K.; Morawska, L.; Watts, J.W. Green infrastructure for air quality improvement in street canyons. Environ. Int. 2021, 146, 106288. [Google Scholar] [CrossRef] [PubMed]
  13. Yang, Y.; Gatto, E.; Gao, A.; Buccolieri, R.; Morakinyo, T.E.; Lan, H. The “plant evaluation model” for the assessment of the impact of vegetation on outdoor microclimate in the urban environment. Build. Environ. 2019, 159, 106151. [Google Scholar] [CrossRef]
  14. Tsoka, S.; Tsikaloudaki, A.; Theodosiou, T. Analyzing the ENVI-met microclimate model’s performance and assessing cool materials and urban vegetation applications—A review. Sustain. Cities Soc. 2018, 43, 55–76. [Google Scholar] [CrossRef]
  15. Giorgi, F.; Lionello, P. Climate change projections for the Mediterranean region. Glob. Planet Chang. 2008, 63, 90–104. [Google Scholar] [CrossRef]
  16. Lionello, P.; Abrantes, F.; Congedi, L.; Dulac, F.; Gacic, M.; Gomis, D.; Goodess, C.; Hoff, H.; Kutiel, H.; Luterbacher, J.; et al. Introduction: Mediterranean climate: Background information. In The Climate of the Mediterranean Region: From the Past to the Future; Lionello, P., Ed.; Elsevier: Amsterdam, The Netherlands, 2012; pp. xxxv–xc. [Google Scholar]
  17. Maggiotto, G.; Buccolieri, R.; Santo, M.A.; Leo, L.S.; Di Sabatino, S. Validation of temperature-perturbation and CFD-based modelling for the prediction of the thermal urban environment: The Lecce (IT) case study. Environ. Model. Softw. 2014, 60, 69–83. [Google Scholar] [CrossRef]
  18. Di Sabatino, S.; Buccolieri, R.; Pappaccogli, G.; Leo, L.S. The effects of trees on micrometeorology in a real street canyon: Consequences for local air quality. Int. J. Environ. Pollut. 2015, 58, 100–111. [Google Scholar] [CrossRef]
  19. Martinelli, L.; Matzarakis, A. Influence of height/width proportions on the thermal comfort of courtyard typology for Italian climate zones. Sustain. Cities Soc. 2017, 29, 97–106. [Google Scholar] [CrossRef]
  20. Matzarakis, A.F.; Rutz, H. Mayer Modelling radiation fluxes in simple and complex environments: Application of the RayMan model. Int. J. Biometeorol. 2007, 51, 323–334. [Google Scholar] [CrossRef]
  21. Buccolieri, R.; Gatto, E.; Manisco, M.; Ippolito, F.; Santiago, J.L.; Gao, Z. Characterization of Urban Greening in a District of Lecce (Southern Italy) for the Analysis of CO2 Storage and Air Pollutant Dispersion. Atmosphere 2020, 11, 967. [Google Scholar] [CrossRef]
  22. Tominaga, Y.; Mochida, A.; Yoshie, R.; Kataoka, H.; Nozu, T.; Yoshikawa, M.; Shirasawa, T. AIJ guidelines for practical applications of CFD to pedestrian wind environment around buildings. J. Wind. Eng. Ind. Aerodyn. 2008, 96, 1749–1761. [Google Scholar] [CrossRef]
  23. Lee, H.; Mayer, H. Validation of the mean radiant temperature simulated by the RayMan software in urban environments. Int. J. Biometeorol. 2016, 60, 1775–1785. [Google Scholar] [CrossRef]
  24. Liu, Z.; Cheng, W.; Jim, C.Y.; Morakinyo, T.E.; Shi, Y.; Ng, E. Heat mitigation benefits of urban green and blue infrastructures: A systematic review of modeling techniques, validation and scenario simulation in ENVI-met V4. Build. Environ. 2021, 200, 107939. [Google Scholar] [CrossRef]
  25. Morakinyo, T.E.; Ouyang, W.; Ka-Lun Lau, K.; Ren, C.; Ng, E. Right tree, right place (urban canyon): Tree species selection approach for optimum urban heat mitigation—Development and evaluation. Sci. Total Environ. 2020, 719, 137461. [Google Scholar] [CrossRef]
  26. Di Sabatino, S.; Buccolieri, R.; Olesen, H.R.; Ketzel, M.; Berkowicz, R.; Franke, J.; Schatzmann, M.; Schlunzen, K.; Leitl, B.; Britter, R.; et al. COST 732 in practice: The MUST model evaluation exercise. Int. J. Environ. Pollut. 2011, 44, 403–418. [Google Scholar] [CrossRef] [Green Version]
  27. Feyisa, G.L.; Dons, K.; Meilby, H. Efficiency of parks in mitigating urban heat island effect: An example from Addis Ababa. Landsc. Urban Plan. 2014, 123, 87–95. [Google Scholar] [CrossRef]
  28. Sodoudi, S.; Zhang, H.; Chi, X.; Müller, F.; Li, H. The influence of spatial configuration of green areas on microclimate and thermal comfort. Urban For. Urban Green. 2018, 34, 85–96. [Google Scholar] [CrossRef]
  29. Wang, J.; Guo, W.; Wang, C.; Yao, Y.; Kou, K.; Xian, D.; Zhang, Y. Tree crown geometry and its performances on human thermal comfort adjustment. J. Urban Manag. 2021, 10, 16–26. [Google Scholar] [CrossRef]
  30. Thorsson, S.; Lindberg, F.; Eliasson, I.; Holmer, B. Different methods for estimating the mean radiant temperature in an outdoor urban setting. Int. J. Clim. 2007, 27, 1983–1993. [Google Scholar] [CrossRef]
  31. Morakinyo, T.E.; Kong, L.; Lau, K.-L.; Yuan, C.; Ng, E. A study on the impact of shadow-cast and tree species on in-canyon and neighborhood’s thermal comfort. Build. Environ. 2017, 115, 1–17. [Google Scholar] [CrossRef]
  32. Karimi, A.; Sanaieian, H.; Farhadi, H.; Norouzian-Maleki, S. Evaluation of the thermal indices and thermal comfort improvement by different vegetation species and materials in a medium-sized urban park. Energy Rep. 2020, 6, 1670–1684. [Google Scholar] [CrossRef]
  33. Colter, K.R.; Middel, A.C.; Martin, C.A. Effects of natural and artificial shade on human thermal comfort in residential neighborhood parks of Phoenix, Arizona, USA. Urban For. Urban Green. 2019, 44, 126429. [Google Scholar] [CrossRef]
  34. Ambrosini, D.; Galli, G.; Mancini, B.; Nardi, I.; Sfarra, S. Evaluating Mitigation Effects of Urban Heat Islands in a Historical Small Center with the ENVI-Met® Climate Model. Sustainability 2014, 6, 7013–7029. [Google Scholar] [CrossRef] [Green Version]
  35. Battista, G.; Pastore, E.M.; Mauri, L.; Basilicata, C. Green roof effects in a case study of Rome (Italy). Energy Procedia 2016, 101, 1058–1063. [Google Scholar] [CrossRef]
  36. Pastore, L.; Corrao, R.; Heiselberg, P.K. The effects of vegetation on indoor thermal comfort: The application of a multi-scale simulation methodology on a residential neighborhood renovation case study. Energy Build. 2017, 146, 1–11. [Google Scholar] [CrossRef]
  37. Evola, G.; Gagliano, A.; Fichera, A.; Marletta, L.; Martinico, F.; Nocera, F. UHI effects and strategies to improve outdoor thermal comfort in dense and old neighbourhoods. Energy Procedia 2017, 134, 692–701. [Google Scholar] [CrossRef]
  38. Piselli, C.; Castaldo, V.; Pigliautile, I.; Pisello, A.; Cotana, F. Outdoor comfort conditions in urban areas: On citizens’ perspective about microclimate mitigation of urban transit areas. Sustain. Cities Soc. 2018, 39, 16–36. [Google Scholar] [CrossRef]
Figure 1. Position of the city of Lecce in southern Italy (down-left) and focus on the city: red areas indicate neighbourhoods already investigated (Section 2.1), green areas indicate the neighbourhoods investigated here (Santa Rosa and Libertini), and the yellow area indicates the 167 neighbourhood left to future investigation.
Climate 09 00116 g001
Figure 2. The study neighbourhoods: Santa Rosa (left) and Libertini (right). Red dotted lines: main street canyons “a” and “b” investigated; yellow dotted lines: squares investigated (mod. from Google Earth).
Climate 09 00116 g002
Figure 4. Position of Vaisala HMP45C thermo-hygrometers in Santa Rosa and Libertini.
Climate 09 00116 g004
Figure 5. Tair data extraction points P1, P2, P3 and P4 (see Section 3.2) in Santa Rosa (left) and Libertini (right). Points 1 correspond to the meteorological measurement locations (see Figure 4).
Climate 09 00116 g005
Figure 6. Temporal profiles of Tair obtained from ENVI-met at selected points in Santa Rosa and Libertini.
Climate 09 00116 g006
Figure 7. Spatial Mean Radiant Temperature (MRT) maps at 12:00, 16:00, and 20:00 for all the scenarios investigated in Santa Rosa (top) and Libertini (bottom). The spatially averaged (average) difference compared to the scenario without trees is shown in the box, which is green when the effect is positive and red when it is negative.
Climate 09 00116 g007aClimate 09 00116 g007b
Figure 8. Spatial Predicted Mean Vote (PMV) maps at 12:00, 16:00, and 20:00 for all the scenarios investigated in Santa Rosa (top) and Libertini (bottom). The spatially averaged (average) difference compared to the scenario without trees is shown in the box, which is green when the effect is positive and red when it is negative.
Climate 09 00116 g008aClimate 09 00116 g008b
Table 1. Initial and boundary conditions used in ENVI-met simulations.
ParameterDefinitionValue
Simulation TimeStart Date12 June 2018
Start of simulation (h)05:00
Total simulation time16 h (4 h spin-up + 12 h)
Meteorological conditionsWind speed0.9 m/s
Wind direction210°
Temperature of atmosphere (forced)Daily profile
Relative humidity (%) (forced)Daily profile
initial temperature (K) and relative humidity
(%) of deep layer below 0.5 m
293–60 (default values)
Computational domain and gridGrid cells (x,y,z)150 × 150 × 30Santa Rosa
125 × 150 × 30Libertini
δx × δy × δz2 m × 2 m × 2 m (equidistant: 5 cells close to the ground)
Nesting grids5
Boundary conditionsCyclic
Table 2. Statistical analysis of Tair obtained from ENVI-met (Sim.) and measured (Meas.) in Santa Rosa and Libertini.
Statistical ParameterSanta RosaLibertini
Sim.Meas.Sim.Meas.
Mean29.7427.3829.8528.81
St.dev.3.793.463.583.26
Higher35.5333.0534.9933.62
NMSE0.010.00
FB−0.08−0.04
R0.920.91
Table 3. HRP values (%) at 12:00, 16:00, and 20:00 in the areas investigated in Santa Rosa and Libertini. CS: current scenario; MS: modified scenario.
Santa RosaLibertini
Street Canyon “a”Street Canyon “b”SquareStreet Canyon “a”Square
CSMSCSMSCSMSCSMSCSMS
12:0011%16%17%20%11%12%6%10%2%9%
16:0015%20%23%24%15%16%6%11%3%14%
20:003%1%3%1%3%4%0.4%6%0.4%2%
Publisher’s Note: MDPI stays neutral with regard to jurisdictional claims in published maps and institutional affiliations.

