Article

Flood Risk Assessment under Climate Change: The Petite Nation River Watershed

by
Khalid Oubennaceur
1,*,
Karem Chokmani
1,
Yves Gauthier
1,
Claudie Ratte-Fortin
1,
Saeid Homayouni
1 and
Jean-Patrick Toussaint
2
1
Institut National de la Recherche Scientifique, Centre Eau Terre Environnement, 490 De la Couronne Street, Quebec City, QC G1K 9A9, Canada
2
Federation of Canadian Municipalities, Clarence Street, Ottawa, ON K1N 5P3, Canada
*
Author to whom correspondence should be addressed.
Submission received: 11 June 2021 / Revised: 26 July 2021 / Accepted: 27 July 2021 / Published: 5 August 2021

Abstract

:
In Canada, climate change is expected to increase the extreme precipitation events by magnitude and frequency, leading to more intense and frequent river flooding. In this study, we attempt to map the flood hazard and damage under projected climate scenarios (2050 and 2080). The study was performed in the two most populated municipalities of the Petite Nation River Watershed, located in southern Quebec (Canada). The methodology follows a modelling approach, in which climate projections are derived from the Hydroclimatic Atlas of Southern Quebec following two representative concentration pathways (RCPs) scenarios, i.e., RCP 4.5 and RCP 8.5. These projections are used to predict future river flows. A frequency analysis was carried out with historical data of the peak flow (period 1969–2018) to derive different return periods (2, 20, and 100 years), which were then fed into the GARI tool (Gestion et Analyse du Risque d’Inondation). This tool is used to simulate flood hazard maps and to quantify future flood risk changes. Projected flood hazard (extent and depth) and damage maps were produced for the two municipalities under current and for future scenarios. The results indicate that the flood frequencies are expected to show a minor decrease in peak flows in the basin at the time horizons, 2050 and 2080. In addition, the depth and inundation areas will not significantly change for two time horizons, but instead show a minor decrease. Similarly, the projected flood damage changes in monetary losses are projected to decrease in the future. The results of this study allow one to identify present and future flood hazards and vulnerabilities, and should help decision-makers and the public to better understand the significance of climate change on flood risk in the Petite Nation River watershed.

1. Introduction

Floods are the most frequent natural hazard in Canada [1,2] and in many parts of the world. They can occur at any time of the year and are mostly caused by hydrometeorological mechanisms, such as heavy rainfall, rapid melting of a deep snowpack, ice jams, or, more rarely, the failure of a natural or the human-made dam. Their frequency, magnitude, and cost are on the rise worldwide, thus, potentially increasing flood damage in the future. Extreme weather events in Canada are increasing in frequency and severity and this trend is likely to continue as a result of climate change [3]. Environment and Climate Change Canada predicted, an increase in the intensity and frequency of extreme weather events in their last report published in 2019 [4]. A total of 309 flood events occurred in Canada between 1990 and 2020 [5]. The majority of those events occurred in major urban cities such as: Saguenay in 1996 [6], Winnipeg in 1997 [7], Calgary in 2013 [8], Toronto in 2013 [9], and recently in the south of Quebec in 2017 and 2019 [10]. Extreme precipitation is projected to increase across most of the country according to recent climate change projections, with some decreases in summer precipitation in southern areas [4] (pp. 112–193). The modelling approaches using linked climate-hydrologic models could help to characterize future changes in flood risk [11].
Flood risk is commonly determined as a combination of the probability of a flood with given intensity, and the potential consequences [12]. Numerous studies have focused on quantifying flood risk, including two major components, i.e., flood hazard and vulnerability. Understanding, preventing, and managing flood risk in the context of climate change must, therefore, consider the evolutions of these two components. A flood hazard is described by the physical characteristics of the flood events (e.g., extent and depth of inundation) with a probability of exceedance, whereas flood vulnerability is measured by the exposure and susceptibility to damage. Exposure refers to the question of ‘who or what will be affected?’, while the susceptibility responds to the question of, “how will the affected elements be damaged?” Susceptibility is usually described in depth–damage curves [13]. These curves represent losses (structural and/or content damage, in total or as a percentage of structure value) as a monotonic function of inundation depth.
Many studies about flooding and climate change have been undertaken worldwide (e.g., [11,14,15]), as well as in a Canadian context [14,15,16]. Henstra and Thistlethwaite [16] assessed the way Toronto and Calgary are using public resources to share climate-related risks with a focus on flooding. In Quebec, several studies have addressed flooding the lens of climate change. For instance, Roy, Leconte [17] investigated the impact of climate change on flooding in the Châteauguay River basin, located in the southern part of Quebec, by using results from the Canadian general circulation model GCM (CGCM1) and a coupled hydrologic–hydraulic model of the basin. Mareuil, Leconte [18] evaluated the hydrological impacts of climate change on the Chateauguay River watershed, by using three global climate models (GCMs). Using GCMs, Laforce, Simard [19] mapped the extent of flooding rivers located within the Chateauguay River Basin (CRB) and the du Nord River Basin (NRB), in southern Quebec. Riboust and Brissette [20] studied the climate change impacts and uncertainties on Lake Champlain’s flooding, as well as the Richelieu River flooding. Zadeh, Burn [21] studied changes in flood regimes in Canada using large-scale datasets of hydrometric stations. Changes were examined using different factors: hydroclimatic regions, drainage area size, and land-use changes [21]. In these studies, changes in flooding frequency and magnitudes were assessed. In other studies, such as [22,23,24], investigations were carried out to determine how floodplain and flood damage would be impacted by climate change. This present study explores future changes in the frequency flood hazard and monetary damage. Mapping the extent and depth of flooding associated with current and future flood scenarios was a key component of assessing the vulnerability.
In order to assess climate change impacts, an ensemble of global circulation models (GCMs) and regional climate models (RCMs) have been commonly used for future climate projections [25,26]. On the one hand, GCM simulations are performed at a coarse spatial resolution of 150–550 km [27], making the data unreliable for basin-scale impact assessment studies. In order to determine future flows and flooding projections at catchment(s) scales, coarse resolution climate projections from GCMs are usually downscaled [28].
On the other hand, RCMs can produce climate simulations at a higher resolution than GCMs. They typically operate at a grid resolution between 10 and 50 km, and are limited to subregions of the globe (e.g., Quebec). For instance, the research of Elía, R. C. et al. [29] presented an evaluation of the Canadian regional climate model (CRCM) and simulated stream flow characteristics for 21 watersheds for northeast Canada.
Many climate scenarios have been created under the Intergovernmental Panel on Climate Change (IPCC) for the next 100 years [30,31,32,33]. These scenarios, or representative concentration pathways (RCPs), represent a set of greenhouse gas concentrations that may occur based on anthropological activities, and have been widely used to study hydrological responses to climate change [34,35,36]. The Fifth Assessment Report (AR5) of the IPCC, published in 2014, presented four RCPs. The pathways describe different climate futures, all of which are considered possible depending on the volume of greenhouse gases (GHG) emitted in the years to come. The RCPs, originally RCP 2.6, RCP 4.5, RCP 6, and RCP 8.5, are labelled after a possible range of radiative forcing values in 2100 (2.6, 4.5, 6, and 8.5 Wm−2, respectively).
In Quebec, the Direction de l’expertise hydrique et atmosphérique (DEHA), under the Ministry of Environment and the Fight against Climate Change, published a hydroclimatic atlas [37], which presents a synthesis of the state of knowledge describing the projected changes in high and low flows on the 2050-time horizon for southern Quebec [37]. The data used in the assessment comprise a total of 89 climate projections based on the Coupled Model Intercomparison Model Phase 5 (CMIP 5) [38] produced by 29 general circulation climate models, and the modelling domain consisted of a region called meridional Quebec, which includes the watersheds of the Ottawa and Saguenay rivers as well as the St-Lawrence Valley region. Hydroclimatic modelling uses climate and hydrological models to assess the impact of GHGs on the main processes that determine the behaviour of hydrological regimes. They concluded that an increase in average winter river flows is expected for all of Québec for the 2041–2070-time horizons. The consensus is high (over 90%) among all the hydroclimatic projections. Most rivers in Northern Quebec could experience increases in average spring and fall flows for the same time horizon (moderate consensus). Most rivers in southern Quebec can expect a decrease in average flows in summer, spring, and fall. The impact of climate change on flooding in southern Quebec is variable depending on the type of hazard (open water, ice jams, or coastal floods), the size of the basin (small or large basin), and the season [39]. The processes leading to peak flooding depend on the spatial and temporal scales.
This study aims at proposing a methodology to investigate the climate change impacts on flood hazard and damage for two municipalities of the Petite Nation River watershed. This aim is achieved through a climatic, hydrologic, hydraulic, and damage approach. It provides an original approach to incorporating climate change into flood risk analysis. The objectives are:
(i).
To develop frequency analysis of observed average flows measured at the Petite Nation River Basin concerning current and future climate conditions;
(ii).
To simulate flood hazard maps under future climate changes scenarios;
(iii).
(To estimate damage assessment in terms of monetary losses associated with residential buildings.
(iv).
The flood hazard and damage mapping results associated with climate change are not intended to develop detailed floodplain mapping and vulnerabilities for official floodplain designation. The flood modelling and mapping outlined in this case study were undertaken to better understand the effects of climate change on the Petite Nation River. Mapping the extent and depth of flooding associated with current and future flood scenarios was a key component of assessing the vulnerability of people, buildings, infrastructure, and the economy to flood events.

2. Materials and Methods

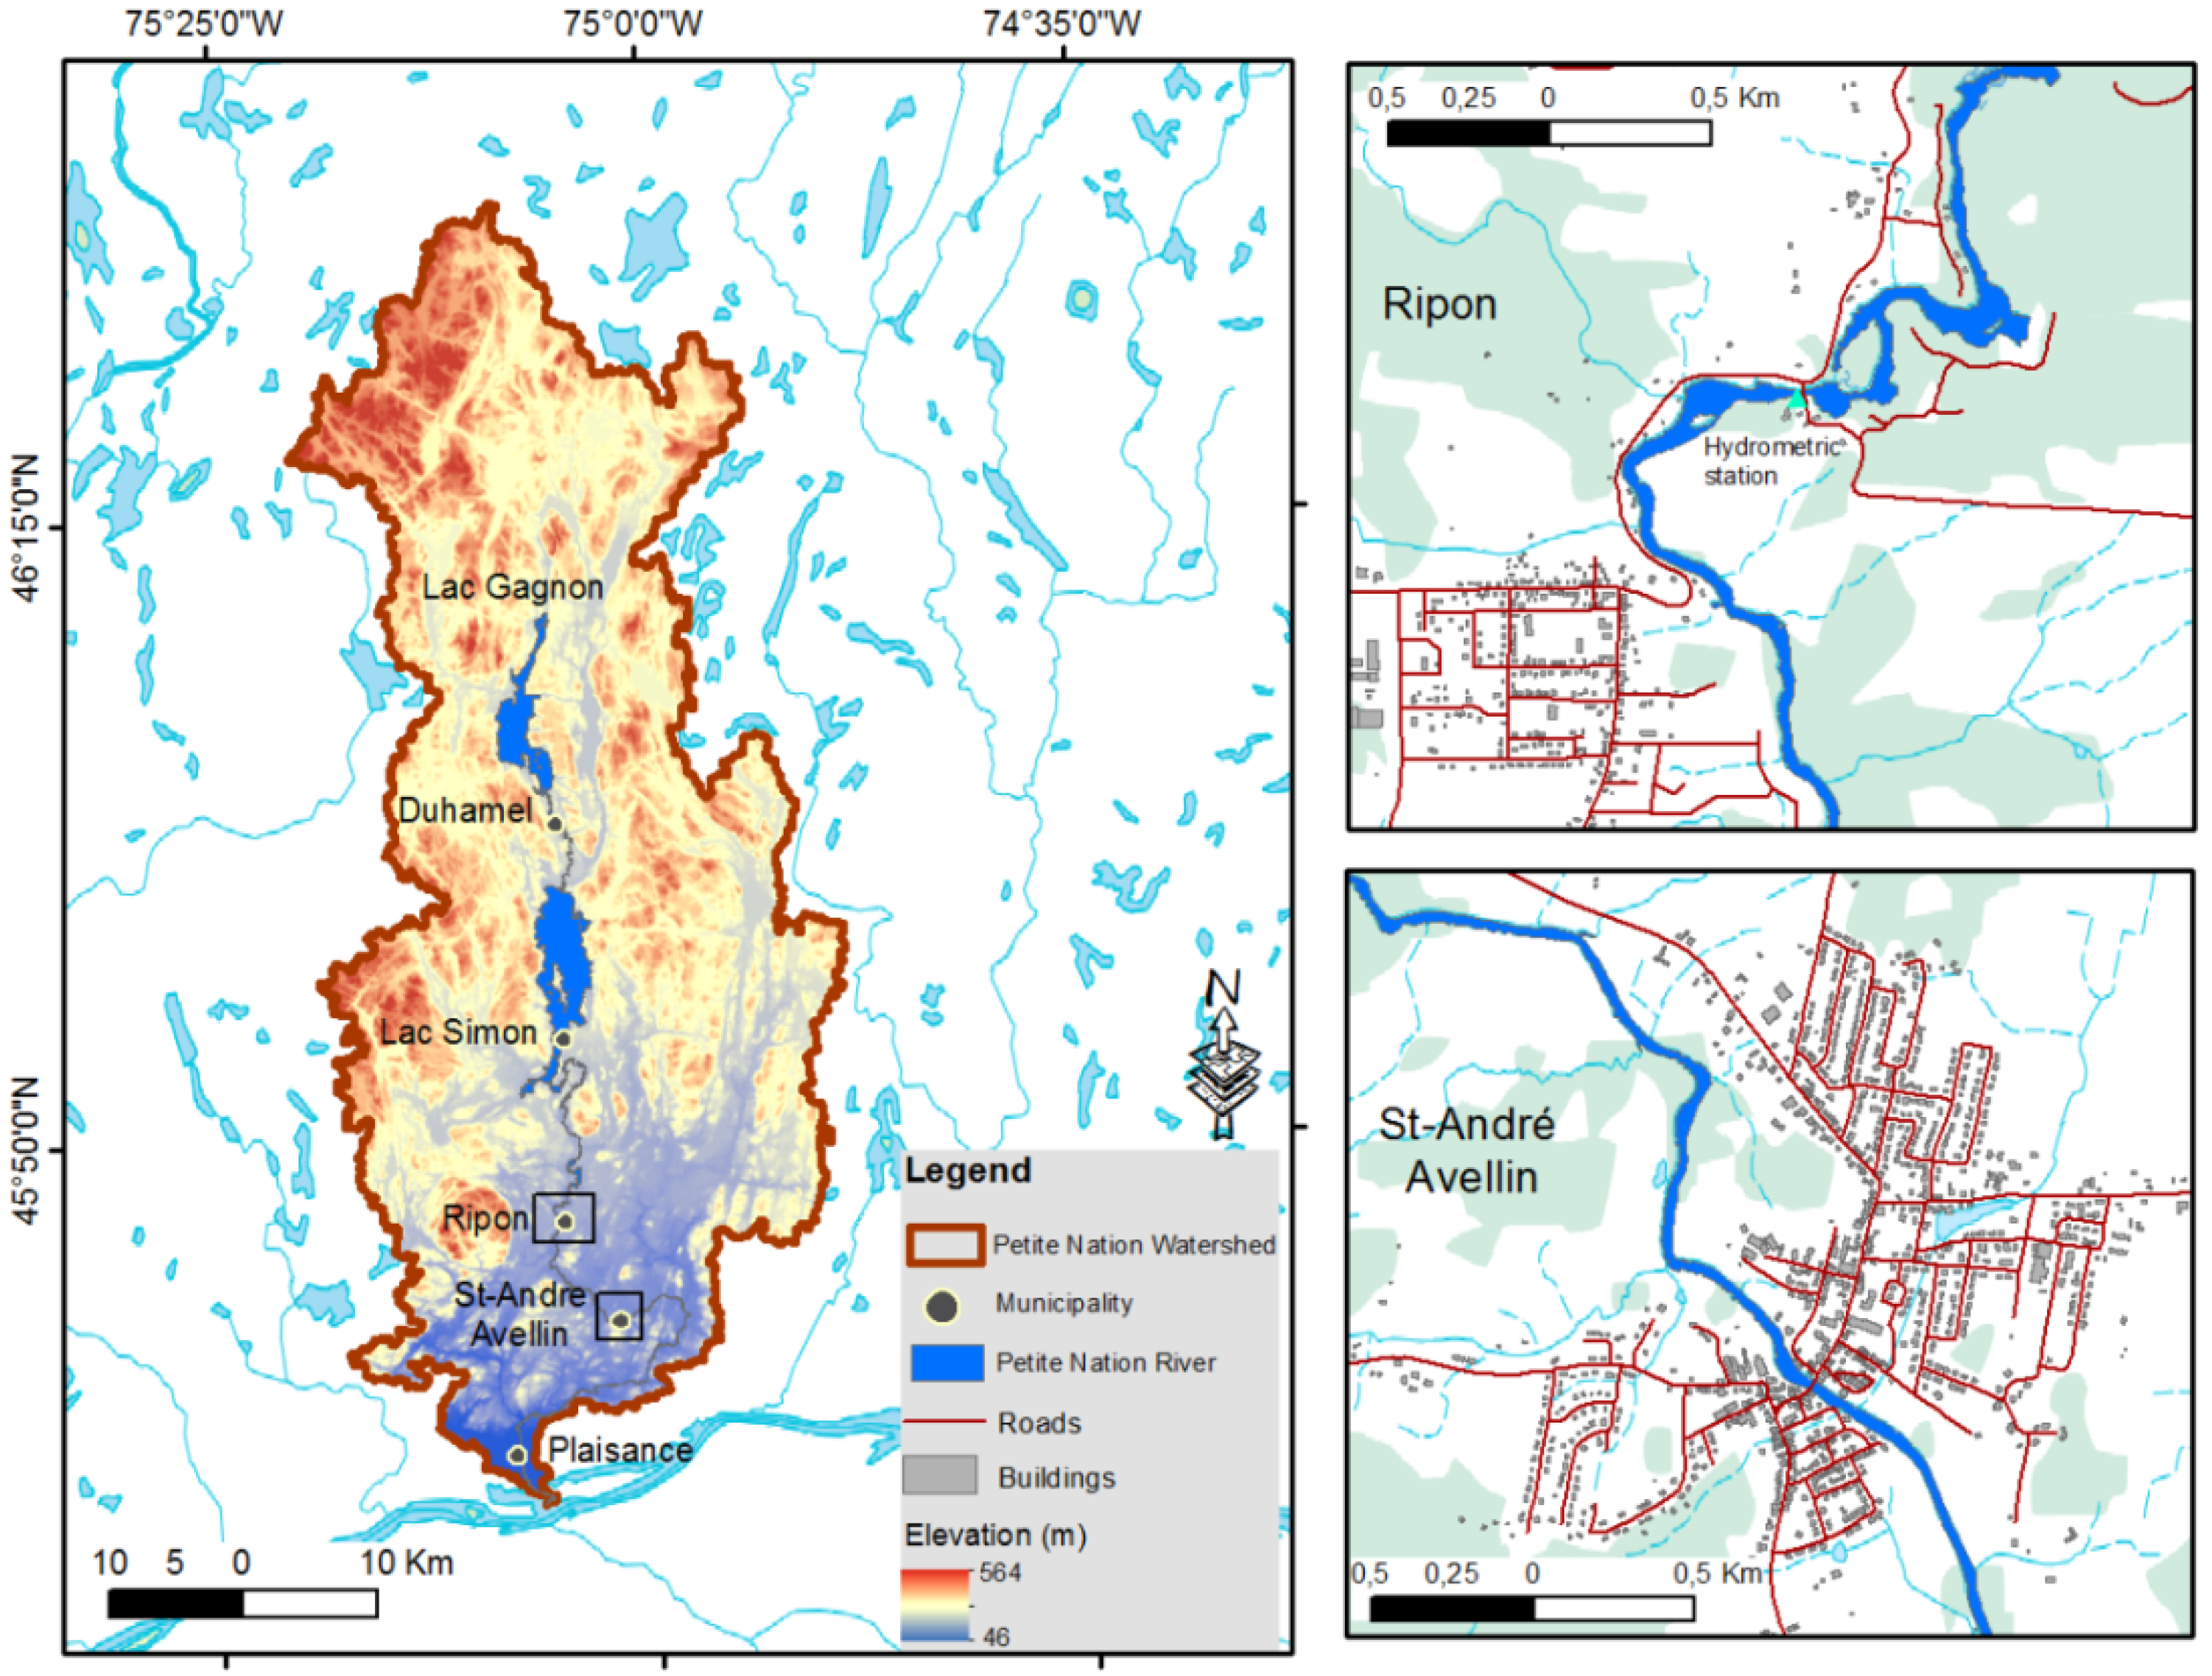
2.1. Study Area and Datasets

The study area is located along two urban municipalities in the Petite Nation River watershed, southern Quebec, Canada, i.e., Ripon and St-André-Avellin. Figure 1 shows the Petite Nation River watershed location with the digital elevation model (DEM) and the locations of the two studied municipalities. The Petite Nation River watershed has a total area of 2250 km2. The Petite Nation River takes sources from Lake des Grandes Baies and flows north to south for 132 km into the Ottawa River, a major tributary of the St. Lawrence River. The population of the watershed is approximately 17,500 inhabitants. The municipalities with a higher concentration of the population are St-Andre-Avellin and Ripon. These two municipalities have about 1320 and 3520 inhabitants, respectively. They have been chosen because they both suffer from recurring flooding problems, especially the recent floods in 2017 and 2019 in southern Quebec [40]. Most municipalities of the Petite Nation River watershed, except the municipalities of Ripon and St-André-Avellin, are rural areas. The importance of forest cover marks the northern part of this watershed. In addition, water bodies and streams are present in this sector (Lake Simon, Lake Gagnon, etc.), which is not very heavily occupied by human activity, notwithstanding the presence of vacationers.
Topographically, the Petite Nation River watershed’s elevation represented by a high-resolution DEM (1 m) gradually increases from South to North to a maximum elevation of 500 m (Figure 1); along this gradient, most of the Petite Nation River watershed altitude lies between 150 and 225 m. The Petite Nation River valley offers an undulating relief dotted with mounds and hills. In the northern part, the topography is characterized by low hills originating from the Laurentian massif. The 1 m DEM for the study area was acquired from the Ministry of Forests, Wildlife and Parks of Quebec.
Three main types of climates characterize the watershed. A cold and humid climate defines the northern parts, between 200 and 400 m in altitude. A moderately cold too mild and humid climate characterizes the watershed, up to 200 m in altitude in the center. Finally, in the south, along the Ottawa River, a mild and humid climate prevails. In the Petite Nation River watershed, the average annual precipitation is approximately 1000 mm.
Canada has developed a worldwide reputation for its flood management programs, focusing on floodplain regulation and mapping. In Quebec, floodplain mapping has been performed on some of the most problematic rivers. More recently, the delineation of 2-, 20-, and 100-year return flood was mapped for many Quebec rivers as part of a follow-up program called the “Programme de détermination des cotes de crues” (Program for the determination of the flood stage) set forth by the DEHA. The resulting digital maps were made available to us by the DEHA center. The Petite-Nation River is part of this project and has eight sectors (including the two studied municipalities) where flood hazard assessments have been carried out. The hydrometric data (stream flows) required for hydrologic and hydraulic modelling were also made available from the hydrometric station located at 1.6 km upstream from Ripon. The results of these floodplain maps have been used for hydraulic modelling, one of the main components of this methodology.
To assess the vulnerability, a database of 1160 buildings, including residential houses, was considered to estimate damage vulnerability. The majority of the buildings are one or two stories high, with basements. The factors taken into consideration when evaluating the risk to buildings are based on two criteria: the presence or absence of a basement for residential buildings and the number of stories. The level of inundation is defined in the stage–damage curves as the level of the water above the first-floor entrance. The amount of damage sustained by a building during a flood is typically measured using stage–damage curves. These curves are used in this study for the calculation of flood risk due to climate change. In this study, we assume that all buildings will be evacuated in the event of a flood, and therefore only structural impacts are considered. The municipal property assessment corporation provided the property assessment roll used in this study.

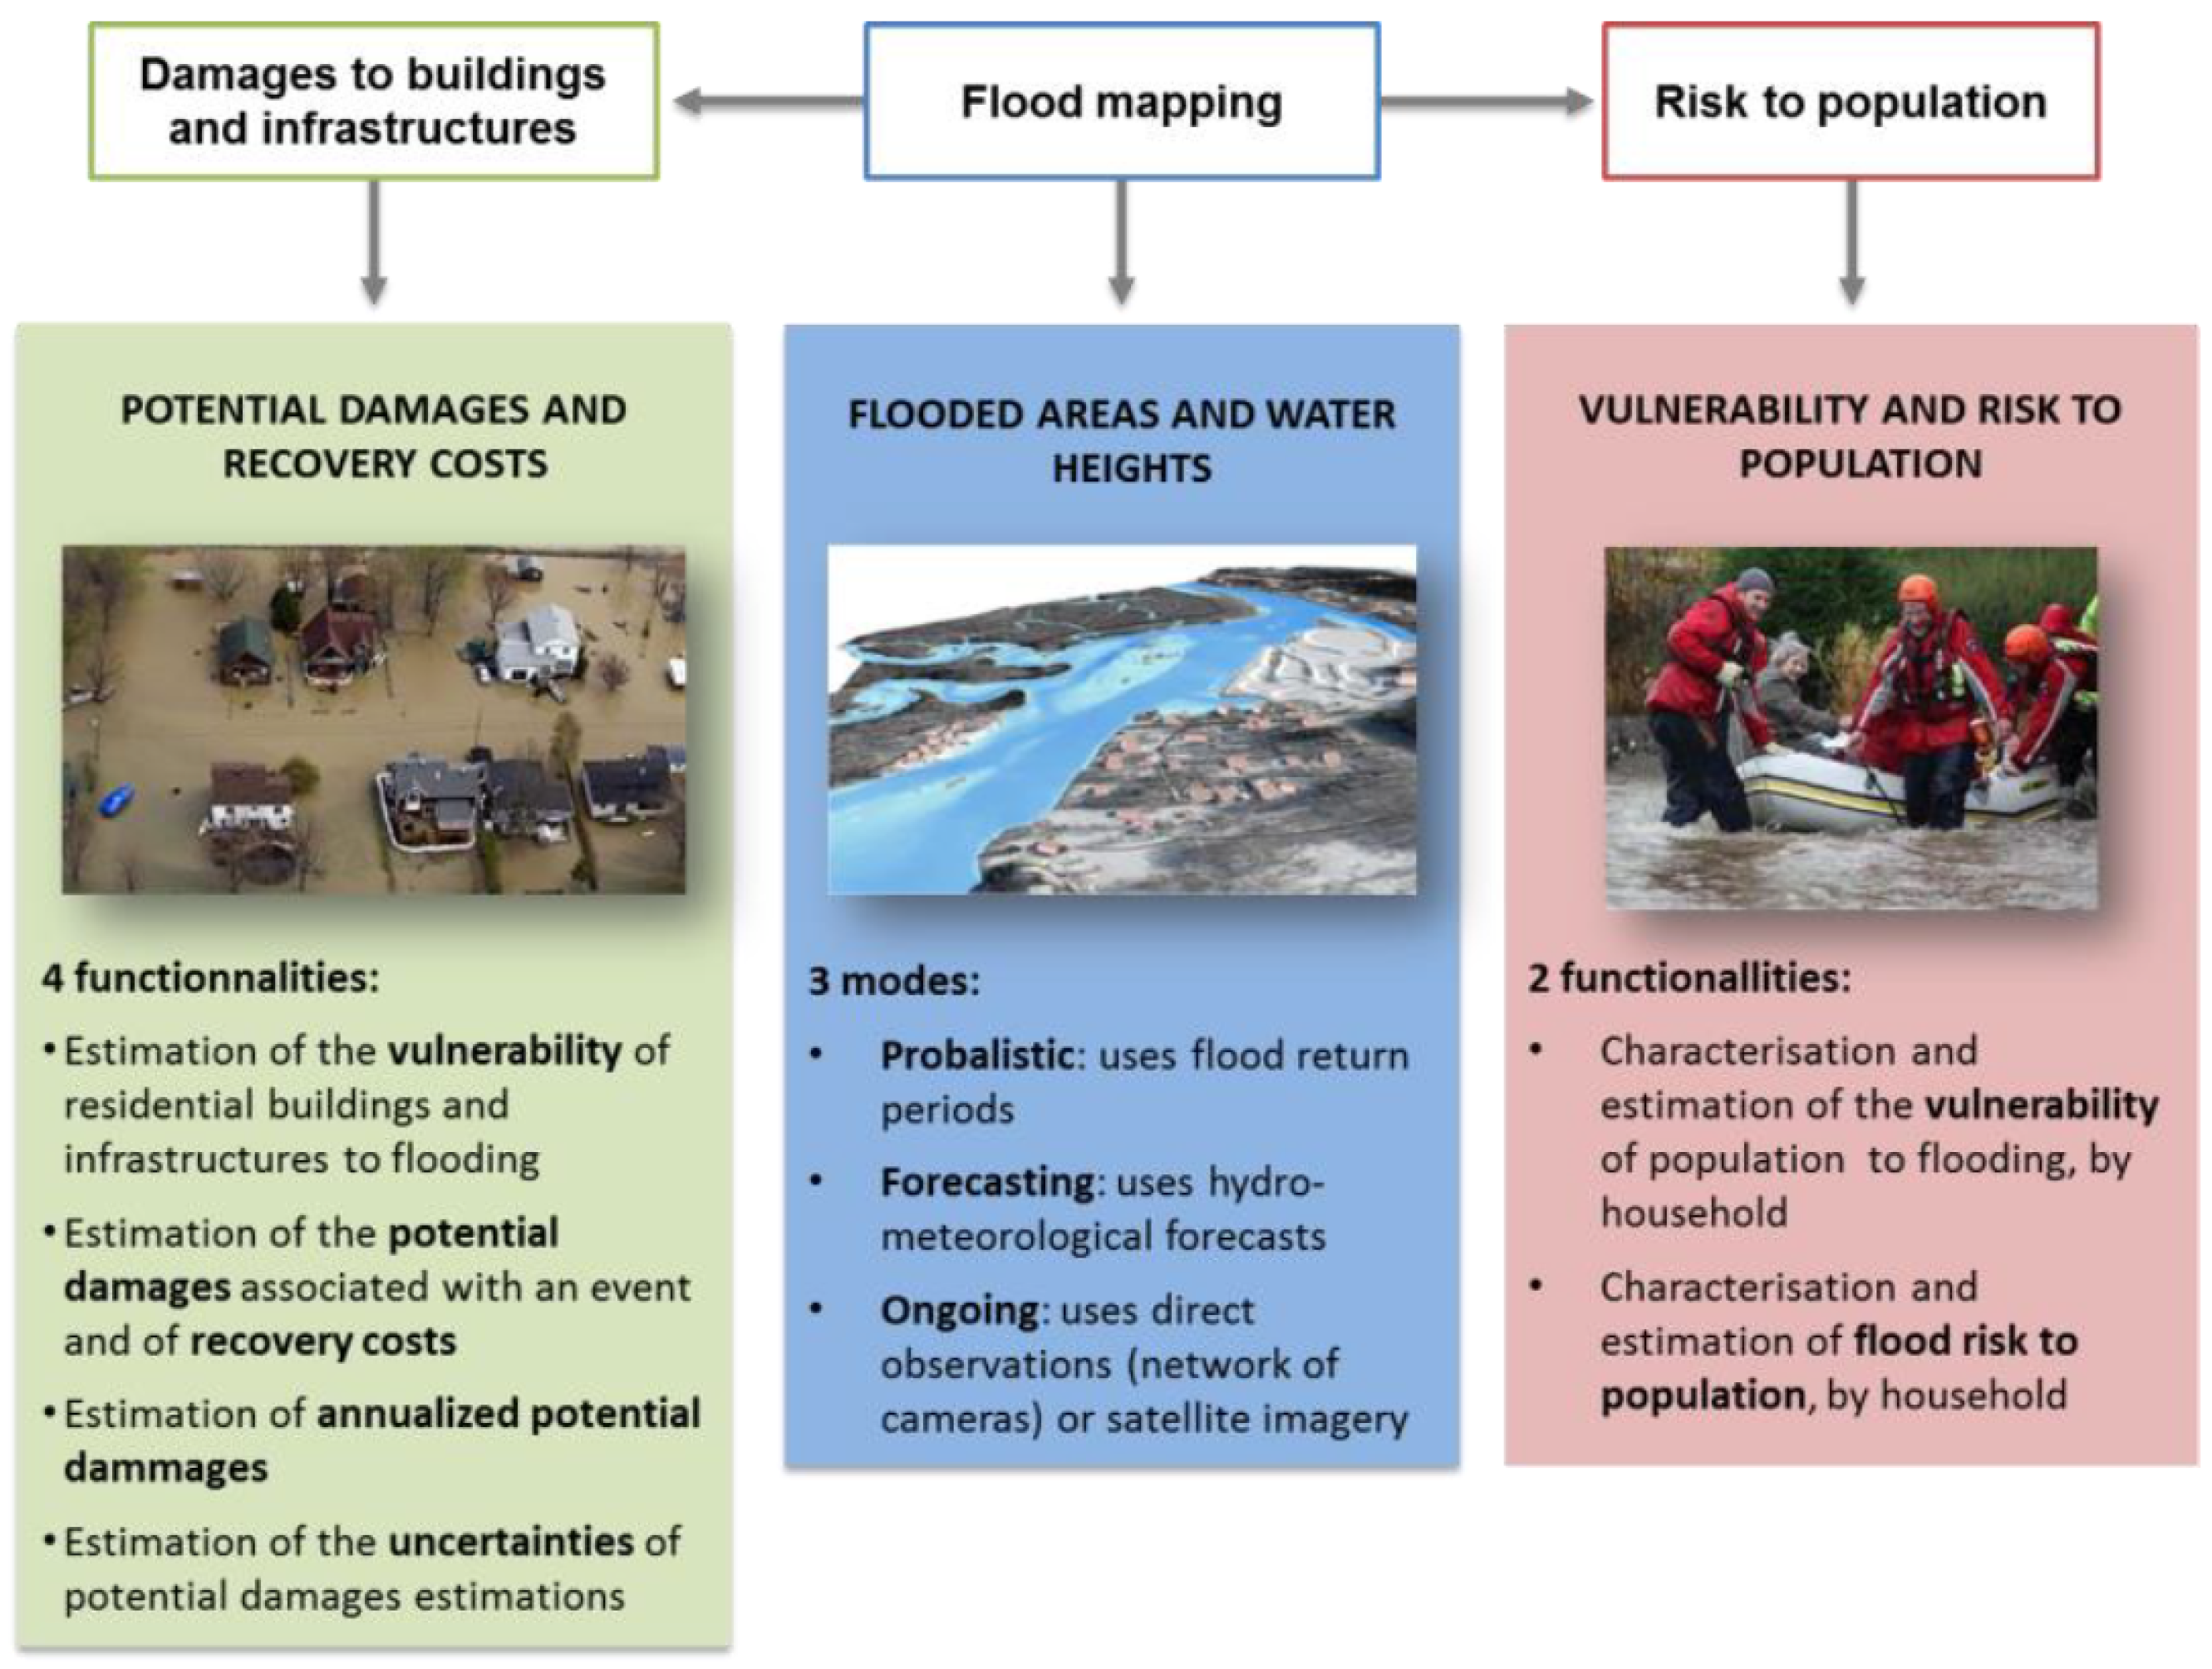
2.2. Description of GARI Tool
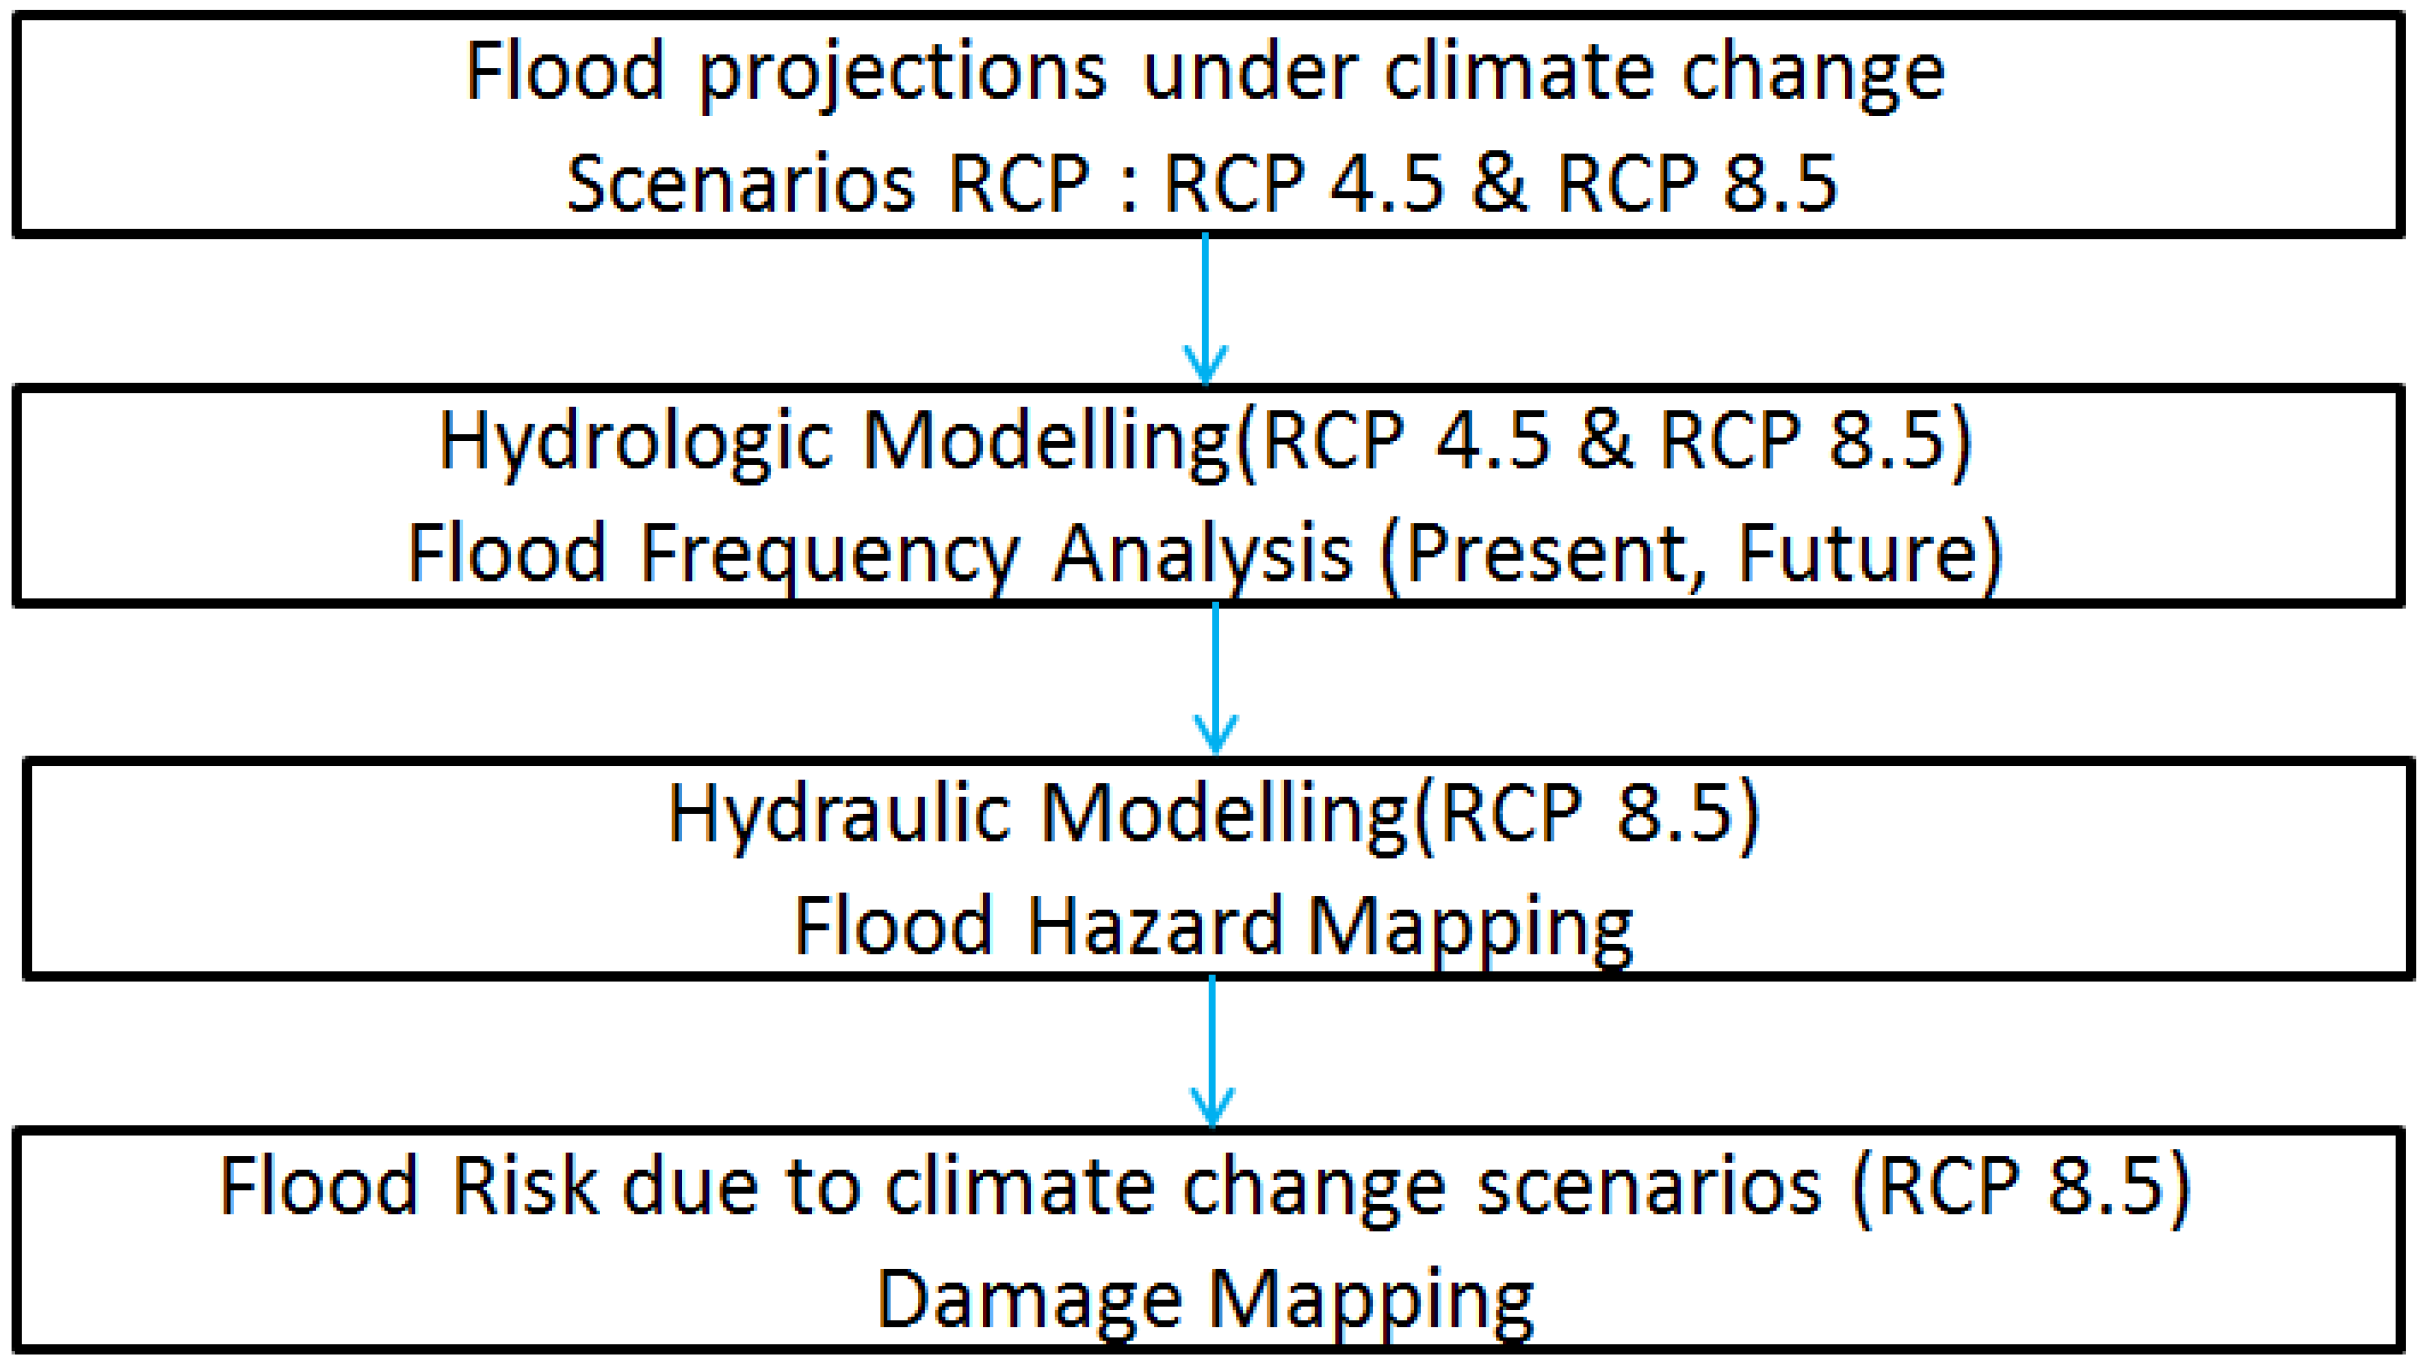
The GARI (Gestion et Analyse du Risque d’Inondation) tool was developed by the research team from the Environmental and Nordic Remote Sensing (TENOR) of the National Institute of Scientific Research (INRS) [41]. This tool can estimate analysis, and visualization the flood risk to the citizens, residential buildings, and infrastructure in some cases. The main advantage of the GARI tool is that it accounts for both the characteristics of the flooding event (i.e., flooded area and water heights) and the vulnerabilities of the elements directly or indirectly exposed to flooding. Vulnerability and flood risk to people are estimated and mapped by households, while potential damages (annualized or single-event-based) to residential buildings and recovery costs are estimated and mapped for each building. These estimations can be frequently updated to account for the spatiotemporal dynamic of flooding events.
The GARI tool contains three different modes: (i) flood mapping, (ii) risk to the population, and (iii) damage to buildings and infrastructure (Figure 2). Flood mapping allows estimation of the extent and water depth. The risk to the population provides a characterization and an estimation of population vulnerability to flooding by household, and an estimation of human risk associated with a flooding event. Finally, the damage at buildings estimate provides estimations of the potential damages and the recovery costs (both expressed in dollars) associated with a flooding event and estimation of annualized potential damages.

3. Methodology

The main steps for mapping the flood risk under current and future climate change, in this case study, are as follows:
Step 1. 
Flood projections under the climate change, operate the climate projections from the Hydroclimatic Atlas of Southern Quebec [42] under the scenarios RCP 4.5 and RCP 8.5.
Step 2. 
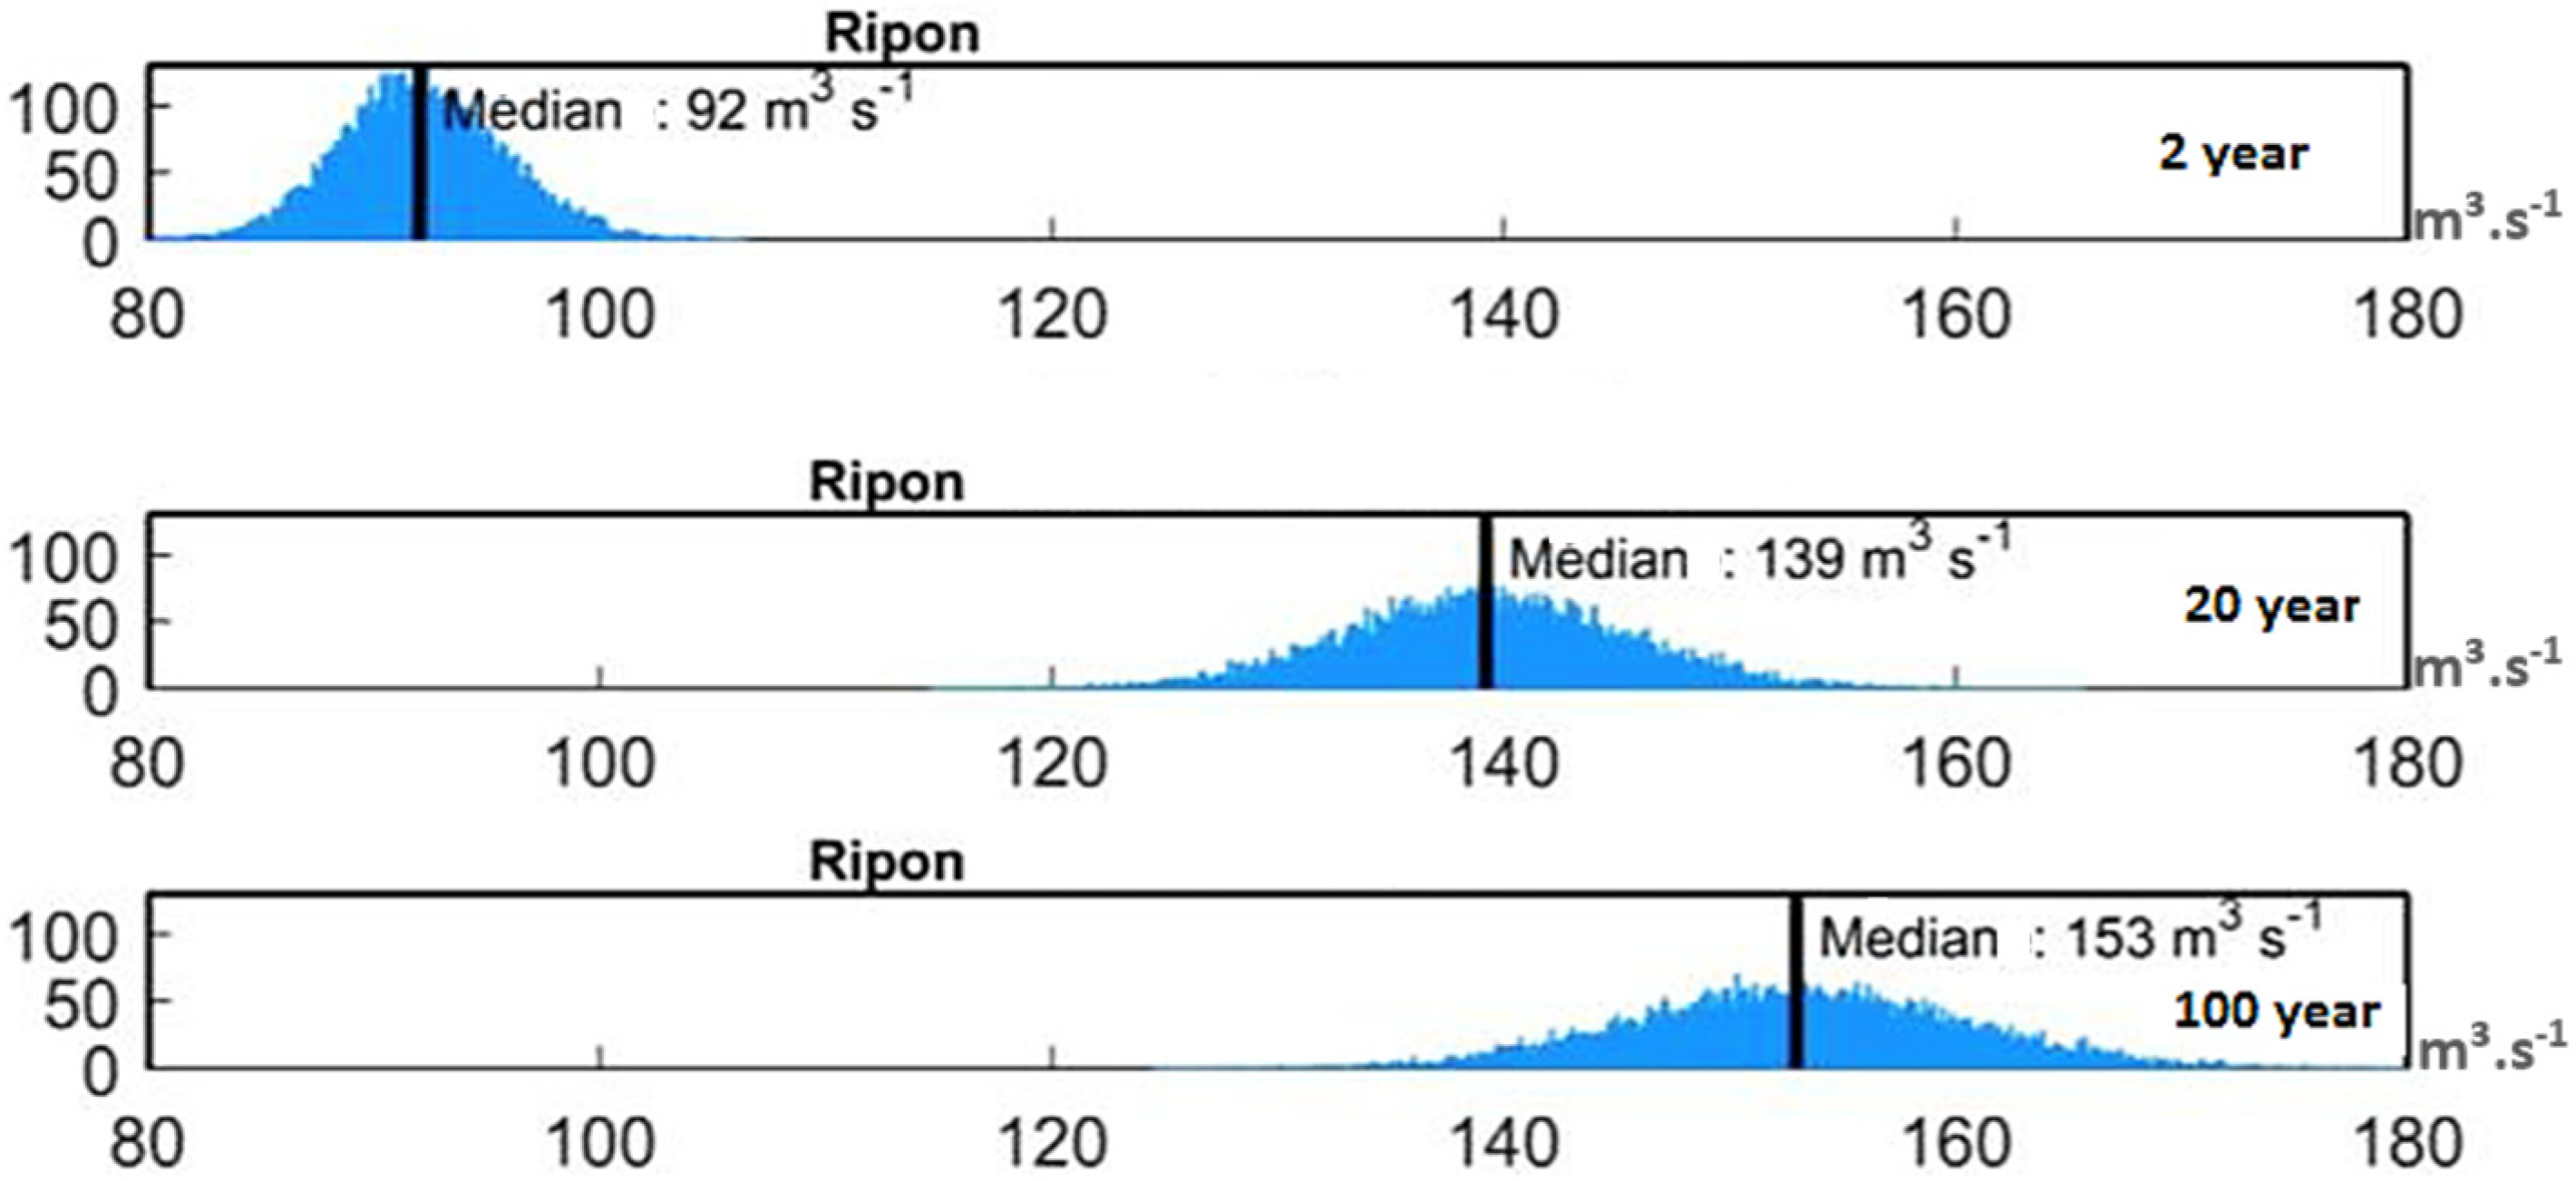
Hydrologic modelling, perform flood frequency analysis to extract the flow values for different return periods, i.e., 2, 20, and 100 years (RCP 8.5 and RCP 4.5).
Step 3. 
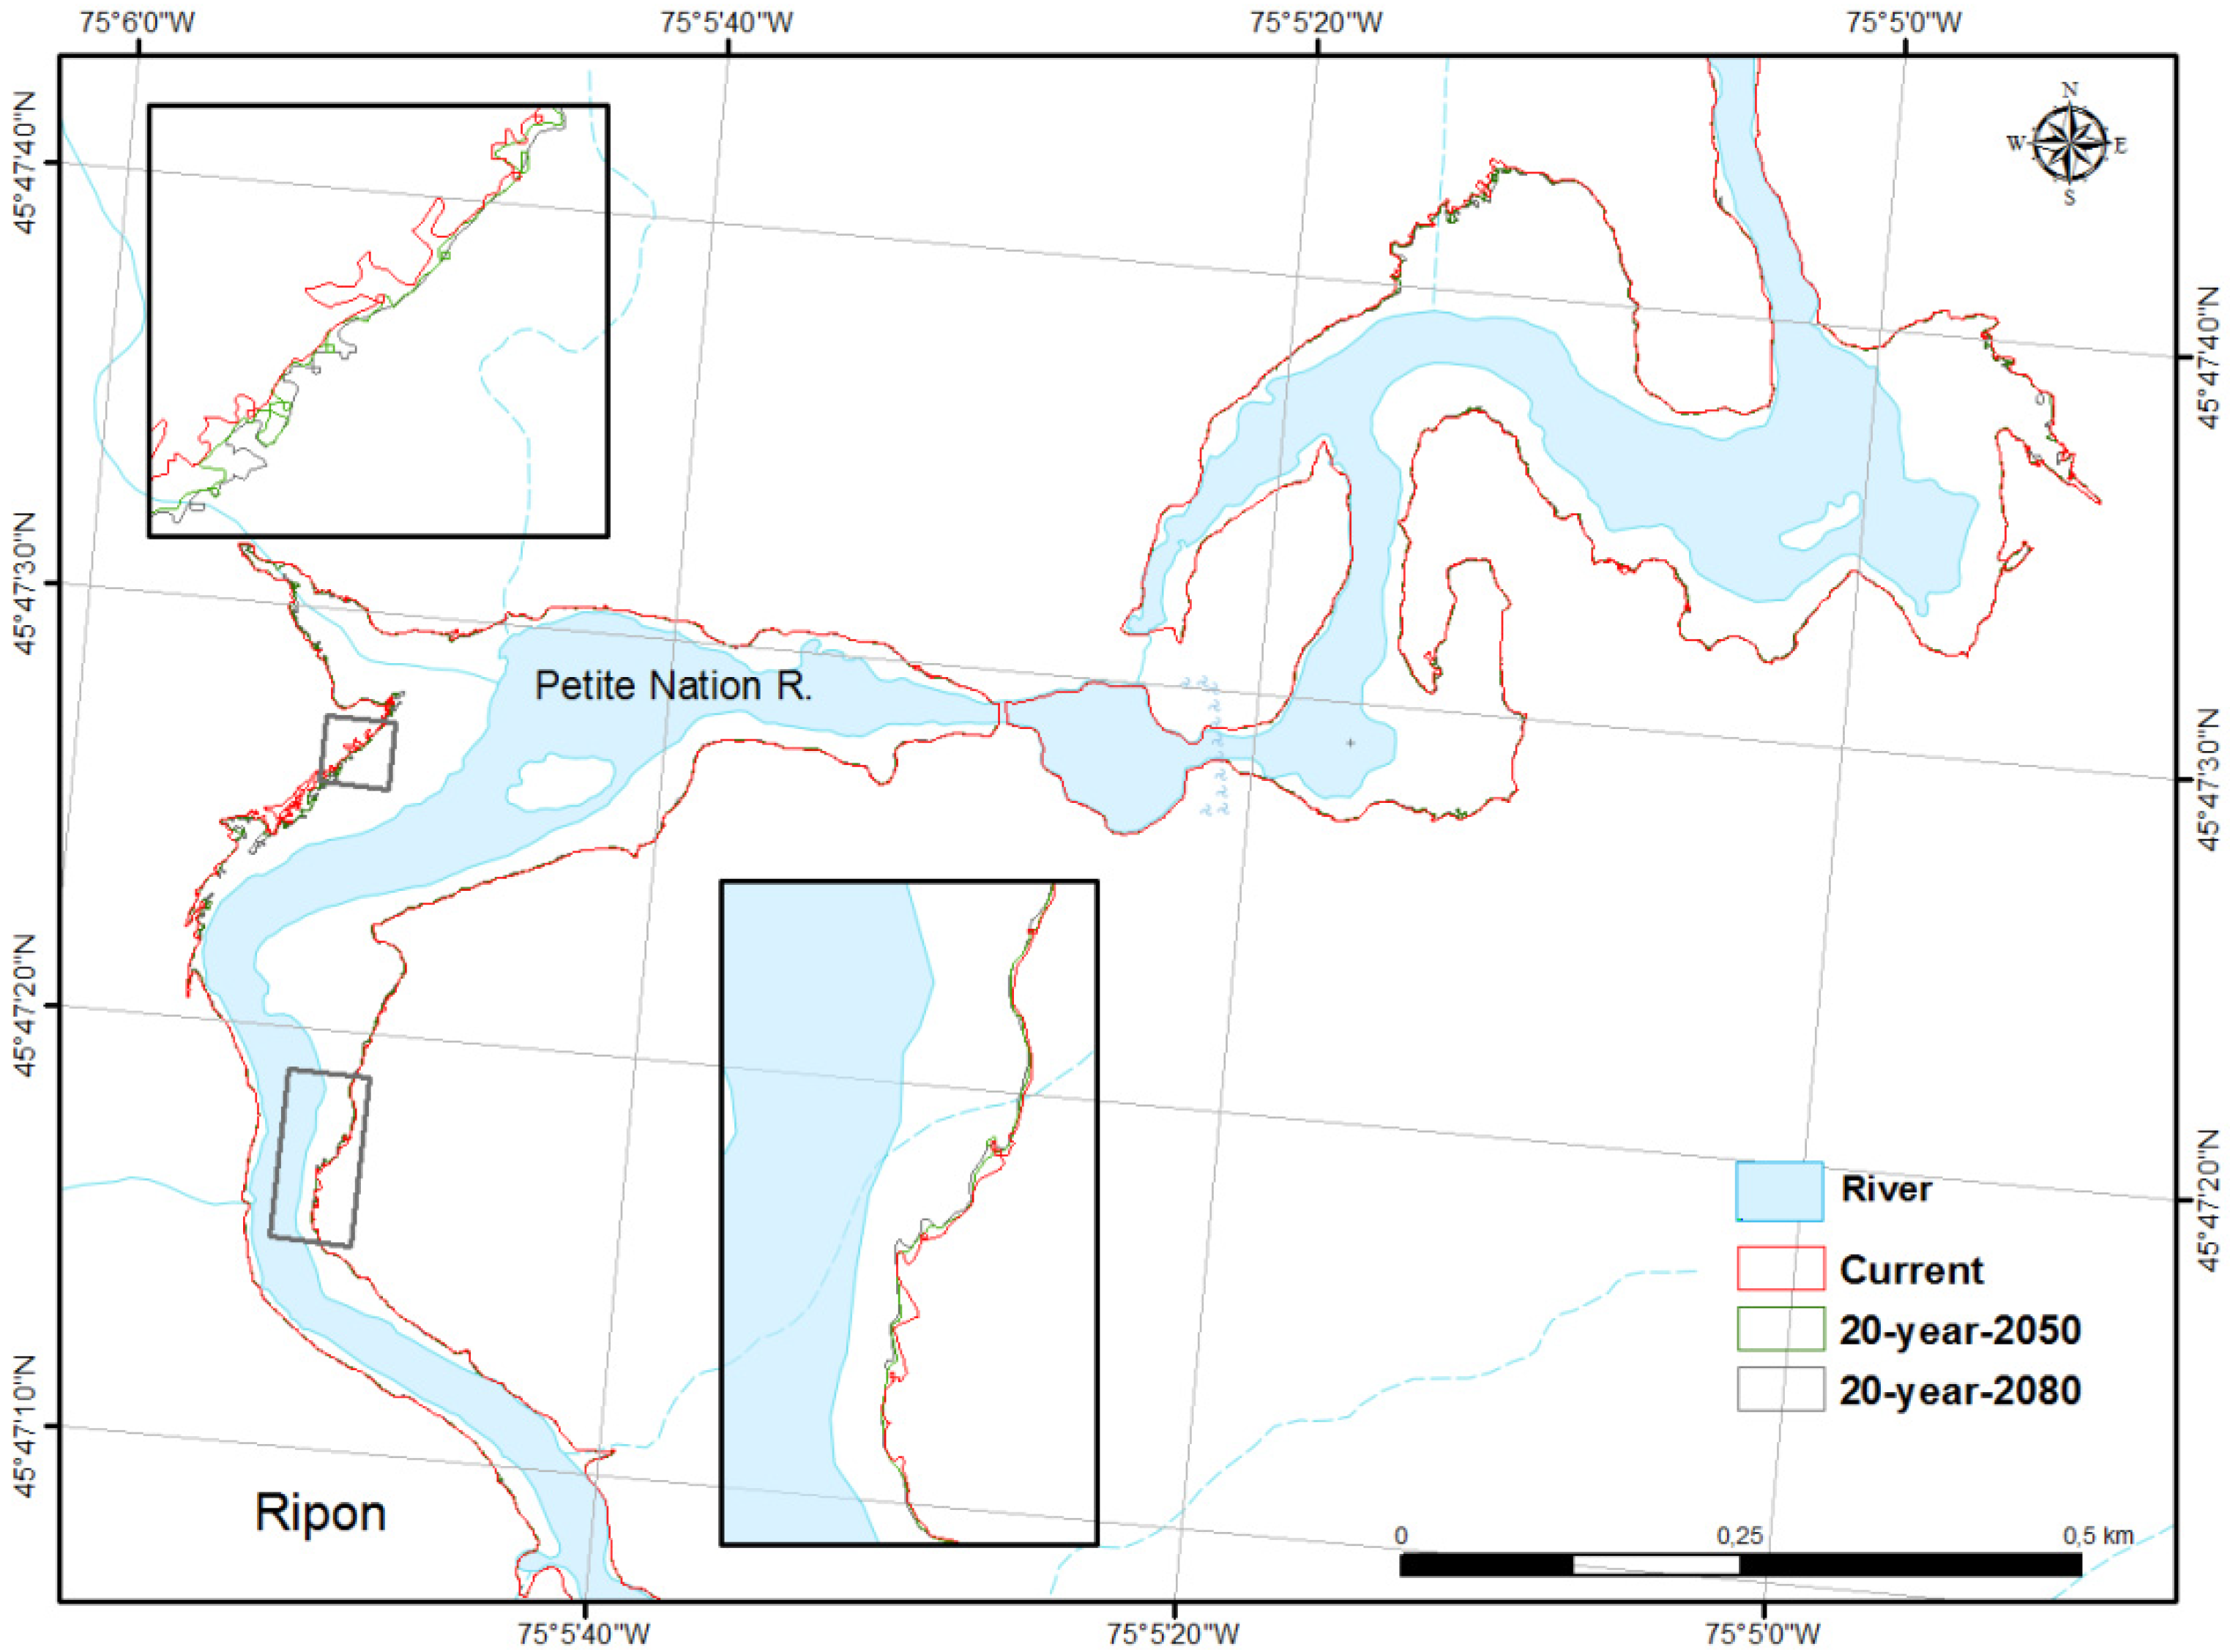
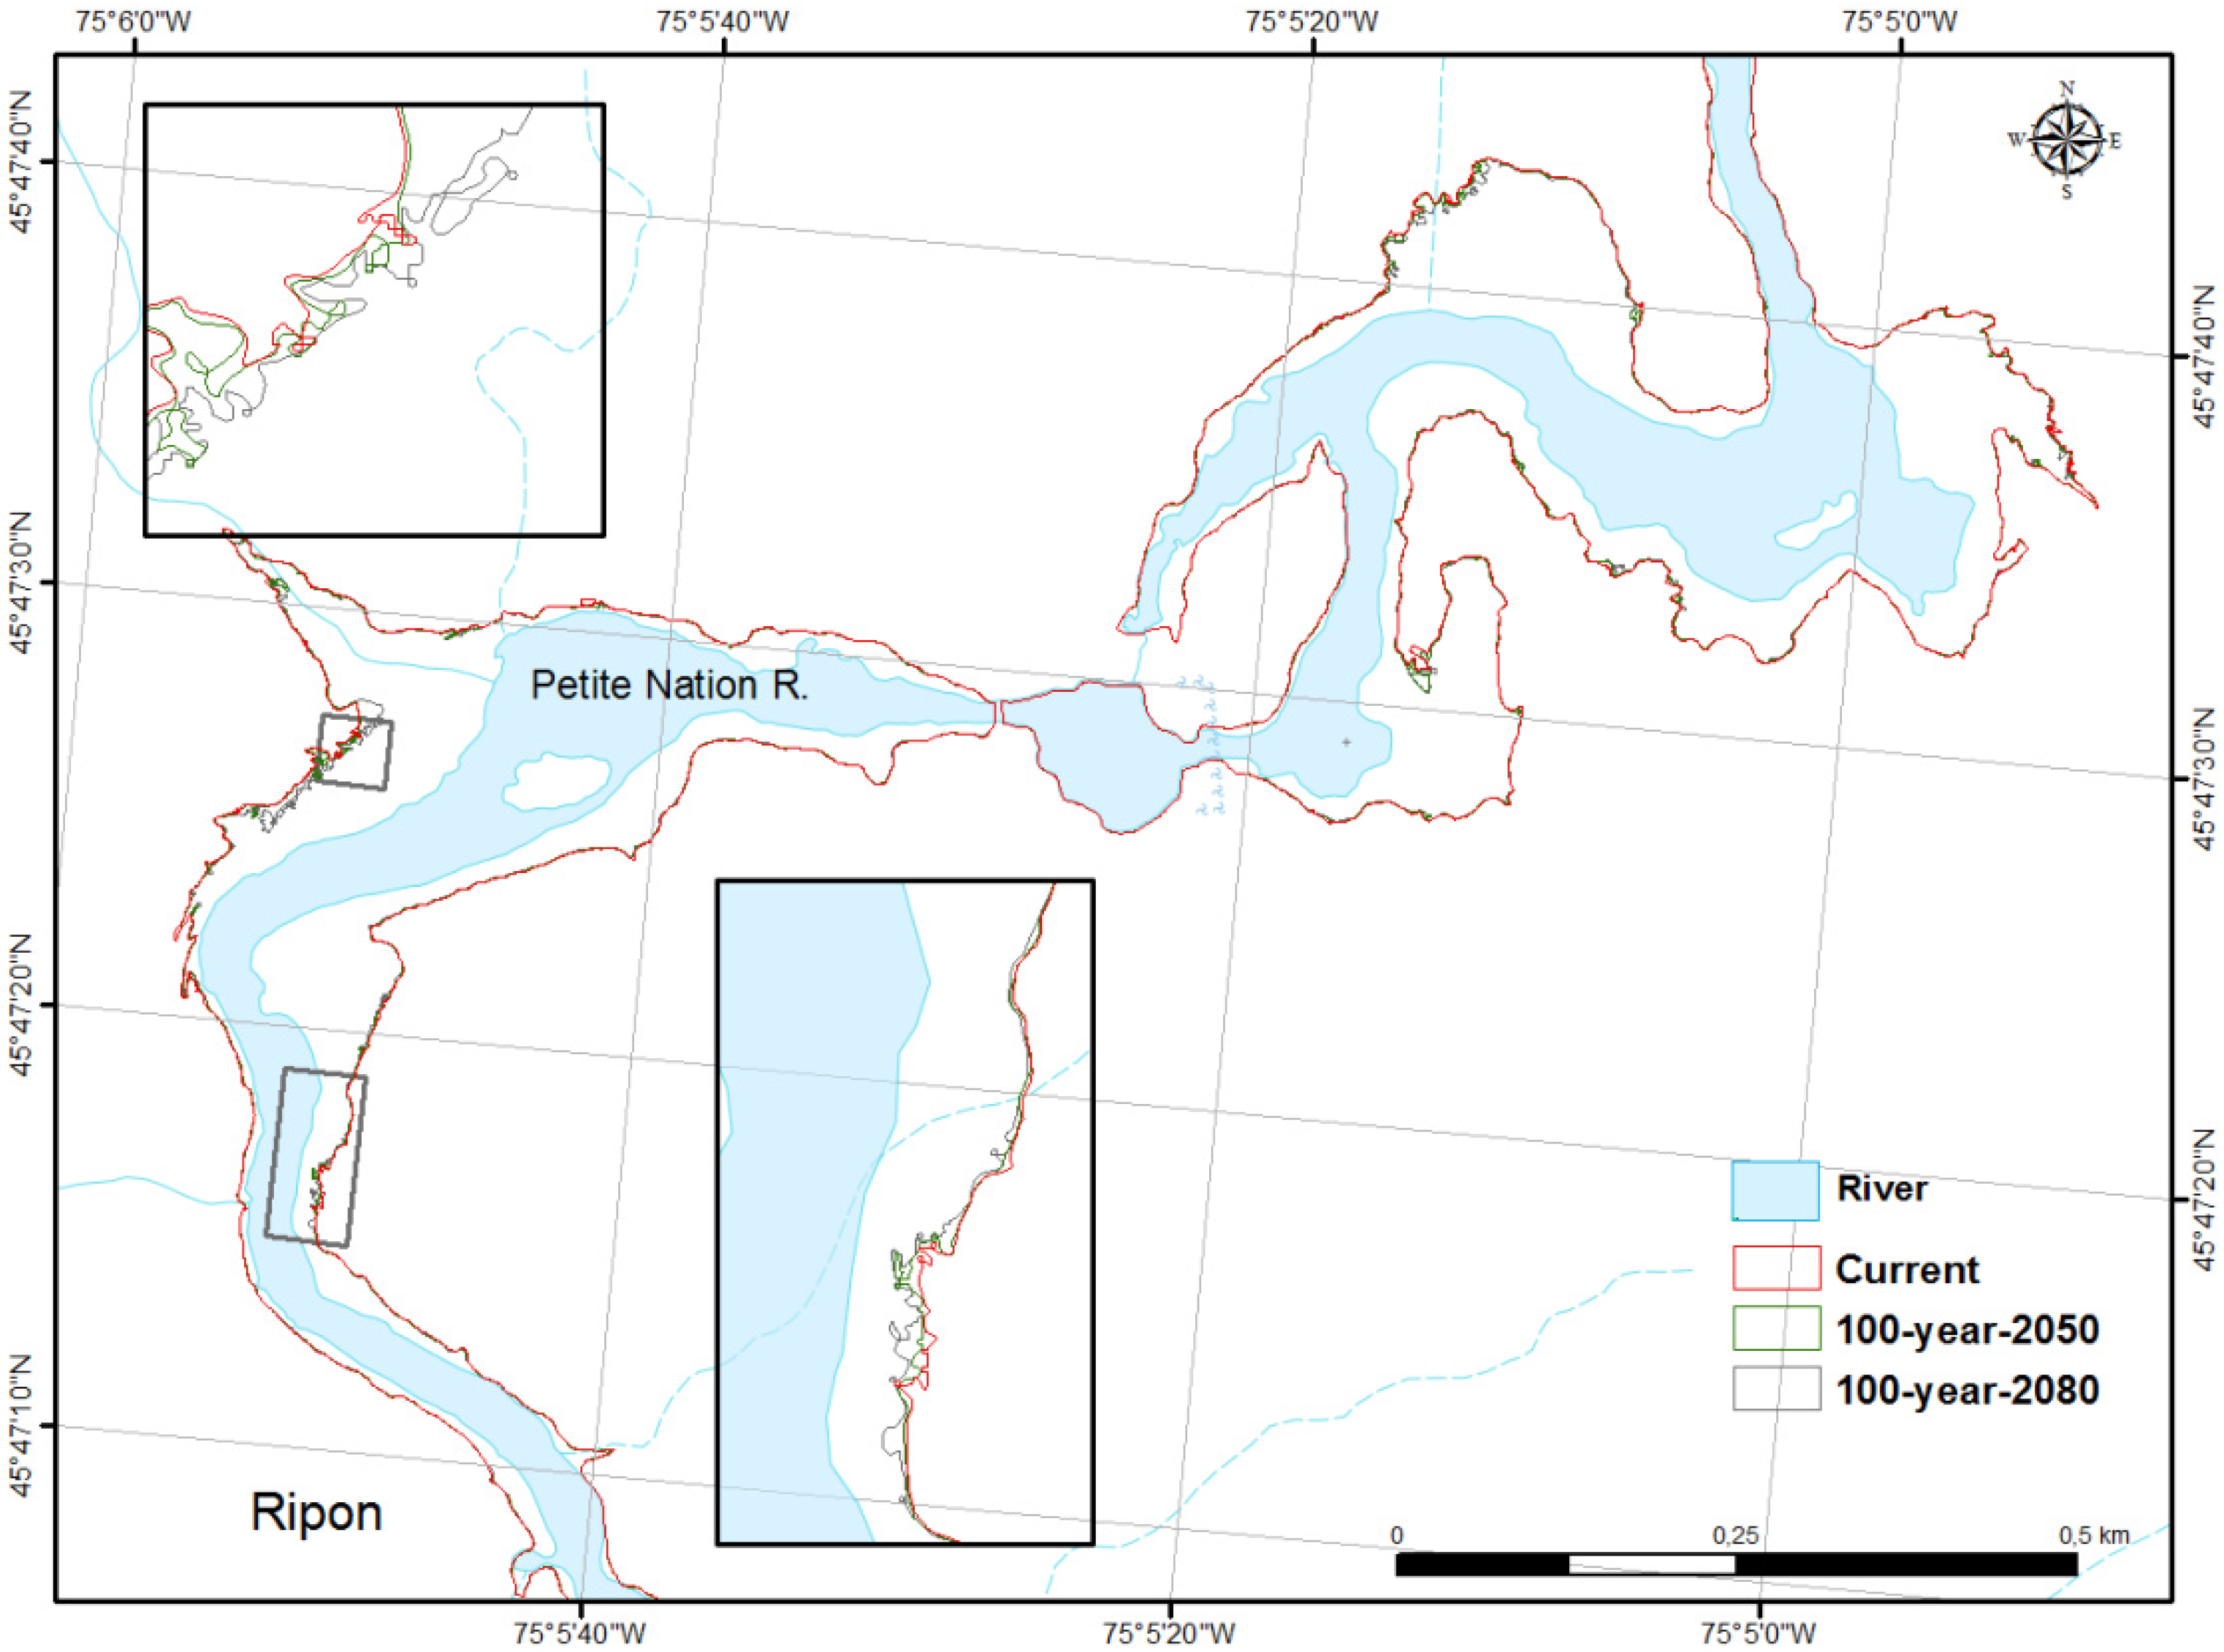
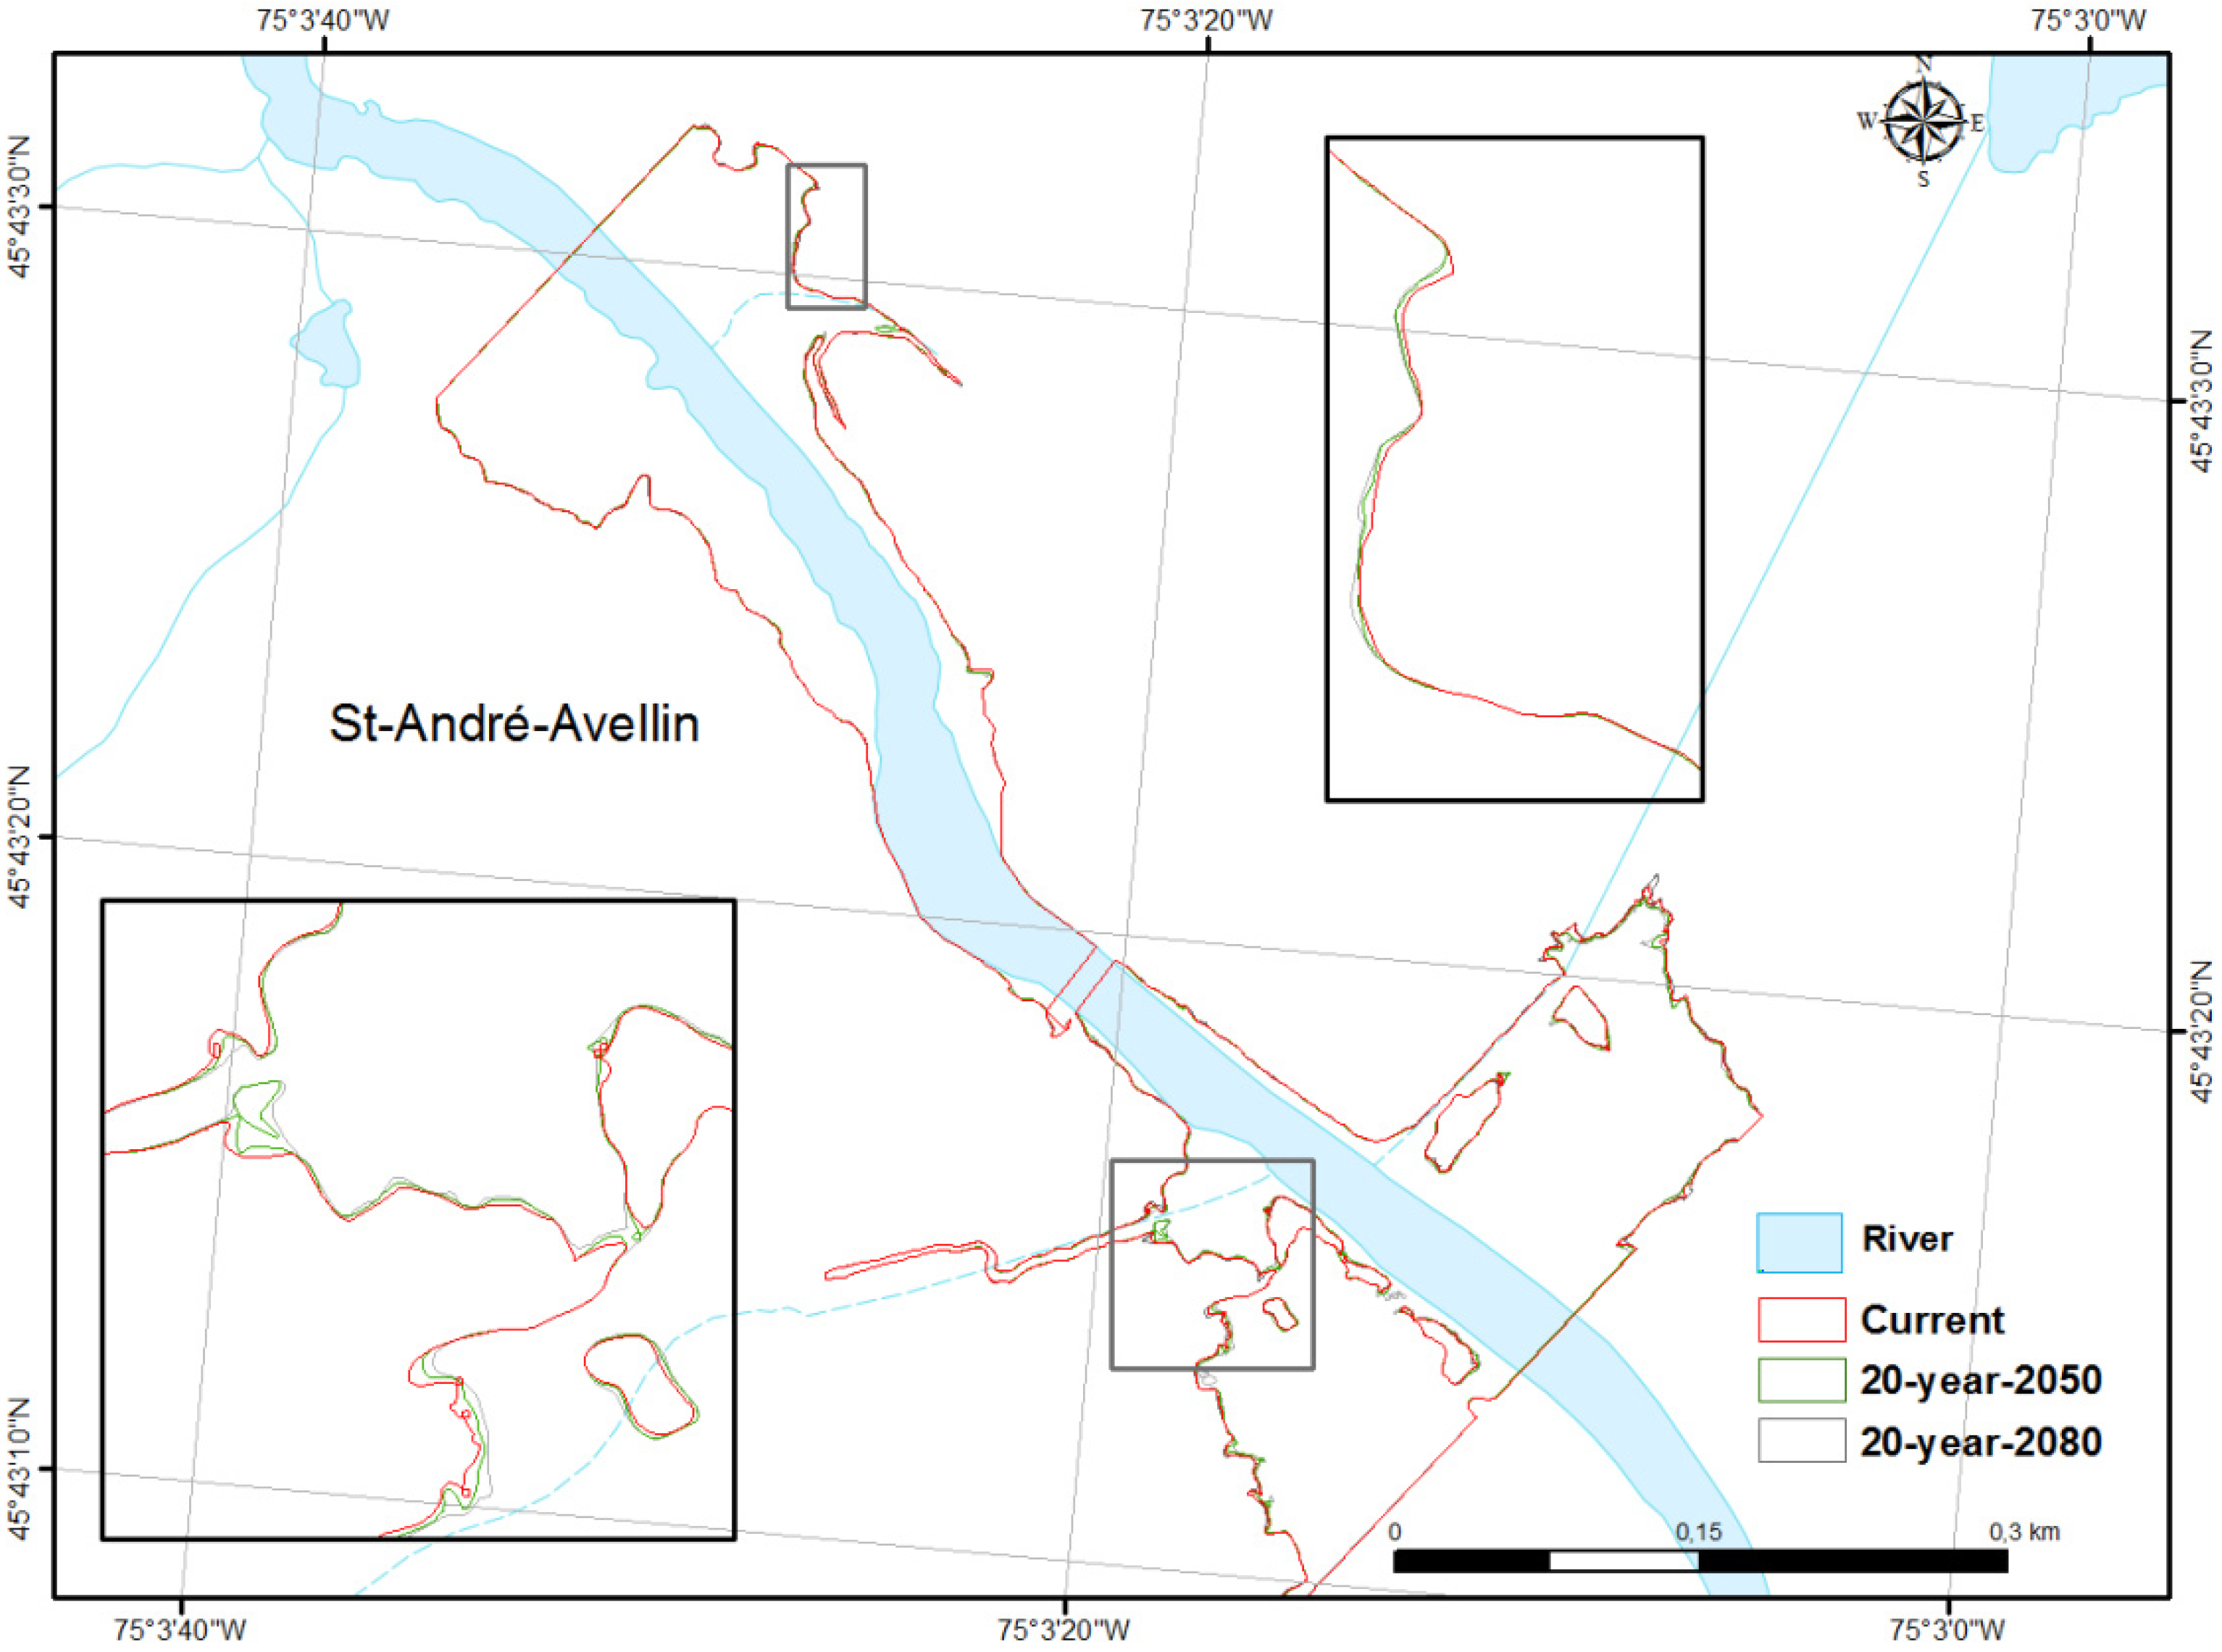
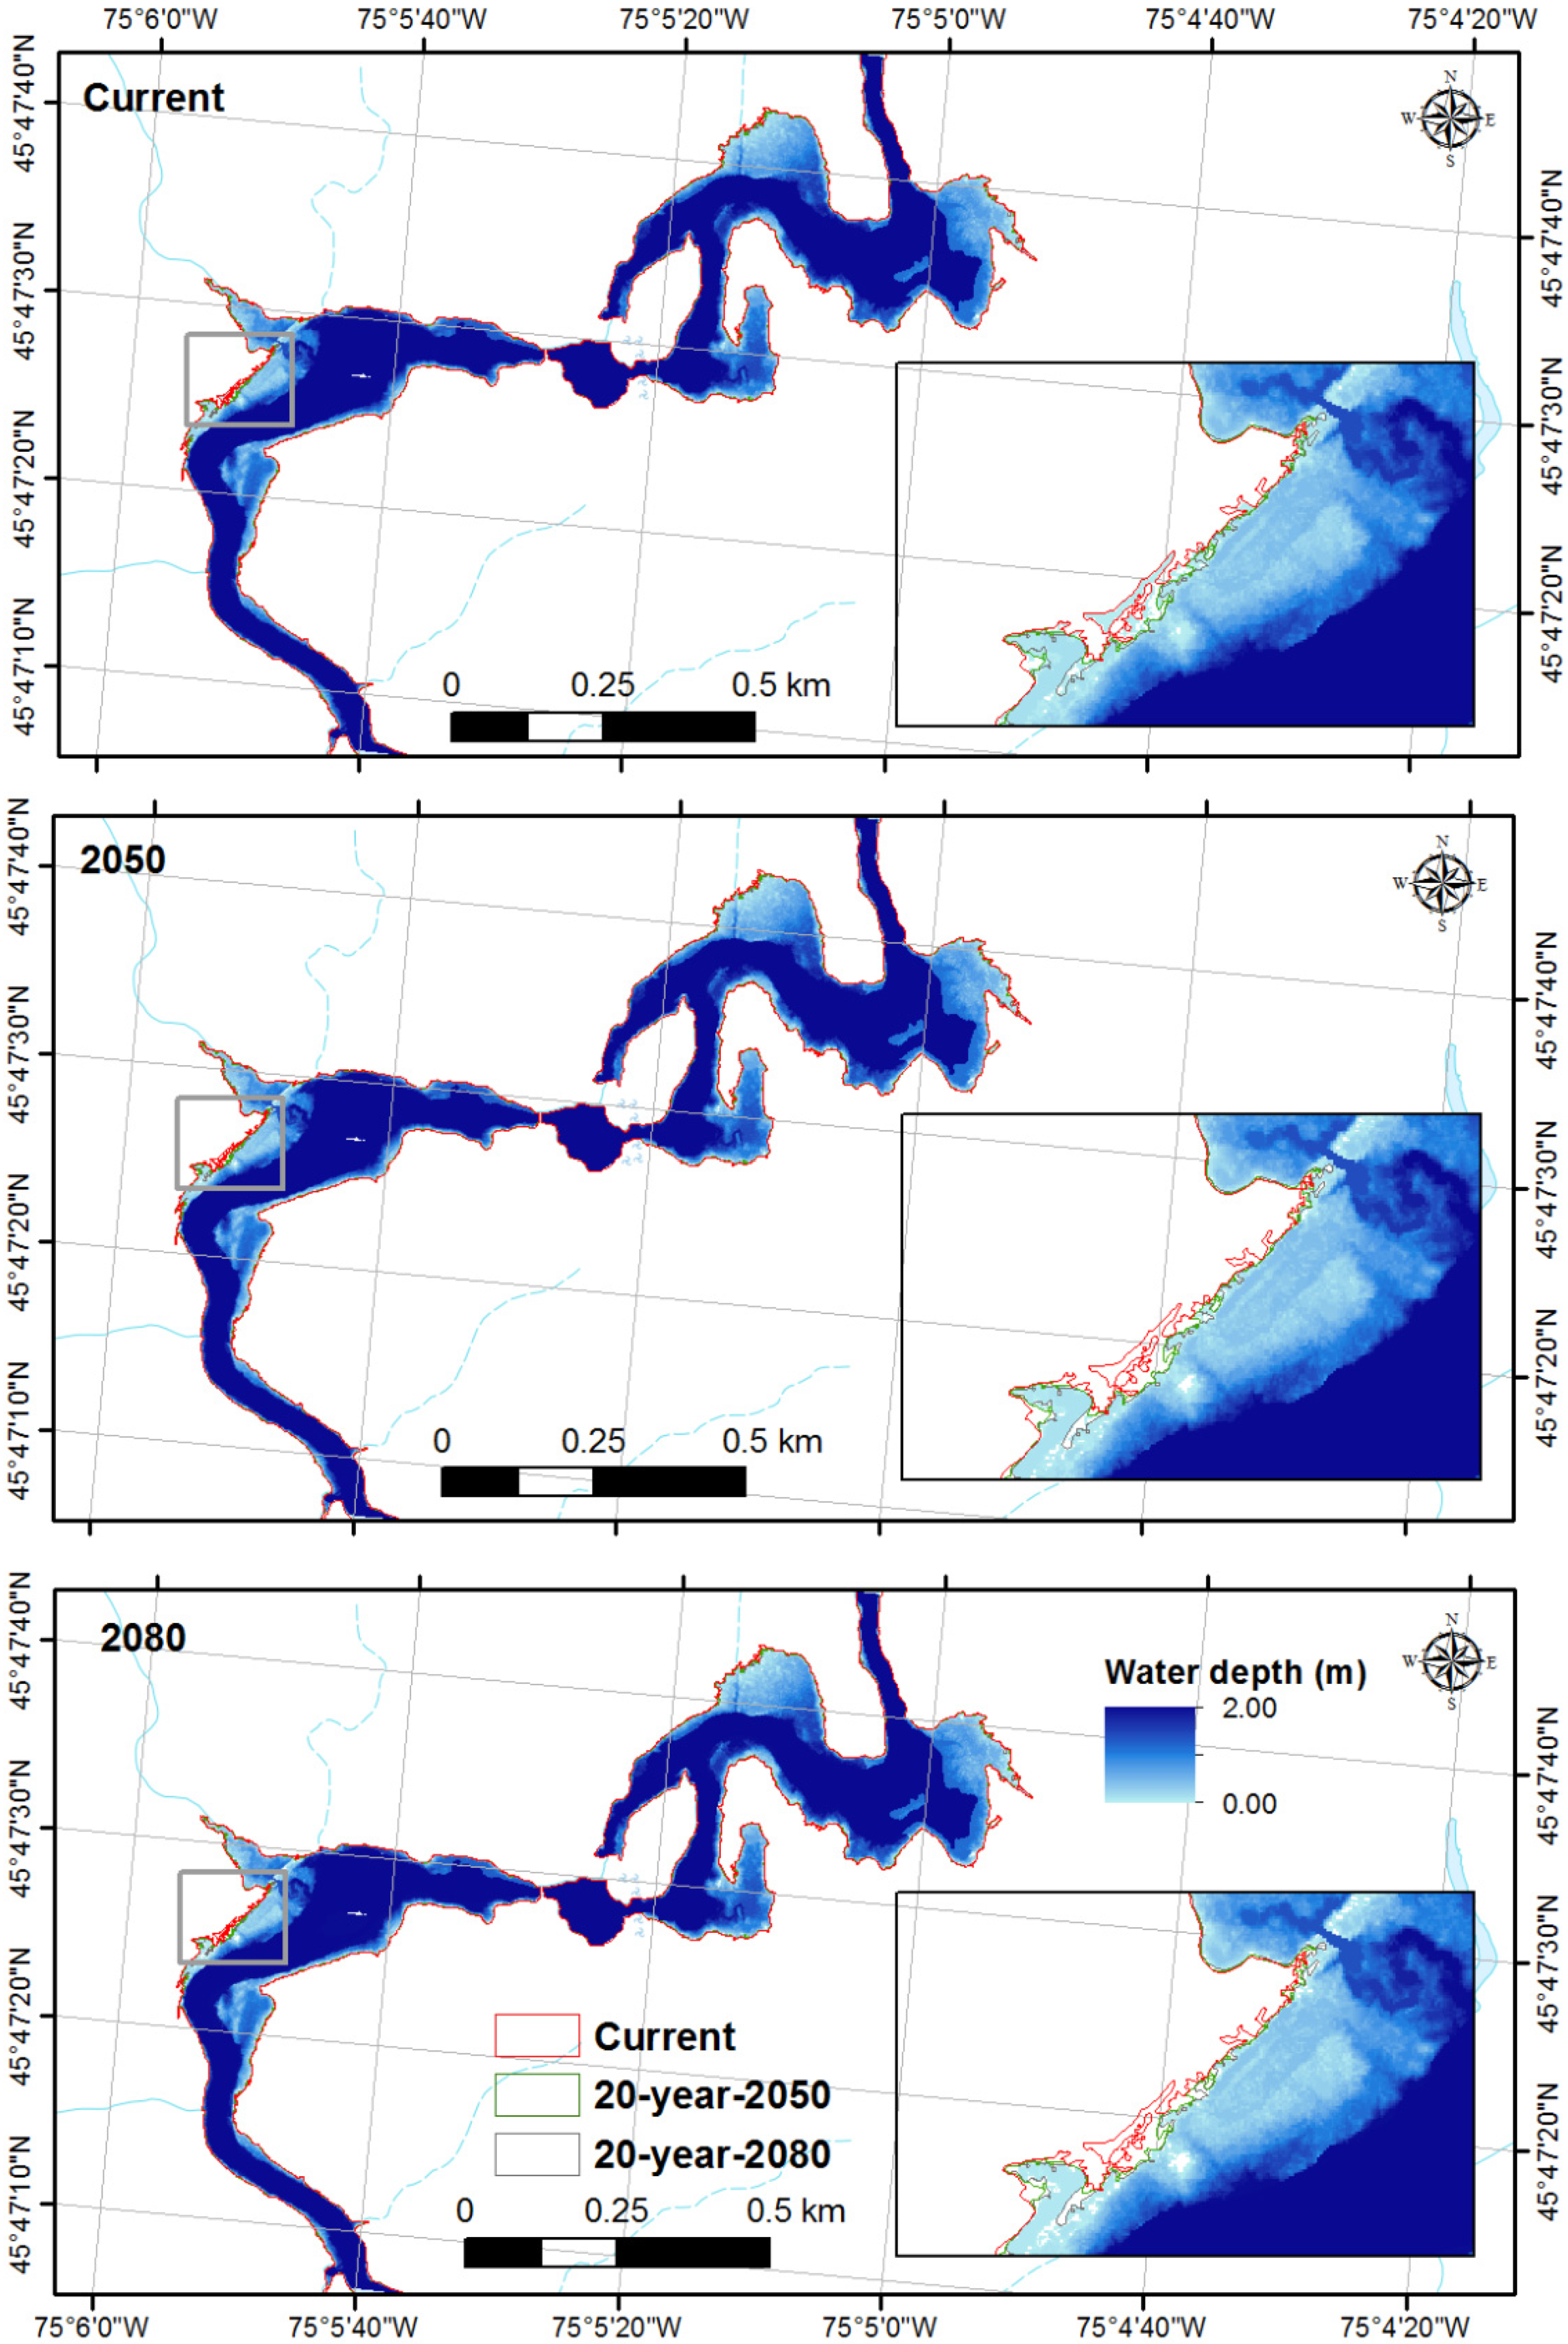
Hydraulic modelling, perform the 20-year and 100-year return flood values from Step 2 into the GARI tool to map flood hazard (depth and water extent). We use the worst climate scenario (RCP 8.5) which presents significant changes in terms of hazard and damage maps, unlike the RCP 4.5 scenario.
Step 4. 
Flood damage, estimate projected monetary damage for the residential buildings from the flood hazard maps provided from the previous step (due to space reasons, the results are only shown for the 20 year period (RCP 8.5)).
Figure 3 provides a visual overview of the methodology adopted in this study. There is a vertical interconnectivity between all the steps in the methodology. Outputs for each step are used as input into the next step. Steps 2, 3, and 4 are the steps that are typically used to assess flood risk, but Step 1 is the additional stages needed to incorporate climate change scenarios into the process. The methodology in this study is specific to the flood hazard, identified as the most critical climate change impact in the Petite Nation River watershed, but the general methodology may also be applied to other hazards (i.e., coastal floods and ice jams). The procedure applied to incorporate future climate change impacts is described in more detail in the following sections.

3.1. Climate Change Projections

Climate modelling provides meteorological data for hydrologic analysis to provide future river flows by reproducing the water cycle’s main components through a numerical representation of the hydrological processes that occur at the watershed level. Climate change projections were selected by the Ouranos (Consortium on regional climatology and adaptation to climate change in the province of Quebec).
The RCP 4.5 (“optimistic”) scenario is a stabilization scenario where total radiative forcing is stabilized before 2100 by employing technologies and strategies to reduce greenhouse gas emissions, while the RCP 8.5 (“pessimistic”) scenario predicts an increase in greenhouse gas emissions. The scenarios were both extracted from the Canadian coupled general climate model (CGCM) defined by the Intergovernmental Panel on Climate Change (IPCC) [32]. These two pathways were used to produce the Hydroclimatic Atlas of Southern Québec [37]. Three time horizons were also considered in the study, i.e., current (baseline), 2050, and 2080; 2050 and 2080 correspond to the mid and far future, respectively. Then, the climate scenario information was transferred to the hydrological model Hydrotel [43], and frequency analysis was performed on the simulated hydrological analysis. The Hydrotel model simulated the following processes at the watershed level, starting with observed precipitation and temperature values: evapotranspiration, snowpack accumulation and melt, surface and subsurface runoff, river discharges. The model was used to simulate the hydrological regime and was supplied with current and future climate projections to generate continuous time series of river flows. The model was calibrated for 50 gauged watersheds which are all located within southern hydrological Québec, an area of some 726,000 km2 that covers the watersheds of St. Lawrence and Ottawa River tributaries and the Petite Nation River. The outputs of the hydrological modelling were used as input for flood hazard mapping.
For each hydrological indicator in the Hydroclimatic Atlas of Southern Québec, the amplitude of change is presented separately for RCP 4.5 and RCP 8.5 under the 2050-time horizon. The amplitude of change corresponds to the median value of the relative changes produced by the different hydroclimatic projections between a future time horizon and the reference period. In Figure 4, the Qmoy hydrological indicator corresponds to the average annual flow. Under the 2050-time horizon, projections describe a probable decrease in Qmoy in the Petite Nation River watershed in the order of −6% to −2% (RCP 4.5). This decrease is closely related to the temperature and precipitation regimes interacting to generate the spring flood. In addition, we found in the Hydroclimatic Atlas that there is a general decrease in summer and autumn (June–October) flows forecasted and an increase in the winter flows for both time horizons. For the RCP 8.5, there is a very slightly decrease in Qmoy, in the order of −2% to −2%.

3.2. Projected Flood Frequency

Flood return periods are typically estimated from a flood frequency analysis. The objective of flood frequency is to relate the magnitude of extreme events to their frequency of occurrence. In this study, the frequency analyses are used as input into the flood mapping module in the GARI model to calculate the extent and depth of flood inundation for a specific location along the river reach.
First, a frequency analysis was carried out on the maximum annual discharges from the average daily flow measured at the hydrometric station located in Ripon 040406 (available from 1969 to 2020) to retrieve the flow estimates for various return periods. We tested three distributions commonly used in hydrology (i.e., generalized extreme values (GEV), lognormal, and gamma [44]) with non-stationary trends linked to climate change. From these three distributions, four types of non-stationary trends were tested. These types are: T0, which corresponds to a stationary distribution; T1 which corresponds to a distribution with a linear non-stationary trend related to the expected value (location parameter for the GEV distribution); T2, which corresponds to a distribution with linear non-stationary trends related to the expected value and standard deviation (location and scale parameters for GEV distribution); and T3, which corresponds to a distribution with linear non-stationary trends related to scale, location, and shape parameters (for GEV only). Parameters were estimated with the maximum likelihood estimation method. The accuracy of distribution was evaluated using the Bayesian information criterion [45]. A nonparametric bootstrap was applied to generate a distribution of 10,000 flows for each recurrence.
Secondly, the projected river flows for the periods 2050 and 2080 were also considered in the GARI tool to simulate projected future hazard maps. They were estimated using data from the Hydroclimatic Atlas of Southern Quebec. These projections are produced by the Hydrotel model.
The projected future flows use relative values of the rate of change. Then, flows over future time horizons (Qfuture) are calculated according to the equations:
Q future Q ref · Δ Q Atlas ,
Δ Q Atlas = Q Atlas _ future Q Atlas _ ref Q Atlas _ ref ,
where Q Atlas is the relative value of change available in the Hydroclimatic Atlas and Q ref is the reference flow calculated with the frequency analysis.

3.3. Flood Hazard Mapping

Flood inundation areas were computed using the GARI tool’s dynamic flood mapping module. This component is based on the CADYRI model [46]. CADYRI has been developed at the INRS-ETE for mapping flood risk in urban areas. This model can simulate the associated water level for a given discharge and subsequently determine the extent of the flooded area and the submersion heights at each point of the flooded area, using a DEM. The module is based on a simple regression model based on the water level-discharge function at each point of the domain.
The hydraulic analysis starts by importing the results of hydraulics simulations generated by the program (“Programme de détermination des cotes de crues”) set forth by DEHA to determine the flood stage. These simulations were derived with the HEC-RAS program [47]. The second step is to generate a water surface for each cell of the study area using the interpolation technique. After completion of these steps, the regression calculation is performed for each cell common to all water surface by using the stage–discharge relationships H = aQB [48] (where H is the water surface elevation at the cell position (in meters); Q is the discharge; and a, b are estimated regression parameters estimated for each grid cell). These steps are formed of two matrices containing the a and b parameters for each cell of the domain. More details about the CADYRI software operation can be found in Tanguy [49].
Lastly, the hydraulic analysis was performed using the geometric data (boundaries), DEM, and flow data issued from the flood frequency analysis. The flow data correspond to projected 20 and 100 year periods (2050 and 2080). Water surface profiles are generated within the boundaries of the municipalities of Ripon and St-Andre-Avellin. Each cell’s elevation is subtracted from the water level surface to give an inundation depth per grid cell. Finally, floodplain mapping is performed within the bounding polygon limits using the water surface elevations generated by the GARI model. In this way, calculating a flood event and visualization of inundation depths take only a few minutes as compared with several hours for the two-dimensional (2D) model using a powerful computer.

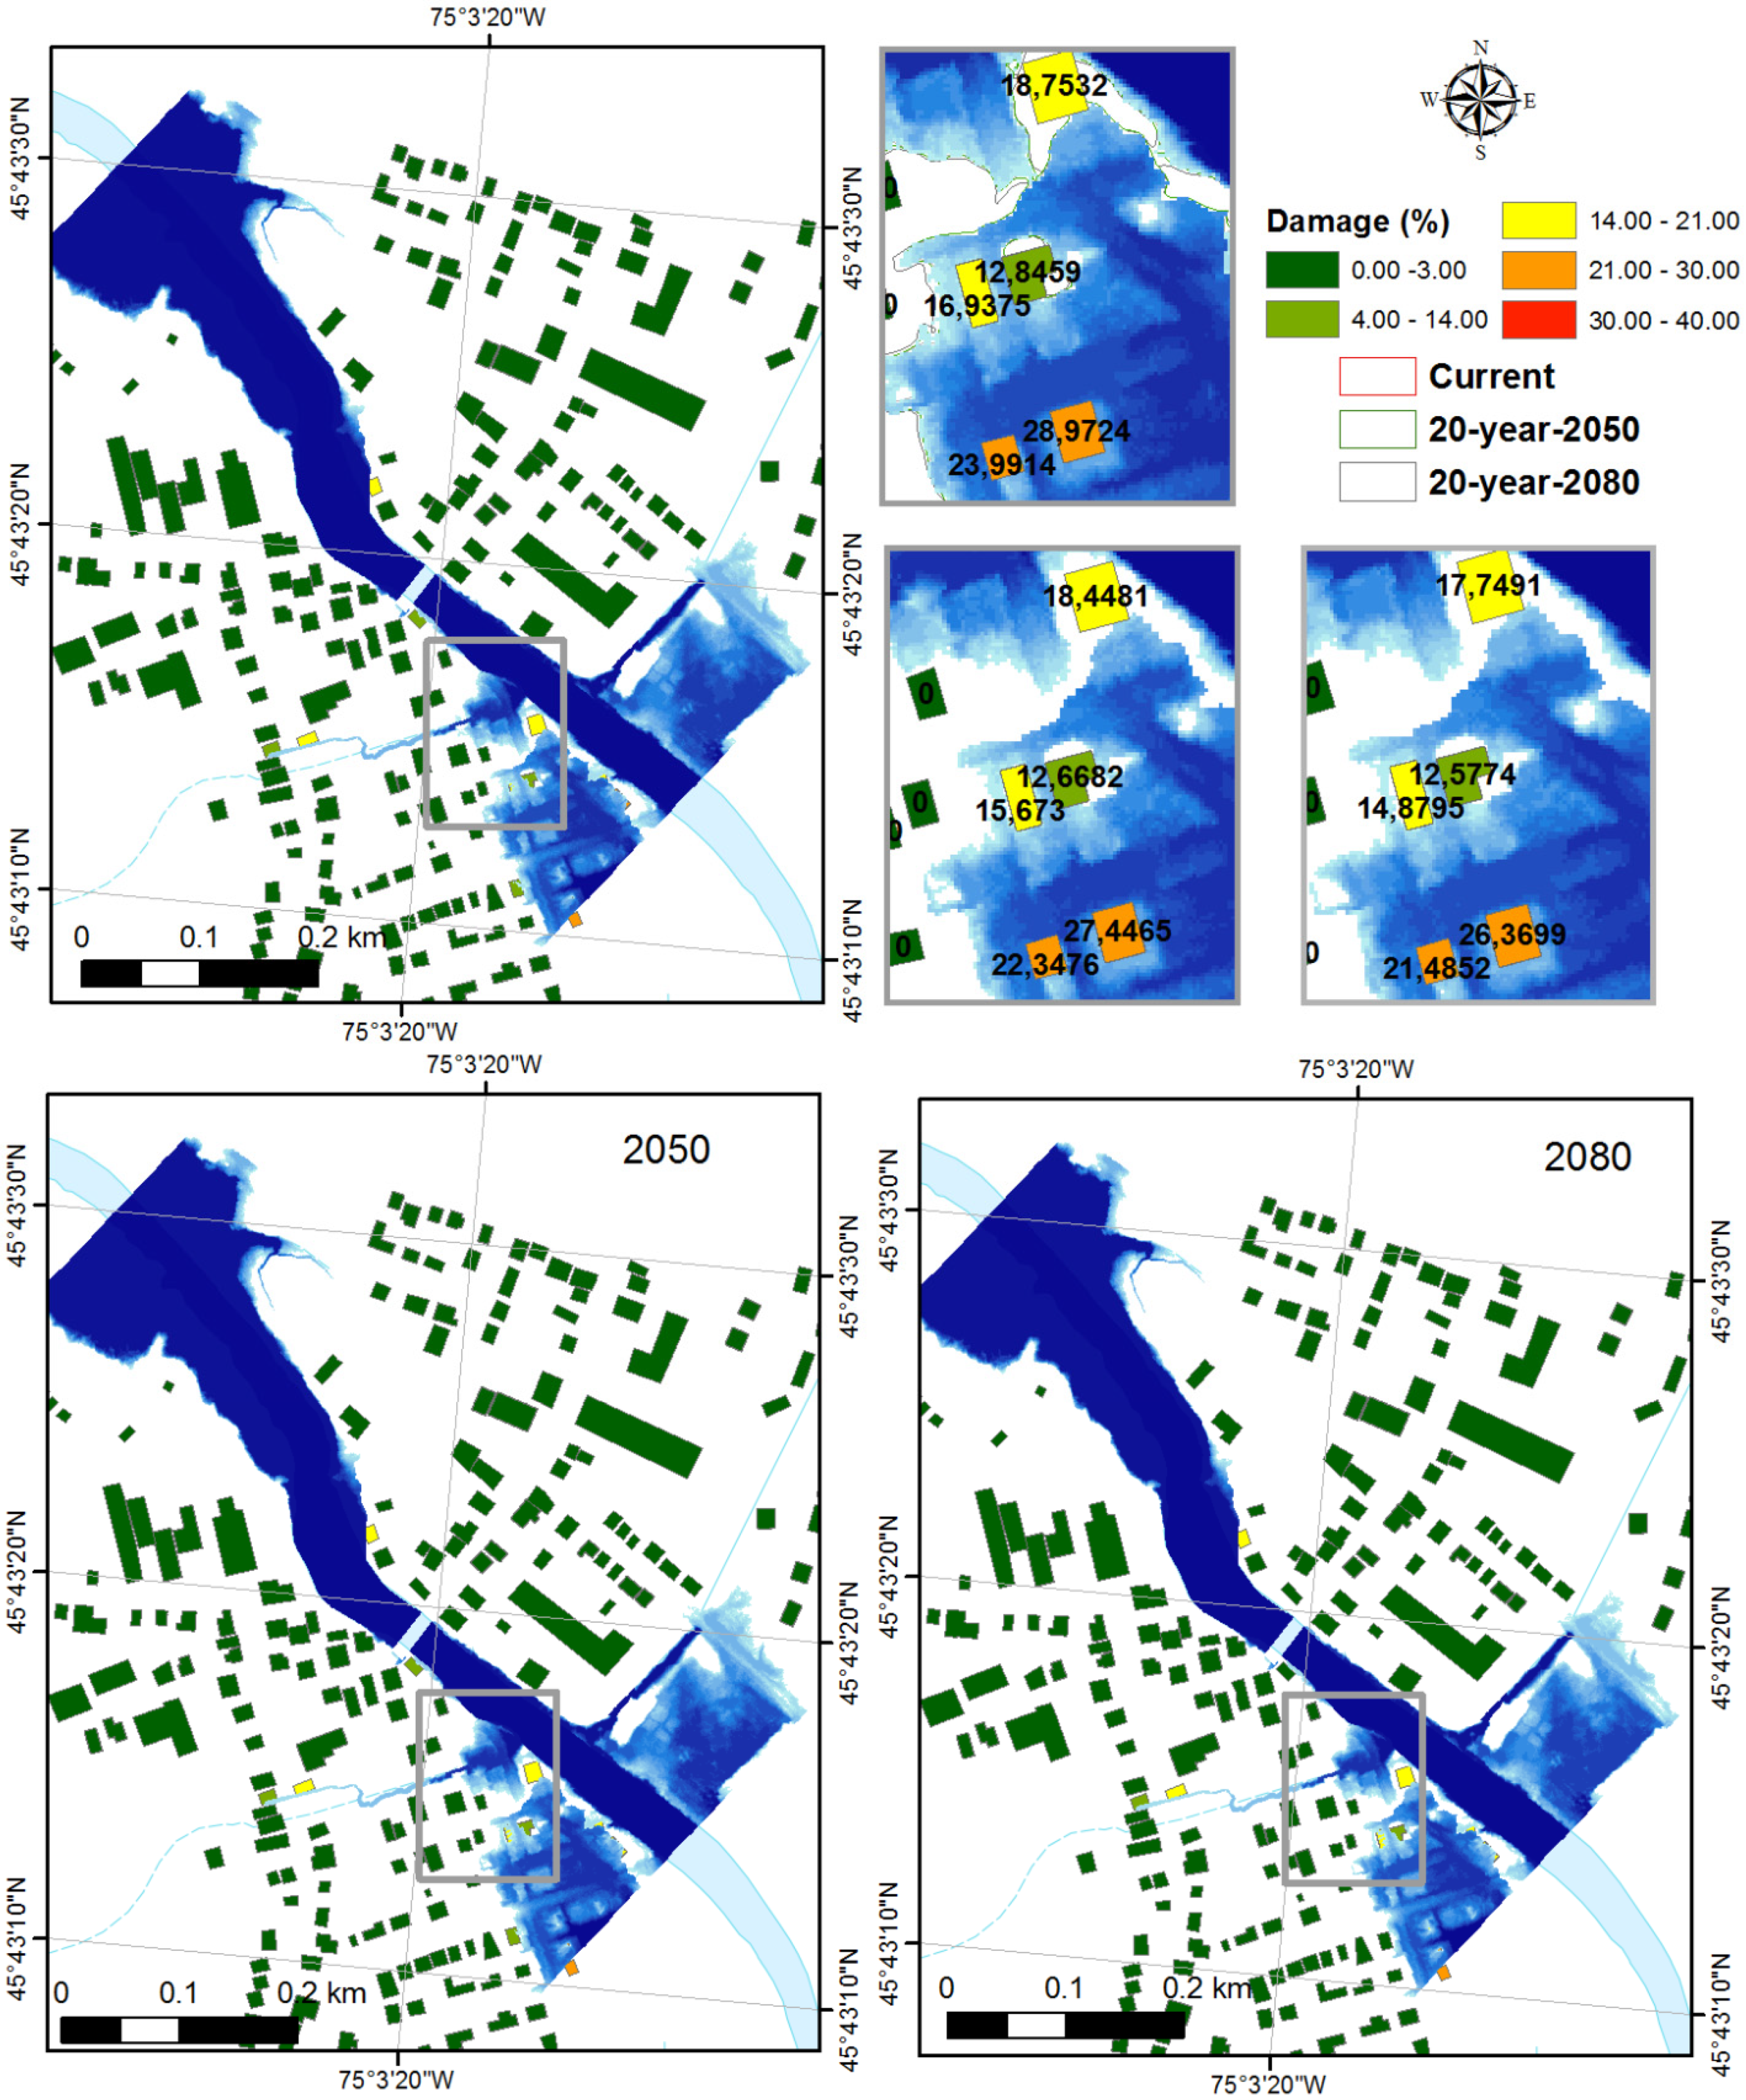
3.4. Flood Damage Assessment

Flood damage is carried out according to different structural characteristics (i.e., the number of floors, presence or absence of a basement, the elevation of the first floor, etc.). It refers to the potential monetary damage incurred by a building as a result of a flood event. This information can be provided as a map of each residential building’s vulnerability levels in the area and under the form of the individual report describing a building’s characteristics that justify the level of vulnerability estimated.
We estimated building damage using the module “damages to buildings and infrastructure” of the GARI tool. This module provides estimates of the potential damages (expressed in dollars) associated with a flooding event for each residential building. Potential damages are estimated as a function of the building’s characteristics, its value, and water heights in this building during the event. They are estimated using water depth–damage curves, specifically adapted to residential buildings’ characteristics in the province of Quebec. Four different depth–damage curves are used herein by the type of buildings in the study area. These functions are derived from [50] based on empirical data from flood observations. Each depth–damage curve describes the percent loss as a function of depth.
The depth–damage functions are categorized based on the number of stories in the residential building and the presence/absence of a basement. These curves include only damage to the building structure, excluding damage to furniture and property within the residence. In addition, they use the first-floor level as the zero-height point rather than the ground level. The depth–damage curves are combined with the resulting inundation depths at each building’s location to determine the damage ratios (relative function) for given inundation scenarios. Each ratio is multiplied by the property value assigned to each building to derive the absolute damage. The total damage of a given scenario is the sum of the damage of all grid cells.

4. Results and Discussion

This methodology’s implementation, first, offers the projected flood frequency at the 2050- and 2080-time horizons. The second set of results provides insight into projected flood hazard maps. The final set of results provides insight into the monetary damage.

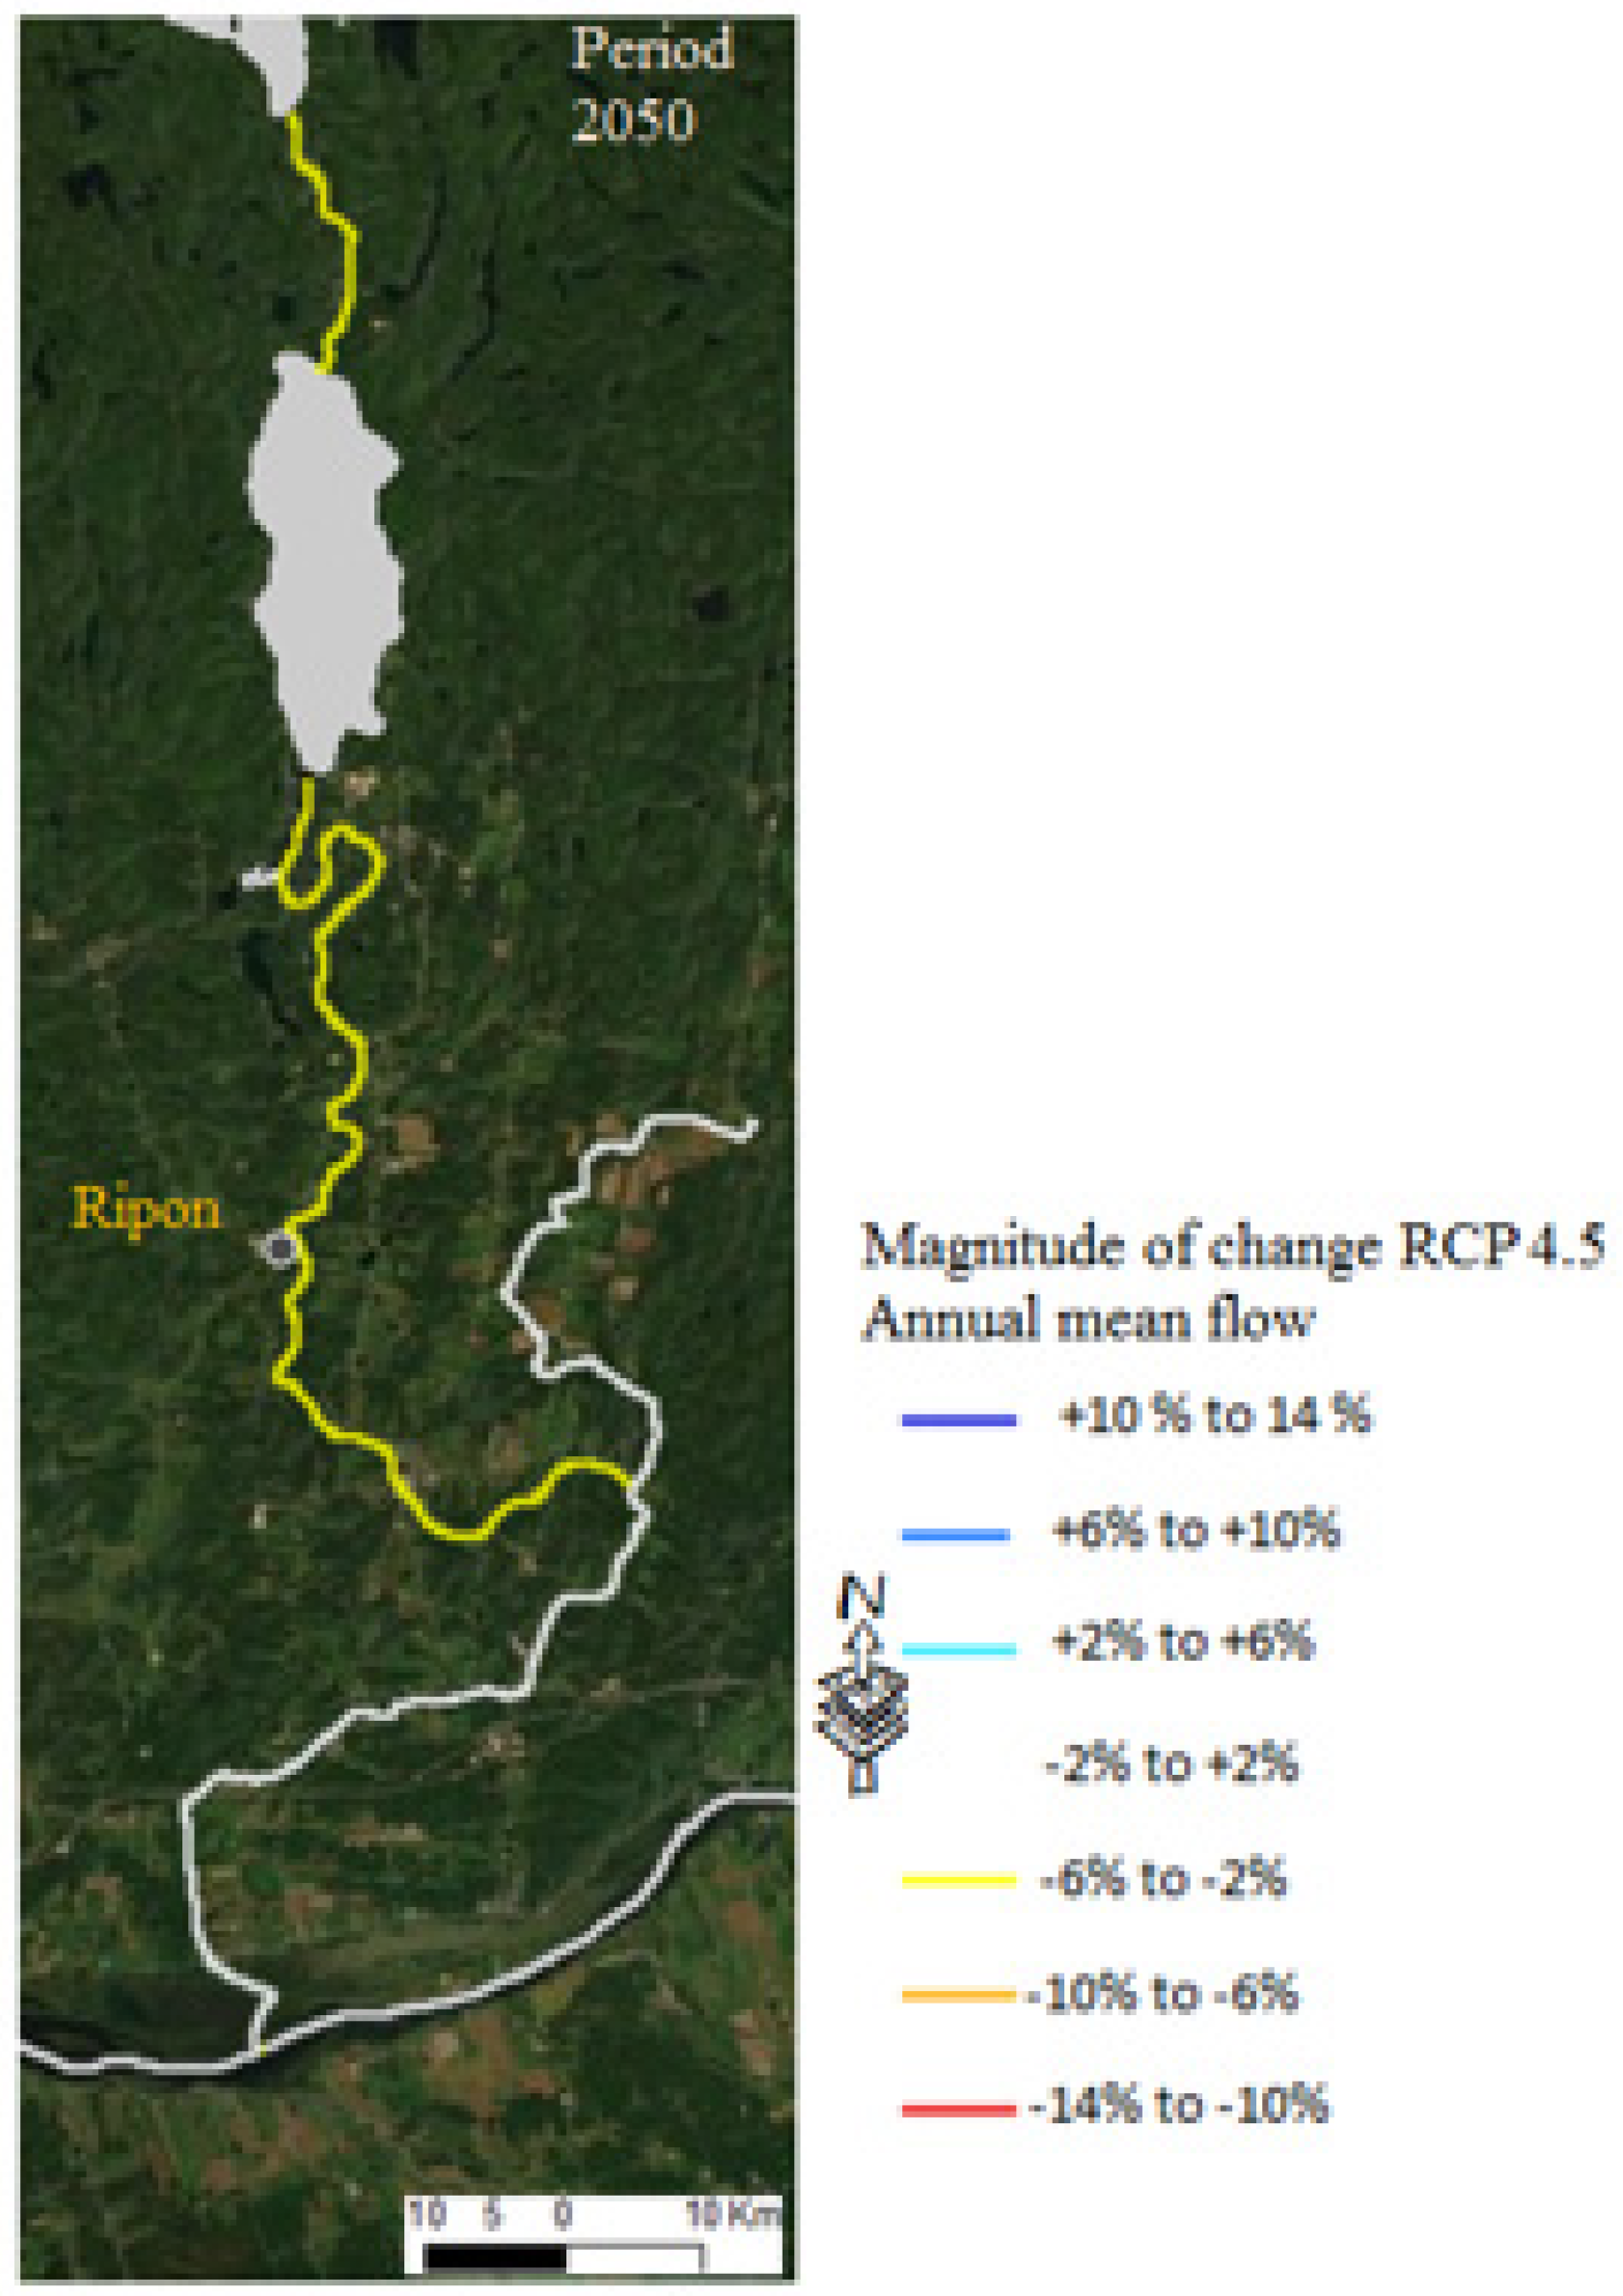
4.1. Projected Change in Flood Frequency

Figure 5 shows the flood frequency results at the hydrometric Station 040406 for different returns periods (2, 20, and 100 years). The median indicates the flow values for the return periods. The flow values for the other sectors of the river are estimated by the watershed transfer technique used by the DEHA based on the transfer of the basins’ surface areas. The use of this method assumes a homogeneity of the two watersheds at the morphological (relief, slope, shape, etc.), hydrological (drainage density, hydrographic density, confluence ratio, etc.), and physiographic (land use, soil types, etc.) levels. The Petite-Nation River does not receive any significant inflow in the study area, according to the study by Mailhot, Talbot [51].
Table 1 summarizes the projected peak future flows for 2-, 20-, and 100-year return periods obtained from baseline, 2050, and 2080, under the RCP 4.5 and RCP 8.5 scenarios. It should be noted that the projected flows are expressed in annual values, and the baseline flow values are the results from the frequency analysis presented previously.
The results indicate that flooding frequencies of historical 2-, 20- and 100-year return periods decrease slightly for the periods 2050 and 2080 under RCP 4.5 and RCP 8.5. In addition, these projections of return period changes differ considerably between different RCPs. The highest relative decrease was observed under RCP 8.5 in 2080, whereas the lowest relative change was observed under RCP 4.5 in 2050.

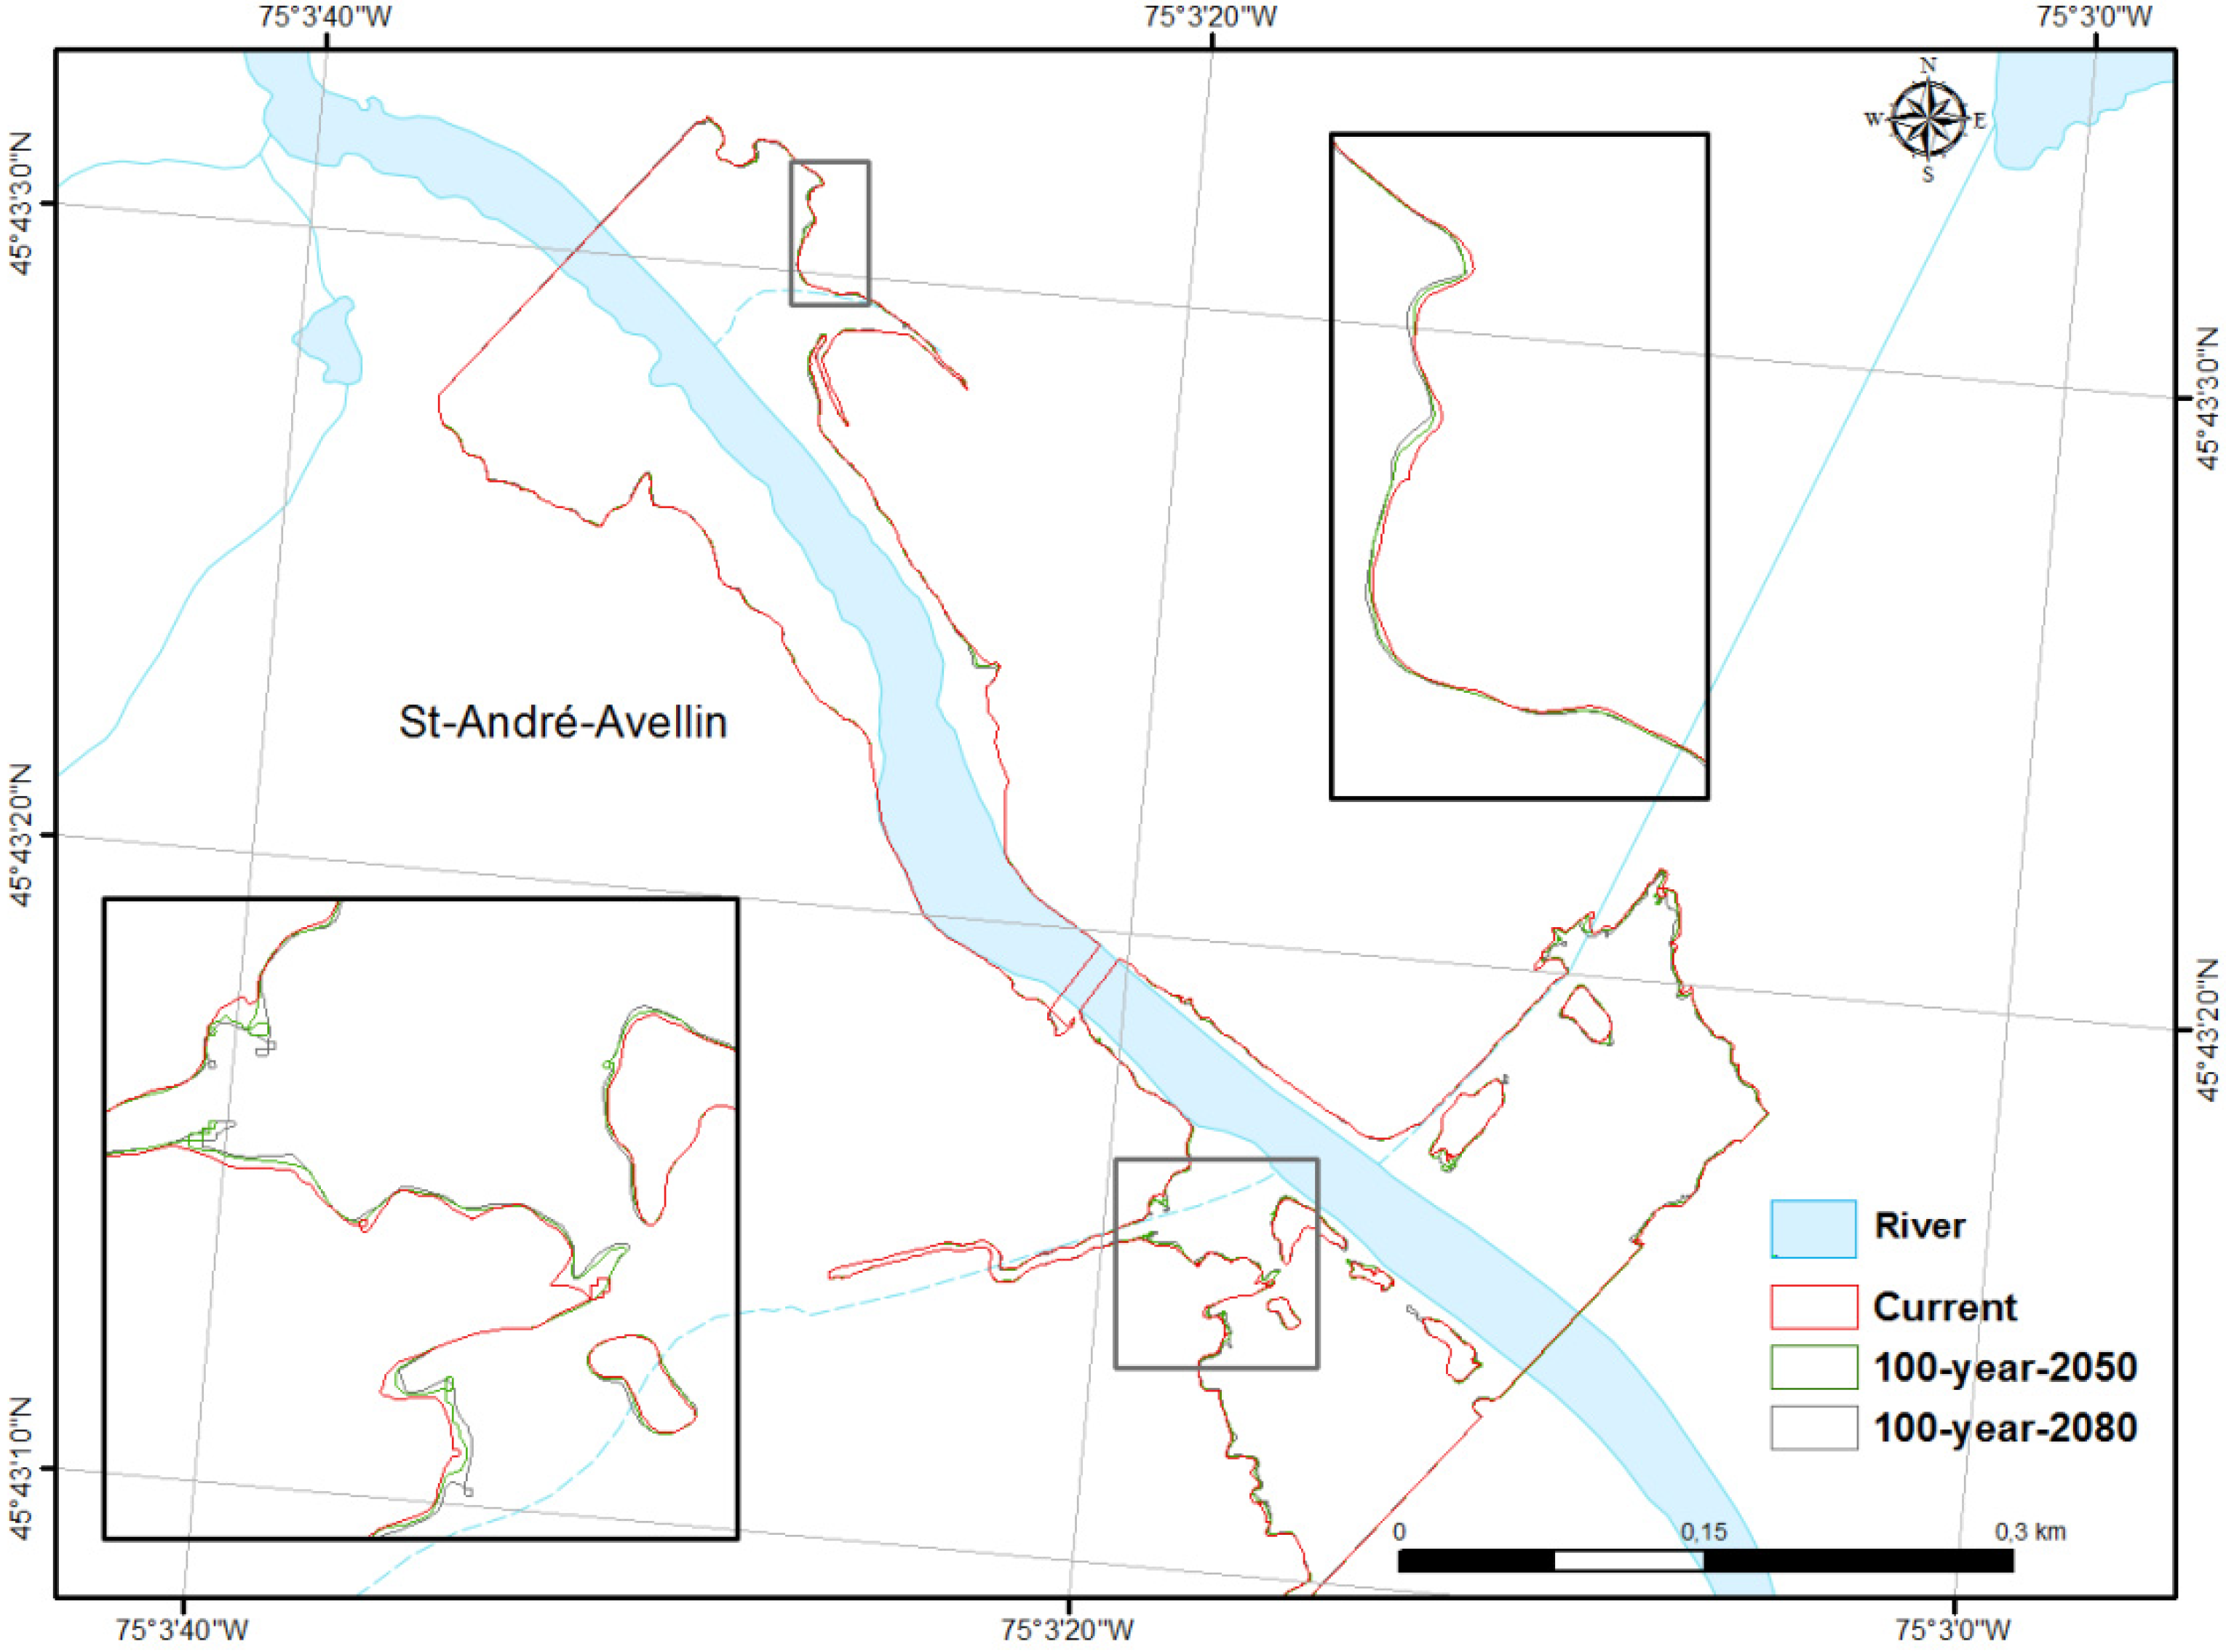
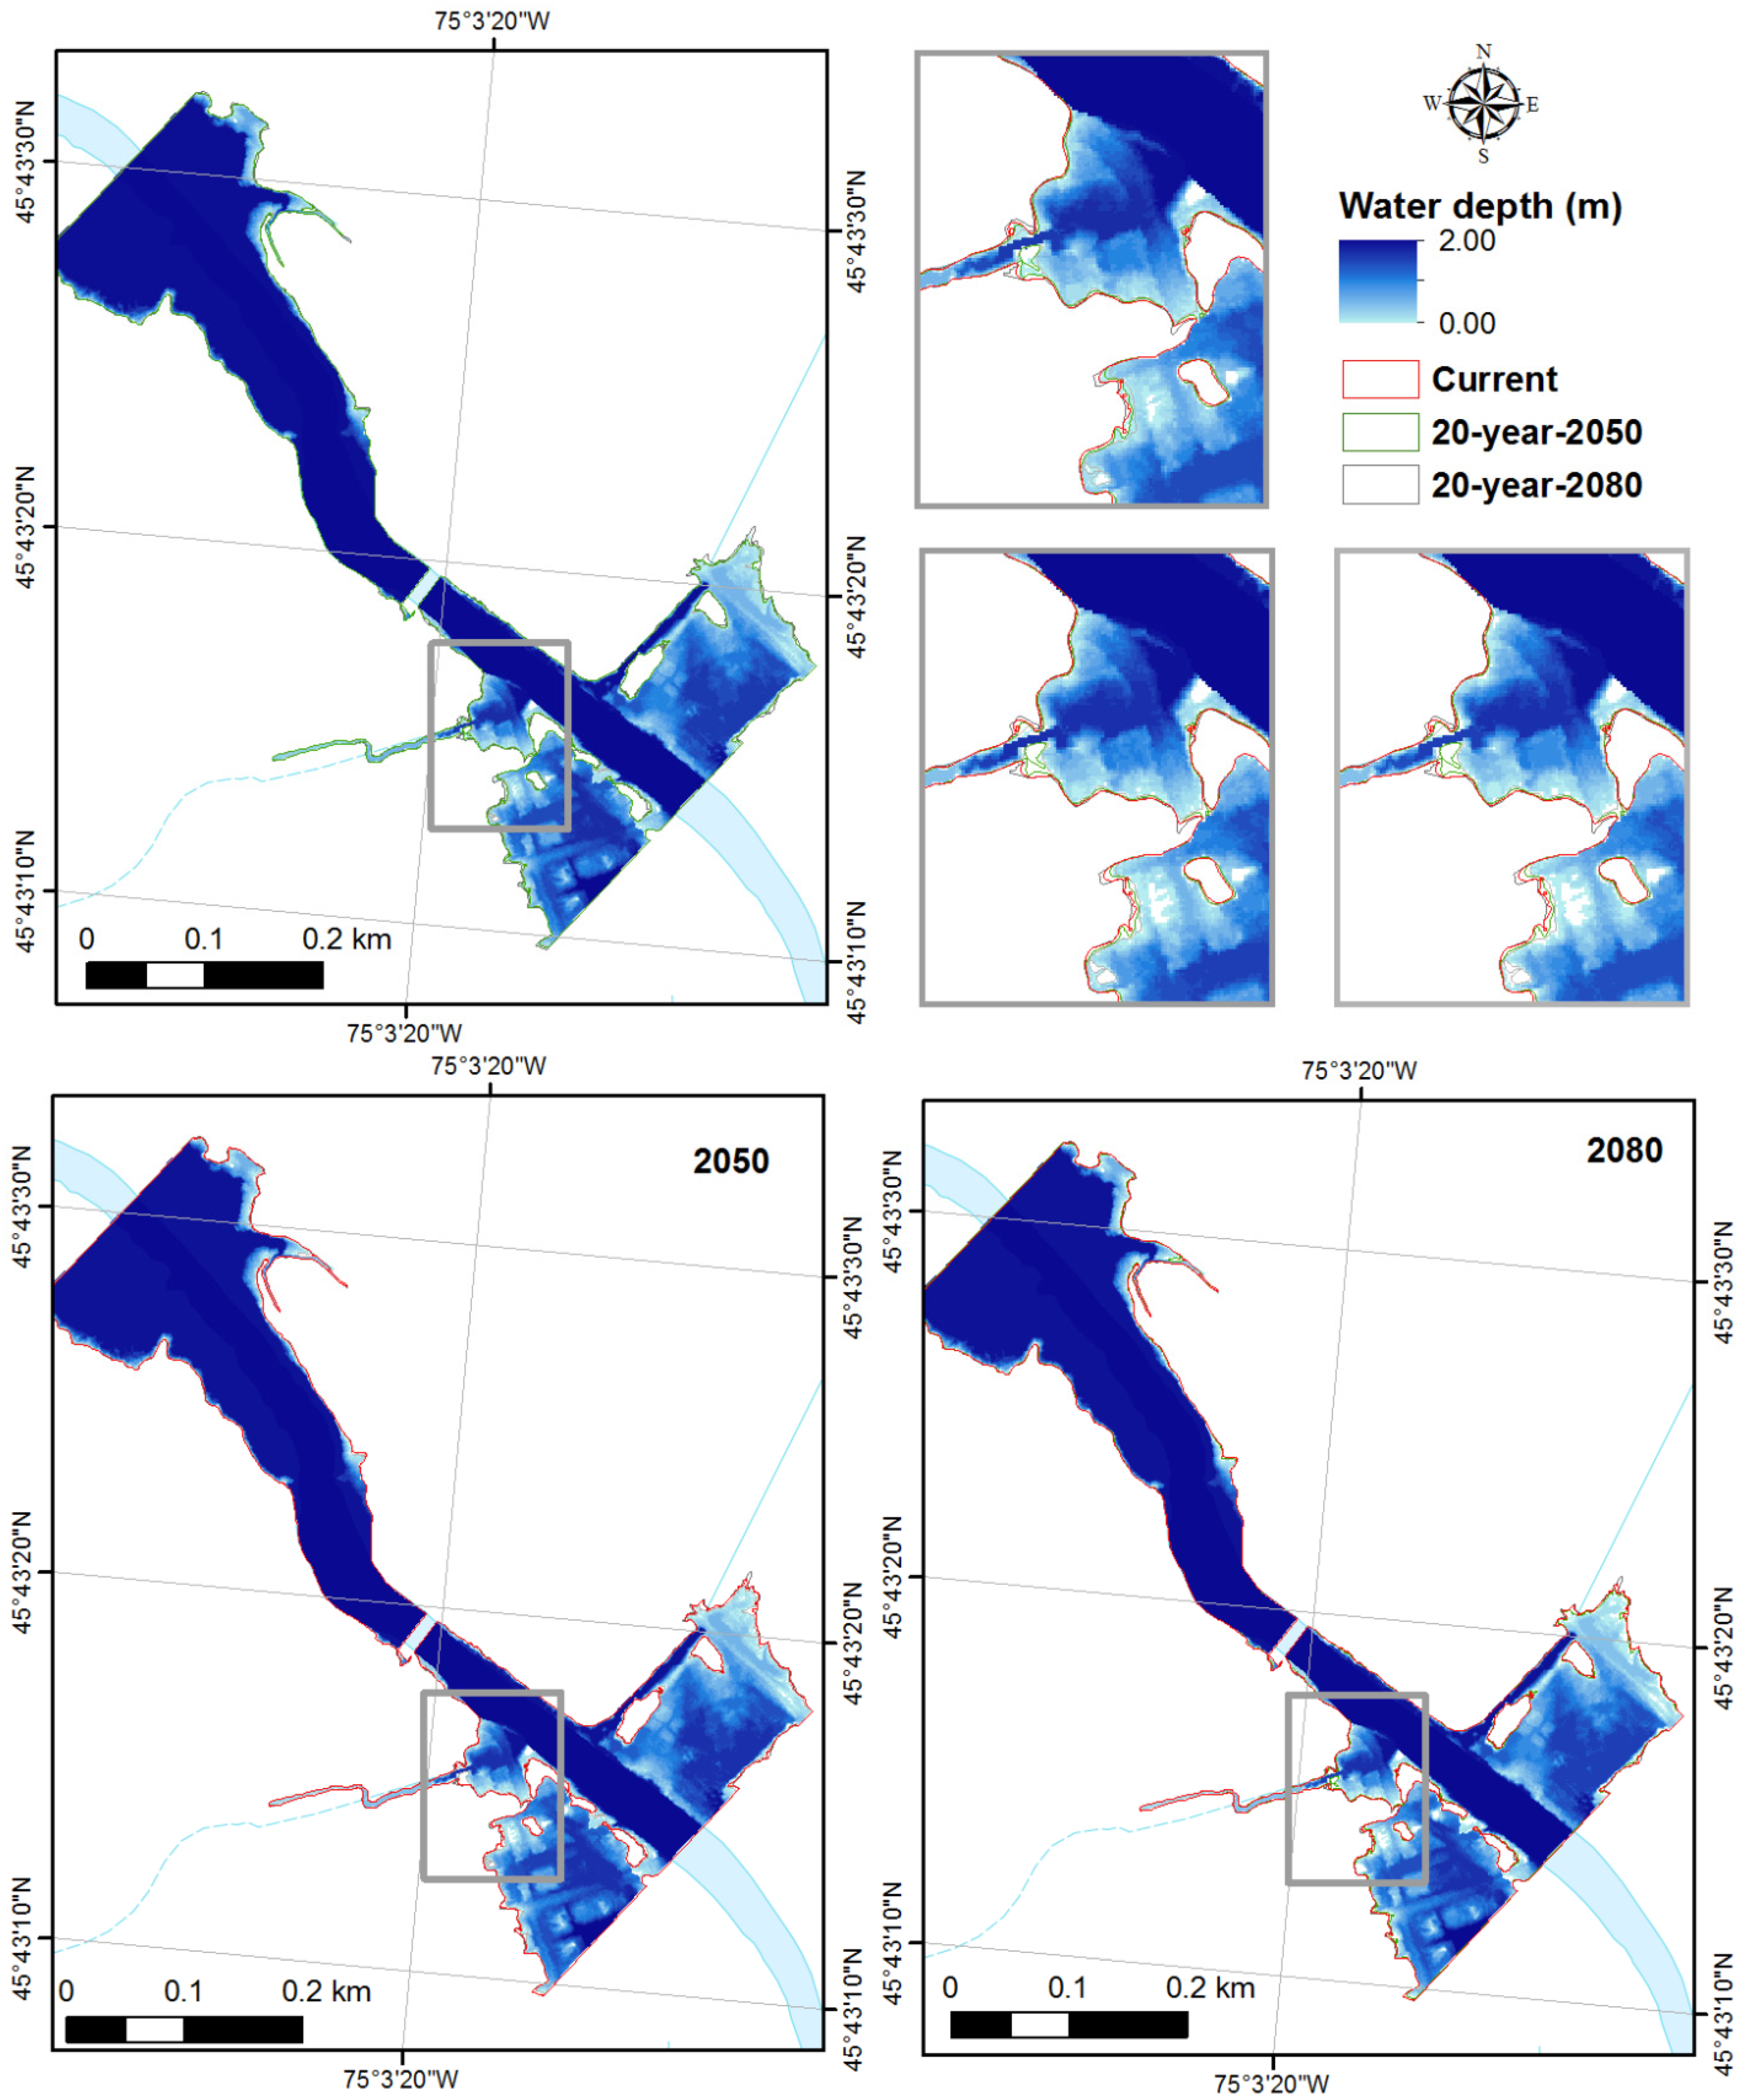
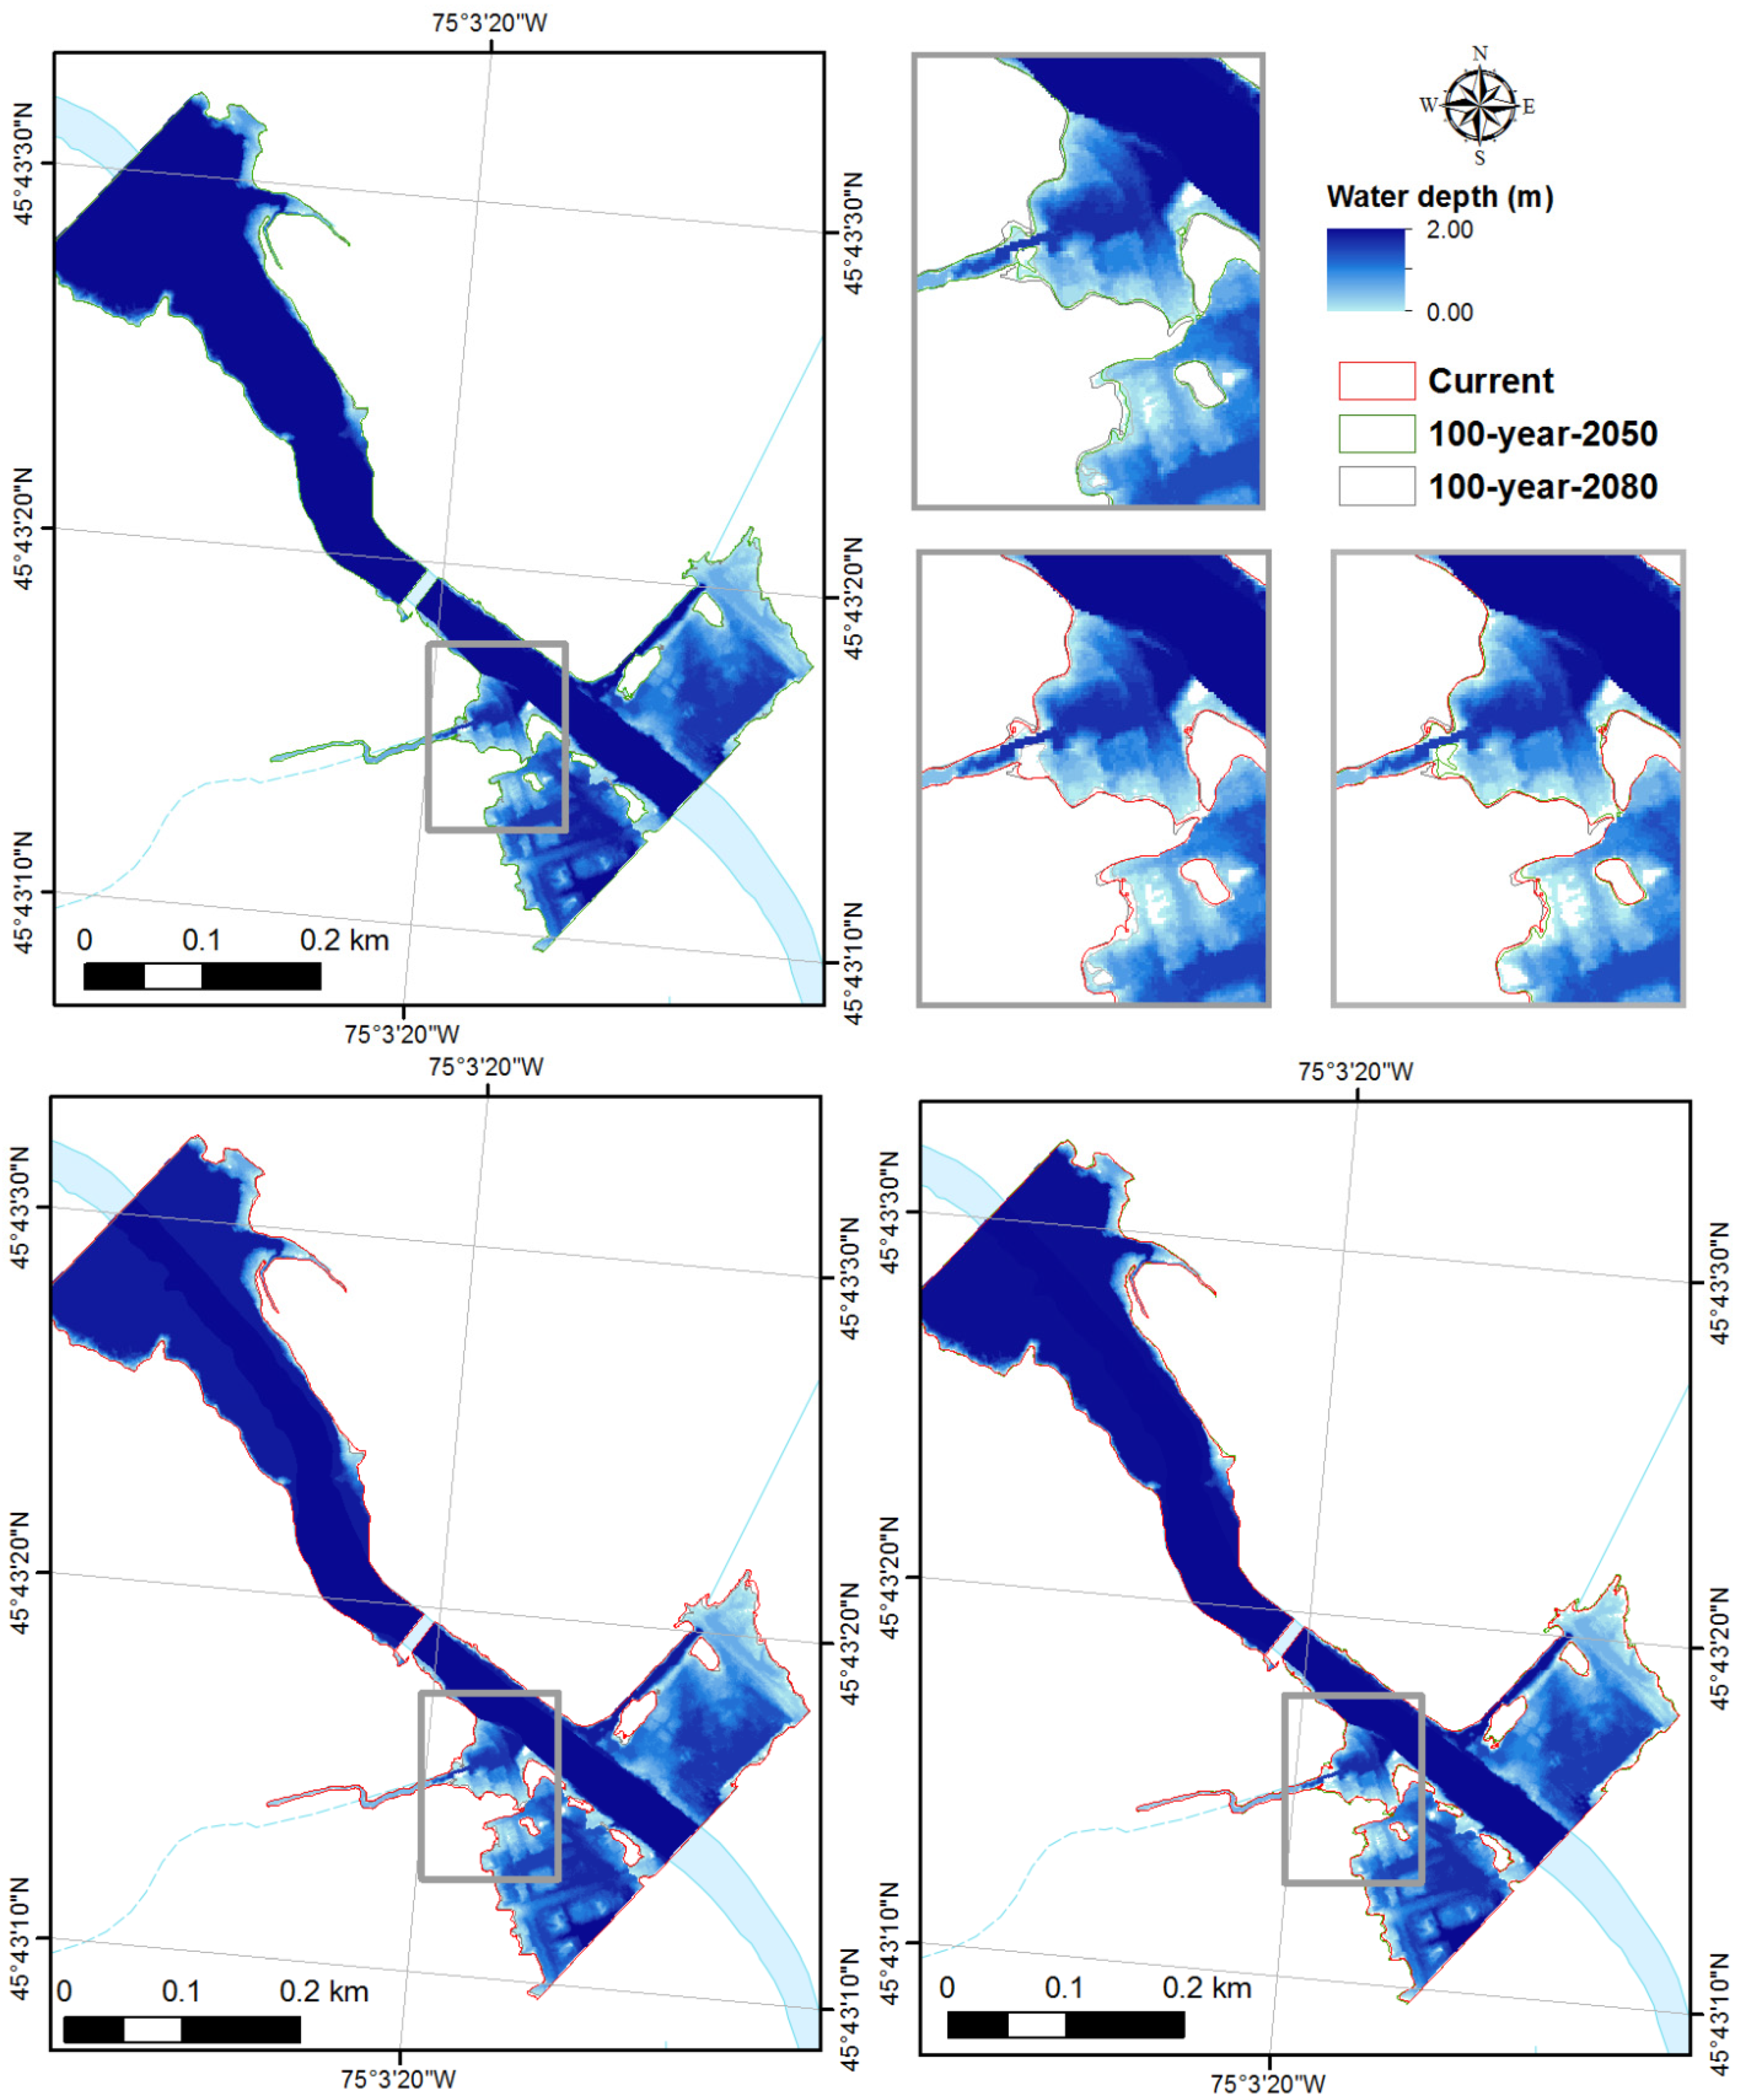
4.2. Projected Change in Floodplain Mapping

The flood simulation was carried out in the present and future scenarios (2050 and 2080) with respect to the RCP 8.5 scenario. In the Appendix A, Figure A1, Figure A2, Figure A3 and Figure A4 show the comparison of floodplain extent with 20 and 100 year period simulated floods for the municipalities, St-Andre-Avellin and Ripon, under current and future time horizons, assuming that there are no improvements or modifications to the existing flood protection network. Similarly, Appendix A Figure A5, Figure A6, Figure A7 and Figure A8 show the comparison of projected flood depth with the same time horizons and return periods.
The results of the Appendix A Figure A1, Figure A2, Figure A3 and Figure A4 show that Ripon and St-Andre-Avellin are projected with a relatively minor decrease in the extent of inundation areas as compared with present conditions for all return periods. For St-Andre-Avellin, the flooded areas range from 90,114 m2 (current) to 88,300 m2 (2080), and from 92,394 km2 (current) to 90,568 m2 (2080) for 20- and 100-year return periods, respectively. Table 2 summarizes the total areas of inundation for the two municipalities under both time horizons.
Similarly, climate change will decrease the depth of inundation following the Appendix A Figure A5, Figure A6, Figure A7 and Figure A8. According to these figures, the spatial coverage of flood depth is observed to be maximum under the present climate scenario for both return periods (20 and 100 years), and decrease, respectively, for the 2050- and 2080-time horizons. The decrease in floodplain depth and extent is relatively limited to the flat topography of the Petite Nation River watershed floodplain and a decreasing trend mainly due to a decrease in projected flood frequency (Section 3.1). The Petite Nation River valley offers an undulating relief dotted with mounds and hills. In the northern part, the topography is characterized by low hills originating from the Laurentian massif [52].

4.3. Flood Damage Projections

By combining the change in frequency analysis of flooding with associated inundated depth maps and the damage curves of the residential buildings, we generated a projected change in flood damages, expressed in percentage according to the property’s value. The projected flood damage changes associated with 20-year return periods are summarized in Appendix A Figure A9 and Figure A10 for Ripon and St-Andre-Avellin. The obtained results are presented in the form of a map of flood damage at the building scale. We assume no change in the built assets or flood protection within mapped floodplains. On average, the estimated flood damage for residential buildings in both scenarios varies from zero to more than hundreds of thousands of dollars per building. The total damage for a flood event is computed by summing the damages for all buildings in the study area. The statistics of damage results are summarized in Table 3. For Ripon, the estimated damage ranges from 0.75% (current) to 0.68% (2080), and from 0.93% (current) to 0.79% (2080) for the 20- and 100-year return periods, respectively. It is obtained that the estimated flood damages decrease from the current horizon to the 2050-time horizon for both municipalities. The decreasing flood damages projected for Ripon and St-Andre-Avellin are consistent with the decrease in modelled changes in flood hazard maps, combined with the decrease in projected changes in flood frequency.
Our results illustrate that the projected flood damage estimate will decrease in the future. On the one hand, the overall damages will depend on how we alter our emissions and how we adapt to changing risks of future flooding, future demographic, and infrastructure change. On the other hand, flood damage estimates contain uncertainties related to the damage model’s choice and the simulation of inundation depth. The uncertainty propagation to the absolute damage estimates can, therefore, be considerable. For lower discharge flood events that only affect a few houses, the damage estimate for the individual house can differ significantly from the “average damage”, and therefore involve considerable uncertainty. For larger flood events that affect many houses, deviations from the mean damage likely cancel out. In other words, for large floods, this type of uncertainty has less importance.

4.4. Limitations and Recommendations

The present analysis is subject to several limitations as the uncertainties considered herein are far from exhaustive. First, the underlying projections of climate change are subject to large uncertainties. Examples of uncertainties include actual greenhouses gas emissions in the future, uncertain responses of the global climate system to increases in anthropogenic greenhouses concentrations, the effects of emissions on the actual temperature, precipitation process, downscaling in space and time, and river hydrology. It is recommended that future studies be updated on greenhouse gas emission projections, exploration of downscaling methods for climate projections, and evolving climate science regarding projected change in temperature, precipitation, and river basin hydrology. In addition, it should also be mentioned that the use of the information presented in the Hydroclimatic Atlas must be conditional to an adequate interpretation of the following methodological limitations: (1) hydrological projections are limited to the natural flow regime on the surface of the watercourse, (2) the hydrological projections do not consider the local effect of dam operation on the change signal, and (3) the hydrological projections simulate open water flows. The results, therefore, do not cover ice-related phenomena such as ice jams.
Secondly, the floodplain of the Petite Nation River watershed is hydraulically complex. The resulted flood depths and extent may be less or more than the modelled flood scenarios due to simplified assumptions on hydrodynamical processes on the watershed (i.e., land cover changes, survey and numerical modelling). It is recommended that that the projected floodplain areas need to be continually updated to account for land cover change developments, floodplain developments and infrastructure, ice jamming consideration, and natural changes to the landscape and hydrologic systems. Therefore, proper land use planning and risk-based hydraulic structures must be an integral part of the mitigation plan when addressing vulnerabilities to future flood damages in the basin. In addition, with respect to mapping flood depth and extent, improved accuracy would also result from more accurate topographic data.
Generally, in order to better understand projected changes in the frequency analyses and develop more accurate flood hazards and damage maps that account for the effects of climate change, there is a need to review and prioritize data limitations and uncertainties in flood projection flood modelling and to undertake uncertainty and sensitivity analyses while calculating flood vulnerability assessment. In addition, it may be appropriate to undertake ongoing research to address priority data limitations and uncertainties.

5. Conclusions

This study presents a methodology to produce flood hazard and monetary damage maps under projected climate change conditions. It provides a modelling approach, in which future climate projections generated by the Hydroclimatic Atlas of southern Quebec are analyzed and used as input to the GARI tool for predicting future flood risk maps. The proposed methodology was conducted in two municipalities in the Petite Nation River located in southern Quebec, for the time horizons, 2050 and 2080.
The results indicate that the projected flood frequency change decreases slightly in the two municipalities for the time horizons, 2050 and 2080. Similarly, climate through decreased peak river flows combined with the basin’s flat topography will decrease the flood depth and inundation area under climate change in the two municipalities. It also projected that potential monetary damage can be expected to decrease in the future represented by the RCP 8.5.
This study’s results provide a plausible picture of the present and future flood risk mapping in the Petite Nation watershed. One of the main contributions of the case study is the assessment of climate change impacts for two main range of climate scenarios. The results can serve as useful guides for decision-makers in Canada for identifying flood-hazard areas under changing climate and for prioritizing appropriate mitigation and response efforts in these areas. Developing flood hazard and damage maps constitutes a sensible adaptation strategy to cope with climate change, as it should guide decision-makers in planning for future urban development and devising efficient emergency plans.

Author Contributions

Conceptualization, K.O.; methodology, K.O. and K.C.; writing—original draft preparation, K.O.; writing—review and editing, K.O., S.H.; visualization, Y.G.; validation, C.R.-F.; supervision, J.-P.T. All authors have read and agreed to the published version of the manuscript.

Funding

This research was funded by the Municipalities for Climate Innovation Program led by the Federation of Canadian Municipalities, grant number MIC-15557.

Data Availability Statement

Not applicable.

Acknowledgments

This study was carried out by the National Institute of Scientific Research (INRS), in partnership with the local watershed organization (Organisme de bassins versants des rivières Rouge, Petite-Nation et Saumon, OBVRPNS) and six municipalities located within the watershed (Duhamel, Ripon, St-Andre-Avellin, Lac-Simon, Papineauvillle, Plaisance), under the project entitled “Tool: Assess flood risk and develop sustainable management plans”. The authors would like to thank the contributions from six municipalities of the watershed and OBVRPNS for providing the data and kind help on operating it. The anonymous reviewers are thanked for their constructive reviews.

Conflicts of Interest

The authors declare no conflict of interest.

Appendix A

Figure A1. Flood extent for a 20-year return period, under current, 2050, and 2080 horizons (RCP 8.5). Case: Ripon.
Climate 09 00125 g0a1
Figure A2. Flood extent for a 100-year return period, under current, 2050, and 2080 horizons (RCP 8.5). Case: Ripon.
Climate 09 00125 g0a2
Figure A3. Flood extent for a 20-year return period, under current, 2050, and 2080 horizons (RCP 8.5). Case: St-Andre-Avellin.
Climate 09 00125 g0a3
Figure A4. Flood extent for a 100-year return period, under current, 2050, and 2080 horizons (RCP 8.5). Case: St-Andre-Avellin.
Climate 09 00125 g0a4
Figure A5. Projected flood depth for a 20-year return period (RCP 8.5). Case: Ripon.
Climate 09 00125 g0a5
Figure A6. Projected flood depth for a 100-year return period (RCP 8.5). Case: Ripen.
Climate 09 00125 g0a6
Figure A7. Projected flood depth for a 20-year return period (RCP 8.5). Case: St-Andre-Avellin.
Climate 09 00125 g0a7
Figure A8. Projected flood depth for a 100-year return period. Case: St-Andre-Avellin.
Climate 09 00125 g0a8
Figure A9. Projected monetary damage map expressed in percentage for a 20-year return period with current, 2050, and 2080 (RCP 8.5). Case: Ripon.
Climate 09 00125 g0a9
Figure A10. Projected monetary damage map expressed in percentage for a 20-year return period with current, 2050, and 2080 (RCP 8.5). Case: St-Andre-Avellin.
Climate 09 00125 g0a10

References

  1. Buttle, J.M.; Allen, D.M.; Caissie, D.; Davison, B.; Hayashi, M.; Peters, D.L.; Pomeroy, J.W.; Simonovic, S.; St-Hilaire, A.; Whitfield, P.H. Flood processes in Canada: Regional and special aspects. Can. Water Resour. J. Rev. Can. Res. Hydr. 2016, 41, 7–30. [Google Scholar] [CrossRef]
  2. Sandink, D.; Kovacs, P.; Oulahen, G.; McGillivray, G. Making Flood Insurable for Canadian Homeowners: A Discussion Paper; Institute for Catastrophic Loss Reduction: Toronto, ON, Canada; Swiss Reinsurance Company Ltd.: Toronto, ON, Canada, 2010; p. 75. [Google Scholar]
  3. Sandink, D.; Kovacs, P.; Oulahen, G.; Shrubsole, D. Public relief and insurance for residential flood losses in Canada: Current status and commentary. Can. Water Resour. J. Rev. Can. Ressour. Hydr. 2015, 41, 220–237. [Google Scholar] [CrossRef]
  4. Bush, E.; Lemmen, D.S. Canada’s Changing Climate Report; Government of Canada: Ottawa, ON, Canada, 2019. [Google Scholar]
  5. Public Safety Canada (PSC). Canadian Disaster Database (CDD). 2021. Available online: https://www.publicsafety.gc.ca/cnt/rsrcs/cndn-dsstr-dtbs/index-en.aspx (accessed on 11 June 2021).
  6. Robichaud, S.; Maltais, D.; Lalande, G.; Simard, A.; Moffat, G. Les inondations de Juillet 1996: Une série d’événements stressants. Serv. Soc. 2001, 48, 16–33. [Google Scholar] [CrossRef] [Green Version]
  7. Burn, D.H. Perceptions of flood risk: A case study of the Red River Flood of 1997. Water Resour. Res. 1999, 35, 3451–3458. [Google Scholar] [CrossRef]
  8. Tanner, A.; Árvai, J. Perceptions of risk and vulnerability following exposure to a major natural disaster: The Calgary flood of 2013. Risk Anal. 2018, 38, 548–561. [Google Scholar] [CrossRef] [PubMed]
  9. Nirupama, N.; Armenakis, C.; Montpetit, M. Is flooding in Toronto a concern? Nat. Hazards 2014, 72, 1259–1264. [Google Scholar] [CrossRef]
  10. Teufel, B.; Sushama, L.; Huziy, O.; Diro, G.T.; Jeong, D.I.; Winger, K.; Garnaud, C.; De Elia, R.; Zwiers, F.W.; Matthews, H.D.; et al. Investigation of the mechanisms leading to the 2017 Montreal flood. Clim. Dyn. 2018, 52, 4193–4206. [Google Scholar] [CrossRef]
  11. Hirabayashi, Y.; Mahendran, R.; Koirala, S.; Konoshima, L.; Yamazaki, D.; Watanabe, S.; Kim, H.; Kanae, S. Global flood risk under climate change. Nat. Clim. Chang. 2013, 3, 816–821. [Google Scholar] [CrossRef]
  12. Gouldby, B.J.T. Uncertainty and Sensitvity Analysis Method for Flood Risk Analysis. 2009. Available online: https://eprints.hrwallingford.com/1360/ (accessed on 11 June 2021).
  13. Apel, H.; Aronica, G.T.; Kreibich, H.; Thieken, A. Flood risk analyses—How detailed do we need to be? Nat. Hazards 2009, 49, 79–98. [Google Scholar] [CrossRef]
  14. Burn, D.H.; Whitfield, P.H. Changes in floods and flood regimes in Canada. Can. Water Resour. J. Rev. Can. Ressour. Hydr. 2016, 41, 139–150. [Google Scholar] [CrossRef]
  15. Cunderlik, J.M.; Ouarda, T.B. Trends in the timing and magnitude of floods in Canada. J. Hydrol. 2009, 375, 471–480. [Google Scholar] [CrossRef]
  16. Henstra, D.; Thistlethwaite, J. Climate Change, Floods, and Municipal Risk Sharing in Canada; Institute on Municipal Finance and Governance: Toronto, ON, Canada, 2017. [Google Scholar]
  17. Roy, L.; Leconte, R.; Marche, C. The impact of climate change on seasonal floods of a southern Quebec River Basin. Hydrol. Process. 2001, 15, 3167–3179. [Google Scholar] [CrossRef]
  18. Mareuil, A.; Leconte, R.; Brissette, F.; Minville, M. Impacts of climate change on the frequency and severity of floods in the Châteauguay River basin, Canada. Can. J. Civ. Eng. 2007, 34, 1048–1060. [Google Scholar] [CrossRef]
  19. LaForce, S.; Simard, M.; Leconte, R.; Brissette, F. Climate Change and Floodplain Delineation in Two Southern Quebec River Basins1. JAWRA J. Am. Water Resour. Assoc. 2011, 47, 785–799. [Google Scholar] [CrossRef]
  20. Riboust, P.; Brissette, F. Climate change impacts and uncertainties on spring flooding of Lake Champlain and the Richelieu River. JAWRA J. Am. Water Resour. Assoc. 2015, 51, 776–793. [Google Scholar] [CrossRef]
  21. Zadeh, S.M.; Burn, D.H.; O’Brien, N. Detection of trends in flood magnitude and frequency in Canada. J. Hydrol. Reg. Stud. 2020, 28, 100673. [Google Scholar] [CrossRef]
  22. Huang, Y.; Zou, Y.; Huang, G.; Maqsood, I.; Chakma, A. Flood vulnerability to climate change through hydrological modeling: A case study of the Swift Current Creek watershed in western Canada. Water Int. 2005, 30, 31–39. [Google Scholar] [CrossRef]
  23. McLeman, R.; Smit, B. Vulnerability to climate change hazards and risks: Crop and flood insurance. Can. Geogr. 2006, 50, 217–226. [Google Scholar] [CrossRef]
  24. Thistlethwaite, J.; Minano, A.; Blake, J.A.; Henstra, D.; Scott, D. Application of re/insurance models to estimate increases in flood risk due to climate change. Geoenviron. Disasters 2018, 5, 8. [Google Scholar] [CrossRef] [Green Version]
  25. Chen, J.; Brissette, F.P.; Leconte, R. Uncertainty of downscaling method in quantifying the impact of climate change on hydrology. J. Hydrol. 2011, 401, 190–202. [Google Scholar] [CrossRef]
  26. Cloke, H.L.; Wetterhall, F.; He, Y.; Freer, J.; Pappenberger, F. Modelling climate impact on floods with ensemble climate projections. Q. J. R. Meteorol. Soc. 2012, 139, 282–297. [Google Scholar] [CrossRef] [Green Version]
  27. Chaumont, D. A Guidebook on Climate Scenarios: Using Climate Information to Guide Adaptation Research and Decisions; Ouranos: Montréal, QC, Canada, 2014. [Google Scholar]
  28. Gaur, A.; Gaur, A.; Simonovic, S.P. Future changes in flood hazards across Canada under a changing climate. Water 2018, 10, 1441. [Google Scholar] [CrossRef] [Green Version]
  29. Huziy, O.; Sushama, L.; Khaliq, M.N.; Laprise, R.; Lehner, B.; Roy, R. Analysis of streamflow characteristics over Northeastern Canada in a changing climate. Clim. Dyn. 2012, 40, 1879–1901. [Google Scholar] [CrossRef] [Green Version]
  30. Edenhofer, O.; Seyboth, K. Intergovernmental Panel on Climate Change (IPCC). Encycl. Energy Nat. Resour. Environ. Econ. 2013, 48–56. [Google Scholar] [CrossRef]
  31. Meinshausen, M.; Smith, S.J.; Calvin, K.; Daniel, J.S.; Kainuma, M.L.T.; Lamarque, J.F.; Matsumoto, K.; Montzka, S.; Raper, S.C.B.; Riahi, K.; et al. The RCP greenhouse gas concentrations and their extensions from 1765 to 2300. Clim. Chang. 2011, 109, 213–241. [Google Scholar] [CrossRef] [Green Version]
  32. Nakicenovic, N.; Alcamo, J.; Davis, G.; Vries, B.D.; Fenhann, J.; Gaffin, S.; Gregory, K.; Grubler, A.; Jung, T.Y.; Kram, T.; et al. Special Report on Emissions Scenarios (SRES), a Special Report of Working Group III of the Intergovernmental Panel on Climate Change; Cambridge University Press: Cambridge, UK, 2000. [Google Scholar]
  33. Solomon, S.; Manning, M.; Marquis, M.; Qin, D. Climate Change, the Physical Science Basis: Contribution of Working Group I to the Fourth Assessment Report of the Intergovernmental Panel on Climate Change; Cambridge University Press: Cambridge, UK, 2007; p. 996. [Google Scholar]
  34. Ficklin, D.; Luo, Y.; Luedeling, E.; Zhang, M. Climate change sensitivity assessment of a highly agricultural watershed using SWAT. J. Hydrol. 2009, 374, 16–29. [Google Scholar] [CrossRef]
  35. Moradkhani, H.; Meier, M. Long-lead water supply forecast using large-scale climate predictors and independent component analysis. J. Hydrol. Eng. 2010, 15, 744–762. [Google Scholar] [CrossRef]
  36. Praskievicz, S.; Chang, H. Impacts of climate change and urban development on water resources in the Tualatin River Basin, Oregon. Ann. Assoc. Am. Geogr. 2011, 101, 249–271. [Google Scholar] [CrossRef]
  37. Centre d’Expertise Hydrique du Québec; Ministère du Développement Durable, de l’Environnement et de la Lutte Contre les Changements Climatiques. Hydroclimatic Atlas of Southern Québec; Government of Québec: Quebec City, QC, Canada, 2015.
  38. Taylor, K.E.; Stouffer, R.J.; Meehl, G.A. An Overview of CMIP5 and the Experiment Design. Bull. Am. Meteorol. Soc. 2012, 93, 485–498. [Google Scholar] [CrossRef] [Green Version]
  39. Ouranos. Fiche Avis d’Ouranos Sur les Inondations Dans un Contexte de Changements Climatiques; Ouranos: Montréal, QC, Canada, 2018. [Google Scholar]
  40. Lin, H.; Mo, R.; Vitart, F.; Stan, C. Eastern Canada flooding 2017 and its subseasonal predictions. Atmos. Ocean 2019, 57, 195–207. [Google Scholar] [CrossRef] [Green Version]
  41. Chokmani, K.; Oubennaceur, K.; Tanguy, M.; Poulin, J.; Gauthier, Y.; Latapie, R.; Bernier, M. The Use of Remotely Sensed Information within a Flood Risk Management and Analysis Tool (GARI). In Proceedings of the IGARSS 2019—2019 IEEE International Geoscience and Remote Sensing Symposium, Yokohama, Japan, 28 July–2 August 2019; pp. 4636–4639. [Google Scholar]
  42. Guay, C.; Minville, M.; Braun, M. A global portrait of hydrological changes at the 2050 horizon for the province of Québec. Can. Water Resour. J. Rev. Can. Ressour. Hydr. 2015, 40, 285–302. [Google Scholar] [CrossRef]
  43. Fortin, J.; Moussa, R.; Bocquillon, C.; Villeneuve, J. Hydrotel, un modèle hydrologique distribué pouvant bénéficier des données fournies par la télédétection et les systèmes d’information géographique. Rev. Sci. Eau J. Water Sci. 1995, 8, 97–124. [Google Scholar] [CrossRef] [Green Version]
  44. Han, D. Flood Risk Assessment and Management; Bentham Science Publishers: Sharjah, United Arab Emirates, 2011. [Google Scholar]
  45. Schwarz, G. Estimating the dimension of a model. Ann. Statist. 1978, 6, 461–464. [Google Scholar] [CrossRef]
  46. Tanguy, M.; Chokmani, K.; Bernier, M.; Poulin, J. CADYRI, a dynamic mapping tool of human risk associated with flooding in urban areas. AGU Fall Meet. Abstr. 2013, 2013, NH43B-1756. [Google Scholar]
  47. Brunner, G.W. Hec-Ras (River Analysis System). In North American Water and Environment Congress & Destructive Water; ASCE: New York, NY, USA, 2002. [Google Scholar]
  48. Tanguy, M.; Chokmani, K.; Bernier, M.; Poulin, J.; Raymond, S. River flood mapping in urban areas combining Radarsat-2 data and flood return period data. Remote Sens. Environ. 2017, 198, 442–459. [Google Scholar] [CrossRef] [Green Version]
  49. Tanguy, M. Cartographie du Risque D’inondation en Milieu Urbain Adaptée à la Gestion de Crise: Analyse Préliminaire; INRS-Eau, Terre et Environnement: Quebec City, QC, Canada, 2012. [Google Scholar]
  50. Bonnifait, L.; Leclerc, M. Construction de Courbes Niveau-Dommages Pour l’Habitat Québécois; INRS-Eau, Terre et Environnement: Quebec City, QC, Canada, 2004. [Google Scholar]
  51. Mailhot, A.; Talbot, G.; Ricard, S.; Turcotte, R.; Guinard, K. Assessing the potential impacts of dam operation on daily flow at ungauged river reaches. J. Hydrol. Reg. Stud. 2018, 18, 156–167. [Google Scholar] [CrossRef]
  52. MRC de Papineau. Schéma d’Aménagement et de Développement; Municipalité Régionale de Comté de Papineau: Papineauville, QC, Canada, 1987. [Google Scholar]
Figure 1. Location map of the study area with the two studied municipalities.
Climate 09 00125 g001
Figure 2. Modes and functionalities of the GARI tool.
Climate 09 00125 g002
Figure 3. Steps for estimating the impacts of climate change on future flood hazard and damage.
Climate 09 00125 g003
Figure 4. Hydroclimatic Atlas of Southern Québec average annual flow indicator, the magnitude of change RCP 4.5.
Climate 09 00125 g004
Figure 5. Annual flow distribution for different return periods (2, 20, and 100 years) at Station 040406.
Climate 09 00125 g005
Table 1. Projected peak flow estimated at the 2050- and 2080-time horizons as compared with the baseline flows at the hydrometric Station 040406 (RCP 4.5 and RCP 8.5).
Baseline
(m3/s)
Flow (m3/s)
2050
Flow (m3/s)
2080
RCP 4.5RCP 8.5RCP 4.5RCP 8.5
2 years9289889083
20 years139139132140127
100 years153153147151142
Table 2. Comparison of flood inundation areas for 20- and 100-return periods for current (baseline), 2050-, and 2080-time horizons under RCP 8.5 for the two municipalities: Ripon and St-Andre-Avellin.
9Flooded Area (m2)
20-Year Return Period100-Year Return Period
PeriodCurrent20502080Current20502080
St-Andre-Avellin90,11489,05888,38892,39491,35890,568
Ripon271,653268,194266,201279,213276,277273,002
Table 3. Projected damage changes expressed in percentage for the 20- and 100-year return periods for Ripon and St-Andre-Avellin (current (baseline), 2050, and 2080).
Damage   ( % )
20-Year Return Period100-Year Return Period
PeriodCurrent20502080Current20502080
St-Andre-Avellin3.77%3.58%3.25%4.39%4.19%3.94%
Ripon0.75%0.71%0.68%0.93%0.86%0.79%
Publisher’s Note: MDPI stays neutral with regard to jurisdictional claims in published maps and institutional affiliations.

