
Climate Change Mitigation Potential of Wind Energy


1
Sibley School for Mechanical and Aerospace Engineering, Cornell University, Ithaca, NY 14853, USA
2
Department of Earth and Atmospheric Sciences, Cornell University, Ithaca, NY 14853, USA
*
Author to whom correspondence should be addressed.
Climate 2021, 9(9), 136; https://0-doi-org.brum.beds.ac.uk/10.3390/cli9090136
Submission received: 30 July 2021
/
Revised: 19 August 2021
/
Accepted: 25 August 2021
/
Published: 28 August 2021
(This article belongs to the Special Issue Climate Change Mitigation and Adaptation Policies and Strategies in Energy)
Abstract
:Global wind resources greatly exceed current electricity demand and the levelized cost of energy from wind turbines has shown precipitous declines. Accordingly, the installed capacity of wind turbines grew at an annualized rate of about 14% during the last two decades and wind turbines now provide ~6–7% of the global electricity supply. This renewable electricity generation source is thus already playing a role in reducing greenhouse gas emissions from the energy sector. Here we document trends within the industry, examine projections of future installed capacity increases and compute the associated climate change mitigation potential at the global and regional levels. Key countries (the USA, UK and China) and regions (e.g., EU27) have developed ambitious plans to expand wind energy penetration as core aspects of their net-zero emissions strategies. The projected climate change mitigation from wind energy by 2100 ranges from 0.3–0.8 °C depending on the precise socio-economic pathway and wind energy expansion scenario followed. The rapid expansion of annual increments to wind energy installed capacity by approximately two times current rates can greatly delay the passing of the 2 °C warming threshold relative to pre-industrial levels. To achieve the required expansion of this cost-effective, low-carbon energy source, there is a need for electrification of the energy system and for expansion of manufacturing and installation capacity.
1. Introduction
Current global greenhouse gas (GHG) emissions (including those from land-use change) of 59.1 GtCO2e are dominated by fossil fuel combustion (38.0 GtCO2) associated primarily with electricity and heat generation (24% of GHG emissions) plus transformation and fugitive emissions (10%) [1]. As 189 countries seek to implement the Paris climate agreement to reduce emissions of GHG including carbon dioxide (CO2) and limit the increase in global temperature from the pre-industrial baseline (ΔT) to 2°C or less, decarbonization of the energy sector is a major goal [2].
The maturity of the wind energy industry with low-cost, low-carbon electricity generation means that the growth of wind energy penetration into global electricity generation systems has long been recognized as a potential mechanism to reduce climate forcing [3]. Over the past two decades, wind energy deployed on land has become the cheapest source of electricity generation [4]. Accordingly, many countries have ambitious plans to expand both onshore and offshore wind energy installed capacity as well as further exploiting solar energy resources [1].
In earlier work (2014), we explored whether the enhanced deployment of wind energy could substantially impact climate change trajectories. We concluded that, with ambitious wind energy scenarios, it was possible to “buy time” to delay passing a 2 °C warming temperature threshold that was of the order 1–10 years, depending on the overall emissions scenario [3]. As CO2 emissions continue to accumulate in the atmosphere, we updated the conclusions in 2020 to show advanced wind energy scenarios could still delay exceeding the 2 °C threshold by up to 5 years, and, by 2050, reduce cumulative emissions by ~154 GtCO2 [5]. In light of the rapidity of changes in national and global ambitions to reduce anthropogenic forcing, here we revisit this issue. We characterize recent growth trends in the wind energy industry and present analyses to quantify the mitigation potential from wind-derived electricity in the rapidly evolving context of new global aspirations and regional policies and targets.
2. Methodology
To assess the future climate change mitigation potential of wind energy we begin in this section by, documenting the assumptions upon which the climate change mitigation potential are predicated. Accordingly, we start by describing the current status of the energy sector and its related GHG emissions. In the following sub-section, we detail current energy demand and related metrics, focusing on the top four GHG emitters (China, US, EU+UK and India) that contribute over 55% of total non-land use change related global CO2 emissions [1] (Table 1). These four also have the largest TPES and electricity use (Figure 1 and Table 1), closely followed by Russia and Japan. Following that, we summarize current climate pledges focused on those from the four areas. To assess how much wind energy expansion is feasible to 2050, we start by documenting historical trends of wind energy deployment and then detail near-term plans. For the future period (beyond 2025) we quantify plans for expansion of on- and off-shore wind turbine deployments by country and examine scenarios of potential wind energy deployment developed by non-governmental agencies. We conclude this section by briefly summarizing the IPCC socio-economic pathways and RCP scenarios.
2.1. Energy and GHG Emissions
Energy use is a key driver of global atmospheric carbon dioxide concentrations. The International Energy Agency (IEA) states “CO2 emitted from coal combustion was responsible for over 0.3 °C of the 1 °C increase in global average annual surface temperatures above pre-industrial levels. This makes coal the single largest source of global temperature increase” [7]. Overall total primary energy supply (TPES) is continuing to grow. Annual TPES increased from 6908 million tonnes of oil equivalent (Mtoe) in 1973 to 14,282 Mtoe in 2018. This equates to an annualized rate of increase of ~3.7% and includes increases in demand for coal, natural gas, and oil leading to an increase in energy-related CO2 emissions by 1.7% to 33.1 GtCO2 in 2018 [7] (Figure 1).
The contribution to energy supply from electricity has also grown over recent decades from 6131 TWh (9.4% of TPES) in 1973 to 26,619 TWh in 2018 (19.3% of TPES) (an increase of 7.4% per year) [6]. This trend towards electrification, e.g., the use of electric vehicles and in industrial processes is likely to enable both increasing reliance on renewable energy sources and reductions of GHG emissions. Although the recent growth of renewable energy for electricity generation is substantial, in absolute terms fossil fuels remain the overwhelmingly dominant component of energy demand in every area, and globally (Figure 1). Transport comprises ~36% of energy demand and contributes ~24% of global GHG emissions [6]. According to some estimates, by 2040 the share of renewable energy sources needs to increase from 3.5% to 19% in the transportation sector, 10% to 25% in the provision of heat and 25 to 67% in electricity in order to be on track to meet climate goals and reduce air pollution [7].
Although hydroelectricity currently dominates renewable electricity generation (4325 TWh, around 16% of total electricity supply) [6], the largest growth rates and most future scenarios envisage major expansion in wind and solar energy [7]. GHG emissions from wind energy are estimated to be 14.5–28.5 g CO2e per kWh of electricity generated compared to 360–1259 g CO2e per kWh for fossil fuel generation [8]. Some estimates of lifetime GHG emissions from wind turbines deployed onshore are 7 g CO2e per kWh while some estimates for offshore deployments are 11 g CO2e per kWh [9]. Given the market readiness and low cost of electricity generation from wind turbines, we focus here on wind energy and examine how current plans for expanded use of this technology will/could contribute to meeting GHG emission reduction goals.
Note, in synthesizing data across multiple sources, agencies and countries there are inevitably some inconsistencies and simplifying assumptions that must be invoked. For example, while data presented here for the IPCC RCP denote total GHG emissions expressed at the mass of carbon dioxide equivalents (CO2e) because most GHG emissions from fuel combustion are in the form of carbon dioxide, where energy-related GHG emissions (or avoided emissions) are presented they are for CO2 only. Furthermore, in order to equate emissions from different fuel types, some assumptions about energy content and/or electricity generation efficiency and/or GHG emission rates must be made. For example, the following conversion factors are employed; Combustion of 1 Mtoe produces approx. 4.4 TWh electricity; production of 1 barrel of oil per day = 49.8 tonnes of oil per year; 1 bcm gas = 0.86 Mtoe; 1.5 tonnes of hard coal or 3 tonnes lignite and sub-bituminous coal (average 2.25 tonnes) = 1 tonne oil [10].
2.2. Pledges and Targets
Since adoption of the Paris accord of United Nation Framework Convention on Climate Change (UNFCCC) based on Nationally Determined Contributions (NDC), there were both political and market factors moving towards the decarbonization of not just electricity generation but the entire energy sector. A total of 145 of the 194 submitted NDCs include renewable energy and 109 have a quantified target for renewables [11,12] to reduce GHG emissions [13] (Table 2). By April 2021 44 countries plus the European Union (EU) pledged to meet the net-zero emissions target, most by the year 2050. These countries account for about 70% of global CO2 emissions but, even if fully realized, these changes will be insufficient to limit global warming to 1.5 °C [14].
2.3. Growth of Wind Energy
2.3.1. Wind Energy Industry Historical Trends
Wind turbines are deployed to harness wind resources in over 90 countries. By 2020, 742 GW of wind energy capacity was installed, 35 GW of which was offshore (Figure 2) [11]. As of the end of 2020, 12 countries have an installed capacity (IC) above 10 GW, and twenty have IC above 5 GW [11]. As shown in Figure 2, IC is dominated by Asia (principally China with 288 GW), Europe (largest contributor; Germany 62 GW) and North America (dominated by the USA with 122 GW) [11]. IC increased at a mean annualized rate ~14.2% between 2006 and 2020.
Consistent with the increase in IC, wind energy electricity production expanded from 104 TWh in 2005 to 1273 TWh in 2018 [6]. In 2019, wind energy generated approximately 6.5% of 26,600 TWh global electricity demand [11] with six countries generating more than 20% of demand. The UK, Germany and Spain are close to achieving 20%, ten countries more than 10% and China reported close to 5% of electricity supply from wind energy [21]. Denmark has the highest penetration of wind-generated electricity of 47%, which is 32% in Ireland and 27% in Portugal [21]. In 2020, wind energy produced 459 TWh of electricity in Europe from 220 GW of wind energy IC. Wind-derived electricity production in the EU27 was 382 TWh in 2020. The USA generates 8.4% of its electricity from wind (2020) with wind contributing nearly 25% in six states [22]. Current wind penetration levels of electricity generation compare favorably with other sources. For example, approximately 10.2% of global electricity supply derives from nuclear, 16.3% from hydroelectric plants, 3.3% from oil, 22.9% from natural gas and 38.3% from coal [23].
In the following sections, we document the near-term expectations for expansion of the wind energy IC and examine the plans for the long-term growth of wind-derived electricity generation in the context of the global energy supply for the top GHG emitters.
2.3.2. Near-Term Trends in Wind Energy Deployments
60 GW of wind energy installed capacity was added in 2019 [11]. In a 2019 report by the International Energy Agency (IEA), global annual net wind capacity additions were projected to be 65 GW by 2020 and 68 GW in 2021 (including 7.3 GW of net capacity additions offshore) [24]. Despite the COVID-19 pandemic, 92 GW of installed capacity was actually added in 2020 [11]. The Global Wind Energy Council (GWEC) anticipates even larger annual increases of nearly 94 GW until 2025, including 70 GW offshore over the period 2021–2025 from IC of 35 GW in 2020 [11].
The current growth in wind energy IC is not even across each region. Most regions, including the USA, follow closely the global mean annual increase of 14% (Figure 2). In the USA, IC reached 122 GW at the end of 2020 with an annual record installation of nearly 17 GW. The European Union (EU), which already had an IC of 48 GW in 2006, increased at 7% per year reaching 219 GW in 2020. In 2020 14.7 GW of new IC was installed in the EU. IC increased in Asia from 2006–2020 by over 19% per year. Annual installations in China exceeded 48 GW in 2020 as the market accelerated to beat the deadline in the transition to subsidy-free onshore wind [11].
2.3.3. Future Wind Energy Pledges and Targets from National Governments
Global annual increases in wind energy IC are approaching 100 GW [11] with IC in individual countries/regions increasing at annual rates of 3–18% (Table 2). While impressive, this progress appears to be too slow to meet climate goals. The current rate of the annual increase in wind energy installed capacity of 15 GW in Europe (Table 2) is widely regarded to be insufficient to deliver the Green Deal and climate neutrality by 2050 [25]. WindEurope suggests that to meet the new 55% climate targets that would require annual installation of almost twice as much (27 GW) [25,26]. The path to climate neutrality by 2050 as currently envisaged by the EU relies on increasing electrification from 2760 TWh/y today to meet 75% of energy demand (i.e., generation of 6800 TWh/y in 2050). It is proposed that wind turbines deployed onshore will generate 2300 TWh/y, and an additional 1200 TWh/y will be supplied by offshore wind IC [26]. The amount of IC needed to meet these electricity generation goals is a strong function of the assumed electricity generation efficiency. Assuming no increase in the efficiency of next-generation wind turbines and thus capacity factors (CF) of 34% and 43%, respectively for onshore and offshore wind [27], this represents approximately 770 GW IC onshore and 320 GW IC offshore. Assuming the projected increase in capacity factors to 45% for onshore wind and 50% for offshore wind, the required IC is 580 GW onshore and 270 GW offshore. Both would require a faster rate of expansion of wind energy installed capacity (~21–28 GW/y) than is currently being realized (15 GW/y, Table 2) but lower than the rate that some deem possible [28]. According to government pledges, 105 GW of total new wind power IC will be achieved by 2025 (75 GW by the EU27) [28]. The UK strategy relies on the expansion of offshore wind IC from around 10 GW currently [28] to 40 GW by 2030 [20], which would require considerable acceleration of the current rate of increase in IC of 0.48 GW/y in 2020 [28].
While China reached the levels of its intended annual wind IC increase of 50 GW in 2020, wind energy IC growth may fall as the Feed-in Tariff expires and is replaced by an Emissions Trading Scheme [11]. Nonetheless, it indicates that 50 GW of annual installation as planned is achievable in China.
In 2015 the U.S. Department of Energy (DoE) updated its strategic vision for wind energy [29]. The DoE Study Scenario sets out wind deployment levels to IC of 113 GW by 2020 to supply 10% of electricity. It further sets out wind deployment levels of 224 GW by 2030, and 404 GW by 2050 [19,29] (Table 2). The 2020 IC target was met and indeed slightly exceeded. The IC was 122 GW at the end of 2020 [30]. Unfortunately, in 2019, wind energy supplied 296 TWh of total electricity generation or 7.2% of the total 4128 TWh. Thus, penetration of the electricity supply fell short of the specified goal due largely to unexpected large growth in electricity demand. The 2015 DoE wind vision proposed 20% of electricity supply from wind in 2030, and 35% in 2050 when electricity demand is expected to be 4900 TWh/y. Assuming a CF of 48%, to reach the 35% goal by 2050 (i.e., wind-generated electricity of 1715 TWh/y), requires around 404 GW of wind energy IC by 2050. Given IC was 122 GW at the end of 2020 [30], achieving 404 GW of wind energy IC would require annual additions of IC of around 10 GW/y. This is below the record rate of nearly 17 GW achieved in 2020 [30]. At this rate, the IC goal for 2030 can be passed in 2026 and the 2050 goal by 2037. A separate goal of 30 GW of offshore wind IC by 2030 was announced in early 2021 [17].
2.3.4. Future Wind Energy Scenarios from Non-Governmental Organization
Implementation of the current NDC would lead to only a 3.6% annual increase in deployment of wind energy over 2015–2030 compared to the 8.5% per year realized between 2010 and 2016 [12]. Hence several agencies have proposed wind energy IC and electricity generation targets that are more ambitious.
For example, the International Energy Agency (IEA) Announced Pledges Case (APC) is designed to keep GHG emissions down to 22 GtCO2/y by 2050 and includes about 12,000 TWh/y from wind energy by that date. Under the IEA Stated Policies (STEPS) scenario, offshore wind IC increases to about 180 GW in 2030, and 380 GW by 2050, while the IEA Sustainable Development Scenario (SDS) increases offshore wind IC to 220 GW in 2030 and 590 GW by 2050 [31]. GHG emission reductions under the IEA Stated Policies Scenario (STEPS) and the more ambitious IEA Announced Pledges Case (APC) scenario are substantial but neither scenario limits ΔT < 1.5 °C or achieves net-zero global emissions [14]. Under the IEA net-zero emissions scenario from the energy sector (IEA NZE) global energy-related and industrial process CO2 emissions fall to around 21 GtCO2 in 2030 and to net-zero in 2050. This scenario requires TPES to fall by 7% from 2020 to 2030 and for ~50% of energy supply to be in the form of electricity, 88% of which is derived from wind and solar [14]. Under this ambitious scenario, annual wind energy IC additions reach 390 GW/y by 2030 (from 114 GW/y in 2020), leading to around 8000 GW wind IC by 2050 [14] (Figure 3 and Figure 4). Since the GWEC scenario [11,16] is similar to IEA NZE we assume that its impact can be inferred from those scenarios and call the scenario IEA NZE/GWEC (Figure 4).
Similar scenarios were also developed by other organizations. IRENA describes a reference case based on current plans (global emissions falling from around 35 GtCO2/y in 2030 to 33.1 GtCO2/y in 2050) and a Renewable Energy Roadmap (REmap) case designed to keep the global temperature rise from pre-industrial levels (ΔT) to less than 2 °C with emissions falling to 24.9 GtCO2/y in 2030 and 9.8 GtCO2/y by 2050 [27]. In REmap wind energy generates 35% of electricity by 2050 [12,27]. The share of wind-generated electricity is expected to increase from 4% in 2020 to 21% and 35% in 2030 and 2050 globally, respectively. Equivalent country-specific figures (2020, 2030 and 2050) for the wind contribution to total electricity are; 11, 37, 55 for the UK; 4, 29, 51 for China; 6, 28, 46 for the USA; 9, 24, 40 for the EU28 (EU27+UK); 4, 19, 23 for India [27]. REmap projections from IRENA for onshore IC would realize 5044 GW onshore (including China 2000 GW, USA 840 GW, India 300 GW, Europe 483 GW) and 1000 GW offshore [27] (Figure 3). IRENA indicates global annual new IC including repowering (see description in Section 4.3) increasing from around 50 GW/y in 2018 to 147 GW/y in 2030, stabilizing at 200 GW/year from 2040–2050 [27]. China’s onshore wind installed capacity would grow from 205 GW in 2018 to almost 2150 GW in 2050 [27]. USA grew from 94 GW in 2018 to 857 GW by 2050 [27] and Europe from 161 GW to 406 GW by 2050 [27]. In these scenarios, the overall IC for wind energy could expand over 10 times from current levels by 2050, generating the amounts of low-carbon electricity needed to substantially contribute to climate change mitigation.
2.4. Emission Scenarios and Related Global Temperature Increases
The Intergovernmental Panel on Climate Change (IPCC) Fifth Assessment Report [32], suggests that limiting global temperature increase above pre-industrial levels (ΔT) to less than 1.5 °C “would require major reductions in greenhouse gas emissions in all sectors” [33]. Assuming cumulative emissions to 2017 of 2200 GtCO2 this indicates approximately 580 GtCO2 can be added prior to exceedance of 1.5 °C warming [33]. The IPCC Fifth Assessment Report includes a number of the Representative Concentration Pathways (RCP) [34] that can be used to examine how scenarios of GHG emissions may influence future climate states. These RCP scenarios are based on different Socio-Economic Pathways and thus include assumptions about the transformation of the energy system. However, none are as ambitious as the scenarios articulated by IRENA, IEA and increasingly by national governments.
GHG concentrations initially grow under all four RCP [34] (Figure 5a) with the major divergence between the scenarios and emission pathways occurring after 2040. There is an approximately linear relationship between peak global mean temperature and cumulative emissions of carbon (transient climate response to cumulative emissions of carbon, TCRE) which we assume here to be ΔT = 0. 54 °C per 1000 GtCO2 [3] which falls within the “likely range” 0.2–0.7 °C per 1000 GtCO2 [33] (Figure 5b).
3. Results
3.1. Wind Energy Global Climate Change Mitigation Potential
In this section, we present results for climate change mitigation computed for the implementation of three wind energy scenarios to 2050 based on Current National Pledges (NDC) (Figure 3a), IRENA and IEA NZE and their impact GHG emissions and related global temperature changes from pre-industrial levels (ΔT) (Figure 5). In order to do so we invoke several assumptions:
- To avoid double counting, GHG emission reductions associated with the implementation of wind energy in the IPCC scenarios are removed as in [3] and [5]. This process is shown as IPCC minus wind in Figure 6. Assumptions regarding the wind energy IC under each IPCC scenario (RCP 2.6, 4.5, 6.0 and 8.5) are estimated to avoid 2.5, 2.7, 0.74 and 1.5 GtCO2e/y, respectively. The more aggressive wind energy expansion scenarios are then implemented in each RCP to generate new estimates of global CO2e emissions (Figure 6).
- To estimate avoided emissions, it is assumed that wind energy replaces electricity generation that is typified by the USA energy mix in 2013 in terms of emissions of carbon dioxide equivalent per unit of electricity produced. Thus the avoided emissions of CO2e are around 0.64 kg/kWh or 0.64 mt/TWh [29].
- To convert wind energy IC in GW to electricity generation in TWh, wind energy capacity factors (CF) are used. CF for onshore wind turbines is currently 34% and is expected to increase for onshore wind turbines to over 42% by 2030 and 45% by 2050. Equivalent values for wind turbines deployed offshore are currently 43%, increasing to over 45% by 2030 and to over 50% by 2050 [27].
- The annual rate of increase in wind energy IC in 2050 is assumed to continue over 2051–2100.
Because GHG accumulate in the atmosphere and have lifetimes of many years, and wind energy expansion is also incremental through time, implementation of expanded wind energy scenarios has only a very small impact on near-term cumulative emissions and climate forcing but has increasing influence on climate futures by the end of the century. Based on current emissions and the IPCC RCP8.5 pathway in which TPES and associated emissions continue to grow, ΔT cannot remain below 2 °C (Figure 6). Implementing any of the wind energy expansion scenarios (NDC, IREA and IEA NZE) in this IPCC RCP all fail to prevent global temperature rises above 2 °C in <30 years (Figure 6). However, the longer-term use of the more advanced wind energy scenarios makes an important contribution to the annual and cumulative GHG emissions and resulting climate forcing. The most aggressive deployment scenario reduces CO2 emissions by around 5 GtCO2e/y by 2030 and by over 10 GtCO2e/y by 2050 [14]. Employing the most ambitious wind energy scenarios where installed wind energy capacity is more than 10 times the present value by 2050 will reduce ΔT by up to 0.7–0.8 °C. Even adopting wind energy at the level of current pledges will lower ΔT by 0.3–0.4 °C at the end of the century. In both more moderate emission scenarios where significant action is undertaken to reduce GHG emissions (IPCC RCP 6.0 and 4.5), ΔT passes the 2 °C threshold within 30–50 years, unless further action is taken, e.g., as here by a more rapid increase in renewable energy in the IEA NZE/GWEC scenarios. Taking the most ambitious GHG emission reduction pathway (RCP2.6) with the IEA NZE/GWEC wind energy scenario can reduce ΔT to well below 1.5–2 °C and achieve even less warming by the end of the twenty-first century. However, this pathway requires urgent and significant lifestyle changes substantially beyond the decarbonization of energy supply.
3.2. Wind Energy Impact on Regional GHG Emissions
As expressed above, four countries/areas; China, Europe (EU plus UK), the USA and India are critically important to historical and future global GHG emissions. In this section, we describe possible impacts from achieving Nationally Determined Contributions (NDC) (current pledges) and implementing IRENA regionally-discretized wind energy scenarios [27] on impact national/regional GHG emissions and contextualize those in the historical emissions and post-COVID-19 current policies.
Over the last three decades, these countries and the EU have shown markedly different trajectories in terms of energy-related GHG emissions, with increases in China and India but declines in EU+UK and fairly constant (but varying) CO2e emissions in the USA (Figure 7). The EU plus UK already have net zero emissions targets that include a large contribution from wind energy (and other renewables) which are nearly equivalent to projections in the IRENA advanced scenarios. The USA has high current CO2 per capita emissions from energy but is anticipating declines in GHG emissions under the post-COVID-19 current policies (Figure 7, Table 3). The Chinese government is discussing net zero emissions by 2060 but likely would benefit from a more aggressive wind energy scenario. India has committed to greatly expanding the use of wind energy. Thus, these four countries that currently have a relatively large proportion of global GHG emissions are, to varying degrees, also committing to future wind energy development that will substantially reduce emissions by 2030 and 2050, assuming that these pledges are fulfilled.
The analysis of future energy-related GHG emissions is based on the following methodology and assumptions:
- Historical and near-term future emissions to 2030 are based on estimates provided by the Carbon Tracker think-tank (https://carbontracker.org/ Date of access 30 July 2021) and include high-low envelopes derived from post-COVID-19 current policies [36].
- For dates after 2030, we compute avoided GHG emissions that would be realized if the given country/area were to enact in full their pledges (NDC) or enact those pledges plus any additional impact from the IRENA country-specific scenario projections for expansion of wind energy installed capacity and electricity generation above what is codified in the NDC. To avoid double-counting in the NDC plus IRENA calculations for the USA and China only the excess wind energy IC from IRENA (above the NDC) are included. Equally, because the IRENA region/country projections for wind energy in the EU+UK and India are slightly below those noted in the NDC the NDC+IRENA calculation is performed using the wind energy IC expansion from IRENA and not the more ambitious NDC.
- To estimate avoided emissions, it is assumed that wind energy replaces electricity generation that is typified by the USA energy mix in 2013 in terms of emissions of carbon dioxide equivalent per unit of electricity produced. Thus the avoided emissions of CO2e are ~0.64 kg/kWh or 0.64 Mt/TWh [29].
In the short-term (to 2030), under post-COVID-19 country/EU policies, GHG emissions are projected to increase or remain similar to 2018 values in the EU+UK and the USA (Figure 7). The rate of increase in GHG emissions from China is expected to slow and then stop increasing, while in the near term, emissions from India are projected to continue to increase. After 2030 realizing NDC would result in marked declines in GHG and use of the IRENA scenario for the USA would markedly enhance emission reductions from those in the NDC (Table 3 and Figure 7).
Using the IRENA scenario [27], the four countries/area (USA, Europe, China and India) would need to expand capacity by over 4000 GW and the rest of the world would need to commit to developing over 1000 GW of on- and off-shore wind to bring about GHG reductions of more than 10 GtCO2 per year by 2050. This would constitute an important part of the transition to a lower-carbon energy future.
3.3. Uncertainties in the Modeling
Estimating the potential contribution of wind energy to climate change mitigation requires a range of assumptions regarding the socioeconomic, energy and climate systems. The projections thus include both socio-economic uncertainties and physical modeling uncertainties which are described below.
The global COVID-19 pandemic presents a dramatic example of the uncertainty in modeling future GHG emissions. There was an unprecedented 5.8% decline in CO2 emissions in 2020 which is expected to rebound to close to 2019 levels in 2021 [14]. The IPCC emission scenarios are designed to capture some of the uncertainty in projecting changes in socioeconomic conditions and population, GHG emissions and climate response [34]. The IPCC scenarios considered here include a wide range of projections by the end of the century; from annual emissions of −3.4 GtCO2e in RCP2.5 to over 105 GtCO2e in RCP8.5. We consider wind energy IC expansion scenarios that also encompass a range of possibilities that would lead to avoided GHG emissions of ~4–5 GtCO2e by 2030, increasing to around 10 GtCO2e in 2050 under current pledges to over 20 GtCO2e for the more advanced expansion scenarios.
Key uncertainties in the climate change mitigation potentials presented in this work derive from:
- The use of capacity factors (CF) for on- and off-shore wind energy describes the efficiency of electrical power production. Actual CF are dictated by physical variables such as the wind speed probability distribution at a given location and also to the physical dimensions of installed wind turbines (such as hub height and rotor diameter that tend to increase over time [37]). Further, wind turbine performance can decline over time as the technology ages [38]. CF are also determined by operational factors such as curtailment for grid management [39].
- Use of a fixed factor for avoided emissions of CO2e of 0.64 kg/kWh when it is likely that these vary both by region and over time [29].
- Using current projections and pipelines assumes that plans and targets for wind energy deployment will be realized. After 2030, uncertainty increases and by 2050 there is no available information regarding future expansion rates so it is assumed here that annual wind energy deployments continue at the level achieved in 2050.
Based on the possibility that wind energy can substantially contribute to both regional and global emissions reductions and to achieving the overall global plan of meeting the Paris Agreement, in the next section we examine whether there are barriers to this large-scale expansion of wind energy.
4. Are There Barriers to Wind Energy Expansion?
4.1. The Available Wind Resource under Climate Change
The available global wind resource has at least the potential to meet current world electricity demand [5]. The use of wind energy for electricity generation in specific regions with high current and substantial projections of increased wind energy penetration is also not limited by the resource. The technically feasible resource is estimated to be about ten times the current demand in both Europe (potential ~33,000 TWh/y) [26] and the USA (potential ~49,700 TWh/y) [29].
As a weather-dependent renewable energy source, it is possible that global climate non-stationarity may lead to changes in that resource [40,41]. Any such changes are likely to vary by region, rather than being universal increases or decreases [5,42]. It will be imposed on low-frequency variability in wind resources (years to decades) [43,44,45] that derives primarily from the influence of multiple internal climate modes (atmospheric modes such as the North Atlantic Oscillation (NAO), Pacific North American index (PNA), and Arctic Oscillation (AO) or Northern Annular Mode (NAM) and oceanic modes such as El Niño-Southern Oscillation (ENSO), Pacific Decadal Oscillation (PDO) and Atlantic Multidecadal Oscillation (AMO)) on cyclone frequency/intensity/tracking [46,47,48]. For example, the extended period of low electricity generation in the western USA during the first quarter of 2015 was linked to interactions between ENSO, PDO and the PNA [49] and periods of high wind generation in Northern Europe are linked to the occurrence of positive phase NAO [48].
Reduced latitudinal temperature gradients resulting from increased GHG concentrations may also change wind resources via changes in cyclone frequency [50], intensity [51], and/or tracks [52], and/or enhanced atmospheric water vapor and convective instability may impact the intensity of some meso- to synoptic-scale systems [53]. However, deconvoluting any change from current interannual to interdecadal variability is difficult [54], particularly given internal climate modes are themselves impacted by climate change [55].
Assessment of wind speed variability on time and spatial scales of relevance to wind energy continues to be hampered by the lack of long-term high-quality wind speeds at wind turbine hub-heights which are now an average of 89 m for onshore, 103 m for offshore and increasing [56]. Few in situ measurements at heights of approx. 100 m a.g.l. exist in the public domain [57], and while some reanalysis products now report wind speeds at 100 m a.g.l. (e.g., ERA5) they are spatially averaged (in the case of ERA5 the output is at 30 km by 30 km, but naturally the effective length scale is much larger) [58], do not represent all of the processes that impact flow regimes (e.g., terrain channeling) and are subject to inaccuracies deriving from factors such as excessive terrain drag [49]. Direct wind speed measurements are generally taken at 10 m a.g.l. where local terrain and barriers substantially influence the flow characteristics [59], changes in land use land cover change around observational stations can lead to time-varying drag [60], historical records are fractured and/or subject to inhomogeneities [61,62,63] and reanalysis products exhibit notable inconsistencies between the different products and relative to in situ measurements [63,64].
CMIP6 generation global Earth System Models (ESM) exhibit continuing improvements in terms of the representation of key climate modes responsible for low-frequency variability in wind resources [65] but are applied at effective scales that far exceed those that dictate wind resources and representation of cyclone climates, while improving, remains imperfect [66]. Use of direct output (e.g., daily mean or once daily wind speeds) from ESM for wind energy applications remains highly undesirable. Use of dynamical (i.e., application of regional models) [67,68] or statistical downscaling [44,69] is preferable in order to represent more fully the scales of motion responsible for dictating resource and resource variability, but naturally, projections of future resources from such experiments remain contingent on the sources of the lateral boundary conditions/predictor suites as provided by the ESM [5].
A summary of current research on the forcing of near-surface wind climates under greenhouse gas-induced warming can be found in [5] and is briefly summarized below:
- The majority of research on the causes of wind climate variability is focused on high wind resource/high deployment areas of Europe and/or North America.
- The wind energy industry works on timescales of decades relevant to current and planned wind farm lifetimes averaging close to 30 years [70] whereas the majority of climate change studies consider long time scales (i.e., most have considered periods at the end of the current century) where the climate change signal may be more evident.
- Variability in wind resource projections for a given region arises from the global and regional model applied, or predictors to statistical downscaling, resolution of the model, and specific climate forcing scenario. Differences in the mean future wind resource from the current manifestation appear to be of small magnitude and of similar/smaller magnitudes than current inter-annual variability.
- There may not be an overall increase or decrease in wind speeds but rather regional variations which may link to storm track changes. For example, research focused on Europe suggests that wind resources in the north may slightly increase linked to small declines in the Mediterranean. Similarly, there may be changes in the timing of the resource such as increases in winter wind speeds and small declines in summer. Results from downscaling experiments indicate some evidence for increasing resource magnitudes over northern Europe and amplification of the seasonal cycle with the higher resource in winter and lower in the summer, declines over southern Europe (including the Mediterranean). In the USA, wind resources in the southern Great Plains are projected to increase while there is some evidence of declines in the more complex terrain in the western USA [5].
Making resource projections under climate non-stationarity remains challenging and further work is certainly warranted.
4.2. Costs
Much of the expansion of wind energy IC in the near term is projected to occur in the form of wind turbines deployed onshore (Figure 4) and thus will likely employ existing technology and be subject to a relatively low levelized cost of energy (LCoE). Expansion of the scale of offshore deployments may require additional technological advances and may be associated with higher LCoE.
The cost of onshore wind energy is now lower than for most generation types and is, therefore, an incentive rather than a barrier. The cost of electricity generated from wind turbines deployed onshore is below USD 40/MWh in the USA and Europe and below USD 60/MWh in Asia [56]. These costs have declined markedly over the last decade are expected to continue to decrease [56]. Installed costs for onshore wind are expected to drop to USD 0.8–1.3 million per MW of IC (m/MW) and USD 0.65–1.0 million by 2030 from USD 1.5 m/MW in 2018 [27]. Recent projections based on an expert elicitation indicate cost reductions (relative to 2018) of 37% for offshore wind by 2050 [56].
The current levelized cost of energy (LCoE) expressed per Mega-Watt hour of electricity generation (MWh) from offshore wind is estimated to be USD ~100/MWh, with a range of about USD ± 50/MWh [71]. Specific country costs have a range of USD 106–171/MWh that depend on physical parameters (distance to the coast, water depth, etc.) as well as financing structure [72]. The cost of offshore wind energy costs is expected to decline to less than USD 50/MWh in all regions by 2050 [56].
Much of the offshore wind resource lies in water depths greater than 50–60 m where floating offshore wind energy is required. In 2020, 66 MW of floating wind IC are installed, 19 MW in Japan and the remainder in Europe [16]. According to some estimates; 80% of the resource in Europe, 58% in the USA [71] and 60% in China and 80% in Japan [27] will require the use of floating wind turbines. A capacity of 3–19 GW of floating offshore wind by 2030 is anticipated, depending on the relative cost [16] or as much as 5–30 GW, increasing to 1000 GW by 2050 [27]. Costs are currently estimated at above USD 175/MWh and are anticipated to fall below USD 70/MWh by 2030 [71] or in the range of USD 50–80 MWh by 2050 [56].
This summary thus suggests that expansion of wind energy installed capacity will require substantial capital investment and is likely to generate significant financial returns.
4.3. Repowering and Recycling
Wind turbine lifetimes are now close to 30 years [70]. Nevertheless, many wind turbines will either reach the end of their useful life before 2050 (50% in Europe by 2030 [21], 30% in the USA by the end of 2020 [73]) and be decommissioned or retrofitted. Retrofitting is cost-effective because it allows the continued use of infrastructure (grid connections, foundations, access roads). This retrofitting usually involves repowering where wind turbines are altered/replaced with those with increased rotor diameter or hub-height [37] leading to large increments in rated power. Repowering can also involve the replacement of the nacelle with no change in the tower or rotor. This can increase power output by up to 16% [21]. Repowering existing sites is expected to be an important part of future wind energy capacity [74,75]. In Europe, from a total of 38 GW of onshore wind capacity ending operational life over the next five years, nearly 29 GW will undergo lifetime extension and 2.4 GW be repowered [28]. In 2019, nearly 3 GW of repowering was undertaken in the USA [37]. In general, repowering increases both IC and capacity factors.
About 85–90% of a wind turbine can already be recycled (steel, cement, copper, etc.), and full lifecycle assessment suggests that further improvements can be made, particularly for the capital infrastructure which accounts for most of the GHG emissions and hence climate change impacts [9]. The use of glass fiber and resin for wind turbine blades has made recycling more challenging [76]. The European wind industry has proposed on Europe-wide ban on disposing of wind turbine blades via landfill [77] and is working on blade recycling technologies that include materials for new blades or industrial applications [78].
4.4. Materials, Manufacturing, Legal and Workforce Needs
As described herein, Europe has plans to expand by 10–20 times offshore wind current capacity reaching between 230 and 450 GW by 2050 [79]. The USA has a goal of 30 GW of installed capacity by 2030 [17] and the UK plans 40 GW [17]. Asia’s offshore capacity is expected to increase rapidly with twice as much investment as Europe in offshore wind annually to 2030, increasing to 3.5 times by 2050 [27]. Enactment of the IEA NZE by 2030 will require annual installation rates of wind energy that are about twice those in 2020 [11]. The implication is that significant new supply chains will need to emerge, and that deployment and manufacturing capability expansion is needed. Annual manufacturing and assembly capacity in the USA in 2018 was ~15 GW for nacelles, ~9.2 GW for blades and ~8.9 GW for towers in 2018 [27]. Thus, considerable investment in workforce development and manufacturing would be needed to install more than the current rate of ~16 GW per year. Similarly in Europe, to meet the expected level of the annual additional deployment 27 GW is needed up from the current 15 GW requiring significant expansion of manufacturing and deployment capacity [79].
The expansion of wind energy deployment and by association wind turbine manufacture, in turn, relies on substantial increases in the use of raw materials. Over 400 tonnes of concrete is required per 1 MW of installed onshore wind or 400 tonnes of steel per 1 MW offshore wind installed using current technology [27]. Studies estimating the materials/resources needed for such expansion of the wind energy industry have indicated some potential bottlenecks such as copper and dysprosium [80,81].
Human resources will also be needed. IRENA estimates nearly 5 million jobs would be created by 2050, in addition to over 1 million positions in wind energy today [27].
In summary, there are remaining technical and social barriers to large-scale wind energy deployment [11,82]. Policy and technical needs to enable large-scale wind energy expansion are discussed further in [26,27]. In addition to the manufacturing scaling-up described above, other issues include permitting leading to undersubscribed auctions in Europe and could lead to less than 80 GW rather than 105 GW being installed in Europe to 2025 [28]. The complexity of the legal framework for offshore wind development, as well as the supply chain and marine logistics, were also described as additional risks for the USA and European markets [71,79]. In the USA, all of the major transmission system operators have backlogs amounting to around 600 MW in terms of interconnections to the grid [30]. Some estimates indicate Europe needs six times the current rate of grid installation if the green deal targets are to be met [79].
5. Discussion and Conclusions
The global population is rising at 1.1%/yr [83] and the use of TPES and electricity continue to rise at annualized rates of 3.7% and 7.4%, respectively [7]. Atmospheric carbon dioxide concentrations passed 410 ppm in 2019 [84] and globally we emit nearly 46 billion tonnes of greenhouse gases (measured in carbon dioxide equivalents, CO2e) each year [85]. A substantial fraction of those GHG emissions derives from the energy sector. These trends raise the specter of unprecedented and uncontrolled rises in global air temperatures and associated climate change risks. This has prompted individual countries and economic zones to sign the Paris climate agreement and develop strategies to decarbonize their energy systems, and in some cases to propose net-zero emissions by 2050. In parallel, major global organizations such as the International Energy Agency have advanced technically feasible projections for expansion of renewable energy and electrification of the energy system. One of the most mature and readily scalable renewable electricity generation technologies is wind energy. It has seen rapid expansion and substantial cost reductions during the last decades and is a key lynchpin in many national and global strategies for decarbonization of the energy supply.
Here we document the historical growth of the wind energy industry, articulate projections for increased installed capacity from different agencies and address the questions; if the projections for this individual renewable energy technology—wind energy—were to be realized what climate change mitigation could be achieved? How will/could different countries and regions contribute to that mitigation? Are there clear barriers to realizing the required expansion of wind energy installed capacity?
Much of this historical expansion and global wind energy installations are focused on China, the US, and the European Union plus the United Kingdom. These countries are also likely to be the focus on the near-term expansion of installed capacity. For example, China has current wind energy installed capacity (end of 2020) of 288 GW and plans to deploy an additional 50 GW annually until 2025, subsequently increasing to 60 GW/yr.
A number of organizations have developed global growth scenarios for wind energy installed capacity. Projections of wind energy installed capacity at the end of 2050 from IRENA, IEA NZE and GWEC range from approximately 5000 GW to approximately 8200 GW. The projections at the global scale from IRENA of technically feasible expansion of the wind energy industry, are below those issued by the IEA NZE and GWEC but include information at the national level. Replacing the wind energy contributions from the IPCC RCP with the IRENA projections for wind and using the following key assumptions:
- An electricity generation efficiency from onshore wind that increases from 34% to 45% by 2050 and for the offshore wind of 43% increasing to 50% by 2050.
- The wind energy-derived electricity displaces the mean current USA generation supply in terms of CO2 emission per TWh of electricity.
- The transient climate response to cumulative emissions of carbon is 0.54 °C per 1000 GtCO2.
The climate change mitigation from wind energy by 2100 would be 0.3–0.8 °C depending on the RCP emissions scenario.
If the USA achieves its specified NDC, annual GtCO2e emissions will decline from over 6.3 GtCO2e in 2020 to 5 GtCO2e by 2050. However, if they were to achieve additional electrification of industry and transportation and the regional IRENA goal for wind energy expansion, it may be possible to reduce national greenhouse gas emission by 2050 to below 3 GtCO2e. Countries that are still developing their emissions reductions strategy such as the USA can greatly increase the proportion of wind energy in their energy portfolio leading to an even more dramatic reduction of GHG emissions.
An earlier analysis of the wind energy climate change mitigation potential based on the status in 2013 [3] showed that for the most ambitious wind energy expansion plan available at that time (GWEC-Advanced) proposed wind energy IC would increase from 282 GW to ~4800 GW so that wind energy generates ~30% of global electricity supply (~12,000 TWh/y). This was estimated to decrease cumulative CO2 emissions to 2050 by around 600 GtCO2. Depending on the RCP followed, implementing this wind energy expansion scenario was found to reduce likely global temperature increase at 2100 compared to the pre-industrial by ~0.3 °C and although passing the warming threshold of ΔT = 1.5 °C is inevitable it is delayed by up to 6 years.
As of 2021, wind turbines are now deployed in 90 countries and, depending on the precise source of information, generate ~6–7% of global electricity. Between 2012 and 2021 there was the continued expansion of wind energy IC from 282 GW to 742 GW and wind energy IC growing at an annualized rate of ~14%. This expansion is almost equal to achieving the original GWEC Advanced scenario. The new projections for wind energy expansion are even more ambitious than those available in 2013. However, cumulative GHG emissions grow each year. The IPCC report released in 2021 indicated cumulative CO2 emissions are already at 2390 ± 240 GtCO2, and the remaining carbon budget is in the range 300–2300 GtCO2 [86]. There remains no expectation of a reduction in energy demand prior to 2050. As shown here, much more ambitious plans are now required to delay, and potentially avoid the warming threshold of ΔT = 1.5–2 °C. Advanced wind energy scenarios involving >6000 GW of installed capacity by 2050 can help to provide low carbon electricity and reduce CO2 emissions by up to 15 GtCO2 per year, but even these plans will be insufficient to avoid the 1.5 °C warming threshold without reductions in energy use and GHG emissions from other sectors. Even with the enactment of the most ambitious wind energy expansion scenario, if other aspects of the future world continue to follow the IPCC RCP8.5 scenario, the ΔT = 2 °C threshold will be passed in the 2040s. If expanded wind energy is coupled with the RCP4.5 scenario then passing the ΔT = 2 °C threshold would be entirely avoided.
While the scale of anthropogenic climate change is daunting, research presented herein illustrates that wind energy can substantially reduce emissions of greenhouse gases at the national and global scale and measurably reduce the amount of temperature increase. The investment needed to achieve the required expansion of the wind energy installed capacity is substantial but the LCoE from wind is competitive, and a substantial fraction of IC increases may be achieved via repowering and thus require no additional land. Substantial upscaling of manufacturing and installation capacity is required, streamlining of permitting processes would greatly facilitate the expansion of renewable energy penetration of the electricity supply and system-wide electrification is essential.
Author Contributions
Conceptualization, methodology, analysis, resources, R.J.B. and S.C.P. Writing—original draft preparation, R.J.B.; writing—review and editing, S.C.P. Both authors have read and agreed to the published version of the manuscript.
Funding
This research was funded by the U.S. Department of Energy (DoE), grant numbers (DE-SC0016605).
Data Availability Statement
Data used herein are publicly available and sources are cited with each figure and table.
Acknowledgments
We would like to acknowledge the academic membership provided by the Global Wind Energy Council.
Conflicts of Interest
The authors declare no conflict of interest.
Nomenclature
| APC | Announced Pledges Case |
| bcm gas | Billion cubic meters of natural gas |
| CF | Capacity Factors. CF measures the efficiency of electricity production from wind turbines. They are the ratio of the amount of power produced normalized by the potential power produced if all wind turbines run at their rated capacity (usually annual). |
| CO2 | Carbon dioxide. GtCO2 indicates Giga-tonnes (i.e., 109 tonnes) of carbon dioxide. |
| CO2e | Carbon dioxide equivalents. CO2e for gas are computed by their mass emissions by their “global warming potential” (GWP) which represents the warming impacts from that gas compared to CO2 over some time horizon. |
| EU27 | 27 countries that comprise the European Union (EU) |
| EU28 | 27 countries that comprise the European Union (EU) plus the UK |
| GDP | Gross Domestic Product |
| GHG | Greenhouse gases |
| GW | GigaWatts (109 Watts (Joules per second)) |
| GWEC | Global Wind Energy Council |
| IC | Installed Capacity. This is a measure of the total power production (in Watts or GW) that could be produced from the wind turbine fleet if all were operating at peak power production (i.e., their rated of nameplate capacity). |
| IEA | International Energy Agency |
| IEA NZE | International Energy Agency Net Zero Emissions scenario |
| IEA STEPS | International Energy Agency Stated Policies scenario |
| IPCC-RCP | Intergovernmental Panel on Climate Change Fifth Assessment Report Representative Concentration Pathways |
| IRENA | International Renewable Energy Agency |
| kWh | kilo-Watt hour |
| LCoE | Levelized Cost of Energy |
| Mtoe | Million tonnes of oil equivalent |
| NDC | Nationally Determined Contributions |
| TPES | Total Primary Energy Supply |
| TCRE | Transient Climate Response to cumulative Emissions of carbon |
| TWh | Terra-Watt hours |
| UNFCCC | United Nation Framework Convention on Climate Change |
References
- United Nations Environment Programme. Emissions Gap Report 2019; UNEP: Nairobi, Kenya, 2019; p. 108. ISBN 978-92-807-3766-0. Available online: https://wedocs.unep.org/bitstream/handle/20.500.11822/30797/EGR2019.pdf?sequence=1&isAllowed=y (accessed on 30 June 2021).
- United Nations Climate Change. The Paris Agreement. Available online: https://unfccc.int/process-and-meetings/the-paris-agreement/the-paris-agreement (accessed on 2 July 2021).
- Barthelmie, R.J.; Pryor, S.C. Potential contribution of wind energy to climate change mitigation. Nat. Clim. Chang. 2014, 4, 684–688. [Google Scholar] [CrossRef]
- Lazard. Lazards Levelized Cost of Energy Analysis—Version 14.0. 2020. Available online: https://www.lazard.com/perspective/lcoe2020 (accessed on 30 June 2021).
- Pryor, S.C.; Barthelmie, R.J.; Bukovsky, M.S.; Leung, L.R.; Sakaguchi, K. Climate change impacts on wind power generation. Nat. Rev. Earth Environ. 2020, 1, 627–643. [Google Scholar] [CrossRef]
- IEA. Key World Energy Statistics 2020; IEA Publications: Paris, France, 2020; p. 81. Available online: https://webstore.iea.org/download/direct/4093?fileName=Key_World_Energy_Statistics_2020.pdf (accessed on 31 March 2021).
- IEA. Global Energy & CO2 Status Report 2019; IEA: Paris, France, 2019; p. 29. Available online: https://www.iea.org/reports/global-energy-co2-status-report-2019 (accessed on 2 July 2021).
- Kumar, I.; Tyner, W.E.; Sinha, K.C. Input–output life cycle environmental assessment of greenhouse gas emissions from utility scale wind energy in the United States. Energy Policy 2016, 89, 294–301. [Google Scholar] [CrossRef]
- Bonou, A.; Laurent, A.; Olsen, S.I. Life cycle assessment of onshore and offshore wind energy-from theory to application. Appl. Energy 2016, 180, 327–337. [Google Scholar] [CrossRef] [Green Version]
- BP. Available online: https://www.bp.com/content/dam/bp/business-sites/en/global/corporate/pdfs/energy-economics/statistical-review/bp-stats-review-2019-approximate-conversion-factors.pdf (accessed on 30 July 2021).
- GWEC. Global Wind Report 2021; GWEC: Brussels, Belgium, 2021; p. 80. Available online: https://gwec.net/global-wind-report-2021/ (accessed on 30 June 2021).
- IRENA. Untapped Potential for Climate Action. Renewable Energy in Nationally Determined Contributions; International Renewable Energy Association: Abu Dhabi, United Arab Emirates, 2017; p. 36. ISBN 978-92-9260-043-3. [Google Scholar]
- United Nations Climate Change. NDC Registry (Interim). Available online: https://www4.unfccc.int/sites/NDCStaging/Pages/Party.aspx?party=EUU&prototype=1 (accessed on 9 July 2021).
- IEA. Net Zero by 2050; IEA: Paris, France, 2021; p. 223. Available online: https://www.iea.org/reports/net-zero-by-2050 (accessed on 9 July 2021).
- IEA. The Role of China’s ETS in Power Sector Decarbonisation; IEA: Paris, France, 2021; p. 86. Available online: https://www.iea.org/reports/the-role-of-chinas-ets-in-power-sector-decarbonisation (accessed on 9 July 2021).
- GWEC. Global Offshore Wind Report 2020; GWEC: Brussels, Belgium, 2020; p. 102. [Google Scholar]
- The White House. FACT SHEET: Biden Administration Jumpstarts Offshore Wind Energy Projects to Create Jobs 03/29/2020. 2021. Available online: https://www.whitehouse.gov/briefing-room/statements-releases/2021/03/29/fact-sheet-biden-administration-jumpstarts-offshore-wind-energy-projects-to-create-jobs/ (accessed on 30 March 2021).
- US Energy Information Adminstration. Electric Power Annual 2019; Washington, DC, USA, 2021; p. 240. Available online: https://www.eia.gov/electricity/annual/ (accessed on 29 March 2021).
- U.S. Department of Energy. Wind Vision Detailed Roadmap Actions 2017 Update; DOE/GO-102018-5056; U.S. Department of Energy: Washington, DC, USA, 2018; p. 68. Available online: https://www.energy.gov/sites/prod/files/2018/05/f51/WindVision-Update-052118-web_RMB.pdf (accessed on 2 July 2021).
- HM Government. The Ten Point Plan for a Green Industrial Revolution. 2020; p. 38. Available online: https://assets.publishing.service.gov.uk/government/uploads/system/uploads/attachment_data/file/936567/10_POINT_PLAN_BOOKLET.pdf (accessed on 10 July 2021).
- IEA. IEA Wind Energy Annual Report 2019; International Energy Agency, 2019; p. 164. Available online: https://iea-wind.org/portfolio-item/annual-report-2019/ (accessed on 30 June 2021).
- EIA. US Energy Information Agency, Monthly Energy Review and Electric Power Monthly, February 2021, Preliminary Data for 2020. Available online: https://www.eia.gov/electricity/monthly/ (accessed on 2 April 2021).
- IEA. Electricity information 2019; International Energy Agency: Paris, France, 2019; p. 703. ISBN 978-92-64-98635-0. [Google Scholar]
- IEA. Renewables 2019: Analysis and forecast to 2024; International Energy Agency: Paris, France, 2019; ISBN 978-92-64-36998-6. Available online: https://iea.blob.core.windows.net/assets/a846e5cf-ca7d-4a1f-a81b-ba1499f2cc07/Renewables_2019.pdf (accessed on 31 March 2021).
- WindEurope. Wind Is Not Growing Fast Enough for EU Economy to Go Climate-Neutral. 25 February 2021. Available online: https://windeurope.org/newsroom/press-releases/wind-is-not-growing-fast-enough-for-eu-economy-to-go-climate-neutral/#:~:text=Europe%20installed%2014.7%20GW%20of,of%20this%20was%20onshore%20wind.&text=But%20Europe%20is%20not%20building,55%25%20emissions%20reductions%20by%202030 (accessed on 2 April 2021).
- WindEurope. Getting Fit for 55 and Set for 2050. Electrifying Europe with Wind Energy; WindEurope, 2021; p. 72. Available online: https://etipwind.eu/publications/getting-fit-for-55/ (accessed on 9 June 2021).
- IRENA. FUTURE OF WIND Deployment, Investment, Technology, Grid Integration and Socio-Economic Aspects; International Renewable Energy Agency: Abu Dhabi, United Arab Emirates, 2019; p. 88. ISBN 978-92-9260-155-3. [Google Scholar]
- WindEurope. Wind Energy in Europe 2020. 2020 Statistics and the Outlook for 2021–2025; Wind Europe: Brussels, Belgium, 5 March 2021; p. 36. [Google Scholar]
- U.S. Department of Energy. Wind Vision: A New Era for Wind Power in the United States; DOE/GO-102015-4557; U.S. Department of Energy: Washington, DC, USA, 2015; p. 348. Available online: https://www.energy.gov/sites/prod/files/WindVision_Report_final.pdf (accessed on 1 July 2021).
- American Clean Power. Clean Power Quarterly 2021 Q1; American Clean Power: Washington, DC, USA, 2021; p. 76. [Google Scholar]
- IEA. Offshore Wind Outlook; IEA: Paris, France, 2019; p. 98. [Google Scholar]
- IPCC. Climate Change 2014: Synthesis Report. Contribution of Working Groups I, II and III to the Fifth Assessment Report of the Intergovernmental Panel on Climate Change; Core Writing Team, Pachauri, R.K., Meyer, L.A., Eds.; IPCC: Geneva, Switzerland, 2014; 155p, Available online: https://www.ipcc.ch/report/ar5/syr/ (accessed on 1 April 2014).
- Rogelj, J.; Shindell, D.; Jiang, K.; Fifita, S.; Forster, P.; Ginzburg, V.; Handa, C.; Kheshgi, H.; Kobayashi, S.; Kriegler, E.; et al. Mitigation Pathways Compatible with 1.5 °C in the Context of Sustainable Development. In Global Warming of 1.5 °C; IPCC: Geneva, Switzerland, 2018; pp. 93–174. [Google Scholar]
- Intergovernmental Panel on Climate Change. Climate Change 2013. The Physical Science Basis. Working Group I Contribution to the Fifth Assessment Report of the Intergovernmental Panel on Climate Change. Summary for Policymakers; Cambridge University Press: Cambridge, UK; New York, NY, USA, 2013; p. 27. [Google Scholar]
- Schwalm, C.R.; Glendon, S.; Duffy, P.B. RCP8.5 tracks cumulative CO2 emissions. Proc. Natl. Acad. Sci. USA 2020, 117, 19656. [Google Scholar] [CrossRef] [PubMed]
- Climate Action Tracker. 2021. Available online: https://climateactiontracker.org/global/temperatures/&https://climateactiontracker.org/countries (accessed on 16 July 2021).
- Wiser, R.; Bollinger, M.; Hoen, B.; Millstein, D.; Rand, J.; Barbose, G.; Darghouth, N.; Gorman, N.; Jeong, S.; Mills, A.; et al. Wind Energy Technology Data Update: 2020 Edition. 2020. Available online: https://emp.lbl.gov/wind-technologies-market-report/ (accessed on 12 July 2021).
- Hamilton, S.; Millstein, D.; Bolinger, M.; Wiser, R.; Jeong, S. How Does Wind Project Performance Change with Age in the United States? Joule 2020, 4, 1004–1020. [Google Scholar] [CrossRef]
- Bird, L.; Lew, D.; Milligan, M.; Carlini, E.M.; Estanqueiro, A.; Flynn, D.; Miller, J. Wind and solar energy curtailment: A review of international experience. Renew. Sustain. Energy Rev. 2016, 65, 577–586. [Google Scholar] [CrossRef] [Green Version]
- Pryor, S.C.; Barthelmie, R.J. Climate change impacts on wind energy: A review. Renew. Sustain. Energy Rev. 2010, 14, 430–437. [Google Scholar] [CrossRef]
- Pryor, S.C.; Barthelmie, R.J. Assessing the vulnerability of wind energy to climate change and extreme events. Clim. Chang. 2013, 121, 79–91. [Google Scholar] [CrossRef]
- Pryor, S.C.; Barthelmie, R.J. Renewable energy resources—ocean energy: Wind/wave/tidal/sea currents. In Climate Vulnerability: Understanding and Addressing Threats to Essential Resources; Pielke, R.A., Ed.; Elsevier: Amsterdam, The Netherlands, 2013; pp. 65–81. ISBN 9780123847034. [Google Scholar]
- Pryor, S.C.; Shepherd, T.J.; Barthelmie, R.J. Interannual variability of wind climates and wind turbine annual energy production. Wind Energy Sci. 2018, 3, 651–665. [Google Scholar] [CrossRef] [Green Version]
- Pryor, S.C.; Hahmann, A.N. Downscaling wind. In Oxford Research Encyclopedia, Climate Science; von Storch, H., Ed.; Oxford University Press: New York, NY, USA, 2019. [Google Scholar] [CrossRef]
- Jung, C.; Taubert, D.; Schindler, D. The temporal variability of global wind energy–Long-term trends and inter-annual variability. Energy Convers. Manag. 2019, 188, 462–472. [Google Scholar] [CrossRef]
- Bett, P.E.; Thornton, H.E.; Clark, R.T. Using the Twentieth Century Reanalysis to assess climate variability for the European wind industry. Theor. Appl. Climatol. 2017, 127, 61–80. [Google Scholar] [CrossRef] [Green Version]
- Moemken, J.; Reyers, M.; Buldmann, B.; Pinto, J.G. Decadal predictability of regional scale wind speed and wind energy potentials over Central Europe. Tellus Ser. A-Dyn. Meteorol. Oceanogr. 2016, 68, 29199. [Google Scholar] [CrossRef]
- Pryor, S.C.; Barthelmie, R.J.; Schoof, J.T. Inter-annual variability of wind indices across Europe. Wind Energy 2006, 9, 27–38. [Google Scholar] [CrossRef]
- Pryor, S.C.; Letson, F.; Barthelmie, R.J. Variability in wind energy generation across the contiguous USA. J. Appl. Meteorol. Climatol. 2020, 59, 2021–2039. [Google Scholar] [CrossRef]
- Bengtsson, L.; Hodges, K.; Roeckner, E. Storm Tracks and Climate Change. J. Clim. 2006, 19, 3518–3543. [Google Scholar] [CrossRef] [Green Version]
- Catto, J.L.; Ackerley, D.; Booth, J.F.; Champion, A.J.; Colle, B.A.; Pfahl, S.; Pinto, J.G.; Quinting, J.F.; Seiler, C. The Future of Midlatitude Cyclones. Curr. Clim. Chang. Rep. 2019, 5, 407–420. [Google Scholar] [CrossRef] [Green Version]
- O’Gorman, P.A. Understanding the varied response of the extratropical storm tracks to climate change. Proc. Natl. Acad. Sci. USA 2011, 107, 19176–19180. [Google Scholar] [CrossRef] [Green Version]
- McCabe, G.; Clark, M.; Serreze, M. Trends in northern hemisphere surface cyclone frequency and intensity. J. Clim. 2001, 14, 2763–2768. [Google Scholar] [CrossRef]
- Knutson, T.; Camargo, S.J.; Chan, J.C.L.; Emanuel, K.; Ho, C.H.; Kossin, J.; Mohapatra, M.; Satoh, M.; Sugi, M.; Walsh, K.; et al. Tropical Cyclones and Climate Change Assessment: Part I: Detection and Attribution. Bull. Am. Meteorol. Soc. 2019, 100, 1987–2007. [Google Scholar] [CrossRef] [Green Version]
- Kuzmina, S.; Bengtsson, L.; Johannessen, O.; Drange, H.; Bobylev, L.; Miles, M. The North Atlantic Oscillation and greenhouse-gas forcing. Geophys. Res. Lett. 2005, 32, L04703. [Google Scholar] [CrossRef] [Green Version]
- Wiser, R.; Rand, J.; Seel, J.; Beiter, P.; Baker, E.; Lantz, E.; Gilman, P. Expert elicitation survey predicts 37% to 49% declines in wind energy costs by 2050. Nat. Energy 2021, 6, 555–565. [Google Scholar] [CrossRef]
- Kusiak, A. Share data on wind energy: Giving researchers access to information on turbine performance would allow wind farms to be optimized through data mining. Nature 2016, 529, 19–22. [Google Scholar] [CrossRef]
- Pryor, S.C.; Barthelmie, R.J. A global assessment of extreme wind speeds for wind energy applications. Nat. Energy 2021, 6, 268–276. [Google Scholar] [CrossRef]
- Palma, J.; Castro, F.A.; Ribeiro, L.F.; Rodrigues, A.; Pinto, A. Linear and nonlinear models in wind resource assessment and wind turbine micro-siting in complex terrain. J. Wind Eng. Ind. Aerodyn. 2008, 96, 2308–2326. [Google Scholar] [CrossRef]
- Wu, J.; Zha, J.L.; Zhao, D.M.; Yang, Q.D. Changes in terrestrial near-surface wind speed and their possible causes: An overview. Clim. Dyn. 2018, 51, 2039–2078. [Google Scholar] [CrossRef] [Green Version]
- Letson, F.; Pryor, S.C.; Barthelmie, R.J.; Hu, W. Observed gust wind speeds in the coterminous United States, and their relationship to local and regional drivers. J. Wind Eng. Ind. Aerodyn. 2018, 173, 199–209. [Google Scholar] [CrossRef]
- Wan, H.; Wang, X.L.; Swail, V.R. Homogenization and Trend Analysis of Canadian Near-Surface Wind Speeds. J. Clim. 2010, 23, 1209–1225. [Google Scholar] [CrossRef]
- Pryor, S.C.; Barthelmie, R.J.; Young, D.T.; Takle, E.S.; Arritt, R.W.; Flory, D.; Gutowski, W.J.; Nunes, A.; Roads, J. Wind speed trends over the contiguous United States. J. Geophys. Res. 2009, 114, D14105. [Google Scholar] [CrossRef]
- Ramon, J.; Lledó, L.; Torralba, V.; Soret, A.; Doblas-Reyes, F.J. What global reanalysis best represents near-surface winds? Q. J. R. Meteorol. Soc. 2019, 145, 3236–3251. [Google Scholar] [CrossRef] [Green Version]
- Coburn, J.J.; Pryor, S.C. Differential Credibility of Climate Modes in CMIP6. J. Clim. 2021, in press. [Google Scholar] [CrossRef]
- Priestley, M.D.; Ackerley, D.; Catto, J.L.; Hodges, K.I.; McDonald, R.E. An overview of the extratropical storm tracks in CMIP6 historical simulations. J. Clim. 2020, 33, 6315–6343. [Google Scholar] [CrossRef]
- Pryor, S.C.; Barthelmie, R.J.; Schoof, J.T. The impact of non-stationarities in the climate system on the definition of ‘a normal wind year’: A case study from the Baltic. Int. J. Climatol. 2005, 25, 735–752. [Google Scholar] [CrossRef] [Green Version]
- Pryor, S.C.; Barthelmie, R.J. Assessing climate change impacts on the near-term stability of the wind energy resource over the USA. Proc. Natl. Acad. Sci. USA 2011, 108, 8167–8171. [Google Scholar] [CrossRef] [PubMed] [Green Version]
- Pryor, S.C.; Schoof, J.T.; Barthelmie, R.J. Winds of Change? Projections of near-surface winds under climate change scenarios. Geophys. Res. Lett. 2006, 33, L11702. [Google Scholar] [CrossRef] [Green Version]
- Wiser, R.H.; Bolinger, M. Benchmarking Anticipated Wind Project Lifetimes: Results from a Survey of US Wind Industry Professionals; Berkeley Lab: Electricity Markets and Policy Group. 2019. Available online: https://emp.lbl.gov/publications/benchmarking-anticipated-wind-project (accessed on 3 October 2019).
- Musial, W.; Beiter, J.; Spitsen, P.; Nunemaker, J.; Gevorgian, V. 2018 Offshore Wind Technologies Market Report; Department of Energy: Washington, DC, USA, 2019; p. 94. [Google Scholar]
- Noonan, M.; Stehly, T.; Mora, D.; Kitzing, L.; Gavin Smart, G.; Berkhout, V.; Kikuchi, Y. IEA Wind TCP Task 26: Offshore Wind Energy International Comparative Analysis; IEA Wind: Roskilde, Denmark, 2018; p. 71. [Google Scholar]
- Pryor, S.C.; Barthelmie, R.J. 20% Wind by 2030. Wind Int. 2020. Available online: https://www.windtech-international.com/editorial-features/20-wind-by-2030 (accessed on 10 June 2020).
- Grau, L.; Jung, C.; Schindler, D. Sounding out the repowering potential of wind energy—A scenario-based assessment from Germany. J. Clean. Prod. 2021, 293, 126094. [Google Scholar] [CrossRef]
- Pryor, S.C.; Barthelmie, R.J.; Shepherd, T. 20% of US electricity from wind: Impacts on system efficiency and regional climate. Nat. Sci. Rep. 2020, 10, 541. [Google Scholar] [CrossRef]
- Sommer, V.; Walther, G. Recycling and recovery infrastructures for glass and carbon fiber reinforced plastic waste from wind energy industry: A European case study. Waste Manag. 2021, 121, 265–275. [Google Scholar] [CrossRef]
- WindEurope. Wind Industry Calls for Europe-Wide Ban on Landfilling Turbine Blades. Available online: https://windeurope.org/newsroom/press-releases/wind-industry-calls-for-europe-wide-ban-on-landfilling-turbine-blades/ (accessed on 16 June 2021).
- Jensen, J.P.; Skelton, K. Wind turbine blade recycling: Experiences, challenges and possibilities in a circular economy. Renew. Sustain. Energy Rev. 2018, 97, 165–176. [Google Scholar] [CrossRef]
- WindEurope. The EU Offshore Renewable Energy Strategy; Brussels, Belgium, 2020. Available online: https://windeurope.org/wp-content/uploads/files/policy/position-papers/20200610-WindEurope-offshore-renewable-energy-strategy.pdf (accessed on 12 July 2021).
- Cristóbal, J.; Jubayed, M.; Wulff, N.; Schebek, L. Life cycle losses of critical raw materials from solar and wind energy technologies and their role in the future material availability. Resour. Conserv. Recycl. 2020, 161, 104916. [Google Scholar] [CrossRef]
- Shammugam, S.; Gervais, E.; Schlegl, T.; Rathgeber, A. Raw metal needs and supply risks for the development of wind energy in Germany until 2050. J. Clean. Prod. 2019, 221, 738–752. [Google Scholar] [CrossRef]
- WindEurope. Available online: https://windeurope.org/about-wind/wind-energy-today/ (accessed on 30 June 2021).
- The World Bank. Available online: https://data.worldbank.org/indicator/SP.POP.TOTL (accessed on 30 July 2021).
- US Global Change Research Program. Available online: https://www.globalchange.gov/browse/indicators/atmospheric-carbon-dioxide (accessed on 30 July 2021).
- The World Bank. Available online: https://data.worldbank.org/indicator/EN.ATM.GHGT.KT.CE (accessed on 30 July 2021).
- IPCC. Climate Change 2021: The Physical Science Basis. Contribution of Working Group I to the Sixth Assessment Report of the Intergovernmental Panel on Climate Change; Masson-Delmotte, V., Zhai, P., Pirani, A., Connors, S.L., Péan, C., Berger, S., Caud, N., Chen, Y., Goldfarb, L., Gomis, M.I., et al., Eds.; Cambridge University Press: Cambridge, UK, 2021; Available online: https://www.ipcc.ch/report/ar6/wg1/#FullReport (accessed on 17 August 2021).
Figure 1.
Energy demand and annual energy demand growth from selected sources [7]. To enable comparison across different fuel types they were also converted to electricity in TWh (NB. Not calorific equivalents). (a) Energy demand (2018) by country/area where ROW = Rest of World. (b) Annual growth 2017–2018 (in %). Conversion factors; 1 Mtoe produces approx. 4.4 TWh electricity; 1 barrel of oil per day = 49.8 tonnes per year; 1 bcm gas = 0.86 Mtoe; 1.5 tonnes of hard coal or 3 tonnes lignite and sub-bituminous coal (average 2.25 tonnes = 1 tonne oil) [10].

Figure 2.
Total installed capacity (IC) of wind energy show by region (solid bars, left axis). The offshore installed capacity for Asia, Europe and North America is indicated using the same colors and thinner hatched bars (right axis). The solid black line shows the accumulation of global IC and the dashed line denotes a 14.2% annualized growth rate. Data from [11].

Figure 3.
Wind energy installed capacity (IC) (a) Current IC (2018) and NDC/pledges/targets to 2030 and 2050 (b) Implied expansion of IC in different countries/regions under more ambitious wind energy scenarios. Values are estimated from IRENA [27], IEA NZE [14], GWEC [11].

Figure 4.
Global scenarios for the growth of wind energy IC. Data estimated from IEA NZE [14], IRENA [27] and GWEC [11,16]. The solid black line shows total wind energy IC while offshore IC is shown by the blue bars and onshore IC by the grey bars.

Figure 5.
Representative Concentration Pathways (RCP) from the Intergovernmental Panel on Climate Change Emissions Scenarios [34]. (a) Cumulative CO2 emissions in GtCO2e relative to the pre-industrial. The RCP scenarios X.X refer to a forcing equivalent to 2.6 Wm−2, 2.6 to 4.5 Wm−2 (total bar height), 4.5 to 6.0 Wm-2 (total bar height), and 6.0 to 8.5 Wm−2 (total bar height) by the end of the century. (b) Temperature increases relative to pre-industrial levels calculated using TCRE of ΔT = 0.54 °C per 1000 GtCO2.

Figure 6.
Projections of cumulative CO2e emissions from the IPCC Representative Concentration Pathways [33] (IPCC RCP), minus the current contribution from wind energy (IPCC-wind). The right axis indicates the associated global temperature increase above pre-industrial levels. The scenarios for current pledges and targets (NDC), IRENA and IEA NZE/GWEC use avoided emissions from wind energy only with IPCC projected emissions. The goal of the Paris Climate Agreement is to limit ΔT to well below 2 °C, preferably to 1.5 °C [2] which is indicated by the horizontal bar in yellow.

Figure 7.
Annual global GHG emissions (a) and emissions by country/area (b–e) (in GtCO2e). NB. Axes differ in each panel, grey grid lines indicate 1 GtCO2e per year for comparison. Solid lines show historical emissions to 2016 (global) or 2018 by country/area [36]. Shaded areas from 2016/2018 to 2030 show high/low projections based on post-COVID-19 current policies. Dashed lines indicate emissions minus wind energy contributions based on current pledges and targets from [36]. Dotted lines show emissions minus wind energy contributions estimated from IRENA [27]. Carbon emissions from [36].


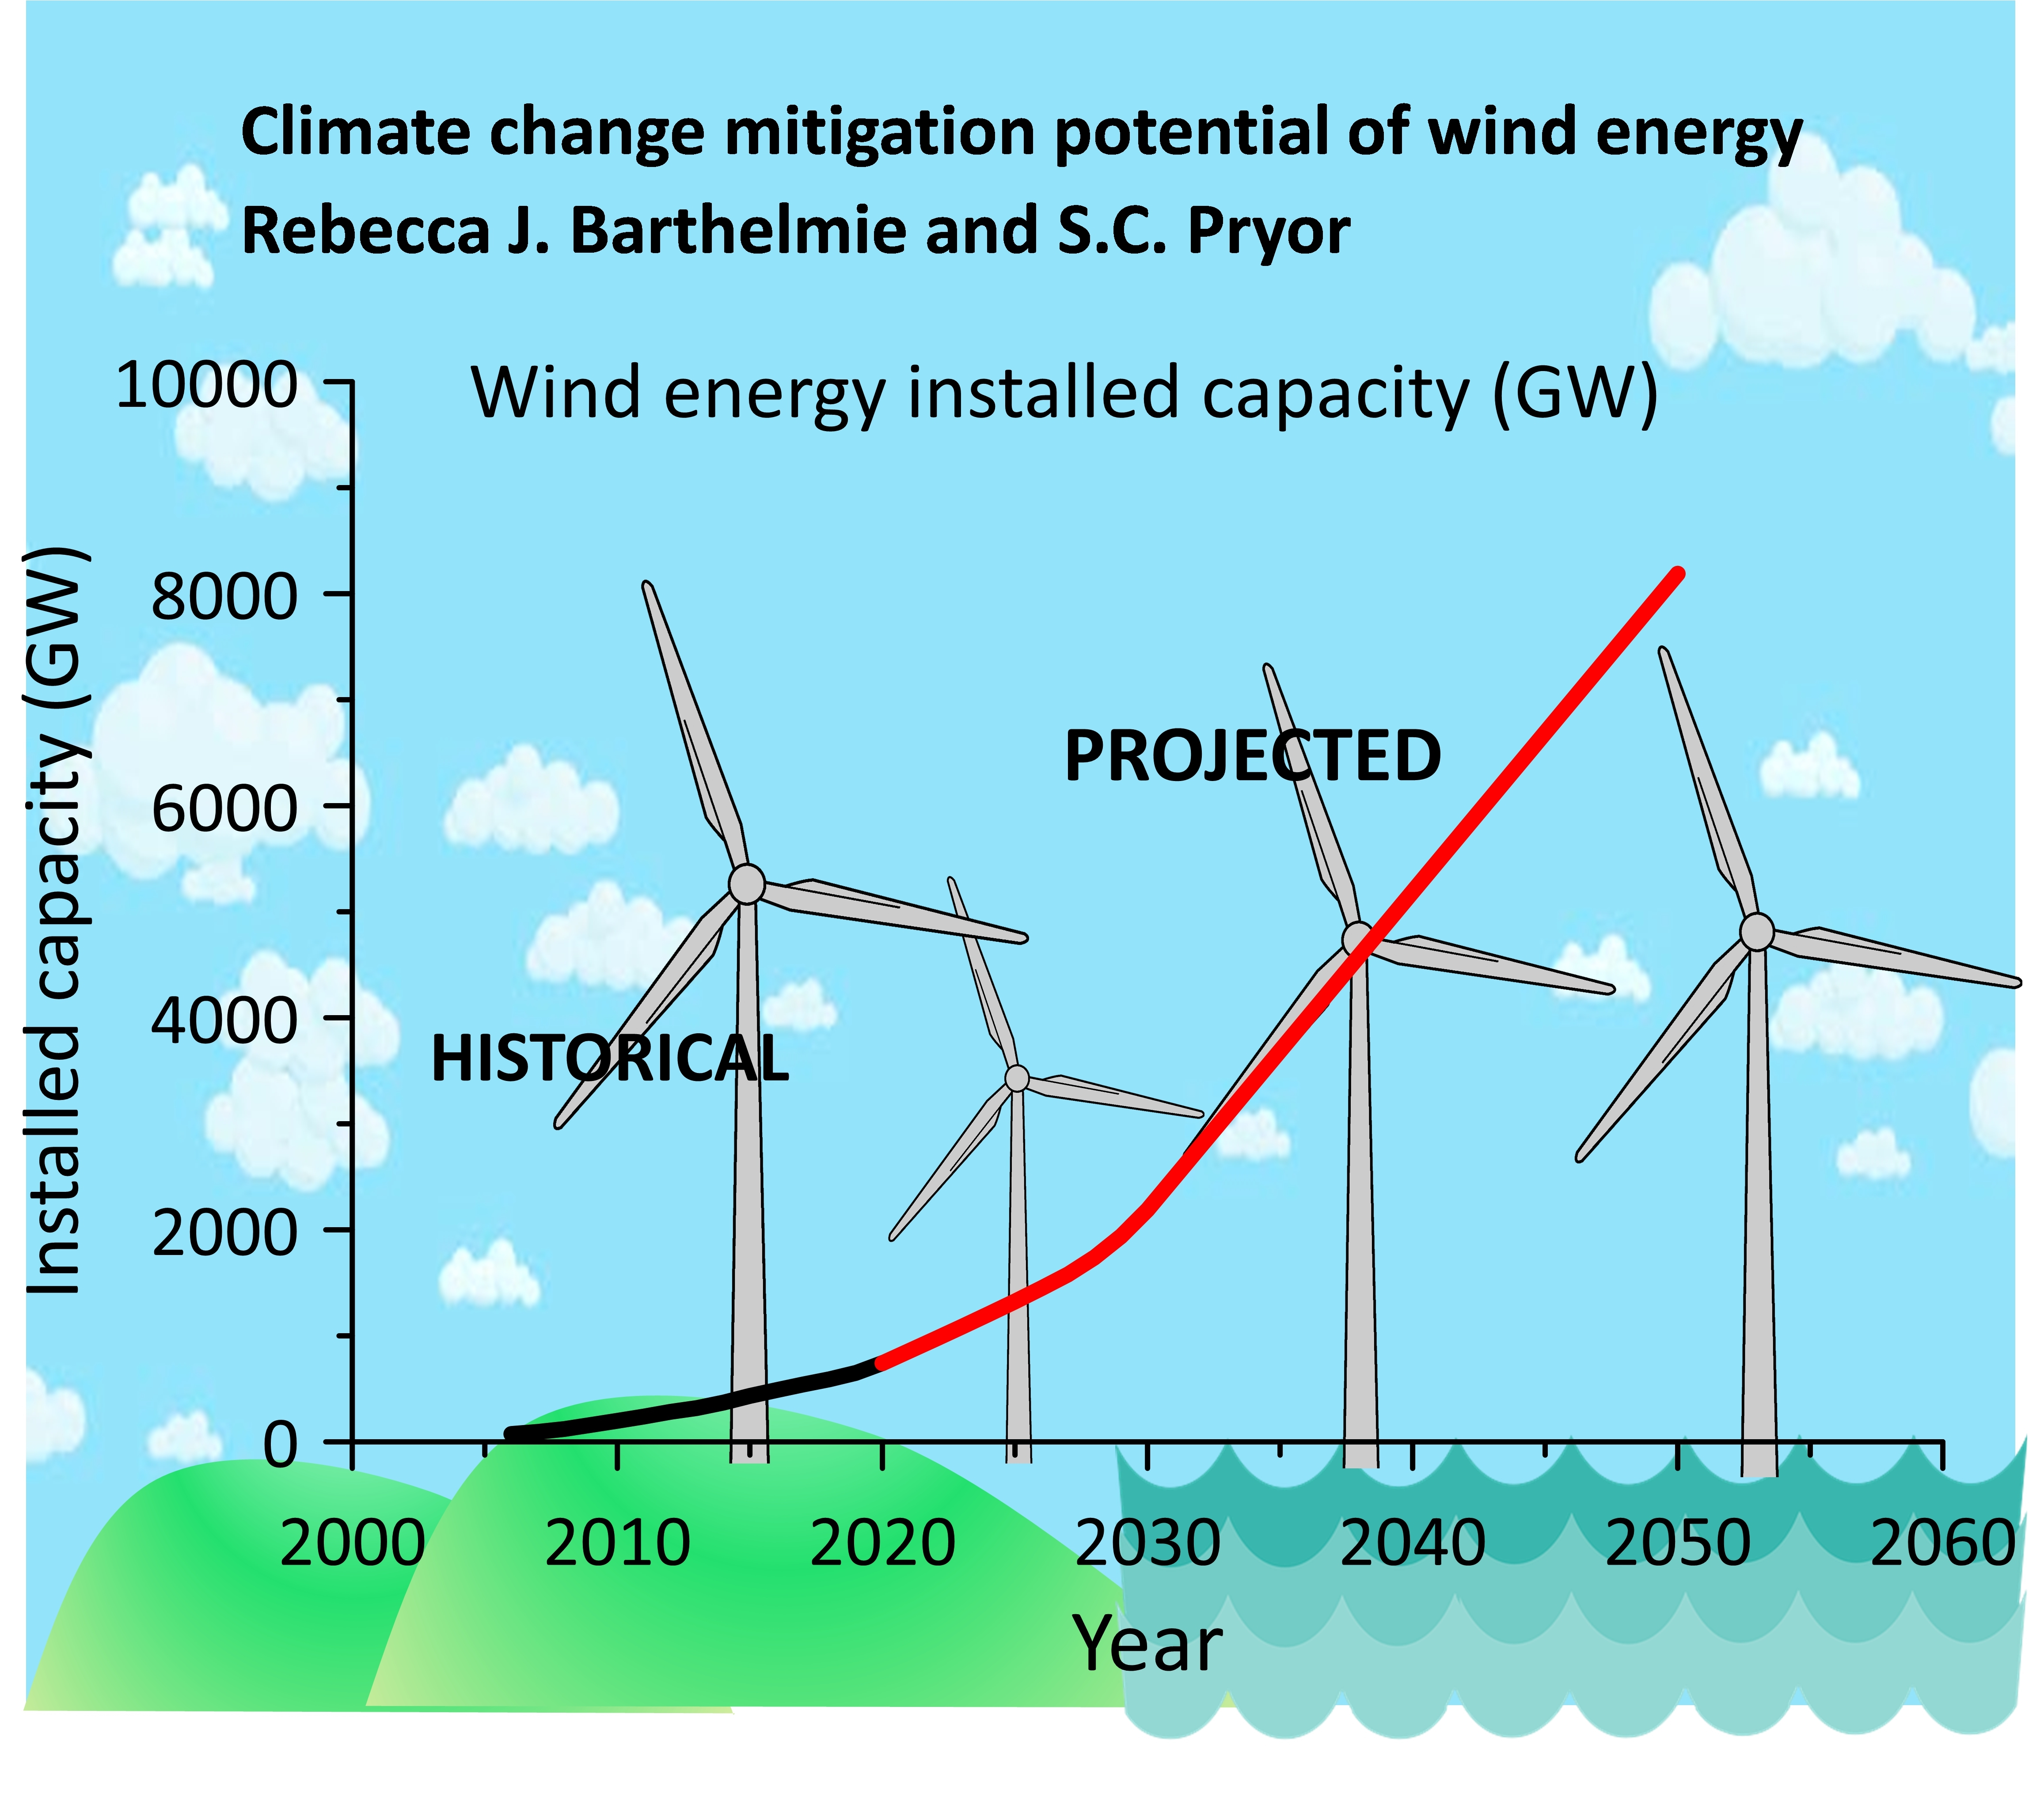
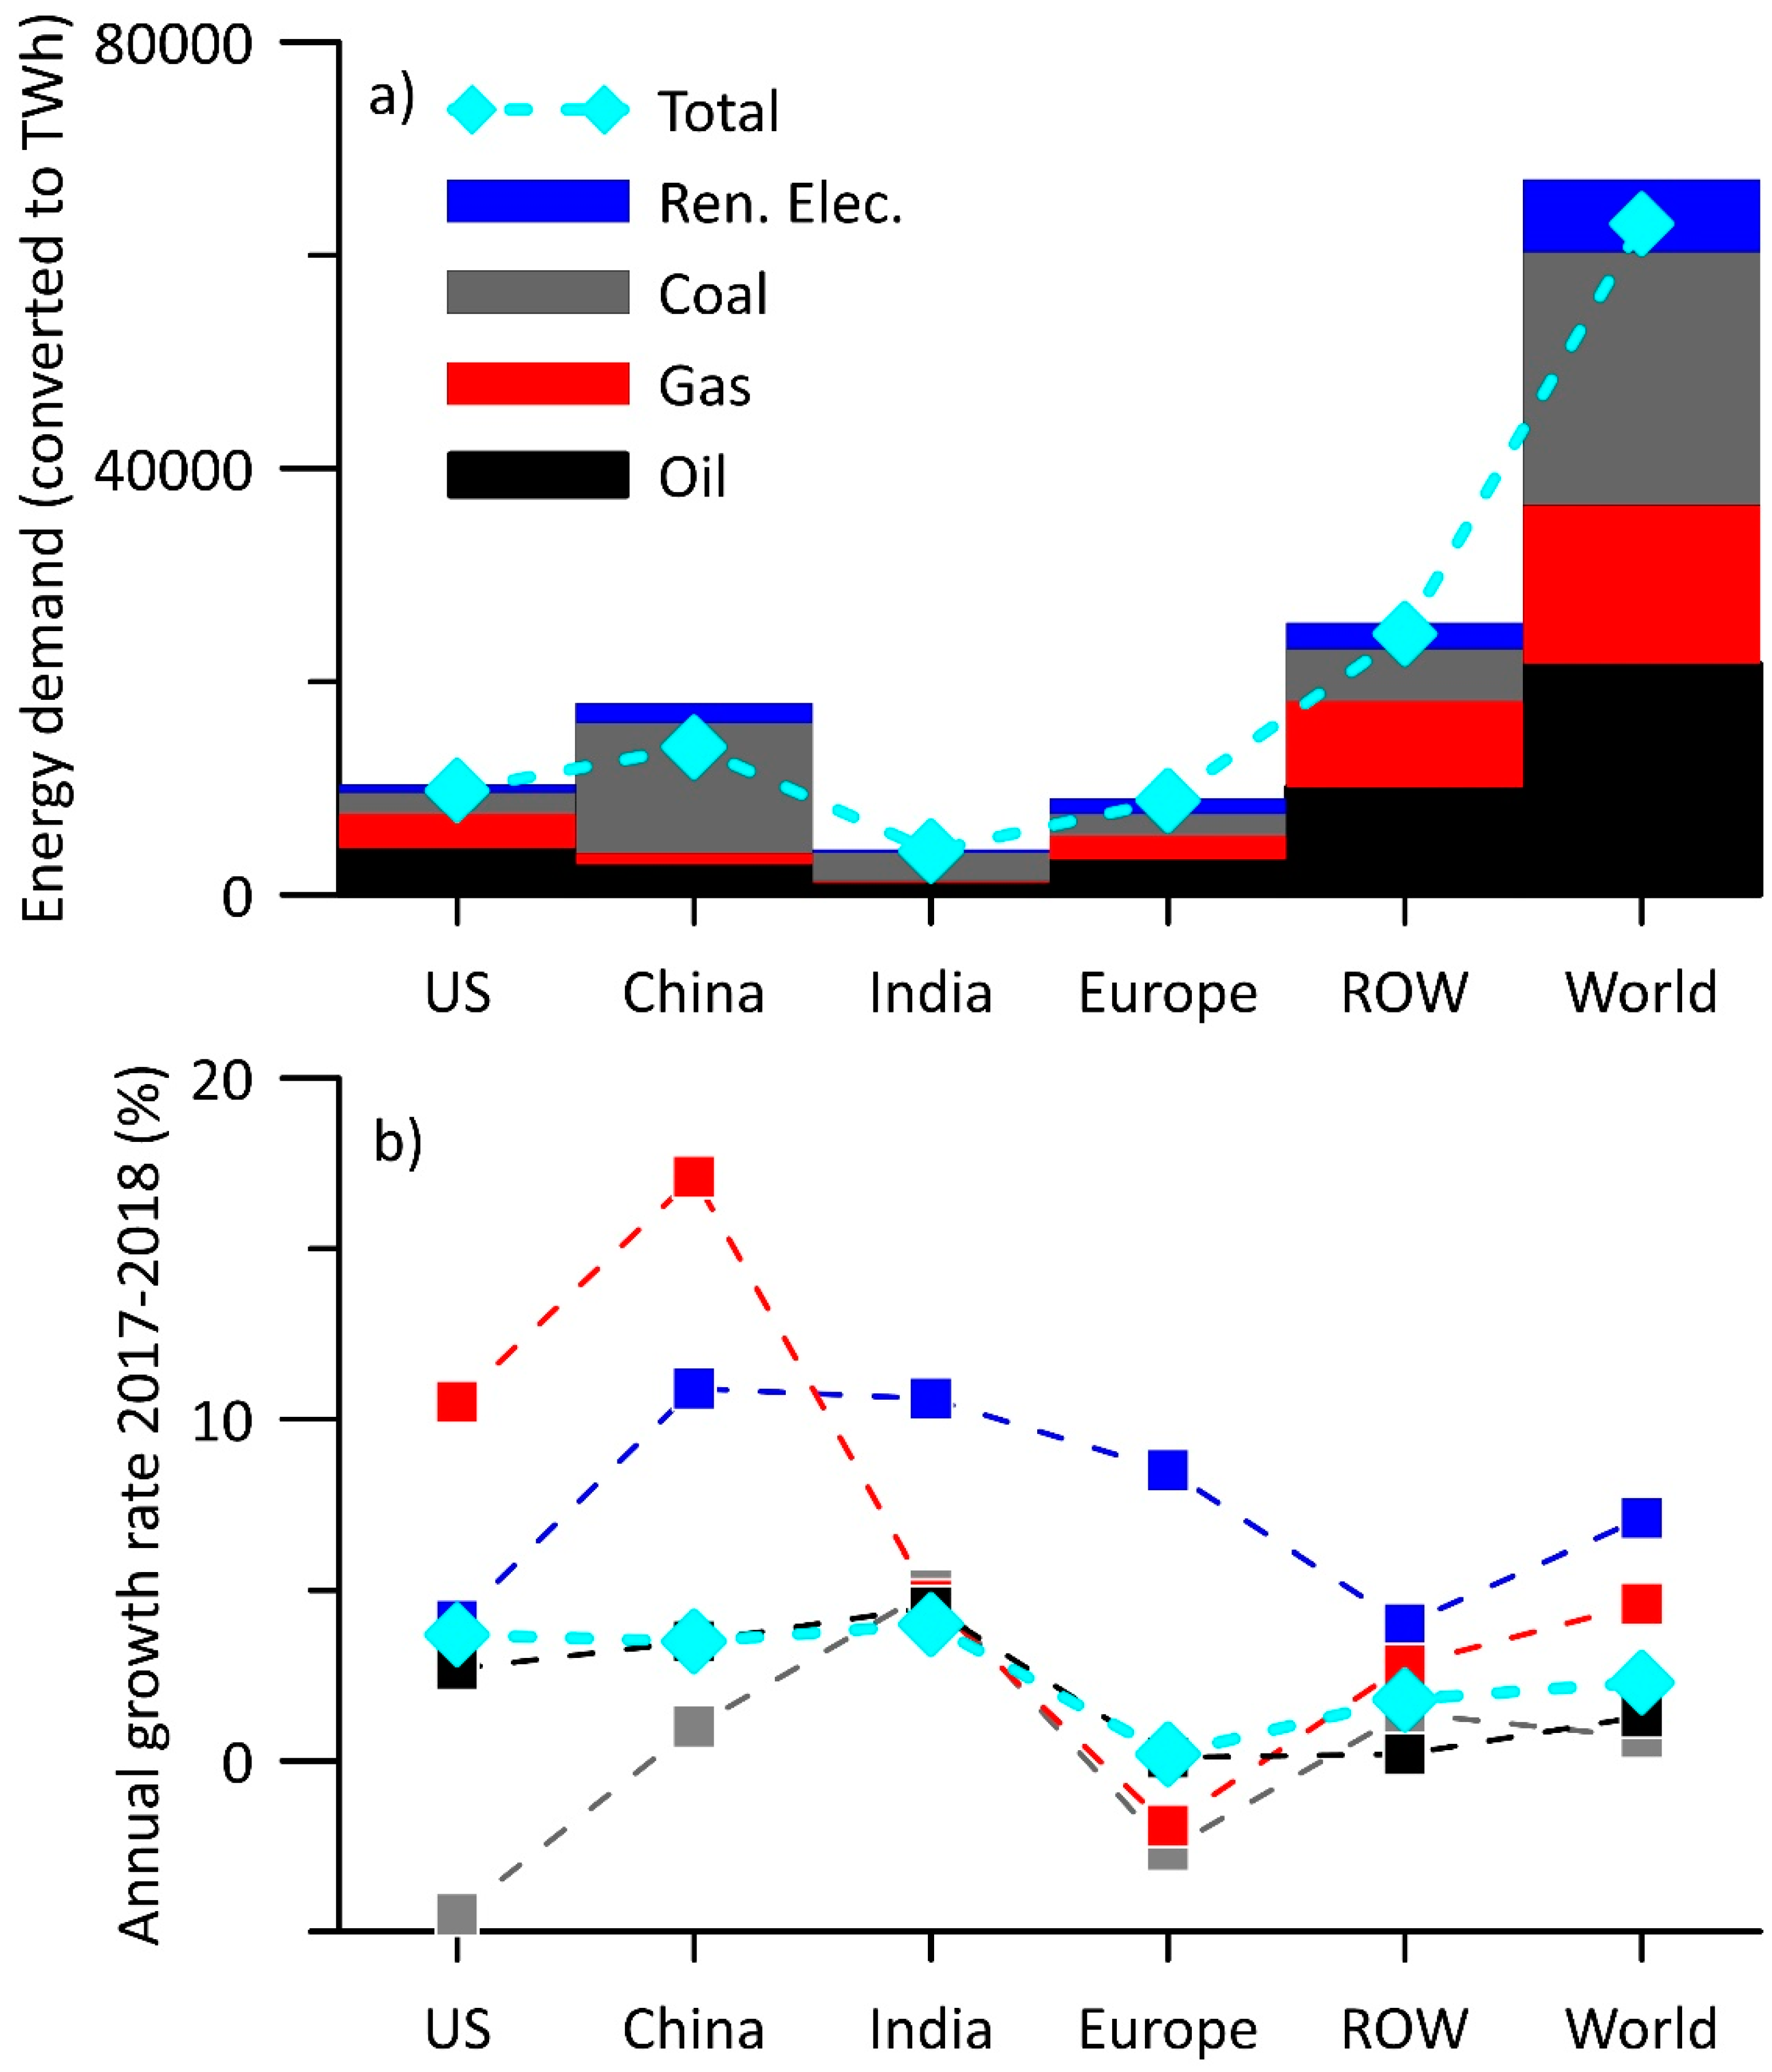
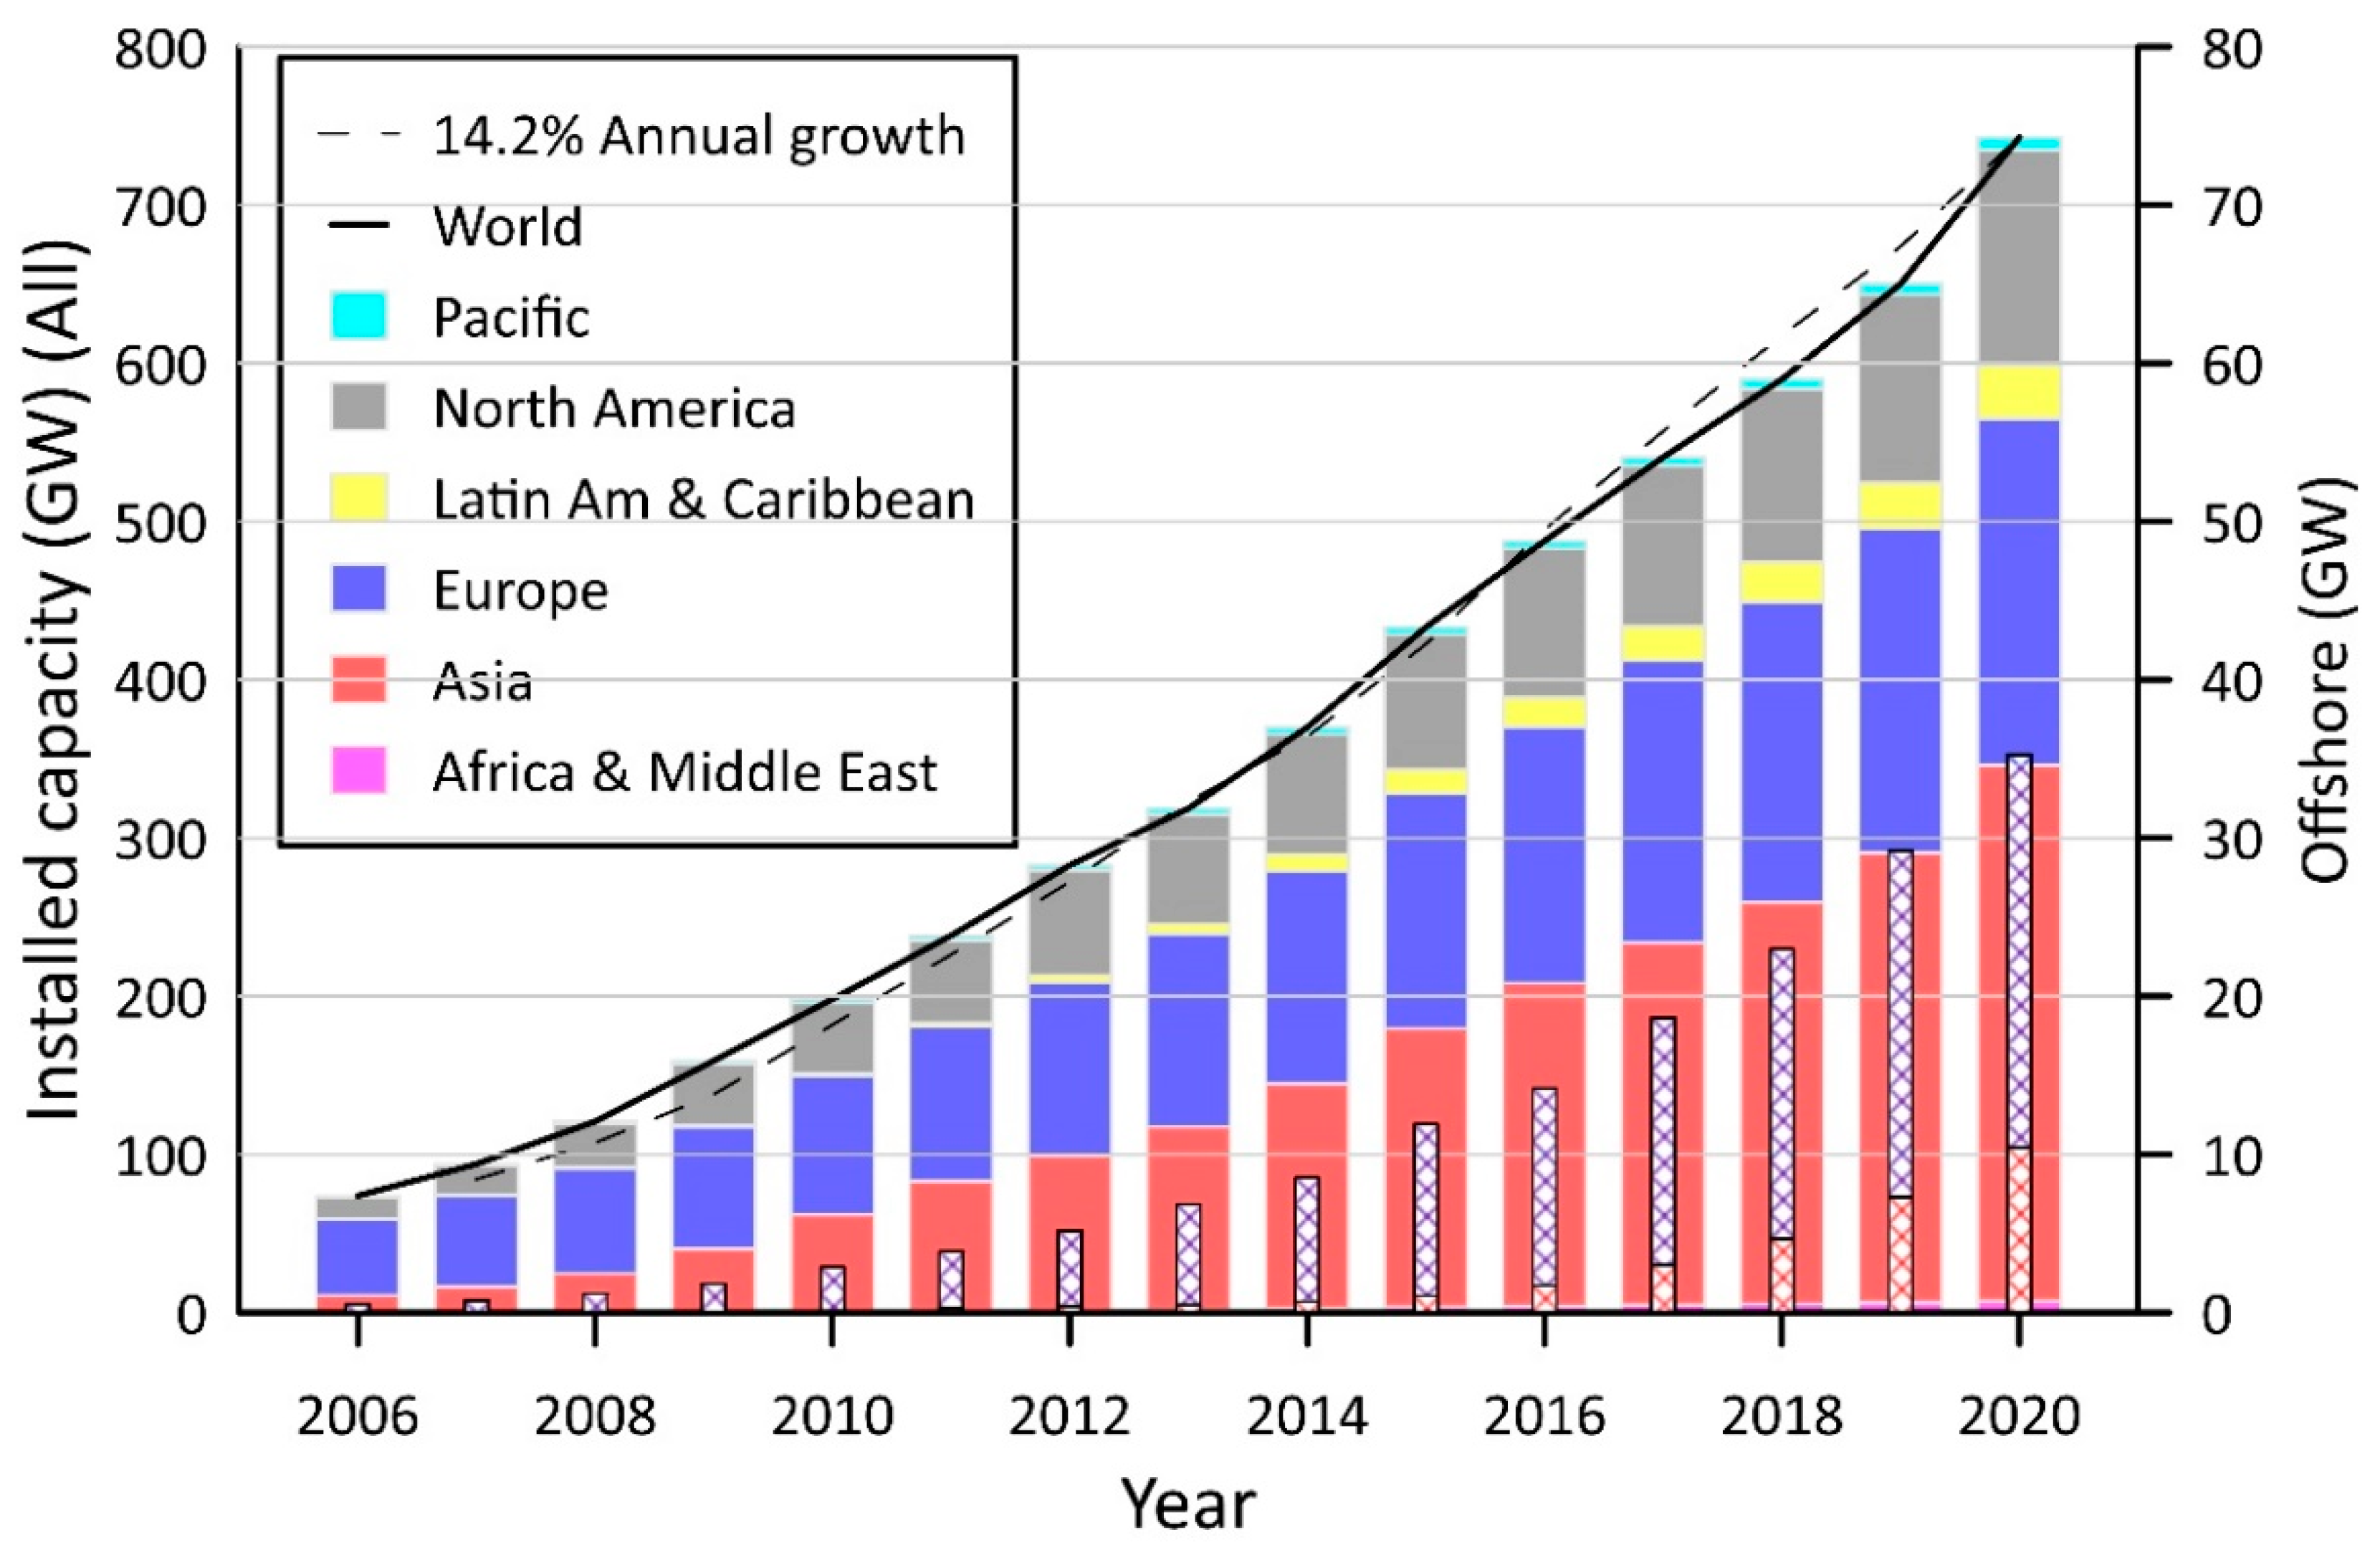
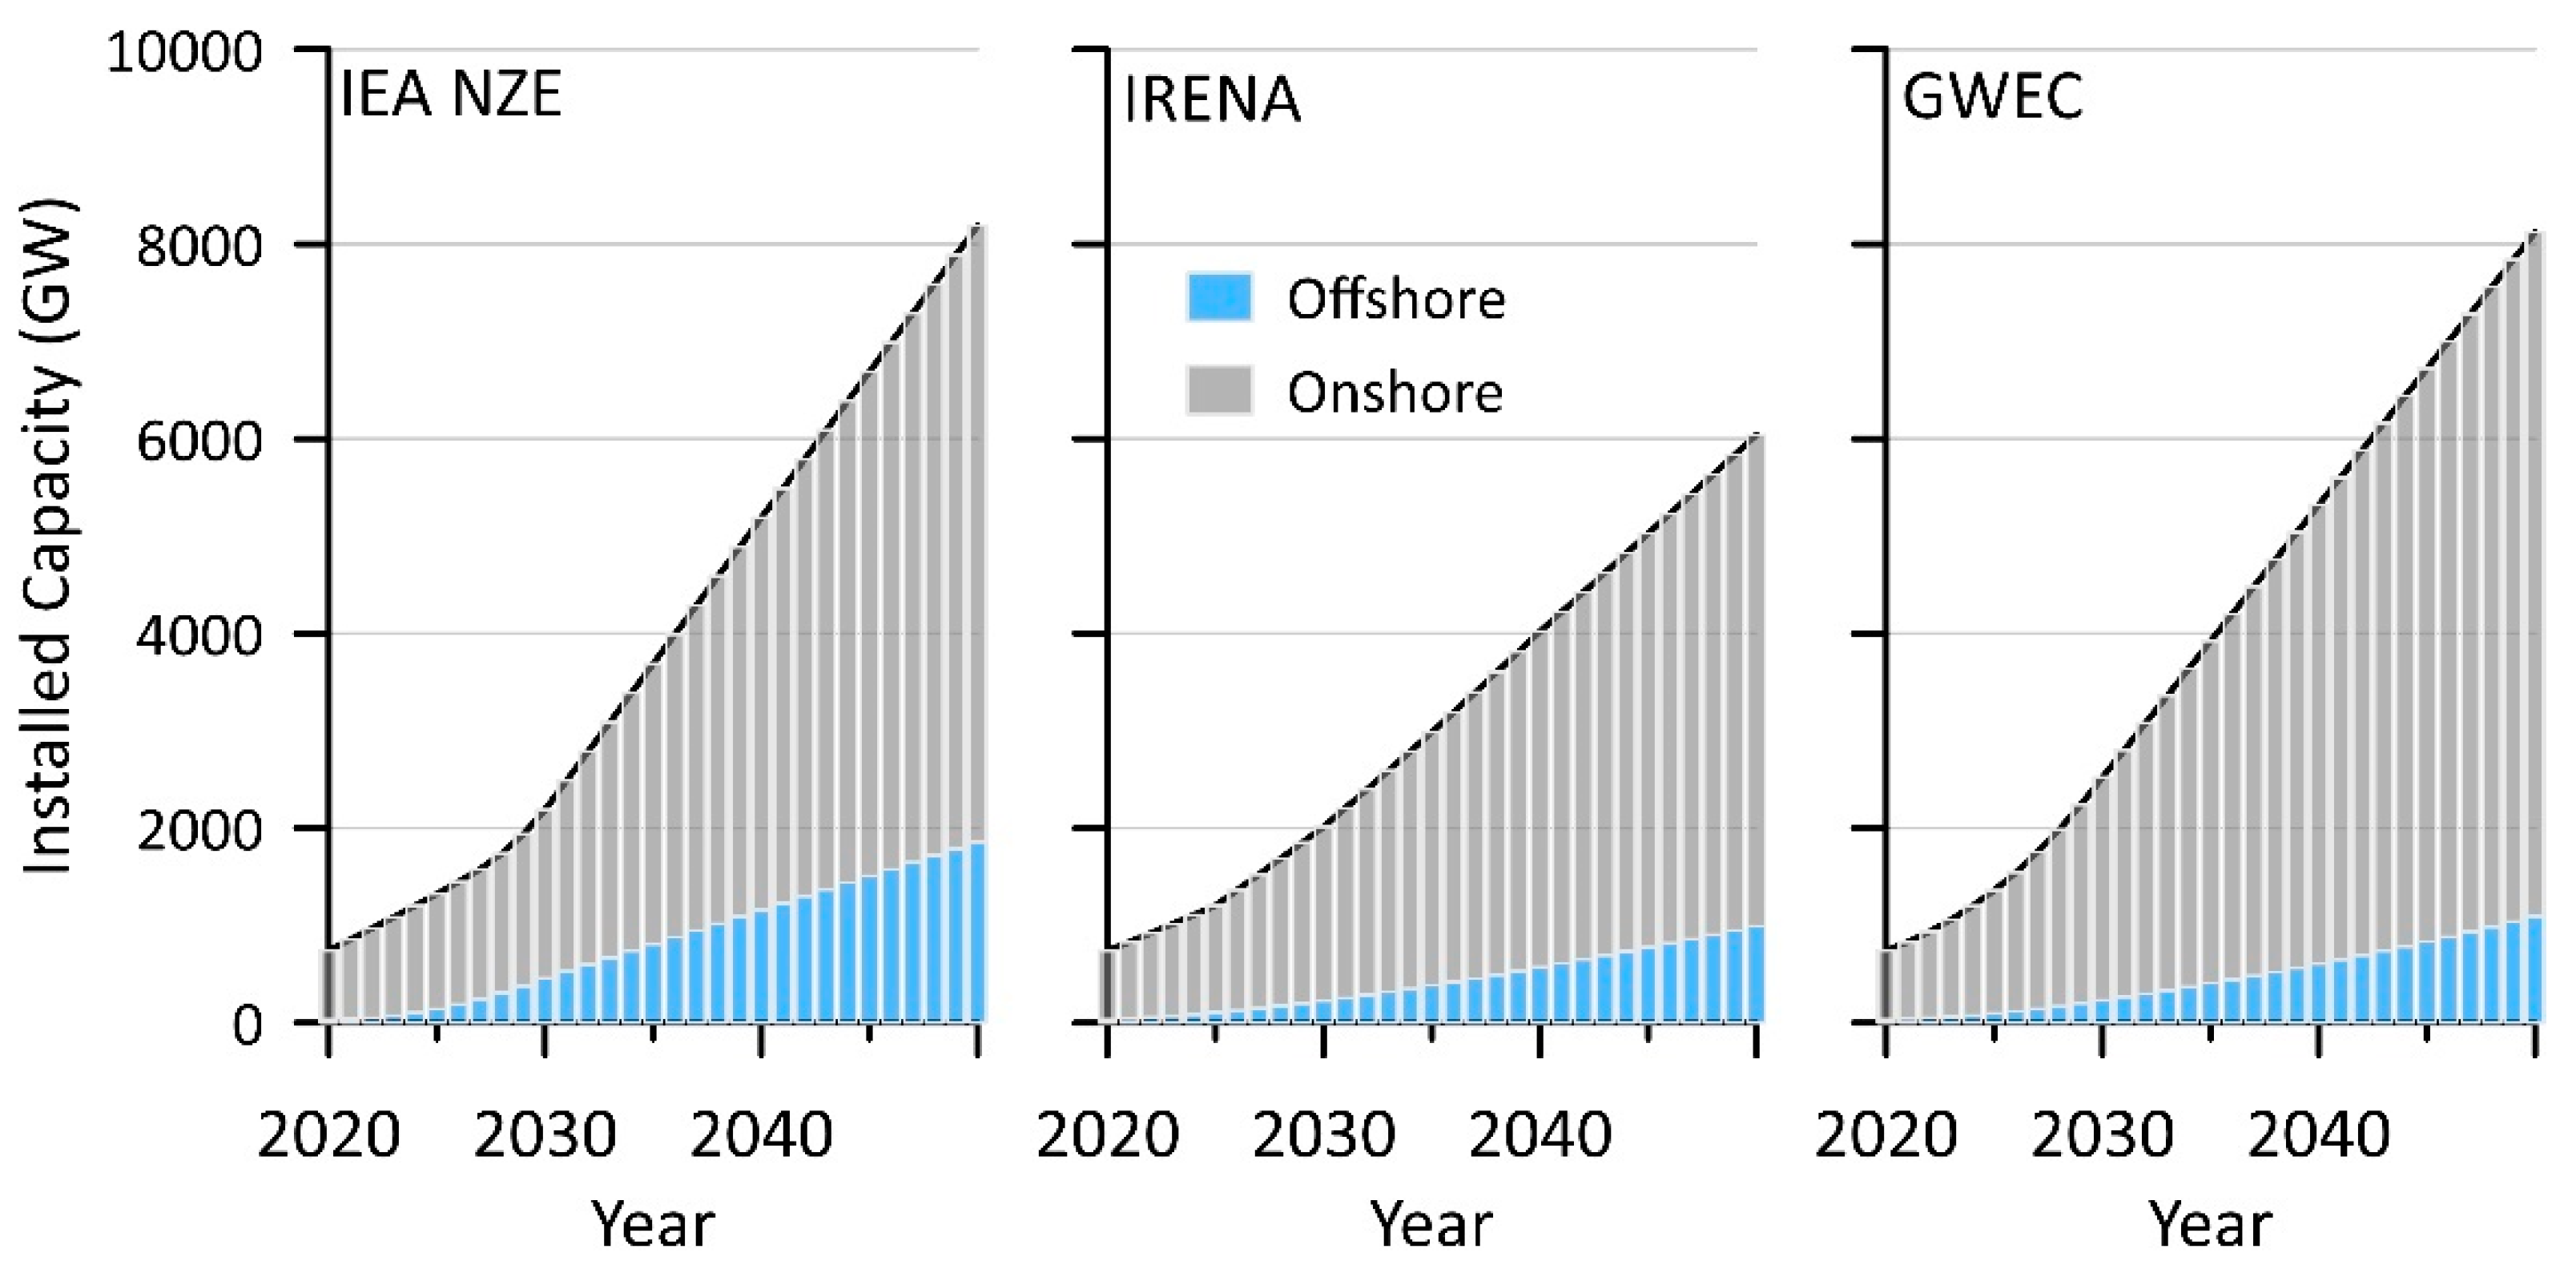
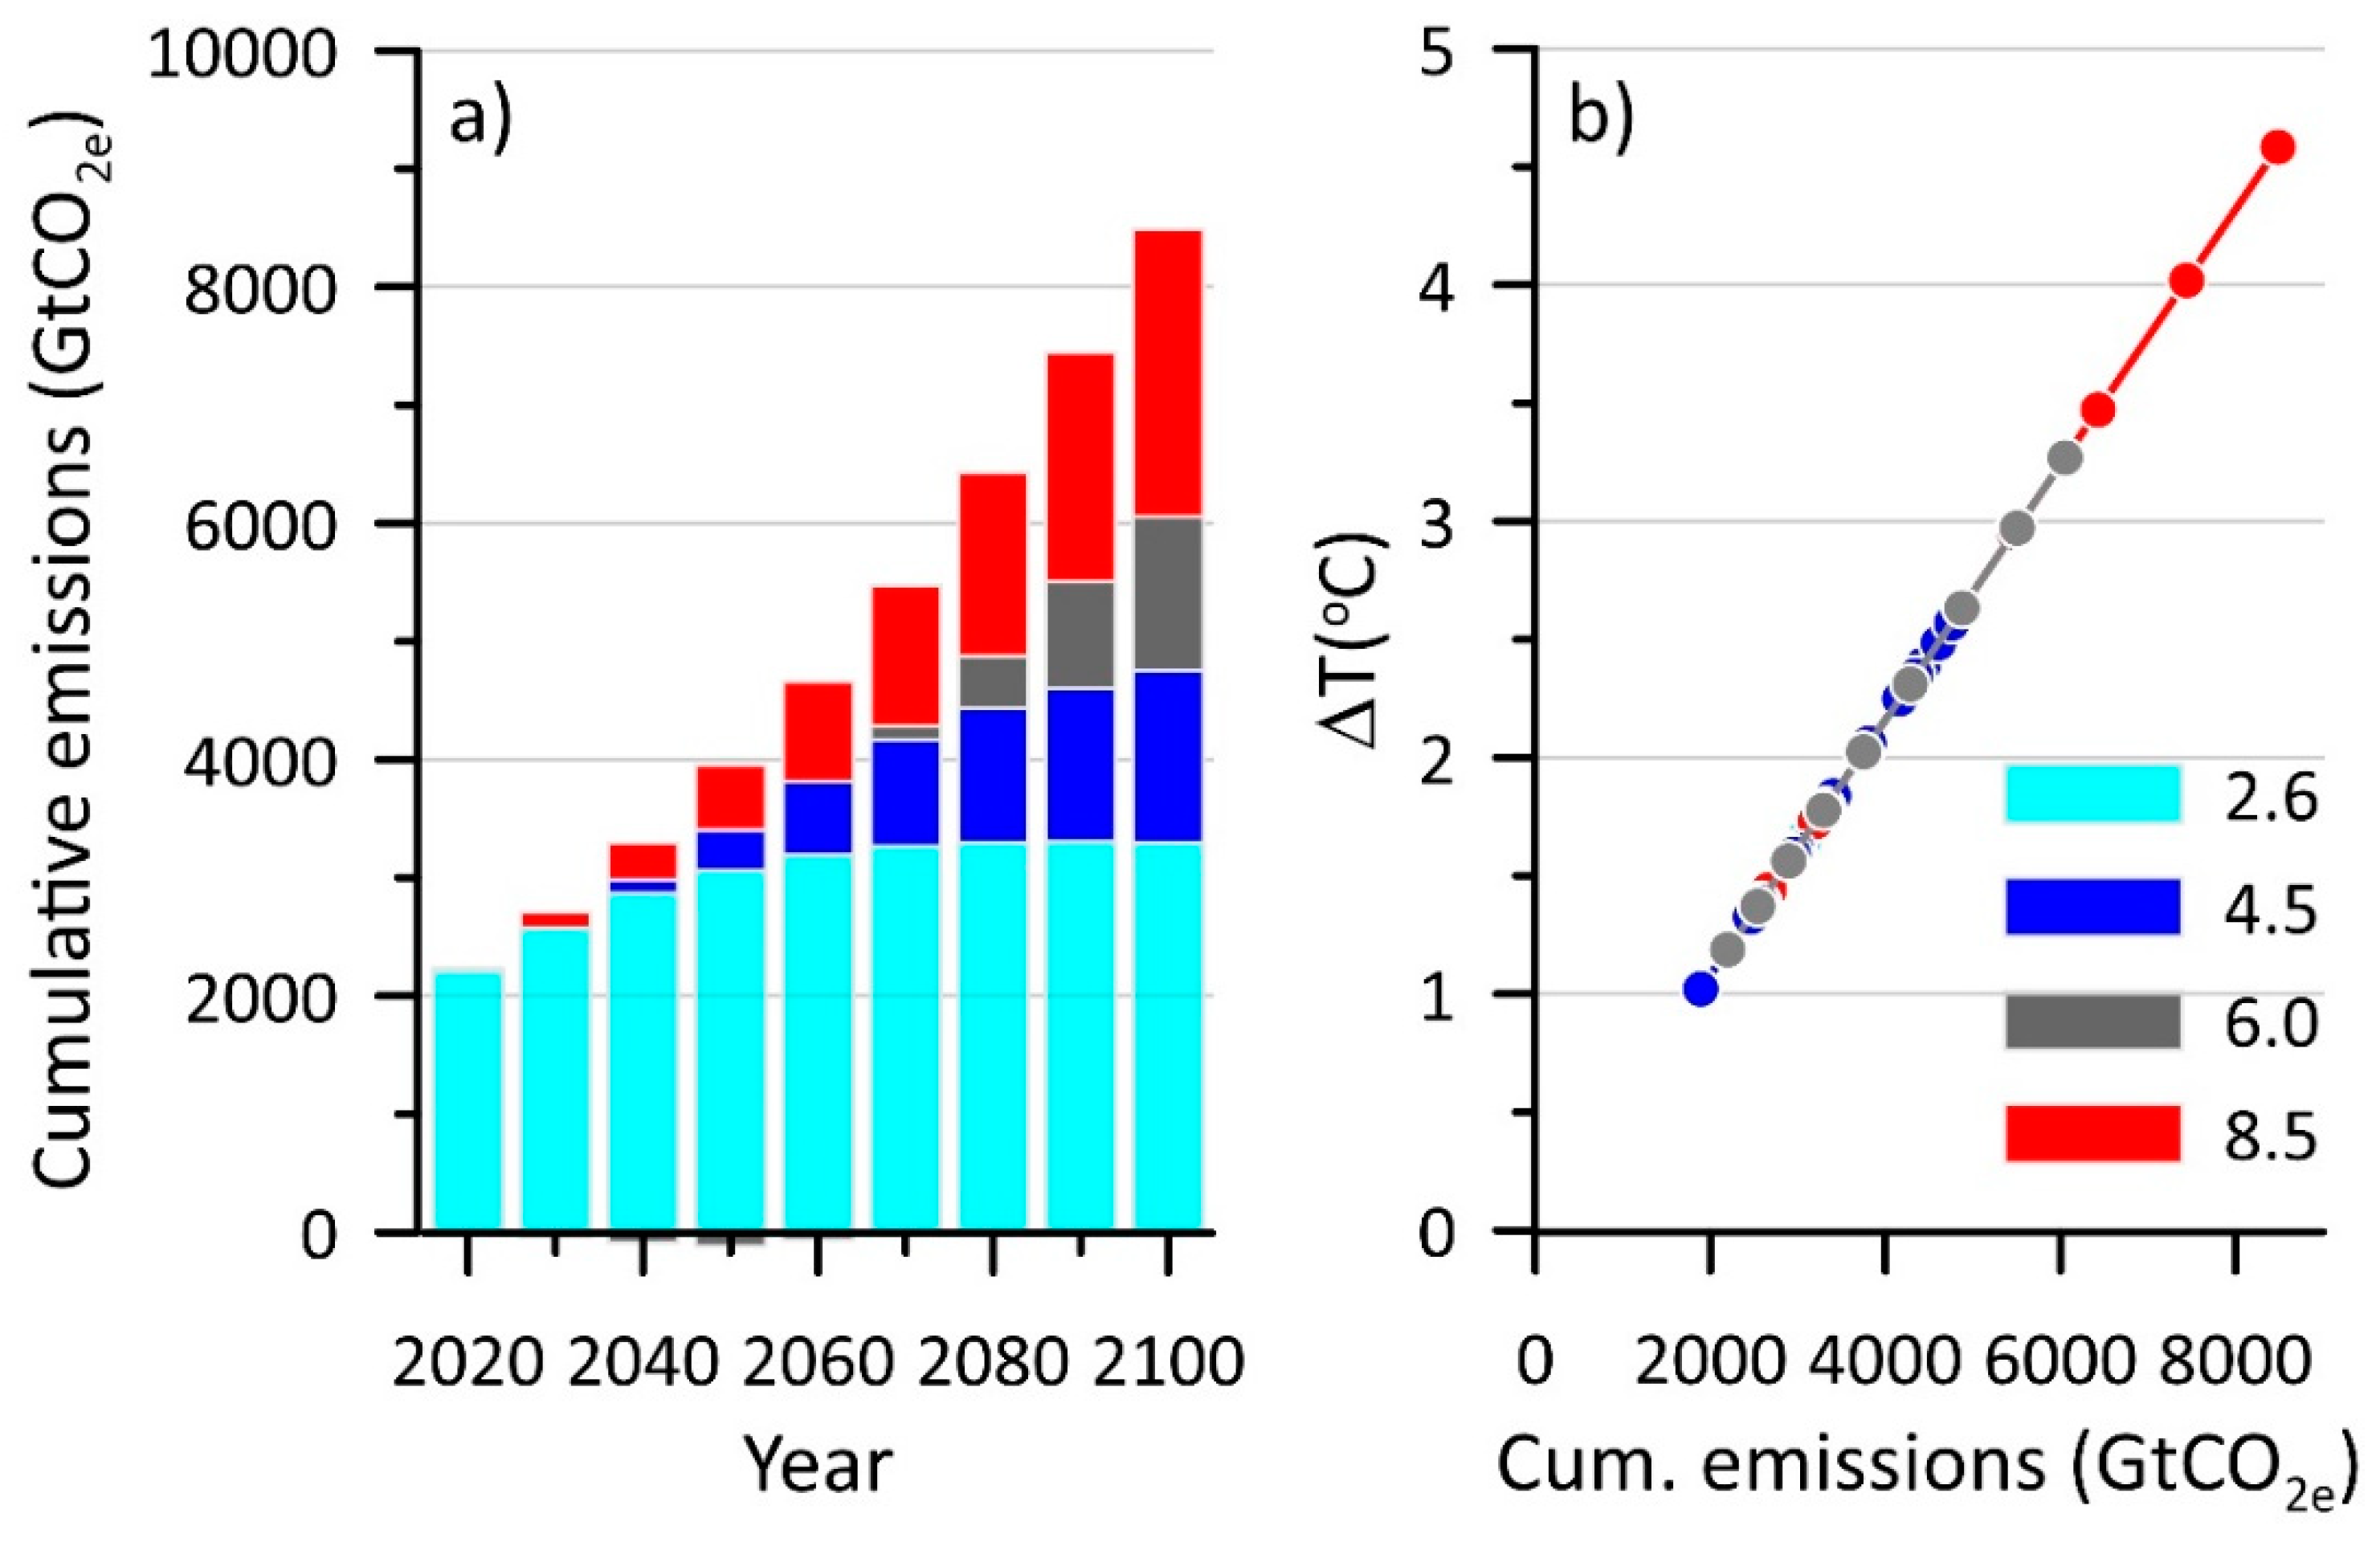
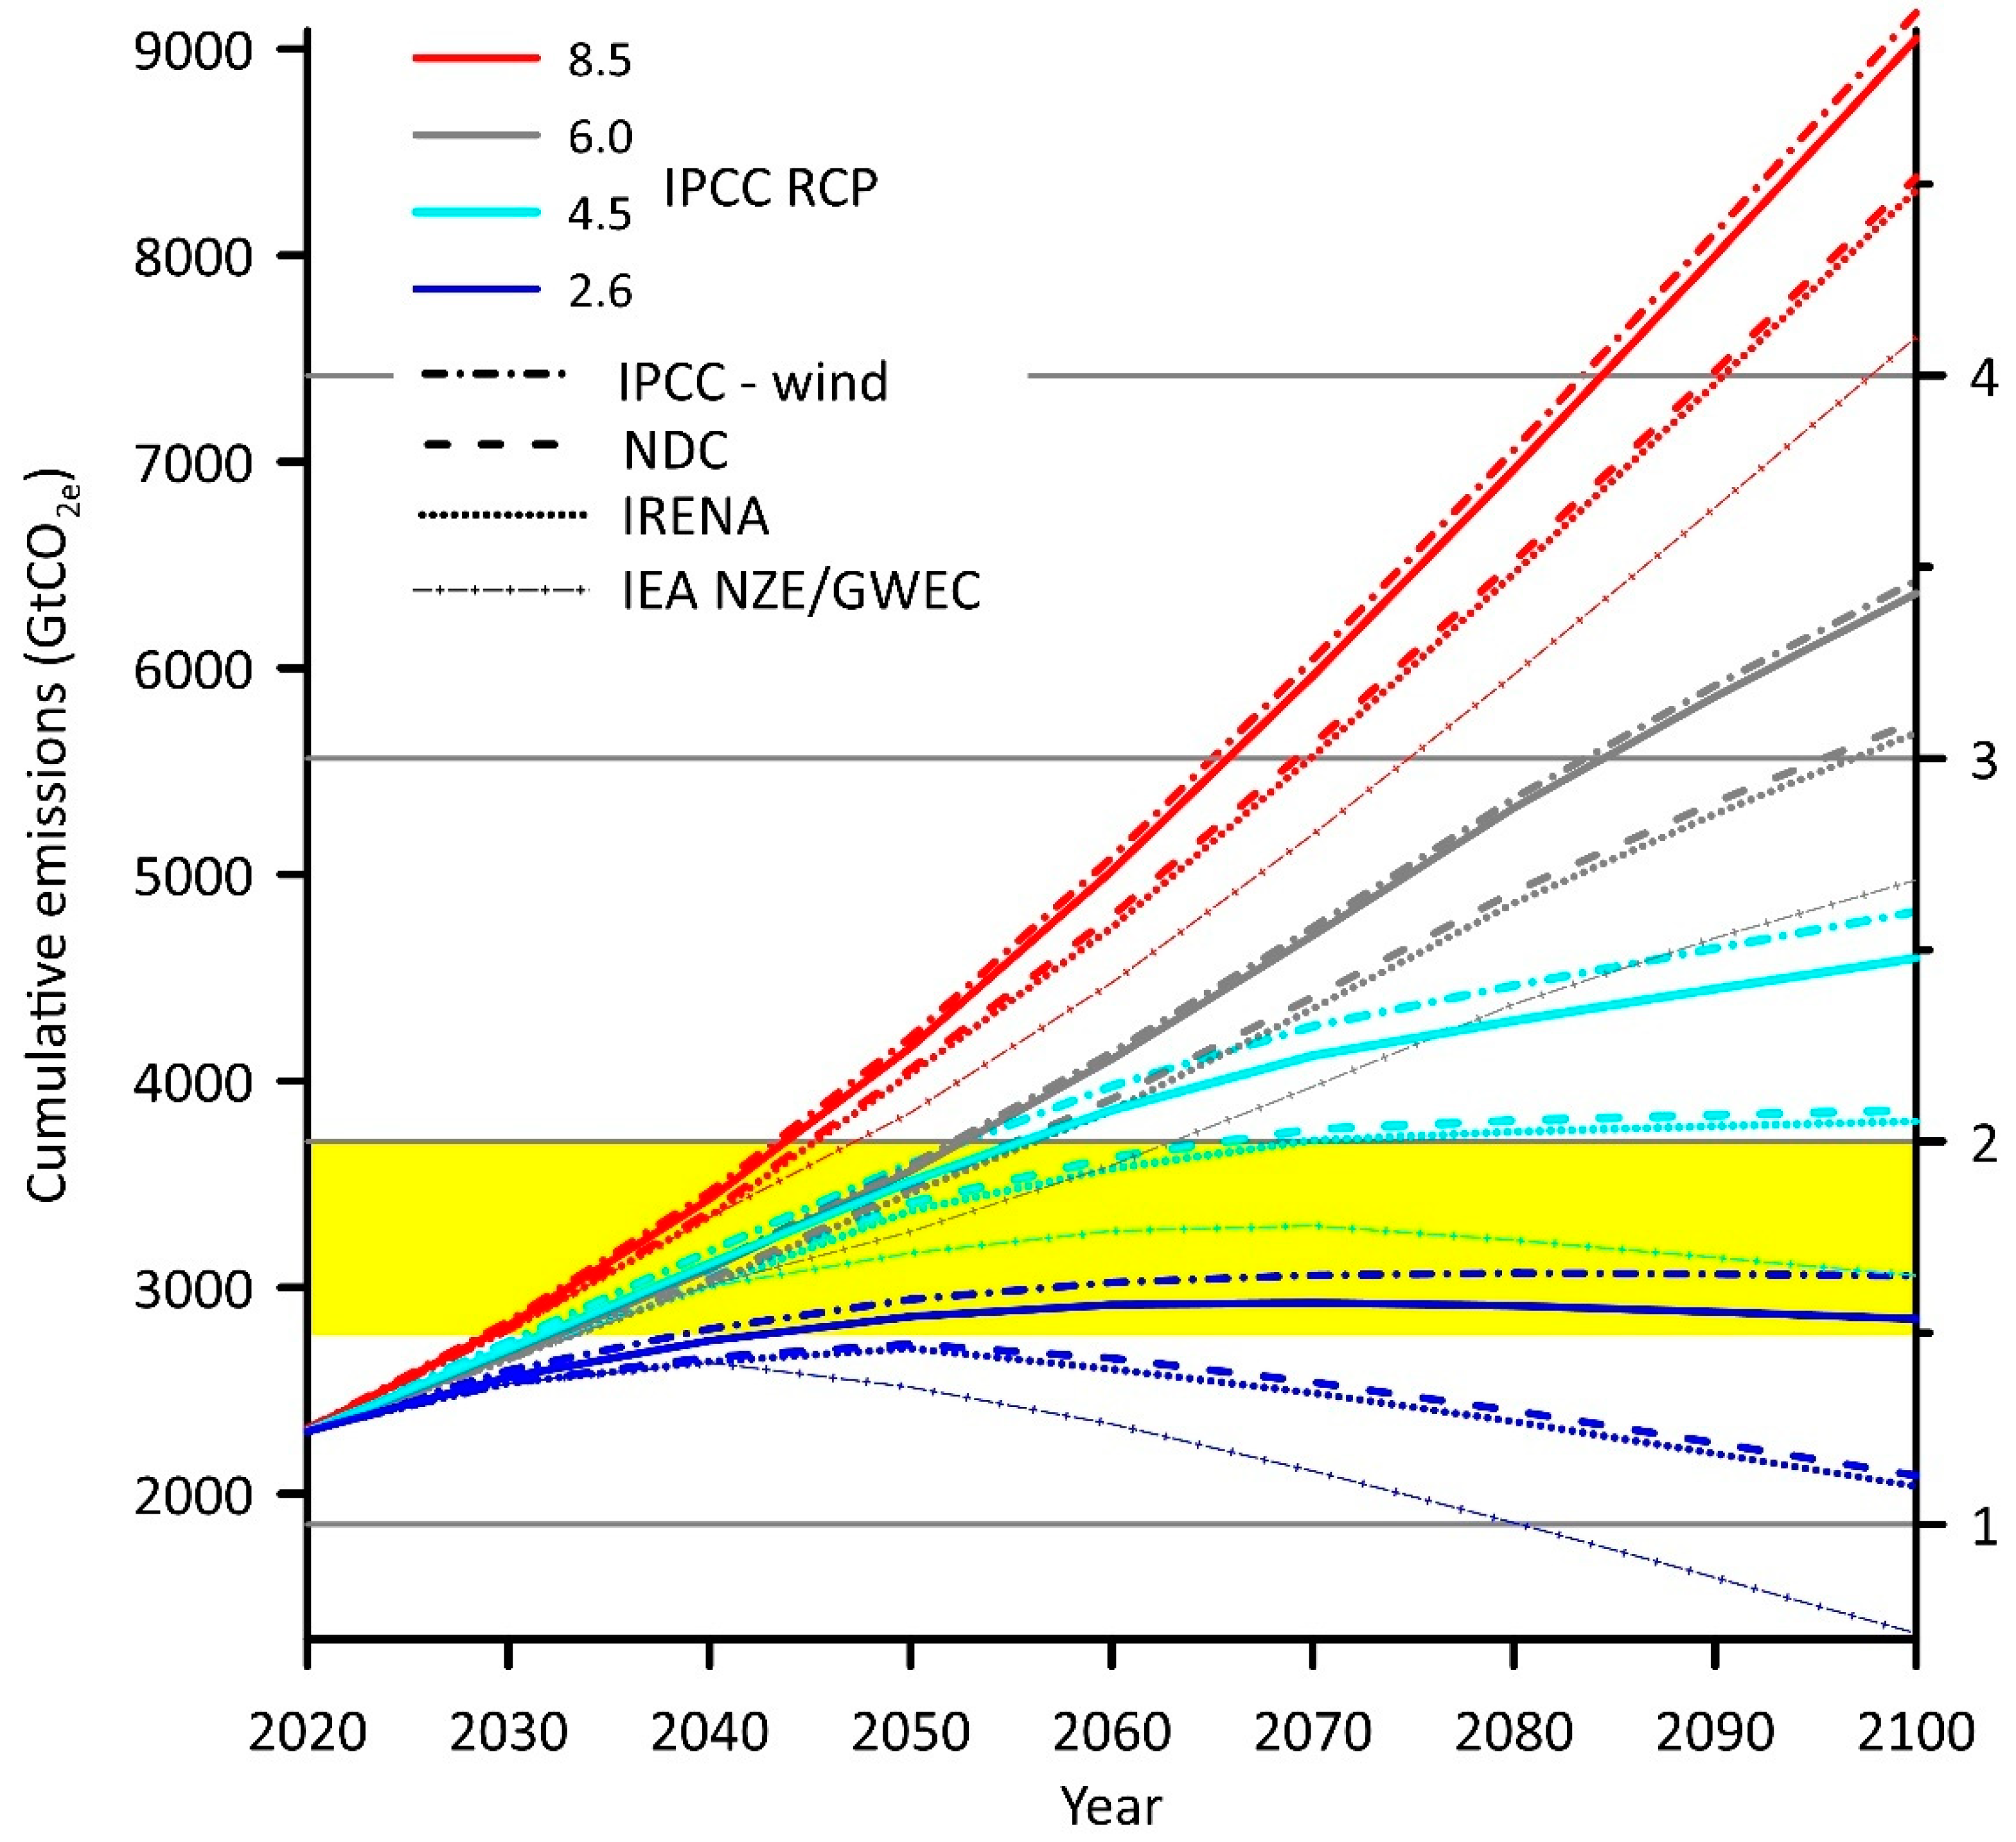
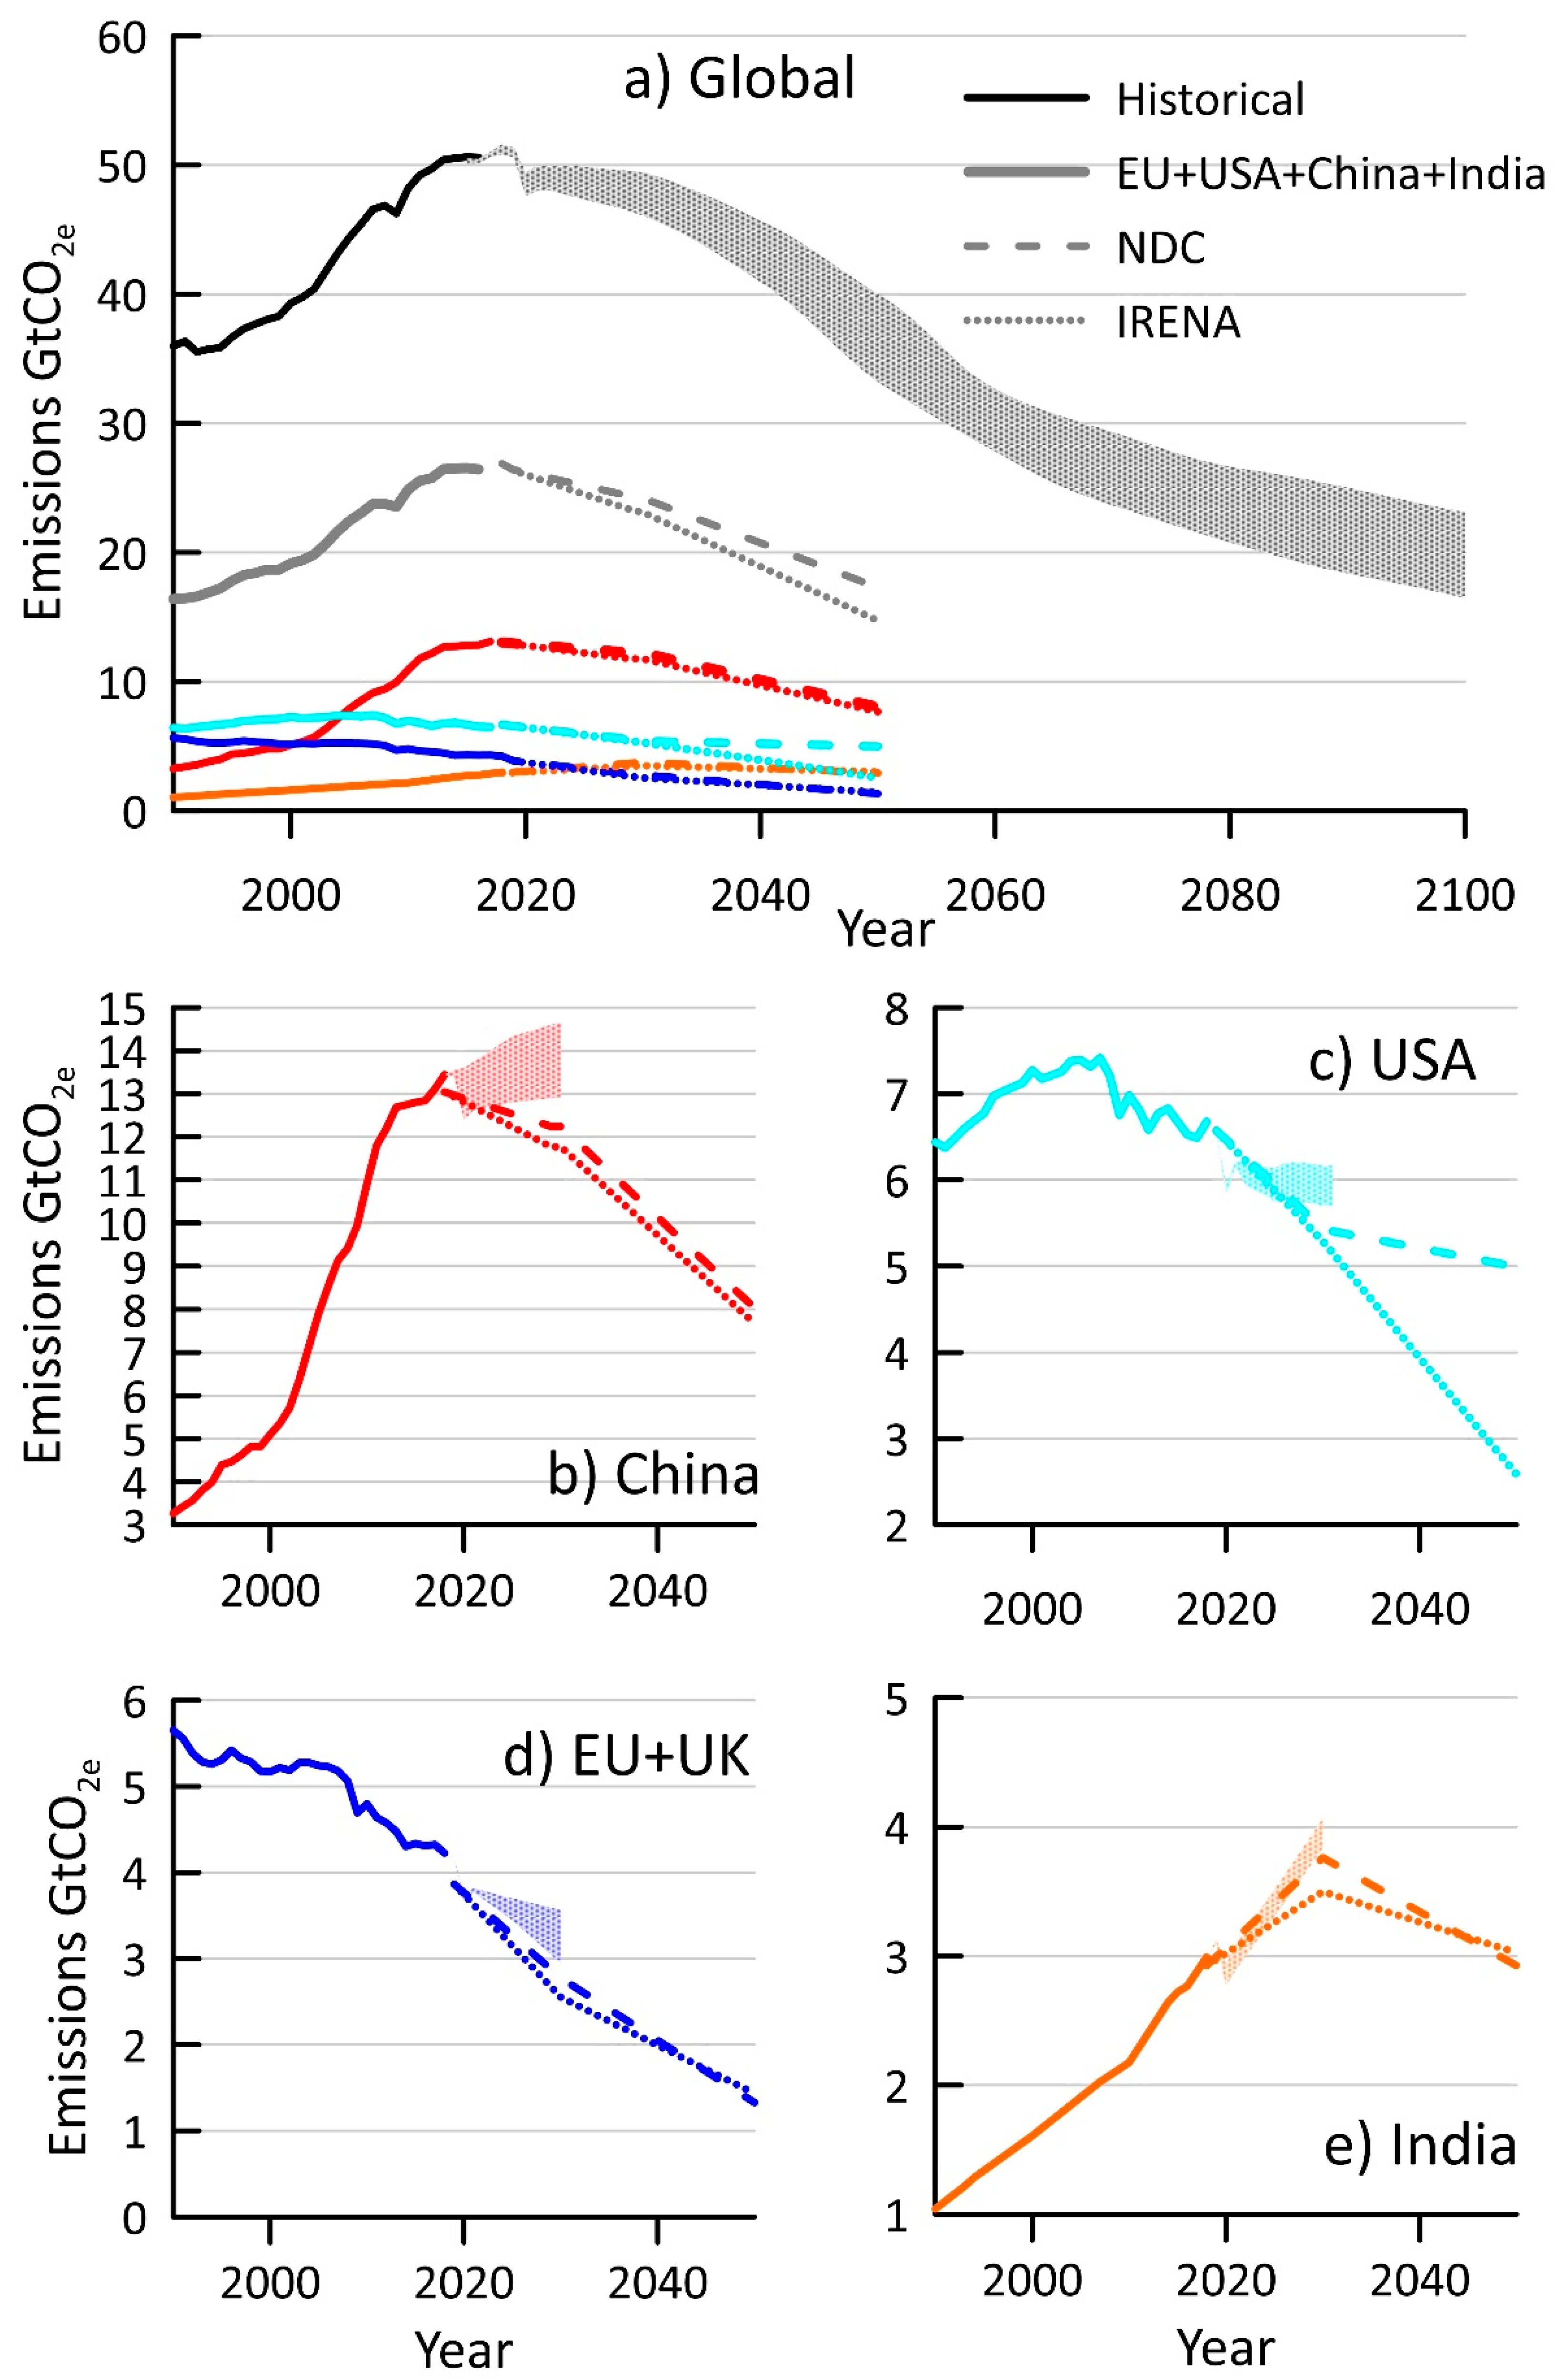
Table 1.
Annual Total Primary Energy Supply (TPES), electricity consumption, carbon dioxide emissions from energy use, and population by country or region. Additionally shown are per capita rates of TPES, electricity consumption and CO2 emissions from energy use. Data from [6].
Table 1.
Annual Total Primary Energy Supply (TPES), electricity consumption, carbon dioxide emissions from energy use, and population by country or region. Additionally shown are per capita rates of TPES, electricity consumption and CO2 emissions from energy use. Data from [6].
| TPES (Mtoe) | Electricity Consumption (TWh) | CO2 Emissions (Gt) | Population (Million) | Per Capita | |||
|---|---|---|---|---|---|---|---|
| TPES (toe per Capita) | Electricity Consumption (MWh per Capita) | CO2 Emission (tonne per Capita) | |||||
| China | 3196 | 6833 | 9.582 | 1393 | 2.3 | 4.9 | 6.8 |
| US | 2231 | 4289 | 4.921 | 327 | 6.8 | 13.1 | 15.0 |
| EU+UK | 1603 | 3098 | 3.156 | 514 | 3.1 | 6.0 | 6.1 |
| India | 919 | 1309 | 2.308 | 1353 | 0.7 | 1.0 | 1.7 |
| World | 14,282 | 24,739 | 33.513 | 7588 | 1.9 | 3.3 | 4.4 |
Table 2.
Climate-relevant pledges and targets. Additionally shown are installed capacity (IC) of wind energy in 2020 and historical annual rates of increase in IC [11].
Table 2.
Climate-relevant pledges and targets. Additionally shown are installed capacity (IC) of wind energy in 2020 and historical annual rates of increase in IC [11].
| Pledges and Targets | Wind Energy IC 2020 (GW) | Annual Increase IC Wind Energy (GW) (%) | |
|---|---|---|---|
| China | Reduce CO2 emissions intensity per unit of GDP by 65%, increase non-fossil fuel contribution to TPES to 25% and expand wind and solar IC >1200 GW. Plans for carbon neutrality by 2060 [15]. Beijing declaration on wind energy, 50 GW annual added IC to 2025, increasing to 60 GW annually to 3000 GW by 2060 [11]. Guangdong and Jiangsu Province plans >30 GW offshore IC by 2025 [16]. | 288 | 52 (18%) |
| US | Reduce GHG emissions by 50–52% below 2005 levels by 2030. Net-zero emissions pledge by 2050 under the Biden administration [11,13,17]. A total of 30 GW offshore wind IC by 2030 [17]. A total of 10% of U.S. electrical demand (4128 TWh in 2019 [18]) by 2020, 20% in 2030, and 35% in 2050 [19]. | 122 | 16 (14%) |
| EU+UK | EU climate neutrality by 2050 and renewables 32% of TPES by 2030 [13]. UK targets: GHG reduction >68% by 2030, cf 1990 levels, net zero emissions by 2050 [13]. UK 40 GW offshore wind IC by 2030 [20]. | 219 | 15 (7%) |
| India | 33–35% reduction in carbon emissions intensity by 2030 relative to 2005. Renewables target 175 GW by 2022 (wind 60 GW onshore; 5 GW offshore), 450 GW by 2030, including 30 GW offshore [11]. | 39 | 1 (3%) |
| World | 743 | 93 (13%) |
Table 3.
Energy-related emissions (GtCO2) in 2018, plus estimated avoided emissions in that year resulting from current use of wind energy (GtCO2) plus projections of avoided emissions in 2030 and 2050 that would arise in the current pledges from each country/area were realized in full and then if those pledges were realized but the full scenario of wind expansion from IRENA is also achieved. The avoided emissions from wind energy electricity generation are estimated by assuming emissions from the current energy mix of 0.64 MtCO2 per TWh.
| Energy-Related CO2 Emissions (GtCO2) [6] | Annual Avoided Emissions from Current Wind IC (GtCO2) | Annual Avoided Emissions from Current Pledges (NDC) | Annual Avoided Emissions from NDC + IRENA Wind Scenario | |||
|---|---|---|---|---|---|---|
| Year | 2018 | 2018 | 2030 | 2050 | 2030 | 2050 |
| Country/area | ||||||
| China | 9.6 | 0.40 | 1.6 | 5.8 | 2.0 | 6.1 |
| EU+UK | 3.1 | 0.36 | 0.48 | 2.0 | 0.70 | 1.8 |
| USA | 4.9 | 0.18 | 0.50 | 0.94 | 0.64 | 3.4 |
| India | 2.3 | 0.07 | 0.19 | 1.0 | 0.45 | 0.93 |
| ROW | 14 | 0.11 | 0.17 | 0.33 | 0.96 | 2.8 |
| Total | 34 | 1.1 | 2.9 | 10 | 4.8 | 15 |
Publisher’s Note: MDPI stays neutral with regard to jurisdictional claims in published maps and institutional affiliations. |
© 2021 by the authors. Licensee MDPI, Basel, Switzerland. This article is an open access article distributed under the terms and conditions of the Creative Commons Attribution (CC BY) license (https://creativecommons.org/licenses/by/4.0/).
Share and Cite
MDPI and ACS Style
Barthelmie, R.J.; Pryor, S.C. Climate Change Mitigation Potential of Wind Energy. Climate 2021, 9, 136. https://0-doi-org.brum.beds.ac.uk/10.3390/cli9090136
AMA Style
Barthelmie RJ, Pryor SC. Climate Change Mitigation Potential of Wind Energy. Climate. 2021; 9(9):136. https://0-doi-org.brum.beds.ac.uk/10.3390/cli9090136
Chicago/Turabian StyleBarthelmie, Rebecca J., and Sara C. Pryor. 2021. "Climate Change Mitigation Potential of Wind Energy" Climate 9, no. 9: 136. https://0-doi-org.brum.beds.ac.uk/10.3390/cli9090136
Note that from the first issue of 2016, this journal uses article numbers instead of page numbers. See further details here.