
Effects of Climate Conditions on TP Outsourcing in Lake Kinneret (Israel)


Migal Scientific Research Institute, Post Office Box 831, Kiryat Shmone 11016, Israel
Climate 2021, 9(9), 142; https://0-doi-org.brum.beds.ac.uk/10.3390/cli9090142
Submission received: 22 August 2021
/
Revised: 6 September 2021
/
Accepted: 9 September 2021
/
Published: 16 September 2021
Abstract
:Since the mid-1980s, significant changes in climate conditions have occurred, and trends of dryness in the Kinneret drainage basin have been documented, including a temperature increase and precipitation decline. The precipitation decline, and consequently the reduction in river discharge, resulted in a decrease in TP (total phosphorus) flux into Lake Kinneret. After the drainage of the Hula natural wetlands and old Lake Hula during the 1950s, the ecological characteristics of the Hula Valley were modified. Nutrient fluxes downstream into Lake Kinneret were therefore predicted. The impacts of climate conditions (precipitation and discharge) on TP (total phosphorus) outsourcing through erosive action are significant: higher and lower discharge enhances and reduces TP load, respectively. The total TP flushing range from the Hula Valley peat soil through the subterranean medium and where TP is directed are not precisely known but are probably outside Lake Kinneret. Most runoff water and mediated TP originates from bedrock through erosive action. Long-term records of TP concentrations in headwaters and potential resources in the Hula Valley confirmed the significant influence of climate conditions on the outsourcing of TP capacity. The impacts of agricultural development, external fertilizer loads and migratory cranes in the winter are probably insignificant.
1. Introduction
A wide range of chemical, agricultural, biological, and environmental characteristics of the Hula Valley have been documented. Phosphorus, manganese, and organic matter relationships in the Hula Valley peat soil [1,2,3,4,5,6,7,8,9,10], as well as the effects of geochemical parameters, pH, oxidation–reduction (redox), wettability (rainfall, irrigation), soil properties, temperature, and agricultural management (fertilization) conditions on the dynamics of phosphorus and TP (Total Phosphorus) bound-release mechanism from peat soil particle have been thoroughly investigated. Moreover, plant-mediated phosphorus and its role in the phosphorus transport from altered wetland soils into water pathways has been documented [11,12]. External sources of phosphorus in dust deposition and agricultural fertilization have been studied [3,10,13,14]. Phosphorus input in the Hula ecosystem from winter migrating cranes (Grus grus) has also been documented [15]. Information on phosphorus transportation and migration in relation to topography, hydrology, vegetation coverage, and land use management has been widely discussed [16]. Nevertheless, a quantitative analysis of the relative impacts of various sources of total phosphorus (TP) on the Lake Kinneret ecosystem remained to be performed. The long-term records of phosphorus dynamics in Lake Kinneret and its drainage basin were evaluated. Lake Kinneret’s known external TP sources are natural bedrock erosion, dust deposition, and anthropogenic intervention in the drainage basin, as well as soil degradation and agricultural–ecotourism developments within the Hula Valley. Among internal TP sourcing, reductive conditions and microbial activity in the in anoxic hypolimnion sediments are significant during the stratification period. The major impact on TP concentration in the lake is from the erosive which is dependent on river discharge. The TP concentrations in the Jordan River were found to be significantly associated with the headwater discharge ranges. The river discharge has been a consequence of climate conditions, such as the precipitation range
1.1. Regional Hydrology
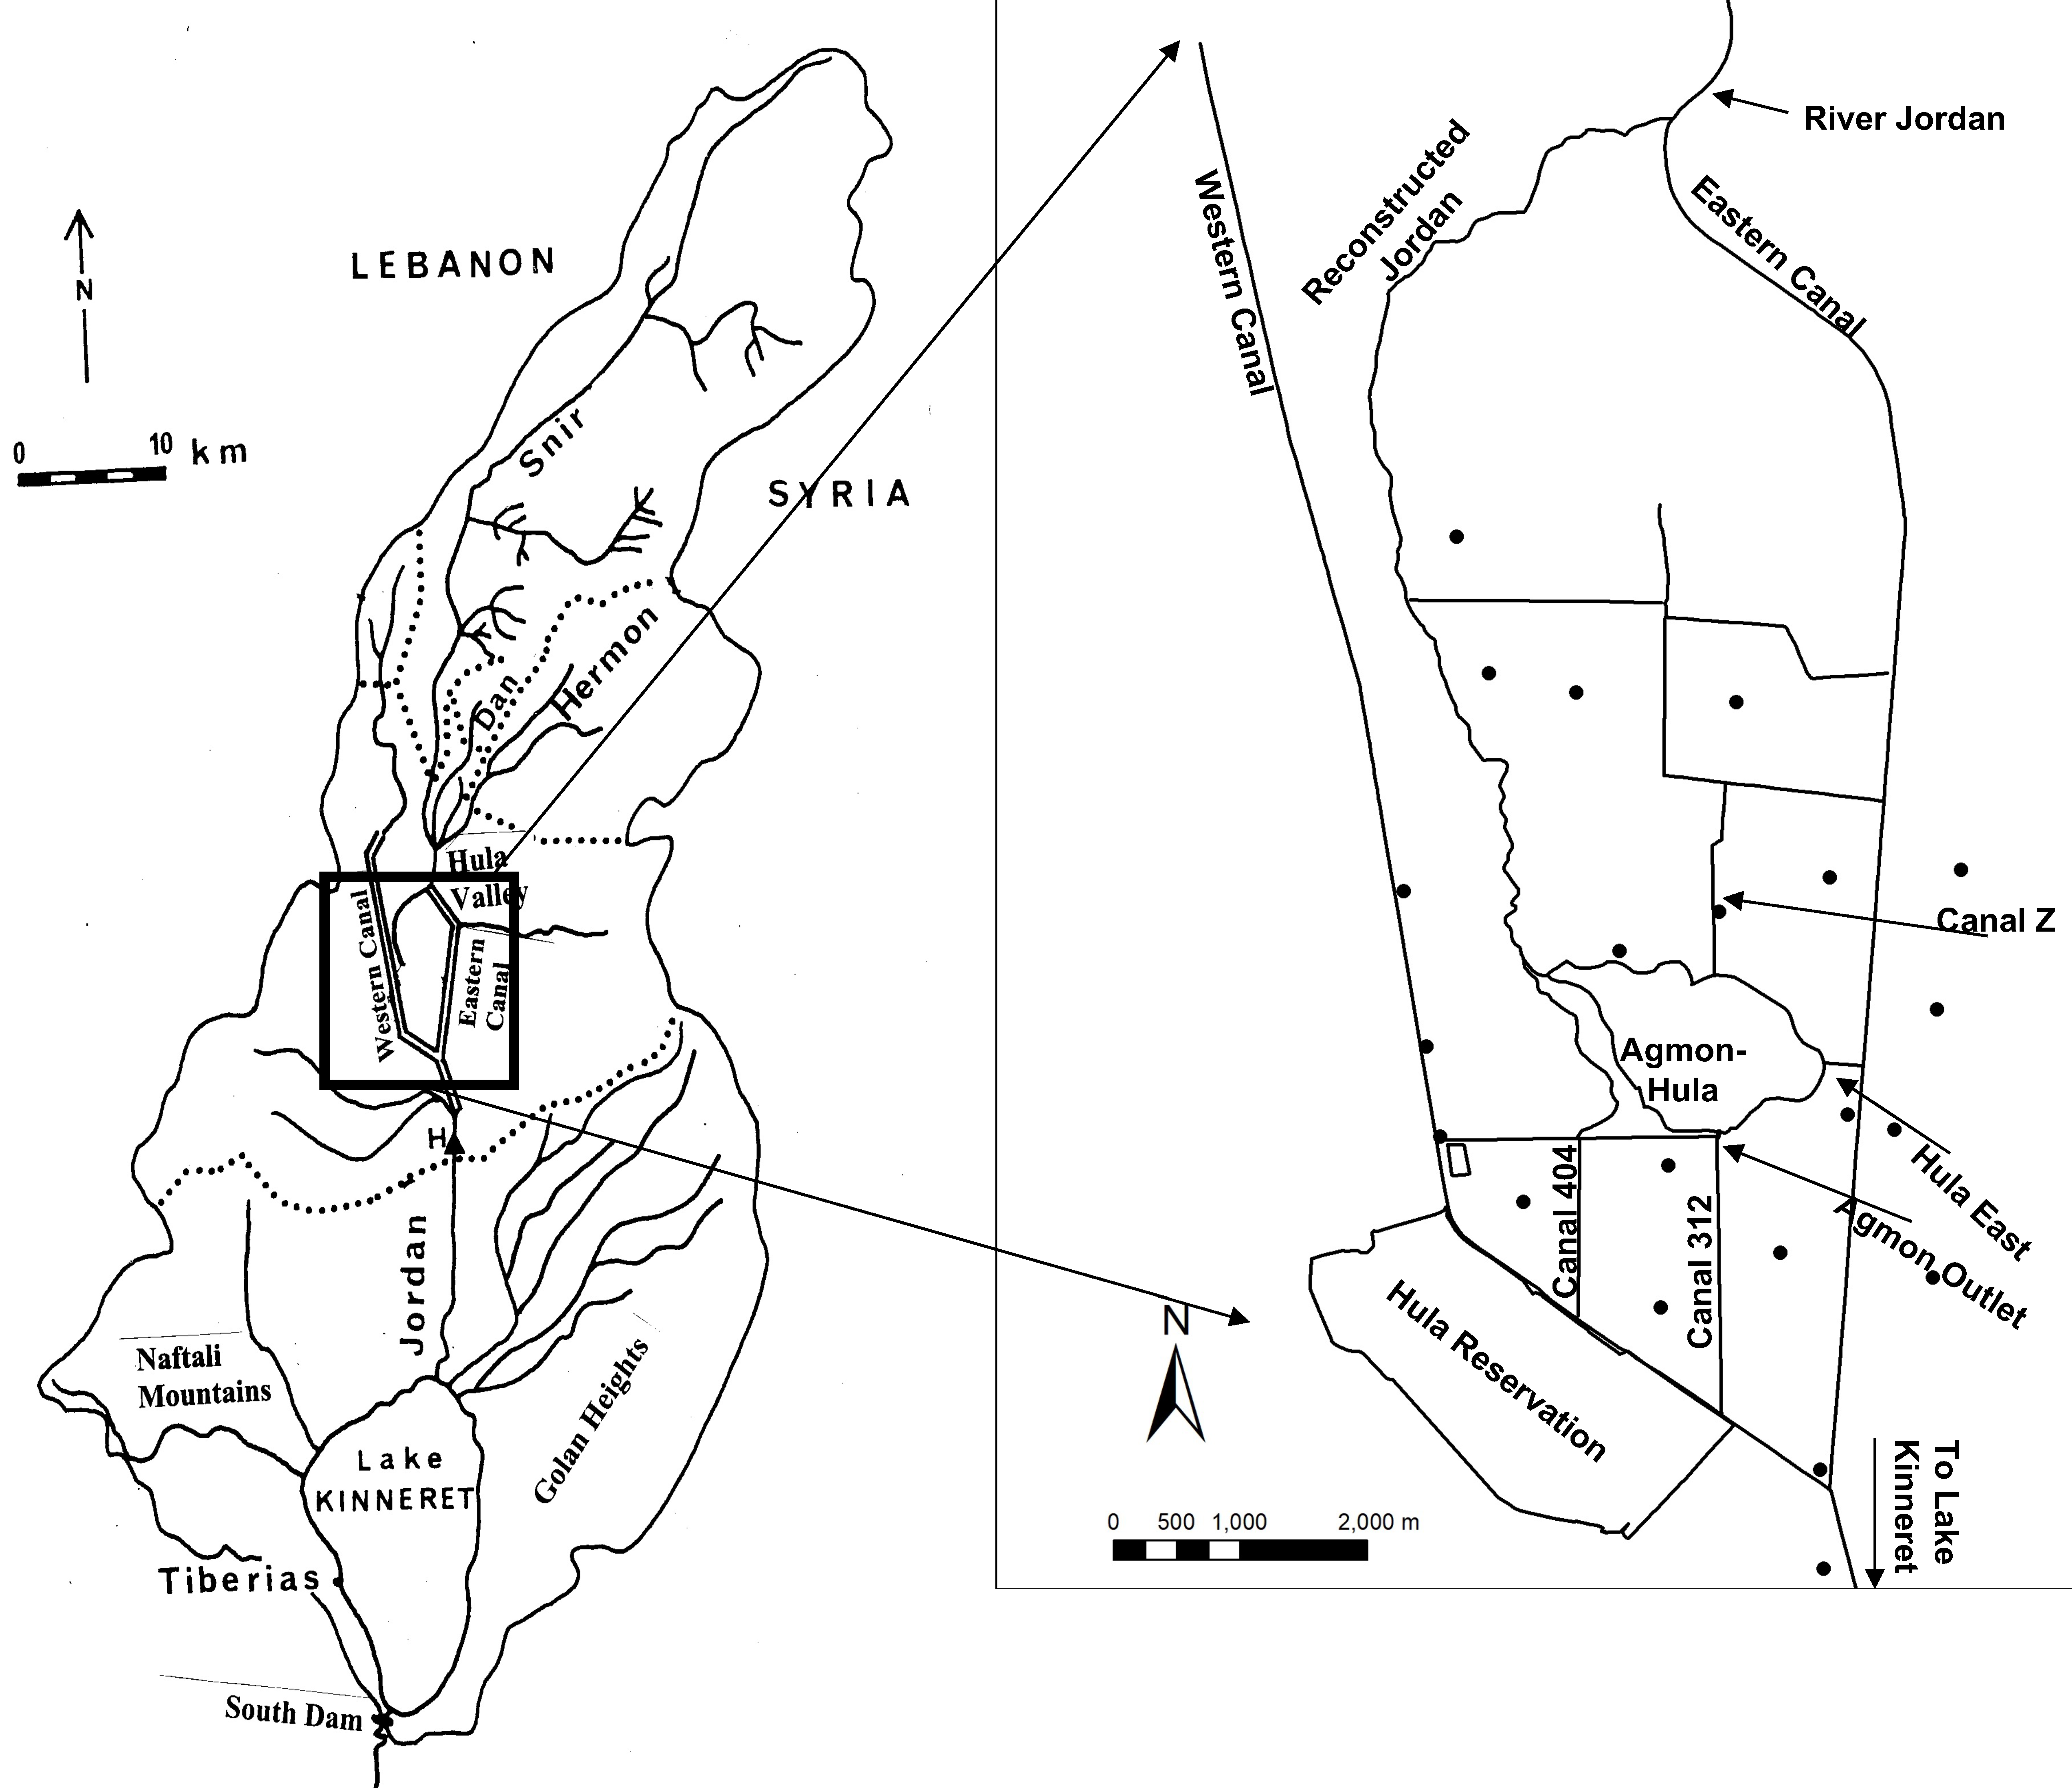
The Hula Valley and Lake Kinneret are located in the Syrian–African Rift Valley in northern Israel (Figure 1). Lake Kinneret is the only natural freshwater lake in Israel. Until 2010, an average of 336 mcm (336 million cubic meters) of water was pumped annually (34% in winter and 66% in summer) from the lake, mostly for domestic usage and partly for agricultural irrigation [17]. Since 2010, desalinization plants have supplied almost the entire water demand for domestic consumption, thus dramatically decreasing the pumping rate from Lake Kinneret. The water quality of Lake Kinneret is a national concern, because pollutant inputs (including TP) from the Hula Valley are prominent. More than 95% of Israel’s natural water resources are used. The total national water supply is 2.11 bcm (2.11 billion cubic meters), of which 0.55 bcm comes from the Kinneret–Jordan water system, and 0.7 bcm comes from desalinization. The area of the Kinneret drainage basin is 2730 km2 and is located mostly to the north of the lake, approximately 200 km2 from the Hula Valley. Three major headwater rivers (Hatzbani, Banyas, and Dan) flow from the Hermon Mountain region (Figure 1) in the northern part of the Kinneret drainage basin (2730 km2). These rivers join the Jordan River, for which, before the Hula drainage, crossed the valley through two branches (tributaries) flowing into the old Lake Hula. From Lake Hula, at an altitude of approximately 61 masl (61 m above mean sea level), the Jordan River flows downstream into Lake Kinneret at an altitude of 209 mbsl (209 m below mean sea level) for a distance of approximately 15 km. The Jordan River contributes approximately 63% of the Kinneret water budget and more than 50% of the total external nutrient inputs [18]. Before the drainage of the Hula Valley (1957), the land was covered by Lake Hula (1.5 m mean depth; 13 km2 water surface) and 3500 ha of swamps. The swampy area was completely covered by water in the winter and partly covered in the summer. To the north of the swamps was an area (3200 ha) where water table levels were high in winter, thus making agricultural cultivation impossible. During the summer, when underground water levels declined, this 3200-ha surface was successfully cultivated.
1.2. Brief Anthropocene History of the Hula Valley
The Hula Valley was turned into wilderness by the Mongolians from 1240 AC. Mosquitos carrying malaria were introduced into the Hula Valley by the Crusaders, and the inundation of the Hula Valley was enhanced as a result of the construction of the Benot Yaakov bridge downstream by Bivers in 1260. Later, malaria became a major parameter affecting human activity in the Hula wetlands.
The Ghawarna tribes were the first people to settle in the Hula Valley in the 4th decade of the 19th century, but their settlement came to an abrupt end in 1948. The development of the Ghawarna settlement was very slow during the 19th century but significantly accelerated during the first half of the 20th century. According to British sources, between 1877 and 1948, the Ghawarna population increased from 520 to 31,470. Before 1830, no permanent settlements of the Ghawarna existed in the Hula Valley. Residents from the northern region came down from the surrounding mountains with their cattle herds for grazing and for agricultural cropping in the summer and stayed most of the summer months in the parts of the valley that were not inundated. This was the summer paradox of the Hula wetlands before the 20th century: the drier the winter, the greater the quantity of grass for cattle grazing and land for agriculture. The cultivated land was like a puzzle of plots, denoted ‘Mazraa’ (or ‘Azeva’).
The history of Jewish settlements in the upper Galilee and particularly in the Hula Valley and its vicinity dates to the end of the 19th century and the beginning of the 20th century. Nevertheless, extensive Jewish settlement in the Hula Valley region started in the 1940s. The drainage of the old Lake Hula and adjacent swampy area began in 1950 and was completed in 1955. The old Lake Hula wetland area was converted to arable land. Beneficial crops were produced, but not without difficulties. Shortly thereafter, the National Water Carrier was constructed, and Lake Kinneret became a major national source of the domestic water supply.
1.3. The Hula Reclamation Project (HRP)
Because of the lake and wetland drainage (1957), more than 6500 ha of natural wetland area was converted for agricultural development. Therefore, the unique natural composition of exceptionally diverse fauna and flora was nearly destroyed. The newly created arable land became a source of income to the residents of northern Israel. For 40 years, it was successfully cultivated, agricultural products (mostly cotton, corn, alfalfa, and vegetables) were economically produced, and nutrient flux into Lake Kinneret did not threaten the lake’s water quality. Nevertheless, as a result of inappropriate management, drainage canals were blocked, irrigation methods were not suitable for optimal soil management and fertility, and crop utilization and water tables declined. Consequently, the soil structure of the upper layers (0–0.5 m) became oxidized and deteriorated, heavy dust storms became frequent, and the soil surface subsided (7–10 cm/year). Because of the decline in the water table level and longer periods of leaving bare and dry soils uncultivated, underground fires occurred often. Increased rodent population outbreaks caused severe damage to agricultural crops and the stability of drainage canal banks. In the 1980s, intensive cultivation of the land was gradually abandoned. Therefore, in the period of 1990–1997, the entire drainage area underwent a reclamation project, referred to as the Hula Reclamation Project (HRP), which focused on the 500 ha in the middle part of the valley at the lowest altitude. The project was aimed primarily at decreasing the nutrient fluxes from the Hula Valley soil while implementing modern irrigation methods to reintroduce economical land use and integrate ecotourism. The HRP comprised several operational stages: increasing the soil moisture by elevating the ground water table (GWT), changing the irrigation method, renewing the drainage system in the entire valley, and creating a new shallow lake called ‘Agmon-Hula’. The surface area and mean depth of this lake were 110 ha and 0.5 m, respectively, in the years 1994–2010, but later this body of water shrank to a surface area of 82 ha and 0.2 m deep. This shallow lake was designed to be operated as a drainage basin for the entire valley and to provide an ecological service as an ecotourism wetland. A plastic sheet (4-mm thickness) was placed vertically (0–4.5 m) along 2.8 km, crossing the valley in an east-west position, to partition the southern part of the valley and prevent underground migration and leakage of pollutants downstream to Lake Kinneret.
Before the drainage of the Hula Swamps and the old lake became a national concern, the main interest in the north was security combined with demographic population dispersal, and agricultural income sources. Later, the search for essential utilization of the Hula land became a national concern. Optimized implementation of agricultural technologies was not easily established, and many difficulties hindered efficient utilization. The Hula Project included the development of a new multipurpose shallow lake, Agmon-Hula [19,20]. The objective of this new lake was to create a sufficient hydrological volume to collect peat soil-drained, nutrient-rich water effluent mixed with fresh Jordan River water to prevent deterioration of water quality. Nutrient-rich polluted water from Lake Agmon-Hula was transferred for irrigation usage outside the Kinneret drainage basin. Agmon-Hula and its surroundings (500 ha) were marked for commercial ecotourism management. Natural attractions were designed for observational touring of the aquatic vegetation landscape, bird watching and sport fishing recreation. The rationale was to replace agriculture with another income source for the land owners. The original design was successfully implemented, and crane wintering provided an attractive experience for tourists.
The objective of this paper is to gain insight into phosphorus resources in the Kinneret watershed ecosystem and evaluate the practical contributions of phosphorus to this ecosystem. The paper focuses on practical management policy of water quality, agriculture, ecology and public welfare aspects. This work evaluates the ecosystem structure of the Kinneret water shed and particularly the Hula Valley, resulting from a succession of natural and anthropogenic processes recently exposed to climate change conditions. An attempt is made to develop an efficient management design involving controversial constraints such as water quality protection, agricultural development, ecological issues, nature preservation, and climate change conditions.
2. Materials and Methods
2.1. Data Sources
The GWT, TP concentrations in the water canals of the Hula Project area and Agmon-Hula effluent (1994–2020), the three headwater rivers and Jordan River discharge (1970–2018) (mcm/year; 106 m3), and rainfall (1940–2020) were statistically evaluated. Maximal counts of wintering cranes in the period of 1997–2020 were also evaluated. Data were obtained from the following sources: Annual Reports of the Kinneret Limnological Laboratory [21]; National Meteorological Service; National Hydrological Service; National Water Authority; MIGAL-Scientific Research Institute; Mekorot Water Supply Company Ltd. (Nazareth, Israel); Monitoring Unit, Jordan District. Data on the Jordan River nutrient loads, concentrations, and discharge were obtained from annual and temporal reports. Agmon-Hula TP concentrations (1993–2019) were obtained from the annual reports [22,23,24,25]. Monthly means (1993–2019) of 277 sampled TP concentrations in Agmon-Hula effluent were evaluated; 27 months (9 in 2016) were not sampled in this period, owing to technical difficulties. Monthly averages of two to six weekly samples of TP concentrations in underground water samples collected monthly (14 months) from the top level of the GWT in 14 bore-holes (drilled for GWT monitoring) distributed in the Hula valley were assessed (Figure 1) [1].
2.2. Statistical Methods
Three regression methods were performed (STATA 17): (1) fractional polynomial regression of continuous covariates, a form of parsimonious parametric modeling (Published in Applied Statistics 43: 429–467), (2) linear regression with confidence interval percentage (95%) (STATA17), and (3) LOWESS Smoother (0.8 Bandwidth), which provides weighted scatterplot smoothing.
3. Results
3.1. Changes in Climate Conditions: Temperature, Rainfall, River Discharge, and Nutrient Dynamics
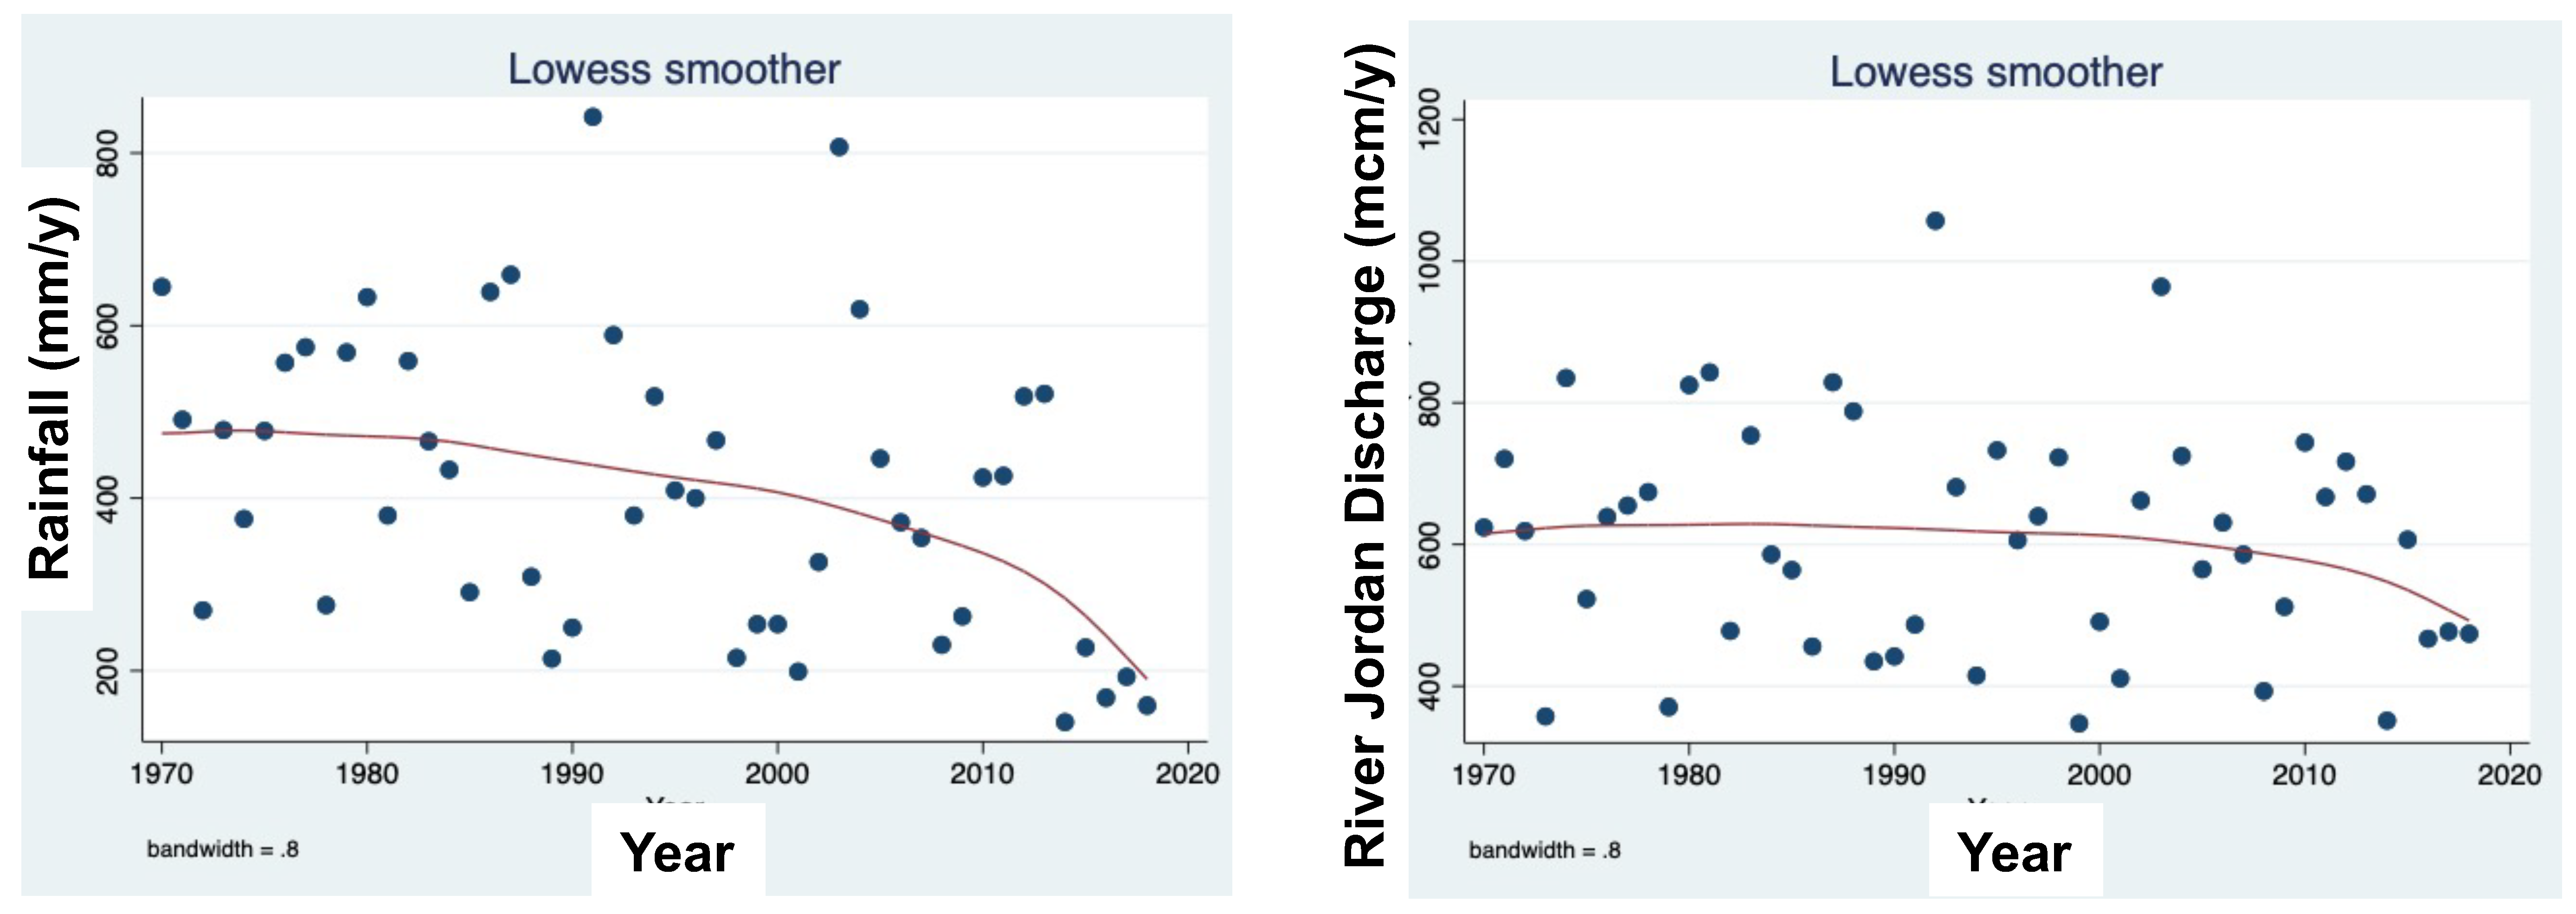
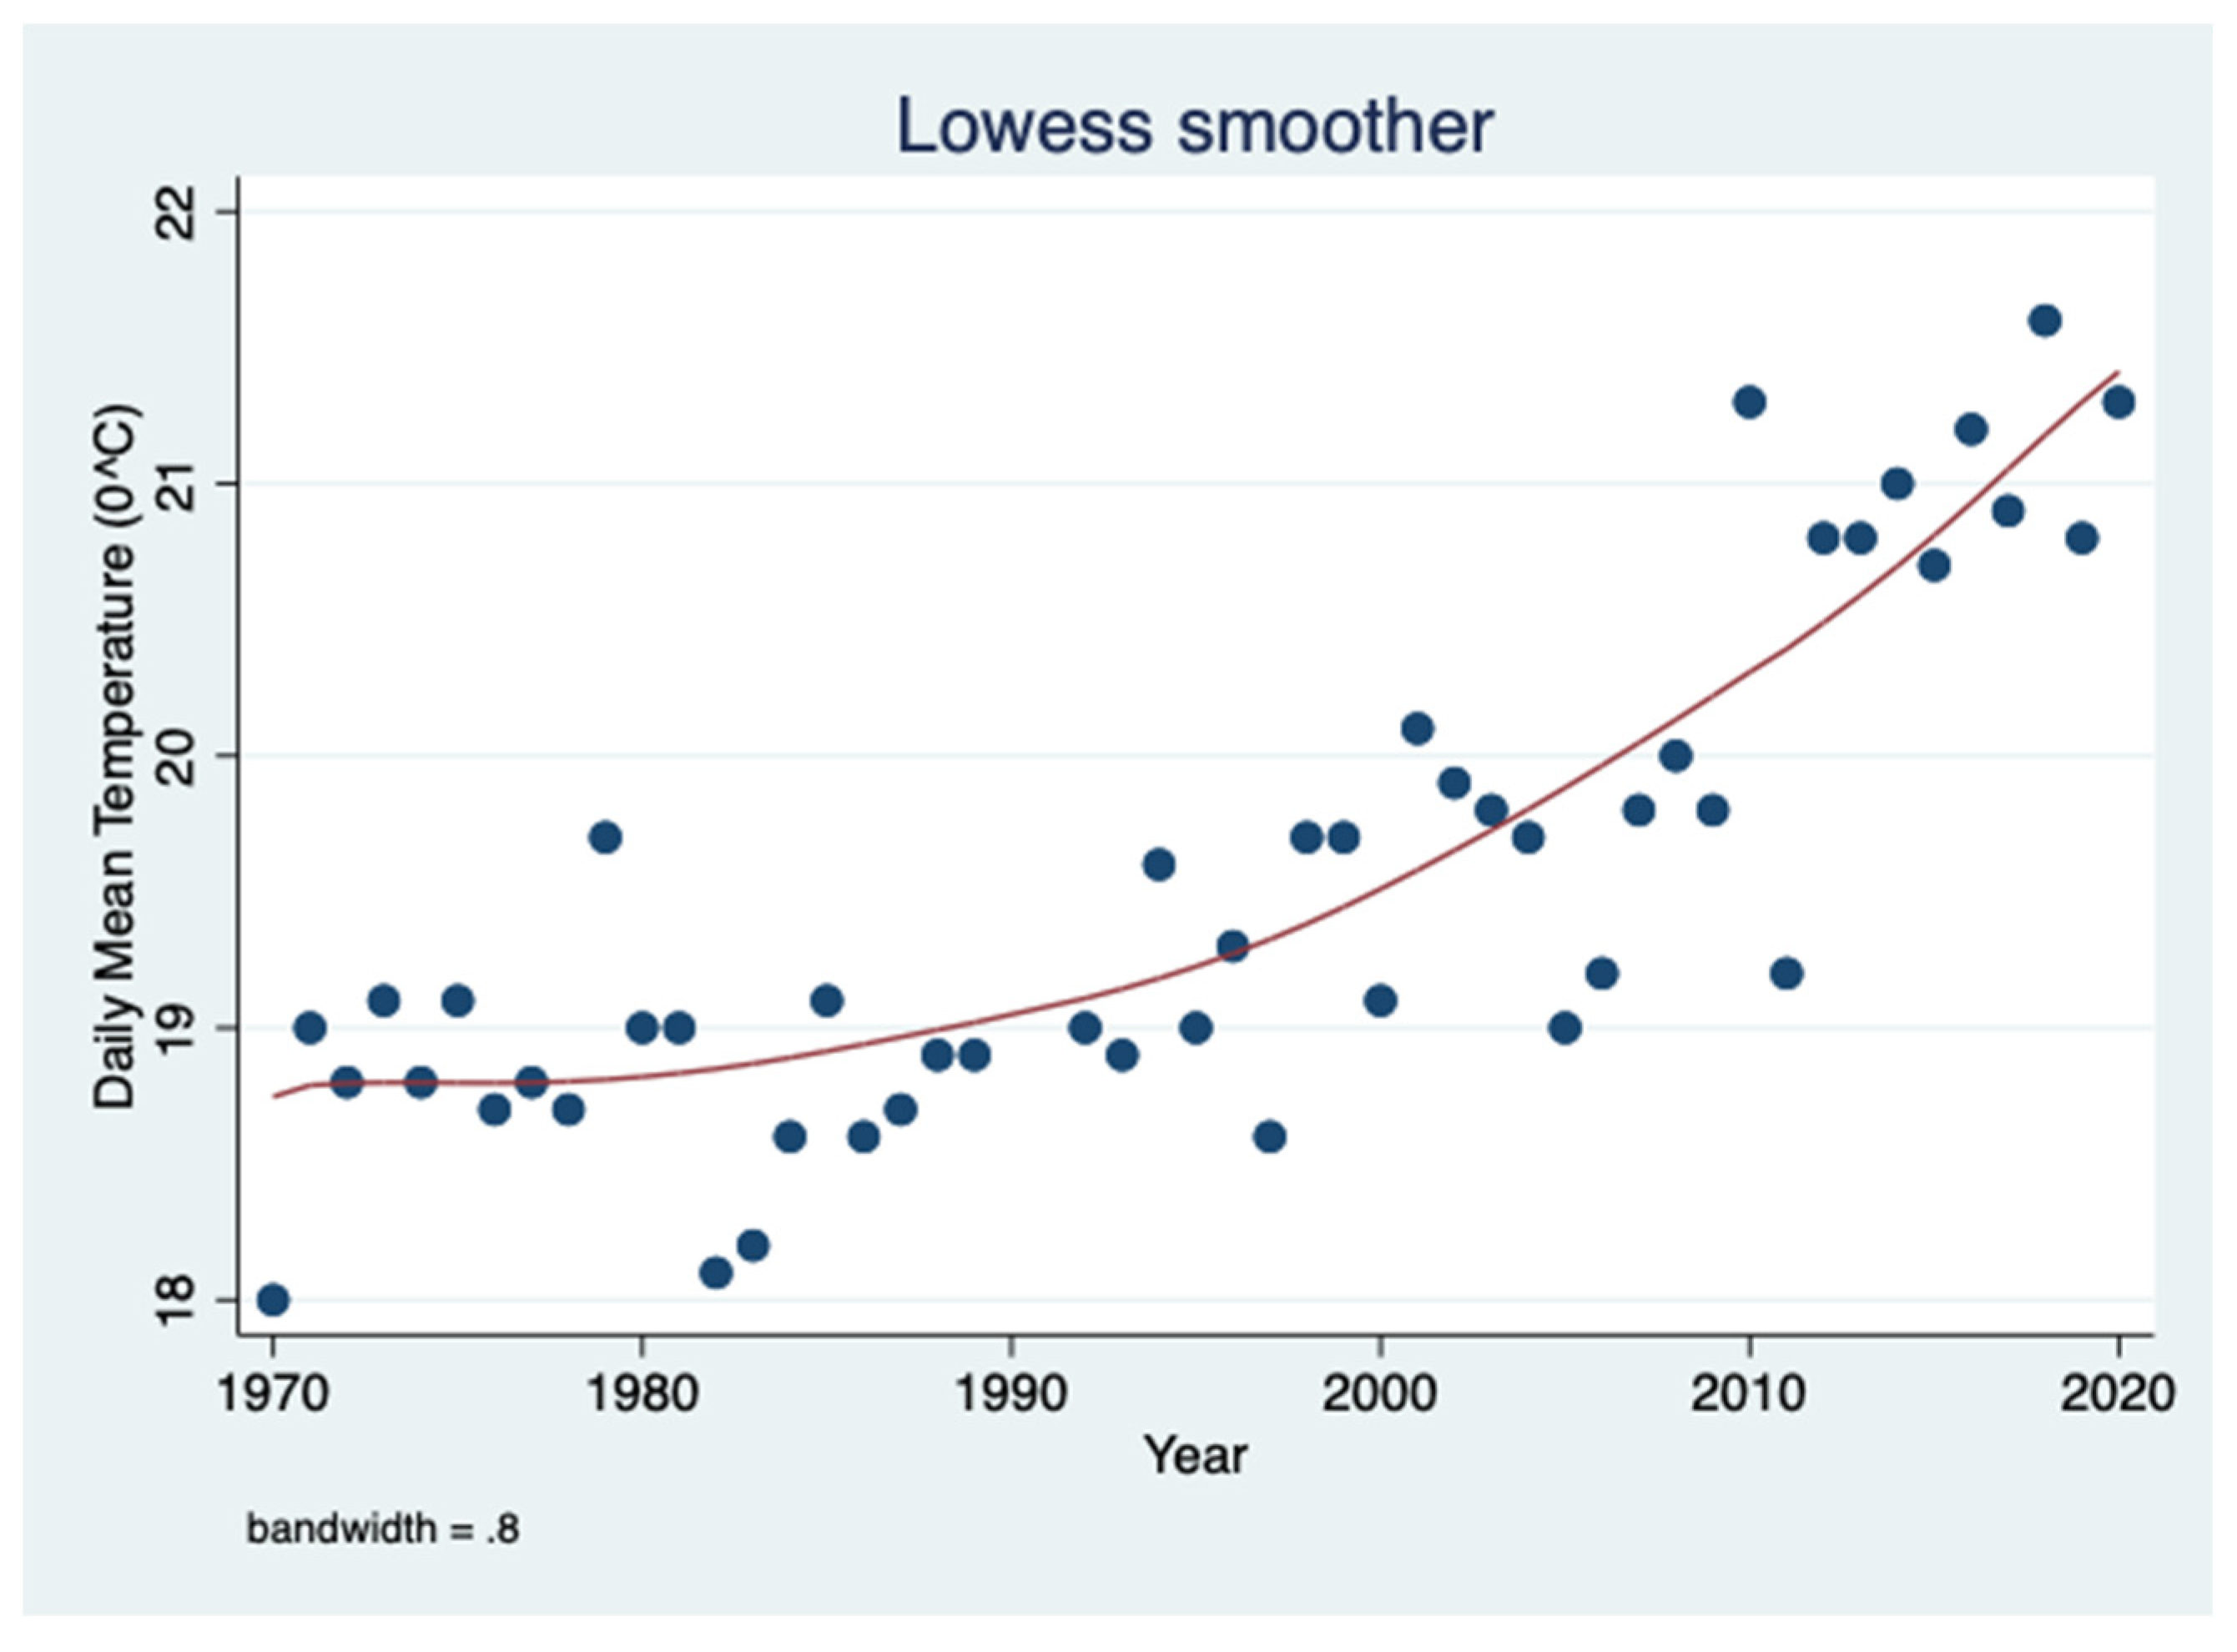
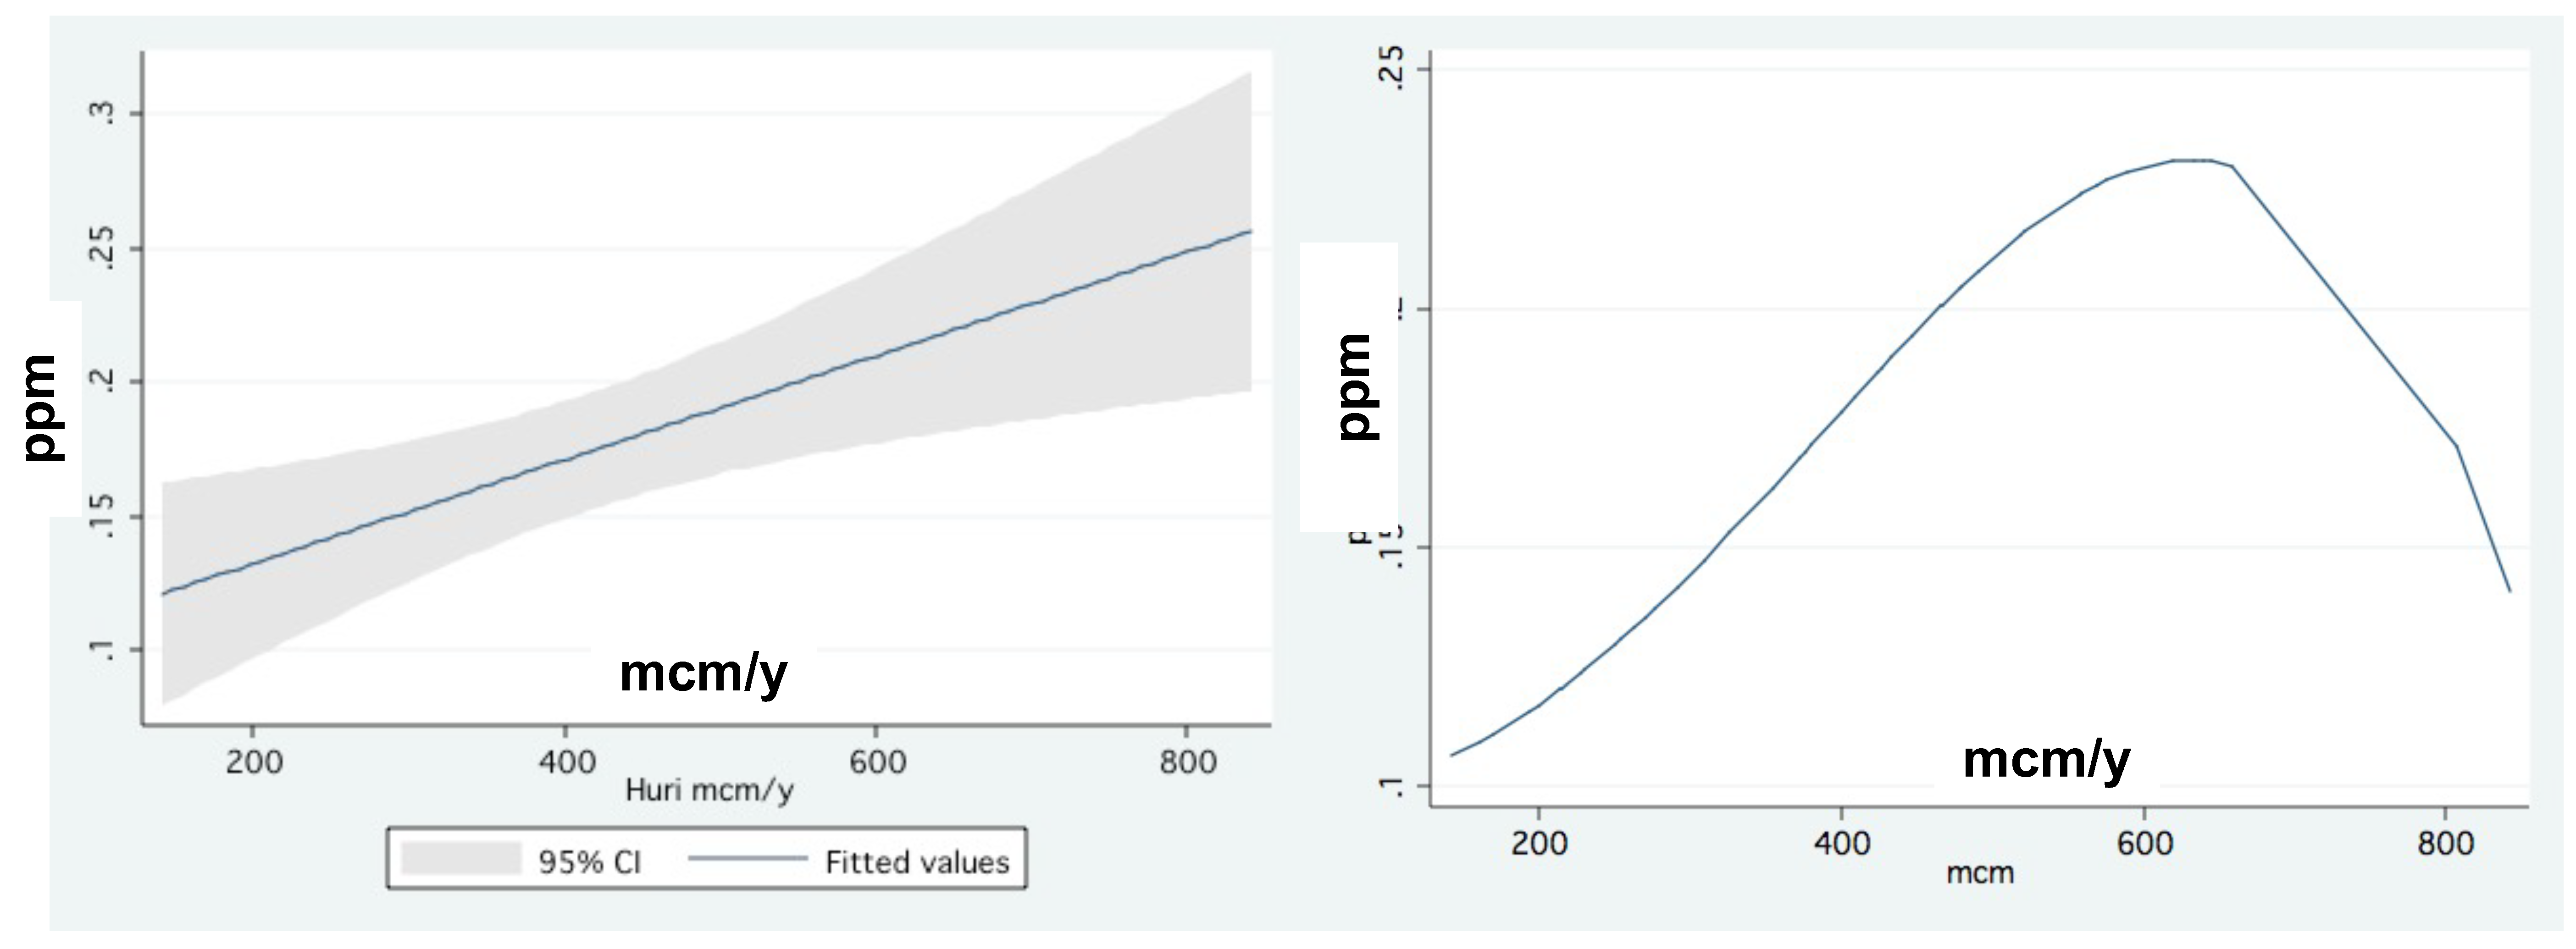
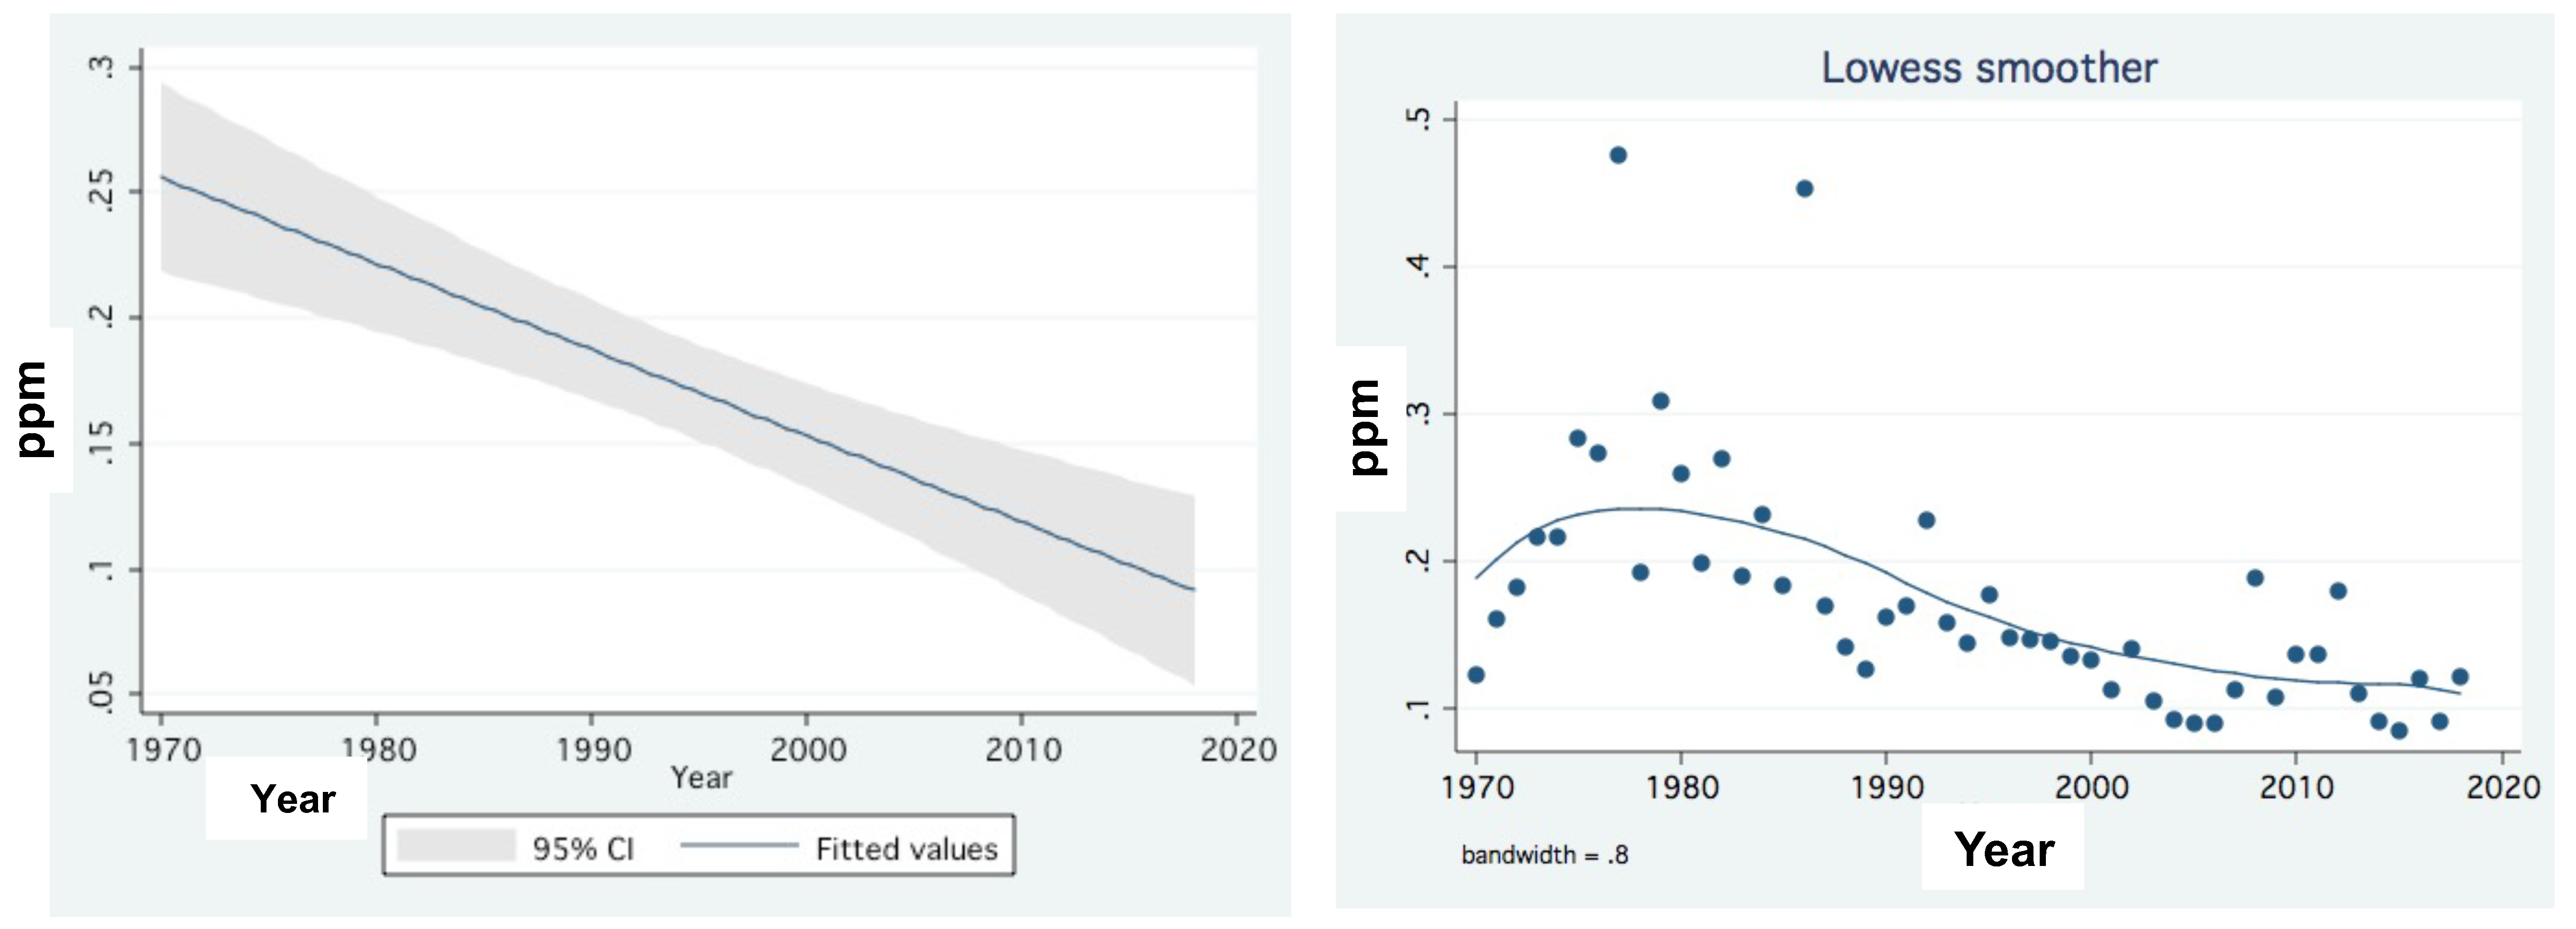
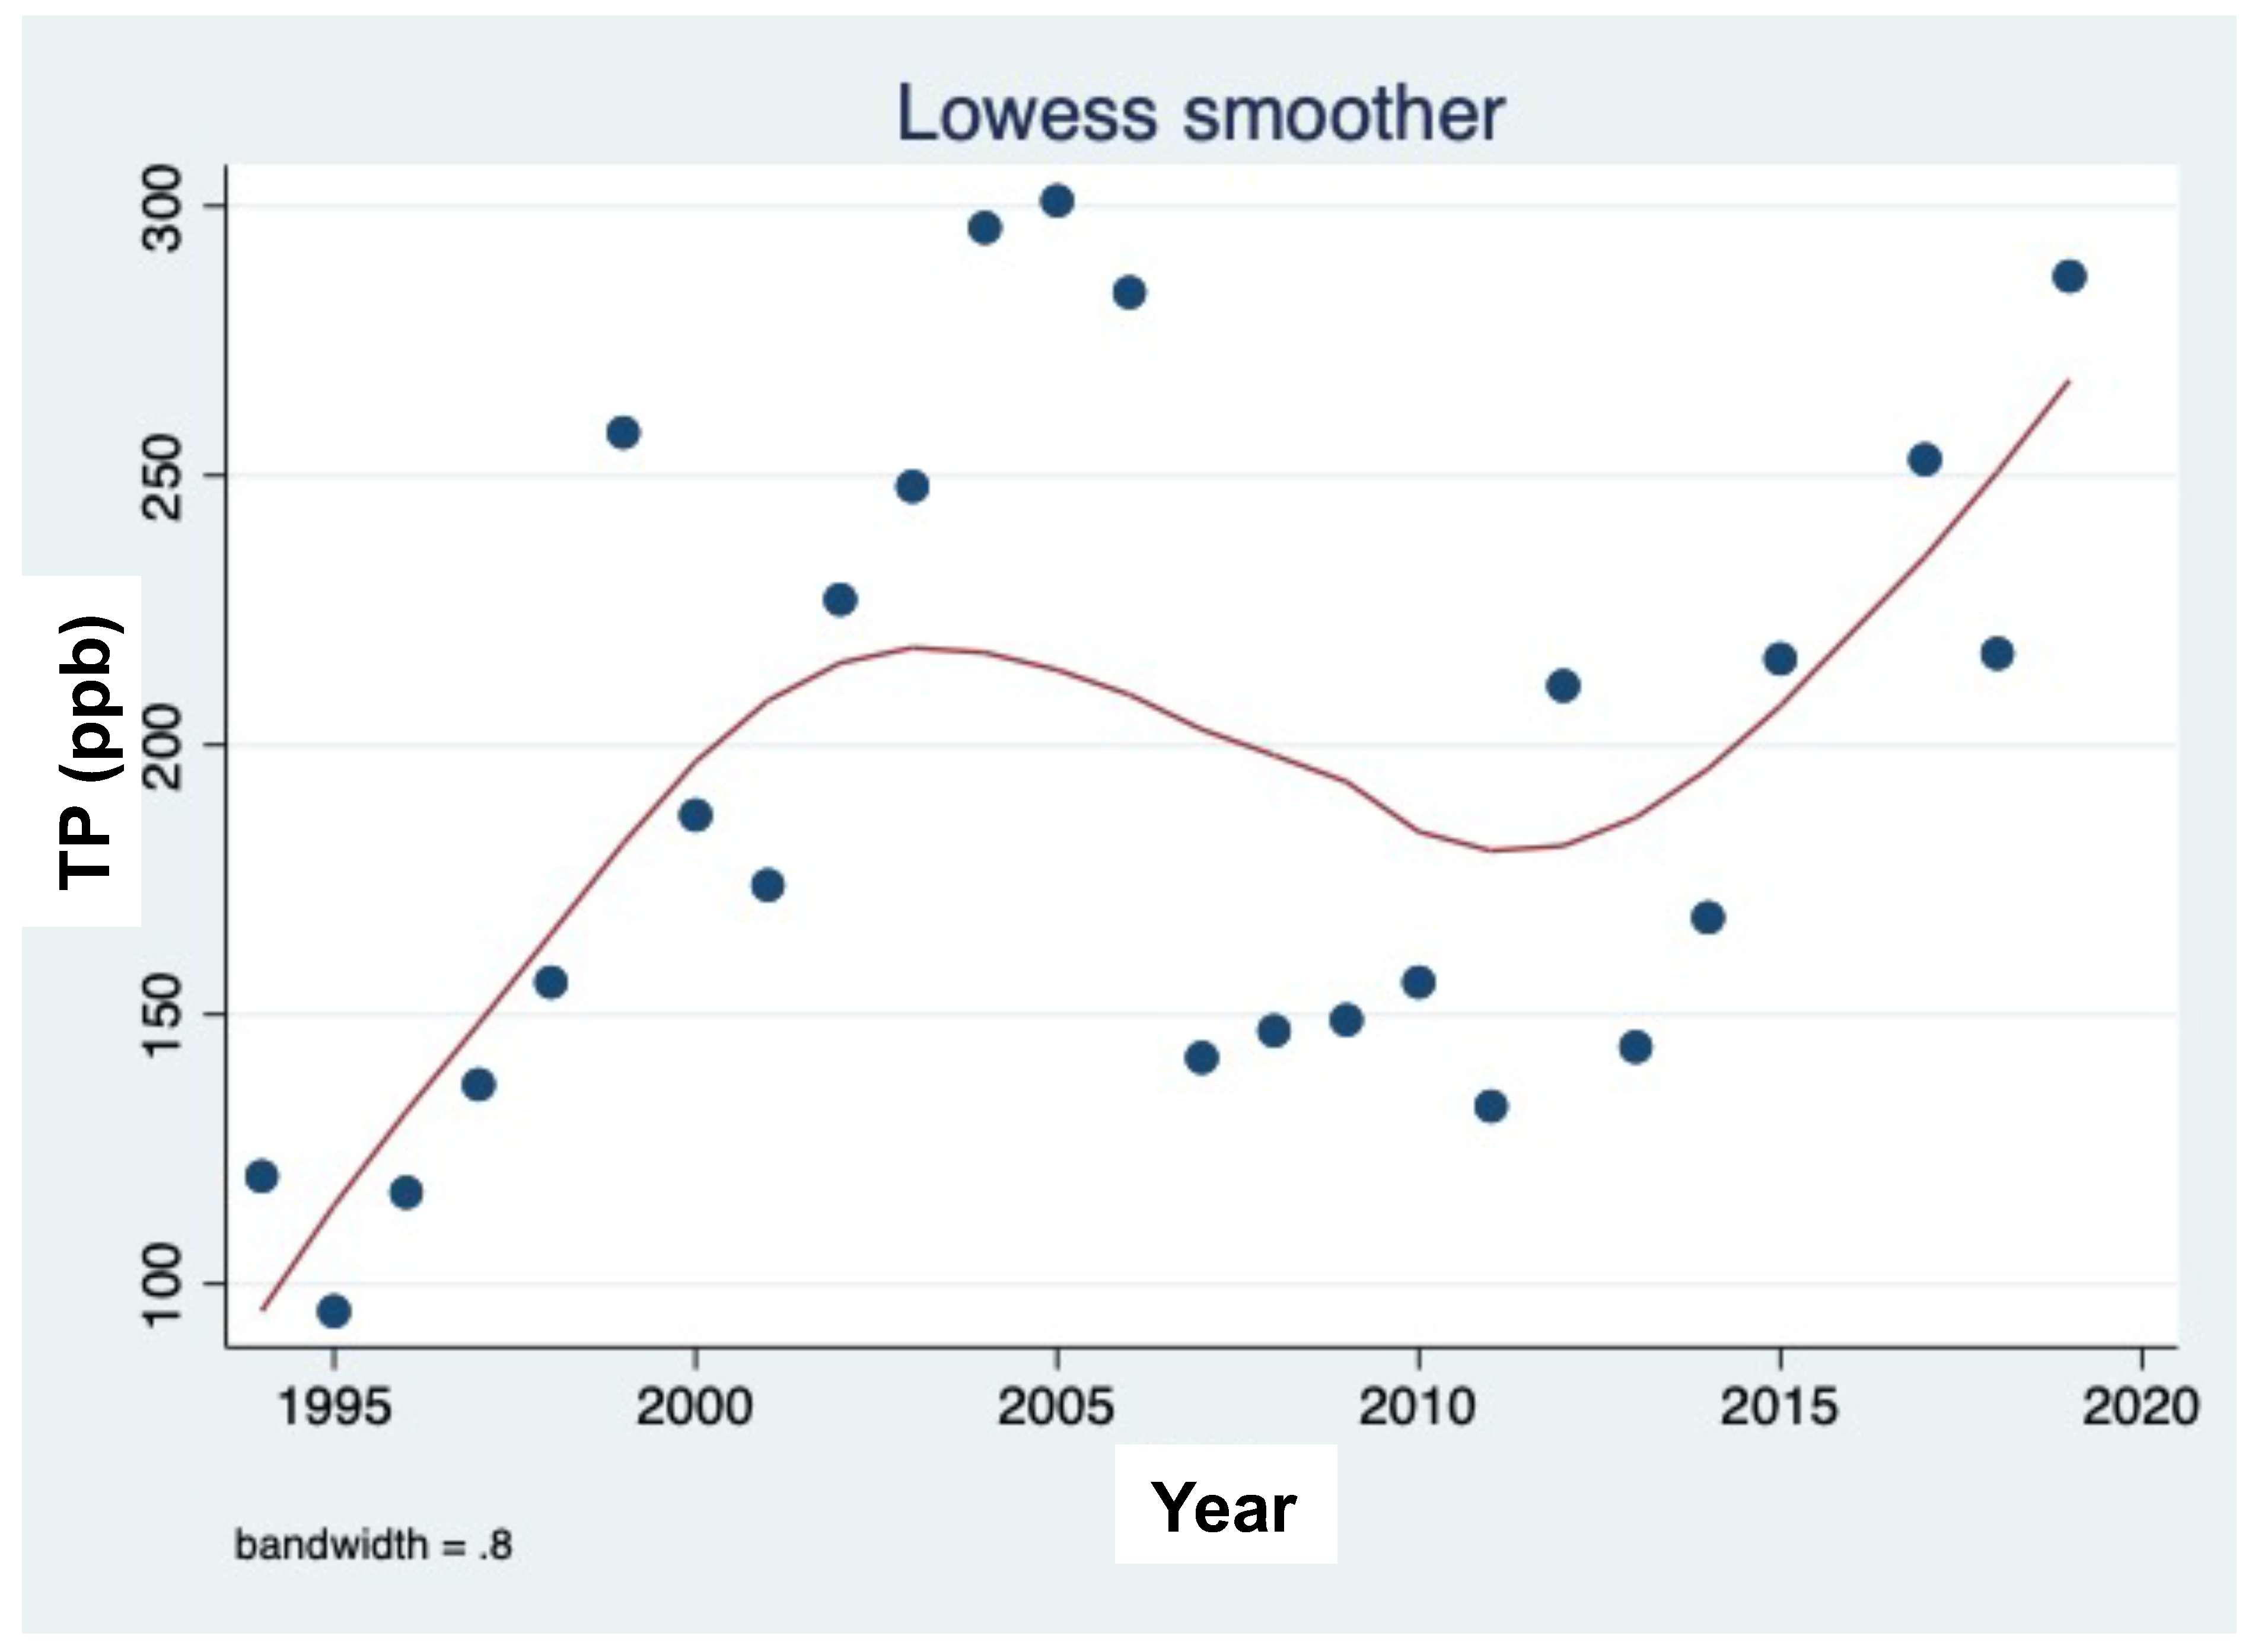
Changes in climate conditions, such as decreased precipitation, decreased Kinneret headwater discharge, and temperature elevation, were indicated since the mid-1980s (Figure 2, Figure 3 and Figure 4) [6,26]. A decline in TP concentrations and Jordan River discharge was documented (Figure 5, Figure 6, Figure 7, Figure 8, Figure 9 and Figure 10) [5,6,7,8,9,10]. The positive relationship between TP concentrations in Lake Agmon-Hula and the Jordan River is shown in Figure 11. Changes in climate conditions were also reflected by the lowering of the GWT in the Hula Valley (Figure 12). The temporal and seasonal elevations in TP concentrations in Lake Agmon-Hula are shown in Figure 13, Figure 14 and Figure 15. A mild temporal increase in epilimnetic TP in Lake Kinneret was documented during 1970–2001 [26]. The trend of dryness as part of climate change also resulted a decline in the GWT in the Hula Valley (Figure 11). The decline in TP concentrations in Jordan River ranged between 0.21 and 0.14 ppm. The increase in TP concentrations in the Kinneret epilimnion during 1969–2001 was from 0.015 to 0.021 ppm [26]. Moreover, the TP concentration dynamics in the Agmon effluent and Jordan waters indicated an inverse relationship (Figure 11). The trend in the GWT decline since 2010 (Figure 12) probably influenced TP dynamics in the peat organic soil. Temporal (1994–2020) changes in TP concentrations in the Hula Valley runoff routes, particularly in the Agmon-Hula effluent, indicated a long-term trend of elevation (Figure 14). The seasonal and annual dynamics of TP content in the Agmon-Hula waters continually showed significant elevation during the late summer–autumn months, as a result of offset degradation of submerged vegetation. The increase in TP in late summer–autumn was due to degradation and decomposition of submerged vegetation, whereas cranes did not contribute significantly to TP in Lake Kinneret. Positive regressions (r2 = 0.596) were observed between Jordan River discharge and nutrient inflow loads (p < 0.0001) for TP. Independently, the discharge in the Jordan River declined since the mid-1980s from 15 to <10 m3/s, owing to a precipitation decline. Lake Kinneret’s sources of phosphorus were dust deposition and river inflows, whereas the internal sources were bottom sediments, in a geochemical and bacterially driven manner. Most of the dust deposition was fluxed directly into Lake Kinneret and partly into the Jordan River from ‘African’ regions. Part of the deposited dust was from the Hula valley [13,14]. Dust deposition was probably negligible when the valley was covered by swampy wetlands and old Lake Hula. After Hula drainage (late 1950s), sporadic seasonal eastern storm (Sharkiye) events initiated heavy dust loads, which sharply decreased in response to extensive agricultural development and further declined because of the HRP [13]. The decline in dust storms was a result of HRP implementation (which enhanced soil moisture and improved agricultural technology involving full year cycle ‘green cover’) and, to a lesser extent, changes in climate conditions. Dryness enhancement in the Hula Valley might have caused an increase in phosphorus concentration in the Jordan River, but this was not the case: phosphorus inputs continuously declined. Consequently, Hula Valley dust deposition appeared to have a minor effect on phosphorus input into Lake Kinneret and was slightly affected by anthropogenic activities but was not significantly affected by climate change. Dominant effects of climate change through river discharge and erosive eco-forces are therefore suggested.
The TP mass through the Lake Agmon-Hula outflow was found to vary between 0.9 and 1.6 t/y, the multi-annual mean range of TP concentrations in the Agmon-Hula outlet was 0.01–0.2 ppm, and no long-term changes were documented.
3.2. Environmental Changes
After the implementation of the HRP, a partial restoration of the lost Lake Hula native flora and fauna species was observed, including approximately 300 bird species, 40 plant species, and 12 fish species in the Hula Valley. The valley has been populated annually from November through March by increasing numbers of cranes, including as many as 50,000 in the winter of 2019–2019 (Figure 16). A collaborative solution involving farmers, nature authorities, water managers, land owners, and regional municipalities was budgeted for and implemented. The cranes’ night stay (12–14 h) site was in the protected refuge site in the newly created shallow lake Agmon-Hula. Consequently, the study of the potential impact of cranes on phosphorus content in the Agmon-Hula outflows became critical. This study included hydrological regime and chemical analyses of the Agmon-Hula effluent.
During 1995–2018, the hydrological management of Agmon-Hula was accompanied by chemical monitoring aimed at assessing its potential as a TP source.
The monthly water balance (103 m3/season) of Lake Agmon-Hula is shown by the 2001 annual summary [19] in Table 1.
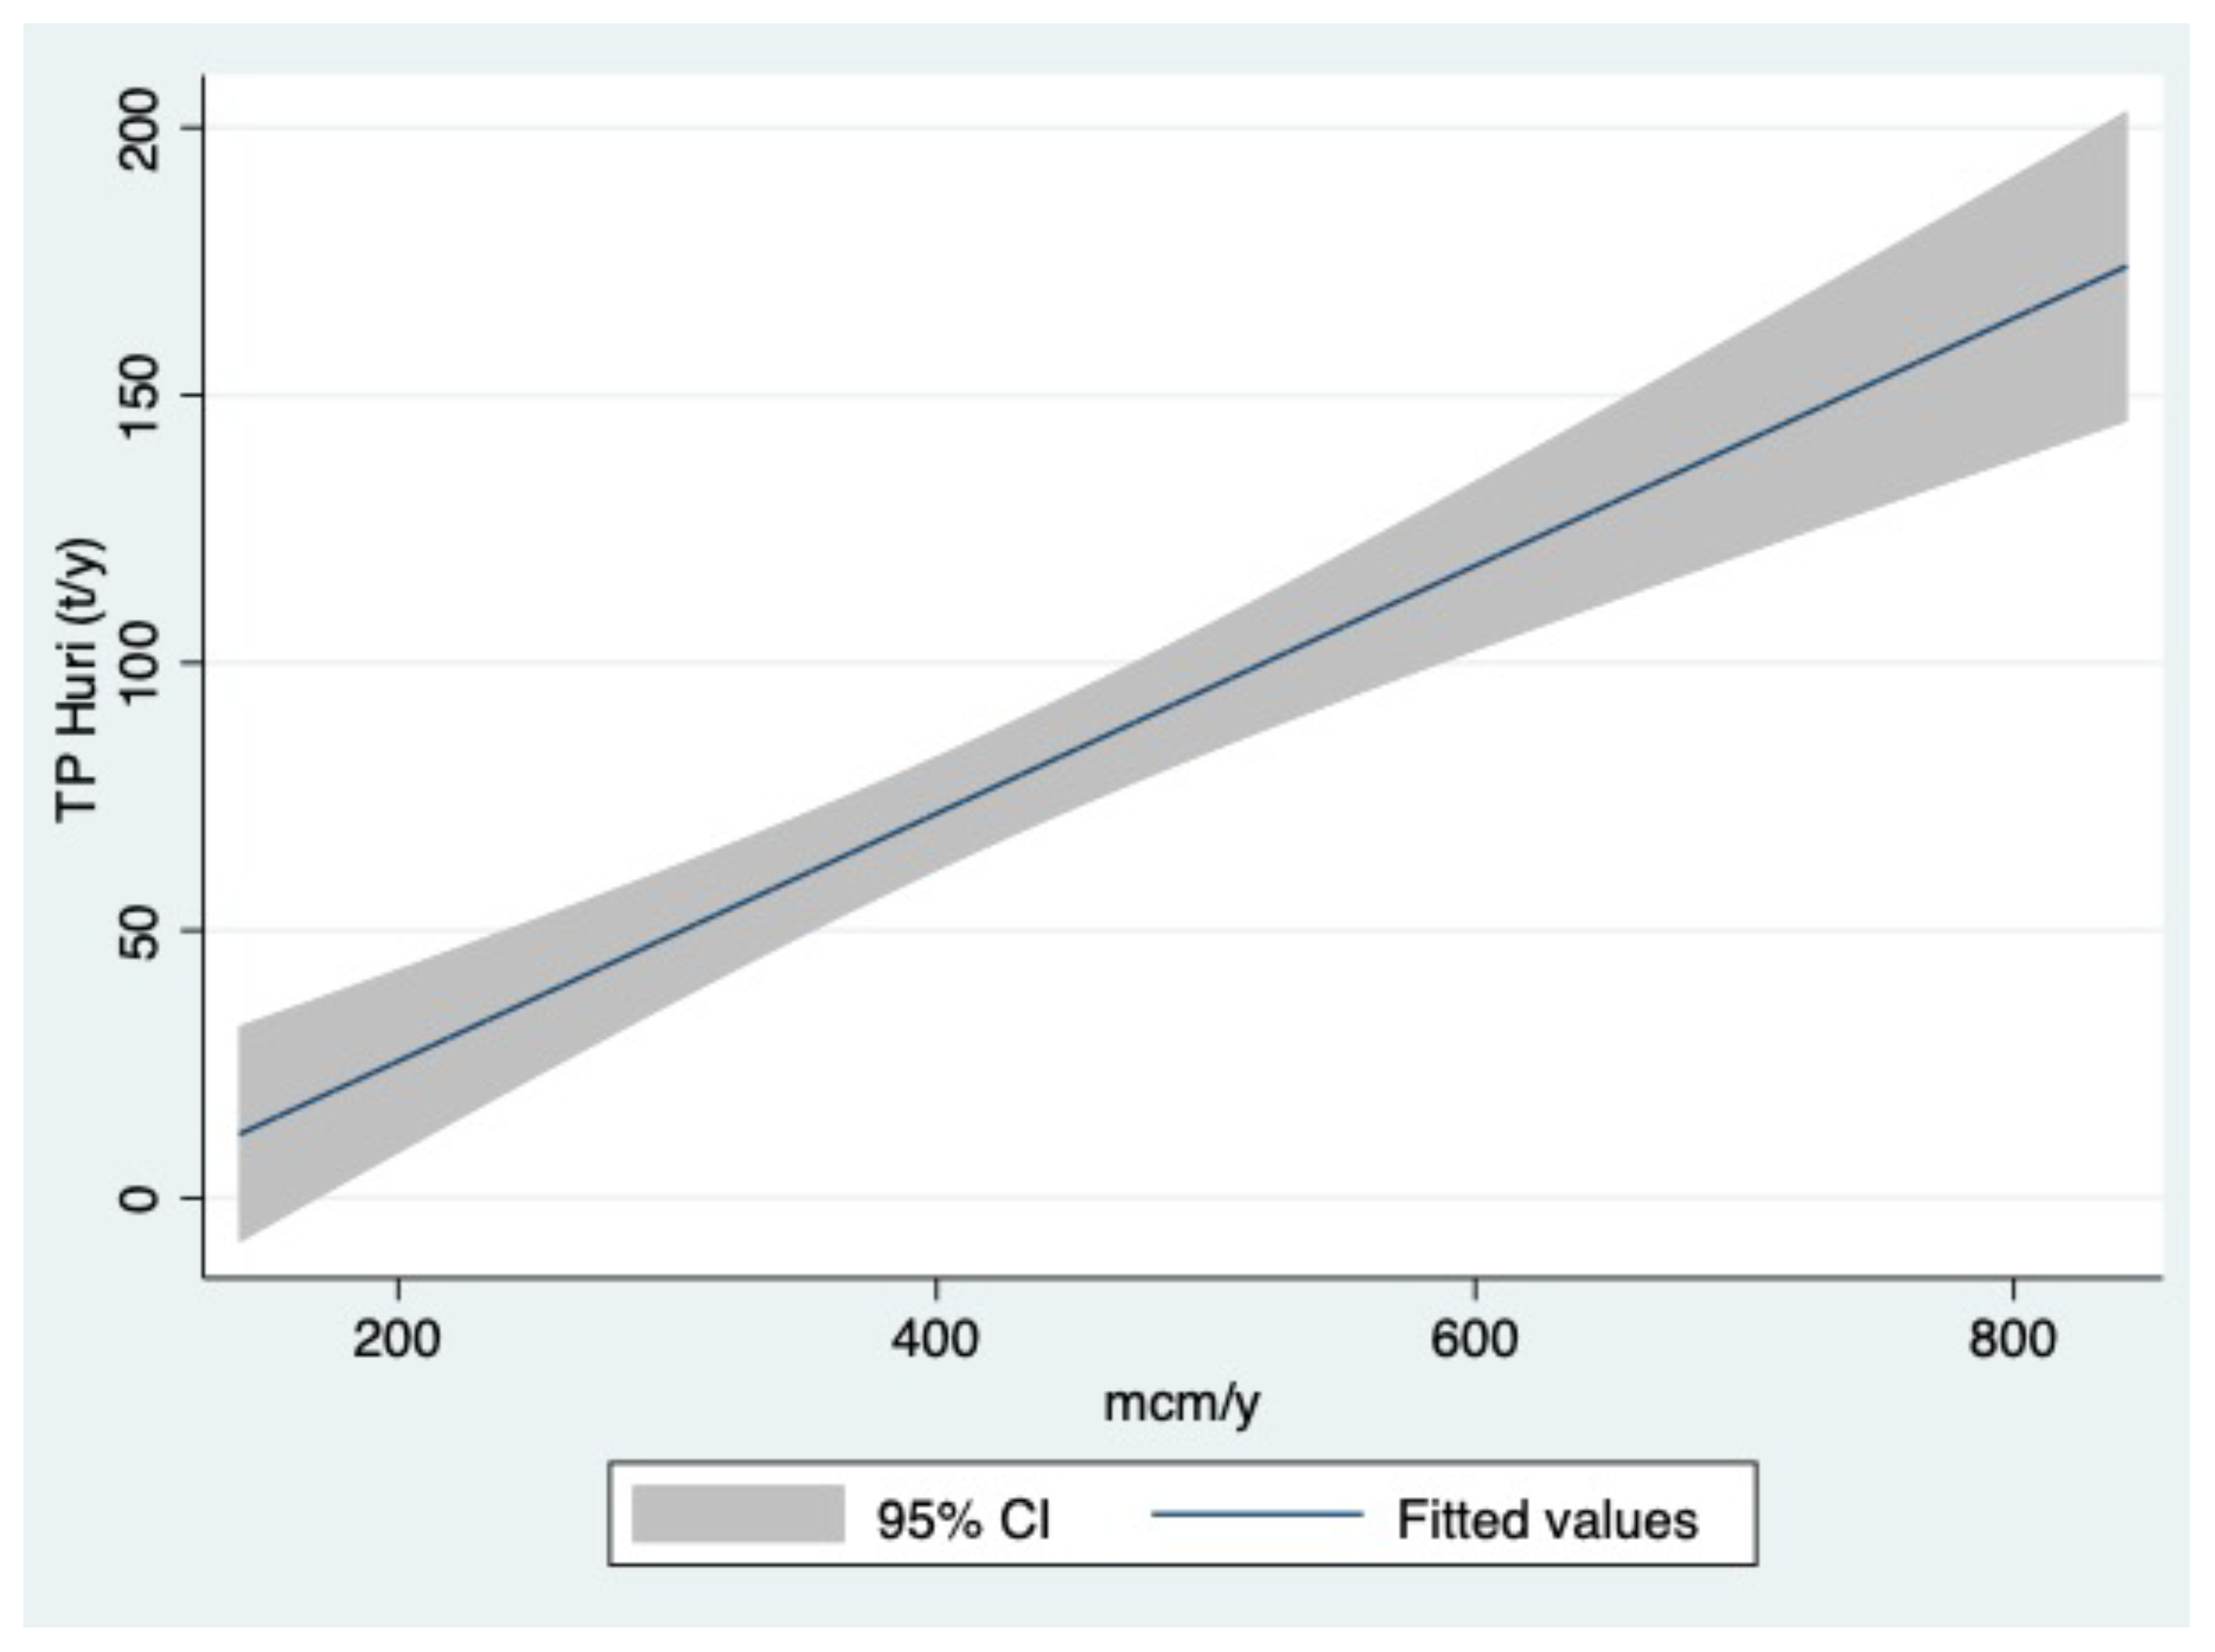
The results shown in Figure 17 indicate similar TP loading enhancement resulting from an increase in discharge and consequent erosive action.
Because the Agmon-Hula water level did not change annually, 949 103 m3 t of water, containing phosphorus, is suggested to have infiltrated through bottom sediments at a rate of approximately 1 litre per m2 per month. Those infiltrated waters contained TP, but their fate and precise allocation are mostly unknown and were probably not included within the Lake Kinneret input loads. The multi-annual mean (SD) TP concentration in the Agmon-Hula effluent was 117 (SD 80) ppb, and that in the Agmon-Hula outflow was 10 × 106 m3. Consequently, the total load was approximately 1–1.2 tons of TP. An annual output of TP from Agmon-Hula of 1–1.2 tons of TP was mediated by runoff water and a load similar to the bottom infiltration. Part of the runoff water-mediated TP was removed by the irrigation system, but the fate of bottom-infiltrated TP is not completely known. Part of the bottom-infiltrated TP has been tentatively suggested to have migrated as subterranean water [1]. Lake Agmon-Hula is located topographically at the lowest altitude of the valley, thus causing a hydraulic gradient from north to south. Monthly records (1988–2021) of GWT depths in 40 bore-holes and a full-year (2010–2011) chemical analysis of ground water samples indicated that the northern GWT altitude is higher than that of the southern part. The northern soil type is organic, whereas the southern soil type is mineral. The northern amplitude of seasonal depth fluctuations of GWT depth is smaller. Finally, the TP concentration in southern ground water is higher. Consequently, migration of ground water-mediated TP is suggested to circumvent the plastic barrier through the bottom or side. The underground accumulation of TP was confirmed to result from three factors: hydraulic gradient; enhanced erosive impacts due to the mineral soil type, which probably has a high amount of free space; and enhanced evapo-transpiration (ET) capacity, because of the enhanced erosive impacts. Nevertheless, vertical and horizontal quantitative underground migration of TP throughout the Hula Valley has not been precisely studied. The TP dynamics in the Jordan River and Lake Kinneret, after further evaluation, did not provide answers to these critical unknowns. The concentrations (ppb) of TP in the Agmon-Hula outlet for 3 years are shown later as seasonal averages.
The data shown in Table 2 indicate an abrupt elevation in TP content in Agmon-Hula in the summer and fall seasons, as a result of massive decomposition of submerged vegetation. Aquatic vegetation onset begins annually in the spring, incorporating phosphorus from bottom sediments. During the degradation of plant mass, phosphorus is released and transferred into the water in dissolved and particulate forms. A report has indicated [27] 64% of TP load input to Jordan waters during winter months (12 and 1–5) and 36% input in the summer. A combined computation of hydrological and chemical monthly data enabled the assessment of loads of TP inflow, outflow, and balance (TPin minus TPout); the results for 2003 and 2004 are shown later.
Data shown in Table 3 indicate the inter-annual dissimilarity of the TP balance, owing to the relationship between TP load and the water balance; the water balance is dependent on rainfall and agricultural allocation (irrigation) (Table 3).
Annual mass balances of TP loads in Lake Agmon-Hula for 4 years are shown in Table 4.
The data in Table 4 indicate much higher TP export from Lake Agmon-Hula during drought seasons and therefore irrigation intensification accompanied by TP flushing from the peat soil. Nevertheless, the annual TP output from Lake Agmon-Hula ranged between 0.5 and 1.5 tons per year.
A survey of the distribution and TP content of submerged vegetation in lake Agmon-Hula was performed for the period 1997–2004. The total dry weight and TP content are shown in Table 5.
3.3. TP Migration from the Hula Valley into Lake Kinneret
The links between various measurements and the TP load capacity in Lake Kinneret were evaluated through long-term (1970–2020) records (Table 6). The data included weekly measurements in five sampling stations at eleven discrete depths in the deepest station and four to six depths in the shallower stations, with a total number of 28 samples collected weekly. All samples were averaged for three periods (1969–1978, 1979–1989, and 1990–2001) and three representative years during the 2000s (2006, 2008, and 2020). The years 2008 and 2016 represent drought periods, and 2020 represents a heavy rainfall season. The results (ppb) are shown in Table 6.
Notes for Table 6:
- Values taken during 2008, 2016, and 2020 are annual averages, whereas the others are periodical means.
- The volume of the epilimnetic layer depth at 1–15 m was computed with respect to WL changes, whereas those for the hypolimnetic layer with respect to the bottom layer were limited to between 10–2 m above the sediment surface and were unaffected by WL fluctuations, of which the same volume of 453 mcm was incorporated.
- A mean reduction of 27% of TP load in the epilimnion of Lake Kinneret was observed during the 2000s.
- The increase in TP concentration in the hypolimnion during 2016 was probably due to WL decline and the smaller volume of the hypolimnion, which enhanced phosphorus release from the sediments.
The results shown in Table 6 indicate a reduction in the epilimnetic TP load resulting from a decline of migration into the lake, thus supporting the use of this parameter as an indicator of climate change.
Annual (2004–2020) reports [21] published by the Kinneret Limnological Laboratory clearly documented that the concentrations of all three forms of phosphorus measured in the samples collected at the same stations and depths were lower than the multi-annual mean. Nevertheless, several exceptions were recorded as well. During 2018 and 2019, the TP concentrations were higher and closer to the long-term average resulting from high rainfall and discharge; therefore, the input load of phosphorus into the lake was higher. Heavy rainfall, high river discharge, and WL elevation were documented during 2020, and resulted in TP, SRP, and TDP epilimnetic values similar to the multi-annual averages.
Documented information [28,29] on the discharge and TP loads in three major headwater rivers and Jordan River during 1967–1985 was compiled, and a summary is shown in Table 7 (Figure 17).
The results shown in Table 7 indicate an SD percentage range of 12–23%, whereas for the other headwaters and Jordan River, the range varied between 31% and 62%. The difference is probably because the River Dan was sampled at the upwelling site, and the other sampling (for chemistry and hydrology) sites were located beyond the long-distance runoff flow, where anthropogenic activities are performed.
4. Discussion
4.1. Erosion Process
The major known process of natural erosion is mechanical removal of solid matter comprised of a wide size range of particles, from disintegrated soil to pebbles. The second type of erosive process is carried out through dissolving effect. Mechanical and chemical erosion is an action effect caused by surface and underground waters as well. Rainfall and consequently surface runoff produce soil and bedrock erosion. Human activity may enhance or reduce the rate of erosion. Surface water flows might be enhanced with increased soil saturation or surplus rainfall. The karstic rock type of Mount Hermon, geologically belong to the Upper Jurassic, led to the formation of numerous dolines into which Jordan River headwaters flow and emerge from. The formation of sinkholes (dolines) and other features of karst topography is an example of extreme chemical erosion. Those conditions are very common in the northern part of the Kinneret watershed [30,31,32]. Moreover, most erosion occurs during flood events. Chemical erosion is the loss of matter in a landscape in the form of solutes. Physical parameters associated with fluid dynamics, such as the impacts of heat transfer and bedrock chemical structure, are relevant but beyond this paper’s scope. Partial land use, land cover, terrestrial vegetation cover, and soil moisture have been documented [26]. Nevertheless, the northern region of the headwater drainage basin was excluded, thus making the present study a partial completion, which cannot serve as a basis for a hydrological model. The geographical slope of the Kinneret drainage basin is very steep: from 2814 masl from the top of Hermon Mountain down to Lake Kinneret’s mean water surface level altitude of 211 mbsl (total 3025 m). The length of the watershed is 110 km. The distance from Hermon’s top to the northern shoreline of Lake Kinneret is 90 km, thus creating a natural 3025 m range of altitude and an average slope of 3.4%. Nevertheless, for the most northern part of the drainage basin, where the headwater river flows, the altitude range is approximately 2700 m, and the horizontal distance is approximately 35 km, thus creating a slope of approximately 8%. Moreover, the karstic erosion of the uplifted massif from the Jurassic and Lower Cretaceous limestone has created numerous dolines into which the headwater flows and emerges. The karstic landscape forms a vast, steep surface area of waterflow–bedrock interface, thus enhancing erosion.
Climate condition fluctuations in the Kinneret watershed region are frequent and are a relevant consideration. Nevertheless, this paper aimed at forecasting phosphorus loading in Lake Kinneret through river discharge carriers. Documentation of the long-term periodicity of climate conditions is widely available. The NOAA Climate Prediction Center has compiled vast information on the impacts of El Nino Southern Oscillation (ENSO) events on global environmental abnormal climate conditions [33]. The historical records of rainfall since the end of the 19th century indicate eight periods of exceptional dryness in which the most extreme ranges were 14, 6, and 5 years in duration: 1923–1936, 1958–1963, 1975–1979, and 2013–2018 [34]. Unusual climate events in the Kinneret region (low temperature and WL elevation) during 1971–2003 were found to be closely associated with strong ENSO events, as documented by the NOAA [33]. ENSO might be partly responsible for the periodic performance of the extreme fluctuations in climatic conditions. The appearance of drought periodicity (1930–2016) was analysed with the standard precipitation index method [35,36,37], which classifies three levels of drought severity. The highest, termed ‘severe drought’, occurred 13 and 17 times during 1930–1970 and 1970–2016, respectively [35]. Consequently, the dryness trend was recently amplified. Although this dryness trend recently resulted in 5 years of drought, heavy rainy seasons followed (2013–2018). Nevertheless, because the major contribution of TP is outsourcing, the hydrological aspects of those climate conditions together with nutrient supply are crucial for water quality protection in Lake Kinneret.
4.2. The Impact of Hula Valley
Previous studies on the environmental impact of change in climate conditions in the Kinneret watershed region during the Anthropocene have documented [26] the rainfall decline, river discharge reduction, temperature elevation, and decline of the GWT in the Hula Valley. Campbell and Capece [38] have reported that the P transport mechanism is based primarily on surface topography, and the distribution of P between the surface and groundwater is associated with hydrologic and topographic factors rather than land use intensity. The altitude of the northern GWT in the Hula Valley is higher than that of the southern section, thus resulting in a hydrologic gradient from north to south. A wide variety of water-mediated phosphorus resources in the Kinneret watershed are known [1,2,3,4,5,6,10,11,12,13,14]. A major source of TP might be agricultural loading (fertilization). Fertilization regimes in the Hula Valley are estimated to supply 150–200 tons of P for 20,000 dunam (5–10 gP/m2) [3,10]. Studies performed in the Everglades have indicated a low phosphorous output concentration when the total P mass loading is less than 1 g/m2, thus suggesting that the ‘one-gram assimilative capacity rule’ may be a fairly good approximation for freshwater wetlands [39]. The annual (1970–2018) average total TP load in the Jordan River is 72 tons (Table 4). Consequently, subtraction of the annual Kinneret input (72 t) from fertilizers’ supplemental loaded mass (150–200 ton) indicates a residual portion of 78–128 t channeled to harvested plant matter, absorbed by soil particles, and migrating into subterranean water pathways that drain into unknown preferential space channels. Much of the organic P in organic compounds is associated with soil particles, and P transformations are controlled by a combination of P concentrations in solutions and biological activities, most importantly microbial alterations of redox reactions and bonding to soil particles [2,4,5,10,30]. Information on the continuous high loading from commercial fertilizers may contribute significant quantities of soluble P to surface and subsurface drainage (Campbell and Capece 1999) [10]. Phosphorus fertilization regimes in the Hula Valley have been investigated and criticized by Barnea [10]. The impact of P fertilization rates (4.3–8.6 gP/m2) on P dynamics in organic and mineral soil types has been studied [2]. The low hydraulic conductivity (1 mm/day) and high P adsorption (900–1400 mgP/kg) on the organic peat soil that dominates the northern part of the valley significantly reduce the underground drainage of P and probably further leakage into the environment. However, the hydraulic conductivity of the marl soil in the southern part of the valley is 1.7 × 105 mm/d, and P migration is higher and occurs primarily as particulate P [10]. Therefore, higher P contamination of the environment through underground water mediation is predicted. A flux estimation of 1.0 kgP/ha through free space macropores into the shallow underground water bulk has been suggested [1].
After the implementation of the HRP, the drainage system of the valley comprised runoff canals, partly through Lake Agmon-Hula and partly through others (312 and 404 canals) (Figure 1), and subterranean spaces. Lake Agmon-Hula serves as a hydrological junction in the Hula Valley. Therefore, insights into geochemical and biological processes in Agmon are important for the study of TP dynamics. Shortly after water filling in Lake Agmon-Hula, a dense vegetation comprising P-limited cattail plants (Typha domingensis) grew in the southern part of the lake and collapsed 18 months later—an event significantly correlated with the peat soil phosphorus availability [12,40]. The strong correlation between the spatial distribution of cattails and soil P concentration has been documented by Miano and DreBusk [41]. Moreover, another study [35] has shown that over the course of digging in the Agmon-Hula wetland during HRP construction, organic peat soil was exposed, and P oxidation and availability were enhanced, thus enabling the growth of cattail vegetation [42]. Water coverage of the Lake Agmon-Hula bottom eliminated soil oxidation, and P deficiency resulted in the cattail collapse. Enhancement of peat soil moisture might also decrease the release of P from soil particles [7,8,9]. The Hula Valley and Lake Kinneret are linkage ecosystems, and the flux of pollutants, such as phosphorus, from the Hula Valley downstream into Lake Kinneret must be controlled. The ‘Best Management Practices’ program recommended by Lzuno and Whalen [42,43,44] includes categories of fertilizer management, water management, and particulate transport reduction.
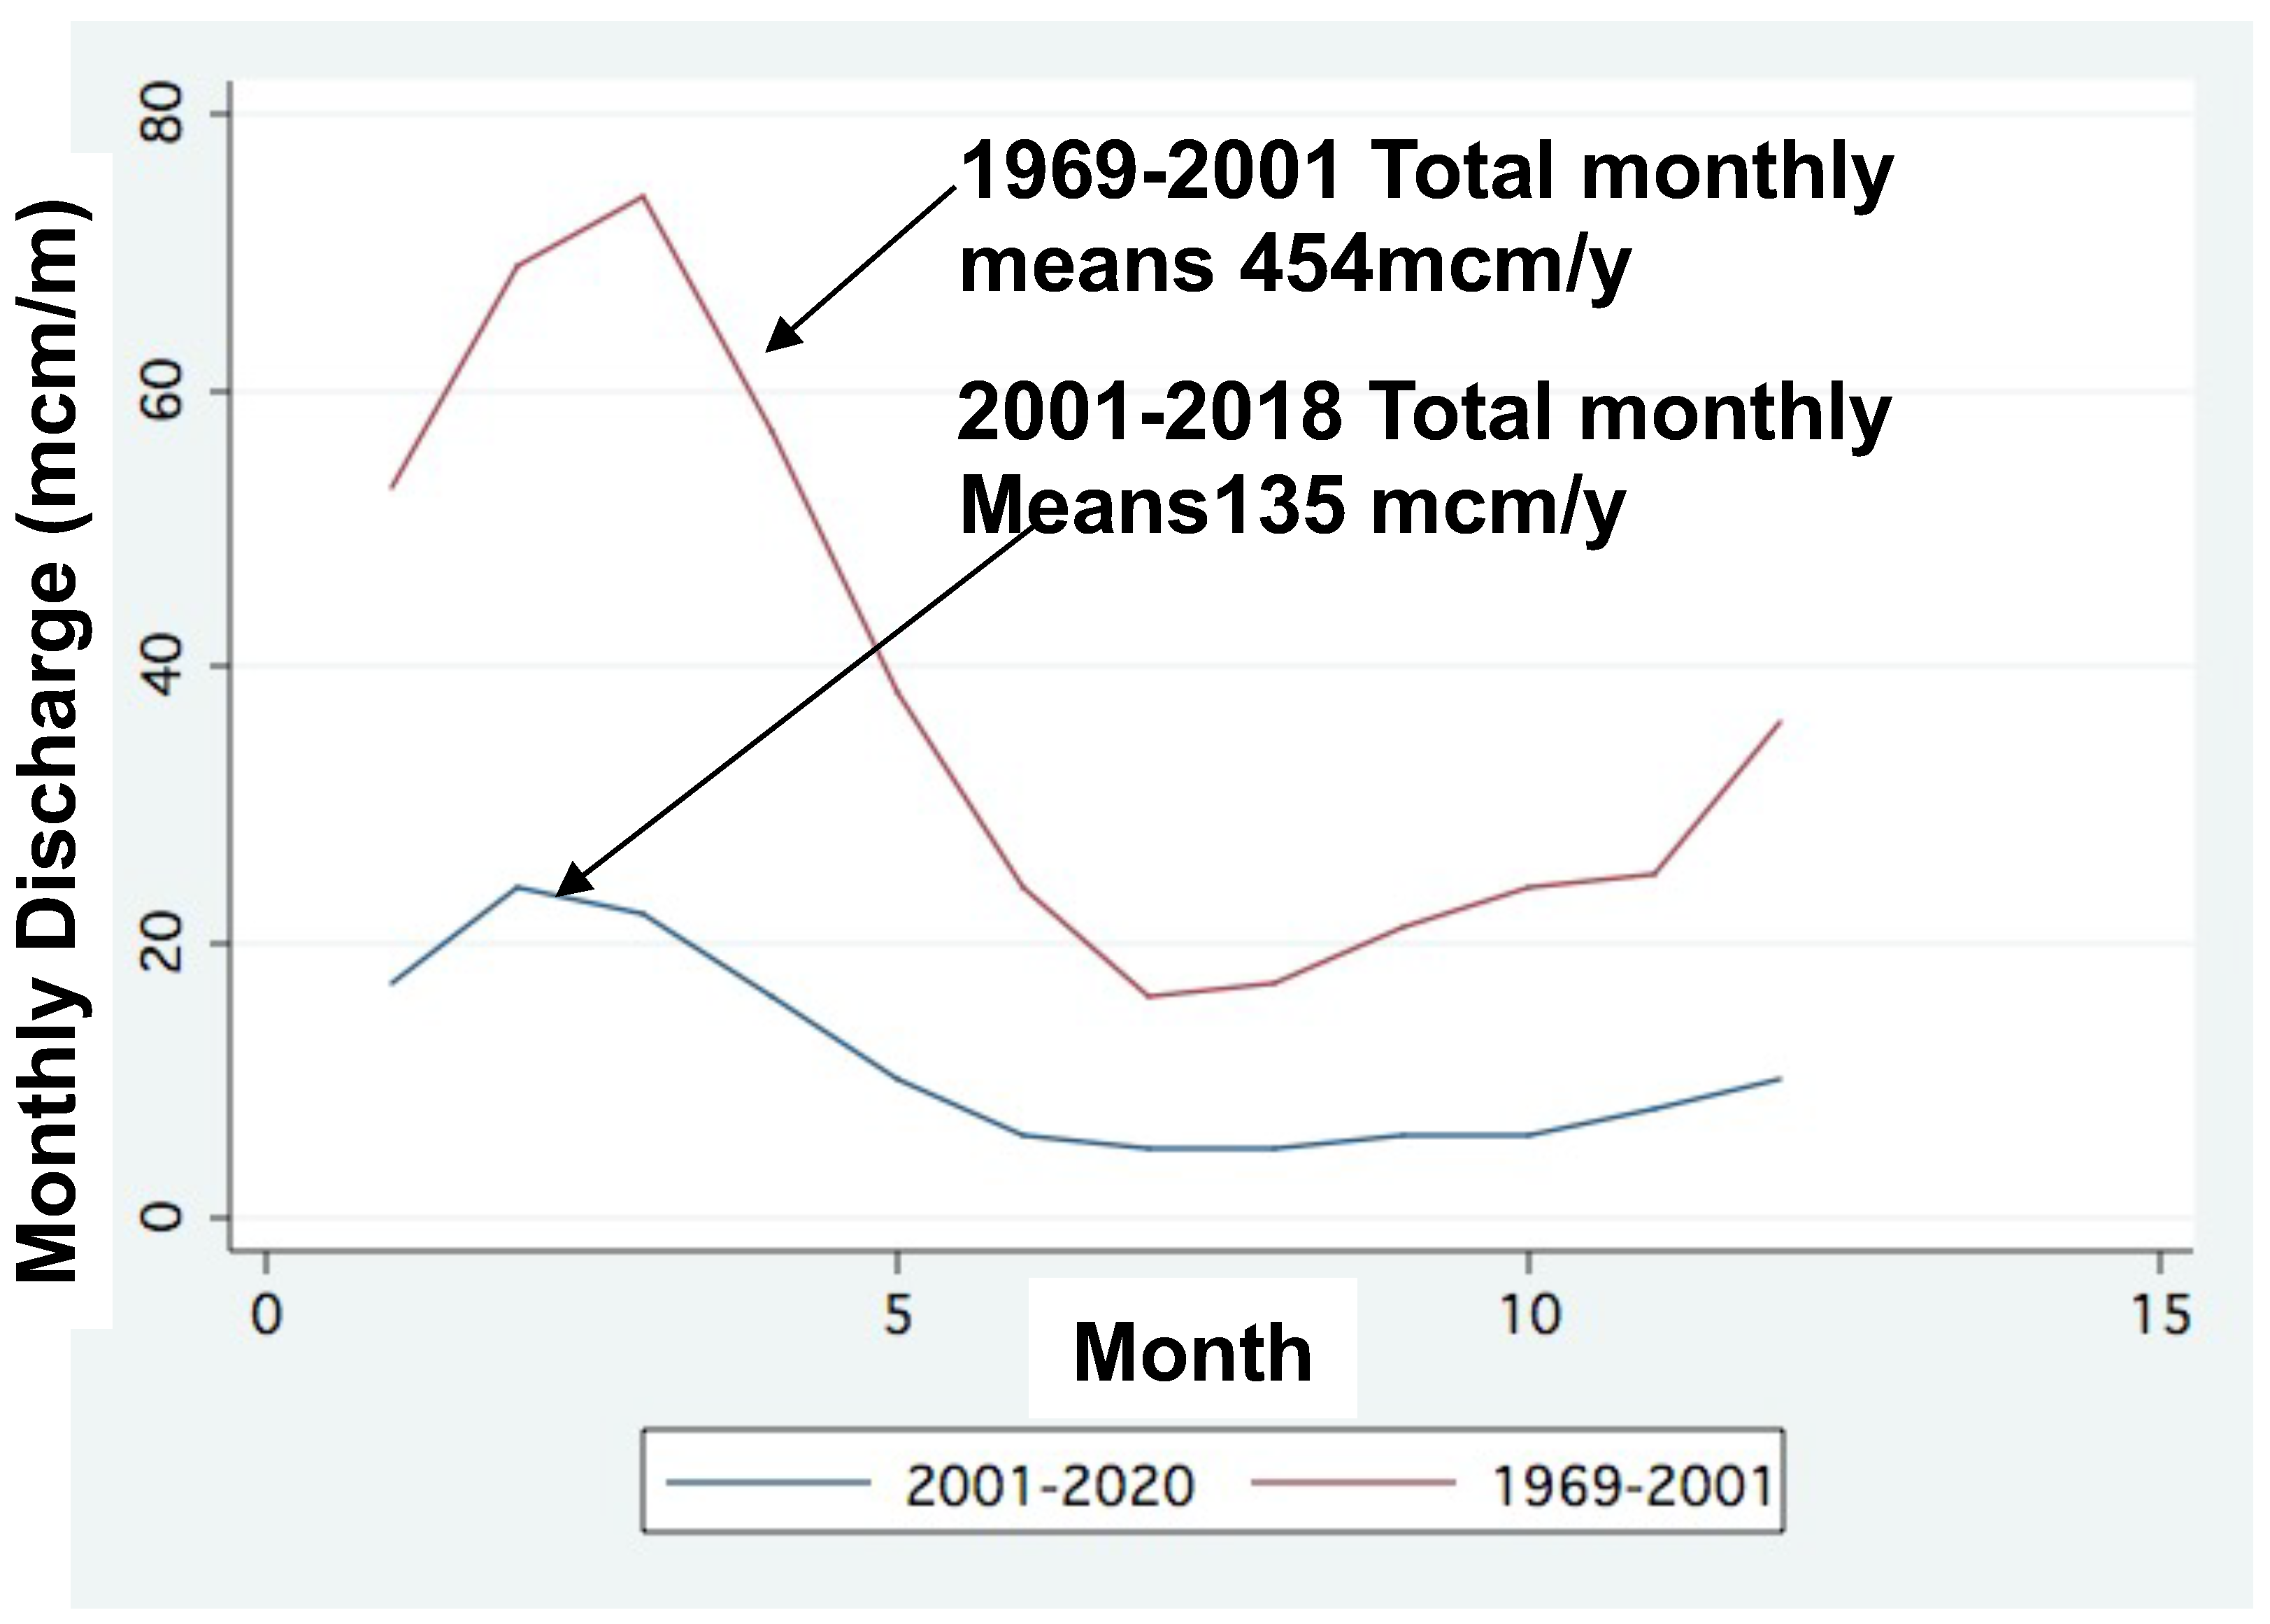
The Hula Valley’s potential as a TP source is clear, but does it pose a significant threat to Lake Kinneret water quality? The results shown in Figure 11 indicate an inverse relationship between the seasonal pattern of TP fluctuations in the Agmon-Hula and Jordan waters. This difference is probably due to the dissimilarity between the driving factors controlling TP supply to the Agmon-Hula and Jordan watersn [45]. In Agmon-Hula, enhancement of TP is mostly due to the intensive growth of aquatic plants in spring–summer and their decomposition, whereas the rate of discharge controls TP concentration dynamics in Jordan waters. In the winter, the TP concentration in Agmon-Hula declines but increases in the summer, whereas TP increases in Jordan waters during the winter, when rain and discharge are maximal. Are the TP concentration dynamics in Agmon-Hula and Jordan River dependent on or independent of each other? This paper suggests that they are independent. Deeper evaluation is likely to reveal that loaded phosphorus in the Hula Valley is transported into plant matter (harvested crops) and absorbed by soil particles, and the excess migrates into unverified free space. The data shown in Figure 10 indicate the consequences of the dissimilarities in TP concentrations in Jordan and Agmon-Hula waters with respect to seasonal dynamics. Low TP concentrations in Jordan River waters (Figure 5) are correlated with a decline in Jordan River discharge. Low levels of discharge are typical of summer periods. In contrast, the TP concentration in the Agmon-Hula waters increases during summer months (Figure 14 and Figure 15). These contrary developments support the conclusion of independence between Agmon-Hula and the Jordan River. Moreover, the linear regression between rainfall regime (clearly in winter) and Jordan River discharge (Figure 6) was found to be significant (r2 = 0.3268, p = 0.0044). Figure 13 indicates a temporal elevation in TP concentration in Lake Agmon-Hula between 1994 and 2020. A temporal long-term decline of nutrient concentrations in the Jordan River waters was documented. An increased crane population (Figure 16) indicated that the presence of cranes in the Hula Valley had no impact on nutrient concentrations in the Jordan waters.
The information documented during 1967–1985 (Table 7) indicated an average annual supply of 119 tons TP (Huri), of which 43 tons measured north of the Hula Valley were contributed by the three major headwaters. Consequently, runoff flows through the Hula Valley supplemented only 76 tons of TP. The information herein confirms lower TP capacity within the Hula Valley runoff of Lake Agmon effluent, and canals 312 and 404, than the loads recorded in the headwaters north of the Hula Valley. The underground migration of water-mediated TP is also likely not to be directed towards Lake Kinneret. Therefore, we conclude that the source of the additional TP measured in Jordan River (at Huri) is bedrock erosion. The role of TP drift due to erosive action is relevant to both headwaters and the Jordan River. This outcome was confirmed by the data in Figure 17: similar impacts of intensified erosive action were found between the Jordan River inside the Hula Valley and the Hazbani and Snir Rivers north of the valley. An optional source of TP might also be horizontal subterranean migration through preferential free space from the peat soil directly into drainage canals with hydrological contact with the Jordan River. This type of TP migration was not investigated and therefore is not yet confirmed.
4.3. Periodicity or Climate Change
In contrast to previous documentation [13], this paper indicated that a major contribution of TP to Lake Kinneret is due to sources located north of and further from the Hula Valley: headwaters transporting water-mediated erosive TP from the discharge bedrocks and ‘African sources’ of dust deposition. Additional sources of bio-available phosphorus supplementation were bottom sediments under anoxic-hypolimnetic waters released as a result of geochemical conditions and bacterial activity. Sources of phosphorous supply to Lake Kinneret within the drainage basin that were discussed in this paper include the erosion of soil and bedrock by headwater discharge, components of organic peat and marl soil in the Hula Valley, decreases in the number of winter migratory cranes, and external P fertilizer loading. Two other sources are dust deposition and Kinneret l bottom (chemo–microbiologically released). Most of the deposited dust originated from intercontinental resources (‘African deserts’), and a minor part was from the dry peat soil in the Hula Valley, transported by seasonal eastern gusts in wind storms [13,14,30,31,32]. External fertilizer loading was partly incorporated into harvested crops and adsorbed on soil particles. The fate and dynamics of the P supply, which is likely to migrate mostly in particulate form, is unknown, but was probably not fully included in the Jordan River discharge. The present input regime of phosphorus into Lake Kinneret is not suggested to be risky, but the eco-hydrological structure of the ecosystem has reasonable potential to lead to eutrophication in both Lake Kinneret and Lake Agmon-Hula. A total of 77% and 68% of total TP load in Jordan River and its headwaters, respectively, fluxed during winter months (October–April). The impacts of agricultural activities and cranes are minor, although the difference between winter and summer TP loads in the Hula Valley’s effluent was pronounced (higher in summer). Conclusively, the dominant factor that controls water-mediated TP concentration and consequently the load of the Kinneret inputs is erosive processes due to friction between water flows and soil or bedrock infrastructure. The higher the discharge, the higher the TP concentration. The fate of the surplus P is unknown. Most of the Lake Kinneret TP outsourcing supply originates from bedrock erosion in the watershed and dust deposition, partly from Hula Valley and the rest from African deserts. The anthropogenic (HRP) and natural (cranes) contributions are minor (Figure 16). Most of the TP exiting from the Hula Valley does not enter Lake Kinneret, and the fate of most of the TP is unclear.
A compilation of long-term (1967–1985; 2012) [27,46] data indicated the following. The total Golan Heights river discharge (TP average concentration—197 ppb) that flowed directly to the upper Jordan (north of Lake Kinneret) was 50 mcm/y, contributing a TP load of 10 tons; 150 mcm/y of water from the Golan Heights fluxed directly (not via the Jordan River) into Lake Kinneret.
The TP concentration along the Jordan River route increased as follows:
Entrance into the Hula Valley: 272 ppb;
Exit from the Hula Valley: 340 ppb;
Entrance into Lake Kinneret: 394 ppb.
On the basis of the discharge before the change in climate conditions (1967–1985), the annual supplementation is 65 tons of TP. Taking into account the low TP contributions of Hula Valley runoff and the suggested TP content in subterranean waters probably excluded from the Lake Kinneret inputs, we conclude that a major portion is due to the Jordan River’s erosive action.
A comparative evaluation of the TP concentrations documented during 1967–1985 [27] and 2013 [46] confirmed an increase by 113 ppb (13 t TP) in the Banias River and 125 ppb (16 t TP) in the Hazbany River. The total supplemental TP load input into the Jordan River was 39 t. Consequently, the impact of climate conditions (precipitation and river discharge) on TP outsourcing through erosion eco-forces is significant: higher and lower discharge enhances and reduces TP load, respectively. The total TP flushing ranges from the Hula Valley soil through the subterranean medium; its accumulation site is not precisely indicated but, as confirmed here, is not Lake Kinneret. Most runoff water-mediated TP originating from bedrock through erosive action.
5. Conclusions
The HRP was aimed at ensuring the sustainability of modified ecosystems through agricultural development, Kinneret water quality protection, and nature conservation. The tension among farmers, water managers, and nature preservers was reduced, thus leading to their collaboration. The outcome of the HRP was ecosystem renewal, leading to the development of a tourist attraction and enriched biological diversity, with approximately 300 species of birds, including 40,000–56,000 wintering cranes annually, 40 species of water plants, and 12 species of fish. The new ecosystem of the shallow Lake Agmon-Hula with the surrounding safari habitat ecosystem became a tourism attraction. Potential resource contributors to water-mediated phosphorus include the following: Kinneret headwaters (Table 5); Lake Agmon-Hula through decreased numbers of cranes, aquatic vegetation; and the major peat soil-drained water pathways (Table 1) in the Hula Valley. The Kinneret watershed region has undergone changes in climate conditions, prominently dryness. These changes enhanced processes of decline in rainfall–river discharge, and were accompanied by changes in nutrient dynamics and decreases in input concentrations. These modifications in nutrient dynamics were not likely to have been affected by the presence of cranes in the Hula Valley, although the seasonal changes in TP concentration in the Agmon-Hula effluent were due to the onset and offset of submerged macrophytes [47,48] (Figure 14 and Figure 15). The fate of the entire phosphorus compartment in the Hula Valley ecosystem is unclear. Phosphorus input into lakes Agmon-Hula and Kinneret is affected primarily by climate change (Kinneret) and submerged macrophytes and, to a lesser extent (if at all), by cranes (Agmon-Hula).
Funding
This research received no external funding.
Institutional Review Board Statement
Institutional Board Review is confirmed.
Informed Consent Statement
Consent Statement is confirmed.
Data Availability Statement
Data is available.
Conflicts of Interest
The authors declare no conflict of interest.
References
- Gophen, M.; Meron, M.; Orlov-Levin, V.; Tsipris, Y. Seasonal and spatial distribution of N & P substances in the Hula Valley (Israel) subterranean. Open J. Mod. Hydrol. 2014, 4, 121–131. [Google Scholar] [CrossRef] [Green Version]
- Haygarth, P.M.; Delgado, A.; Chardon, W.J.; Litaor, M.I.; Gil-Sotres, F.; Torrent, J. Phosphorus in soils and its transfer to water: From fine-scale soil processes to models and solutions in landscapes and catchments. Soil Use Manag. 2013, 29, 1–4. [Google Scholar] [CrossRef]
- Litaor, M.I.; Chashmonai, I.; Barnea, I.; Reichmann, O.; Shenker, M. Assessment of phosphorus fertilizer practices in altered wetland soils using uncertainty analysis. Soil Use Manag. 2013, 29, 55–63. [Google Scholar] [CrossRef]
- Litaor, M.I.; Reichmann, O.; Dente, E.; Naftaly, A.; Shenker, M. The impact of ornithogenic inputs on phosphorous transport from altered wetland soils to waterways in East Mediterranean ecosystem. Sci. Total Environ. 2014, 473, 36–42. [Google Scholar] [CrossRef] [PubMed]
- Reichmann, O.; Chen, Y.; Litaor, M.I. Spatial Model Assessment of P Transport from Soils to Waterways in an Eastern Mediterranean Watershed. Water 2013, 5, 262–279. [Google Scholar] [CrossRef] [Green Version]
- Reichman, O.; Chen, Y.; Litaor, M.I. The Impact of Rainfall-Runoff Events on the Water Quality of the Upper Catchment 729 of the Jordan River, Israel. In Integrated Water Resources Management: Concept, Research and Implementation; Springer: New York, NY, USA, 2016; pp. 129–146. [Google Scholar]
- Yatom, S.; Rabinovich, O. Fractionation of organic soils in the Hula Valley: Partition Indices and Organic Fractionation: Conclusive Report. In 1998 Hula Project Annual Report; Gophen, M., Ed.; Migal & JNF: Kiryat Shmone, Israel, 1999; pp. 86–99. (In Hebrew) [Google Scholar]
- Yatom, S.M.; Meron, M.; Rabinovich, O.; Yasur, E.; Banin, A. Manganese Deficiency and Reduction of Organic Soil Productivity in the Hula Valley. In 1995 Hula Project Annual Report; Gophen, M., Ed.; Migal & JNF: Kiryat Shmone, Israel, 1996; pp. 8–21. (In Hebrew) [Google Scholar]
- Xiang, H.F.; Banin, A. Solid-Phase Manganese Fractionation Changes in Saturated Arid Zone Soils: Pathways and Kinetics. Soil Sci. Soc. Am. J. 1996, 60, 1072–1080. [Google Scholar] [CrossRef]
- Barnea, I. Reexamination of Phosphorus Fertilization Practices in the Altered Wetland Soil of Hula Valley, Israel. Master’s Thesis, The Hebrew University, Jerusalem, Israel, 2009. [Google Scholar]
- Gophen, M. The Hula Project: N and P dynamics in Lake Agmon and pollutants removal from the Kinneret inputs. Water Sci. Technol. 2000, 42, 117–122. [Google Scholar] [CrossRef]
- Simhayov, R.; Litaor, M.I.; Barnea, I.; Shenker, M. Catastrophic dieback of Cyperus papyrus in response to geochemical changes in an East Mediterranean altered wetland. Wetlands 2013, 33, 747–758. [Google Scholar] [CrossRef]
- Nishri, A. Long-Term Impacts of Draining a Watershed Wetland on a Downstream Lake, Lake Kinneret, Israel. Air Soil Water Res. 2011, 4, ASWR.S6879. [Google Scholar] [CrossRef] [Green Version]
- Foner, H.A.; Ganor, E.; Gravenhorst, G. The Chemical composition and sources of the bulk deposition on Lake Kinneret (The Sea of Galilee), Israel. J. Arid Environ. 2009, 73, 40–47. [Google Scholar] [CrossRef]
- Gophen, M. Partnerships between the Managements of Cranes (Grus grus) and Kinneret Water Quality Protection in the Hula Valley, Israel. Open J. Mod. Hydrol. 2017, 7, 200–208. [Google Scholar] [CrossRef] [Green Version]
- Reddy, R.; O’Connor, G.A.; Schelske, C.L. Phosphorus Biogeochemistry in Tropical Ecosystems; Reddy, R., O’Connor, G.A., Schelske, C.L., Eds.; Lewis Publishers: Boca Raton, FL, USA; London, UK; New York, NY, USA, 1999; p. 707. [Google Scholar]
- Gvirtzman, H. Israel Water Resources: Hydrology Band Environmental Sciences; Yad Ben-Zvi Press: Jerusalem, Israel, 2002; p. 287. [Google Scholar]
- Karmon, Y. The Northern Huleh Valley: Its Natural and Cultural Landscape; The Magnes Press: Jerusalem, Israel, 1956; p. 108. (In Hebrew) [Google Scholar]
- Gophen, M.; Tsipris, Y.; Meron, M.; Bar-Ilan, I. The management of Lake Agmon Wetlands (Hula Valley, Israel). Hydrobiologia 2003, 506, 803–809. [Google Scholar] [CrossRef]
- Gophen, M.; Meron, M.; Tsipris, Y.; Orlov-Levine, V.; Peres, M. Chemical, Hydrological and Climatological Properties of Lake Agmon, Hula Valley (Israel), (1994–2006). Open J. Mod. Hydrol. 2016, 6, 8–18. [Google Scholar] [CrossRef] [Green Version]
- Kinneret Limnological Laboratory; IOLR (Eds.) Annual Reports 1970-2000: LKDB-IOLR; Haifa-Migdal Water Authority Kinneret Authority: Haifa, Israel, 2020. [Google Scholar]
- Gophen, M.; Levanon, D. (Eds.) 1993–2006 Hula Project, Annual Reports; Migal-Sientific Research Institute, Jewish National Fund (Keren Kayemet LeIsrael), US Forestry Service International Project, Israeli Water Authority: Jerusalem, Israel, 2006. [Google Scholar]
- Gonen, E. (Ed.) Annual Report 2007: Hula Project; Jewish National Fund (Keren Kayemet LeIsrael) Migal-Scientific Research Institute and Israeli Water Authority, Migal & JNF: Jerusalem, Israel, 2007; p. 133. [Google Scholar]
- Barnea, I. (Ed.) Annual Report 2008: Hula Project; Jewish National Fund (Keren Kayemet LeIsrael) Migal-Scientific Research Institute and Israeli Water Authority: Jerusalem, Israel, 2008; p. 159. [Google Scholar]
- Barnea, I. (Ed.) Annual Report 2008–2018: Hula Project; Jewish National Fund (Keren Kayemet LeIsrael) Migal-Scientific Research Institute and Israeli Water Authority: Jerusalem, Israel, 2018; p. 232. [Google Scholar]
- Gophen, M. Climate Change-Enhanced Cyanobacteria Domination in Lake Kinneret: A Retrospective Overview. Water 2021, 13, 163. [Google Scholar] [CrossRef]
- Geyfman, Y. Multi-Dimensional Analysis of the Dynamics of Jordan Loads to Lake Kinneret during 1970–1999 Unsupervised Neural Networks; Mekorot Water Supply Co. Publisher Nazareth Jordan Districs: Tel Aviv, Israel, 2000; p. 16. (In Hebrew) [Google Scholar]
- Gobi, Z.O.; Shacham, G.; Tsaban, H.; Avnimelech, Y.; Ofer, A. Interim Report: Hula Project 2nd Stage, Development Program. Opinion about Agricultural, Water Consumption, Environmental and Touristic Changes in the Hula Valley; Interim Report; JNF and Kinneret Authority: Jerusalem, Israel, 2011; p. 31. (In Hebrew) [Google Scholar]
- Geyfman, Y.; Shaw, D.H.; Sarusi, F. The Kinneret Watershed: Jordan and Headwaters Loads Investigation; Mekorot Water Co. Ltd.: Nazereth, Israel, 1987; p. 150. [Google Scholar]
- Nishri, A. Atmospheric Sources of Phosphorus: Dry Deposition (Dust). In Lake Kinneret Ecology and Management; Sukenik, A., Berman, T., Nishri, A., Eds.; Springer: New York, NY, USA, 2014; pp. 341–346. [Google Scholar]
- Serruya, C. Geography; The General Frame. In Lake Kinneret, Monographiae Biologicae; Serruya, C., Ed.; Dr. W. Junk bv Publishers: London, UK, 1978; Volume 32, pp. 7–16. [Google Scholar]
- Michelson, H. Stratigraphy of the lake area. In Lake Kinneret, Monographiae Biologicae; Serruya, C., Ed.; Dr. W. Junk bv Publishers: London, UK, 1978; Volume 32, pp. 17–22. [Google Scholar]
- Gophen, M. The Impact of EL-NINO/Southern Oscillation (ENS) on Fishery and Water Quality in Lake Kinneret (Israel). Open J. Mod. Hydrol. 2016, 6, 43–50. [Google Scholar] [CrossRef] [Green Version]
- Smith, S.V.; Serruya, C.; Geifman, Y.; Berman, T. Annual mass balance of water, P, N, pCa, and Cl in Lake KinneretIsrael. Oceanogr. Limnol. 1990, 34, 1202–1213. [Google Scholar] [CrossRef]
- Givati, A. The Impact of Climate Change, on Water Resources in the Nort. Water Authority, PDF Presentation; Scientific Research Publishing (SCIRP): Wuhan, China, 2016. (In Hebrew) [Google Scholar]
- Givati, A.; Rozenfeld, D. The arctic oscillation climate change and the effect on precipitation in Israel. Atmos. Res. 2013, 132, 114–124. [Google Scholar] [CrossRef]
- Givati, A.; Guillaume, T.; Rozenfeld, D.; Paz, D. Climate change impacts on streamflow at the upper Jordan River based on an assemble of regional climate models, J. Hydrol. Reg. Stud. 2019, 21, 92–109. [Google Scholar] [CrossRef]
- Campbell, K.L.; Capece, J.C. Hydrologic Processes Influencing Phosphorus Transport. In Phosphorus Biogeochemistry in Subtropical Ecosystems; Reddy, R.K., O’Connor, G.A., Schelske, C.L., Eds.; Lewis Publishers: Boca Raton, FL, USA; London, UK; New York, NY, USA, 1999; pp. 343–354. [Google Scholar]
- Richardson, C.J. The role of wetlands in storage, and cycling of Phosphorus on the landscape: A 25-Year retrospective. In Phosphorus Biogeochemistry in Subtropical Ecosystems; Reddy, R.K., O’Connor, G.A., Schelske, C.L., Eds.; Lewis Publishers: Boca Raton, FL, USA; London, UK; New York, NY, USA, 1999; pp. 47–68. [Google Scholar]
- Gophen, M. Nutrient and plant dynamics in Lake Agmon Wetlands (Hula Valley, Israel): A review with emphasis on Typha domingensis (1994–1999). Hydrobiologia 2000, 441, 25–36. [Google Scholar] [CrossRef]
- Miao, S.L.; DeBusk, W.F. Effects of Phosphorus Enrichment on Structure and Function of Sawgrass and Cattail Communities in the Everglades. In Phosphorus Biogeochemistry in Subtropical Ecosystems; Reddy, R.K., O’Connor, G.A., Schelske, C.L., Eds.; Lewis Publishers: Boca Raton, FL, USA; London, UK; New York, NY, USA, 1999; pp. 275–299. [Google Scholar]
- Wetzel, R.G. Organic Phosphorus Mineralization in Soil and Sediments. In Phosphorus Biogeochemistry in Subtropical Ecosystems; Reddy, R.K., O’Connor, G.A., Schelske, C.L., Eds.; Lewis Publishers: Boca Raton, FL, USA; London, UK; New York, NY, USA, 1999; pp. 225–245. [Google Scholar]
- Lzuno, F.T.; Whalen, P.J. Phosphorus Management in Organic (Histosols) Soils. In Phosphorus Biogeochemistry in Subtropical Ecosystems; Reddy, R.K., O’Connor, G.A., Schelske, C.L., Eds.; Lewis Publishers: Boca Raton, FL, USA; London, UK; New York, NY, USA, 1999; pp. 425–445. [Google Scholar]
- DeBusk, T.A.; Dierberg, F.E. Techniques for Optimizing Phosphorus Removal in Treatment Wetlands. In Phosphorus Biogeochemistry in Subtropical Ecosystems; Reddy, R.K., O’Connor, G.A., Schelske, C.L., Eds.; Lewis Publishers: Boca Raton, FL, USA; London, UK; New York, NY, USA, 1999; pp. 467–488. [Google Scholar]
- Gophen, M.; Kaplan, D.; Tsipris, Y.; Meron, M.; Bar-Ilan, I. The newly constructed wetland ecosystem of Lake Agmon (Hula Valley, Israel): Functional perspectives. In Treatment Wetlands for Water Quality Improvement; Quebec 2000 Conference Proceedings (Selected Papers); Pries, J., Ed.; CH2M Hill Canada Ltd.: North York, ON, Canada, 2001; pp. 53–62. [Google Scholar]
- Reichman, O.; Markel, D.; Amar, D. Nutrient Loads in the Kinneret Watershed Rivers–Special Report: Heavy Rain Event (January 2012); Water Authority-Kinneret Section, January 2013; Kluwer Academic Publishers: Dordrecht, The Netherlands, 2014; p. 20. (In Hebrew) [Google Scholar]
- Markel, D.; Sass, E.; Lazar, B.; Bein, A. Biogeochemical evolution of sulfur-iron rich aquatic system in a reflooded wetlands environment (Lake Agmon, northern Israel). Wetl. Ecol. Manag. 1998, 6, 103–120. [Google Scholar] [CrossRef]
- Kaplan, D. Submerged Vegetation. In Hula Project Annual Report; Gophen, M., Ed.; Migal & JNF: Kiryat Shmone, Israel, 1998; pp. 85–96. [Google Scholar]
Figure 1.
Geographical maps of the Kinneret watershed (left) and Hula Valley (right). Bore-holes (drills for monitoring of GWT depth) (black spots) are indicated.
Figure 1.
Geographical maps of the Kinneret watershed (left) and Hula Valley (right). Bore-holes (drills for monitoring of GWT depth) (black spots) are indicated.

Figure 2.
Temporal changes in climate conditions in the Kinneret watershed. (right) rainfall (mm/y); (left) Jordan River discharge (mcm/y). LOWESS Smoother (bandwidth 0.8).
Figure 2.
Temporal changes in climate conditions in the Kinneret watershed. (right) rainfall (mm/y); (left) Jordan River discharge (mcm/y). LOWESS Smoother (bandwidth 0.8).

Figure 3.
Temporal changes in climate conditions in the Kinneret watershed. Annual means of daily mean temperature (Dafna Station). LOWESS Smoother (0.8 bandwidth) during 1970–2020.
Figure 3.
Temporal changes in climate conditions in the Kinneret watershed. Annual means of daily mean temperature (Dafna Station). LOWESS Smoother (0.8 bandwidth) during 1970–2020.

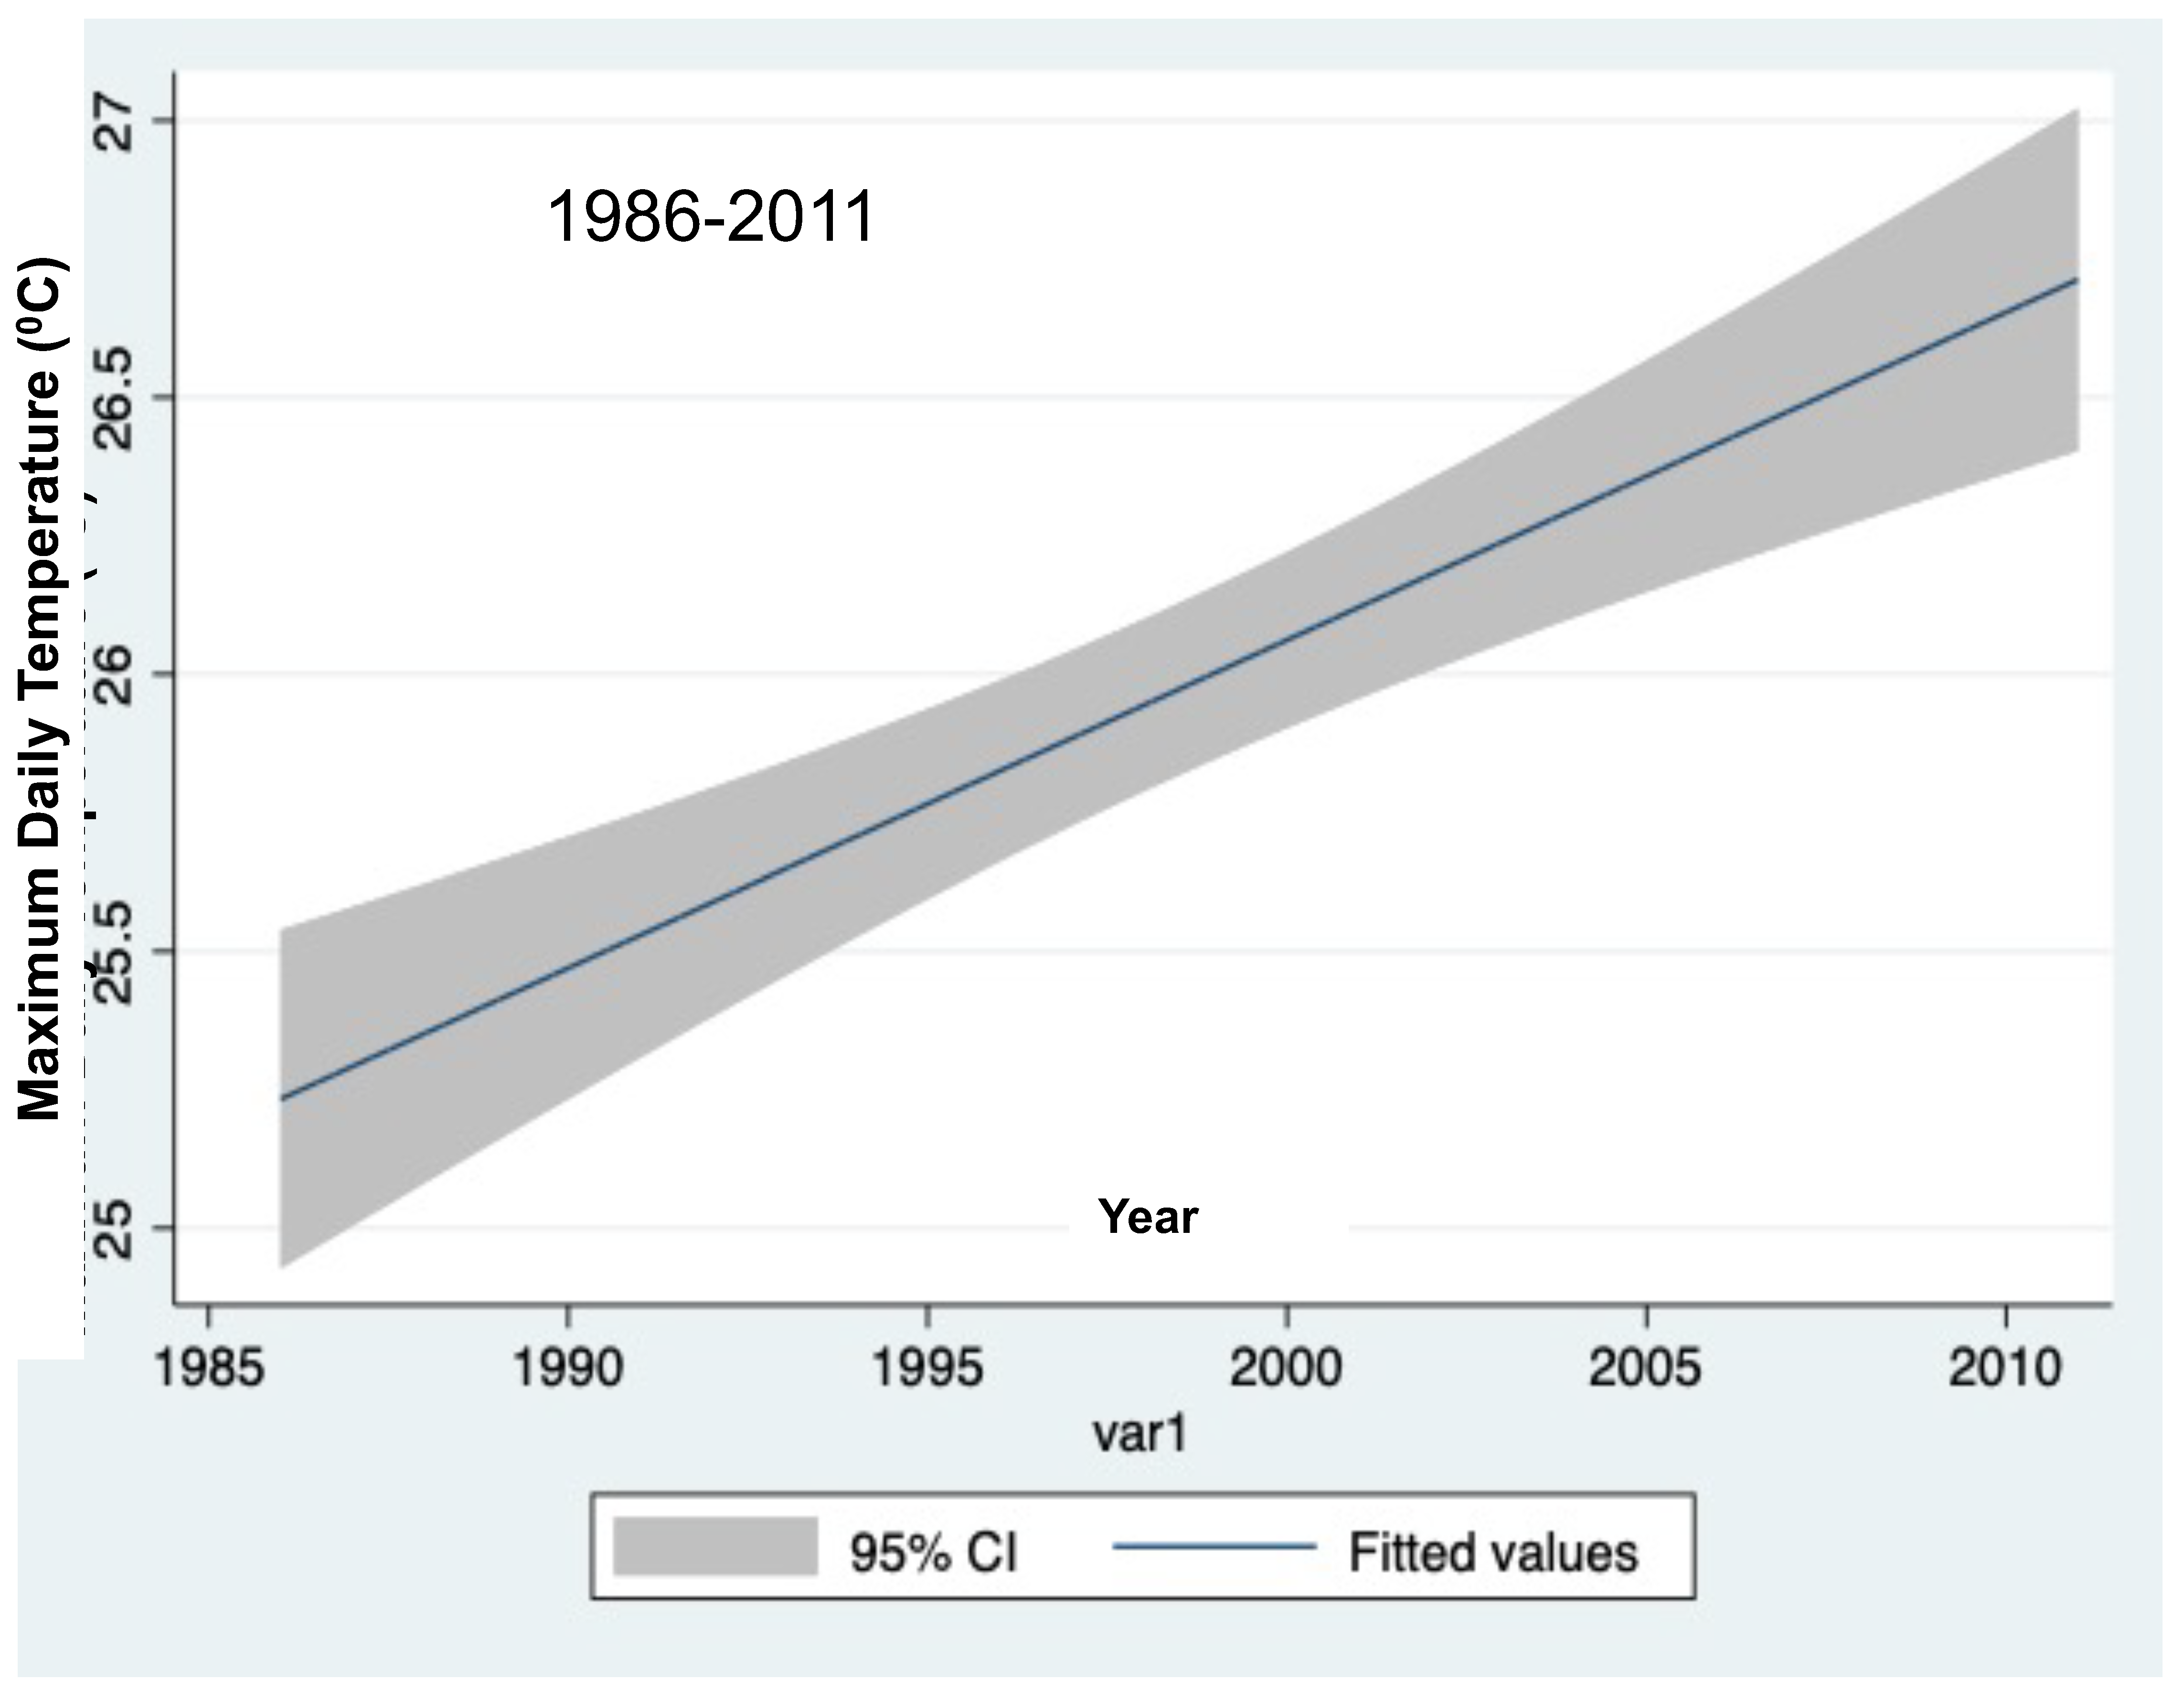
Figure 4.
Temporal changes in climate conditions in the Kinneret watershed. Annual means of daily maximum temperature (Dafna Station). Linear regression with CI (95%) during 1986–2018.
Figure 4.
Temporal changes in climate conditions in the Kinneret watershed. Annual means of daily maximum temperature (Dafna Station). Linear regression with CI (95%) during 1986–2018.

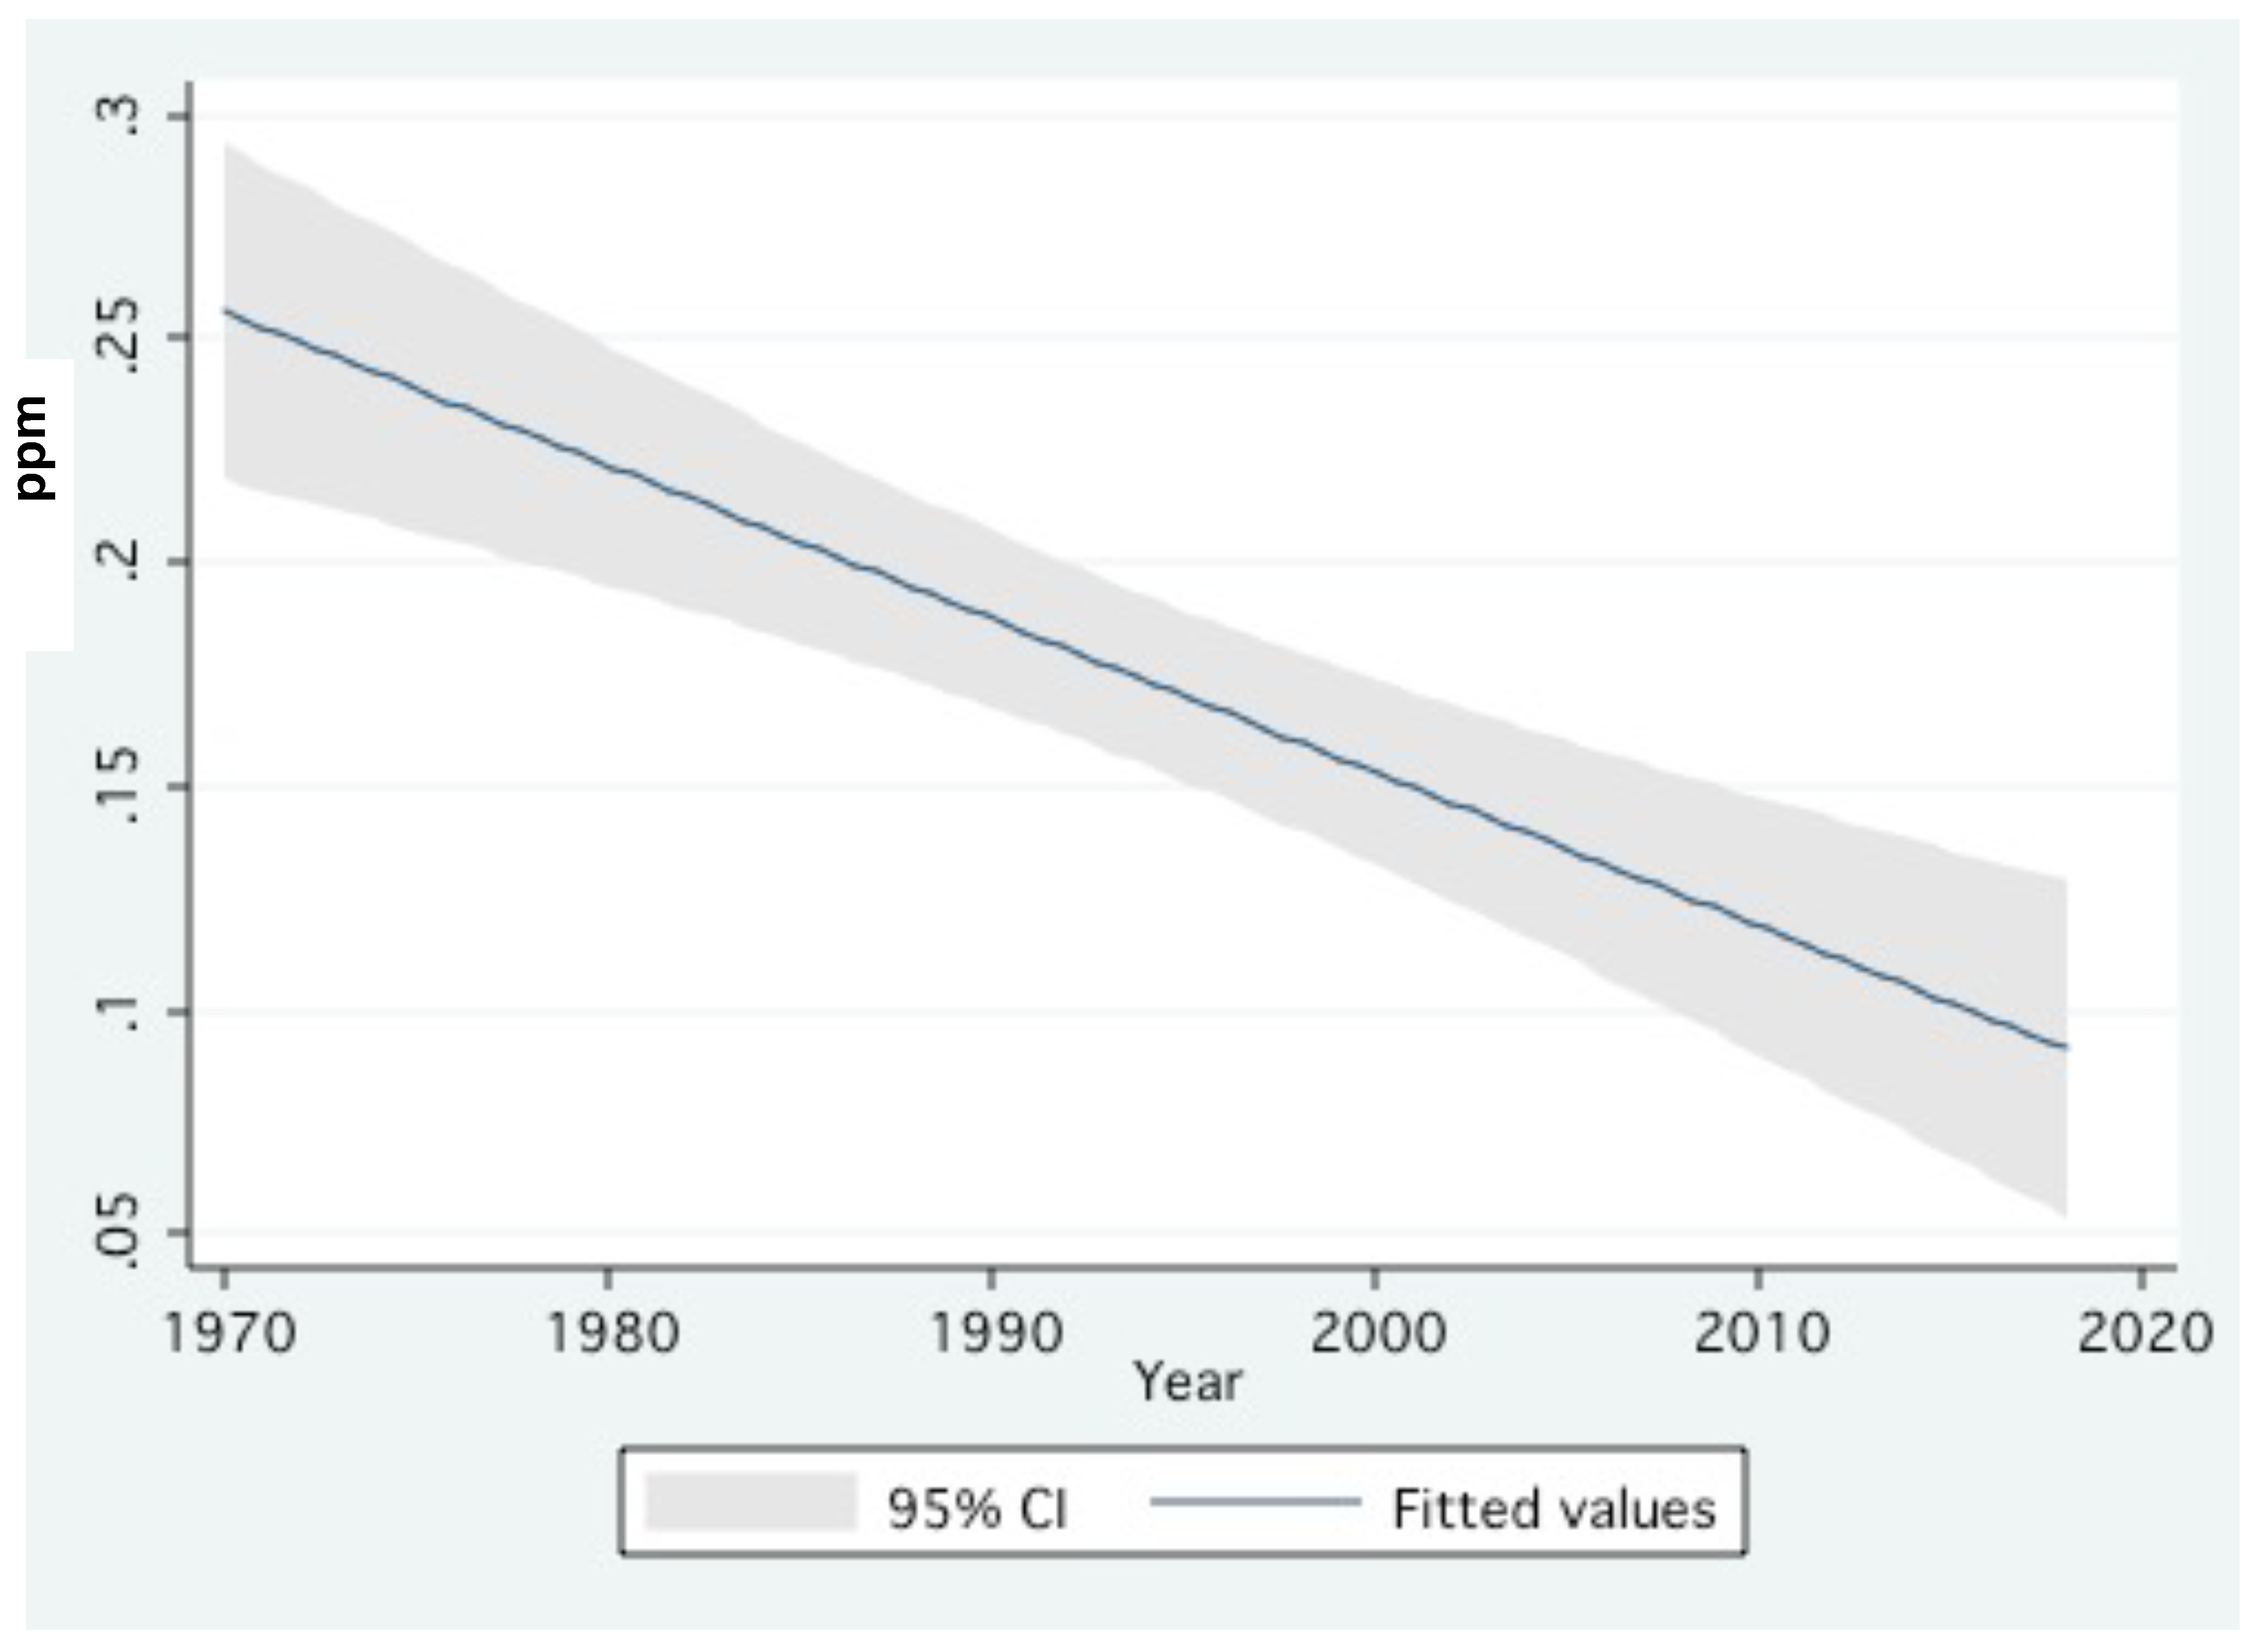
Figure 5.
Annual average TP concentration (ppm) in Jordan River water vs. Jordan River discharge (mcm/y,106 m3/y): linear prediction (95% CI) (left) and fractional polynomial regression (right).
Figure 5.
Annual average TP concentration (ppm) in Jordan River water vs. Jordan River discharge (mcm/y,106 m3/y): linear prediction (95% CI) (left) and fractional polynomial regression (right).

Figure 6.
Monthly averages (1969–2001 and 2001–2018) of Jordan River discharge (mcm/m).

Figure 7.
Temporal changes in climate conditions in the Kinneret watershed. Temporal (1970–2018) changes in annual average TP concentrations (ppm) in Jordan River water: linear prediction (95% CI) (left); trend of changes (LOWESS Smoother 0.8) (right).
Figure 7.
Temporal changes in climate conditions in the Kinneret watershed. Temporal (1970–2018) changes in annual average TP concentrations (ppm) in Jordan River water: linear prediction (95% CI) (left); trend of changes (LOWESS Smoother 0.8) (right).

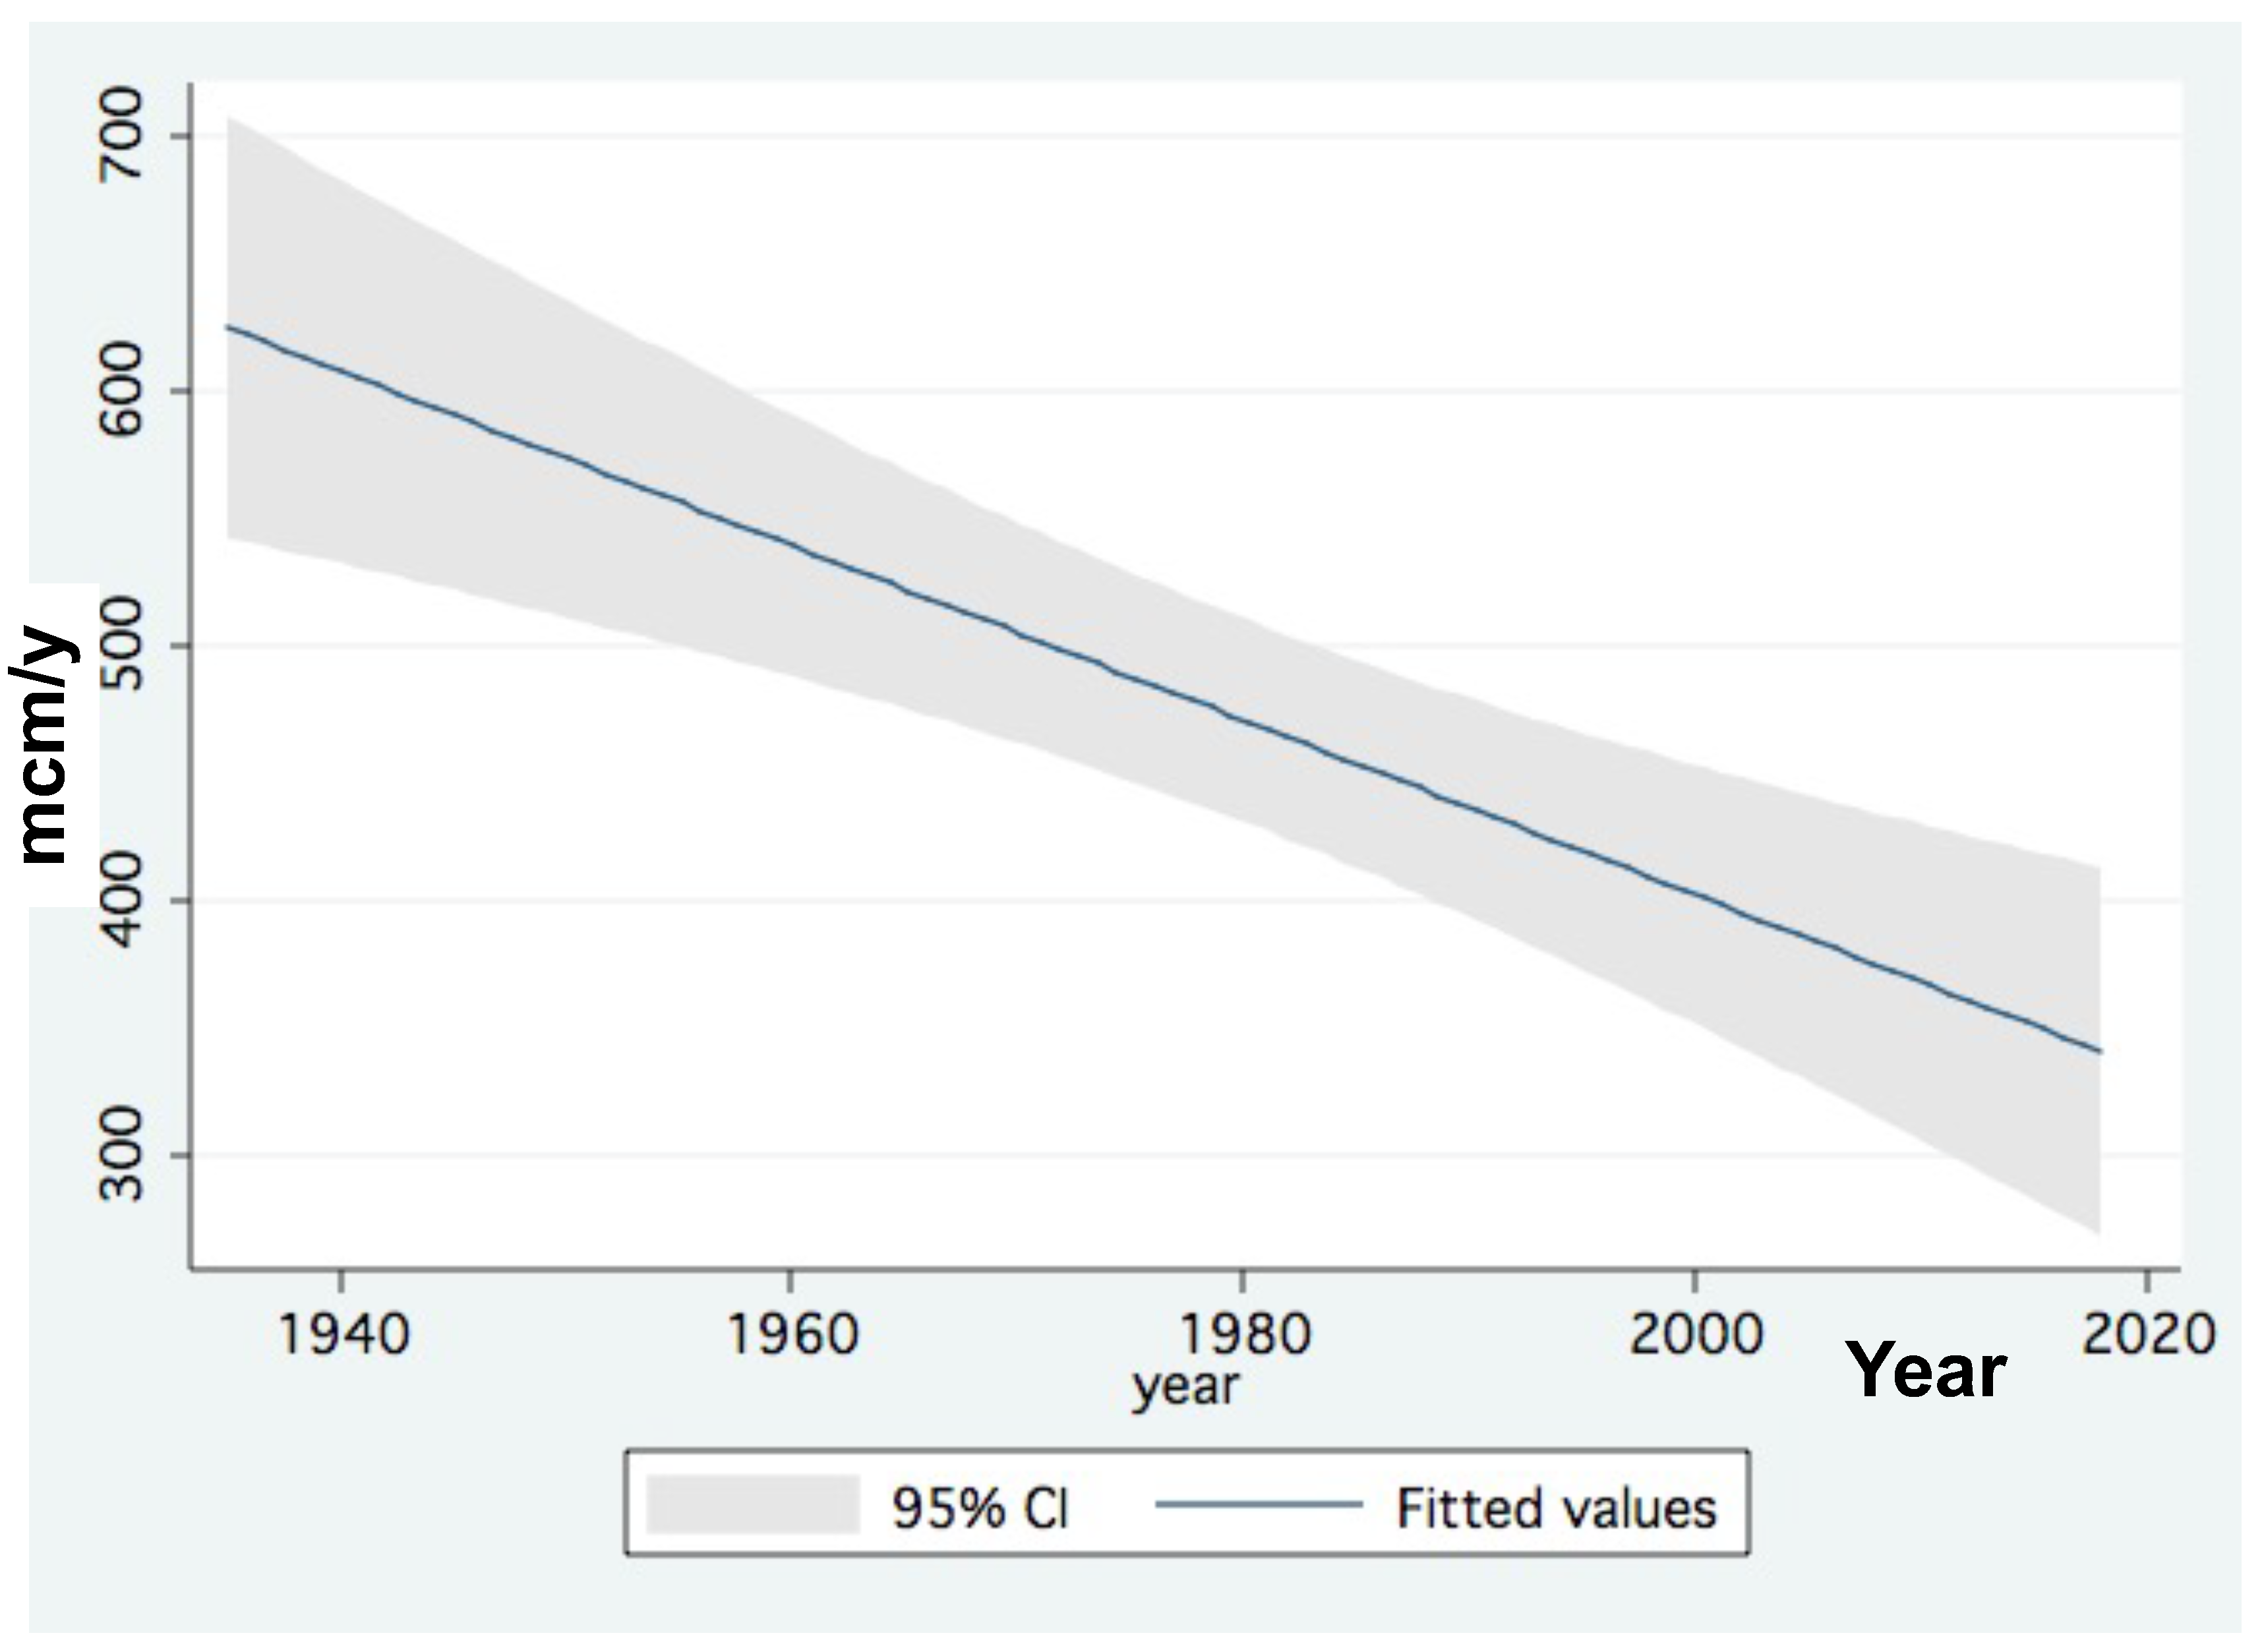
Figure 8.
Temporal changes in climate conditions in the Kinneret watershed. Temporal (1940–2018) changes in annual Jordan River discharge (mcm/y) (linear prediction (95% CI).
Figure 8.
Temporal changes in climate conditions in the Kinneret watershed. Temporal (1940–2018) changes in annual Jordan River discharge (mcm/y) (linear prediction (95% CI).

Figure 9.
Temporal changes in climate conditions in the Kinneret watershed. Temporal (1970–2018) changes in annual concentrations of monthly mean TP concentrations (ppm) in the Jordan River (linear prediction (95% CI)).
Figure 9.
Temporal changes in climate conditions in the Kinneret watershed. Temporal (1970–2018) changes in annual concentrations of monthly mean TP concentrations (ppm) in the Jordan River (linear prediction (95% CI)).

Figure 10.
Linear prediction (95% CI) of annual TP loads (ton/y) in relation to the Jordan River discharge during 1970–2018.
Figure 10.
Linear prediction (95% CI) of annual TP loads (ton/y) in relation to the Jordan River discharge during 1970–2018.

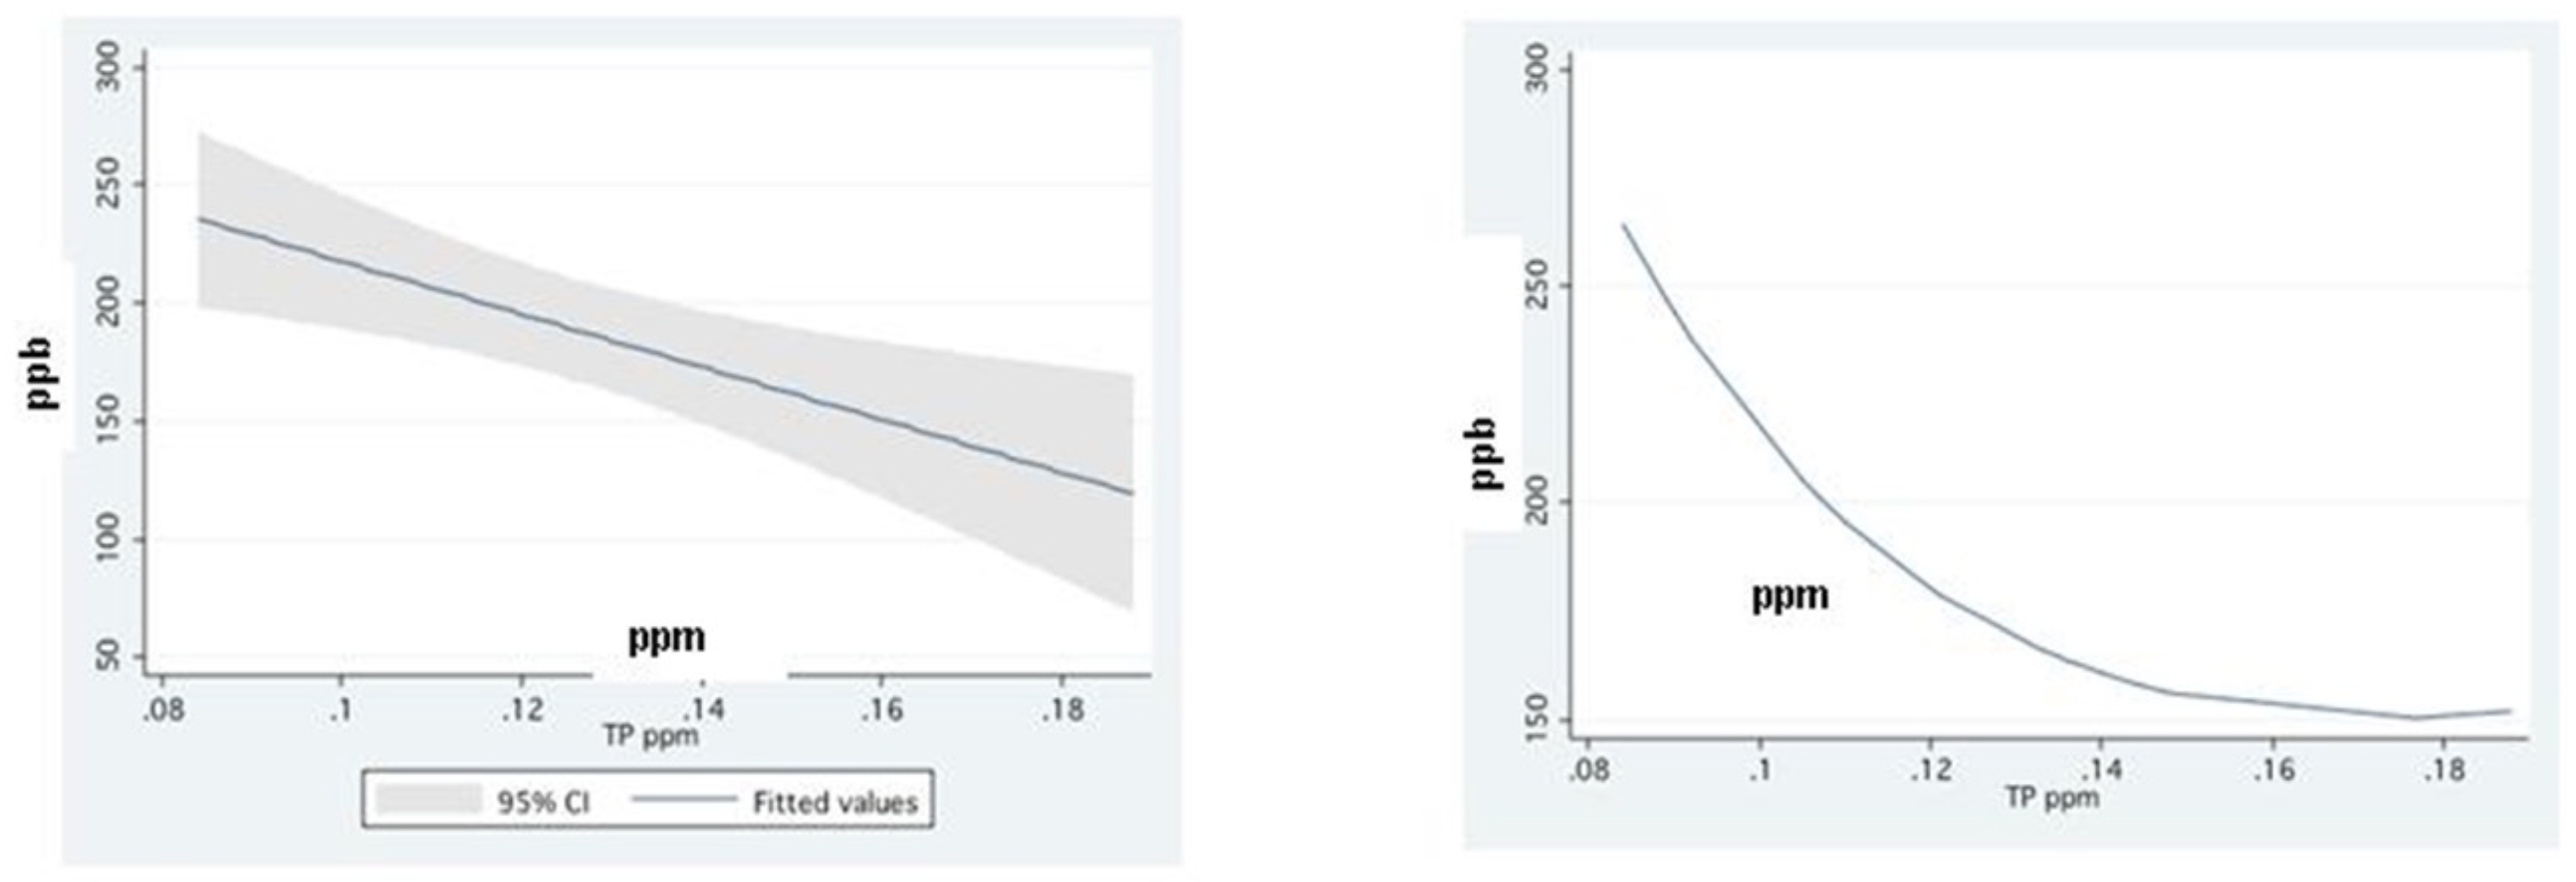
Figure 11.
Annual averages of total phosphorus (TP) concentrations. In the Agmon effluent (ppb) vs. annual concentrations of TP in Jordan waters (ppm): linear prediction (95% CI) (left) and fractional polynomial regression (right) during 1993–2018.
Figure 11.
Annual averages of total phosphorus (TP) concentrations. In the Agmon effluent (ppb) vs. annual concentrations of TP in Jordan waters (ppm): linear prediction (95% CI) (left) and fractional polynomial regression (right) during 1993–2018.

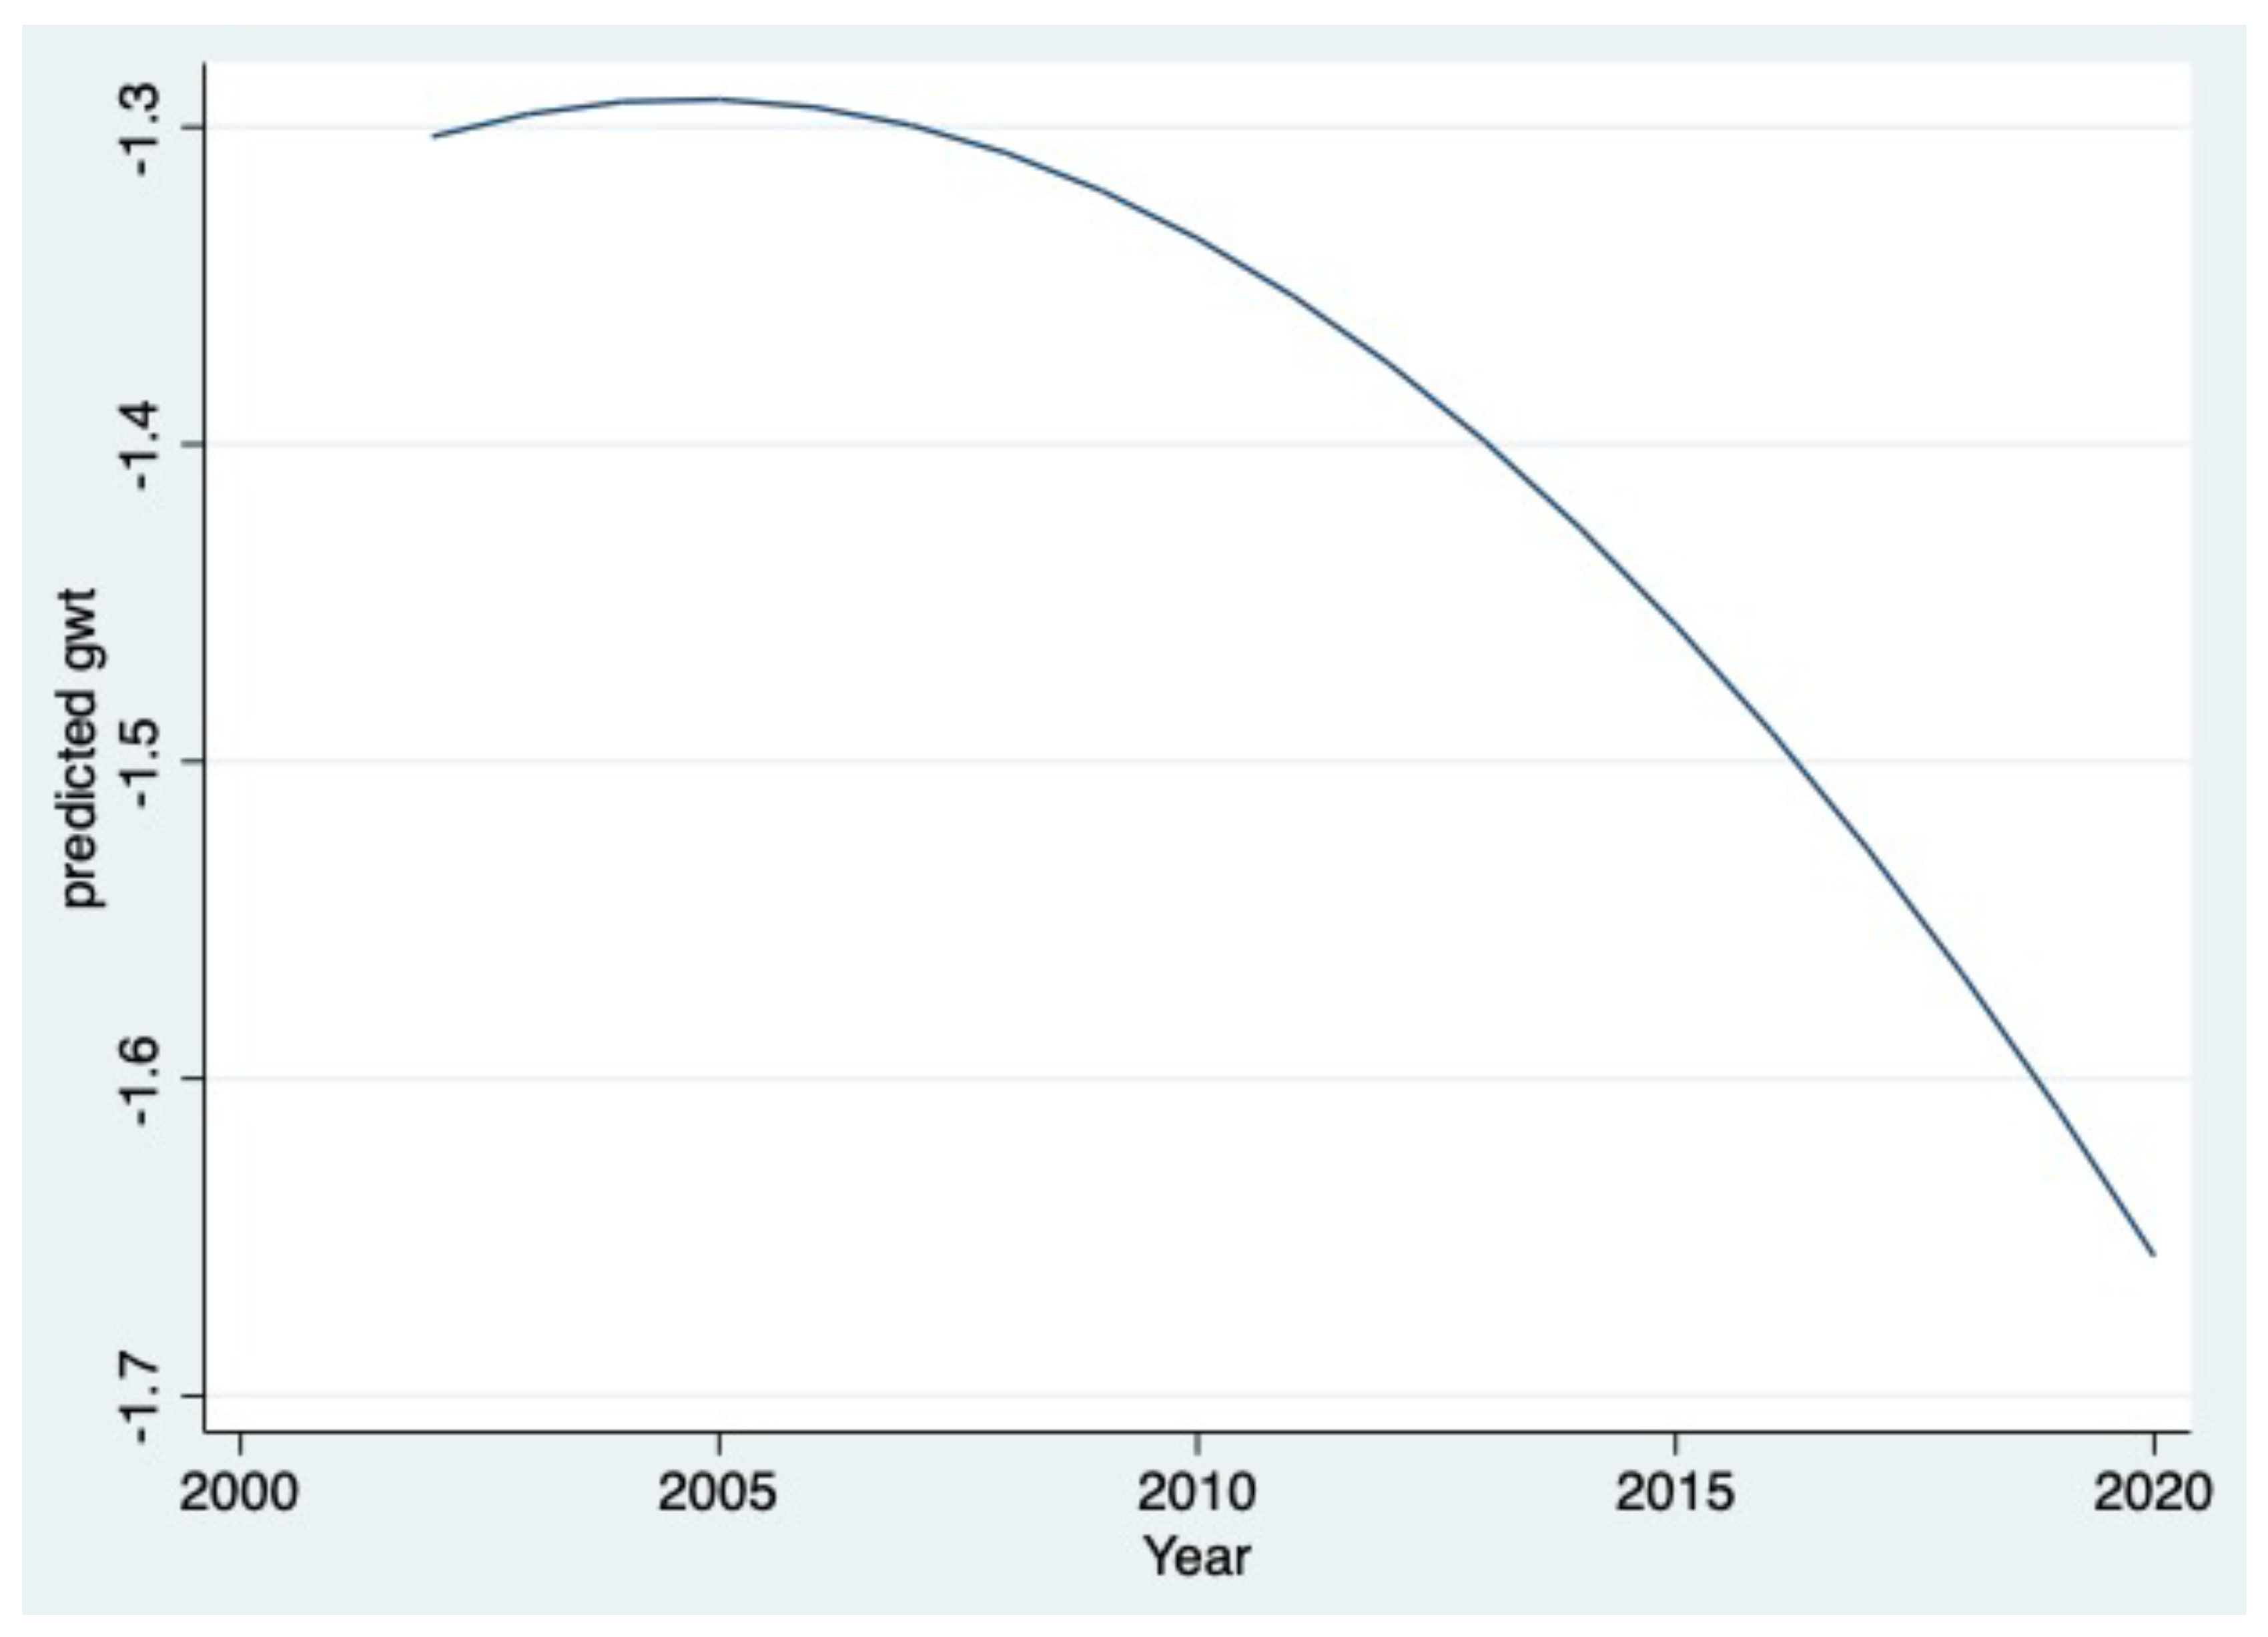
Figure 12.
Average decline of 32 cm of GWT (m below surface) in the Hula Valley: annual averages of bi-weekly measurements in 32 drills distributed throughout the entire valley during 1993–2020.
Figure 12.
Average decline of 32 cm of GWT (m below surface) in the Hula Valley: annual averages of bi-weekly measurements in 32 drills distributed throughout the entire valley during 1993–2020.

Figure 13.
Temporal changes in total phosphorus (TP) concentrations (ppb) in Lake Agmon-Hula. Annual averages vs. years (1994–2020). LOWESS Smoother (bandwidth 0.8).
Figure 13.
Temporal changes in total phosphorus (TP) concentrations (ppb) in Lake Agmon-Hula. Annual averages vs. years (1994–2020). LOWESS Smoother (bandwidth 0.8).

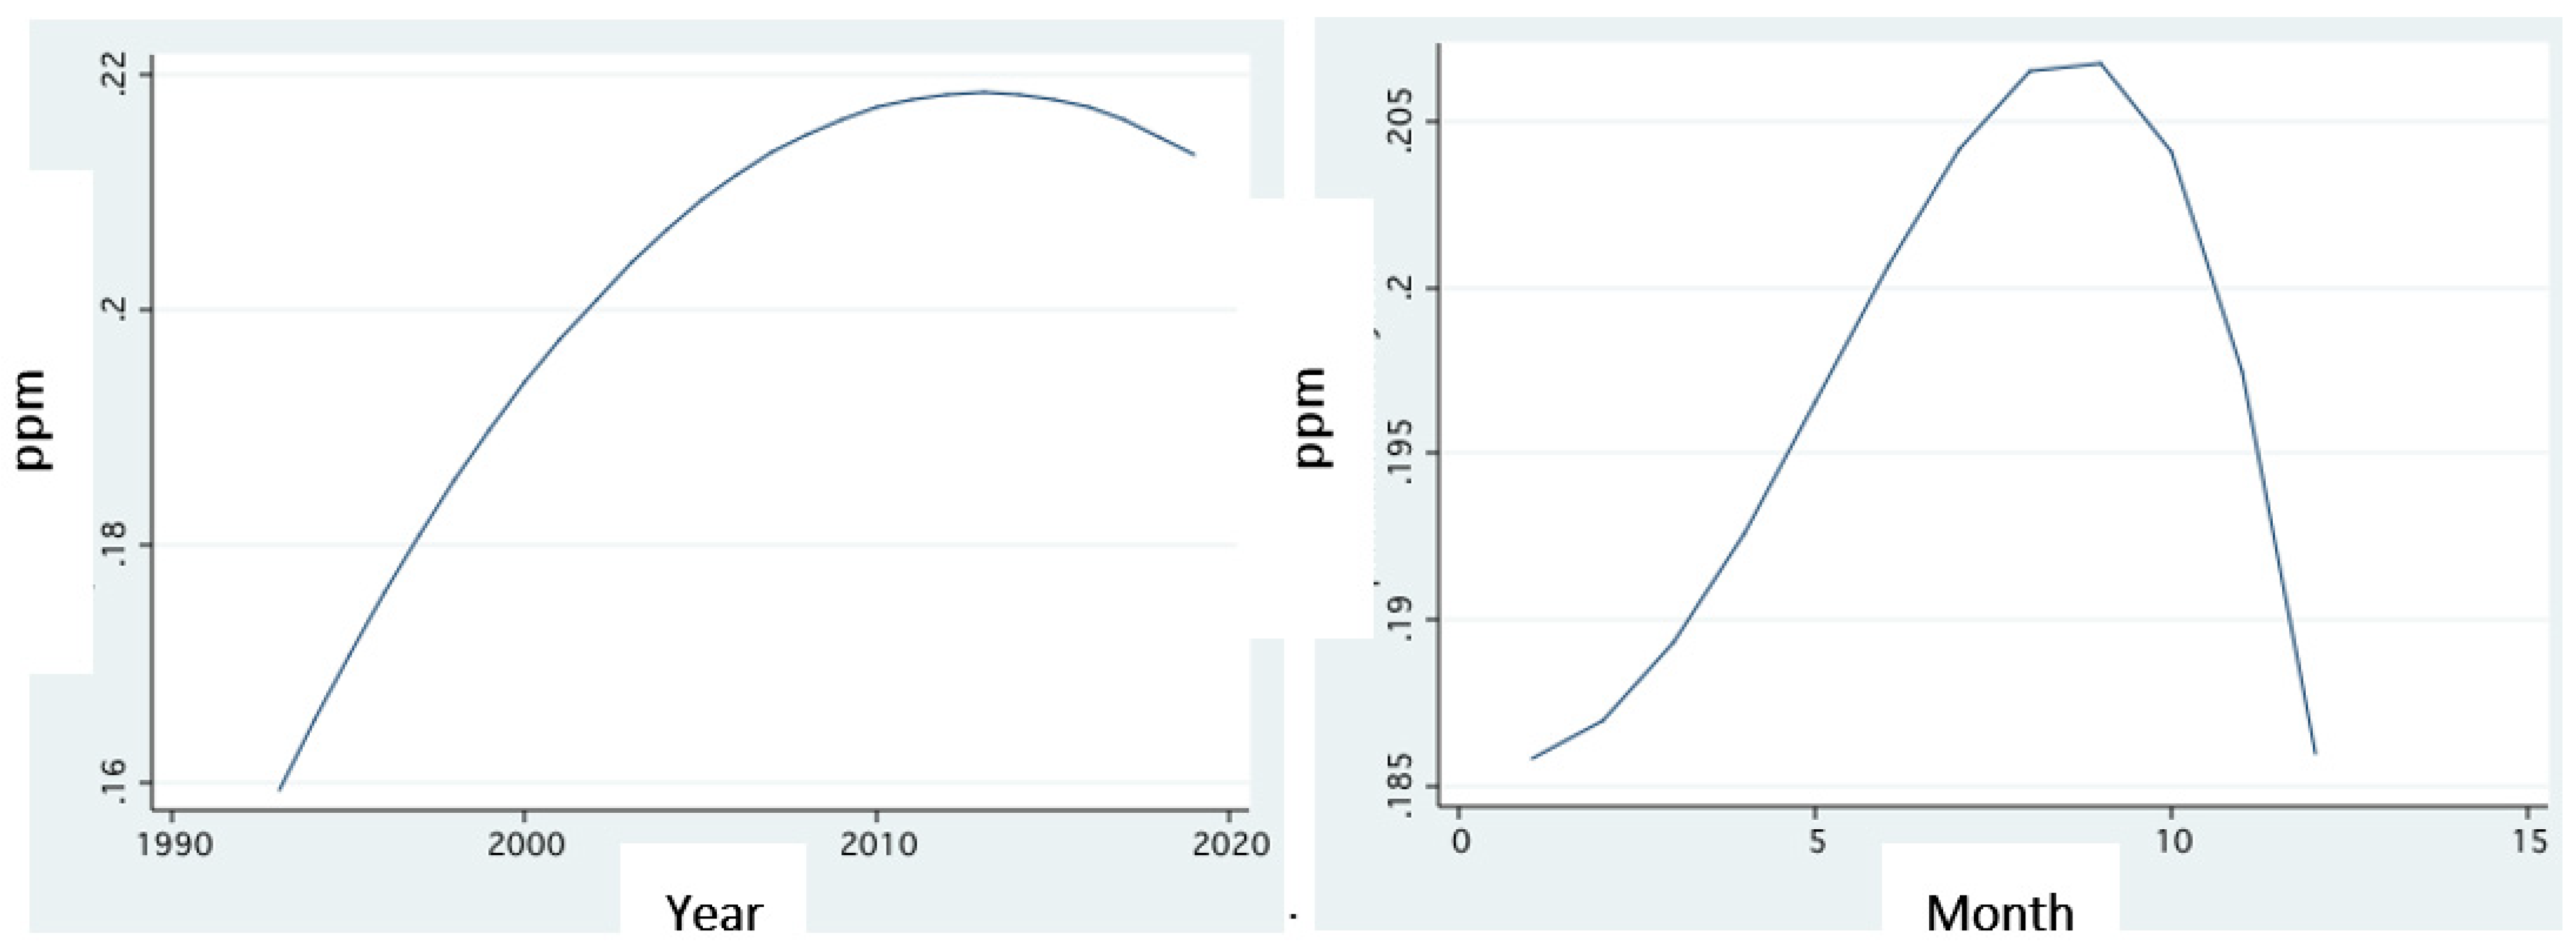
Figure 14.
Temporal changes (annual—left; monthly—right) of total phosphorus concentrations (ppm), averaged for the entire Hula Valley runoff during 1993–2020 (fractional polynomial regression).
Figure 14.
Temporal changes (annual—left; monthly—right) of total phosphorus concentrations (ppm), averaged for the entire Hula Valley runoff during 1993–2020 (fractional polynomial regression).

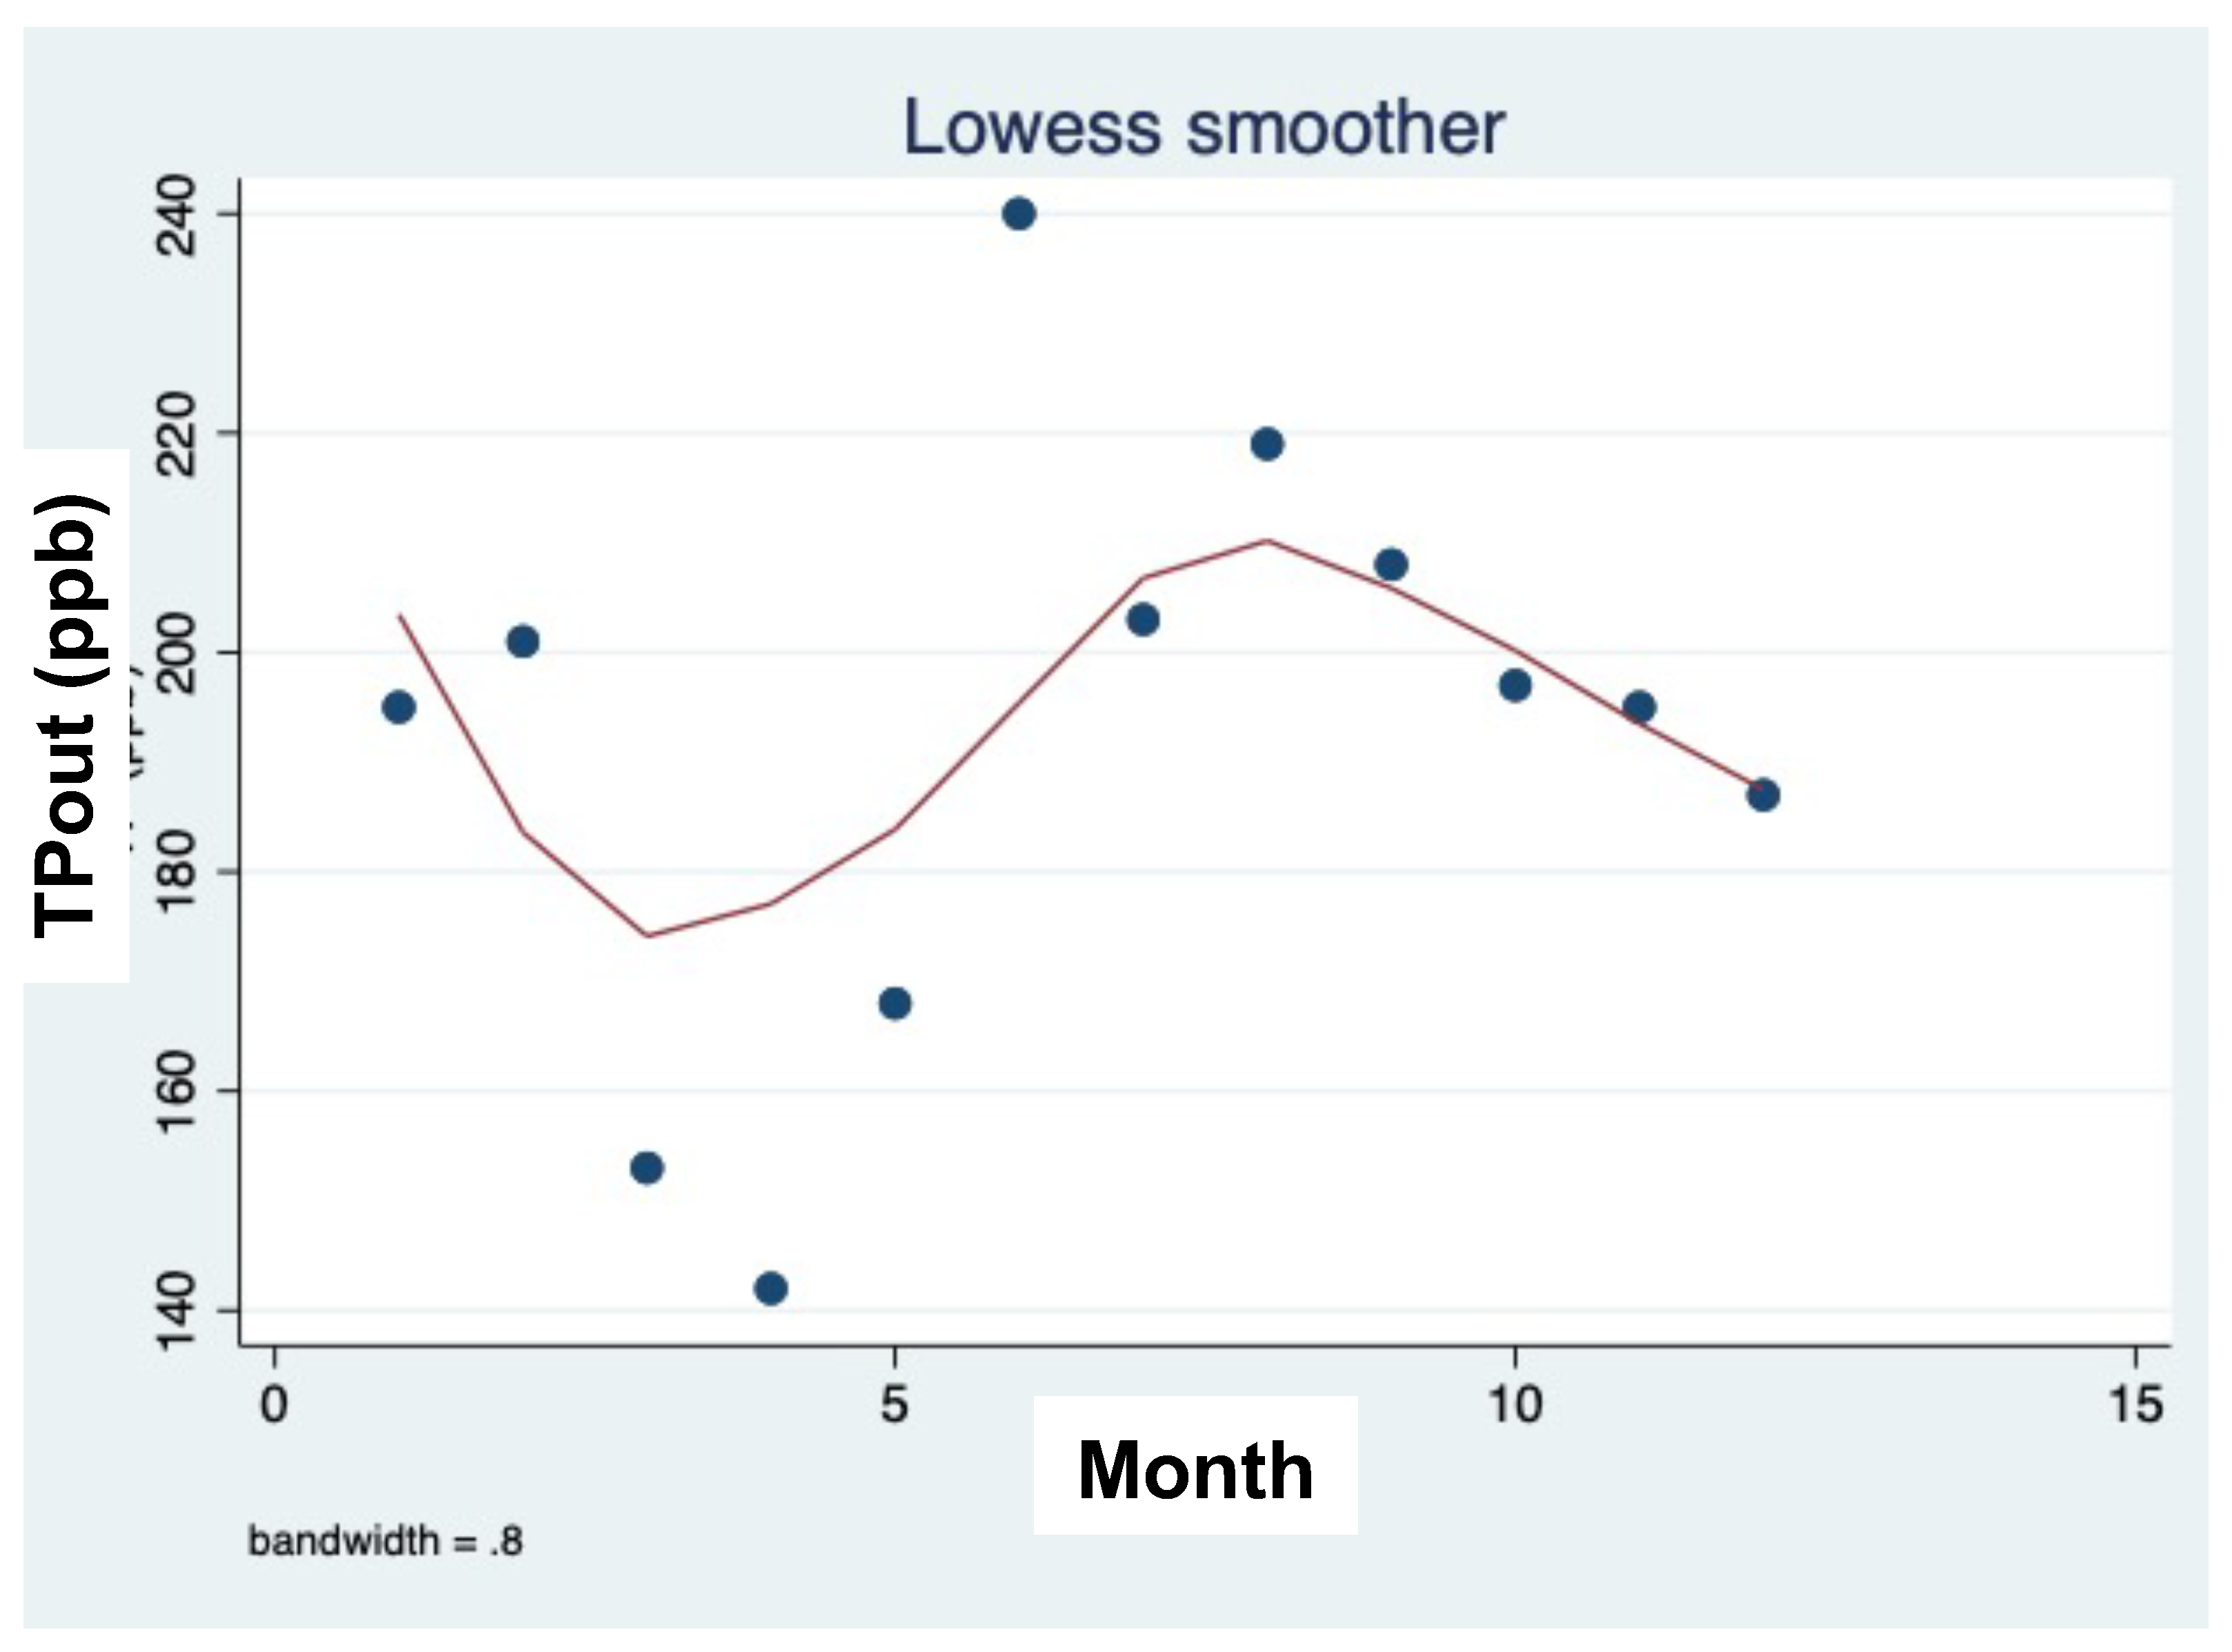
Figure 15.
Monthly average (1993–2020) TP concentrations (ppb) in Agmon-Hula effluent. Scatter plot and LOWESS Smoother (bandwidth 0.8).
Figure 15.
Monthly average (1993–2020) TP concentrations (ppb) in Agmon-Hula effluent. Scatter plot and LOWESS Smoother (bandwidth 0.8).

Figure 16.
Temporal crane density (maximal counts) in the Hula Valley during 1995–2019: LOWESS Smoother (bandwidth 0.8).
Figure 16.
Temporal crane density (maximal counts) in the Hula Valley during 1995–2019: LOWESS Smoother (bandwidth 0.8).

Figure 17.
Linear regression (CI 95%) between the TP loading (t/y) of Jordan River in relation to two headwaters, Hazbani and Banias.
Figure 17.
Linear regression (CI 95%) between the TP loading (t/y) of Jordan River in relation to two headwaters, Hazbani and Banias.


Table 1.
Seasonal summary of water balance (103 m3/season) in Lake Agmon-Hula. Winter—December and January–May; summer—June–November. Water inflow sources (Figure 1) are reconstructed: Jordan, Hula East, and Canal Z (Figure 1) and precipitation; water deficit sources are outflow and evaporation. Plus indicates an increase, and minus indicates a deficit. Evaporation (mm/season) and precipitation (mm/season) have been transformed to areal (110 ha) capacity (m3/season). Nevertheless, as a result of climate condition changes (dryness) during the past 5 years, the surface area of Lake Agmon-Hula became 82 ha, and the mean depth became −20 cm [22] (no available data on particular TP contribution into River Jordan by different sources in Hula Valley).
| Source | Winter | Summer | Annual |
|---|---|---|---|
| Hula East | 310 | 180 | 490 |
| Reconstructed Jordan | 823 | 967 | 1790 |
| Canal Z | 2080 | 3920 | 6000 |
| Precipitation | 389 | 84 | 473 |
| Evaporation | 905 | 1409 | 2314 |
| Outflow | 2110 | 3380 | 5490 |
| Summary: Increment Deficit | +3602 −3015 | +5151 −4789 | +8753 −7804 |
| Total Balance | +587 | +362 | +949 |
Table 2.
Annual (1994–1997) seasonal averages of total phosphorus concentrations (ppb) in the Lake Agmon-Hula outlet: winter (January–March), spring (April–June), summer (July–September), and fall (October–December) [22].
Table 2.
Annual (1994–1997) seasonal averages of total phosphorus concentrations (ppb) in the Lake Agmon-Hula outlet: winter (January–March), spring (April–June), summer (July–September), and fall (October–December) [22].
| Year | Winter | Spring | Summer | Fall |
|---|---|---|---|---|
| 1994 | 37 | 54 | 95 | |
| 1995 | 42 | 33 | 164 | 124 |
| 1996 | 43 | 68 | 203 | 178 |
| 1997 | 104 | 116 | 184 | 185 |
Table 3.
Monthly mass balance (kg/month) (input minus output) of TP in Lake Agmon-Hula in 2003 and 2004 (positive value = retained; negative value = deficit). The input sources are peat soil drainage through Canal Z, Canal East, and the reconstructed Jordan Branch [22].
Table 3.
Monthly mass balance (kg/month) (input minus output) of TP in Lake Agmon-Hula in 2003 and 2004 (positive value = retained; negative value = deficit). The input sources are peat soil drainage through Canal Z, Canal East, and the reconstructed Jordan Branch [22].
| Month | 2003 | 2004 |
|---|---|---|
| 1 | 8 | 180 |
| 2 | 7 | 60 |
| 3 | −63 | 19 |
| 4 | 132 | 10 |
| 5 | 12 | 30 |
| 6 | 79 | 110 |
| 7 | 49 | 70 |
| 8 | 72 | 40 |
| 9 | 23 | 40 |
| 10 | 31 | 10 |
| 11 | −3 | −60 |
| 12 | −210 | 0 |
| Annual Balance | 137 | 600 |
Table 4.
Annual TP mass balance (input minus output: kg/year) in Lake Agmon-Hula (kg/year) for high (2003, 2004) and low precipitation ranges (2007, 2008) [22,23,24].
| Year | Annual Balance (kg/Year) | Input (kg/Year) | Output (kg/Year) |
|---|---|---|---|
| 2003 | 137 | 927 | 792 |
| 2004 | 600 | 1030 | 430 |
| 2007 | −710 | 832 | 1542 |
| 2008 | −620 | 970 | 1590 |
Table 5.
Annual averages of the total vegetation load of dry weight and TP (ton) for the entire lake during the period of 1997–2004. [22].
Table 5.
Annual averages of the total vegetation load of dry weight and TP (ton) for the entire lake during the period of 1997–2004. [22].
| Year | Dry Weight (ton) | TP (ton) |
|---|---|---|
| 1997 | 268 | 0.9 |
| 1998 | 213 | 0.7 |
| 1999 | 432 | 0.8 |
| 2000 | 343 | 0.9 |
| 2001 | 740 | 1.2 |
| 2002 | 817 | 1.2 |
| 2003 | 140 | 0.3 |
| 2004 | 698 | 1.1 |
Table 6.
Periodical (1969–1978; 1979–1989; 1990–2001) averages of total phosphorus (TP) loads in the epilimnion concentrations (ppb) in Lake Kinneret. Analysis of TDP and SRP started from 1974 [21].
Table 6.
Periodical (1969–1978; 1979–1989; 1990–2001) averages of total phosphorus (TP) loads in the epilimnion concentrations (ppb) in Lake Kinneret. Analysis of TDP and SRP started from 1974 [21].
| Period | Epilimnetic TP: ton, (ppm) (1–15 m) | Hypolimnetic TP: ton (ppm) (30–40 M) | Water Volume (1–15 m Depth) mcm | Mean Water Level (mbsl) |
|---|---|---|---|---|
| 1969–1978 | 43 (0.019) | 10 (0.022) | 2285 | 210.5 |
| 1979–1989 | 48 (0.021) | 20 (0.044) | 2273 | 211 |
| 1990–2001 | 45 (0.020) | 23 (0.050) | 2273 | 211 |
| 2008 | 35 (0.016) | 21 (0.046) | 2058 | 214.41 |
| 2016 | 31 (0.014) | 35 (0.078) | 2200 | 213.14 |
| 2020 | 36 (0.016) | 20 (0.044) | 2234 | 209.40 |
Table 7.
Multi-annual (1967–1985) averages for Jordan River and three headwater rivers: Dan, Banias (Hermon), and Hazbani (Snir) (Figure 1). Annual discharge (mcm/y) and TP concentration (ppb) averaged for the three headwaters are shown. Data Sources: National Water Authority-National Hydrological Service; Mekorot Water Supply Company, Ltd.
| Water Source | mcm/y | TP Load (t/y) | TP Concentration (ppb) |
|---|---|---|---|
| Dan | 270 | 5.7 | 21 |
| Banias (Hermon) | 1216 | 18.4 | 159 |
| Hazbani (Snir) | 129 | 19.0 | 147 |
| Total Headwaters | 575 | 42.6 | 83 |
| Jordan (at Huri) | 530 | 119.4 | 225 |
Publisher’s Note: MDPI stays neutral with regard to jurisdictional claims in published maps and institutional affiliations. |
© 2021 by the author. Licensee MDPI, Basel, Switzerland. This article is an open access article distributed under the terms and conditions of the Creative Commons Attribution (CC BY) license (https://creativecommons.org/licenses/by/4.0/).
Share and Cite
MDPI and ACS Style
Gophen, M. Effects of Climate Conditions on TP Outsourcing in Lake Kinneret (Israel). Climate 2021, 9, 142. https://0-doi-org.brum.beds.ac.uk/10.3390/cli9090142
AMA Style
Gophen M. Effects of Climate Conditions on TP Outsourcing in Lake Kinneret (Israel). Climate. 2021; 9(9):142. https://0-doi-org.brum.beds.ac.uk/10.3390/cli9090142
Chicago/Turabian StyleGophen, Moshe. 2021. "Effects of Climate Conditions on TP Outsourcing in Lake Kinneret (Israel)" Climate 9, no. 9: 142. https://0-doi-org.brum.beds.ac.uk/10.3390/cli9090142
Note that from the first issue of 2016, this journal uses article numbers instead of page numbers. See further details here.