
Machine Learning and Natural Language Processing for Prediction of Human Factors in Aviation Incident Reports


1
Departamento de Engenharia Mecânica, Instituto Superior Técnico, Universidade de Lisboa, Av. Rovisco Pais 1, 1049-001 Lisboa, Portugal
2
IDMEC, Instituto Superior Técnico, Universidade de Lisboa, Av. Rovisco Pais 1, 1049-001 Lisboa, Portugal
3
ICT, Escola de Ciências e Tecnologia, Universidade de Évora, Rua Romão Ramalho 59, 7002-554 Évora, Portugal
4
ISEC, ISEC Lisboa, Alameda das Linhas de Torres 179, 1750-142 Lisboa, Portugal
5
AEROG, Universidade da Beira Interior, Calçada da Fonte do Lameiro, 6201-001 Covilha, Portugal
*
Author to whom correspondence should be addressed.
Aerospace 2021, 8(2), 47; https://0-doi-org.brum.beds.ac.uk/10.3390/aerospace8020047
Submission received: 31 December 2020
/
Revised: 27 January 2021
/
Accepted: 29 January 2021
/
Published: 11 February 2021
(This article belongs to the Special Issue Application of Multiagent Systems and Artificial Intelligence Techniques in Aviation (Volume II))
Abstract
:In the aviation sector, human factors are the primary cause of safety incidents. Intelligent prediction systems, which are capable of evaluating human state and managing risk, have been developed over the years to identify and prevent human factors. However, the lack of large useful labelled data has often been a drawback to the development of these systems. This study presents a methodology to identify and classify human factor categories from aviation incident reports. For feature extraction, a text pre-processing and Natural Language Processing (NLP) pipeline is developed. For data modelling, semi-supervised Label Spreading (LS) and supervised Support Vector Machine (SVM) techniques are considered. Random search and Bayesian optimization methods are applied for hyper-parameter analysis and the improvement of model performance, as measured by the Micro F1 score. The best predictive models achieved a Micro F1 score of 0.900, 0.779, and 0.875, for each level of the taxonomic framework, respectively. The results of the proposed method indicate that favourable predicting performances can be achieved for the classification of human factors based on text data. Notwithstanding, a larger data set would be recommended in future research.
1. Introduction
Over the last decade, air transport has been considered to be one of the fastest and safest methods of transportation for long-distance travel, being one of the largest contributors to the growth of political, social, and economic globalization.
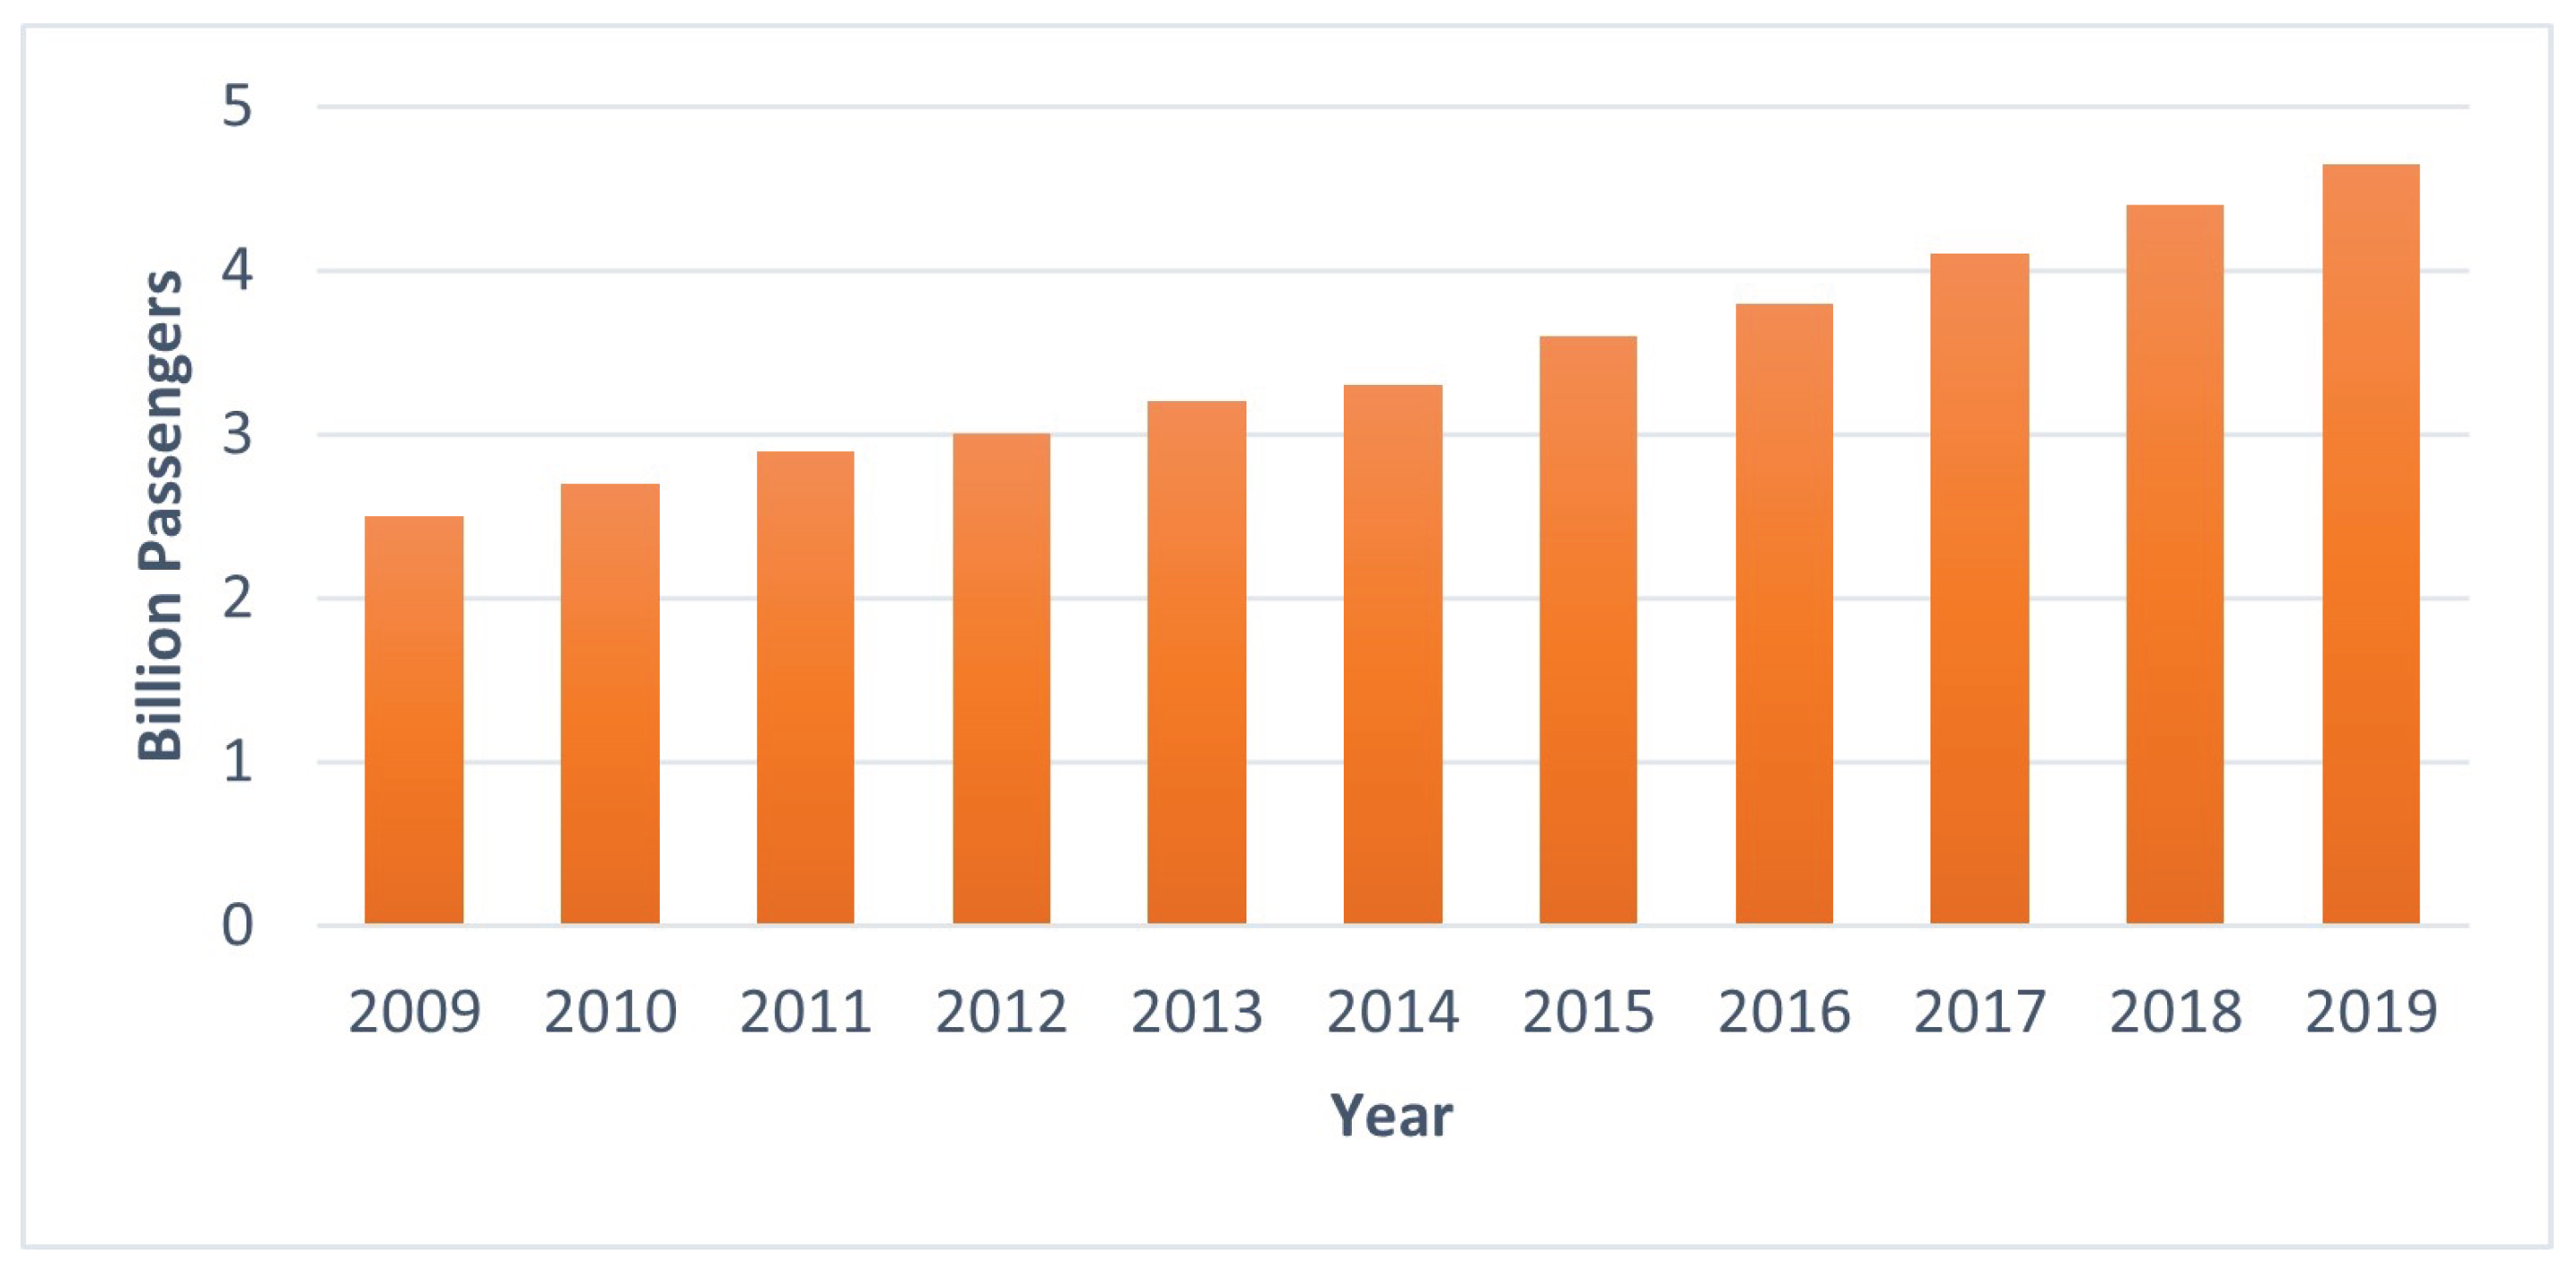
Before the current coronavirus pandemic, the commercial aviation sector was annually deploying over 37 million airplane departures and four billion passengers worldwide, with the International Civil Aviation Organization (ICAO) expecting these numbers to reach 90 million and 10 billion, respectively, by 2040 [1]. Although these numbers have been strongly affected by the pandemic, some projections estimate that global air traffic could reach 2019 levels as early as 2024 [2]. Figure 1 shows the continuous growth of worldwide commercial air traffic over the past decade, in billions of passengers.
In order to keep up with the increasing demand that is generated by the economic growth in emerging markets, rise in population, and introduction of low-cost carriers, airlines have been on a fast large-scale expansion, through increasing their assets, personnel, and infrastructure, while maintaining competitive prices. Some instances that are representative of this growth can be found in [4,5].
This fast expansion has brought safety concerns into numerous sectors of the aircraft industry. Oftentimes, the increase in workload is not accompanied by a proportional gain in personnel and, as a consequence, employees are often subjected to an enormous quantity of rigorous requests, under pressured time frames, and complex environments [6]. Moreover, compounded factors, such as career uncertainty and frequent demand for overtime, have contributed to an increasing risk of personnel capabilities detriment and, hence, mistakes in safety sensitive tasks [6]. These circumstances have been further aggravated by the effects of the current pandemic, where companies had to forgo large portions of their employees in order to reduce cash burns and regain profit margins, while maintaining contractual obligations and preparing for a resurgence of traffic demand [7,8].
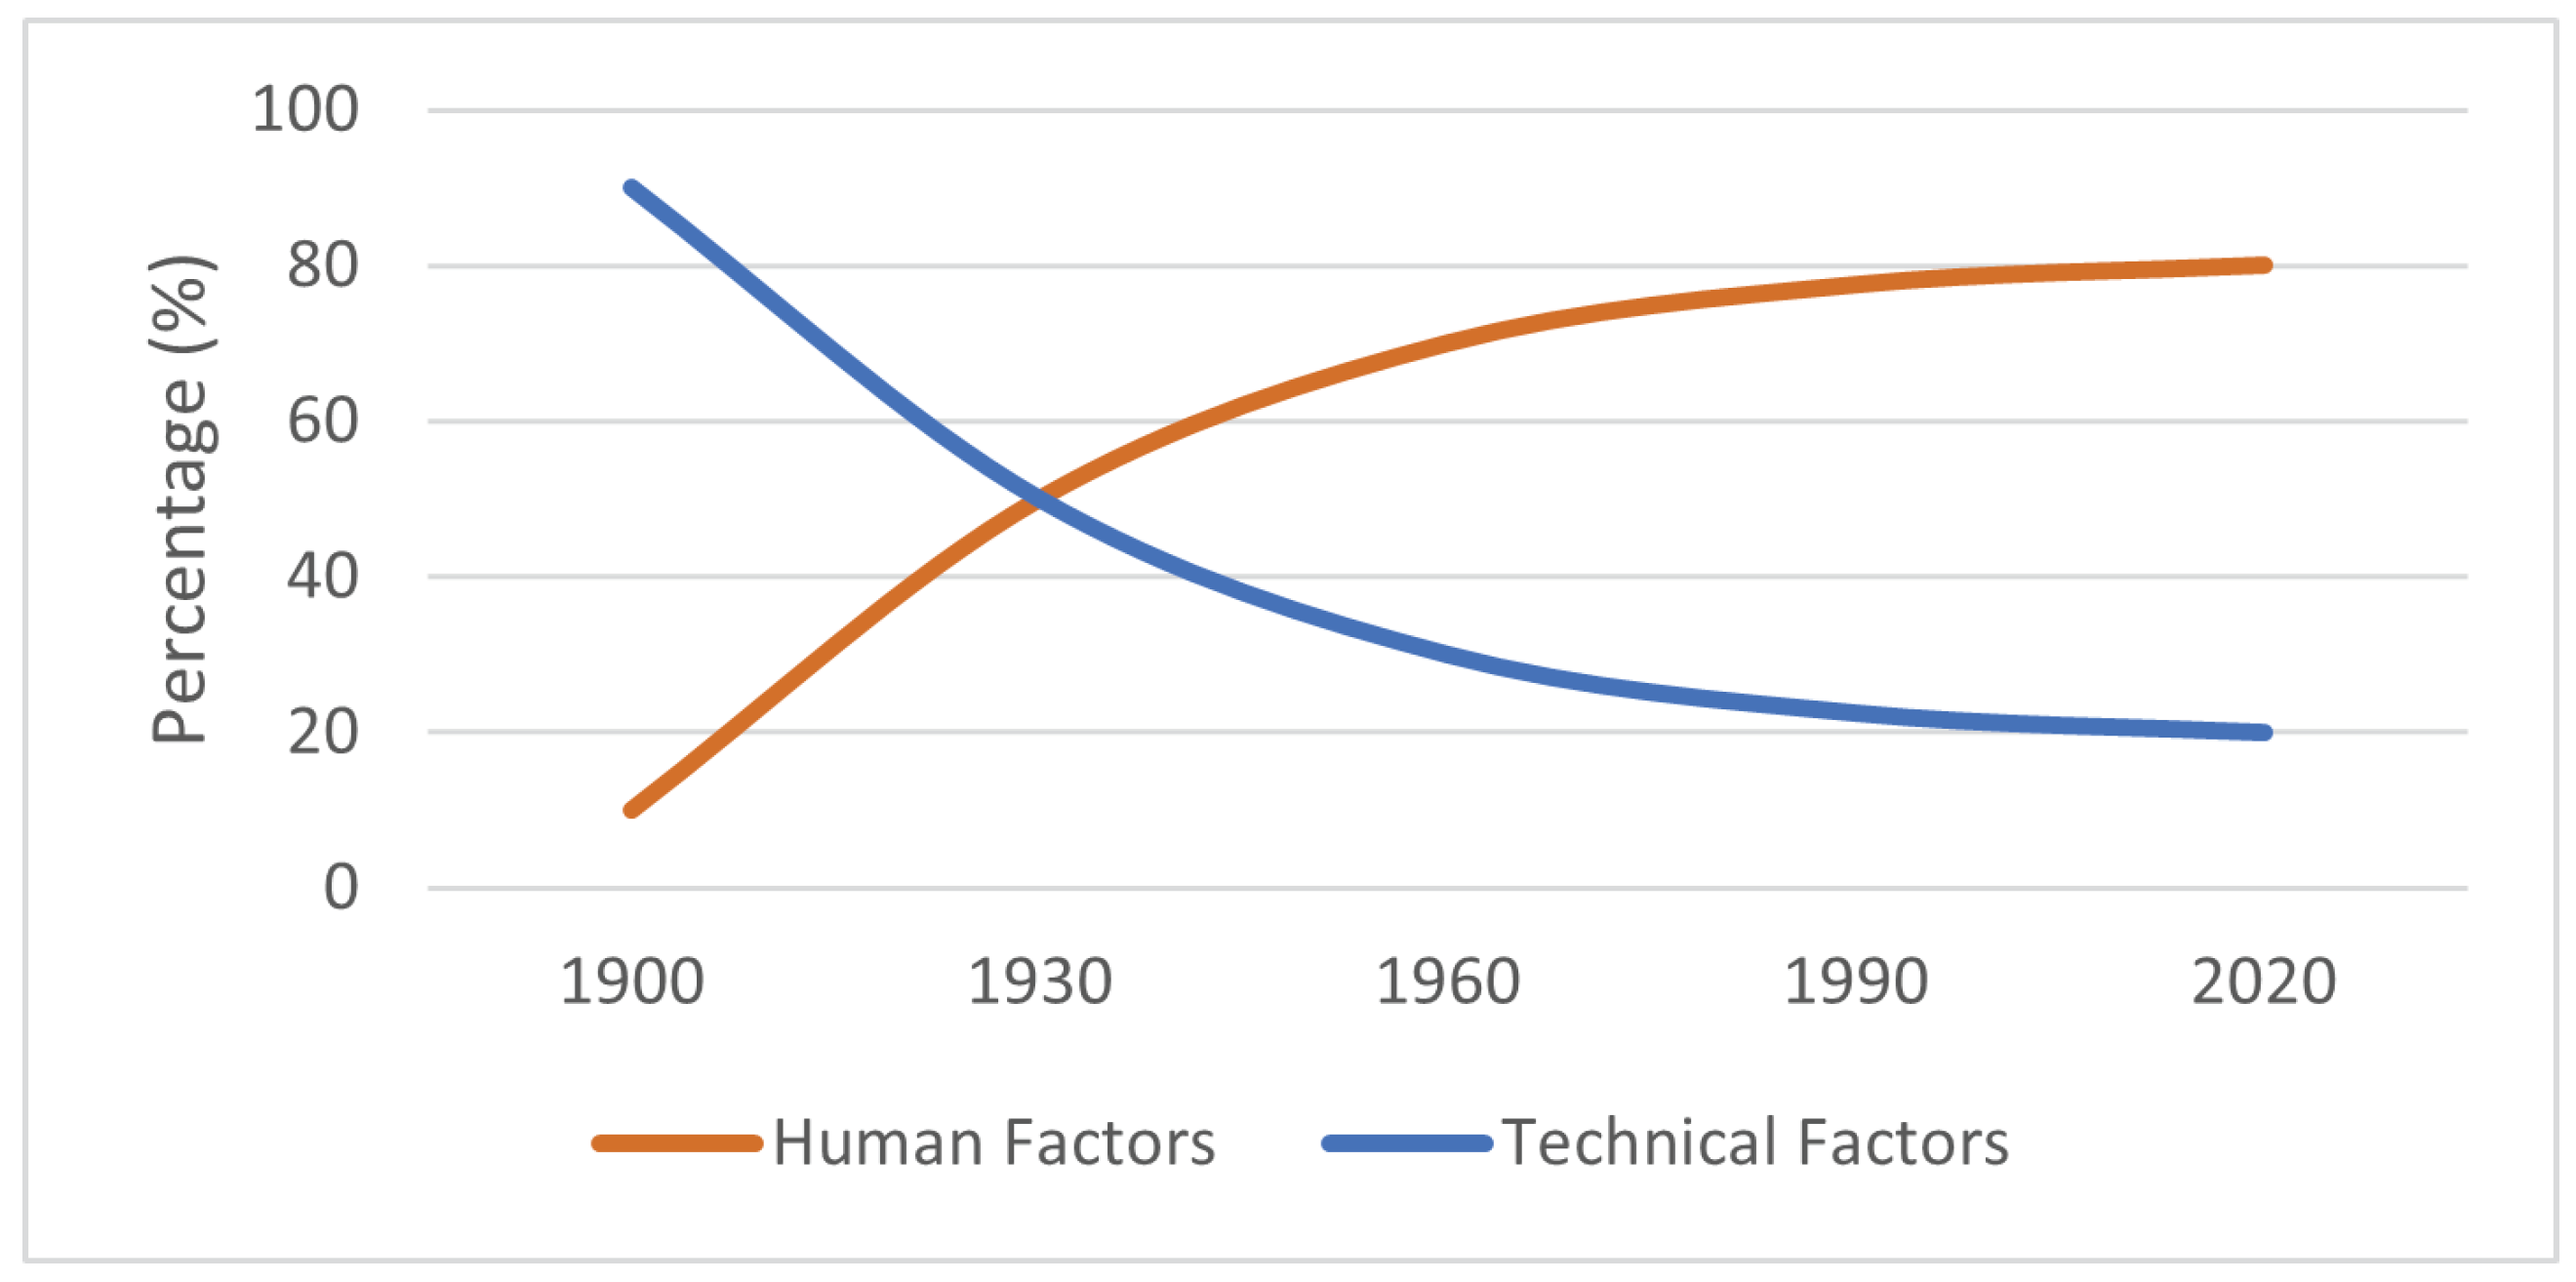
In fact, although the total number of yearly accidents has had a significant decrease over the past decades due to rapid technological developments, human factors have taken the lead as the main latent cause of the overall incidents (Figure 2) [6,9]. Studies, such as [10,11,12,13], have found pressure, fatigue, miscommunication, and a lack of technical knowledge on crucial personnel—such as maintenance workers, air crew, and air traffic controllers-to be some of the main probable causes for aviation mishaps.
In order to address these issues, international regulatory agencies compel airlines to use frameworks, such as Safety Management System (SMS) and Maintenance Resource Management (MRM), which use periodic inspections, standardized audits, and performance-based approaches to identify safety breaches [14]. Notwithstanding, according to ICAO, in 2018 there were 98 aircraft accidents for scheduled commercial air transport operations, of which 11 were fatal accidents, which resulted in 514 passenger fatalities [1]. This report still reflects a long way for aviation safety improvement. Consequently, the aviation industry should strongly adopt the strategy that “one accident is already too much”. In addition to the existing reactive tools, there is also a high need for the implementation of predictive human factor safety models that can detect and prevent high-risk situations.
Human resources management has been one of the primary focuses in the past years. ICAO, in [14], put a lot of efforts into developing an organizational framework to prevent organizational factors inducing or posing threats to aviation safety. One of the purposes of [14] is to improve, at all levels and to all industry players, the decision making, personal, environmental, and industrial processes that could lead to a potential catastrophic safety or hazard event. There are four main components of actuation. The first is the Safety Police and Objectives, where every aeronautical player must define every role, responsibilitie, and relationships outlined by the entire aviation ecosystem. The second is the Safety Risk Management, which, by definition, discloses how every player manages its risk factor, taking that there are no zero risk into account. The third is the Safety Assurance. This point deals with the organizational error capture methods. There must be several active layers of error detection. Each layer must be independent and proactive to error capturing methods. The fourth and last component is the Safety Promotion. The main driven of this last point is promoting a safety environment. This is achieved by a multitude of activities and strategies. The final objective is that every aeronautical intervenient has, in its mindset, the correct industrial standards and safety policies, adopting a safety management and reporting culture.
The European Aviation Safety Agency regulator (EASA) has, for many years now, implemented measures to reduce the levels of fatigue, especially in aircrew [15]. EASA established the minimum required rest periods, while taking the circadian biological clock into account. EASA also dictates what must be the accommodation and logistical environment for maintaining a proper rest. It also put limits for flight time, i.e., the regulator imposes weekly, monthly, and annual maximum flying hours. With this, guarantee that pilots do not overwork, avoiding the first stage of fatigue. The drawback is that every person has different biological limits and there is also a significant alteration with aging, and current regulations do not take this into account. The concern of EASA with fatigue is so high that lead to creating a cockpit control rest policy [15]. For the cockpit crew, when a sudden and unexpected fatigue event occurs, EASA has outlined what is called the controlled rest mitigating measures. The pilot in command must coordinate this in order to avoid simultaneous fatigue events. Controlled rest should be used in conjunction with other on-board fatigue management countermeasures, such as physical exercise, bright cockpit illumination at appropriate times, balanced eating and drinking, and intellectual activity. The bottom line is that regulators are now more aware of fatigue and their hazard potential to aviation. It is important to mention, like authors in [6], that aircraft maintenance crews have no such rules, posing a potential threat in this chain.
In [16], the authors describe the implementation of the FRMS (Fatigue Risk Management System), which, despite the importance of the effects of fatigue for aviation safety, remains one of the main psycho-physiological factors for accidents and incidents. The FRMS aimed to ensure alert levels on the part of the crew in order to be able to maintain the safety and performance levels, which creates a system with different types of defense, based on data that identify and implement strategies in order to mitigate it. Reveal that the traditional system that managed the fatigue of the crew was based on a maximum number of hours of work with a minimum of hours of rest required, according to the authors, reveals a simplistic way and a single defense of doing phase to the problem that is fatigue, since transport companies often require individuals to overcome their limitations in order to ensure the normal operating hours.
An increase in a common effort within the research community has been noted to develop data-based Human Reliability Assessment (HRA) processes that can produce accessible predictive indicators, while leveraging the already acquired data. However, some of these prominent processes, especially those that rely on the contents of text reports, often require manual categorization of human factor categories, an expensive and error-prone task [17,18].
The aim of this research is to contribute to better knowledge regarding how to enhance aviation safety, by developing a comprehensive methodology that is based on data mining and machine learning techniques, to identify and classify the main human factors that are causal of aviation incidents, based on descriptive text data.
The general problem of inferring taxonomic information from text data is not novel and it has been extensively explored in other fields of research, such as healthcare and journalism. Some examples of successful applications have been the prediction of patient illness based on medical notes [19,20] and automated fake news detection from internet pages [21]. Surprisingly, to our knowledge, only a few studies have tried to infer information from aviation safety reports using NLP [22].
This paper is organized, as follows. Section 2 presents a carefully conducted initial data analysis and pre-processing of the corpora, and it introduces a novel HFACS-ML framework to facilitate human factor classification on machine learning applications. Moreover, a diversified labelled set is also developed. After that, Section 3 describes how embedding techniques can be used to associate the semantic meaning between long pieces of text by comparing, in a local setting, the human factor categories of differently distanced documents. All of the work developed in Section 2 and Section 3 is outlined in Section 4, where we associate the labelled samples and document vectors with classification algorithms to infer the category of unknown documents. In a preliminary analysis, using a D2V and LS combination, we gain insight into some of the limitations that may corrupt our models, and iterate on this information to improve over the different levels. Subsequently, in Section 5, conclusions and discussion are addressed, as well as some recommendations for future work.
2. Tailored Data Analysis
In order to acquire descriptive texts containing the most recent threats to aviation safety, for this study, we gathered the last two decades (2000 to 2020) of “Probable Cause” reports from the publicly available ASN (Aviation Safety Network) database, amounting to a total of 1674 documents. Additional information on the database and report structures can be found in [23].
2.1. Human Factor Classification Framework
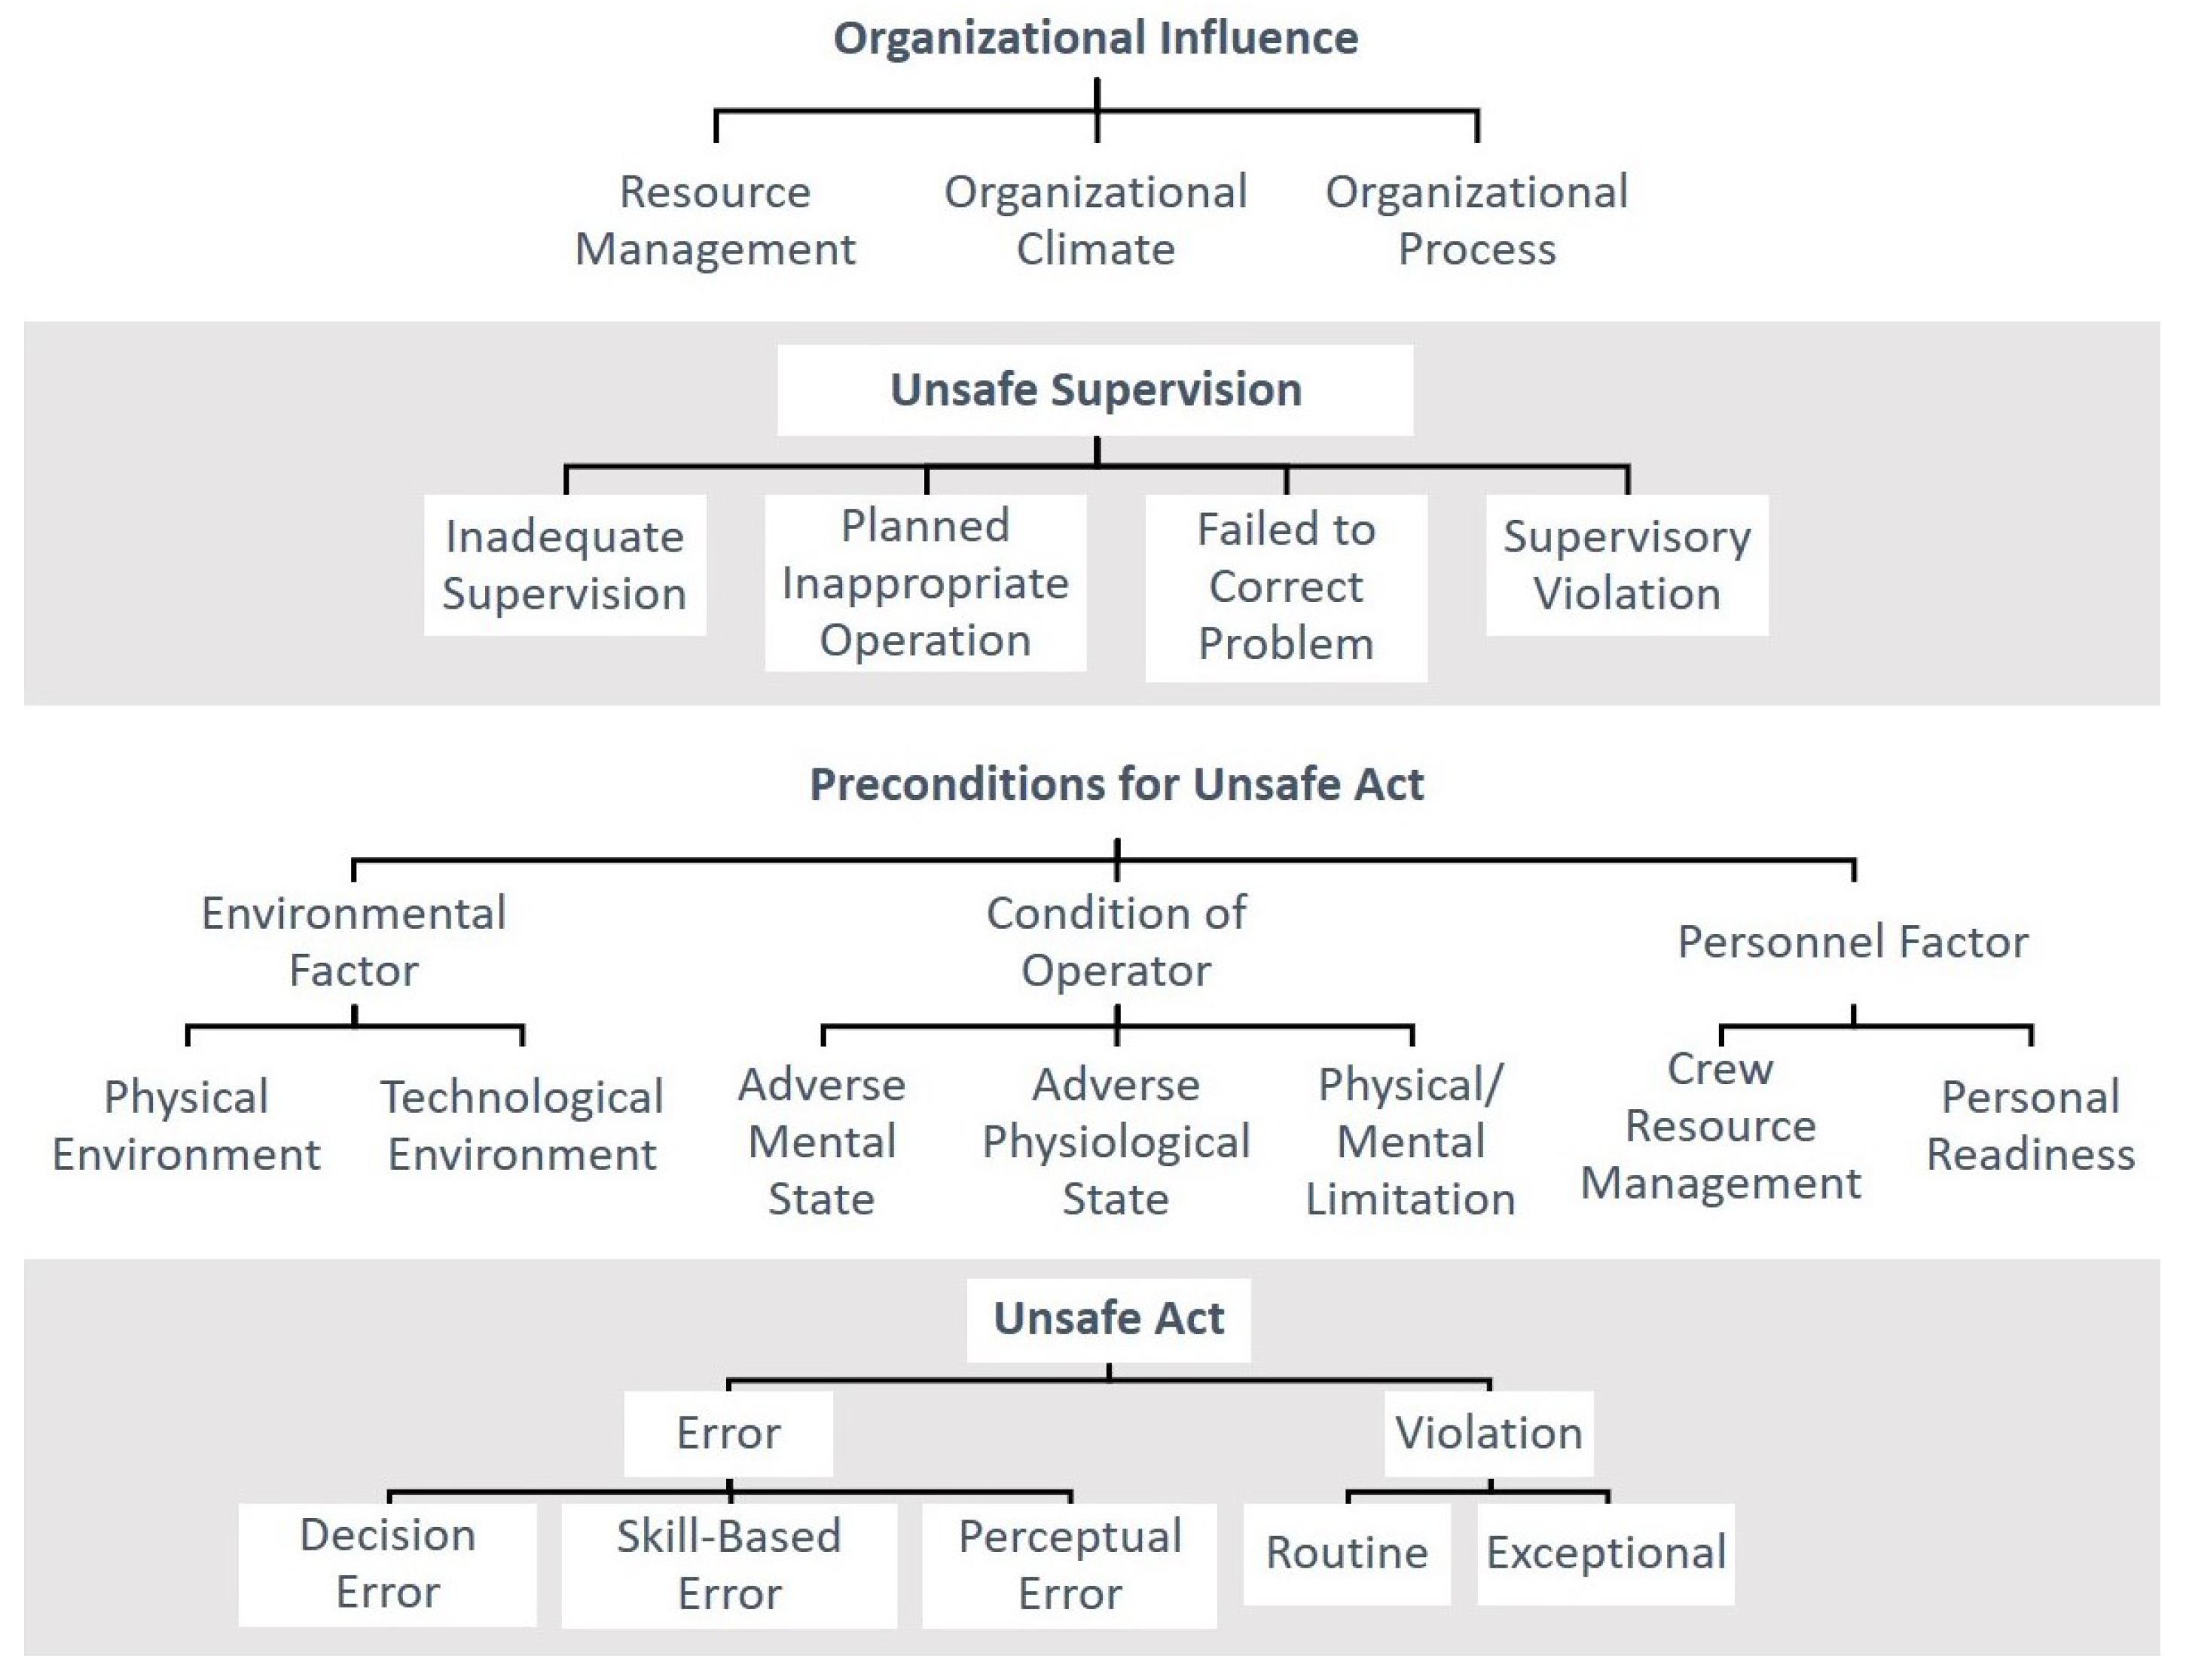
After a comprehensive examination of the database, it resulted in being clear that the content present in the text reports could not be exactly correlated to the standard Human Factor Analysis and Classification System (HFACS) [24], as shown in Figure 3. In the first place, causal factors referring to Organizational Influences are rarely mentioned in the incident investigations. This may be due to the information gap between the knowledge that is provided to investigators and the real upper-level management practices. Secondly, most of the subcategories in the original framework retract to very specific situations, whose information is often not evident in the descriptions, or might be biased to subjectivity. Finally, there are also some categories that encompass an overly broad range of distinct latent scenarios, with little in common with each other.
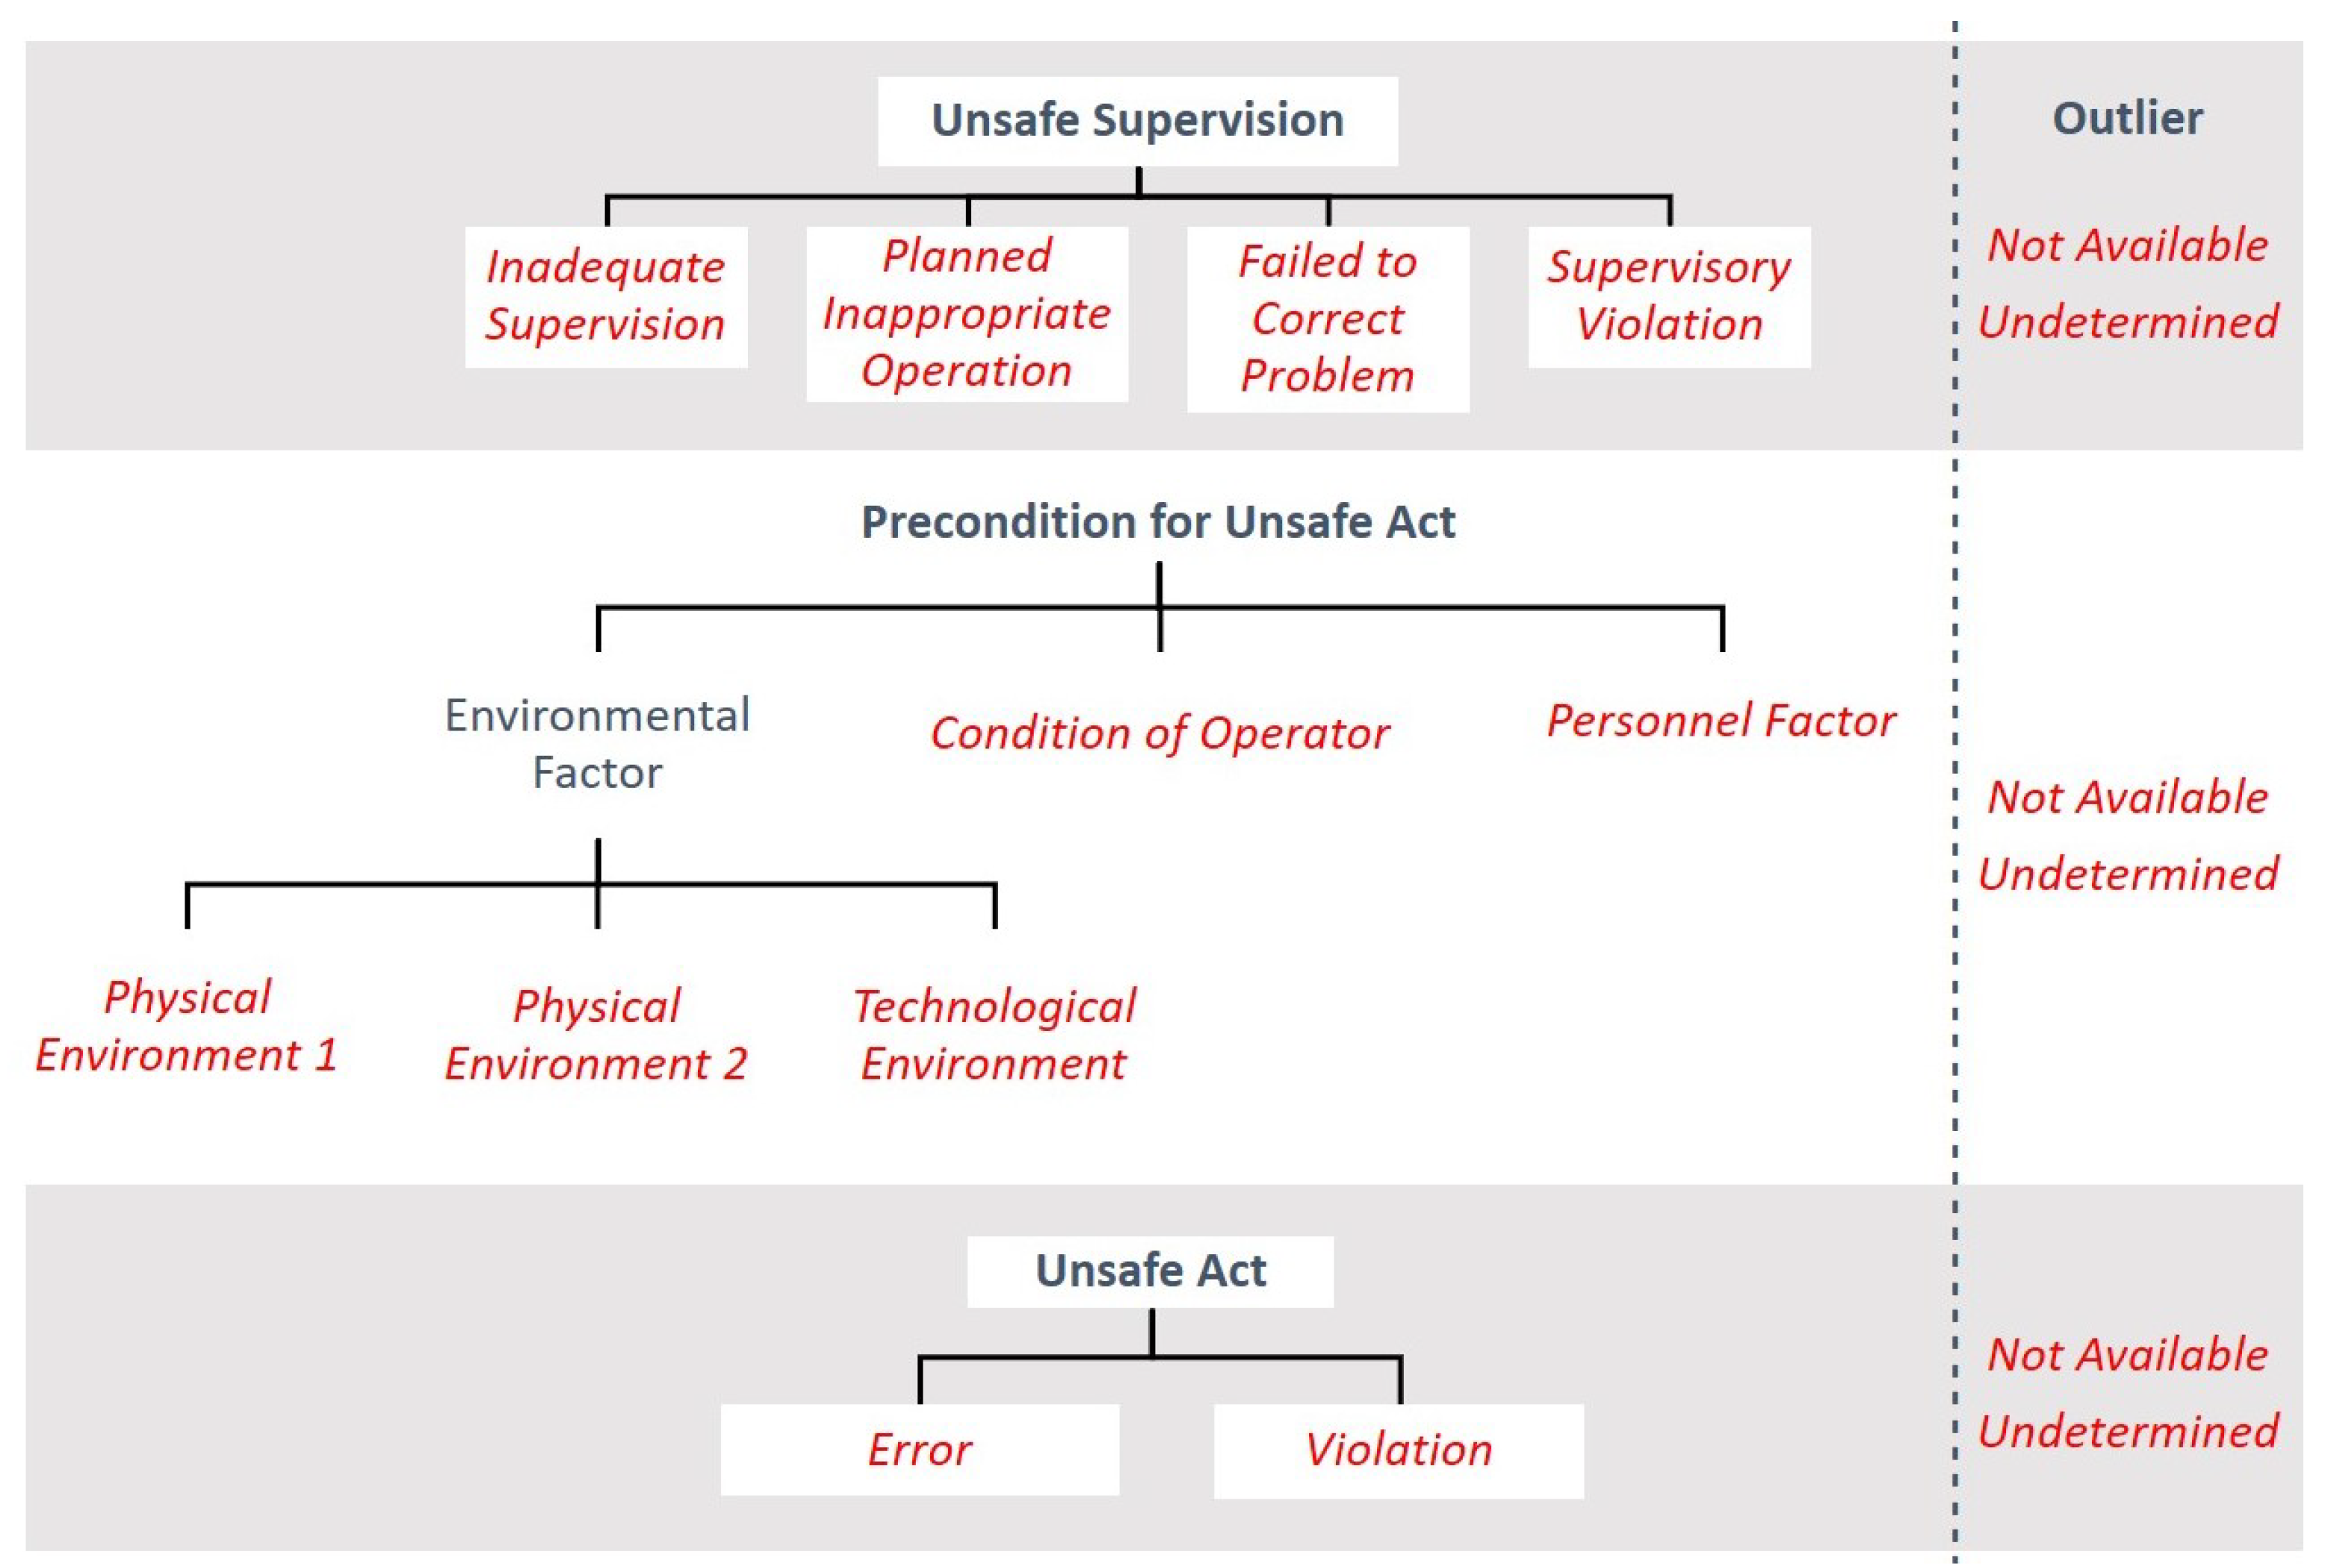
For these reasons, a variation from this framework, adapted for machine learning (ML) research, the HFACS-ML, was proposed (Figure 4). This new framework was designed to correct the previously mentioned challenges, as well as to facilitate the association between the various distinguished contexts that were found in the “Probable Cause” reports to independent human factor categories. On the one hand, categories that were not covered in the reports or whose inference had a higher tendency for subjectivity were either removed or merged to their respective upper level. On the other hand, the “Physical Environment”, which encompassed very different core vocabularies, was divided into two distinct subcategories: “Physical Environment 1”, appurtenant to weather or meteorological preconditions, and “Physical Environment 2”, related to animal interference. Lastly, outlier categories were also considered, “Not Available” (n/a) and ”Undetermined” (und), for the cases where no human factor would be mentioned in the text or the cause of the incident was explicitly undetermined. Additional descriptions of the remaining categories can be found in [24].
Note that, similarly to the original HFACS, in the proposed HFACS-ML, each document may have a minimum of zero labels and a maximum of three labels, with, at most, one label per level.
2.2. Construction of a Labelled Data Set
We constructed a labelled set using two simple and efficient approaches to enable the development and testing of predictive classification models: data-driven automated labelling and manual labelling.
In the first approach, we used keywords that are available in the database, already attributed to some of the documents, and searched for possible associations with HFACS-ML categories. For this task, a consistency criterion was defined: in the observation of 15 random documents with a certain tag, if at least 12 belonged to the same HFACS-ML category, for a certain level of the framework, then consistency was satisfied. In these cases, all of the documents that possessed that keyword would be equipped with the same human factor label for that particular level and the observed irregular samples would be manually corrected. If the consistency criterion was not satisfied for a certain tag, then no label would be attributed to any of the respective reports. Table 1 shows all keyword associations that were found to satisfy consistency and, therefore, contributed to the data-driven automated labelling.
Although a considerable amount of labels was attained through this labelling method, the distribution of the resulting set was revealed to be very imbalanced. For this reason, in order to add variety to the labelled set, a second approach, manual labelling, was also conducted. Throughout the course of this study, more than 60 documents were individually analyzed and classified onto their respective HFACS-ML categories. The result of both labelling processes lead to a total classification of 107 Unsafe Supervision labels, 370 Precondition for Unsafe Act labels, and 119 Unsafe Act Labels. Table 2 summarizes the complete label distribution.
2.3. Pre-Processing
In data mining, the presence of irrelevant information, which is often found in raw text data, is known to substantially condition the performance of predictive models. Because, to our knowledge, no studies have tried to explore which pre-processing tools result in being most efficient for aviation incident report analysis, we took inspiration from studies that were applied to other settings, such as [25,26], in order to implement a tailored pipeline. The resulting process can be summarized into three stages: Data cleaning, Normalization, and Tokenization.
In the first stage, all of the duplicate instances were removed and all incidents that originated from terrorist assaults were excluded. The reason behind the latter was based on the principle that personnel performance under malicious external threats should not be representative of their professional behaviour under conventional circumstances.
In the second stage, all of the non-English documents were translated into English, all letters were lower-cased, and punctuation was removed.
In the third stage of pre-processing, for each document, the text was parsed (or tokenized), converting each word into a single entity (or token). For this step, we chose to apply alphabetic parsing and stripped all digits from the data set. Although significant information may, at times, be derived from these characters, we found them not to provide any additional value regarding human factors, as the main relevant semantic meaning from our database was often found in word descriptions and core vocabularies. The same justification applies to punctuation removal.
After parsing, we considered the removal of stop-words. For this purpose, two lists of unwanted words were introduced. The first list, which was extracted from the publicly available documentation of [27], consisted of standard stop-words that are commonly used for the treatment of natural English data. The second list, was tailored to our data set and designed to handle introductory information, which could appear in different parts of the text. This list consisted of the following words: ’summary’, ’probable’, ’cause’, ’accident’, ’contribute’, ’factor’, ‘find’, ’conclusion’, ’translate’, ’spanish’, ’italian’, ’french’, and ’german’.
In the final step of this stage, words underwent lemmatization, a morphological process that leverages dictionary information to reduce words to their base form. This process is especially useful for feature extraction, as it simplifies the vocabulary and facilitates semantic word association. Following this process, extremely rare words appearing five or less times throughout the corpora were also ignored, as these would prove too rare to form meaningful patterns.
Together, all of the above pre-processing steps provided a significant contribution to improving data quality and reducing computational costs, by homogenizing the text and reducing noisy or unwanted information. The next section avails the result of this process.
3. Feature Extraction with NLP
Mathematical models are used to convert text segments into numerical vector projections in order to enable computers to read, decipher, and understand the semantic meaning of language data in a manner that is valuable. This process is referred to as feature extraction. A series of NLP models, specifically designed to process natural language data, have been considered to efficiently derive document projections from our “Probable Cause” reports. These models are described in the following subsections.
3.1. TF-IDF
In the Term Frequency–Inverse Document Frequency (TF-IDF) model, each feature in a document vector is associated to a single word from the vocabulary, and its value increases proportionally to the frequency of that word in the same document. However, the value of this feature is also offset by the number of documents in which that word appears. The latter concept helps to adjust for the fact that words that appear more frequently in general should be less emphasized, while others that are more domain specific should be compensated with a greater weight [28].
Formally, let be the set of distinct words in the vocabulary, each feature in a TF-IDF document vector represents the weight word w possesses for that document. Additionally, let be the frequency of the same word, in the same document, and be the total number of documents in which that word appears. The formal weight computation is given by
Despite the simplicity of this algorithm, in this overview we also present some of its biggest limitations: computational complexity increases with the size of the vocabulary; word relations are not captured; and, it has trouble handling out of vocabulary words, for the classification of new documents [29].
3.2. Word2Vec
Also known as W2V, this feature extraction algorithm, as introduced in [30], uses shallow Neural Networks (NN) to efficiently derive word embeddings (or vectors) of custom size P. It can do so through two different architectures: the Skip-Gram (SG) and the Continuous Bag of Words (CBoW).
In the first architecture, the NN is trained on the task of predicting the surrounding context words of a single target word , given a context window of size C. The objective function is given by
However, in the second architecture, the shallow NN is trained on the task of predicting a single target word , given a set of context words and a context window of size C. The corresponding objective function is
After the training process, word embeddings can be extracted from the weights of the hidden layer and then converted into document embeddings. Let be the vector projection of word w, the vector projection of an arbitrary document i, and be the set of ordered words found in that same document. The mathematical equivalent of this transformation is
Notwithstanding, another more recent approach enables the computation of document embeddings directly from NN training. This method is described in the following subsection.
3.3. Doc2Vec
First being proposed in [31], this feature extraction algorithm introduces “paragraph vectors” that act as memory devices that retain the topic of paragraphs. In our case, we use these vectors to directly portray the information from the text documents in a vector of custom size P. The underlying intuition of Doc2Vec (D2V) is that document representations should be good enough to predict the words or context of that document.
This algorithm’s two principal architectures, the Distributed Memory (DM) and the Distributed Bag of Words (DBoW), hold a high affinity to W2V’s CBoW and SG architectures, respectively. The main difference is that the document vectors from this new algorithm are directly embedded in the NN training and prediction.
3.4. Preliminary Analysis
Before moving to the classification stage, we analyzed, at a local level, how human factor categories may be inferred from the document projections generated by the previously described architectures. For this purpose, we used the widely known cosine similarity measure
to identify the five closest and three furthest documents from a randomly picked report, with reference (iD) 361, and analyzed them as to their human factors.
The set of tests conducted in this section suggest that documents with similar human factors may tend to be placed in close cosine distances, while documents with distinct human factors might tend to be placed further apart. This observation justifies the set of models, as described in the next section, designed to classify human factors of unknown documents that are based on their position in the vector space. From these local tests, we also concluded that the D2V and W2V architectures are expected to produce close to identical results, generally superior to the TF-IDF, with a slight advantage to D2V, which also proved to be the fastest method.
Note that, in order to keep using cosine distance as the primary metric of vector similarity, all of the document projections have been normalized to unit length. Therefore, excluding magnitude from their differentiation.
4. Human Factor Label Propagation
During the last years, semi-supervised learning has emerged as an exciting new direction in machine learning research. It is closely related to profound issues of how to effectively infer from a small labelled set while leveraging properties of large unlabelled data. A challenge often found in real-world scenarios, where labelled data is expensive to acquire.
In this study, we analyze how the Label Spreading (LS) algorithm may propagate information in roder to infer the intrinsic structure of the data and, therefore, predict human factors of unknown documents.
4.1. Label Spreading
As introduced in [32], this algorithm uses labelled nodes to interact as seeds that spread their information through the network, following an affinity matrix that is based on node distance and distribution. During each iteration, each node receives the information from its neighbours, while retaining a part of its initial information. The information is spread symmetrically until convergence is reached, and the label of each unlabelled point is converted to the class that has received the most information during the iteration process.
In order to define the affinity matrix, it may use a Gaussian Radial Basis Function (RBF) that is associated to a single hyper-parameter (Gamma), which defines the weight with which two document vectors may influence each other. This process is given by
and additional documentation regarding the algorithms can be found in [33].
4.2. Evaluation Metrics
Multi-class classification metrics compare the predicted results to ground truth labels not used during the training process. In this study, we established one primary metric, Micro F1 score, on which the models will be optimized, and two other complementary metrics, Macro F1 score and Precision, which will be used in order to gain deeper insights into the results. Next, follows the expressions for each of the metrics.
where A is any set of main categories from a single level of the HFACS-ML framework. Note that complementary documentation of some of the used terms can be found in [34].
4.3. Early Findings
In an initial attempt to better understand how data extraction and prediction may be improved, an initial categorization experiment was globally carried out, utilizing the baseline D2V DBoW embedding model, together with the LS classifier.
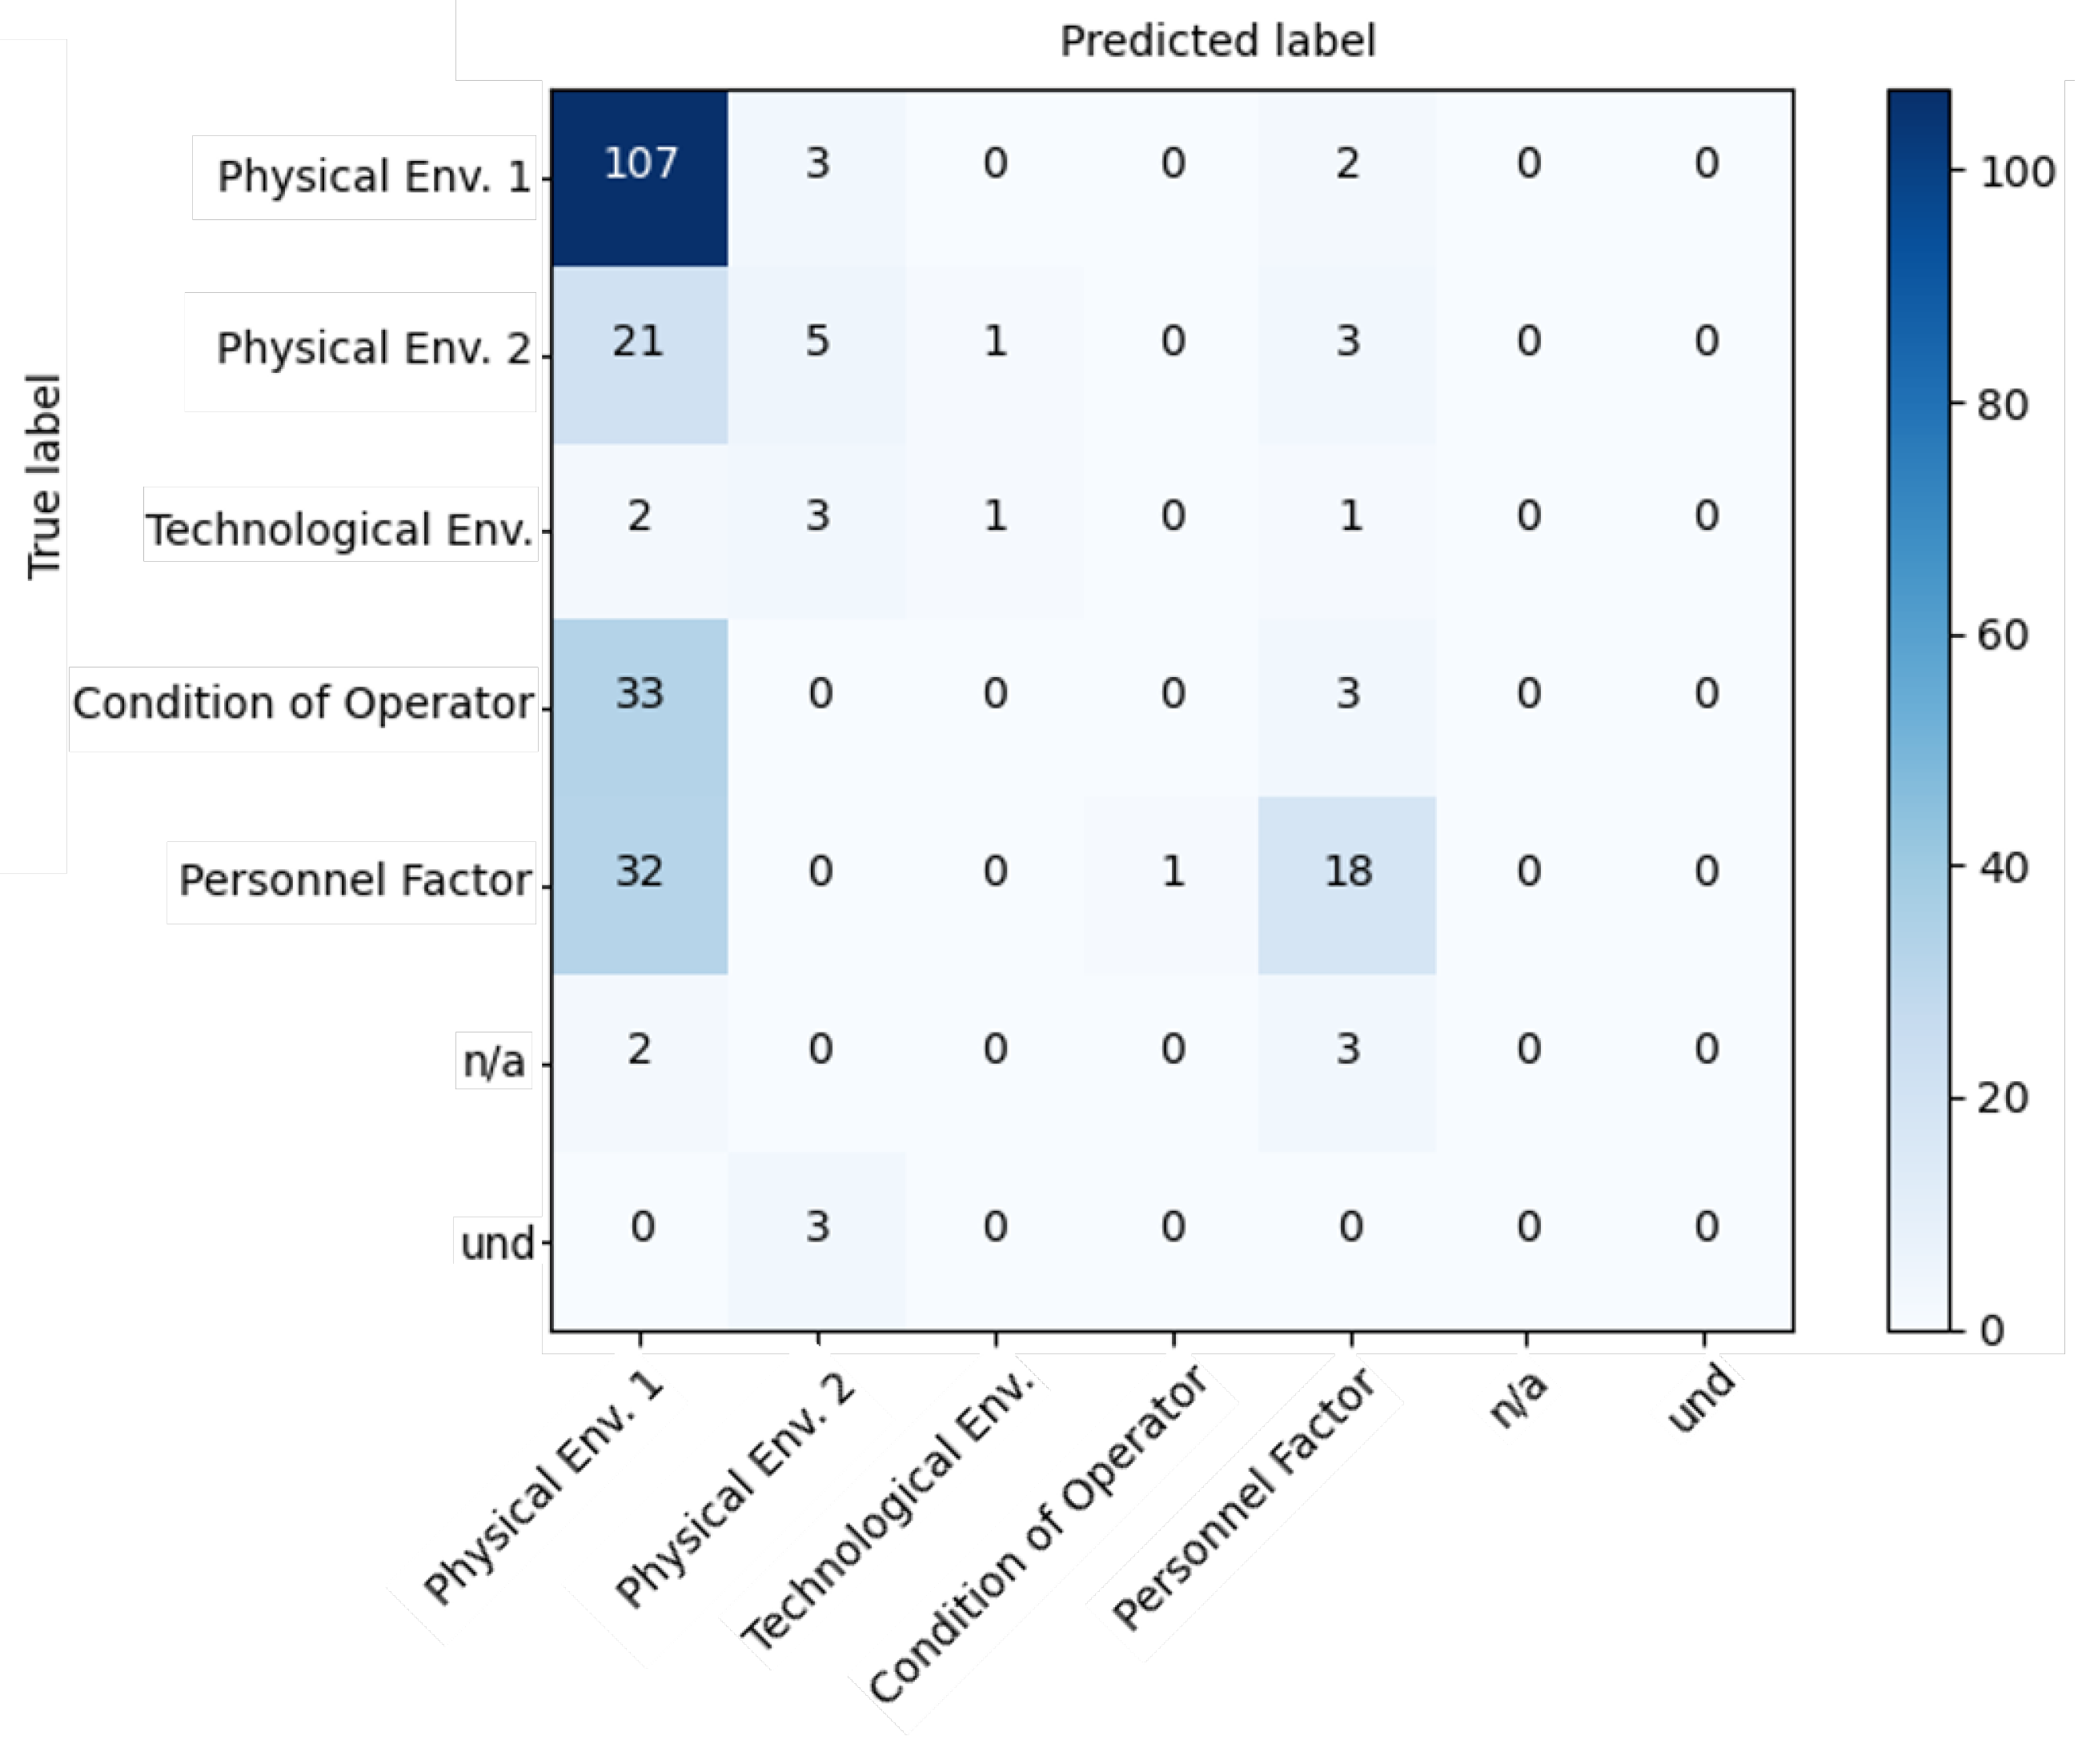
For this experiment, we availed the previously labelled data and split it into train and test sets, in a stratified manner, over different train sizes (). Figure 5 shows the confusion matrix appurtenant to the best result from the Precondition for Unsafe Act level, at .
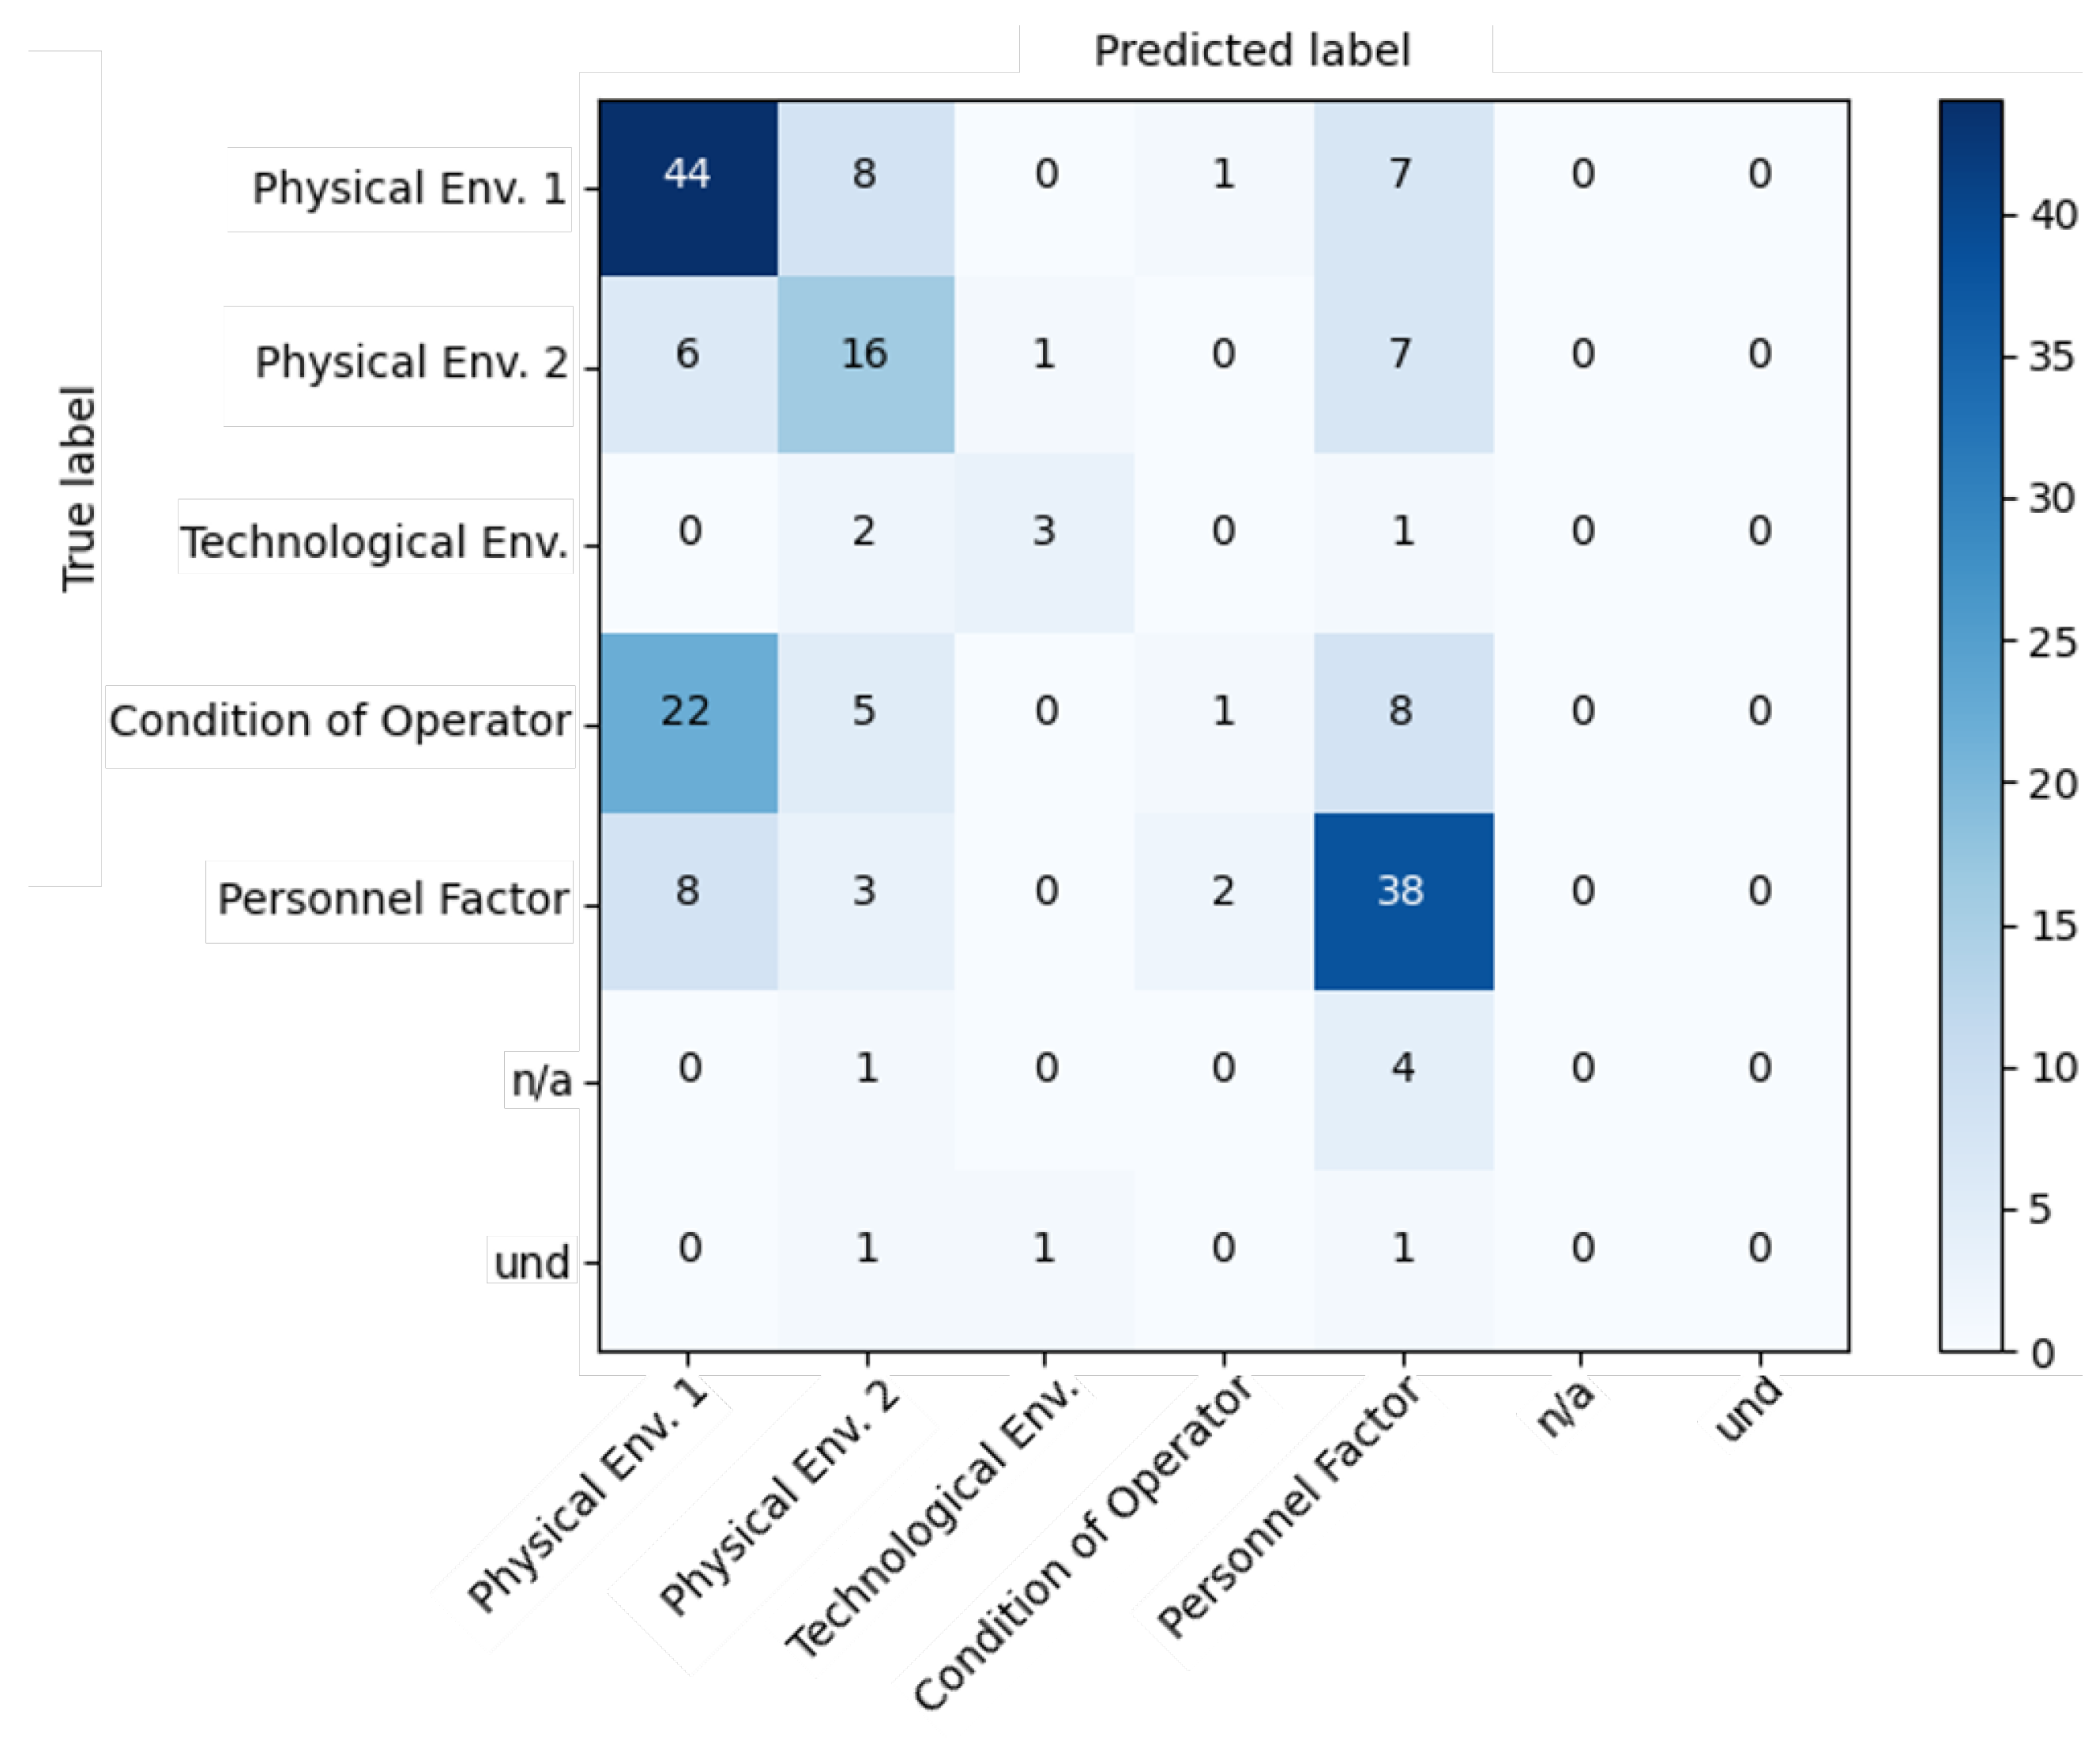
From Figure 5 it may be immediately noticed that our multi-class classification system is largely affected by class imbalance. Because of this factor, especially evident for the exhibited level, we decided to down-sample the “Physical Env. 1” category to an order of magnitude more similar to that of the other categories. Figure 6 shows the subsequent results.
It is interesting to note, from Figure 6, that class balance and prediction evenness were considerably improved from down-sampling. Although the Micro F1 score remained roughly the same, around , the Macro F1 score increased from to .
Another observed irregularity, transversal to all levels of the framework, was the inefficiency of the outlier category ’und’ to predict documents of the same class. Because it failed its purpose and only contributed to adding noise to the system, the documents related to this category were removed for the rest of the study and the category was excluded from the framework.
4.4. Hyper-Parameter Impact Analysis
Hyper-parameter tuning is a procedure often followed by algorithm designers to improve model performance. Yet, the tuning complexity grows exponentially with the number of hyper-parameters and for certain scenarios, such as the present one, where this number is particularly large, a selection has to be made [35]. For this reason, we considered the functional Analysis of Variance (fANOVA) [36,37] to help us narrow down which hyper-parameters account for the biggest impact on the objective function and, therefore, hold a higher need for tuning.
Because this approach requires the use of empirical data, we ran a random search with 350 different states, registering, for each state, the performance score (Micro F1) and the respective hyper-parameter configuration. Table 5 shows the list of hyper-parameters, range, scale, and type. Note that these trials were conducted on the Unsafe Act level. It was expected to provide the most reliable observations due to being the most even of the framework.
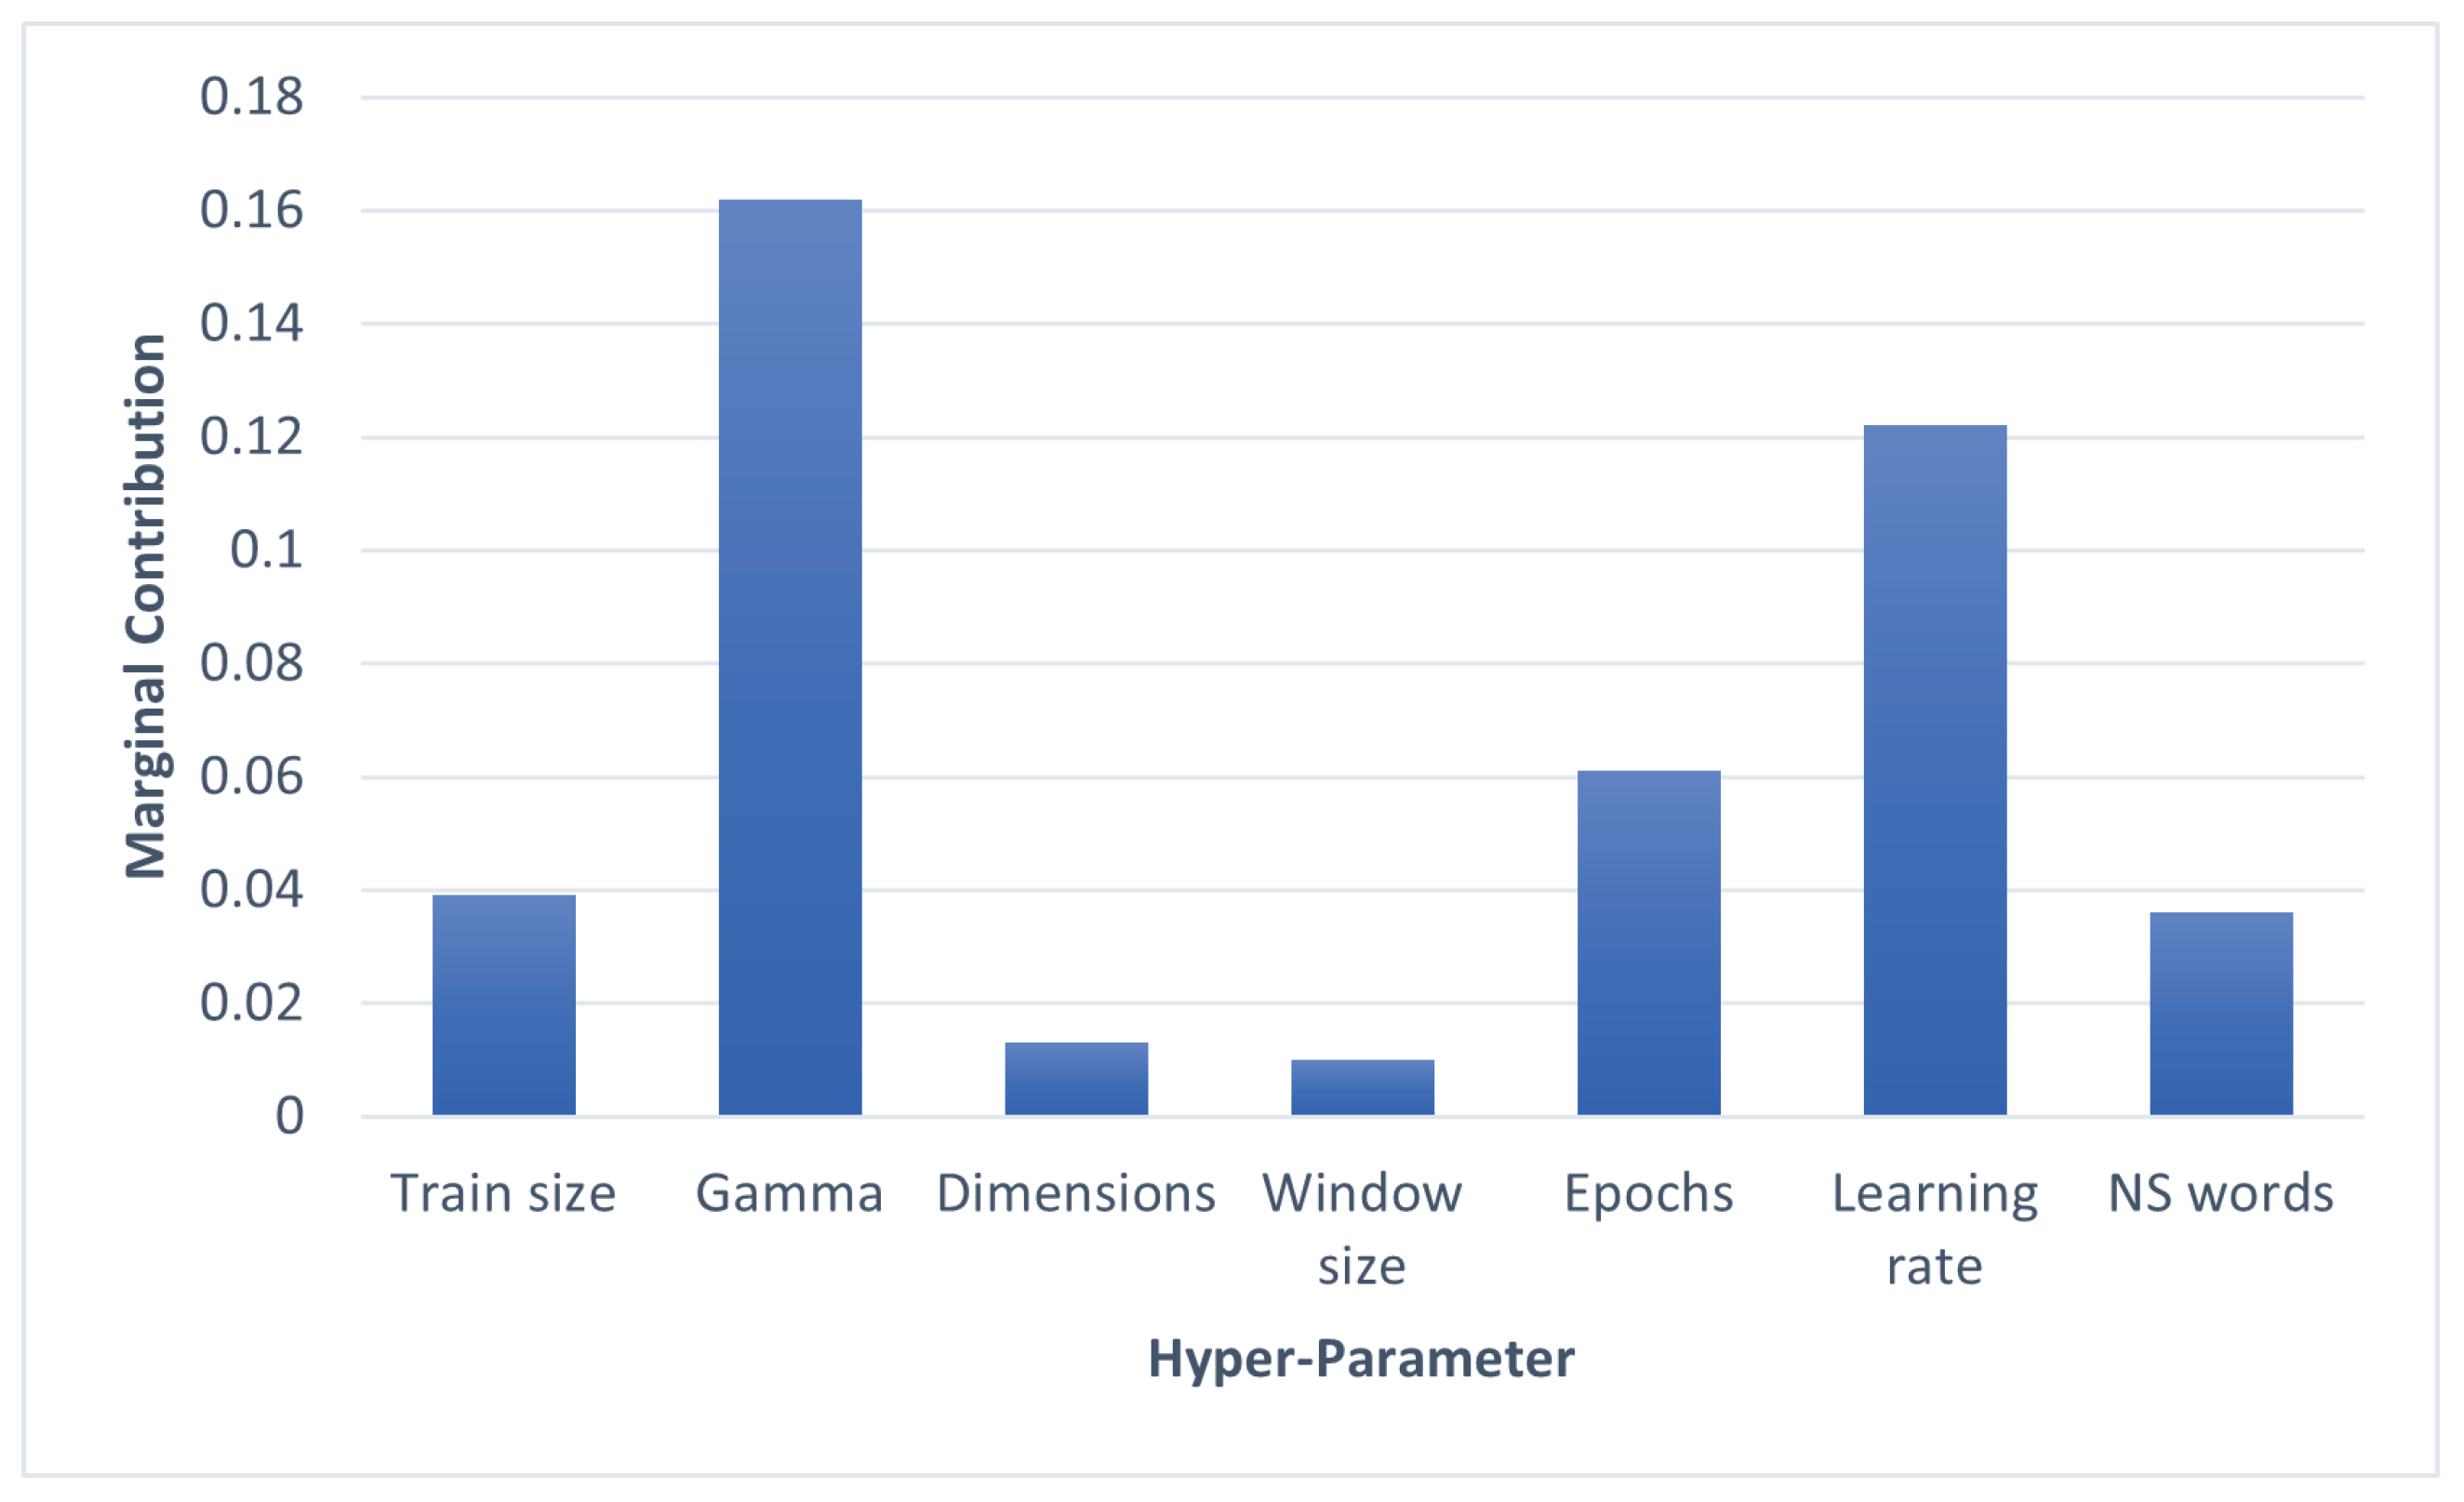
After fitting our empirical data into the fANOVA process, we obtained the marginal contribution of each hyper-parameter (Figure 7). Note that the marginal contribution can be interpreted as the relative importance of a certain variable over the final objective function.
From the bar plot that is exhibited in Figure 7, it may be observed that, even in high-dimensional cases, most performance variations are attributable to just a few hyper-parameters—in this case , Learning rate and Epochs—while others, such as Dimensions and Window size, seem to possess a much lower influence. These results are availed in the next subsection.
4.5. Bayesian Optimization
There exist a variety of industry-standard optimization approaches. In this work, we consider the automatic Bayesian optimization algorithm due to its ability to use previous objective function observations to determine the most probable optimal hyper-parameter combinations [38,39]. This approach falls into a class of optimization algorithms, called Sequential Model-Based Optimization (SMBO), and it is capable of balancing exploitation versus exploration of the search space, for either sampling points that are expected to provide a higher score or regions of the configuration space that have not yet been explored.
With the aim of improving comprehension and steadily test the potentialities of Bayesian optimization, we ran this algorithm multiple times with an incremental number of free variables. For this implementation, we followed the order that was suggested by the fANOVA results (Figure 7), prioritizing hyper-parameters with higher marginal contributions. Note that the procedure that is shown in this subsection retracts again to the Unsafe Supervision level, but it has been replicated for all levels of the framework.
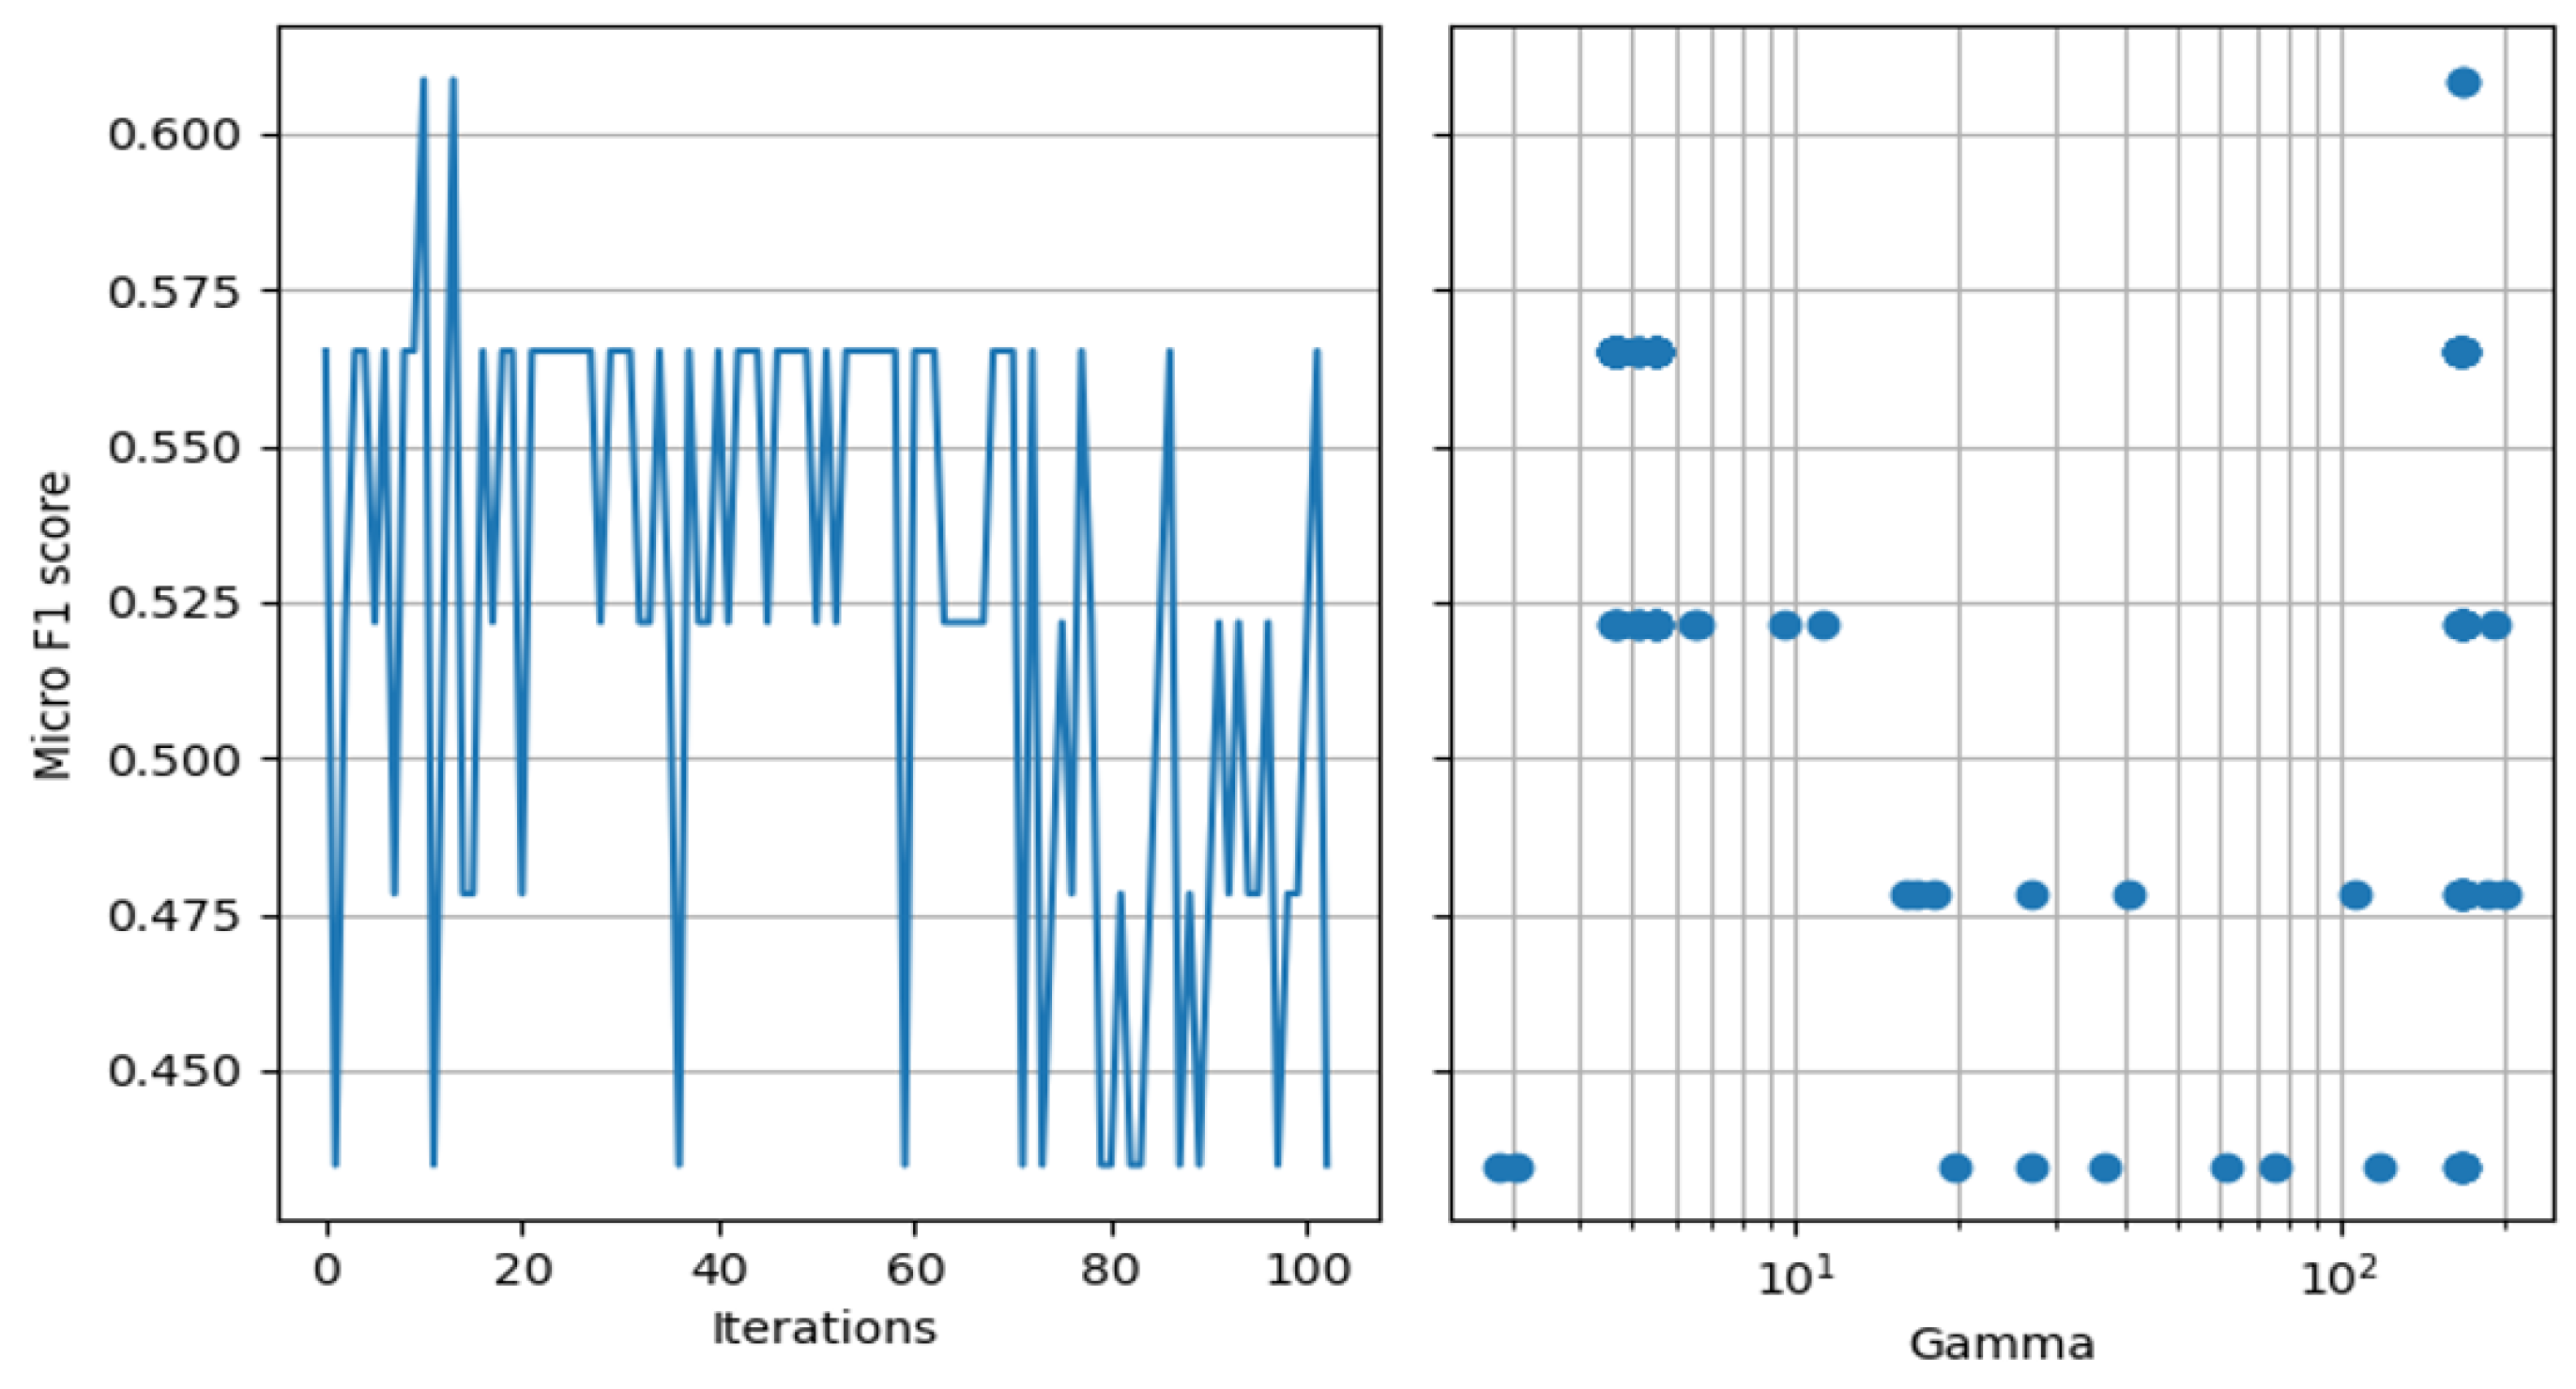
Starting with , Figure 8 illustrates how the Bayesian optimization algorithm performs with one free variable, over a total of 100 iterations (shown on the left), and how it explores the relaxed state space (shown on the right).
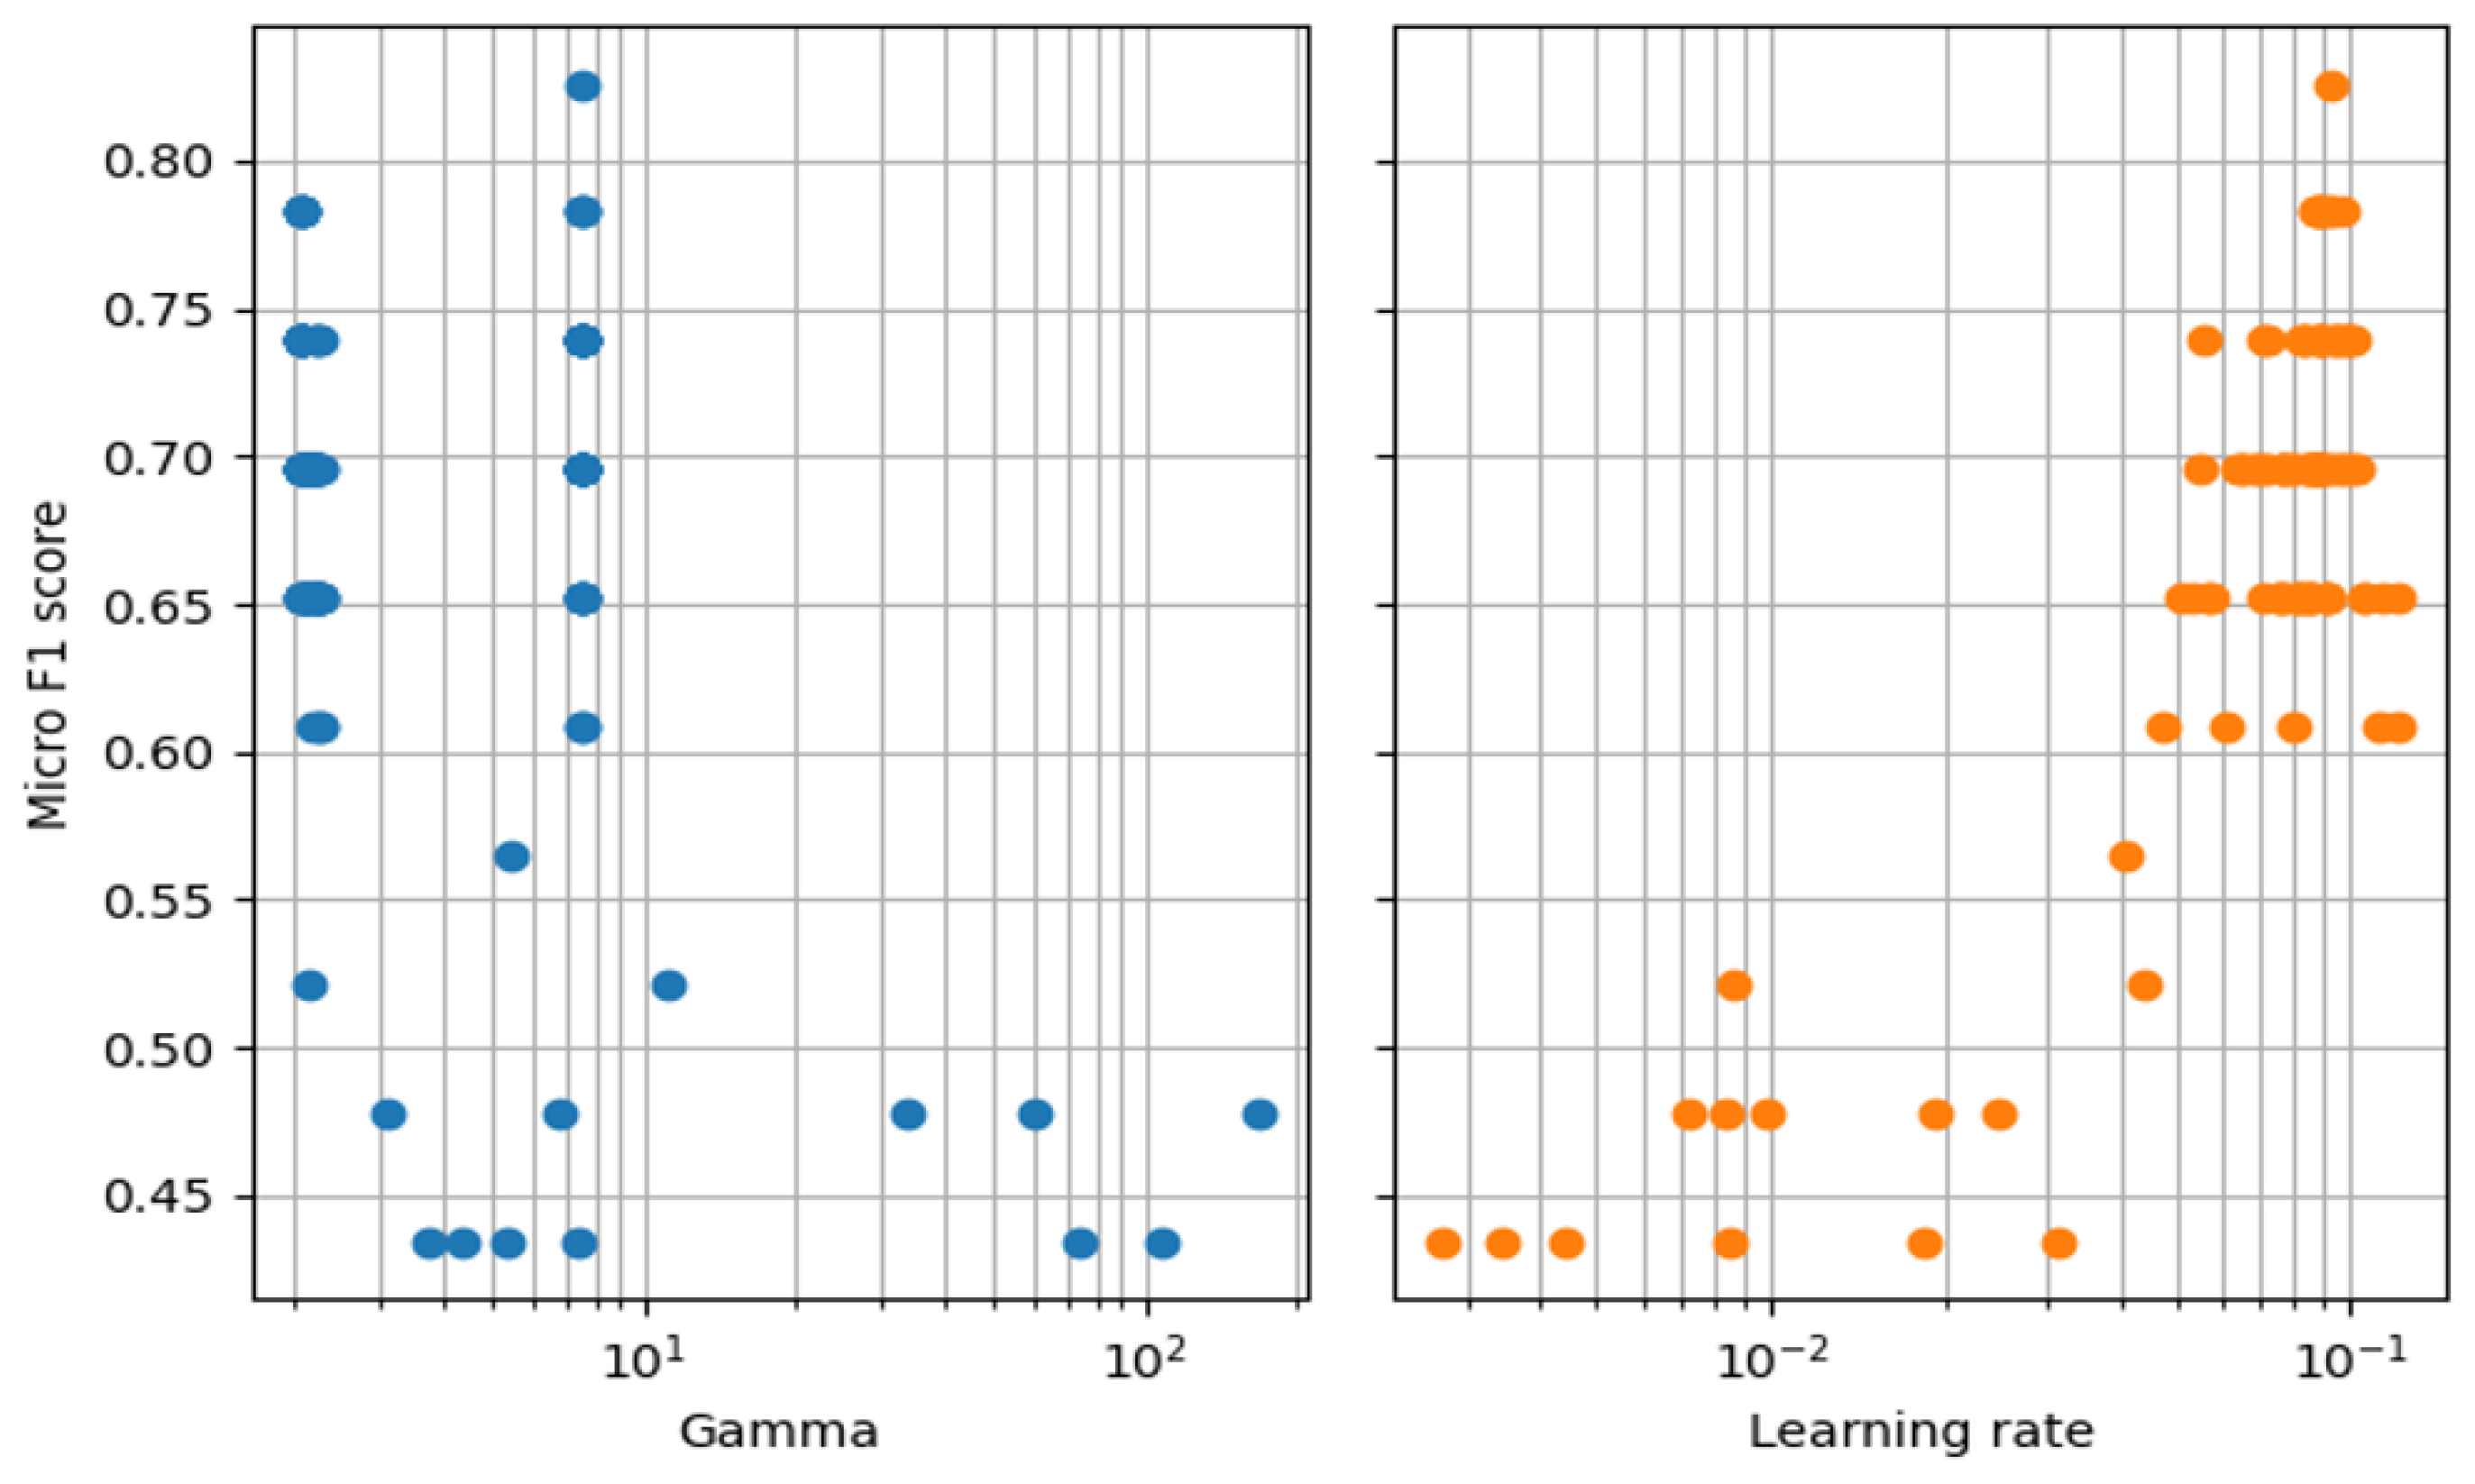
From Figure 8, it can be observed that, although the optimization algorithm explores different regions of the state space, the best achieved result of is still not enough to be considered a robust model. In order to broaden the search scope, we ran the Bayesian optimization algorithm once again, but now with an additional free variable, Learning rate. Figure 9 shows the subsequent search distribution for both of the variables.
A far better result of can be observed from this new configuration. We may also note from the data distribution that has been explored in some of the same regions, as in the previous iteration, but with a drastically different outcome. This is an evident reflection of the high association between the two variables.
The final outcome did not necessarily increase alongside the number of free variables. Similar values from the previous one were registered with three and four free variables, reaching a global best of at four free variables. However, only lower values were obtained with five, six, and seven free variables, reaching as low as in these tests. This may suggest a limit to the Bayesian optimization approach for highly complex search spaces.
4.6. Metric Results
We took the best results from the Bayesian optimization models and compared them against other baseline embedding and classification techniques in order to test the effectiveness of the developed human factor classification algorithm. For this, we tried the previously tested TF-IDF as a D2V substitute to represent the document vectors, and added a Support Vector Machine (SVM) as a potential substitute of LS for the task of vector classification. We also included the results from our non-optimized baseline model, D2V DBoW NS + LS, after ‘und’ removal in order to make it a fair comparison.
Additionally, we took advantage of the random search infrastructure, which was initially built for the fANOVA process, and retrained all the embeddings on this search mechanism, adding another widely used optimization method for the analysis. The final comparison for each level of the framework is summarized in Table 6, Table 7 and Table 8, respectively.
From the results that are observed in Table 6, Table 7 and Table 8, we distinctively attribute the best performance to the Bayesian optimization approach, which exhibited much better results than the baseline model. Comparatively, a random search provided acceptable results for a high enough number of iterations, but it did not prove to be as optimal or consistent.
As for the comparison between models, various conclusions may be extracted. In a primary analysis, it can be observed that the DBoW architecture generally performed slightly better than the DM for the current data set. In a second inspection, it can also be observed that the supervised SVM did not perform as well against class imbalance, always presenting the lowest Macro F1 scores. In contrast, a surprisingly good result came from the baseline TF-IDF + LS model, significantly surpassing the baseline D2V DBoW NS + LS on two levels of the framework. Due to this result, we also explored optimizing this model. However, it did not surpass the best results, as described in Table 6, Table 7 and Table 8, for any of the experiments.
5. Conclusions and Discussion
The results that were obtained in this study showed that the semi-supervised LS algorithm was an appropriate classifier for the current setting, particularly in the levels with fewer labels. We do not discard the potential of the supervised SVM, for the same purpose, but note that it might prove to be more reliable for larger and more even labelled data sets. Surprisingly, the TF-IDF model was also observed to be an interesting alternative to D2V, for some levels of the framework, although it also proved to be more computationally expensive due to its high dimensionality.
The usefulness of Bayesian optimization, when properly tuned, for finding near-optimal hyper-parameter combinations over non-convex objective functions, is the final relevant conclusion to be taken from this study. The fANOVA marginal contribution analysis was also crucial for this purpose, providing valuable insight into the most influential hyper-parameters.
In this paper, a novel HFACS-ML framework is proposed. In future work, it would be interesting to perform a study comparing how it would stack against the original HFACS, on the same task. It could also be pertinent to investigate how different variations from these frameworks could better fit other machine learning applications and data sets.
The inclusion of a larger labelled and unlabelled data set is another concept that should also be considered, in order to understand how this work could perform in a scaled scenario. This fact also motivates further research regarding other approaches for constructing labelled data sets. Active Learning is an interesting alternative to the methods used, which is a methodology that prioritizes the labelling of uncertain points, instead of randomly selected documents, so as to optimize convergence of label propagation algorithms.
Finally, feature selection analysis, such as redundancy and noise, should be carried out in greater depth. In the particular case of the developed models, this is a very important topic, since these operate based on the quality and size of the vocabulary. More work can also be done in regards to the exploration of other types of feature extraction and classification algorithms, as well as their respective combinations.
Author Contributions
T.M.: methodology, software, investigation, data curation, writing original draft preparation, visualization; R.M.: conceptualization, methodology, validation, investigation, data curation, writing review and editing, supervision; D.V.: conceptualization, methodology, validation, investigation, writing review and editing, supervision; L.S.: validation, investigation, writing review and editing, funding acquisition. All authors have read and agreed to the published version of the manuscript.
Funding
This work was supported by FCT, through IDMEC, under LAETA, project UIDB/50022/2020; FCT through ICT (Institute of Earth Sciences) project, project UIDB/04683/2020; UNIVERSITAS, ISEC Lisboa.
Acknowledgments
The authors would like to acknowledge Harro Ranter for kindly providing access to the ASN database for this research.
Conflicts of Interest
The authors declare no conflict of interest.
References
- ICAO. The World of Air Transport in 2018. 2018. Available online: https://www.icao.int/annual-report-2018/Pages/the-world-of-air-transport-in-2018.aspx (accessed on 31 December 2020).
- EuroControl. Covid-19 Impact on the European Air Traffic Network. 2020. Available online: https://www.eurocontrol.int/covid19 (accessed on 31 December 2020).
- Mazareanu, E. Global Air Traffic—Scheduled Passengers 2004–2021, Statista. 2020. Available online: https://0-www-statista-com.brum.beds.ac.uk/statistics/564717/airline-industry-passenger-traffic-globally (accessed on 31 December 2020).
- Josephs, L. Delta is Hiring 12,000 through 2020 as Airline Expands Operations. 2019. Available online: https://www.cnbc.com/2019/10/10/delta-is-hiring-12000-through-2020-as-airline-expands-operations-ceo-says.html (accessed on 31 December 2020).
- Singh, S. 2019: The Year United Airlines eXpanded into New Markets. 2019. Available online: https://simpleflying.com/2019-the-year-united-airlines-expanded-into-new-markets/ (accessed on 31 December 2020).
- Santos, L.F.F.M.; Melicio, R. Stress, pressure and fatigue on aircraft maintenance personal. Int. Rev. Aerosp. Eng. (IREASE) 2019, 12, 35. [Google Scholar] [CrossRef]
- Borden, T.; Akhtar, A.; Hadden, J.; Bose, D. The Coronavirus Outbreak Has Triggered Unprecedented Mass Layoffs and Furloughs. Here are the major companies that have announced they are downsizing their workforces. 2020. Available online: https://www.businessinsider.com/coronavirus-layoffs-furloughs-hospitality-service-travel-unemployment-2020 (accessed on 31 December 2020).
- Reed, D. As Layoffs Of More Than 30,000 Workers Begin, U.S. Airlines Will Never Be The Same. 2020. Available online: https://www.forbes.com/sites/danielreed/2020/10/01/airline-layoffs-american-united-southwest/ (accessed on 31 December 2020).
- Satow, R.L. The Role of Human Factors in Improving Aviation Safety. AERO 1999, 8. Available online: http://www.boeing.com/commercial/aeromagazine/aero_08/human.pdf (accessed on 31 December 2020).
- Latorella, K.A.; Prabhu, P.V. A review of human error in aviation maintenance and inspection. Int. J. Ind. Ergon. 2000, 26, 133–161. [Google Scholar] [CrossRef]
- Schreiber, F. Human Performance—Error Management. 2007. Available online: https://skybrary.aero/bookshelf/books/1640.pdf (accessed on 31 December 2020).
- Council, N.R. Improving the Continued Airworthiness of Civil Aircraft: A Strategy for the FAA’s Aircraft Certification Service; The National Academies Press: Washington DC, USA, 1998. [Google Scholar]
- Othman, N.; Fairuz, I. Mental Workload Evaluation of Aircraft Operators’ Using Pupil Dilation and Nasa-Task Load Index. Int. Rev. Aerospace Eng. 2016, 9, 80. [Google Scholar] [CrossRef]
- ICAO. Annex 19 to the Convention on International Civil Aviation—Safety Management; ICAO: Montréal, QC, Canada, 2013. [Google Scholar]
- EASA, Part-ORO, Subpart FTL, Regulation (EU) 965/2012 on air operations; European Commision: Brussels, Belgium, 2019.
- Lee, S.; Kim, J.K. Factors contributing to the risk of airline pilot fatigue. J. Air Transp. Manag. 2018, 67, 197–207. [Google Scholar] [CrossRef]
- Hsiao, Y.L.; Drury, C.; Wu, C.; Paquet, V. Predictive models of safety based on audit findings: Part 1: Model development and reliability. Appl. Ergon. 2013, 44, 261–273. [Google Scholar] [CrossRef]
- Hsiao, Y.L.; Drury, C.; Wu, C.; Paquet, V. Predictive models of safety based on audit findings: Part 2: Measurement of model validity. Appl. Ergon. 2013, 44, 659–666. [Google Scholar] [CrossRef]
- Pham, T.; Tran, T.; Phung, D.; Venkatesh, S. Predicting healthcare trajectories from medical records: A deep learning approach. J. Biomed. Inform. 2017, 69, 218–229. [Google Scholar] [CrossRef]
- Liu, J.; Zhang, Z.; Razavian, N. Deep EHR: Chronic Disease Prediction Using Medical Notes. In Proceedings of the 3rd Machine Learning for Healthcare Conference, PMLR, Palo Alto, CA, USA, 17–18 August 2018; Volume 85, pp. 440–464. [Google Scholar]
- Masciari, E.; Moscato, V.; Picariello, A.; Sperli, G. A deep learning approach to fake news detection. In Lecture Notes in Computer Science, Proceedings of the Foundations of Intelligent Systems, Graz, Austria, 23–25 September 2020; Helic, D., Leitner, G., Stettinger, M., Felfernig, A., Raś, Z.W., Eds.; Springer: Cham, Switzerland, 2020; Volume 12117, pp. 113–122. [Google Scholar] [CrossRef]
- Tanguy, L.; Tulechki, N.; Urieli, A.; Hermann, E.; Raynal, C. Natural language processing for aviation safety reports: From classification to interactive analysis. Comput. Ind. 2016, 78, 80–95. [Google Scholar] [CrossRef] [Green Version]
- ASN. ASN Aviation Safety Database. 2020. Available online: https://aviation-safety.net/database/ (accessed on 31 December 2020).
- Wiegmann, D.A.; Shappell, S.A. A Human Error Approach to Aviation Accident Analysis. The Human Factors Analysis and Classification System; Ashgate Publishing Limited: Aldershot, UK, 2003. [Google Scholar]
- Uysal, A.K.; Gunal, S. The impact of preprocessing on text classification. Inf. Process. Manag. 2014, 50, 104–112. [Google Scholar] [CrossRef]
- Vajjala, S.; Majumder, B.; Gupta, A.; Surana, H. Practical Natural Language Processing: A comprehensive Guide to Building Real-World NLP Systems; O’Reilly Media: Sebastopol, CA, USA, 2020. [Google Scholar]
- Bird, S. Nltk 3.5. 2020. Available online: https://pypi.org/project/nltk/ (accessed on 31 December 2020).
- Spärk Jones, K. A statistical interpretation of term specificity and Its application in retrieval. J. Doc. 1972, 28, 11–21. [Google Scholar] [CrossRef]
- Kusner, M.; Sun, Y.; Kolkin, N.; Weinberger, K. From word embeddings to document distances. In Proceedings of the 32nd International Conference on Machine Learning, PMLR, Lille, France, 7–9 July 2015; Volume 37, pp. 957–966. [Google Scholar]
- Mikolov, T.; Chen, K.; Corrado, G.S.; Dean, J. Efficient estimation of word representations in vector space. In Proceedings of the 1st International Conference on Learning Representations, Scottsdale, AZ, USA, 2–4 May 2013; Bengio, Y., LeCun, Y., Eds.; pp. 1–12. [Google Scholar]
- Le, Q.V.; Mikolov, T. Distributed representations of sentences and documents. In Proceedings of the 31st International Conference on Machine Learning, PMLR, Beijing, China, 22–24 June 2014; Volume 32, pp. 1188–1196. [Google Scholar]
- Zhou, D.; Bousquet, O.; Lal, T.; Weston, J.; Schölkopf, B. Learning with local and global consistency. In Advances in Neural Information Processing Systems; Thrun, S., Saul, L., Schölkopf, B., Eds.; The MIT Press: Cambridge, MA, USA, 2004; Volume 16, pp. 321–328. [Google Scholar]
- Scikit-Learn Developers. Sklearn.Semi_Supervised.LabelSpreading. 2020. Available online: https://scikit-learn.org/stable/modules/generated/sklearn.semi_supervised.LabelSpreading.html (accessed on 31 December 2020).
- Godbole, S.; Sarawagi, S. Discriminative methods for multi-labeled classification. In Lecture Notes in Computer Science, Proceedings of the Advances in Knowledge Discovery and Data Mining, Sydney, Australia, 26–28 May 2004; Dai, H., Srikant, R., Zhang, C., Eds.; Springer: Berlin/Heidelberg, Germany, 2004; Volume 3056, pp. 22–30. [Google Scholar] [CrossRef]
- Hutter, F.; Hoos, H.; Leyton-Brown, K. An efficient approach for assessing hyperparameter importance. In Proceedings of the 31st International Conference on Machine Learning, Beijing, China, 22–24 June 2014; Xing, E.P., Jebara, T., Eds.; Volume 32, pp. 754–762. [Google Scholar]
- Hooker, G. Generalized functional ANOVA diagnostics for high-dimensional functions of dependent variables. J. Comput. Graph. Stat. 2007, 16, 709–732. [Google Scholar] [CrossRef]
- Hutter, F.; Falkner, S. fANOVA 2.0.5 Documentation. 2017. Available online: https://automl.github.io/fanova/index.html (accessed on 31 December 2020).
- Pelikan, M.; Goldberg, D.E.; Cantú-Paz, E. BOA: The Bayesian optimization algorithm. In Proceedings of the 1st Annual Conference on Genetic and Evolutionary Computation; Banzhaf, W., Daida, J.M., Eiben, A.E., Garzon, M.H., Honavar, V., Eds.; Morgan Kaufmann Publishers: San Francisco, CA, USA, 1999; Volume 1, pp. 525–532. [Google Scholar]
- Snoek, J.; Larochelle, H.; Adams, R.P. Practical Bayesian optimization of machine learning algorithms. In Advances in Neural Information Processing Systems; Pereira, F., Burges, C.J.C., Bottou, L., Weinberger, K., Eds.; Curran Associates: Lake Tahoe, NV, USA, 3–8 December 2012; Volume 25, pp. 2951–2959. [Google Scholar]
Figure 1.
Worldwide commercial air traffic evolution in the last decade (data source [3]).
Figure 1.
Worldwide commercial air traffic evolution in the last decade (data source [3]).

Figure 2.
Evolution of aviation accident causes (adapted from [6]).
Figure 2.
Evolution of aviation accident causes (adapted from [6]).

Figure 3.
Human Factor Analysis and Classification System (HFACS) framework (adapted from [24]).
Figure 3.
Human Factor Analysis and Classification System (HFACS) framework (adapted from [24]).

Figure 4.
Proposed HFACS-machine learning (HFACS-ML) framework.

Figure 5.
Precondition for Unsafe Act confusion matrix.

Figure 6.
Precondition for Unsafe Act confusion matrix, with down-sampled “Physical Env. 1”.

Figure 7.
Marginal contribution of each hyper-parameter, as predicted by the functional Analysis of Variance (fANOVA).
Figure 7.
Marginal contribution of each hyper-parameter, as predicted by the functional Analysis of Variance (fANOVA).

Figure 8.
Bayesian optimization results with one free variable.

Figure 9.
Bayesian optimization results with two free variables.


Table 1.
Automated labelling table.
| HFACS-ML Level | |||
|---|---|---|---|
| Keyword | Unsafe Supervision | Precondition | Unsafe Act |
| Weather-(all) | - | Physical Env. 1 | - |
| ATC & navigation-VFR flight in IMC | - | Physical Env. 1 | - |
| ATC & navigation-Language/communication | - | Personnel Factor | - |
| Collision-Object-Bird | - | Physical Env. 2 | - |
| Collision-Object-Person, animal | - | Physical Env. 2 | - |
| Airplane-Engines-Fuel exhaustion | Supervisory Violation | Personnel Factor | - |
| Airplane-Engines-Fuel starvation | Supervisory Violation | Personnel Factor | - |
| Flightcrew-Alcohol, drug usage | - | Condition of Operator | - |
| Flightcrew-Incapacitation | - | Condition of Operator | - |
| Flightcrew-Disorientation, sit. awareness | - | Condition of Operator | Error |
| Flightcrew-Insufficient rest / fatigue | - | Personnel Factor | - |
| Flightcrew-Non adherence to procedures | - | - | Violation |
| Cargo-Overloaded | - | - | Violation |
| Flightcrew-Un(der)qualified | Supervisory Violation | Personnel Factor | - |
| Security-Suicide | - | Condition of Operator | Violation |
Table 2.
Total label distribution.
| HFACS-ML Level | HFACS-ML Category | Label Count |
|---|---|---|
| Unsafe Supervision | Inadequate Supervision | 20 |
| Planned Inap. Oper. | 6 | |
| Failed Known Prob. | 3 | |
| Supervisory Violation | 52 | |
| n/a | 22 | |
| und | 4 | |
| Precondition for Unsafe Act | Physical Env. 1 | 169 |
| Physical Env. 2 | 46 | |
| Technological Env. | 10 | |
| Condition of Operator | 55 | |
| Personnel Factor | 78 | |
| n/a | 8 | |
| und | 4 | |
| Unsafe Act | Error | 54 |
| Violation | 47 | |
| n/a | 14 | |
| und | 4 |
Table 3.
Most similar documents, from the Doc2Vec-Distributed Memory (D2V DM) model.
| HFACS-ML Level | ||||
|---|---|---|---|---|
| iD | Unsafe Supervision | Precondition | Unsafe Act | |
| Reference Doc | 361 | Inadequate Supervision | Personnel Factor | Error |
| Most Similar Docs (D2V) | 771 | Inadequate Supervision | Physical Env. 2 | Error |
| 1191 | Inadequate Supervision | Personnel Factor | Error | |
| 1011 | Inadequate Supervision | Personnel Factor | Error | |
| 1411 | Inadequate Supervision | Condition of Operator | Error | |
| 857 | Inadequate Supervision | Personnel Factor | Error | |
| Score | 5/5 | 3/5 | 5/5 | |
Table 4.
Least similar documents, from the D2V DM model.
| HFACS-ML Level | ||||
|---|---|---|---|---|
| iD | Unsafe Supervision | Precondition | Unsafe Act | |
| Reference Doc | 361 | Inadequate Supervision | Personnel Factor | Error |
| Least Similar Docs (D2V) | 212 | n/a | Physical Env. 2 | n/a |
| 626 | n/a | Technological Env. | n/a | |
| 823 | n/a | Technological Env. | n/a | |
| Score | 0/3 | 0/3 | 0/3 | |
Table 5.
Random search characteristics of each hyper-parameter.
| Hyper-Parameter | Min Value | Max Value | Scale | Type |
|---|---|---|---|---|
| Train size | 0.2 | 0.8 | Uniform | Float |
| 0.2 | 200 | Log Uniform | Float | |
| Dimensions | 10 | 1000 | Log Uniform | Integer |
| Window size | 1 | 50 | Log Uniform | Integer |
| Epochs | 1 | 100 | Log Uniform | Integer |
| Learning rate | 0.0025 | 0.25 | Log Uniform | Float |
| NS words | 1 | 50 | Log Uniform | Integer |
Table 6.
Best predictions from the Unsafe Supervision level.
| Best Results | ||||
|---|---|---|---|---|
| Model Type | Model Name | Micro F1 | Precision | Macro F1 |
| Random Search | D2V DBoW NS’ + LS | 0.816 | 0.894 | 0.548 |
| D2V DBoW HS’ + LS | 0.850 | 0.928 | 0.531 | |
| D2V DM NS’ + LS | 0.833 | 0.880 | 0.492 | |
| D2V DM HS’ + LS | 0.800 | 0.900 | 0.471 | |
| Bayesian Optimization | D2V DBoW NS” + LS | 0.900 | 0.933 | 0.578 |
| D2V DBoW HS” + LS | 0.900 | 0.933 | 0.578 | |
| D2V DM NS” + LS | 0.850 | 0.928 | 0.510 | |
| D2V DM HS” + LS | 0.850 | 0.866 | 0.518 | |
| Baseline Models | D2V DBoW NS + LS | 0.800 | 0.750 | 0.488 |
| D2V DBoW NS + SVM | 0.500 | 0.500 | 0.133 | |
| TD-IDF + LS | 0.650 | 0.625 | 0.378 | |
| TF-IDF + SVM | 0.600 | 0.555 | 0.276 | |
Table 7.
Best predictions from the Precondition for Unsafe Act level.
| Best Results | ||||
|---|---|---|---|---|
| Model Type | Model Name | Micro F1 | Precision | Macro F1 |
| Random Search | D2V DBoW NS’ + LS | 0.657 | 0.656 | 0.659 |
| D2V DBoW HS’ + LS | 0.729 | 0.732 | 0.782 | |
| D2V DM NS’ + LS | 0.610 | 0.618 | 0.517 | |
| D2V DM HS’ + LS | 0.573 | 0.573 | 0.375 | |
| Bayesian Optimization | D2V DBoW NS’ + LS | 0.729 | 0.724 | 0.693 |
| D2V DBoW HS” + LS | 0.779 | 0.789 | 0.735 | |
| D2V DM NS” + LS | 0.644 | 0.644 | 0.536 | |
| D2V DM HS” + LS | 0.627 | 0.632 | 0.494 | |
| Baseline Models | D2V DBoW NS + LS | 0.407 | 0.407 | 0.197 |
| D2V DBoW NS + SVM | 0.441 | 0.441 | 0.185 | |
| TD-IDF + LS | 0.763 | 0.759 | 0.745 | |
| TF-IDF + SVM | 0.661 | 0.661 | 0.560 | |
Table 8.
Best predictions from the Unsafe act level.
| Best Results | ||||
|---|---|---|---|---|
| Model Type | Model Name | Micro F1 | Precision | Macro F1 |
| Random Search | D2V DBoW NS’ + LS | 0.800 | 0.800 | 0.818 |
| D2V DBoW HS’ + LS | 0.731 | 0.710 | 0.735 | |
| D2V DM NS’ + LS | 0.704 | 0.704 | 0.495 | |
| D2V DM HS’ + LS | 0.741 | 0.739 | 0.761 | |
| Bayesian Optimization | D2V DBoW NS’ + LS | 0.875 | 0.923 | 0.859 |
| D2V DBoW HS” + LS | 0.826 | 0.842 | 0.830 | |
| D2V DM NS” + LS | 0.782 | 0.800 | 0.755 | |
| D2V DM HS” + LS | 0.869 | 0.850 | 0.898 | |
| Baseline Models | D2V DBoW NS + LS | 0.565 | 0.526 | 0.560 |
| D2V DBoW NS + SVM | 0.522 | 0.522 | 0.288 | |
| TD-IDF + LS | 0.739 | 0.737 | 0.762 | |
| TF-IDF + SVM | 0.652 | 0.652 | 0.447 | |
Publisher’s Note: MDPI stays neutral with regard to jurisdictional claims in published maps and institutional affiliations. |
© 2021 by the authors. Licensee MDPI, Basel, Switzerland. This article is an open access article distributed under the terms and conditions of the Creative Commons Attribution (CC BY) license (http://creativecommons.org/licenses/by/4.0/).
Share and Cite
MDPI and ACS Style
Madeira, T.; Melício, R.; Valério, D.; Santos, L. Machine Learning and Natural Language Processing for Prediction of Human Factors in Aviation Incident Reports. Aerospace 2021, 8, 47. https://0-doi-org.brum.beds.ac.uk/10.3390/aerospace8020047
AMA Style
Madeira T, Melício R, Valério D, Santos L. Machine Learning and Natural Language Processing for Prediction of Human Factors in Aviation Incident Reports. Aerospace. 2021; 8(2):47. https://0-doi-org.brum.beds.ac.uk/10.3390/aerospace8020047
Chicago/Turabian StyleMadeira, Tomás, Rui Melício, Duarte Valério, and Luis Santos. 2021. "Machine Learning and Natural Language Processing for Prediction of Human Factors in Aviation Incident Reports" Aerospace 8, no. 2: 47. https://0-doi-org.brum.beds.ac.uk/10.3390/aerospace8020047
Note that from the first issue of 2016, this journal uses article numbers instead of page numbers. See further details here.