
Harmonic Forcing from Distortion in a Boundary Layer Ingesting Fan


GKN Aerospace Engine Systems and KTH, S-461 81 Trollhättan, Sweden
Aerospace 2021, 8(3), 58; https://0-doi-org.brum.beds.ac.uk/10.3390/aerospace8030058
Submission received: 31 December 2020
/
Revised: 11 February 2021
/
Accepted: 17 February 2021
/
Published: 24 February 2021
(This article belongs to the Special Issue Selected Papers from 3rd ECATS Conference on Making Aviation Environmentally Sustainable)
Abstract
:Integrating a fan with a boundary layer ingestion (BLI) configuration into an aircraft fuselage can improve propulsion efficiency by utilizing the lower momentum airflow in the boundary layer developed due to the surface drag of the fuselage. As a consequence, velocity and total pressure variations distort the flow field entering the fan in both the circumferential and radial directions. Such variations can negatively affect fan aerodynamics and give rise to vibration issues. A fan configuration to benefit from BLI needs to allow for distortion without large penalties. Full annulus unsteady computational fluid dynamics (CFD) with all blades and vanes is used to evaluate the effects on aerodynamic loading and forcing on a fan designed to be mounted on an adapted rear fuselage of a Fokker 100 aircraft, i.e., a tail cone thruster. The distortion pattern used as a boundary condition on the fan is taken from a CFD analysis of the whole aircraft with a simplified model of the installed fan. Detailed simulations of the fan are conducted to better understand the relation between ingested distortion and the harmonic forcing. The results suggest that the normalized harmonic forcing spectrum is primarily correlated to the circumferential variation of inlet total pressure. In this study, the evaluated harmonic forces correlate with the total pressure variation at the inlet for the first 12 engine orders, with some exceptions where the response is very low. At higher harmonics, the distortion content as well as the response become very low, with amplitudes in the order of magnitude lower than the principal disturbances. The change in harmonic forcing resulting from raising the working line, thus, increasing the incidence on the fan rotor, increases the forcing moderately. The distortion transfers through the fan resulting in a non-axisymmetric aerodynamic loading of the outlet guide vane (OGV) that has a clear effect on the aerodynamics. The time average aerodynamic load and also the harmonic forcing of the OGV vary strongly around the circumference. In particular, this is the case for some of the vanes at higher back pressure, most likely due to an interaction with separations starting to occur on vanes operating in unfavorable conditions.
1. Introduction
With increasing interest in reducing fuel burn, boundary layer ingestion (BLI) is among the concepts being proposed for future aircraft configurations. The main objective of integrating the fan with the fuselage in a BLI configuration is the potential for improvements in propulsion efficiency. The first discussions of BLI benefits for aircraft date back many years, as in [1], and an early but more modern account is given in [2]. Since a long time ago, similar performance effects have also been established in marine applications, as described in [3]. There are two main categories of modern concepts for aircraft with respect to the flow pattern ingested to the fan. Configurations, such as in [4,5], have the fans embedded in the fuselage or on top of the fuselage surface. Fan installations such as those ingest mainly asymmetric boundary layers, presenting the fan with the flow varying around the circumference. The other main configuration, which is considered in this study, is the tail cone thruster (TCT) mounted on the rear end of a fuselage, as described in [6]. The TCT configuration tends to have a large radial variation of flow, and ideally very small circumferential flow variations. A broader overview of BLI research is given in [7].
Generally, fans used for the propulsion of aircraft are subject, to some extent, to distortion. This can be in the form of streaks of hot air, vortical flow, or effects of side wind, separating inlets, etc. These conditions are mostly encountered in a few particular operating conditions with limited duration. The BLI fan is continuously subjected to distorted flow at a particular design point, which merits attention as it persists for a long time. This has consequences on performance and harmonic forcing of the blades needs to be considered, which could result in challenges to blade and vane durability. Earlier studies have shown that the distortion transfer through a fan can be captured in unsteady Reynolds-averaged Navier–Stokes (URANS) simulations [8,9] through multiple stages. In a later study [10], total pressure distortion over a 120° sector in a single stage fan was studied. Experimental and numerical studies in [11] found an impact on efficiency, as well as distortion, causing corner separation in stators. Blade vibration results in a fan were reported in [12], where the fan response was measured with an ingested boundary layer. While demonstrating that the fan could survive, the authors found high responses and suggested that more needs to be learned on the issue. A unique feature of this study is that it uses an existing aircraft along with a novel fan designed for the purpose of operating as a BLI fan. The Fokker 100 used here was developed in the Netherlands by the Fokker company, which is today part of GKN Aerospace. The aim of this study is to develop a better understanding of the force on the blades and vanes resulting from the ingested distortion.
2. Methods
The Fokker 100 TCT concept considered, in this study, is depicted in Figure 1, plotting the pressure distribution over the aircraft. For the analysis of the whole aircraft, the TCT fan is represented by an impulse disk, which serves to mimic the overall performance of the fan, and to ensure that the ingested airstream is relevant. The ingested flow field from the analysis provides a representative boundary condition for the analysis of the fan. The TCT fan, designed to fit on the Fokker 100 rear fuselage, depicted in Figure 1, is used to study the effects of BLI on the aerodynamic forcing of the fan. The aerodynamic design conditions and more details of the fan design are described in [13,14]. The flow conditions are computed at the aircraft design point where the angle of attack is small and are used to prescribe steady flow conditions at the inlet. This is in line with earlier studies using computational fluid dynamics (CFD) and wind tunnels, such as in [10,11,12]. Larger-scale unsteadiness of the wake could potentially be of importance, in particular, at conditions far from cruise. Here, the focus is on the flight conditions at which the fan operates most of the time, and the flow pattern is assumed to be steady. Most of the energy is consumed here, and the fan in this particular application may be exposed to hazardous vibrations due to distortion.
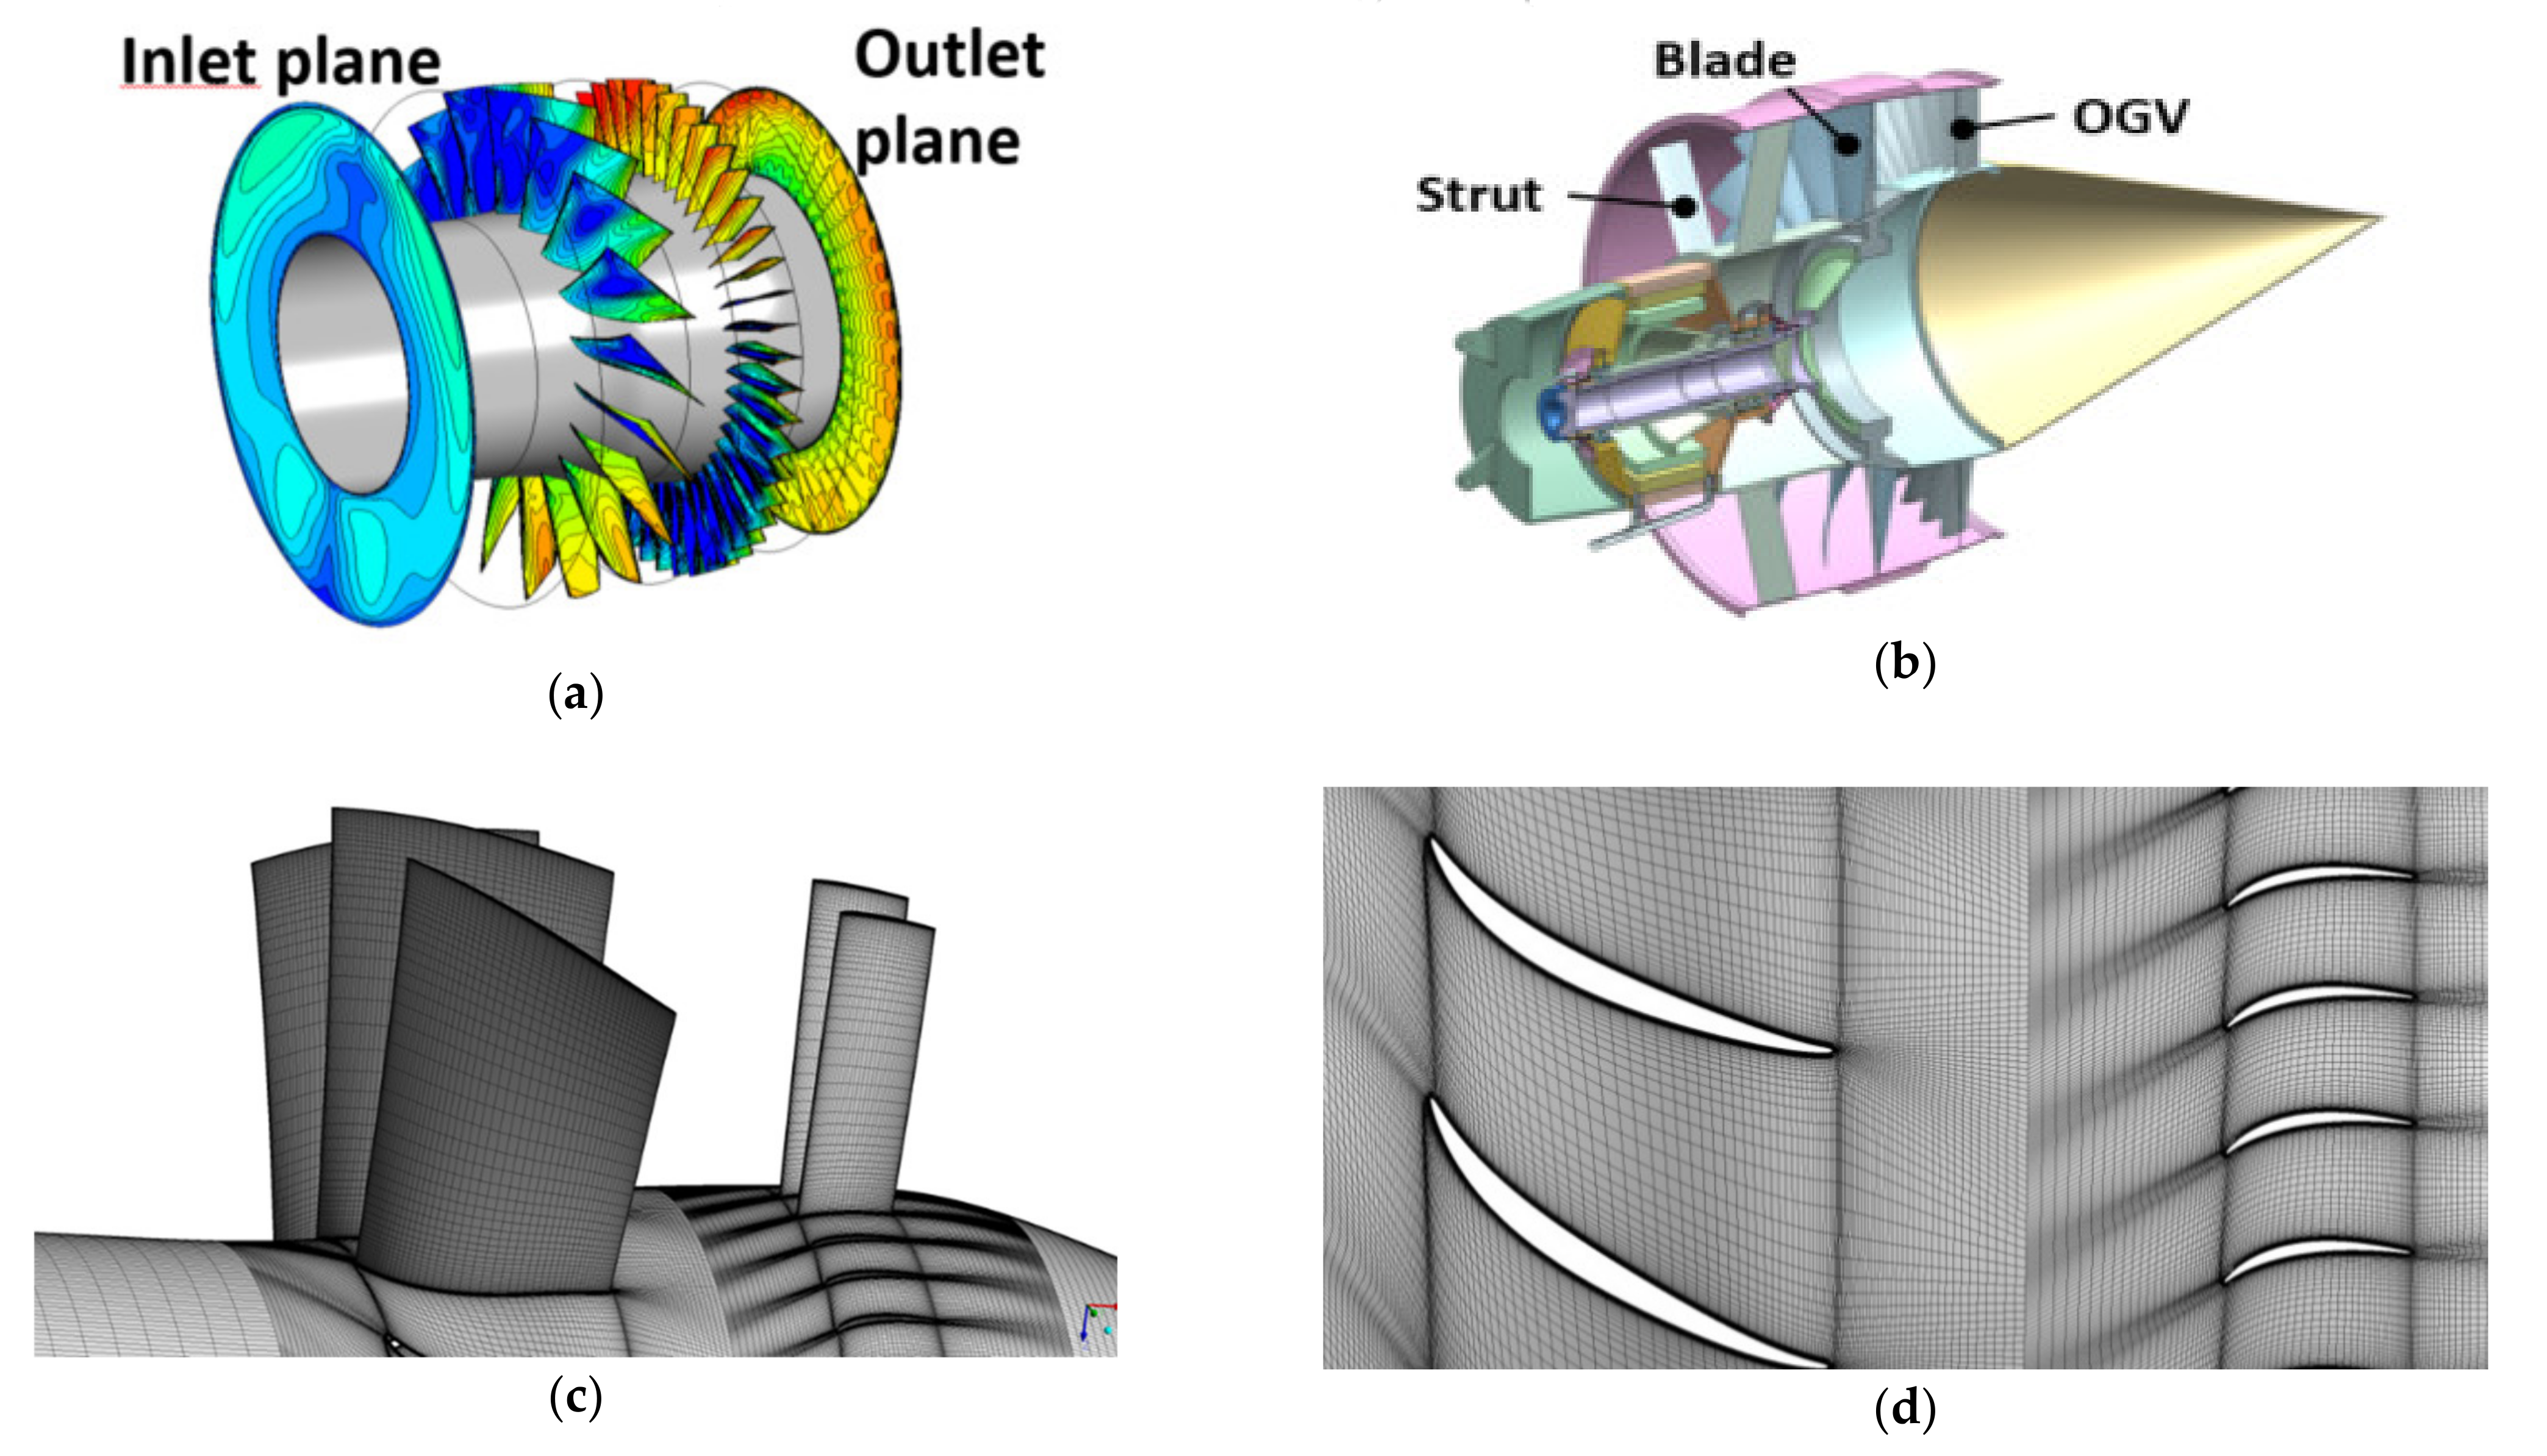
The fan rotor has 18 blades and 46 outlet guide vanes (OGVs). Figure 2a shows the instantaneous total pressure at inflow and outlet along with static pressures on blades and vanes. Apart from a variation in pressure on the individual blades, it is also worth noting that some variation in total pressure remains at the exit boundary. In the overview in Figure 2b, struts are visible that are not used in the simulation. These are part of the original fan build concept and have no intentional aerodynamic function but may be needed for structural reasons. For the aerodynamics, the struts present a loss of efficiency but are not used for turning the flow to any intent, and could, if possible, be removed. Figure 2c,d depict an overview of the mesh over the blade surfaces in the blade-to-blade plane. The CFD model of the fan consists of all 18 blades and 46 OGVs, starting with the inlet boundary just inside the intake lip, and extends to the nozzle, as shown in Figure 2a. The mesh used in the study consists of 37M nodes.
By the nature of the ingested boundary layer flow, the fan is presented with distortion in the form of variations in total pressure and swirling flow over the fan face. The flow field entering the fan is generally distorted with variations in the circumferential as well as in the radial direction. The radial variation leads to a change in the velocity triangles, and a redistribution of flow for which the fan is designed to recover efficiency. An example of this for a TCT fan design is reported in [15].
A reference, aerodynamic design point (ADP) case is directly mapped from the whole aircraft model [14] described in some detail below. The overall performance data for the fan are listed in Table 1.
Distortion is most commonly described in terms of the variation of total pressure over the inlet. It is well known that swirl velocity variation may play an important role affecting the fan in addition to the total pressure variation. For this study, the “ADP” case is complemented by an “Axial” case, in which the swirl components on the inlet are removed, but where the total pressure distortion is the same as for ADP. Increasing the back pressure until the mass flow is reduced to 91% of ADP gives an “HI2” case demonstrating the sensitivity of the operating point on the harmonic forcing. This is selected from the performance map speed line as a point where the fan works well but effects of incidence are significant.
On the basis of the CFD results from a complete Fokker 100 aircraft with a TCT mounted, the flow field entering the fan is used to analyze fan aerodynamics. The whole aircraft model used an actuator disk approach to represent the fan in a simplified manner. Inside the intake lip of the plane, the fan flow field is extracted and used as a boundary condition for the fan analysis. The boundary conditions are imposed on the inlet boundary as distributions of total pressure and flow velocity direction vectors. Figure 3a shows the total pressure normalized by the mass flow averaged total pressure applied as boundary condition over the inlet boundary. Figure 3b gives a view of the swirl components imposed on the inlet boundary, normalized to provide an idea of the swirl pattern ingested. Looking at the arrangement of the fan on the tail cone relative to the vertical tail plane wakes at 6 and 12 o’clock. The regions of lowest total pressure deficit are due to the vertical tail plane, and the other visible regions of low total pressure at the five and seven o’clock positions are the wakes downstream of the engine pods. In addition to discrete non-axisymmetric wakes, an in-plane flow pattern also forms due to the flow around the aft fuselage. On the downstream boundary, the nozzle back pressure is given as a static pressure.
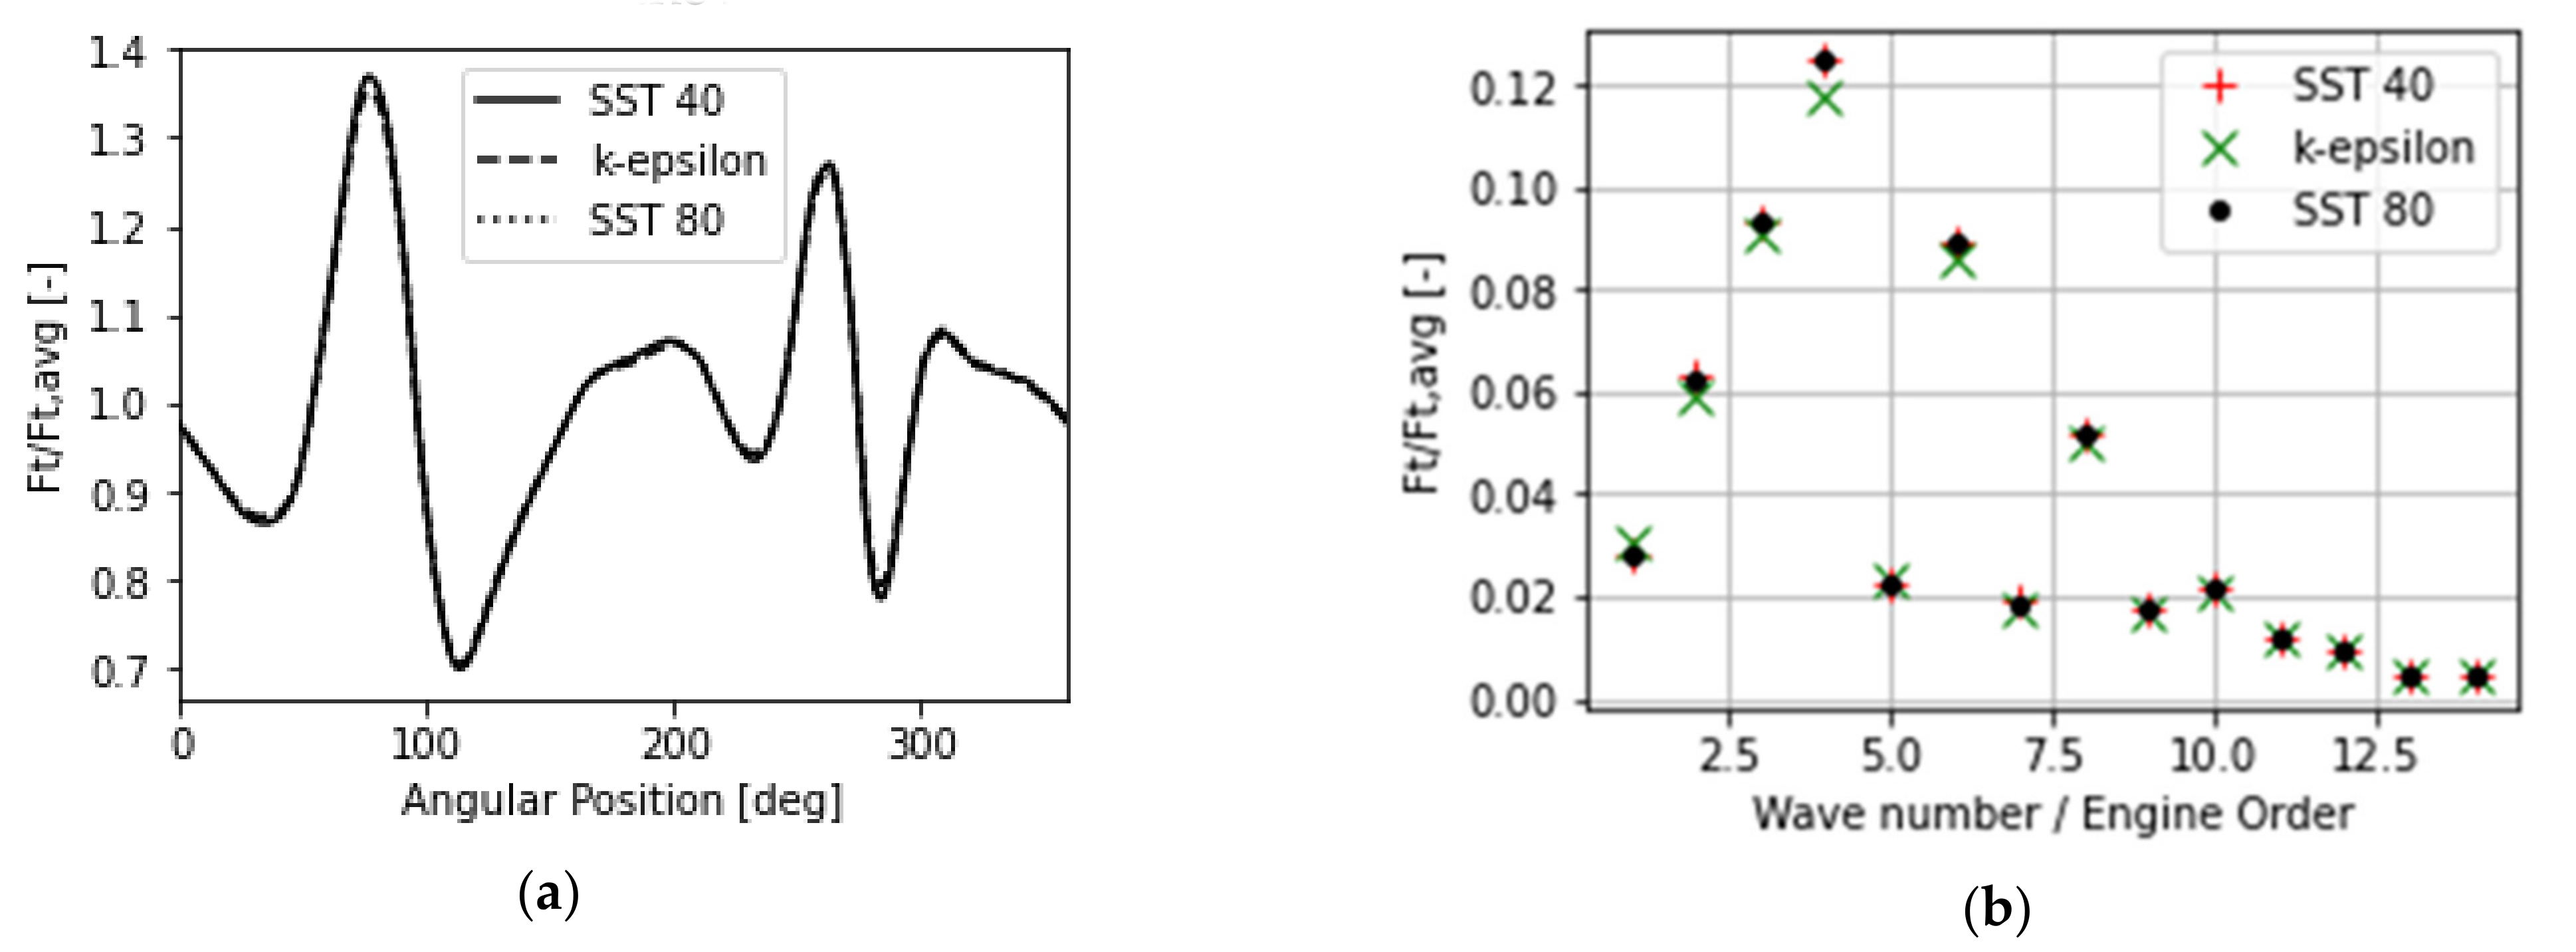
Here, a similar CFD approach to that in [8,9,10,11] is taken, but using the ANSYS CFX version R2020R1 software package, from ANSYS Inc., Canonsburg, PA, USA. The fan is modeled as a whole from inlet to nozzle. The equations solved are the compressible Navier–Stokes equations for an ideal gas, complemented by a k-ω SST model for turbulence closure implemented in ANSYS CFX. The k-ω SST model is a commonly used model in this context, described first in [16], and studied for use in compressors in [17]. All wet surfaces are represented as no-slip conditions using the standard settings in the code. The inlet boundary condition is applied as a profile in the code, laid out as a total pressure and velocity direction variation distributed over the radius and circumferential coordinates, as shown in Figure 3. The total temperature is constant over the inlet. On the outlet boundary, the pressure is given along with using the radial equilibrium boundary condition. Sometimes referred to as a “360 time dependent” simulation, this way of simulating the flow includes all the blades and vanes in each row with no assumptions on harmonics or periodicity. Similar to a physical test, it is necessary to allow the computation to continue for the time necessary to achieve a periodic result, without prescribing this in advance. The time step used to derive the results used in the study is calculated by using 80 steps per blade passing, that is, 1440 timesteps per revolution. In order to check that this is sufficient, simulations using 720 timesteps per revolution (i.e., 40 steps per blade passing) are also done and produce a similar result. Figure 4 provides a comparison made on a coarser grid using 16M nodes showing differences arising due to time stepping and turbulence model. “SST 40” and “SST 80” in the legend denotes the 40 and 80 steps per blade passing time, and “k-epsilon” a computation with the k-ε model. A comparison among the simulation models shows small differences in results demonstrating that the 80 steps per passage is sufficient and that the choice of turbulence model is not critical to the conclusions of the study.
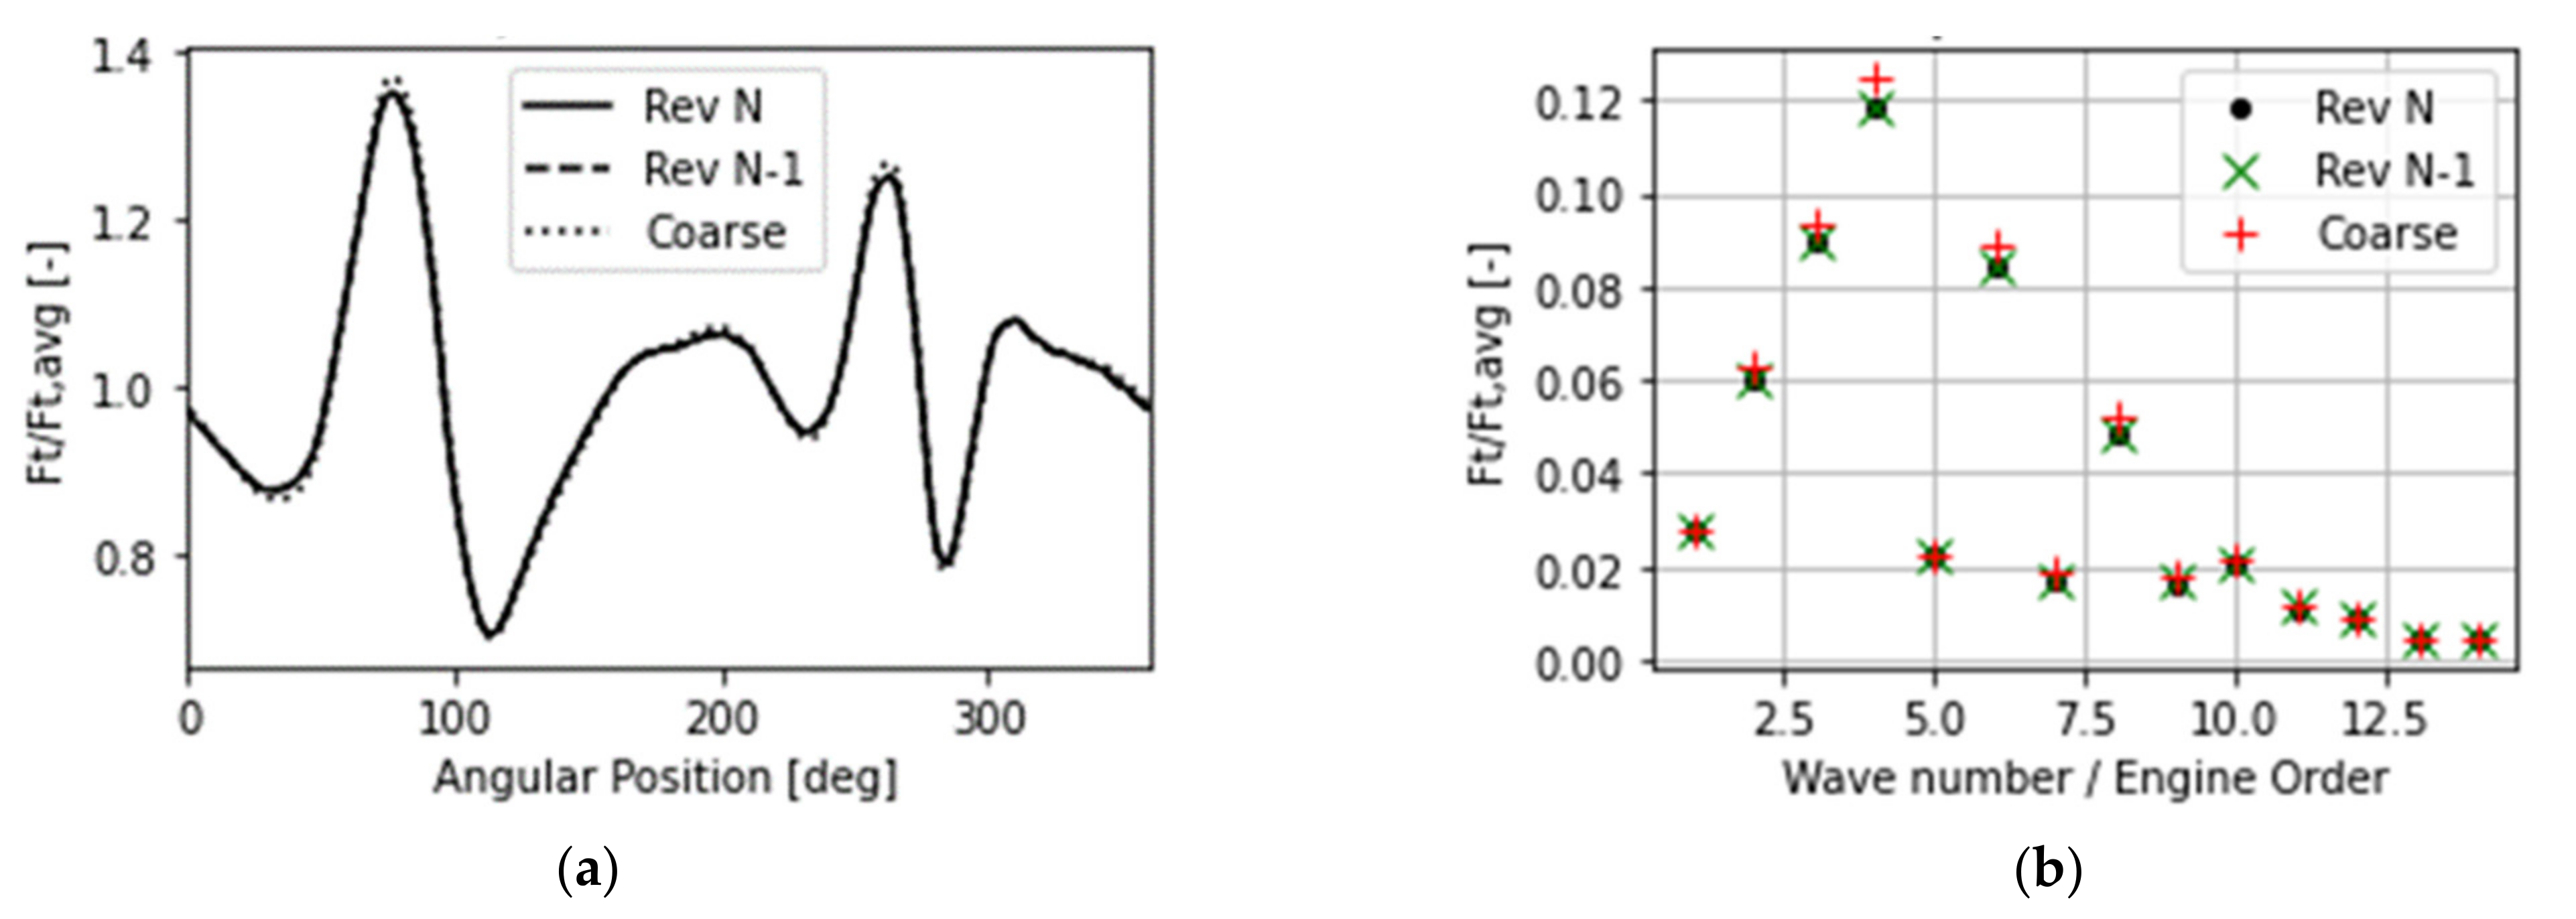
The criterion, applied to check that time periodicity is reached and that the mesh is sufficient, is that the difference in harmonic blade force is less than 1% of the time-averaged force for any frequency considered in the study. We also check that the differences in individual harmonic forces are small as compared with the amplitude of the same specific harmonic. A transient calculation, such as used here, runs for a number of revolutions in order to reach a periodic solution, where data are taken over the last full revolution in each simulation. This is checked by comparing the last full revolution, “Rev N”, to the preceding revolution, “Rev N-1”, shown in Figure 5, and ensuring that the solution does not change significantly. Therefore, the simulations were run for at least two full revolutions with the best resolution. Prior to that, the simulations started from coarser meshes that had been run for several revolutions. A further challenge in the studies is the computational expense involved with a large mesh. Therefore, we check mesh sensitivity by comparing the results to earlier similar analyses using a mesh with less than half the number of nodes, with the same boundary conditions. “Coarse” depicts the coarse mesh also used as a basis for the comparison made in Figure 4, identified as “SST 80”. The small difference show that the resolution and periodicity is sufficient for the study.
3. Results
The variation of the angle of the incoming flow relative to the leading edge is pertinent to the aerodynamics of the rotor. The inlet flow profile consists of an axisymmetric part stemming from the boundary layer developed along the fuselage, and a non-axisymmetric part that will lead to harmonic force, as well as a distortion affecting the performance of the fan. The blade design [8] addressed a radial variation of the total pressure that affects the blade angles and loading distribution by adapting the blade shape. In order to assess how the circumferential distortion affects the aerodynamics and forcing of the blades, we study the results from the full annulus, time-dependent CFD result. Three cases are considered, i.e., “ADP”, “Axial”, and “HI2”, which are formulated to shed light on the level of the harmonic forces, and what controls them. The ADP case is the reference case mapping the flow field from the aircraft CFD onto the fan inlet and outlet as boundary condition. The HI2 case considers the same conditions as ADP on the inlet but at an increased outlet pressure, increasing the aerodynamic load. In order to relate to standard descriptions of distortion, first, the Axial case is considered where the swirl velocity components, Figure 3, are removed but the inlet total pressure and outlet static pressure boundary conditions are the same as ADP. In Figure 6a, the time average of the static pressure field at a plane 2 axial rotor chords, upstream of the rotor leading edge, X = −300 mm, is shown. The rotor blade leading edge is located at X = 0 mm. It is observed that low static pressure regions are found where the total pressures are low at the inlet as compared to the total pressure field at the inlet. In [10], this is attributed to a redistribution of the flow towards regions where the rotor does more work. Although more complex, the case presented here appears to follow similar trends. The relative whirl angle variation at a plane 1 axial chord upstream of the rotor leading edge, X = −150 mm, is shown in Figure 6b. The relative whirl angle, calculated from the flow vector in the rotating frame, is defined as Equation (1):
where is the circumferential velocity and Cm is the meridional flow velocity.
In the same manner, the absolute whirl angle is defined in Equation (2) by:
where is the circumferential velocity in the stationary frame.
A correlation of high whirl angles is observed where the total pressure is low, thus, likely increasing the aerodynamic load of the blade as it passes through the sector by increasing the incidence on the leading edge. Although causing a redistribution of the flow, the circumferential velocities induced by the effect appear not to be very large in this case, which can be inferred from the relative whirl angles, which are nearly symmetric with respect to the vertical axis.
In the ADP case, both swirl velocity and total pressure varies as found in the full aircraft simulation. In Figure 7, the whirl angle variation is shown based on a plane 1 axial chord upstream of the rotor leading edge. Figure 7a gives the whirl angles in the stationary frame, whereas Figure 7b gives the relative whirl angle variation in the reference case. The absolute whirl angle variation is close to anti-symmetric, which is easily understood from the pattern of the velocity vectors. Viewed from the rotor, the whirl angle variation, which translates to a variation in incidence, is not entirely symmetric, indicating that some effect of the swirling flow should be expected as it passes the rotor.
3.1. Effects on Aerodynamics of the Fan
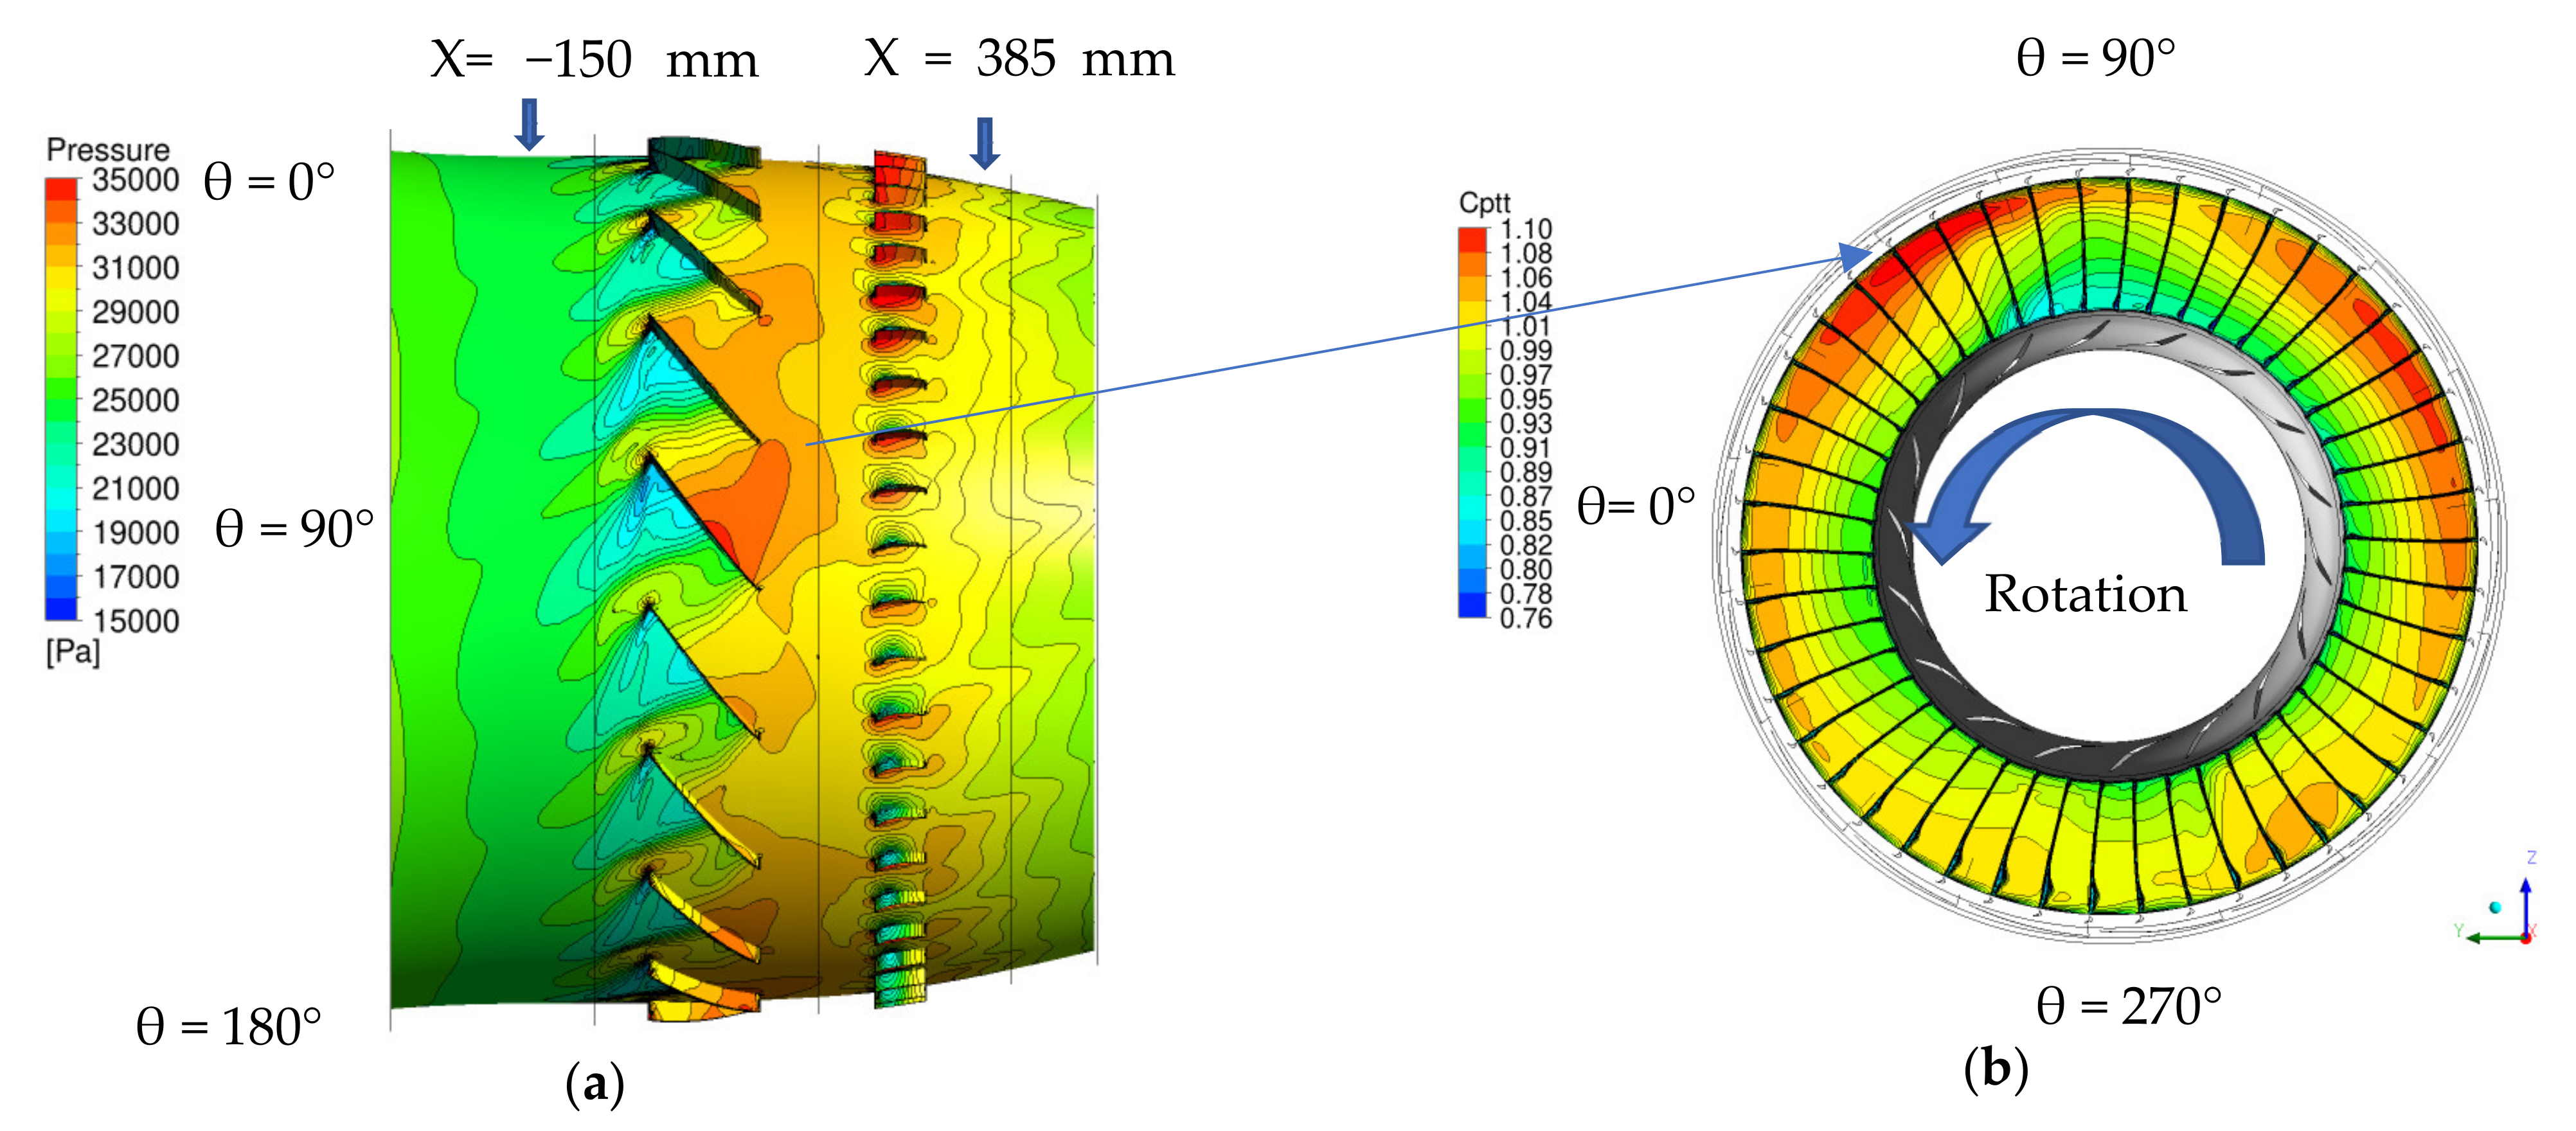
The main effect of the distortion is the change in the work done by the rotor as the incidence angles vary through distorted regions. Firstly, therefore, the transfer of the flow pattern through the fan is examined. For this, the ADP case is examined in more detail. In Figure 8a, the static pressure field is shown looking down the vertical axis. What appears most clearly is that the blade load indicated by the pressure difference over the blade increases as the blade passes through the region of low total pressure at the top of the fan. The resulting total pressure field found on a plane downstream of the OGV at x = 385 mm is shown in Figure 8b. The data are normalized with the mass averaged total pressure over the same plane, to make it comparable with later plots. Firstly, the OGV wakes are visible as radial lines and the pattern emerging, apart from this, has some similar features as that found at the inlet but appears slightly shifted in the direction of rotation and with a bias of higher total pressures where the rotor leaves the distorted region.
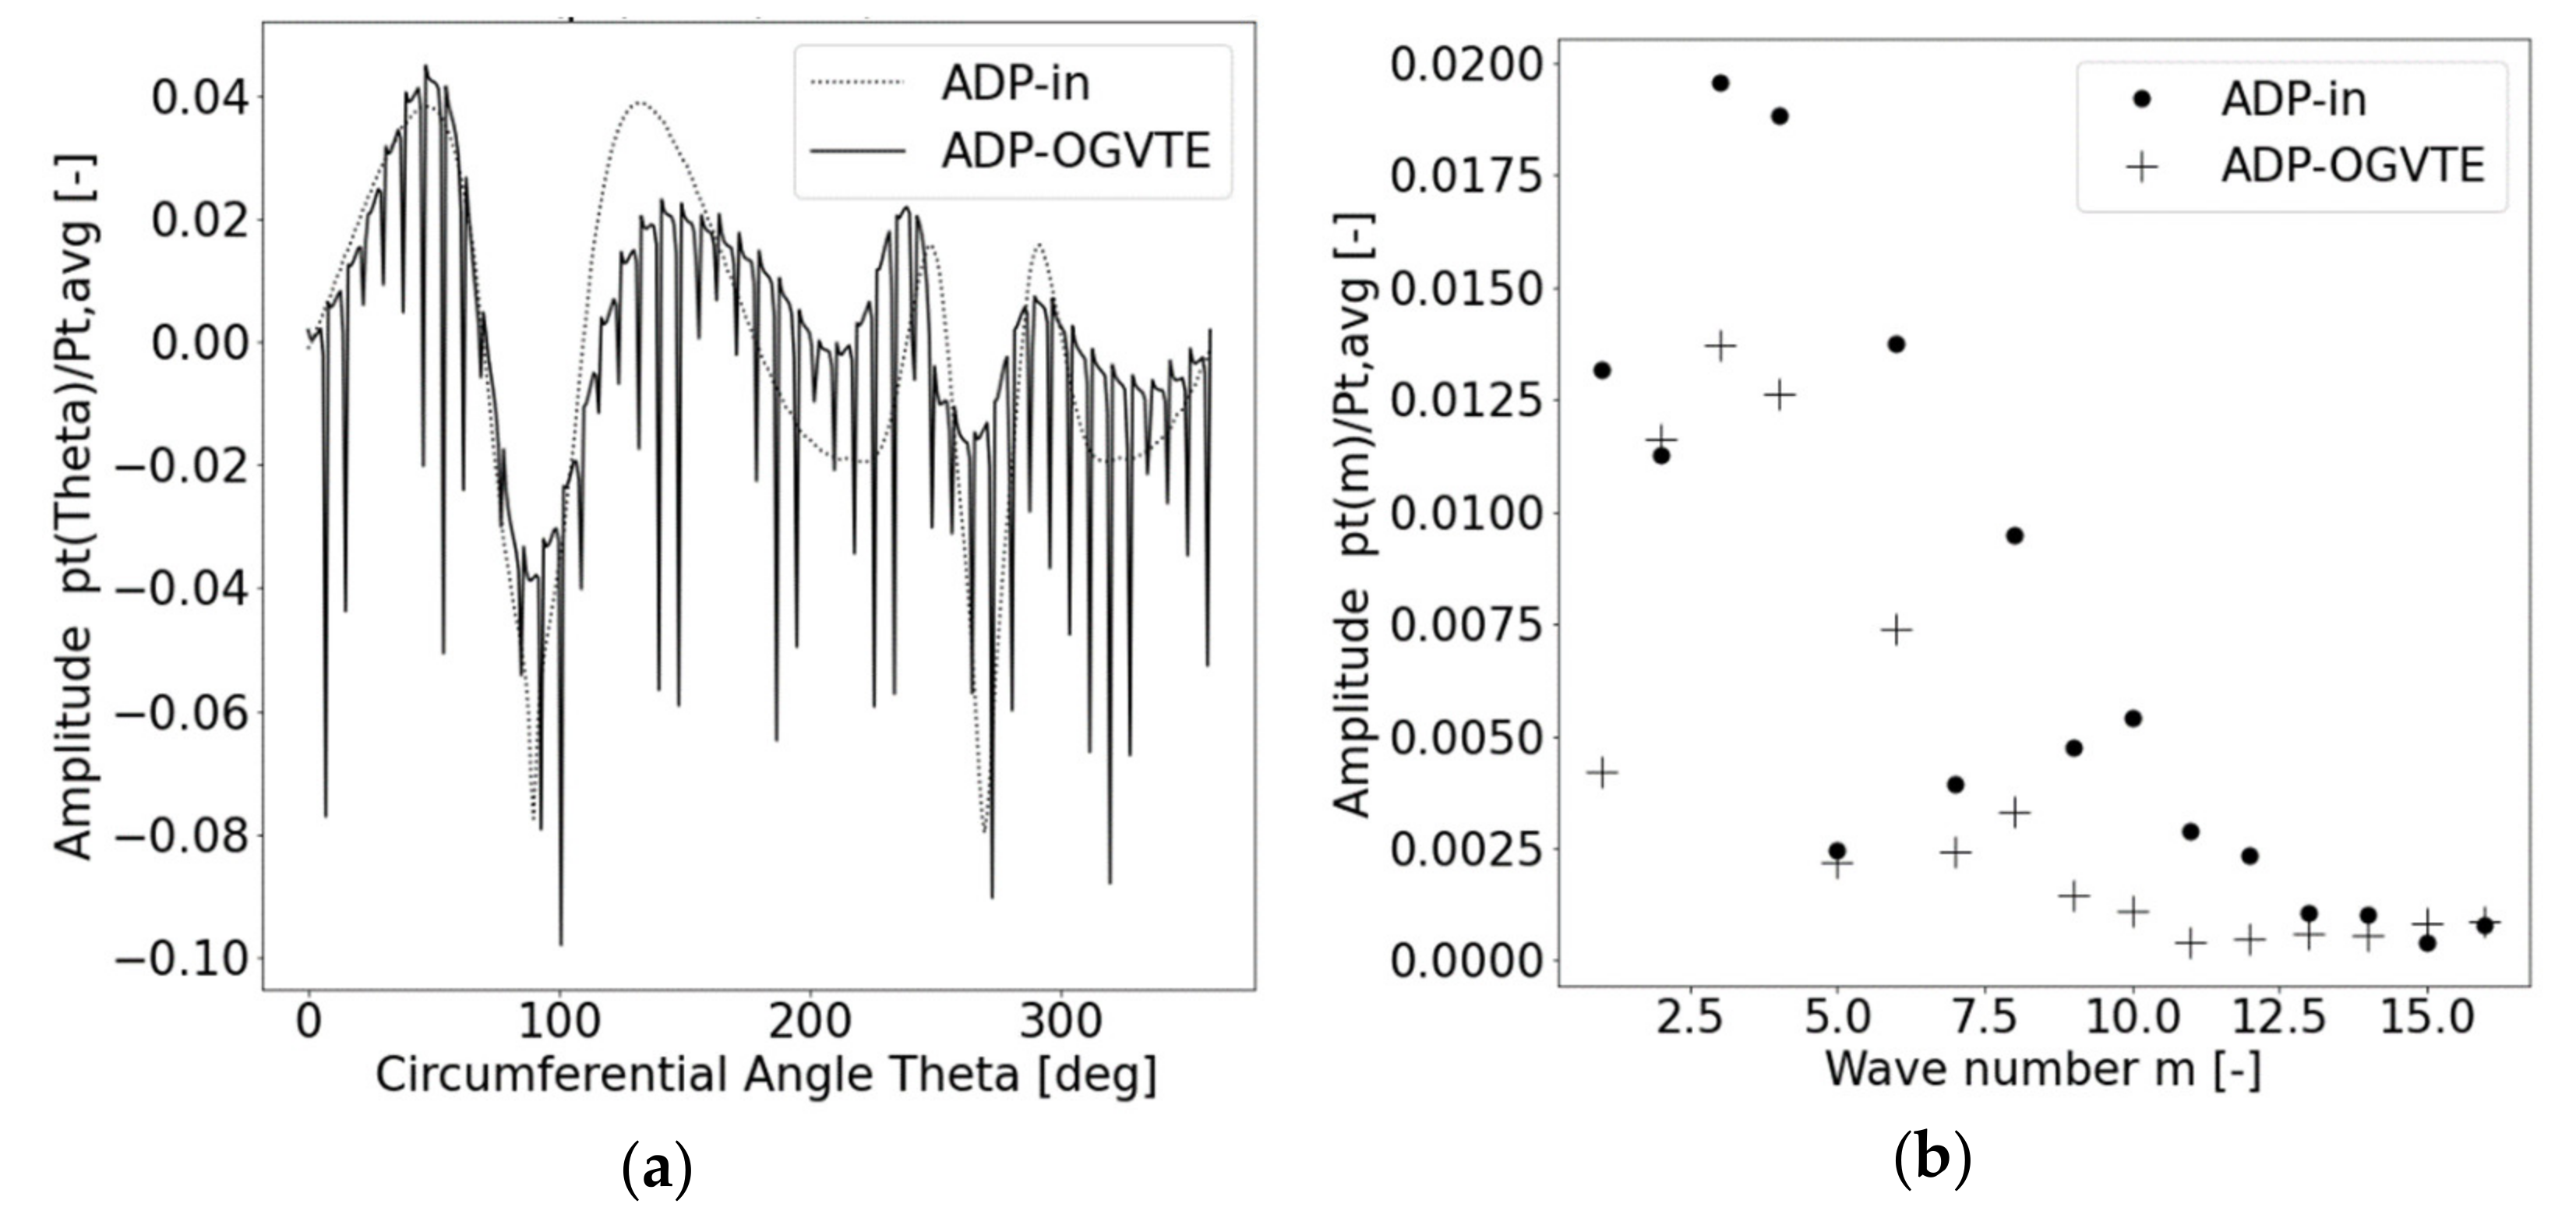
A radially averaged, circumferential variation of the total pressure at the inlet, denoted “ADP-in in the legend and at the plane downstream of the OGV, at X = 0.385, denoted “ADP-OGVTE” in the legend is shown in Figure 9a. This is defined as a mass flow biased average of the total pressure over the radius for each circumferential position extracted at one-degree intervals. The difference in total pressure moving out of and coming into the distorted section is clearly seen here. Apart from the spikes in the “ADP-OGVTE” curves caused by the OGV wakes, the normalized variation also appears to be attenuated to some degree. A more quantitative understanding of the transfer per harmonic is given in Figure 9b. The circumferential variation is shown in terms of Fourier decomposed amplitudes from the same data as in Figure 9a. Apart from wave numbers m = 2 and m = 5, there is a clear reduction in normalized amplitude.
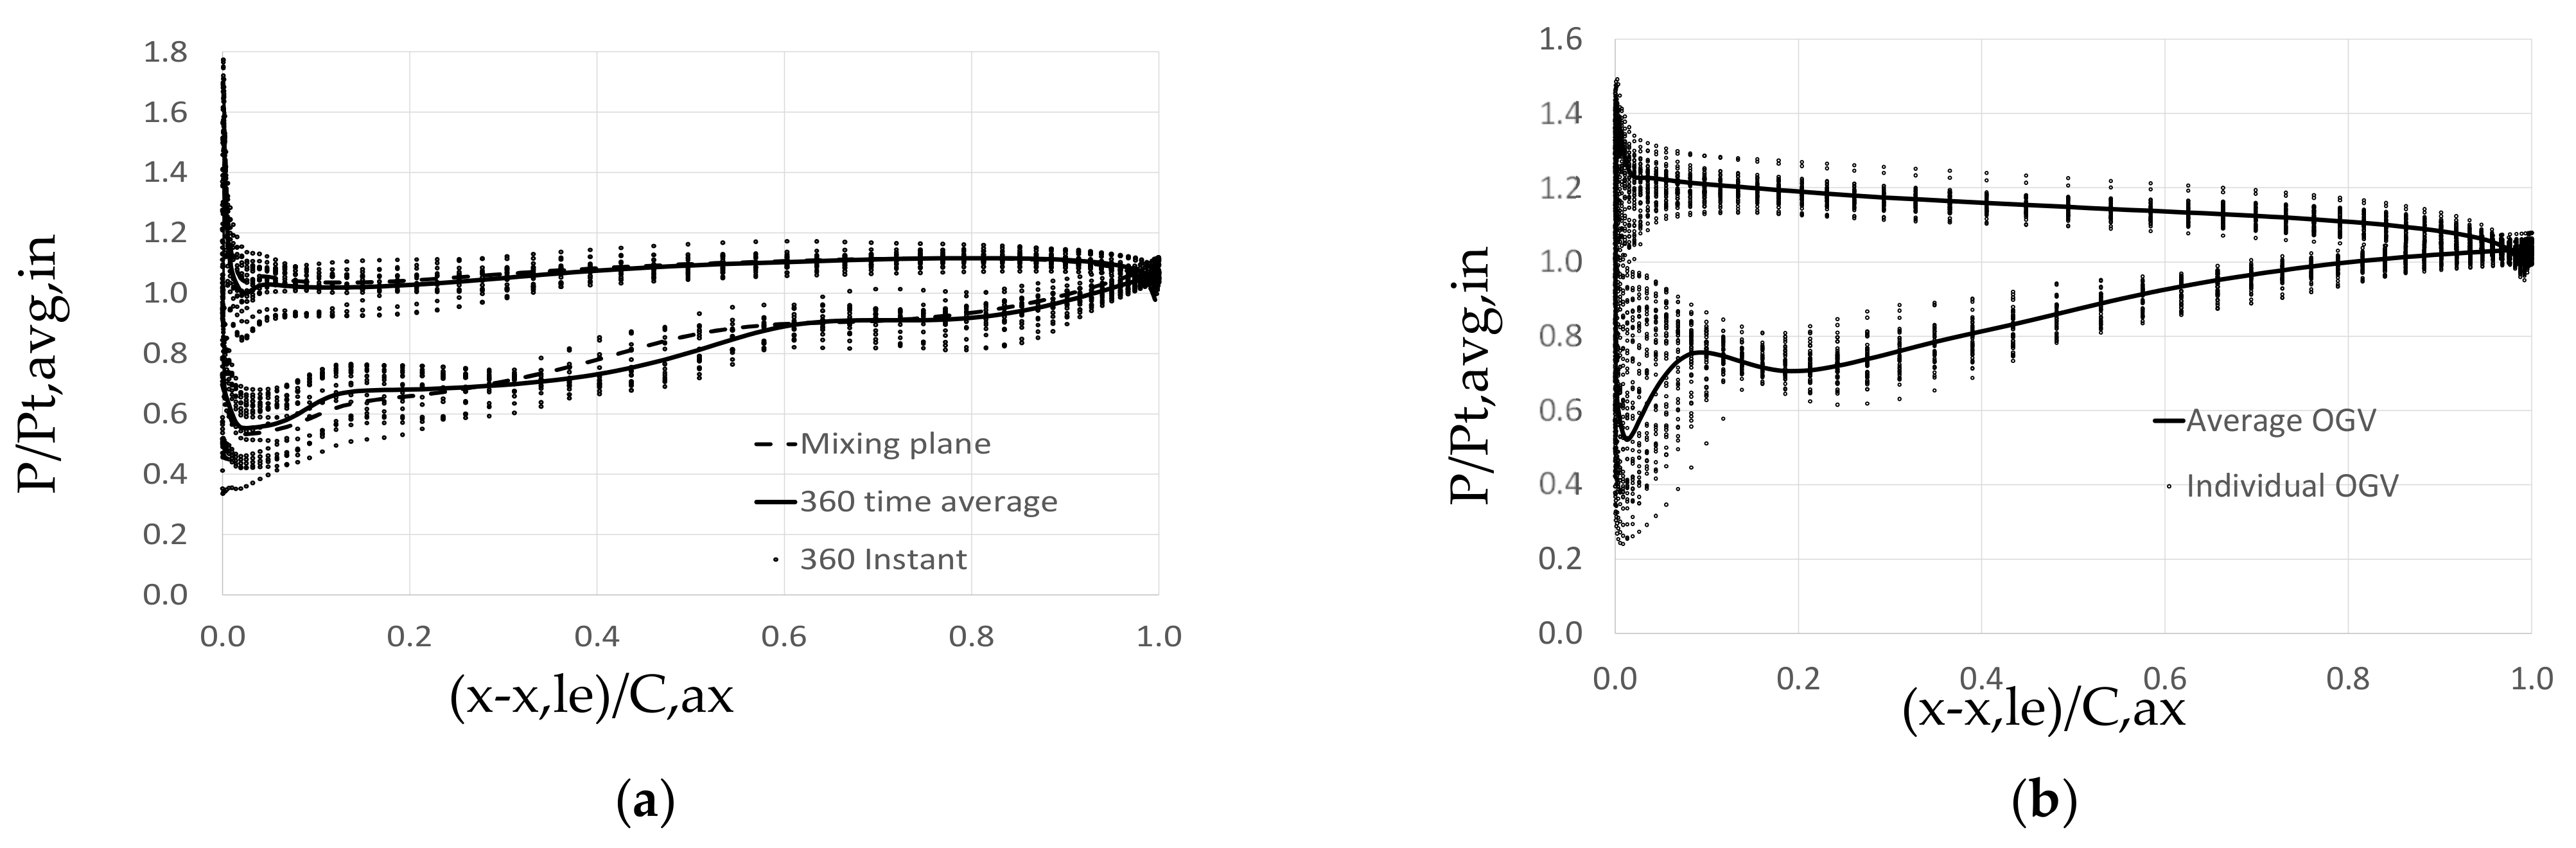
In Figure 10a, individual blade pressure coefficient distributions are shown as dots and the average as a full line. On the x-axis of both plots, the non-dimensional axial distance from the leading edge of the respective airfoil is given; 0 is at the leading edge and 1 is at the trailing edge. The pressure coefficient is defined as the static pressure divided by the mass averaged total pressure at the inlet. For the rotor, this is equivalent to the variation each blade undergoes during one rotation. The variation in the pressure distribution due to the distortion is significant, over the entire chord, which may be expected from the variation in the flow field. The plot also includes the result of a calculation using a mixing plane. The mixing plane is an approximation often used in turbomachinery CFD in order to reduce the computational effort for performance calculations. Over an interface plane, between rotor and stator, a circumferential averaging of the flow is made for each radius. Only the averages are transferred over that interface such that the flow in each blade row receives a steady state flow that is axisymmetric, and thus time invariant in the respective frame of reference. It is of some interest to note that the mixing plane calculation comes relatively close to the average of the transient calculations, as the mixing plane technique was used in the fan design and was reported in [8]. For the OGV shown in Figure 10b, the incidence variation from vane to vane leads to large variations at the leading edge. The view on the OGV is slightly different from the fan blade as this is the time average over each individual vane. Since this is a fixed pattern, individually re-staggering or modifying the vanes could be considered to be a means to mitigate the local incidence effects at ADP. In [18], this is shown effective in substantially reducing separations and losses incurred in the OGV as an asymmetric boundary layer is ingested into the fan.
3.2. Harmonic Forcing of the Rotor Blades
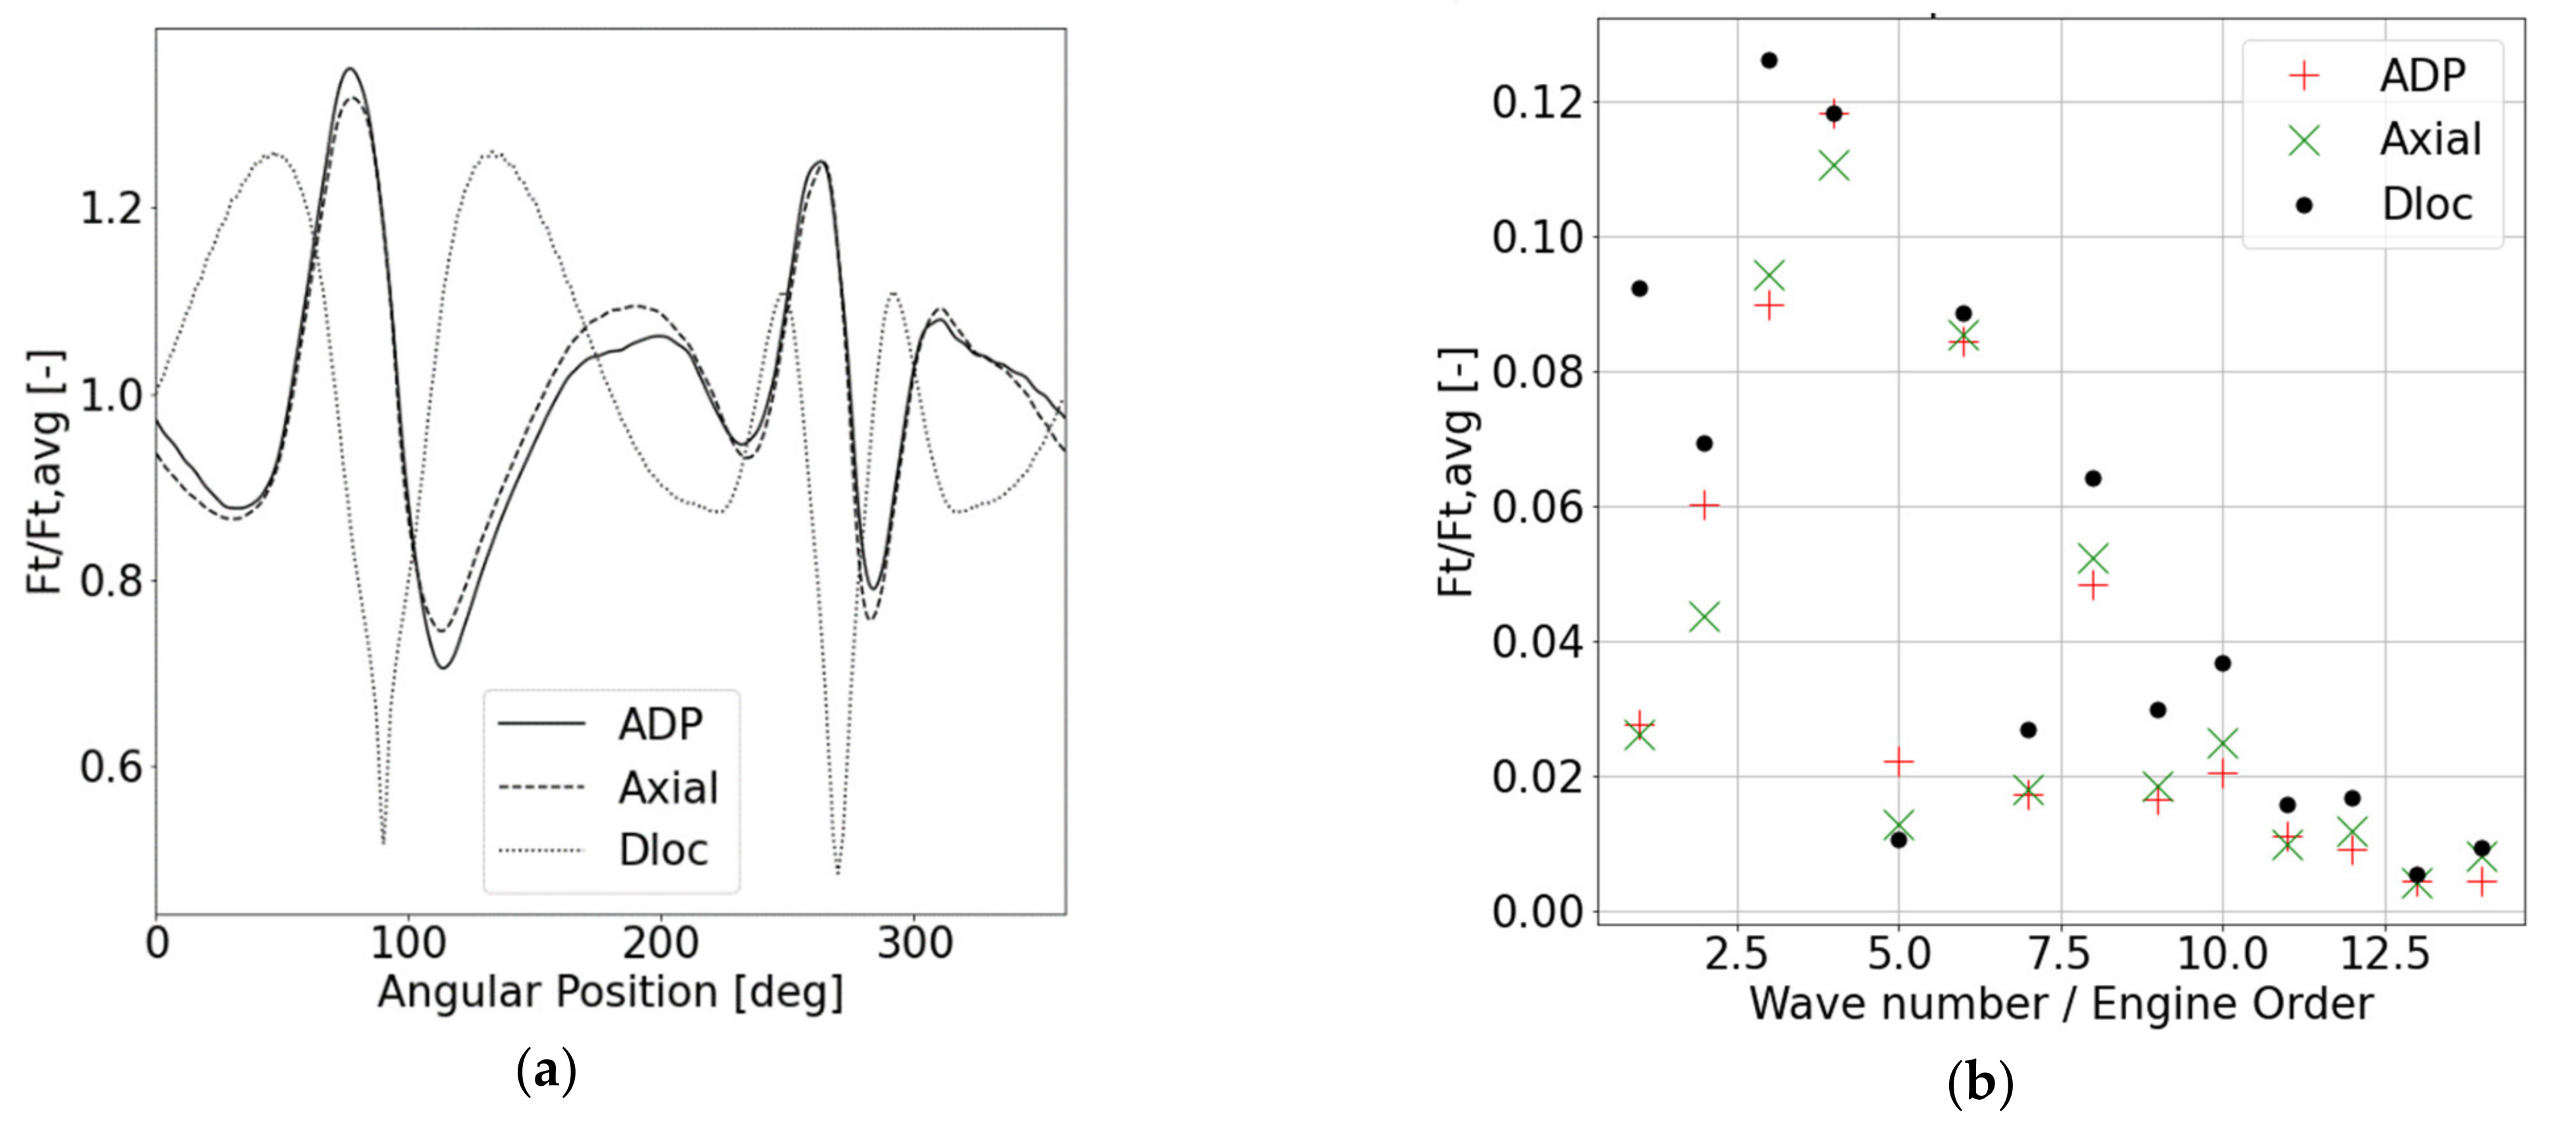
The distortion patterns shown earlier in Figure 9 indicate that we should expect unsteady forcing at the lower engine orders. Blade forces from a full 360° rotation of the fan are evaluated and plotted together with a total pressure variation around the circumference, as referenced in Figure 11. The forces used in the evaluation are the forces in the circumferential direction exerted by the flow onto the blades. The values are normalized with the time-averaged aerodynamic force in the circumferential direction. Through this, the correlation of the blade force with the distortion is examined.
An interesting issue is whether the effect of the total pressure variation over the inlet plane is dominant, or if the swirling flow at the inlet has large effects. This is studied by simply making a comparison of two cases with the same total pressure distribution but different velocity fields at the inflow boundary. The reference model, denoted ADP in Figure 11, uses the total pressure variation and the flow direction taken from the velocity field as computed with the whole aircraft model. The other model, denoted Axial, uses a boundary condition where the same total pressure variation is used as in the reference ADP case, but removing the swirling flow components depicted in Figure 3b. At the inlet boundary, in this case, the flow is axial, but with the same total pressure field. In Figure 11a, the x-axis is the angular position of the rotor could be viewed as negative time passed as the rotor speed is negative. The Dloc parameter, Equation (3), is the radial average of total pressure around the circumference normalized by the dynamic pressure at the inlet, and the definition is:
The blades rotate in the direction of decreasing angle. It appears that a correlation exists, where the force increases when is low, although with some shift in location, which is consistent with findings in [10]. In order to further understand the harmonic force, a Fourier transform is used to describe the force per frequency, and wave number. The circumferential wave number of a disturbance is expected to translate into a blade response at a frequency corresponding to the wave number, m, times the shaft rotational speed, often referred to as an engine order (EO). Figure 11b shows, for the first 14 wave numbers, the amplitudes per wave number of the parameter together with the normalized forces at the corresponding frequencies. The first thing to note is that the forcing levels are the highest at EO = 4, and then decrease towards a higher EO and m. Beyond EO 12, the amplitudes are less than 1/10 of the force at EO = 4, and therefore is not considered of interest. Especially from the Fourier coefficients, it is quite clear that the normalized forces are correlated to the distortion pattern, even as described by the relatively crude approximation of radial averages.
An important observation from the comparison of ADP with Axial is that the differences in forcing are generally small as compared with the absolute value, indicating that the contribution from whirl velocity distortion, in this case, is noticeable but modest. For ADP, the engine order EO = 2 shows a relatively larger difference as comparing with Axial, although not changing the overall picture. This was also noted looking at the distortion transfer in Figure 9, where m = 2 showed less of a reduction in amplitude of the normalized total pressure.
In Figure 12, results from an increased back pressure are added to the graph showing the sensitivity of the forcing to a raised working line. The HI2 operating point is taken at a mass flow that is 91% of the mass flow at ADP, with the same shaft speed and inlet condition. This means that the incidence is generally increased on the blade, with a higher aerodynamic load as a result. The ADP data are re-used in the figure in order to provide a reference for the difference due to increased working line. The general shape of the force spectrum also persists at the lower mass flow, but the forcing levels show a systematic increase over the ADP level for all wave numbers. Taking the root mean square level of the force variation as a measure of the general trend, the increase in forcing coefficient at the HI2 operating point is approximately 20% over the level at ADP.
3.3. Forcing of OGV Blades
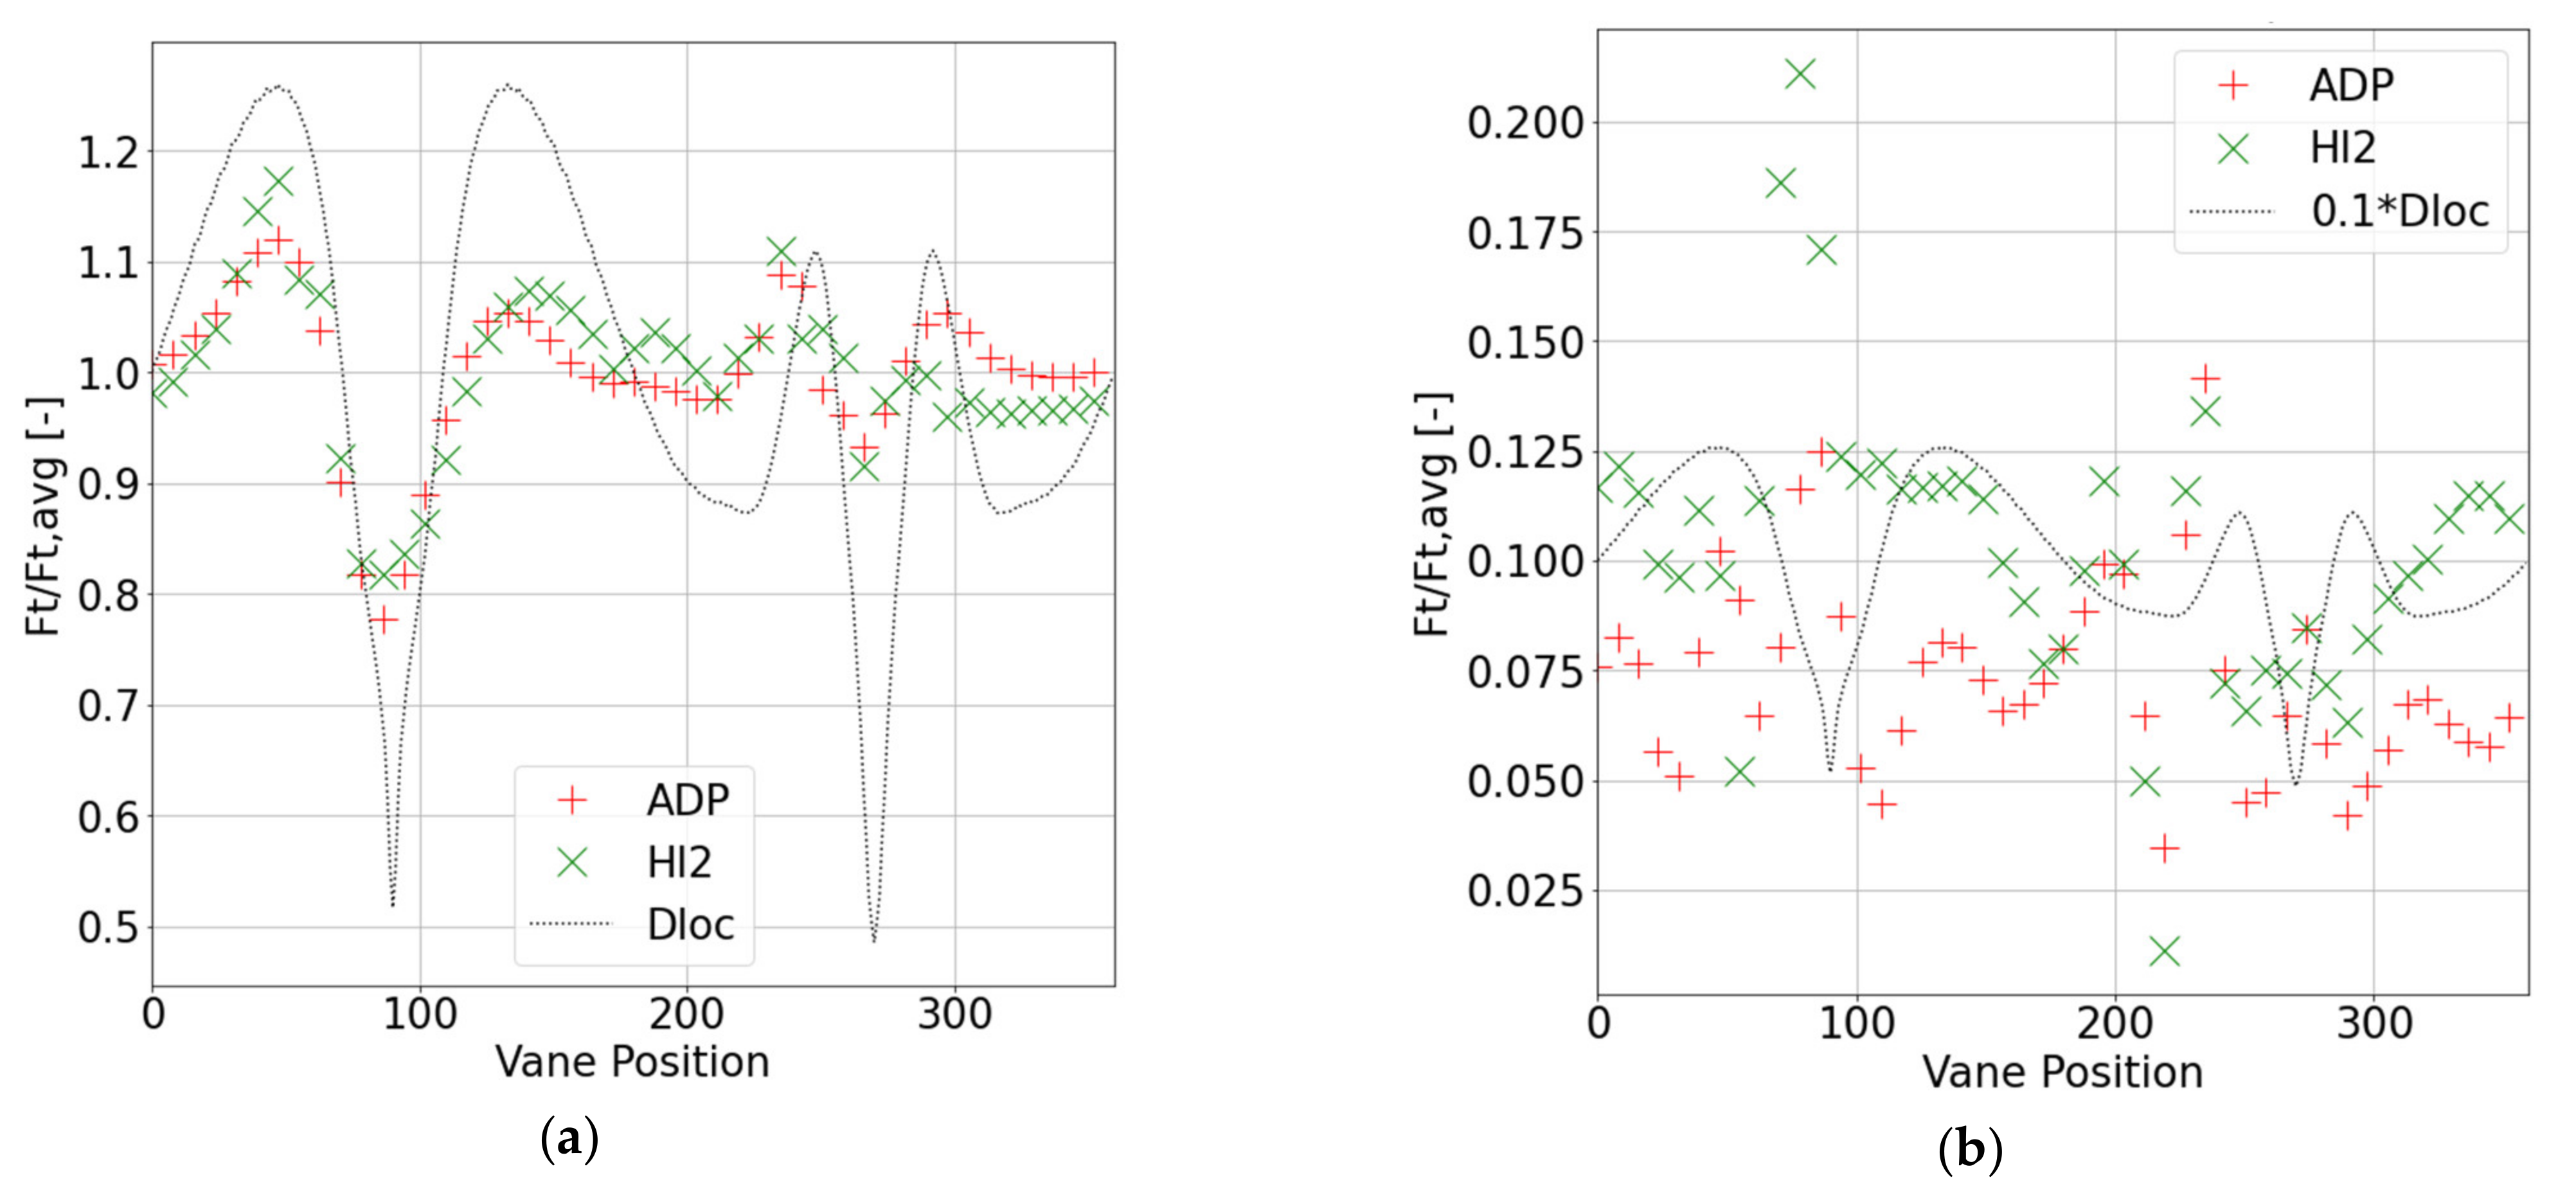
Normally, the time variation is the force exerted on the vanes, due to the passage of the rotor blades. Here, distortion is transferred through the rotor passage which results in a flow field entering the OGV that has both a space pattern of varying flow angles, as well as a time variation. Already looking at the pressure distributions of the different vanes in Figure 10, the suction peaks are severe for some of the vanes. This can be expected to have an effect on the harmonic forcing from the rotor blades onto the OGV. Increasing the back pressure, in the HI2 case, reduces the mass flow to and increases the incidences on both rotor and stator. Figure 13a depicts the time-averaged force variation vane by vane for the ADP case and the HI2 case. Overlaid is also the distortion pattern at the inlet in order to relate the vane positions to the distortion that is the cause of the vane-to-vane variation. Clearly, the load on the individual vanes is correlated with the incoming distortion, but the time-averaged force variation is only slightly affected by the increase in back pressure. The fan has 18 blades, so it is expected that the 18/rev frequency would dominate the harmonic forces on the stator. Figure 13b shows the harmonic forces at the 18/rev frequency for each vane. The harmonic forces are less clearly correlated to the distortion pattern, but also here the amplitudes are generally considerably higher at the HI2 operating point. Despite this, it can be seen that the blades with a high and low response tend to be those found near the distorted sectors. It makes sense as it broadly correlates to the variation of load on the rotor blade, which is the source of the 18/rev variation. For some vanes close to the top, a strong increase is found for the HI2 case when the back pressure is increased. This is likely due to some of the vanes starting to exhibit local separations that respond more strongly to the passing of the rotor. The uneven aerodynamic loading of the vanes in the context of BLI has been noted and discussed before as it can also affect the performance. In [18], the stators are redesigned individually to cope with the non-axisymmetric flow caused by the transferred distortions. Observing the strong increase in the harmonic loading gives cause to consider if non-axisymmetric vane designs could also be less sensitive to increases in back pressure.
4. Conclusions
Transient calculations of a complete fan, subjected to inlet distortion, including all blades and vanes was performed. This is a computationally demanding way to analyze fan aerodynamics, but one that relies on relatively few modeling assumptions. Eventually the mode shape and resonance frequencies are central to whether forcing is a problem in a particular design. The forcing, as studied here, is limited to the force in the circumferential direction, in order to highlight the general behavior. In general, the aerodynamic forces vary around the mean aerodynamic force, with the harmonic amplitudes above 10% of the average force in the circumferential direction. We found that the variation of total pressure over the inlet has a significant general correlation with the harmonic forces up to wave numbers beyond 12, with some exceptions. At higher wave numbers, the forcing diminishes. Above a wave number in the range 10–12, the forces as well the distortion measure dropped by an order of magnitude compared to the force at wave number 4. Removing the non-axial flow components at the inlet had a moderate effect on the forcing for most wave numbers, therefore, on the one hand, the main effect in this case appears to be the variation in total pressure at the inlet rather than swirl components ingested. This could certainly change for other cases but is an interesting finding in this study. Increasing the back pressure increases the incidence on the rotor blades, and increases the forcing amplitudes by moderate amounts, but does not cause any dramatically different conditions. Comparing the forcing of the OGV, on the other hand, shows that some vane individuals exhibit a significantly stronger harmonic forcing at increased back pressures. It is likely that due to the non-axisymmetric loading of the vanes these individuals become prone to separate. A separated region could be more sensitive to the rotor passage and augment the harmonic force. The results suggest that the design can cope with the distortion, but also highlight improvements that can be made to the design. Continued studies should aim to strengthen and generalize the findings and, if possible, formulate simplified models for the forcing.
Funding
This research was funded by the Swedish National Aeronautics Research Program NFFP, grant number 2019-02759 and GKN Aerospace Engine Systems.
Institutional Review Board Statement
Not Applicable.
Informed Consent Statement
Not Applicable.
Data Availability Statement
3rd Party Data. Restrictions apply to the availability of these data. Data was obtained from GKN Aerospace and are available from the author subject to permission of GKN Aerospace.
Acknowledgments
GKN Aerospace also allowed the use of the fan geometry and operating conditions for this research work and publication. In particular Simon Taylor and Anders Sjunnesson who took initiatives to the background design. Martin Laban at NLR, Lars Ellbrant and Max Jacobsson at GKN Aerospace for their contributions in the project and discussions prior to this particular study.
Conflicts of Interest
The author declare no conflict of interest. The funders had no role in the design of the study; in the collection, analyses, or interpretation of data; in the writing of the manuscript. For the decision to publish consent was given by GKN Aerospace Engine Systems.
References
- Smith, A.; Roberts, H. The Jet Airplane Using Boundary Layer Air for Propulsion, J. Aeronaut. Sci. 1947, 14, 97–128. [Google Scholar] [CrossRef]
- Smith, L.H. Wake ingestion propulsion benefit. J. Propuls. Power 1993, 9, 74–82. [Google Scholar] [CrossRef]
- Betz, A. Introduction to the Theory of Flow Machines; Pergamon Press: Oxford, UK, 1966; ISBN 978-0-08-011433-0. [Google Scholar]
- Drela, M. Development of the D8 Transport Configuration. In Proceedings of the 29th AIAA Applied Aerodynamics Conference, American Institute of Aeronautics and Astronautics, Honolulu, HI, USA, 27–30 June 2011. [Google Scholar]
- Uranga, A.; Drela, M.; Greitzer, E.; Titchener, N.; Lieu, M.; Siu, N.; Huang, A.; Gatlin, G.M.; Hannon, J. Preliminary Experimental Assessment of the Boundary Layer Ingestion Benefit for the D8 Aircraft. In Proceedings of the 52nd Aerospace Sciences Meeting, AIAA SciTech Forum AIAA 2014-0906, National Harbor, MD, USA, 13–17 January 2014. [Google Scholar] [CrossRef] [Green Version]
- Welstead, J.; Felder, J.L. Conceptual Design of a Single-Aisle Turboelectric Commercial Transport with Fuselage Boundary Layer Ingestion. In Proceedings of the 54th AIAA Aerospace Sciences Meeting, American Institute of Aeronautics and Astronautics, San Diego, CA, USA, 4–8 January 2016. [Google Scholar] [CrossRef] [Green Version]
- Celestina, M.; Long-Davis, M. Large-scale Boundary Layer Ingesting Propulsor Research, ISABE-2019-24264. In Proceedings of the 24th ISABE Conference, Canberra, Australia, 24–27 September 2019. [Google Scholar]
- Yao, J.; Gorrell, S.E.; Wadia, A.R. High-Fidelity Numerical Analysis of Per-Rev-Type Inlet Distortion Transfer in Multistage Fans—Part I: Simulations With Selected Blade Rows. J. Turbomach. 2010, 132, 041014. [Google Scholar] [CrossRef]
- Yao, J.; Gorrell, S.E.; Wadia, A.R. High-Fidelity Numerical Analysis of Per-Rev-Type Inlet Distortion Transfer in Multistage Fans—Part II: Entire Component Simulation and Investigation. ASME Paper GT2008-50813. In Proceedings of ASME Turbo Expo 2008: Power for Land, Sea, and Air, Berlin, Germany, 9–13 June 2008. [Google Scholar]
- Fidalgo, V.; Hall, C.; Colin, Y. A Study of A Study of Fan-Distortion Interaction Within the NASA Rotor 67 Transonic Stage. ASME J. Turbomach. 2012, 134, 051011. [Google Scholar] [CrossRef]
- Gunn, E.; Hall, C. Aerodynamics of Boundary Layer Ingesting Fans, GT2014-26142. In Proceedings of ASME Turbo Expo, Dusseldorf, Germany, 16–20 June 2014. [Google Scholar]
- Provenza, A.J.; Duffy, K.P.; Bakhle, M.A. Aeromechanical Response of a Distortion Tolerant Boundary Layer Ingesting Fan, GT2018-77094. In Proceedings of ASME Turbo Expo, Oslo, Norway, 11–18 June 2018. [Google Scholar]
- Mårtensson, H.; Ellbrant, L.; Lundbladh, A. Design Conditions For an Aft Mounted Fan With Boundary Layer Ingestion, ISABE-2019-24258. In Proceedings of the 24th ISABE conference, Canberra, Australia, 24–27 September 2019. [Google Scholar]
- Mårtensson, H.; Laban, M. Design and performance of a boundary layer ingestion fan, ASME Paper GT2020-15479. In Proceedings of the ASME Turbo Expo, Virtual, Online, 21–25 September 2020. [Google Scholar]
- Pardo, A.; Hall, C. Aerodynamics of Boundary Layer Ingesting Fuselage Fans, ISABE-2019-24162. In Proceedings of the 24th ISABE conference, Canberra, Australia, 24–27 September 2019. [Google Scholar]
- Menter, F.R. Two-equation eddy-viscosity turbulence models for engineering applications. AIAA J. 1994, 32, 1598–1605. [Google Scholar] [CrossRef] [Green Version]
- Cornelius, C.; Biesinger, T.; Galpin, P.; Braune, A. Experimental and Computational Analysis of a Multistage Axial Compressor Including Stall Prediction by Steady and Transient CFD Methods. ASME. J. Turbomach. 2014, 136, 061013. [Google Scholar] [CrossRef]
- Gunn, E.; Hall, C. Non-Axisymmetric Stator Design For Boundary Layer Ingesting Fans, GT2017-63082. In Proceedings of ASME Turbo Expo, Charlotte, NC, USA, 26–30 June 2017. [Google Scholar]
Figure 1.
GKN/Fokker 100 tail cone thruster (TCT) concept and pressure distribution over the whole aircraft computational fluid dynamics (CFD).
Figure 1.
GKN/Fokker 100 tail cone thruster (TCT) concept and pressure distribution over the whole aircraft computational fluid dynamics (CFD).

Figure 2.
Computational domains. (a) Inflow plane to outlet at nozzle; (b) overview of fan module; (c) meshes over blade surfaces; (d)mesh showing resolution in the blade-to-blade plane.
Figure 2.
Computational domains. (a) Inflow plane to outlet at nozzle; (b) overview of fan module; (c) meshes over blade surfaces; (d)mesh showing resolution in the blade-to-blade plane.

Figure 3.
Inlet boundary plane. (a) Total pressure coefficient; (b) in-plane swirl direction vectors.
Figure 3.
Inlet boundary plane. (a) Total pressure coefficient; (b) in-plane swirl direction vectors.

Figure 4.
Comparing sensitivities to turbulence model and time stepping. (a) On the force as a function of time; (b) on the force per wave number.
Figure 4.
Comparing sensitivities to turbulence model and time stepping. (a) On the force as a function of time; (b) on the force per wave number.

Figure 5.
Comparing effects of two consecutive cycles and the effect of mesh size. (a) On the force as function of time; (b) on the force per wave number.
Figure 5.
Comparing effects of two consecutive cycles and the effect of mesh size. (a) On the force as function of time; (b) on the force per wave number.

Figure 6.
Axial case variation 1 axial chord upstream of the rotor leading edge. (a) Static pressure variation; (b) relative whirl angle.
Figure 6.
Axial case variation 1 axial chord upstream of the rotor leading edge. (a) Static pressure variation; (b) relative whirl angle.

Figure 7.
Whirl angle variation 1 axial chord upstream of the rotor leading edge. (a) Stationary frame; (b) in the relative frame.
Figure 7.
Whirl angle variation 1 axial chord upstream of the rotor leading edge. (a) Stationary frame; (b) in the relative frame.

Figure 8.
(a) Static pressure field at one instant; (b) total pressure coefficients over a plane downstream of the outlet guide vane (OGV) X = 385 mm.
Figure 8.
(a) Static pressure field at one instant; (b) total pressure coefficients over a plane downstream of the outlet guide vane (OGV) X = 385 mm.

Figure 9.
Radial averages of total pressure. (a) As a function of circumferential angle; (b) as a function of wave number, 1 chord upstream of the leading edge at X = −150 mm and downstream of the OGV at X = 385 mm.
Figure 9.
Radial averages of total pressure. (a) As a function of circumferential angle; (b) as a function of wave number, 1 chord upstream of the leading edge at X = −150 mm and downstream of the OGV at X = 385 mm.

Figure 10.
Pressure coefficient distributions at ADP 90% span. (a) Fan blade; (b) outlet guide vane (OGV).
Figure 10.
Pressure coefficient distributions at ADP 90% span. (a) Fan blade; (b) outlet guide vane (OGV).

Figure 11.
Blade forcing for ADP and Axial with reference distortion Dloc. (a) As a function circumferential position; (b) Fourier component amplitudes.
Figure 11.
Blade forcing for ADP and Axial with reference distortion Dloc. (a) As a function circumferential position; (b) Fourier component amplitudes.

Figure 12.
Blade forcing for ADP and HI2 with reference distortion Dloc. (a) As a function circumferential position; (b) Fourier component amplitudes.
Figure 12.
Blade forcing for ADP and HI2 with reference distortion Dloc. (a) As a function circumferential position; (b) Fourier component amplitudes.

Figure 13.
Normalized forces of the OGVs. (a) Time average variation per vane; (b) the 18/rev amplitude per vane.
Figure 13.
Normalized forces of the OGVs. (a) Time average variation per vane; (b) the 18/rev amplitude per vane.


Table 1.
TCT design table for aerodynamic design point (ADP).
| Diameter | (m) | 1.2 |
|---|---|---|
| Shaft speed | (rpm) | 4419 |
| Fan total pressure ratio | (-) | 1.3 |
| Fan efficiency | (-) | >90% |
| Electric power, target | (kW) | <1000 |
| Altitude | (ft) | 35,000 |
| Flight speed, Ma | (-) | 0.74 |
Publisher’s Note: MDPI stays neutral with regard to jurisdictional claims in published maps and institutional affiliations. |
© 2021 by the author. Licensee MDPI, Basel, Switzerland. This article is an open access article distributed under the terms and conditions of the Creative Commons Attribution (CC BY) license (http://creativecommons.org/licenses/by/4.0/).
Share and Cite
MDPI and ACS Style
Mårtensson, H. Harmonic Forcing from Distortion in a Boundary Layer Ingesting Fan. Aerospace 2021, 8, 58. https://0-doi-org.brum.beds.ac.uk/10.3390/aerospace8030058
AMA Style
Mårtensson H. Harmonic Forcing from Distortion in a Boundary Layer Ingesting Fan. Aerospace. 2021; 8(3):58. https://0-doi-org.brum.beds.ac.uk/10.3390/aerospace8030058
Chicago/Turabian StyleMårtensson, Hans. 2021. "Harmonic Forcing from Distortion in a Boundary Layer Ingesting Fan" Aerospace 8, no. 3: 58. https://0-doi-org.brum.beds.ac.uk/10.3390/aerospace8030058
Note that from the first issue of 2016, this journal uses article numbers instead of page numbers. See further details here.