Article

Generation and Mitigation Mechanism Studies of Nonlinear Thermoacoustic Instability in a Modelled Swirling Combustor with a Heat Exchanger †

1
Department of Mechanical Engineering, College of Engineering, University of Canterbury, Christchurch 8041, New Zealand
2
Department of Mechanical Engineering, Eindhoven University of Technology, 5600 MB Eindhoven, The Netherlands
*
Author to whom correspondence should be addressed.
This paper is a modified version of our paper “Numerical Study of Nonlinear Self-sustained Thermoacoustic Instability in a Swirling Combustor” published at the AIAA Propulsion and Energy 2020 Forum, 24–28 August 2020, VIRTUAL EVENT.
Submission received: 26 December 2020 / Revised: 11 February 2021 / Accepted: 21 February 2021 / Published: 26 February 2021

Abstract

:
In the present work, 3D Unsteady Reynolds-Averaged Navier-Stokes (URANS) simulations are performed to investigate the generation and mitigation mechanism of combustion-sustained thermoacoustic instabilities in a modelled swirl combustor. The effects of (1) swirling number SN, (2) inlet air flow rate Va and (3) inlet temperature Ti on the amplitudes and frequencies of swirling combustion-excited limit cycle oscillations are examined. It is found that the amplitude of acoustic fluctuations is increased with increasing SN and Va and decreased with the increase of Ti. The dominant frequency of oscillations is also found to increases with the increase of SN and Va. However, increasing Ti leads to the dominant frequency being decreased first and then increased. An alternative passive control method of installing an adjustable temperature heat exchanger on the combustion chamber wall is then proposed. Numerical results show that thermoacoustic oscillations could be excited and mitigated by setting the heat exchanger temperature to TH. Global and local Rayleigh indexes are applied to further reveal the excitation and attenuation effects on mechanisms. The present study is conducive to developing a simulation platform for thermoacoustic instabilities in swirling combustors. It also provides an alternative method to amplify or mitigate thermoacoustic oscillations.

1. Introduction

Energy efficiency and pollutant emissions have become increasingly global concerns [1]. Lean premixed combustion is an effective method for reducing chemical emission of NOx and enhancing combustion efficiency [2]. However, lean premixed flames usually encounter unwanted issues such as thermoacoustic instability, flashback, and blow-off [3,4]. An attendant problem of thermoacoustic instability is often large amplitude pressure oscillation [5]. Thermoacoustic instability originates from the feedback loop between flow perturbations, heat release and acoustic oscillations [6]. It occurs when the ‘driving’ effect generated by in-phase coupling between the unsteady heat release rate and acoustic fluctuations is greater than the ‘damping’ effect from viscosity, heat transfer, sound radiation, etc. [7]. Thermoacoustic instability would severely aggravate the pollution and noise emission of combustor [8]. It also causes other problem such as structural vibration and overheating [9]. Consequently, these undesirable issues induced by thermoacoustic instability may result in system failure. [10].
Swirling flows have favorable effects on the combustion process [11]. Swirling flow can reduce the flame length by enhancing the mixing between fuel and air [12]. The formation of a recirculation zone in strongly swirling regions can improve the stability of the flame [13]. Therefore, swirling flow generators are widely introduced in various types of gas-turbine engines to stabilize high-intensity flames so they remain efficient and clean [14]. Intensive experimental studies have been conducted to investigate the interaction between swirling flow and flames to better understand, predict and control thermoacoustic instability. Kim et al. [15] performed an experimental study to evaluate the effect of thermal power operating conditions and combustor length on the amplitude and frequency of pressure. Han et al. [16] developed a novel double-swirled combustion system to investigate the correlation between flame macrostructures and thermoacoustic combustion instabilities. Karlis et al. [17] investigated the dynamic and structure of hydrogen-enriched methane swirling flames. It was found that flame shape and thermoacoustic oscillation dynamics varied dramatically with H2 molar content. Thermoacoustic behaviors both under stationary conditions and during transient conditions are examined by Bonciolini et al. [18]. Results show that instabilities during transient conditions are caused by increasing wall temperature when operating parameters are changed.
In addition, the relationship between swirl flow and thermoacoustic instability has been studied numerically by means of computational fluid dynamics (CFD) simulations [19]. Huang et al. [20] examined swirling intensity effects on the pressure and heat release fluctuations of swirling flames by conducting a large eddy simulation (LES). The recirculation regions generated by swirling flow were found to play a significant role in flow–flame interactions. Choi et al. [21] conducted direct numerical simulations (DNS) on a premixed swirling combustor. Results indicate that the near-stagnant breakdown zone originates from swirling flow instability, which is affected by swirling number, tube length, end conditions, and flow exothermicity. Choi et al. [22] conducted a numerical simulation using Reynolds-Averaged Navier-Stokes (RANS) technique to study the flame structure and NOx and CO emission in a partially premixed dual swirl combustor. The effects of various swirl combinations and syngas compositions were examined.
Thermoacoustic instabilities can be mitigated by breaking the feedback loop between unsteady heat release rate and acoustic oscillations [23]. There are two classical methods for its suppression, which are the active and passive control methods [24]. Active control is typically applied by using a dynamic actuator [25]. Paschereit et al. [26] applied the active control method by using an acoustic actuation on a premixed swirl-stabilized combustor. Pressure oscillations and NOx emissions are reduced after the implementation of control actions. However, active control methods are always involved in complex control systems [27]. Suitable parameters for control have to be determined in advance of the experiment [28]. Passive control methods are typically implemented by carrying out modification of the combustors such as applying quarter-wave resonators, Helmholtz resonators, and perforated liners [29]. Williams et al. [30] installed a ring porous insert at the inlet plane of a swirling combustor. Experiment results showed that the porous insert could attenuate thermoacoustic instability by changing flow field characteristics in such combustors. However, it is costly and inflexible to modify the combustion chamber structure [31]. To address the drawbacks of passive and active methods, alternative methods have recently been proposed. Wu et al. [32,33] performed experiments on three types of Rijke-type combustors, including a conventional Rijke tube, a Y-shaped tube and a T-shape tube. It was found that limit-cycle oscillations could be mitigated by inserting an electrical heater in certain areas of the combustor. Mahesh et al. [34] reported a novel strategy for controlling thermoacoustic instability by rotating a swirler in a laboratory premixed combustor. To the best knowledge of the authors, there is a lack of detailed investigation on developing an alternative approach (such as a heat exchanger) to attenuate thermoacoustic instability in a modelled swirling combustor. This motivated the present work.
In this work, 3D Unsteady Reynolds-Averaged Navier-Stokes (URANS) numerical simulations are conducted to investigate the self-sustained thermoacoustic instability in a modelled swirling combustor. The paper structure is organized as follows. Section 2 introduces the physical model and numerical methods. Section 3 presents the results and discussions of the numerical validations and effect of swirling number SN, incoming air flow rate Va and inlet temperature Ti, respectively. Further investigation into the temperature of the heat exchanger, TH, is presented in Section 4 Finally, the main conclusions of this paper are presented in Section 5.

2. 3 D Model and Numerical Method

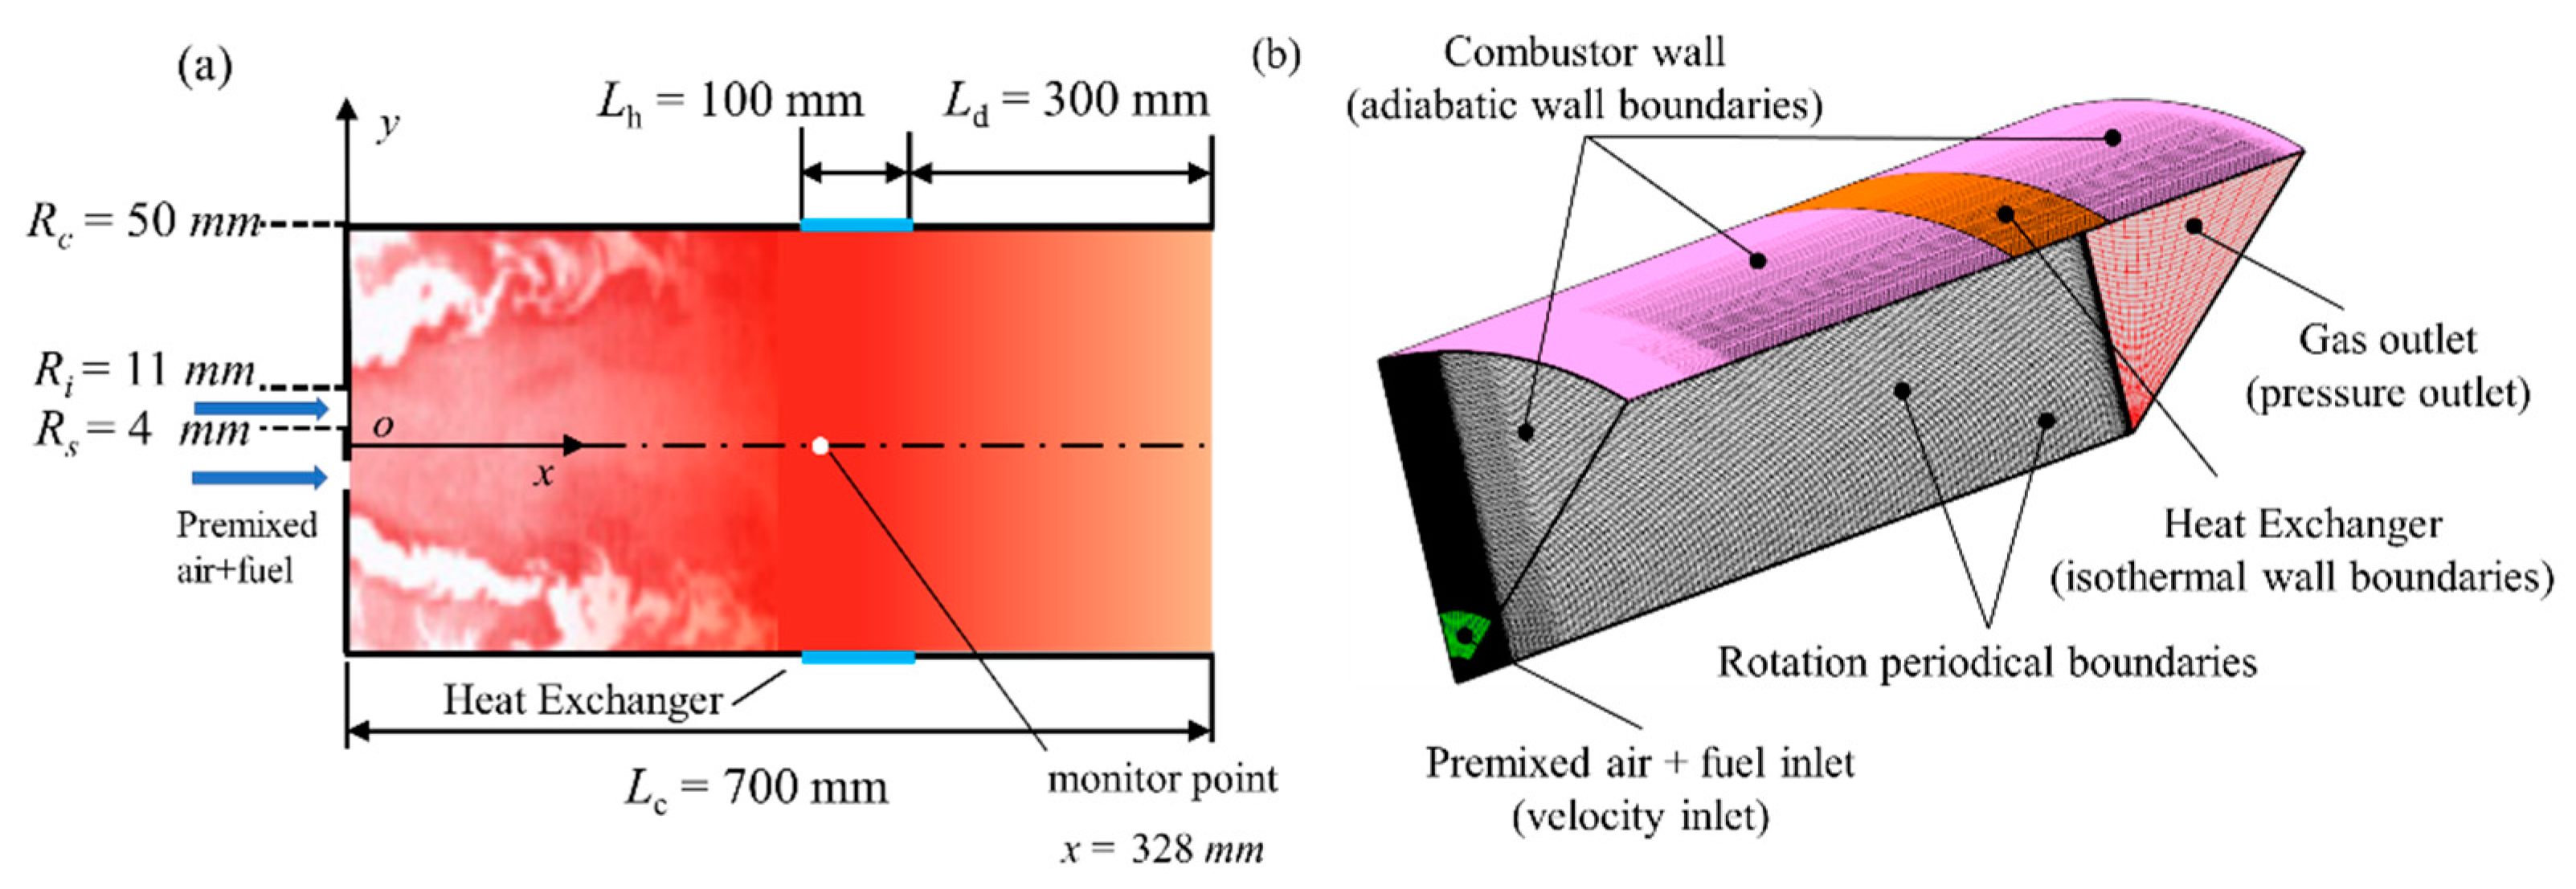
2.1. Combustor Geometry and Boundary Conditions

Figure 1 shows a diagram of the present computational domain [35]. To save computational time, we neglect the swirler vanes, and only a 1/8th segment of the combustor with rotational periodic boundary conditions is adopted for computations, which has been applied and verified in a previous study [36]. Moreover, an individual simulation by using a whole domain and a 1/8 sector domain are applied to figure out the discrepancy of simulation results. The comparison results are supplemented in Appendix A. The key geometrical parameters are shown in Figure 1a. The inlet boundary condition is a Dirichlet for velocity and temperature, which can be regarded as an acoustic closed boundary. Premixed CH4/air with an air flow rate of 130–250 L/min, equivalence ratio of 0.9, inlet temperature of 300–600 K and swirling number of 0.34–0.6 flows into the combustor from the annular inlet. Pressure is outlet of 0 Pa relative pressure treated as an acoustically opened boundary condition is applied at the domain exit. The combustor wall boundaries are defined as adiabatic non-slip walls. The wall where the heat exchanger is located is treated as an iso-thermal boundary condition.

2.2. Governing Equations and Numerical Set-Up

Fully compressible Unsteady Reynolds-Averaged Navier-Stokes (URANS) are solved including mass, momentum, energy, and species transport equations:
(1) Mass conservation equation:
ρ t + ( ρ v ) = 0
(2) Momentum equation:
t ( ρ v ) + ( ρ v v ) = ρ + ( τ = τ i j )
(3) Energy conservation equation:
t ( ρ E ) + ( v ( ρ E + p ) ) = ( k e f f T j h i J i + ( τ e f f v ) ) + S h
(4) Species conservation equation:
t ( ρ Y i ) + ( ρ v Y i ) = J i + ω i
(5) Thermodynamic equation:
ρ = p ( R g / M w ) T
where   ρ , p and t are density, pressure and time, respectively. v is the velocity vector. τ i j is Reynolds stress tensor. E is the total energy, keff is the effective conductivity, h i and J i   are the enthalpy and diffusion flux of species i, Sh is the fluid enthalpy source, Yi is the mass fraction, ω i   is the reaction rate of species i, Rg is the universal gas constant, and Mw is the mean molecular weight.
The Re-Normalization Group (RNG) k-ε model is selected as the turbulence model and The Eddy-dissipation-concept (EDC) model was used for dealing with the combustion process in cases involving a 2-step global reaction mechanism [37]. The boundary conditions, numerical settings and schemes are summarized in Table 1. In the present work, all numerical simulations were performed based, a commercial CFD software, ANSYS FLUENT 19.1.

3. Results and Discussion

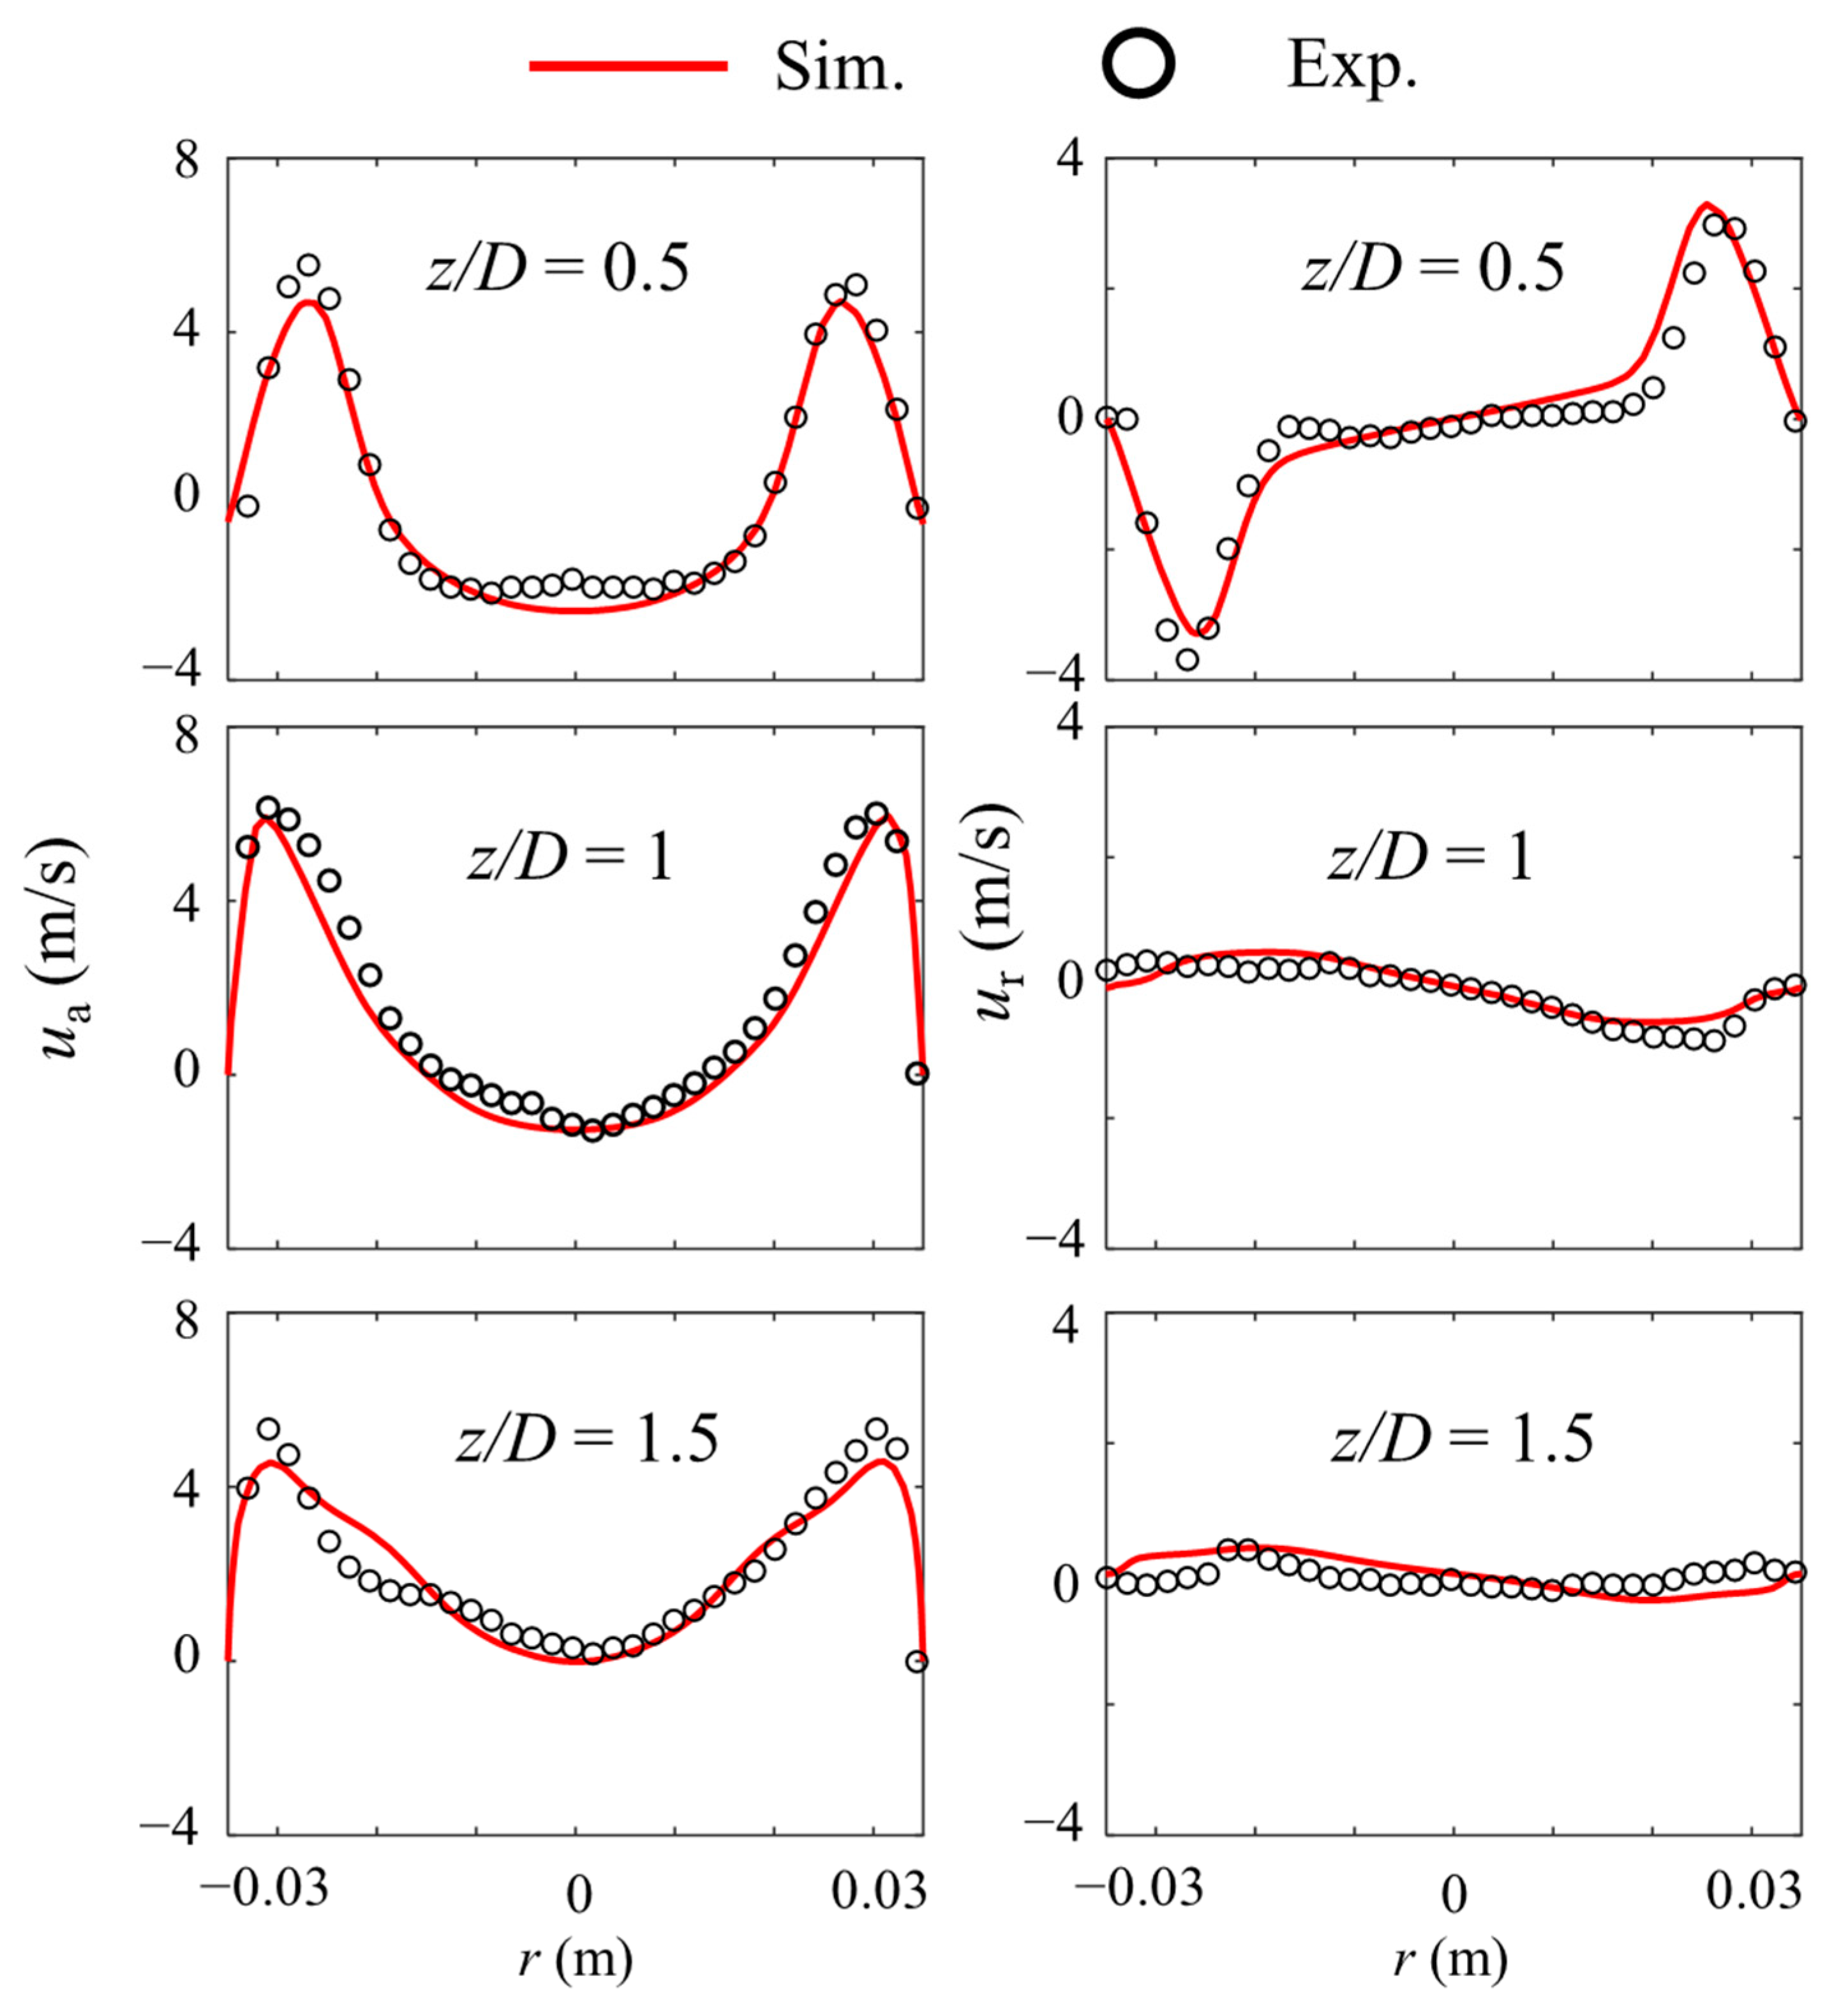
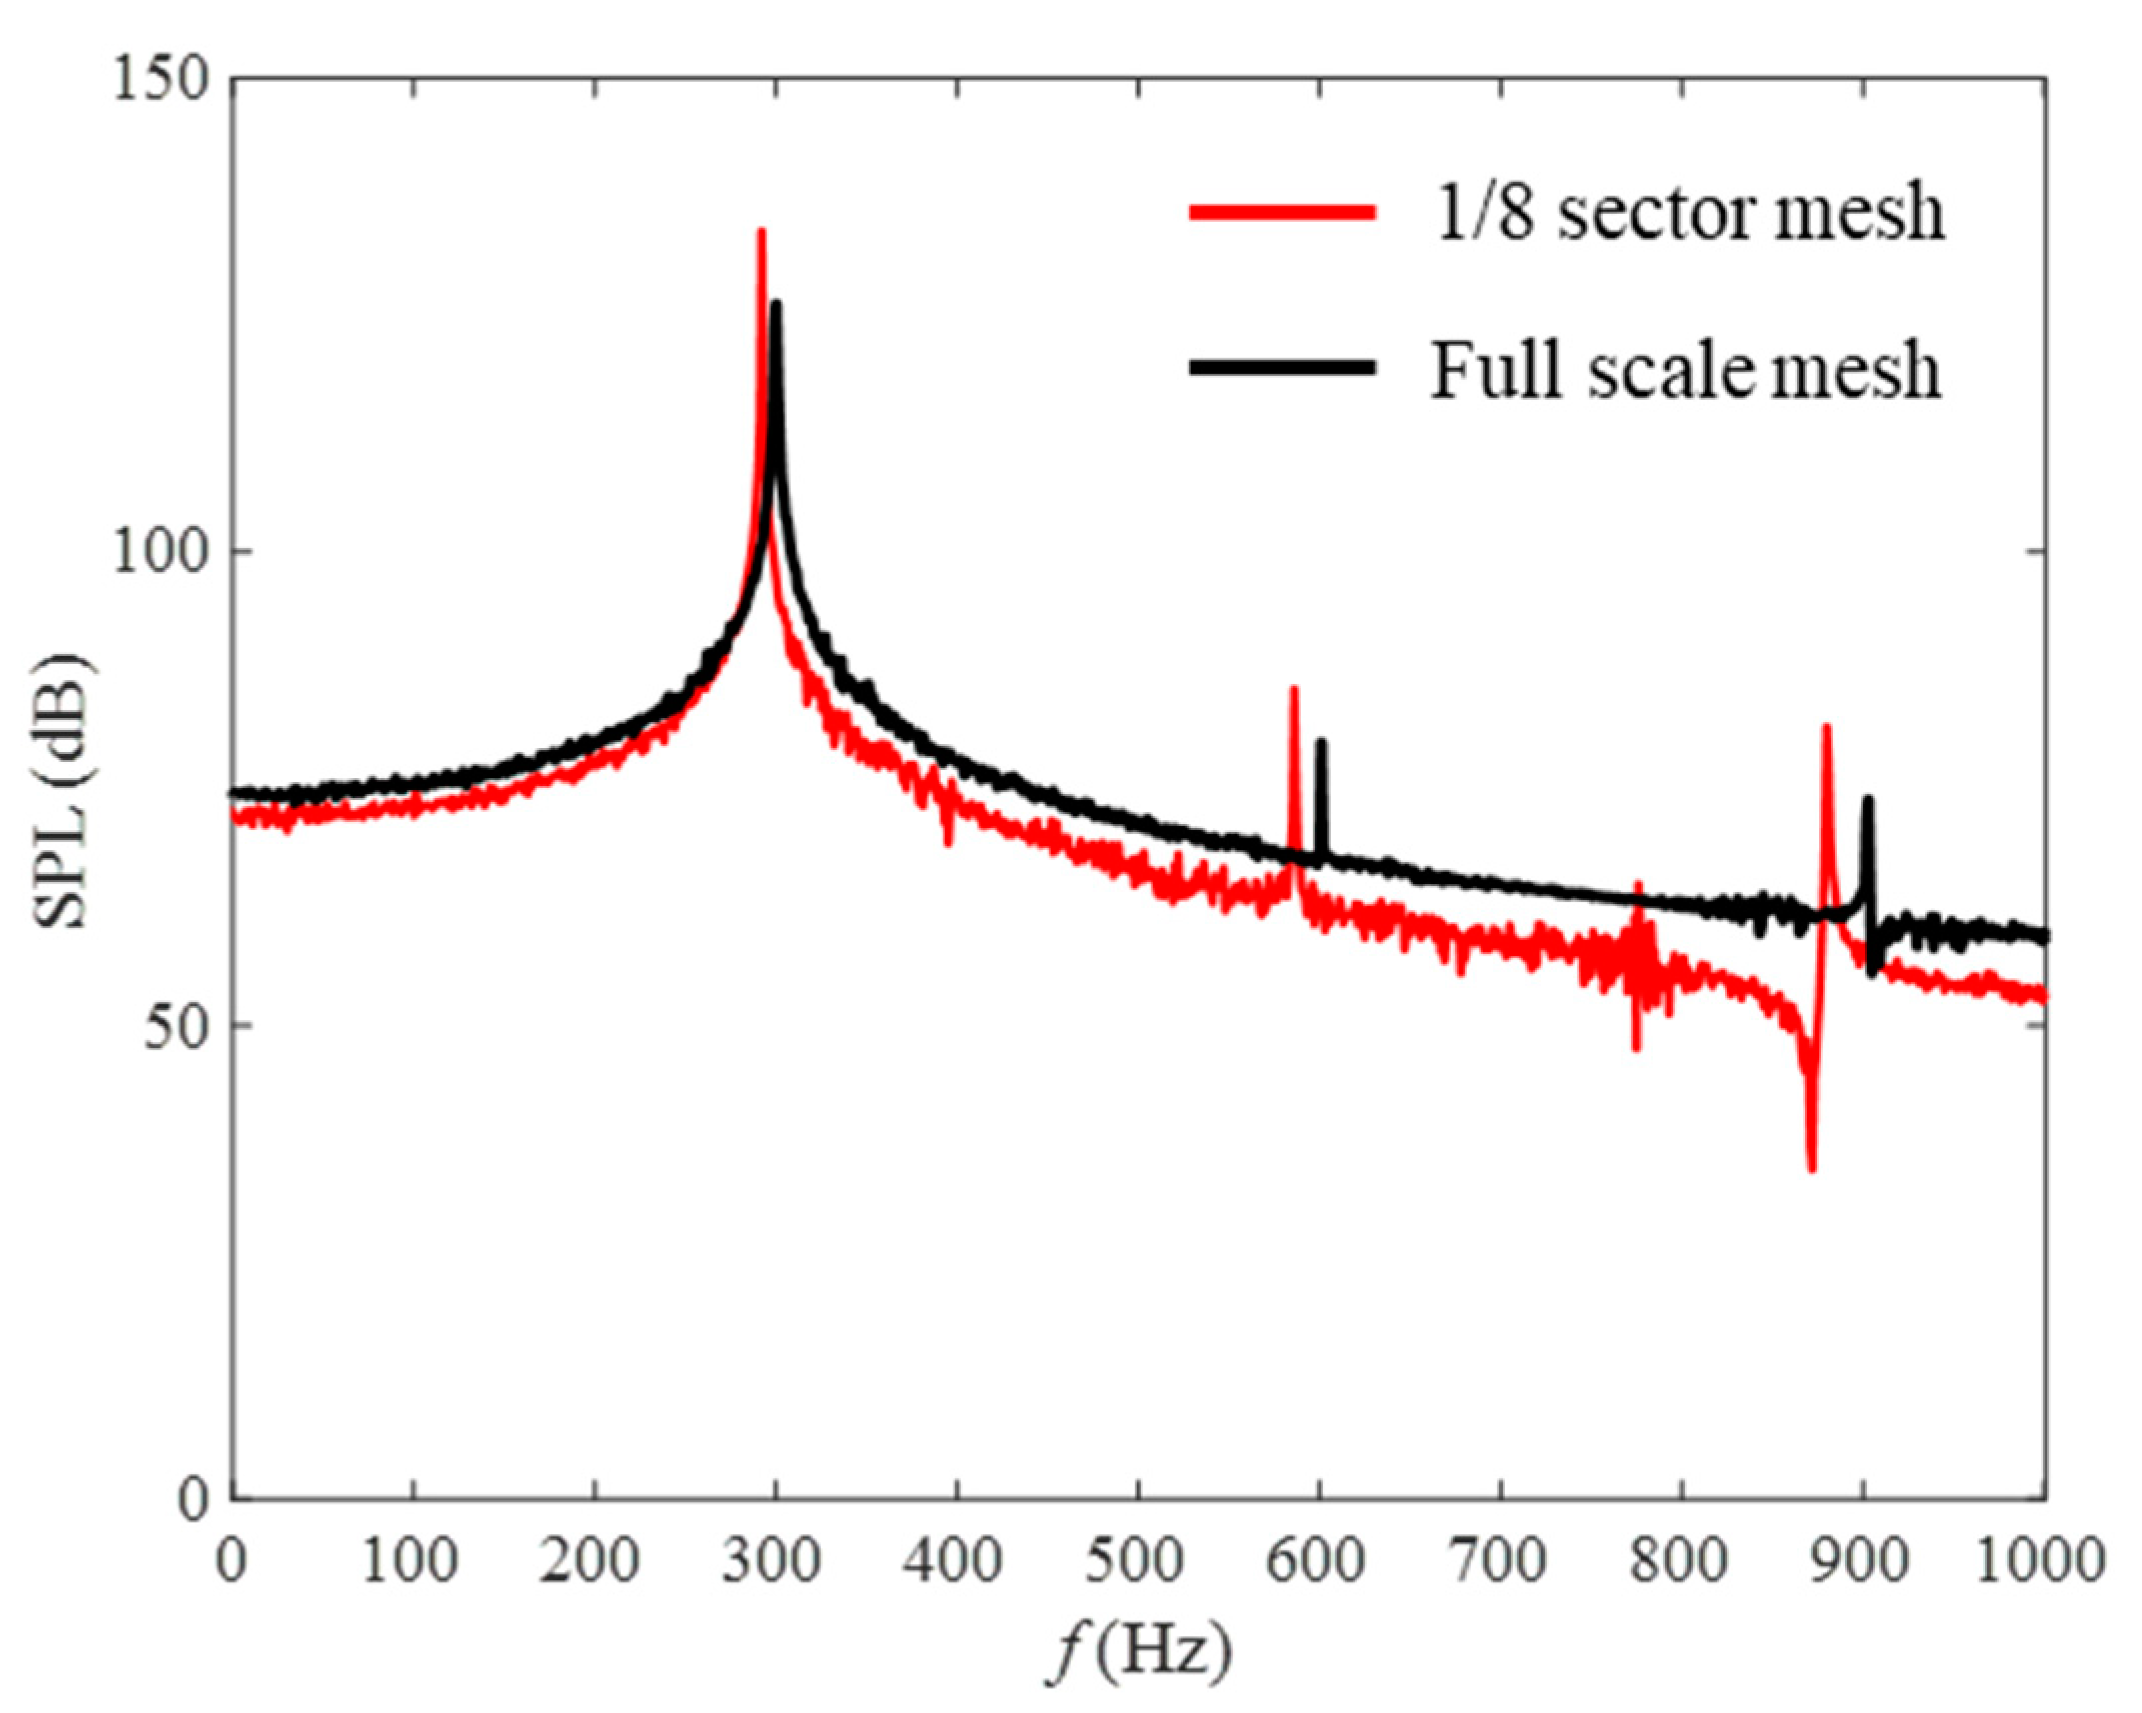
3.1. Model Validation and Mesh-Independence Study

To reach a better prediction of the combustion and its gradients, the grid of flame area is refined. Three different meshes are used to perform a mesh-independence study. The cell numbers are 0.1 M, 0.5 M and 1.0 M, respectively. The mesh-independence study results in Figure 2 show that the grid with 0.5 M cells presents sufficient resolution for further investigations. In addition, as shown in Figure 3, reacting flow validation is performed by comparing mean velocity profiles at different cross sections obtained from the experimental measurement conducted by Zhang et al. [38] and present simulation. The difference between the simulation results and experiment measurement is minor, which is acceptable for RANS simulations.

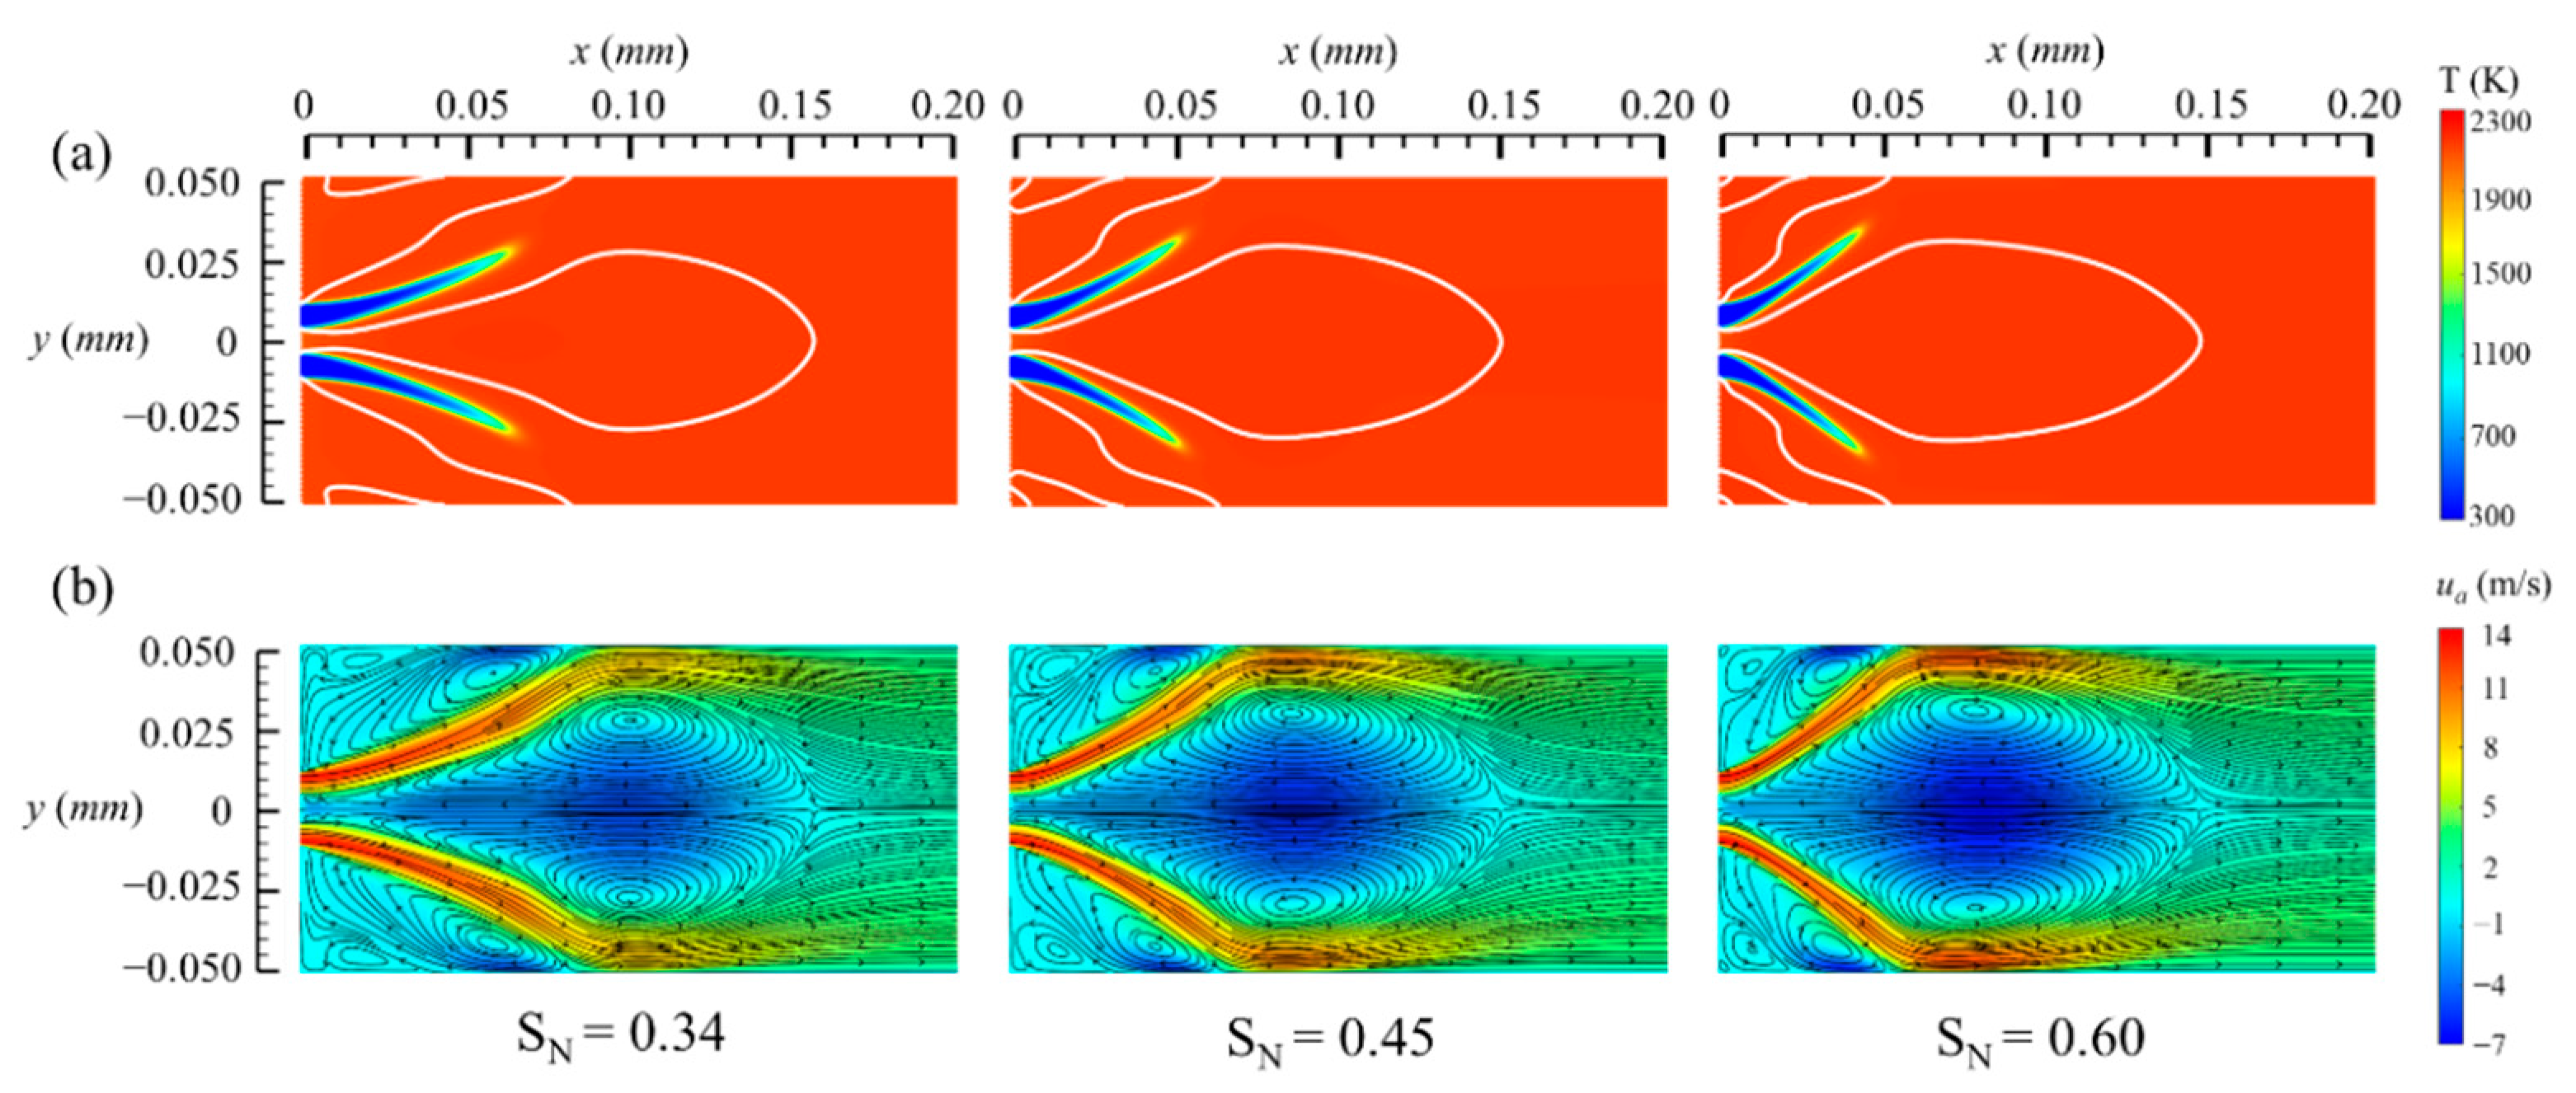
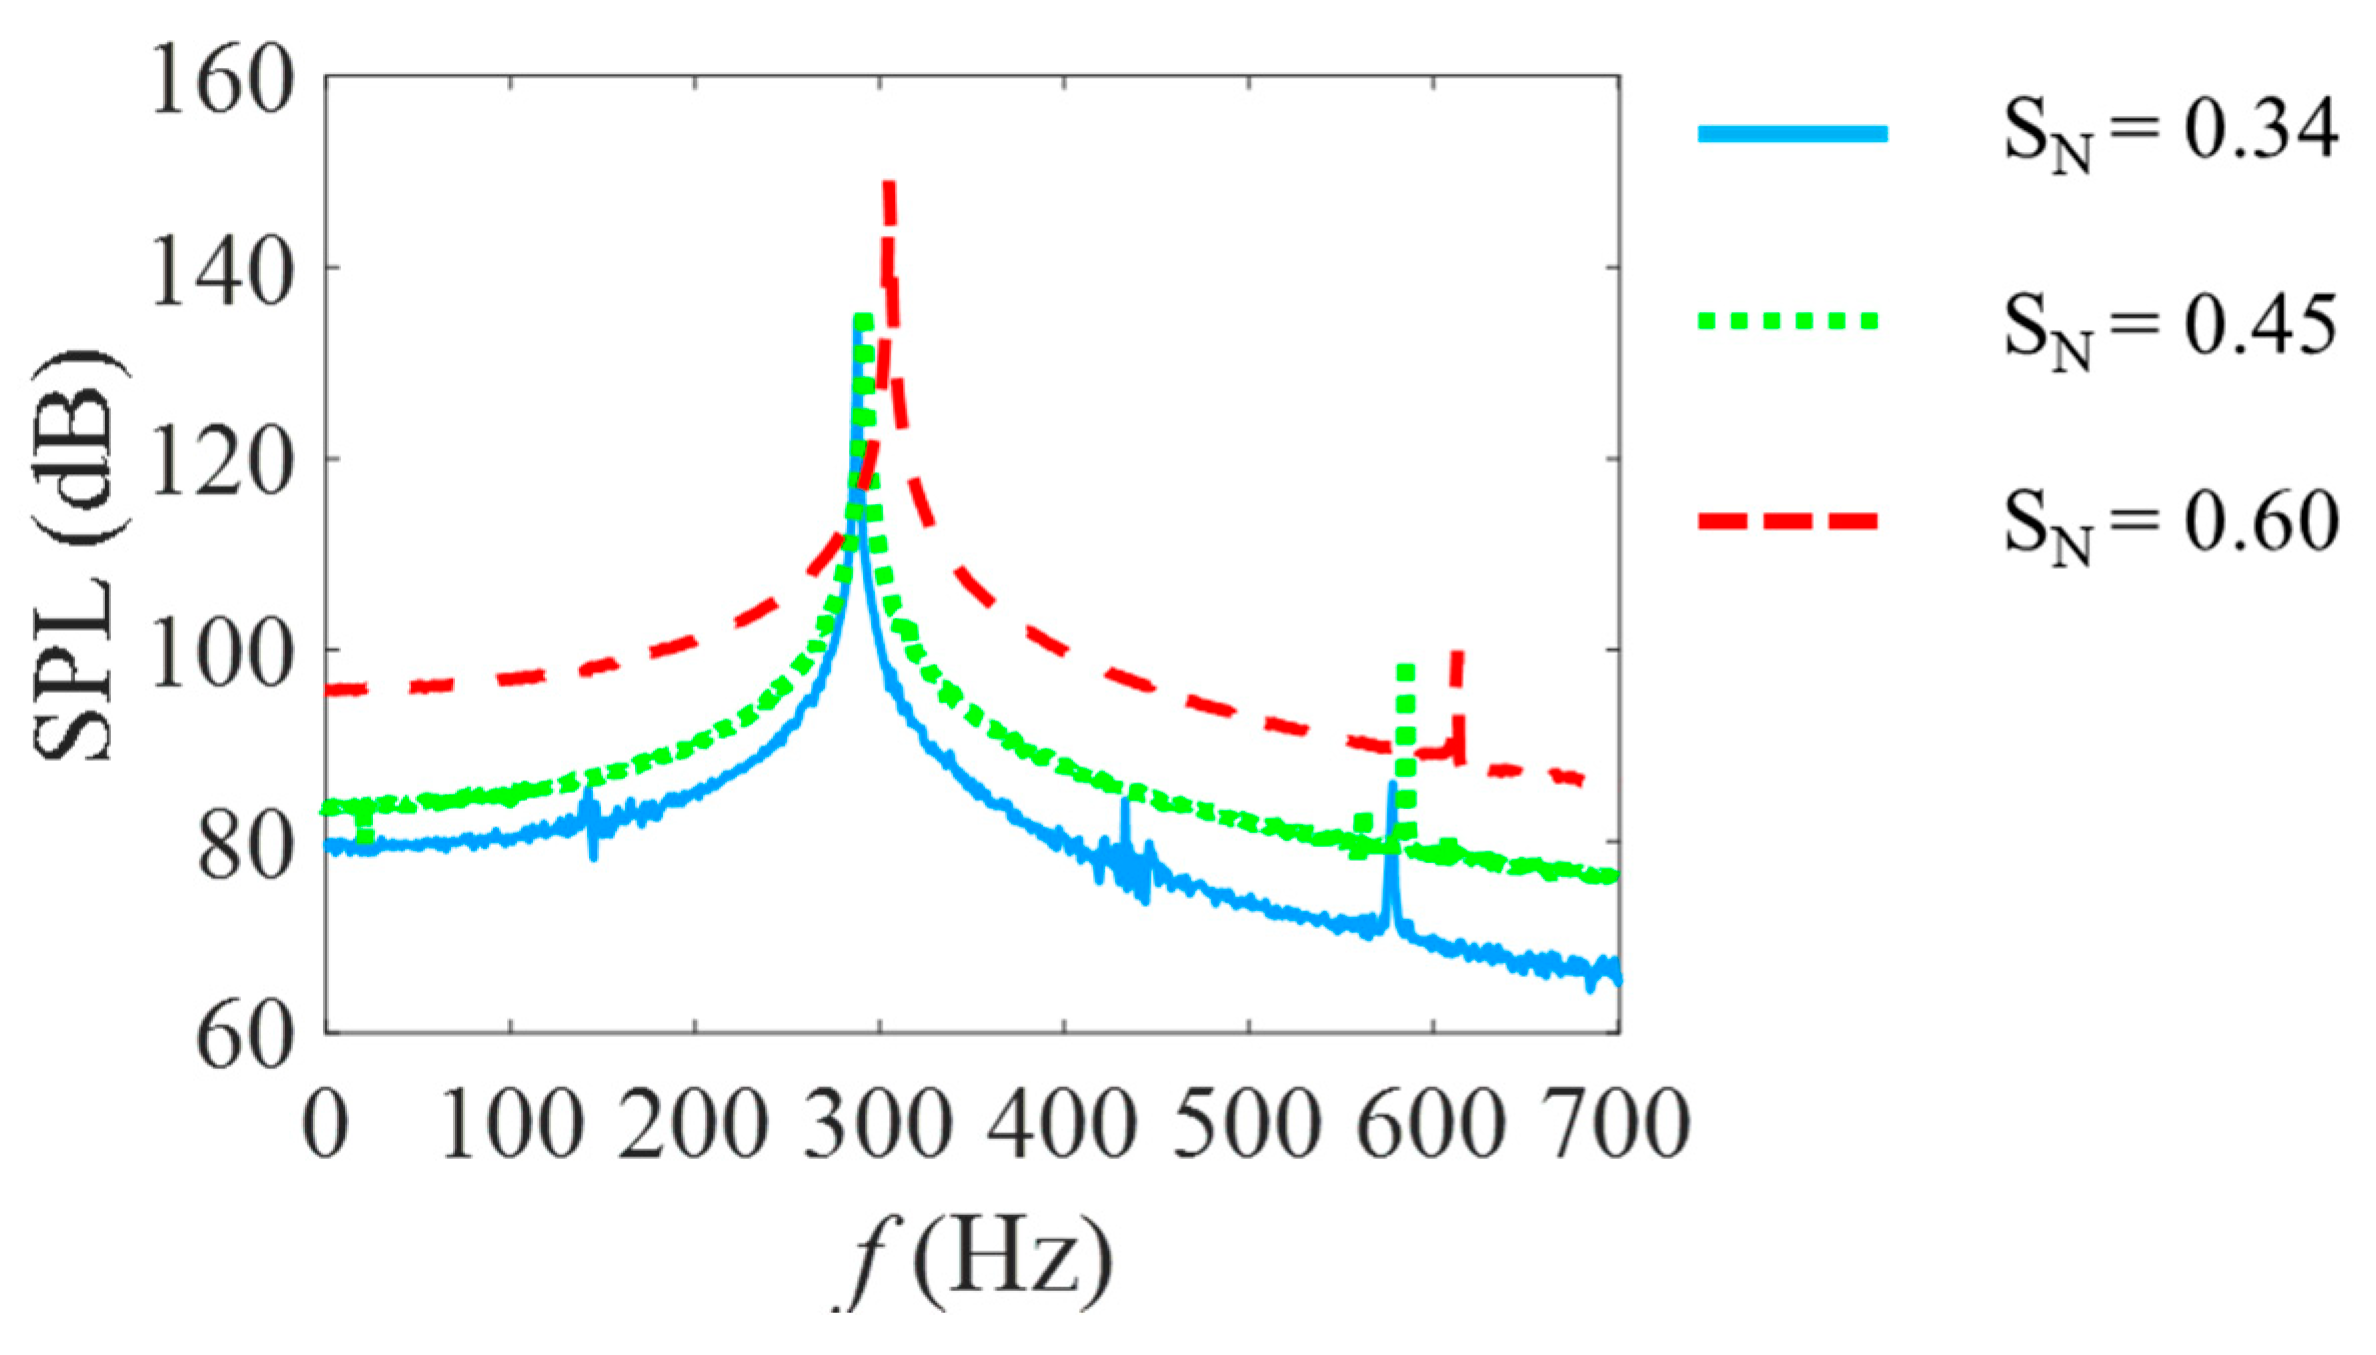
3.2. Effect of Swirling Number SN

The swirling number effect is examined firstly in this section. Simulations are conducted with three different swirling numbers. It can be seen from Figure 4a that V-shaped swirling flames are observed in all swirling number conditions. In Figure 4a, the white line represents the zero-axial velocity iso-line, which can be used to identify the recirculation zones. As the swirling number is increased, vortex centers in both the corner recirculation zone (CRZ) and central toroidal recirculation zone (CTRZ) move upstream. The lengths of both CRZ and CTRZ are shortened. Flame tips move toward the combustor wall, and the flame angle is increased. Figure 4b illustrates axial velocity distributions and streamlines. It can be seen that, at high swirl numbers, the negative axial velocity is higher in the recirculation zone. The wake recirculation zone (WRZ) is observed behind the center rod at SN = 0.34; however, disappears at a higher swirling number. This phenomenon can be explained by the fact that the ratio of axial momentum to tangential momentum is larger near the center rod in low swirling number conditions.
Figure 5a–c shows the pulsating characteristics of the combustor in three SN conditions. Pressure fluctuations data are collected from a probe located inside the combustor (at x = 328 mm, y = 0 mm and z = 0 mm). Limited cycle oscillations are successfully built in all three SN conditions. As SN is increased, the amplitude of pressure fluctuations is increased and reaches around 710 Pa at SN = 0.6. In Figure 6, the dominant frequency of pressure oscillation is observed to shift to a higher frequency with the increase of SN, from 290 Hz at SN = 0.34 to 307 Hz at SN = 0.6.

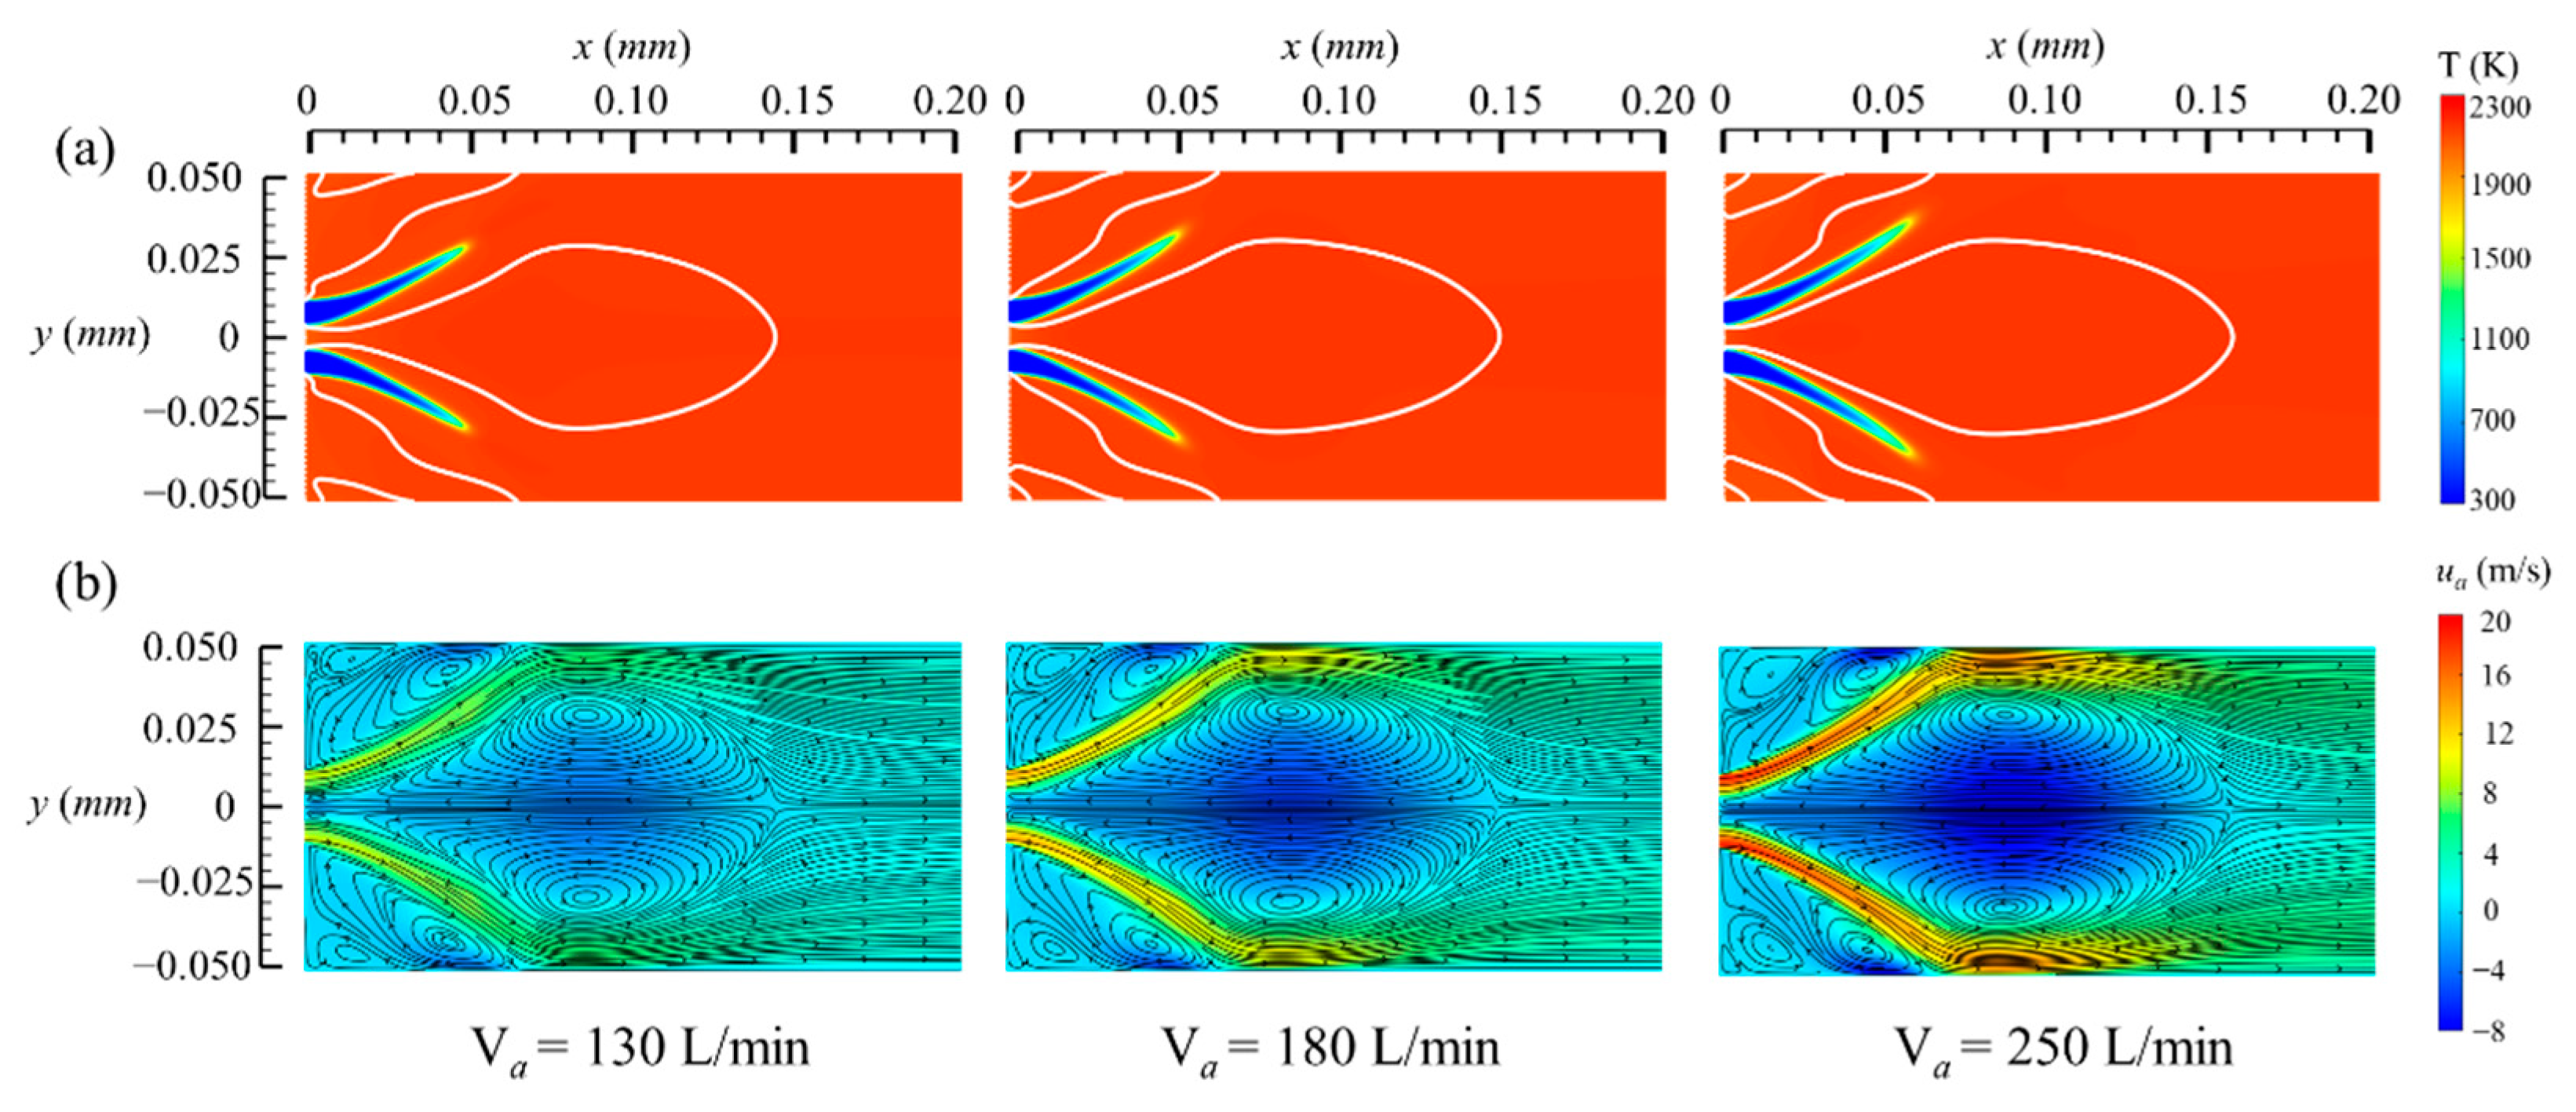
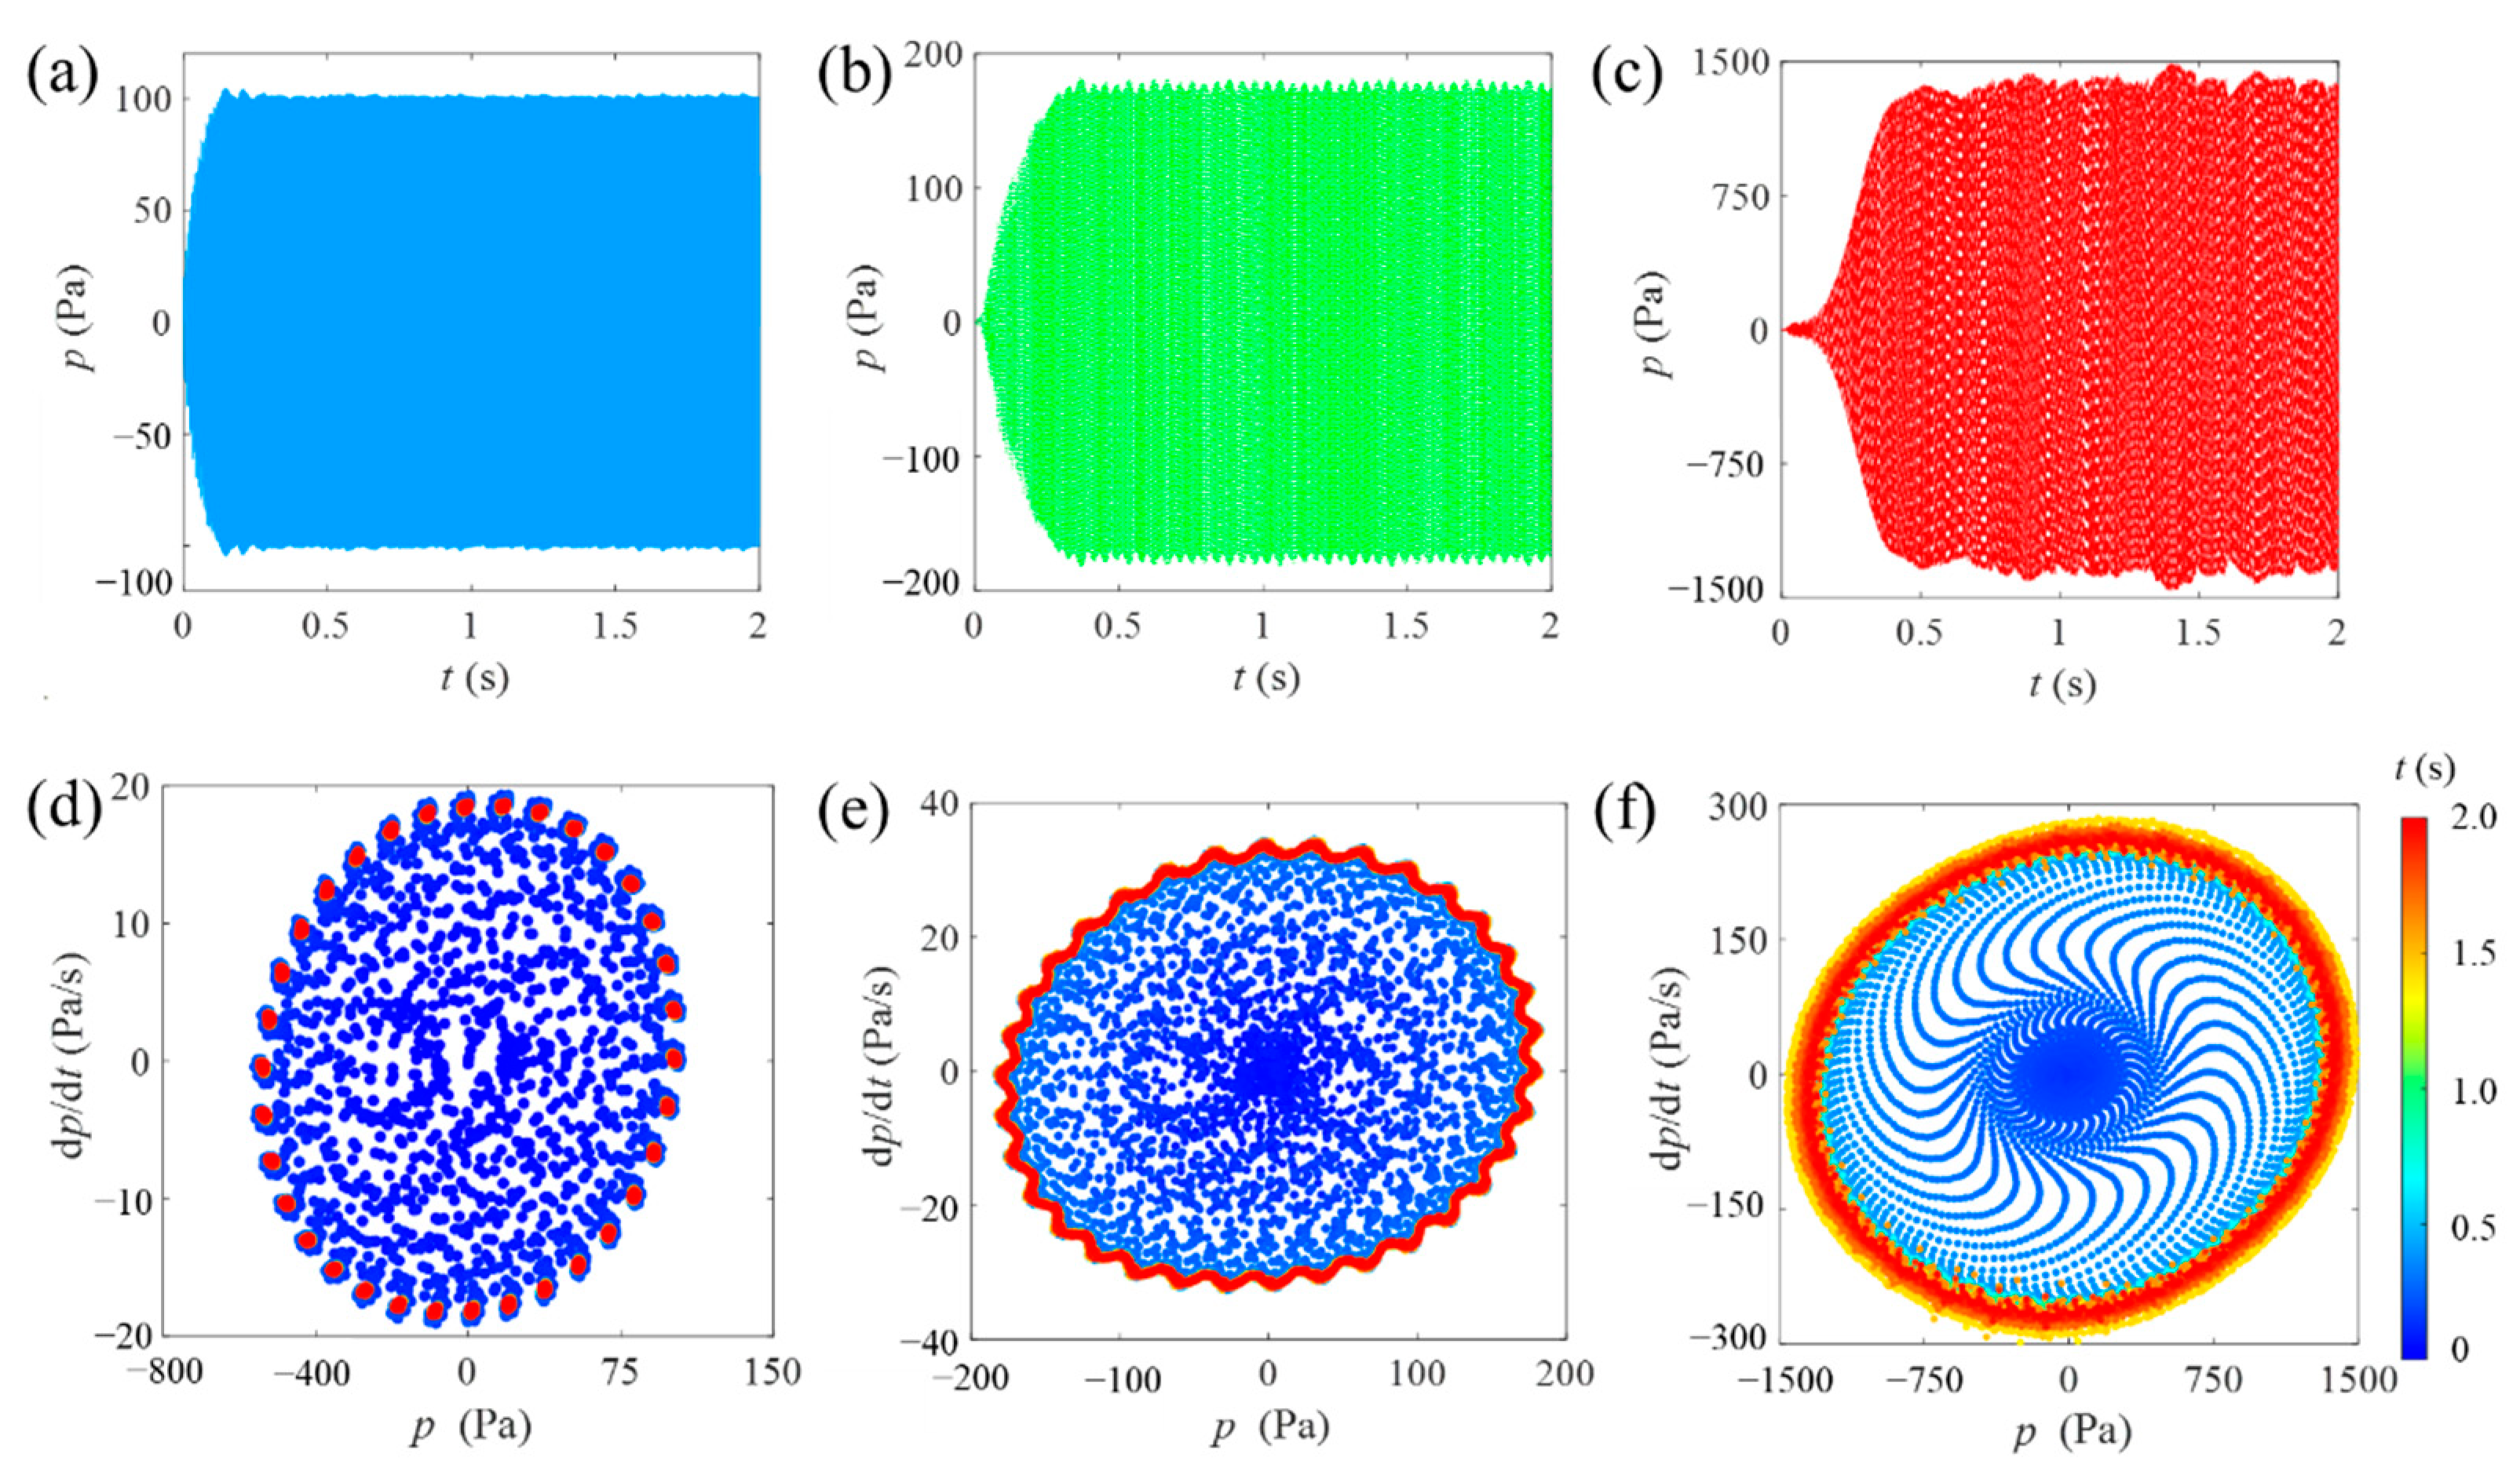
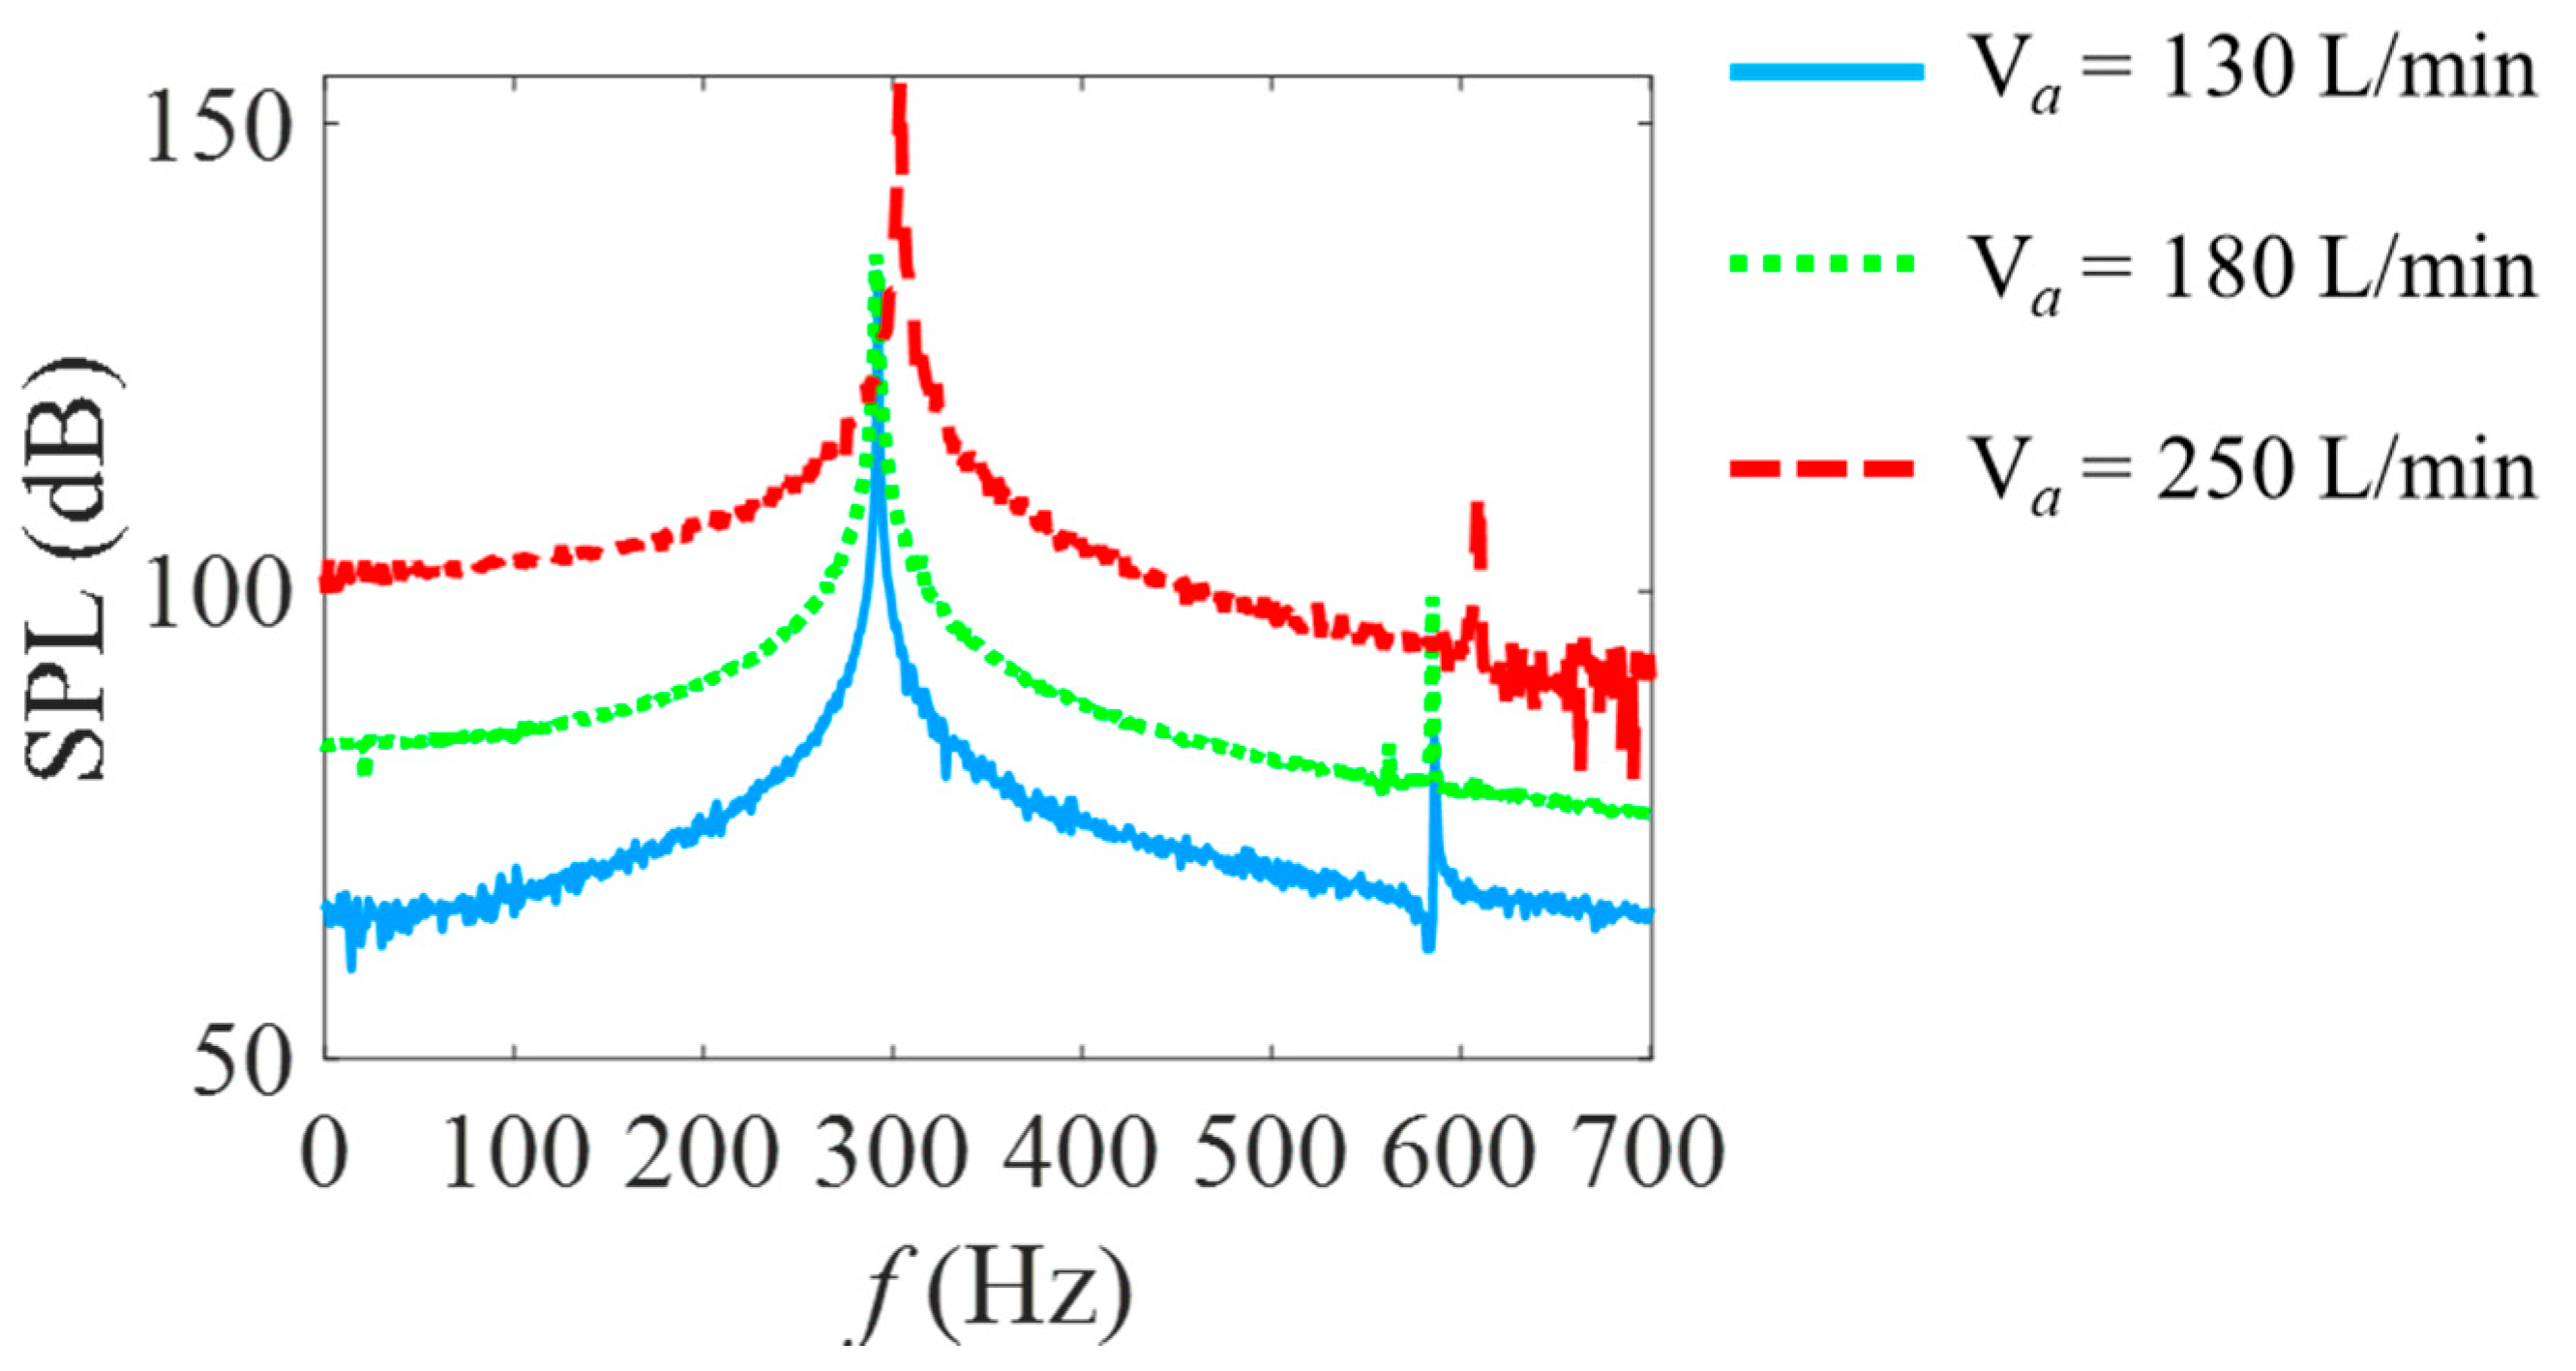
3.3. Effect of Incoming Air Flow Rate Va

Figure 7 shows the axial velocity and temperature distributions at t = 0 s with an air flow rate of 130, 180 and 250 L/min, respectively. It can be seen from Figure 7a that the CTRZ and CRZ move downstream slightly with the increase in the air flow rate. The flame length also increases. Figure 7b illustrates that the reattached point also moves downstream, and the negative axial velocity in the recirculation zone and the positive axial velocity of the jet are larger under the condition of high flow rate.
The effect of inlet air flow rate on pressure oscillations is shown in Figure 8. As Va is increased, the pressure fluctuation amplitude was dramatically raised and reached approximately 1500 Pa at Va = 250 L/min. It is worth noting that the amplitude of pressure at Va = 250 L/min is not stable, and there is an obvious fluctuation of the envelope of pressure signal, which indicates intensive thermoacoustic oscillation. It can be seen from Figure 9 that the dominant frequency of pressure oscillation is increased with the increase of Va, from 294 Hz at Va = 130 L/min to 306 Hz at Va = 250 L/min.

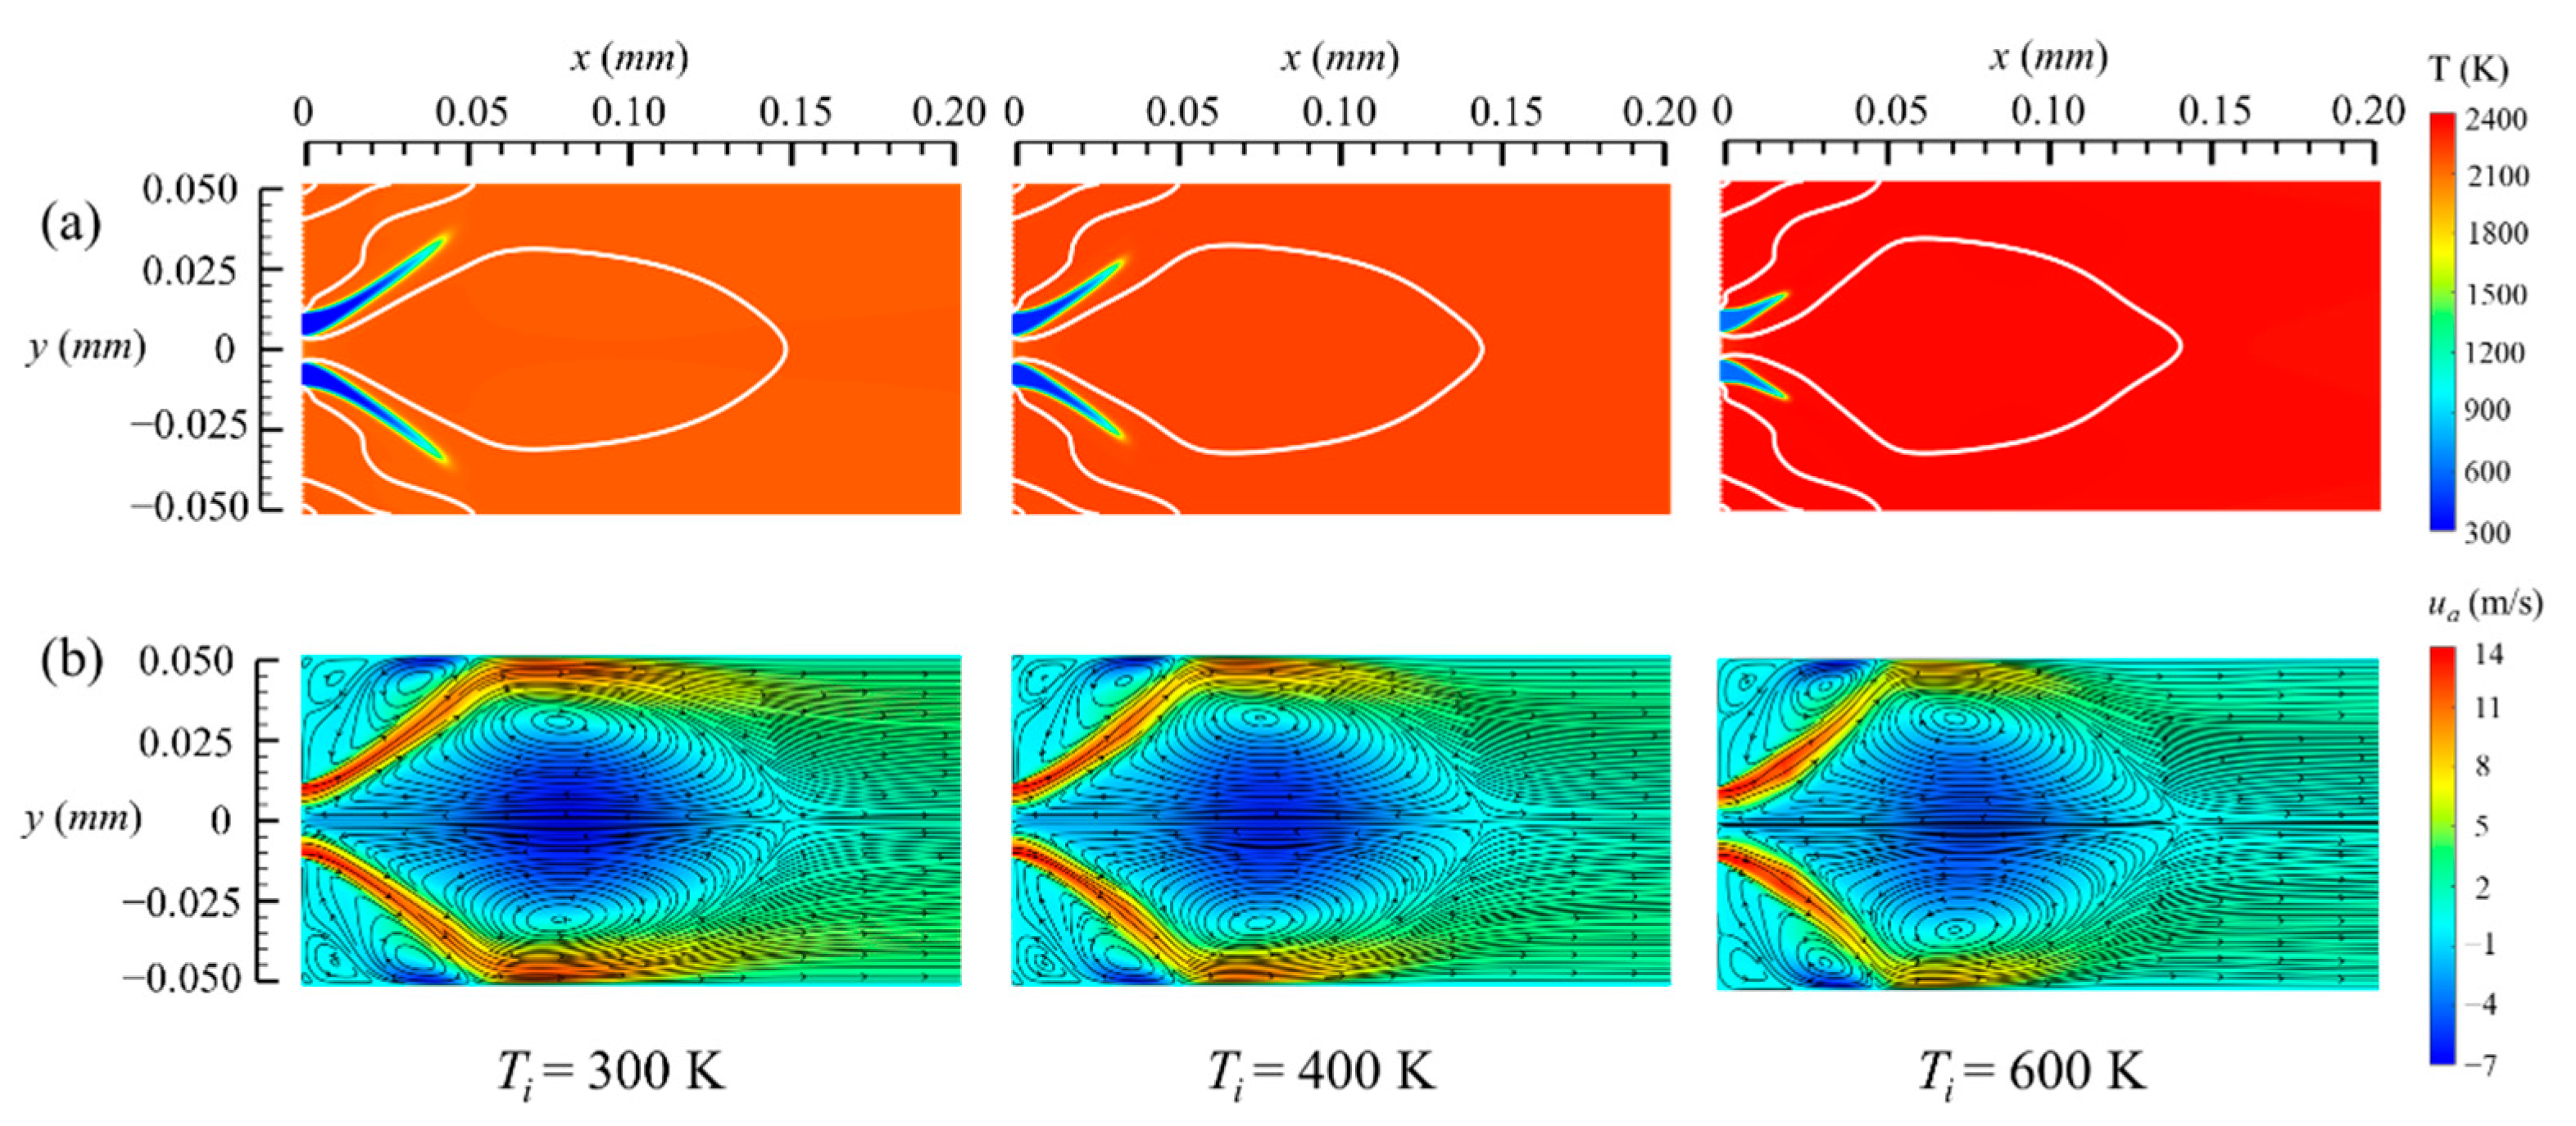
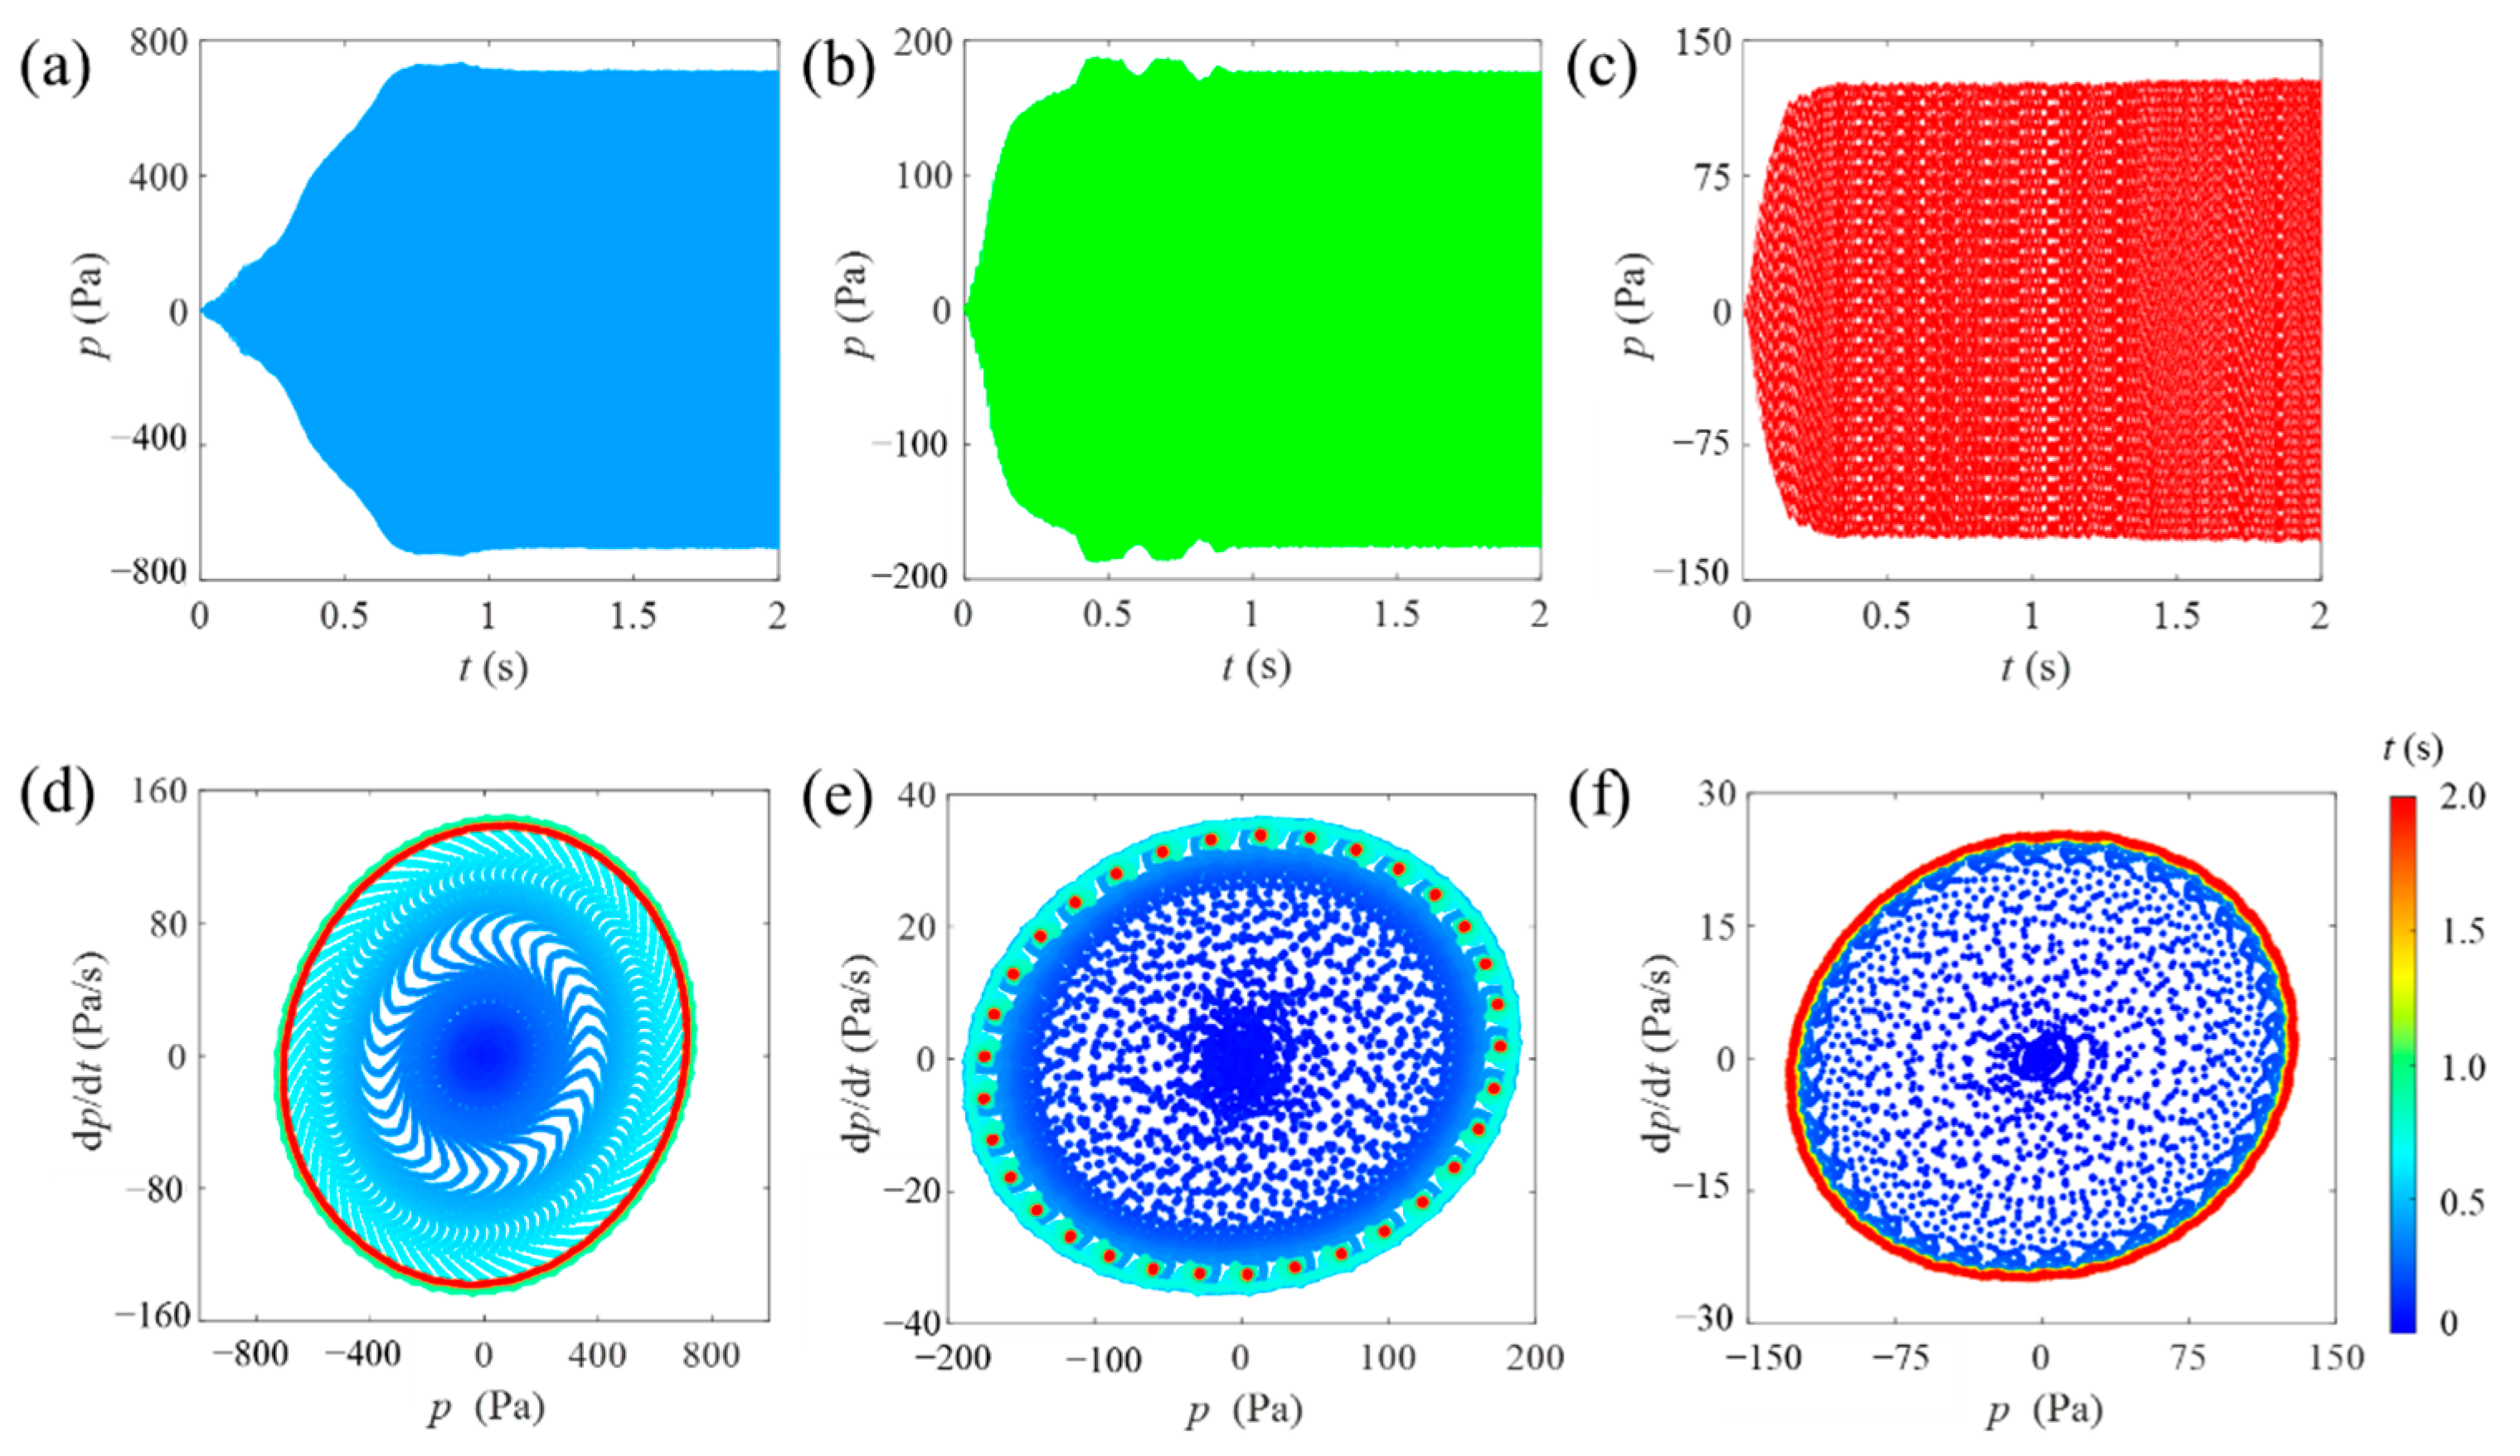
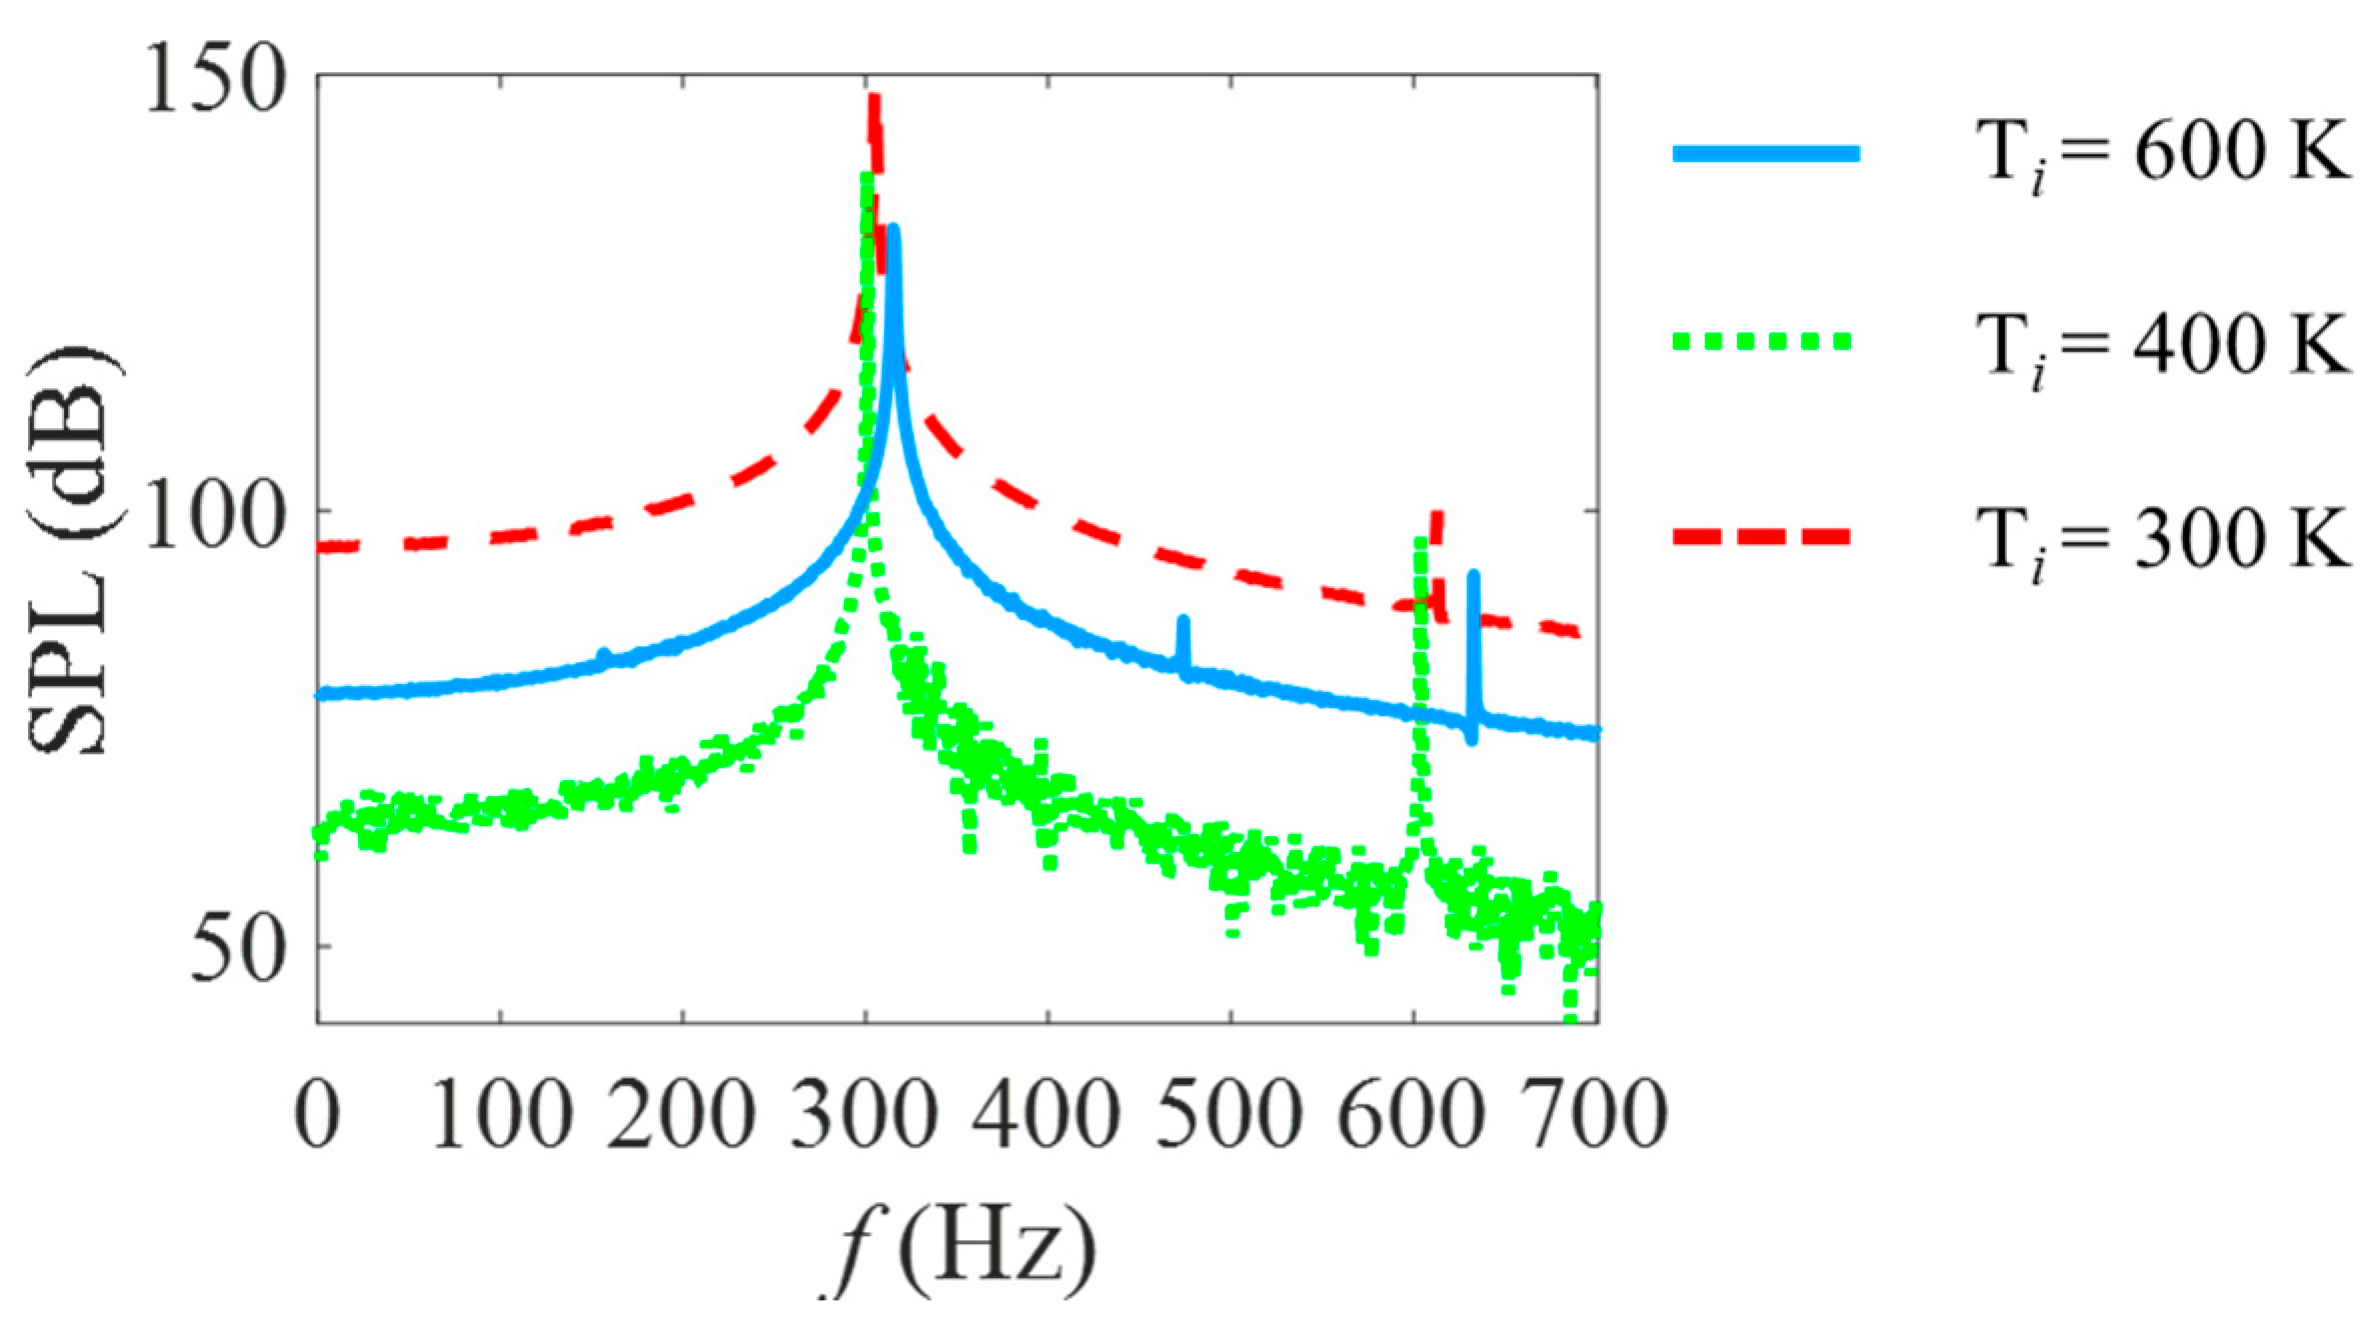
3.4. Effect of Incoming Preheated Air Temperature Ti

Incoming air temperature could also affect the resulting combustion instability. Its effect is examined in Figure 10, which shows the axial velocity and temperature distributions at t = 0 s with an inlet temperature of 300, 400 and 600 K, respectively. As inlet temperature is increased, CTRZ and CRZ move upstream. The flame length decreases dramatically due to the large burning velocity under high inlet temperature. Figure 10b shows that at a higher inlet temperature, the axial velocity jet layer and reversal axial velocity at CTRZ are smaller. This can be explained be the fact that high inlet temperature weakens the gas thermal expansion effect.
Figure 11a–c shows the time evolution of pressure fluctuations in the swirling combustor, as the inlet temperature is set to 3 different values. It can be observed that with incoming air, the temperature increased from Ti = 300 to 400 K, and the amplitude of the generated limit cycles decreased dramatically from 710 Pa to 176 Pa (refer to Figure 11a,b). Further increasing Ti to 600 K led to the amplitude decreasing slightly (refer to Figure 11b,c). Figure 11d–f illustrates the corresponding phase diagrams at different Ti. The ‘annulus-shape’ phase diagrams indicate the presence of multiple tones and thus the nonlinearity of the combustion system.
Further assessment is carried out by determining the pressure spectrum, as shown in Figure 12. It can be seen that there are fundamental peaks at approximately 300 Hz and its harmonics. In addition, as the incoming air temperature is varied, the dominant mode frequency is found to shift slightly at around 300 Hz. Finally, increasing Ti from 300 K to 600 K leads to a reduction of about 17 dB. This reveals that mitigating self-excited thermoacoustic instability in this modelled swirling combustor could be achieved by increasing the incoming air temperature using methods such as pre-heating technology. The damping effect could be mainly due to the reduction of the temperature gradient between pre- and after-combustion regions. Further studies are needed in future work to optimize the incoming air temperature and minimize thermoacoustic instability.

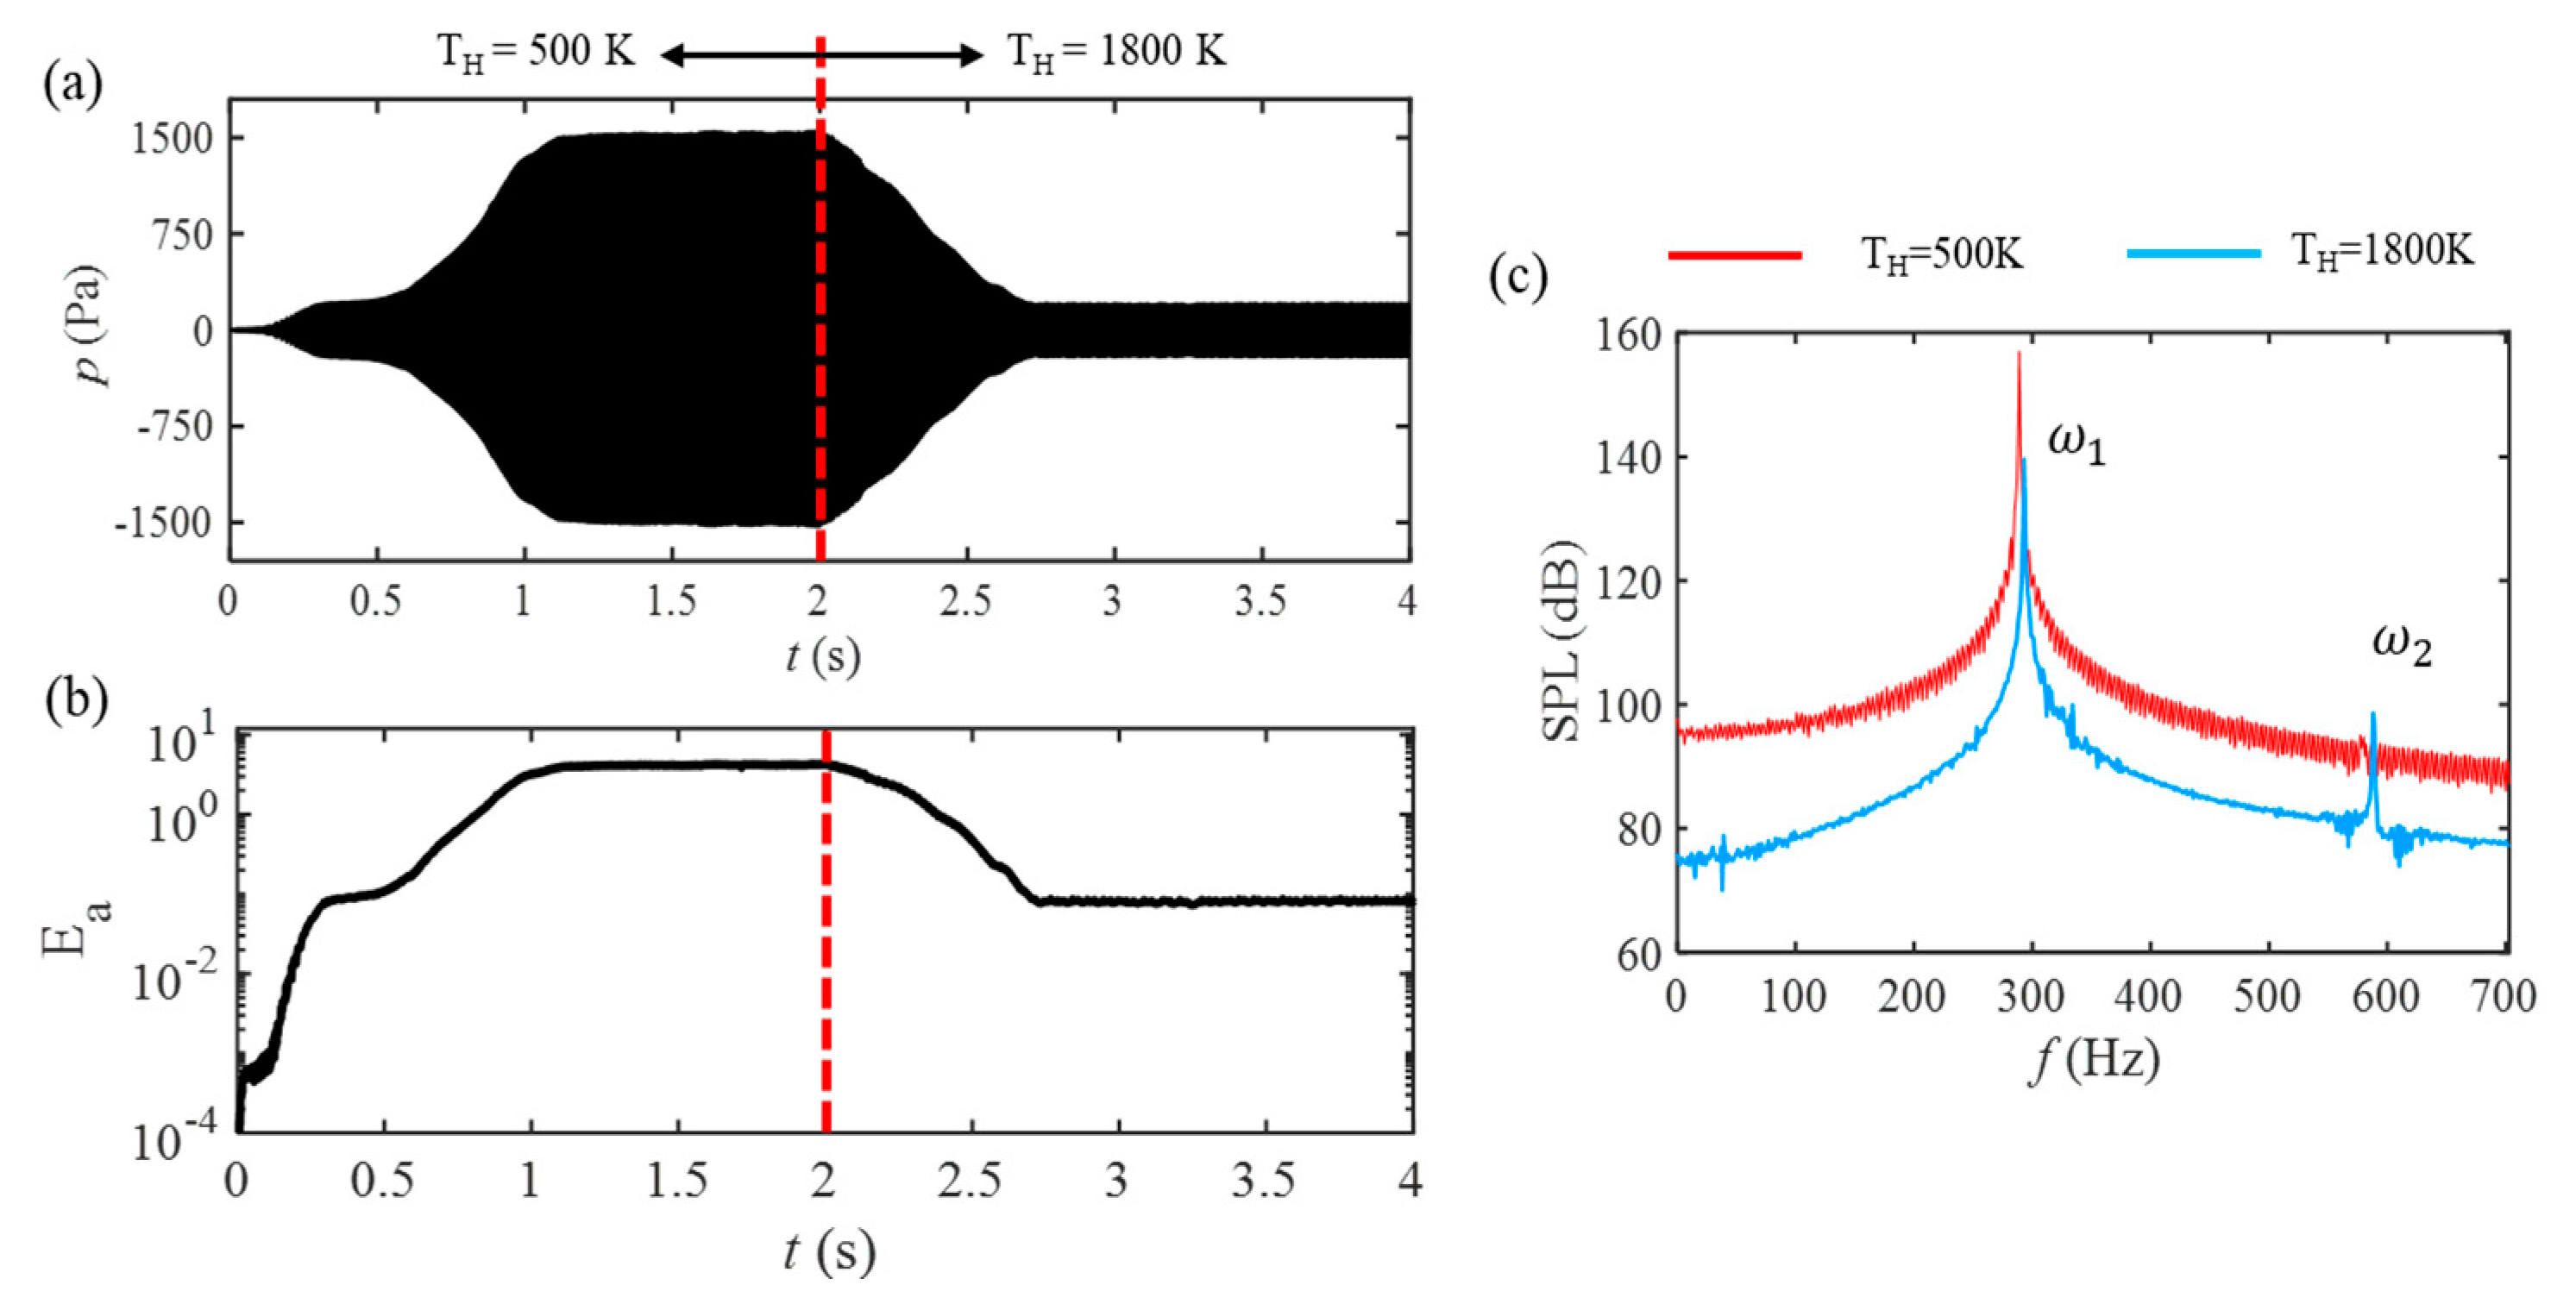
4. Further Investigations into the Heat Exchanger Temperature TH Effect

Energy transfer from heat to sound is undesirable in gas turbine combustors. However, acoustic energy is used to do work in thermoacoustic devices such as thermoacoustic engines. Thus, it is significant to understand the amplification and suppression mechanism of thermoacoustic oscillations. In this section, the effect of a heat exchanger, positioned on the combustor wall, on the excitation and mitigation of thermoacoustic oscillation is investigated. This part of the present work aims to discuss and demonstrate the possibility of using this method in the swirling combustor, and only qualitative research is conducted. In the present study, an iso-thermal wall boundary condition at different temperatures is applied to imitate the heat-loss effect of the practical combustor. At first, the heat exchanger temperature, TH, is set to TH = 500 K, which is a large heat-loss operation condition. The heat exchanger temperature is increased to TH = 1800 K at t ≥ 2 s, which is a low heat-loss operation condition. In practical applications, due to heat loss already existing in the combustor wall, this effect can be achieved by reducing the coolant flow or by wrapping it with thermal insulation materials. Pressure fluctuations data are collected from the probe at x = 328 mm on the axial center line. Figure 13a shows the time domain signal of pressure fluctuations in the combustor, where SN = 0.45, Va = 180 L/min and Ti = 300 K. It is worth noting that pressure oscillation amplitude is amplified and reaches around 1550 a, compared with the model with no heat exchanger in Figure 8b. When the heat exchanger temperature is increased to TH = 1800 K, the pressure oscillation amplitude decreases gradually and becomes stable at the small amplitude of the 215 Pa limit cycle. Here, acoustic energy is introduced to evaluate the heat-to-sound conversion. Acoustic energy per unit volume in time domain Ea (t) is given as [39]:
E a ( t ) = 1 τ τ   ( p ) 2 d t 2 γ p 0
where γ = 1.4   is the gas adiabatic constant. p is the pressure fluctuation in the time domain. p0 is the reference atmosphere pressure, and τ is the pressure oscillation period. Figure 13b illustrates that over 90% of acoustic energy is reduced by increasing TH. Figure 13c compares the spectrum of pressure fluctuations before and after TH is increased. It can be seen that the dominant frequency shifts from 291 Hz to 295 Hz. As for the TH = 1800 K case, a local peak at the harmonic frequency of 590 Hz is observed clearly.
To reveal how the heat changer affects the flow field characteristics in the combustor, Figure 14 and Figure 15 illustrate the temperature contours with streamlines and isolines of zero value for the axial velocity over an oscillation period before and after TH is increased. Flow fields are changed dramatically at TH = 500 K, as Figure 15a–d shows. In the first half of the cycle, negative pressure fluctuation in the combustor reaches its minimum value at τ /4 and returns to 0 at τ /2. The area of the recirculating zone is maximum at τ /2. In the other half of the cycle, pressure in the fluctuation combustor has a positive value. CRZ and CTRZ are compressed. The areas recede and reach their minimum at τ . In this process, back flow gas is cooled first due to the heat exchanger and then heated by flame, which increases the pressure amplitude and reinforces the vibration. This is the reason why combustion can sustain such large amplitude oscillation at TH = 500 K. After TH is increased to 1800 K, it can be seen from Figure 15a,b that the area and shape of the recirculation zone are almost unchanged over a period. The uniformity of the temperature field inside the combustor is improved, which reduces the amplifying effect mentioned before and suppress thermoacoustic oscillation.
Figure 16a compares the radical variation of instantaneous over an oscillation period at the x/Rc = 1.2 cross section, before and after TH is increased. The axial velocity oscillation ranges at TH = 500 K are much wider that at TH = 1800 K. The axial velocity fluctuations at the maximum axial velocity point are used to carry out frequency spectrum analysis, as shown in Figure 16b. Increasing TH reduces the amplitude of axial velocity fluctuation by over 90%. The dominant frequency is found to shift from 291 Hz to 295 Hz.
To shed lights on the generation and damping of thermoacoustic instability, Rayleigh index analysis is then conducted to further characterize self-sustained thermos-acoustic coupling [40]. The Rayleigh index is widely applied to indicate the unsteady coupling nature between pressure and heat release perturbation [41]. The local Rayleigh index distribution can be calculated as [42]:
R I = 1 τ τ   p ( x , y , z , t ) q ( x , y , z , t ) p r m s q ¯ d t
where p and q are the acoustic pressure and unsteady heat release oscillation, which are all the function of spatial locations and time. p r m s is the root mean square value of pressure, and q ¯ is the time average heat release rate. Figure 17 shows the local contour map of the Rayleigh index at TH = 500 K and TH = 1800 K. As shown in the contours, the positive zone with red color denotes the driving effect (constructive interaction between thermos-acoustic couplings) on limit cycle oscillations, i.e., thermoacoustic instabilities. However, the negative value region with a blue color has a damping effect (destructive interaction) on limit cycle oscillations. As can be seen from Figure 18a, there is a stratified structure pattern of local Rayleigh index distribution. Positive value regions and negative ones are periodically presented in space. Closer observation reveals that the maximum driving/generation effect in the region occurs at 0.05 m in the axial direction and ±0.03 m along the radial direction, which corresponds to the shear layer and flame tips. Referring to the streamlines in Figure 14 and Figure 17b illustrates the local Rayleigh index distribution, as the heat exchanger temperature is set to TH = 1800 K. This is quite different from the contour at TH = 500 K, as shown in Figure 17a. The patterns of positive and negative value zones are not periodically presented any more. The positive and negative value regions with smaller values of the local Rayleigh index intertwine with each other.
Moreover, global coupling between pressure and global heat release rate fluctuation can be characterized by their phase difference of perturbations [43], as shown in Figure 18. According to Rayleigh criterion [44], if the fluctuations of pressure and heat release are in the same phase, such as between −90° to 90°, there is a driving effect. If the phase difference is close to 90° or −90°, the driving effect is minimum. As illustrated in Figure 18, phase difference between pressure and heat release fluctuations at 1800 K is larger than at 500 K, and it is close to 90°, which also indicates that thermoacoustic instability is suppressed successfully.

5. Conclusions

In the present work, 3D URANS simulations are conducted to study the nonlinear self-sustained thermoacoustic oscillations in a modelled swirling combustor. Turbulence and combustion models are the RNG k-ε model and EDC model, respectively. A global 2-step combustion kinetic mechanism is applied to deal with chemical reactions. The effect of swirling number SN, inlet air flow rate Va and inlet temperature Ti on mean temperature and flow fields, as well as the swirling combustion-excited limit cycle oscillation characteristics, are examined. Recirculation zone structures are highly affected by SN. As SN is increased, the wake recirculation zone (WRZ) disappears, and the central toroidal recirculation zone (CTRZ) and corner recirculation zone (CRZ) move upstream. As SN is increased, the amplitude and dominant frequency of acoustic pressure oscillations is also increased. As inlet air flow rate Va is increased as the recirculation zone moves downstream. Increasing Va results in the increase of both the amplitude and frequency of acoustic pressure fluctuations. The increase of inlet air temperature, Ti, causes the reduction of flame length and the CTRZ shrink to upstream. Increasing Ti from 300 K to 600 K results in about a 17 dB reduction of sound pressure level (SPL).
Further investigation into the amplification and mitigation effect on combustion-driven limit cycle oscillations is studied by installing an adjustable temperature heat exchanger on the combustion chamber wall. Thermoacoustic oscillations in the swirling combustor can be successfully amplified or suppressed by a lower or higher heat exchanger temperature, TH. The acoustic amplitude, acoustical energy and axial velocity fluctuation range are dramatically reduced with the increase of TH. The dominant frequency of the acoustic pressure and axial velocity spectrum are found to be involved in a 1.6% shift to a higher frequency. A non-negligible harmonic frequency peak is observed in the acoustic pressure spectrum in the high TH condition. Finally, both local and global Rayleigh index analyses are conducted to investigate unsteady and dynamic coupling between acoustic perturbations and unsteady heat release. Increasing TH is found to weaken the strong driving/generating effect in shear layers and the flame tips region to prevent and/or mitigate combustion instability. The present study is conducive to developing a simulation platform for thermoacoustic instabilities in swirling combustors. This paper also proposes an alternative method by using a heat exchanger and sheds light on its excitation and mitigation effects to strengthen or weaken thermoacoustic oscillations in swirling combustion systems.

Author Contributions

Y.S. conducted numerical simulations. Y.S. processed and analysed the data and discussed the results with D.Z. and X.Z., D.Z. conceived and initialized the project. All authors contributed to the paper writing and English editing. All authors have read and agreed to the published version of the manuscript.

Funding

This research was funded by the University of Canterbury, New Zealand with Grant No. 452STUPDZ, and National Research Foundation, Prime Minister’s Office, Singapore, with Grant No. NRF2016NRF-NSFC001-102 and National Natural Science Foundation of China (No.11661141020).

Institutional Review Board Statement

Not applicable.

Informed Consent Statement

Not applicable.

Data Availability Statement

Not applicable.

Conflicts of Interest

The authors declare no conflict of interest.

Nomenclature

SNSwirling number
VaInlet air flow rate
TiInlet temperature
THHeat exchanger temperature
ρ Density
ppressure
ttime
v velocity vector
τ i j Reynolds stress tensor
Etotal energy
keffeffective thermal conductivity
h i enthalpy of species i
J i   diffusion flux of species i
ShFluid enthalpy source
YiMass fraction of species i
ω i Net rate of species i
RgUniversal gas constant
Mwmean molecular weight
EaAcoustic energy
γ Gas adiabatic index
p Pressure fluctuation
p0reference pressure
τ Oscillation period
γ Gas adiabatic index
R I Local Rayleigh index
q Heat release fluctuation
p r m s Root mean square value of pressure
q ¯ Time average heat release rate
Θ Phase difference

Abbreviation

RANSReynolds-averaged Navier-Stokes
URANSUnsteady Reynolds-averaged Navier-Stokes
RNGRe-Normalization Group
EDCEddy-dissipation-concept
WRZWake recirculation zone
CRZcorner recirculation zone
CTRZcentral toroidal recirculation zone
SPLsound pressure level

Appendix A

The simulated results with a whole calculation domain and a 1/8 sector are compared in this part. Figure A1 depicts the radical mean axial velocity profiles for two simulation domains at different cross sections. Figure A2 presents a comparison of the frequency spectrum of pressure fluctuation monitored at the probe. It can be seen that the mean axial velocity profiles are almost identical when using the full scale and the 1/8 sector. For the frequency spectrum, there is a minor difference in pressure fluctuation amplitude and frequency. Since the difference between the two computational domains is slight, the compromise between simulation accuracy and cost is made.
Figure A1. Radical profiles of axial velocity comparison.
Aerospace 08 00060 g0a1
Figure A2. Frequency spectrum comparison.
Aerospace 08 00060 g0a2

References

  1. Yang, D.; Laera, D.; Morgans, A.S. A systematic study of nonlinear coupling of thermoacoustic modes in annular combustors. J. Sound Vib. 2019, 456, 137–161. [Google Scholar] [CrossRef]
  2. Jiang, D.; Yang, W.; Teng, J. Entropy generation analysis of fuel lean premixed CO/H2/air flames. Int. J. Hydrog. Energy 2015, 40, 5210–5220. [Google Scholar] [CrossRef]
  3. Candel, S. Combustion dynamics and control: Progress and challenges. Proc. Combust. Inst. 2002, 29, 1–28. [Google Scholar] [CrossRef]
  4. Wang, W.; Liu, J.; Zuo, Z.; Yang, W. Entropy generation analysis of unsteady premixed methane/air flames in a narrow channel. Appl. Therm. Eng. 2017, 126, 929–938. [Google Scholar] [CrossRef]
  5. Li, L.; Yang, L.; Sun, X. Effect of distributed heat source on low frequency thermoacoustic instabilities. J. Sound Vib. 2013, 332, 3098–3111. [Google Scholar] [CrossRef]
  6. Keller, J.J. Thermoacoustic oscillations in combustion chambers of gas turbines. Aiaa J. 1995, 33, 2280–2287. [Google Scholar] [CrossRef]
  7. Lieuwen, T. Modeling premixed combustion-acoustic wave interactions: A review. J. Propul. Power 2003, 19, 765–781. [Google Scholar] [CrossRef]
  8. Correa, S.M. Carbon monoxide emissions in lean premixed combustion. J. Propul. Power 1992, 8, 1144–1151. [Google Scholar] [CrossRef]
  9. Yi, T.X.; Santavicca, D.A. Combustion Instability and Flame Structure of Turbulent Swirl-Stabilized Liquid-Fueled Combustion. J. Propul. Power 2012, 28, 1000–1014. [Google Scholar] [CrossRef]
  10. Mariappan, S.; Sujith, R.I. Thermoacoustic instability in a solid rocket motor: Non-normality and nonlinear instabilities. J. Fluid. Mech. 2010, 653, 1–33. [Google Scholar] [CrossRef]
  11. Lucca-Negro, O.; O’Doherty, T. Vortex breakdown: A review. Prog. Energy Combust. 2001, 27, 431–481. [Google Scholar] [CrossRef]
  12. Galley, D.; Ducruix, S.; Lacas, F.; Veynante, D. Mixing and stabilization study of a partially premixed swirling flame using laser induced fluorescence. Combust. Flame 2011, 158, 155–171. [Google Scholar] [CrossRef]
  13. Candel, S.; Durox, D.; Schuller, T.; Bourgouin, J.-F.; Moeck, J.P. Dynamics of swirling flames. Annu. Rev. Fluid Mech. 2014, 46, 147–173. [Google Scholar] [CrossRef]
  14. Syred, N.; Beer, J. Combustion in swirling flows: A review. Combust. Flame 1974, 23, 143–201. [Google Scholar] [CrossRef]
  15. Kim, J.; Jang, M.; Lee, K.; Masri, A.R. Experimental study of the beating behavior of thermoacoustic self-excited instabilities in dual swirl combustors. Exp. Therm. Fluid Sci. 2019, 105, 1–10. [Google Scholar] [CrossRef]
  16. Han, X.; Laera, D.; Morgans, A.S.; Lin, Y.; Sung, C.-J. The effect of stratification ratio on the macrostructure of stratified swirl flames: Experimental and numerical Study. J. Eng. Gas. Turbines Power 2018, 140, 121004. [Google Scholar] [CrossRef]
  17. Karlis, E.; Liu, Y.S.; Hardalupas, Y.; Taylor, A.M.K.P. H-2 enrichment of CH4 blends in lean premixed gas turbine combustion: An experimental study on effects on flame shape and thermoacoustic oscillation dynamics. Fuel 2019, 254. [Google Scholar] [CrossRef]
  18. Bonciolini, G.; Ebi, D.; Doll, U.; Weilenmann, M.; Noiray, N. Effect of wall thermal inertia upon transient thermoacoustic dynamics of a swirl-stabilized flame. Proc. Combust. Inst. 2019, 37, 5351–5358. [Google Scholar] [CrossRef] [Green Version]
  19. Pausch, K.; Herff, S.; Schröder, W. Noise sources of an unconfined and a confined swirl burner. J. Sound Vib. 2020, 475, 115293. [Google Scholar] [CrossRef]
  20. Huang, Y.; Yang, V. Effect of swirl on combustion dynamics in a lean-premixed swirl-stabilized combustor. Proc. Combust. Inst. 2005, 30, 1775–1782. [Google Scholar] [CrossRef]
  21. Choi, J.; Rusak, Z.; Kapila, A. Numerical simulation of premixed chemical reactions with swirl. Combust. Theor. Model. 2007, 11, 863–887. [Google Scholar] [CrossRef]
  22. Choi, M.; Park, Y.; Li, X.; Sung, Y.; Park, S.; Moon, K.; Choi, G. Study on flame structures and emission characteristics according to various swirl combinations and fuel compositions in a CH4/H2/CO syngas swirl-stabilized combustor. Fuel 2019, 253, 887–903. [Google Scholar] [CrossRef]
  23. Noiray, N.; Schuermans, B. Theoretical and experimental investigations on damper performance for suppression of thermoacoustic oscillations. J. Sound Vib. 2012, 331, 2753–2763. [Google Scholar] [CrossRef]
  24. Zhang, G.; Wang, X.; Li, L.; Jing, X.; Sun, X. Control of thermoacoustic instability with a drum-like silencer. J. Sound Vib. 2017, 406, 253–276. [Google Scholar] [CrossRef]
  25. DeLaat, J.C.; Kopasakis, G.; Saus, J.R.; Chang, C.T.; Wey, C. Active combustion control for a low-emissions aircraft engine combustor prototype: Experimental results. J. Propul. Power 2013, 29, 991–1000. [Google Scholar] [CrossRef]
  26. Paschereit, C.O.; Gutmark, E.; Weisenstein, W. Control of thermoacoustic instabilities and emissions in an industrial-type gas-turbine combustor. Symp. (Int.) Combust. 1998, 27, 1817–1824. [Google Scholar] [CrossRef]
  27. Hong, Z.; Dai, X.; Zhou, N.; Sun, X.; Jing, X. Suppression of Helmholtz resonance using inside acoustic liner. J. Sound Vib. 2014, 333, 3585–3597. [Google Scholar] [CrossRef]
  28. Gelbert, G.; Moeck, J.P.; Paschereit, C.O.; King, R. Feedback control of unstable thermoacoustic modes in an annular Rijke tube. Control. Eng. Pract. 2012, 20, 770–782. [Google Scholar] [CrossRef]
  29. Lei, L.; Zhihui, G.; Chengyu, Z.; Xiaofeng, S. A Passive Method to Control Combustion Instabilities with Perforated Liner. Chin. J. Aeronaut. 2010, 23, 623–630. [Google Scholar] [CrossRef] [Green Version]
  30. Williams, L.J.; Meadows, J.; Agrawal, A.K. Passive control of thermoacoustic instabilities in swirl-stabilized combustion at elevated pressures. Int. J. Spray Combust. Dyn. 2016, 8, 173–182. [Google Scholar] [CrossRef] [Green Version]
  31. Li, S.; Li, Q.; Tang, L.; Yang, B.; Fu, J.; Clarke, C.A.; Jin, X.; Ji, C.Z.; Zhao, H. Theoretical and experimental demonstration of minimizing self-excited thermoacoustic oscillations by applying anti-sound technique. Appl. Energy 2016, 181, 399–407. [Google Scholar] [CrossRef]
  32. Wu, G.; Lu, Z.; Pan, W.; Guan, Y.; Li, S.; Ji, C.Z. Experimental demonstration of mitigating self-excited combustion oscillations using an electrical heater. Appl. Energy 2019, 239, 331–342. [Google Scholar] [CrossRef]
  33. Wu, G.; Xu, X.; Li, S.; Ji, C. Experimental studies of mitigating premixed flame-excited thermoacoustic oscillations in T-shaped Combustor using an electrical heater. Energy 2019, 174, 1276–1282. [Google Scholar] [CrossRef]
  34. Mahesh, S.; Gopakumar, R.; Rahul, B.; Dutta, A.; Mondal, S.; Chaudhuri, S. Instability control by actuating the swirler in a lean premixed combustor. J. Propul. Power 2018, 34, 708–719. [Google Scholar] [CrossRef]
  35. Sun, Y.; Rao, Z.; Zhao, D.; Wang, B.; Sun, D.; Sun, X. Characterizing nonlinear dynamic features of self-sustained thermoacoustic oscillations in a premixed swirling combustor. Appl. Energy 2020, 264, 114698. [Google Scholar] [CrossRef]
  36. Chen, S.; Zhao, D. Numerical study of guide vane effects on reacting flow characteristics in a trapped vortex combustor. Combust. Sci. Technol. 2018, 190, 2111–2133. [Google Scholar] [CrossRef]
  37. Westbrook, C.K.; Dryer, F.L. Simplified reaction mechanisms for the oxidation of hydrocarbon fuels in flames. Combust. Sci. Technol. 1981, 27, 31–43. [Google Scholar] [CrossRef]
  38. Zhang, M.; Wei, X.; Wang, J.; Huang, Z.; Tan, H. The blow-off and transient characteristics of co-firing ammonia/methane fuels in a swirl combustor. Proc. Combust. Inst. 2020. [Google Scholar] [CrossRef]
  39. Zhao, D.; Guan, Y.; Reinecke, A. Characterizing hydrogen-fuelled pulsating combustion on thermodynamic properties of a combustor. Commun. Phys. 2019, 2. [Google Scholar] [CrossRef] [Green Version]
  40. Yilmaz, İ.; Ratner, A.; Ilbas, M.; Huang, Y. Experimental investigation of thermoacoustic coupling using blended hydrogen–methane fuels in a low swirl burner. Int. J. Hydrog. Energy 2010, 35, 329–336. [Google Scholar] [CrossRef]
  41. Song, H.; Lin, Y.; Han, X.; Yang, D.; Zhang, C.; Sung, C.-J. The thermoacoustic instability in a stratified swirl burner and its passive control by using a slope confinement. Energy 2020, 195, 116956. [Google Scholar] [CrossRef]
  42. Huang, Y.; Ratner, A. Experimental investigation of thermoacoustic coupling for low-swirl lean premixed flames. J. Propul. Power 2009, 25, 365–373. [Google Scholar] [CrossRef]
  43. Bragg, S.L. Noise and Oscillations in Jet Engines. Nature 1964, 201, 123. [Google Scholar] [CrossRef]
  44. Rayleigh, L. The explanation of certain acoustical phenomena. Nature 1878, 18, 319–321. [Google Scholar] [CrossRef] [Green Version]
Figure 1. (a) Diagram of computational domain and key geometry parameters, and (b) mesh generation of the 1/8th sector combustor.
Aerospace 08 00060 g001
Figure 2. Mesh sensitivity analyses: (a) normalized axial velocity profiles and (b) temperature profiles at x/Rc = 0.5.
Aerospace 08 00060 g002
Figure 3. Radial distribution of mean axial (left) and radial (right) velocity components at different cross sections of the combustor. z/D = 0.5, z/D = 1 and z/D = 1.5.
Aerospace 08 00060 g003
Figure 4. (a) Temperature contour with zero axial velocity isolines, and (b) axial velocity contour along with streamlines of different SN, where Va = 180, L/min and Ti = 300 K.
Aerospace 08 00060 g004
Figure 5. Acoustic pressure fluctuations. (ac) Time evolution of pressure fluctuations, (df) corresponding phase diagram of pressure fluctuations at Va = 180 L/min Ti = 300 K. (a) and (d) SN = 0.34, (b) and (e) SN = 0.45, (c) and (f) SN = 0.60.
Aerospace 08 00060 g005
Figure 6. Frequency spectrum of acoustic pressure fluctuations of different SN at Va = 180 L/min and Ti = 300 K.
Aerospace 08 00060 g006
Figure 7. (a) Temperature contour along with zero axial velocity isolines, and (b) axial velocity contour along with the streamlines of different Va, where SN = 0.45 and Ti = 300 K.
Aerospace 08 00060 g007
Figure 8. (ac) Time domain signal of pressure fluctuations and (df) corresponding phase diagram. (a) and (d) Va = 130 L/min, (b) and (e) Va = 180 L/min, and (c) and (f) Va = 250 L/min, where SN = 0.45 Ti = 300 K.
Aerospace 08 00060 g008
Figure 9. Frequency spectrum of acoustic pressure fluctuation of different Va at SN = 0.45 and Ti = 300 K.
Aerospace 08 00060 g009
Figure 10. (a) Temperature contour along with zero axial velocity isolines, and (b) axial velocity contour along with streamlines of different Ti, where SN = 0.60 and Va = 180 L/min.
Aerospace 08 00060 g010
Figure 11. (ac) Time domain signal of pressure fluctuations and (df) corresponding phase diagram. (a,d) Ti = 300 K, (b,e) Ti = 400 K, and (c,f) Ti = 600 K, where SN = 0.6 and Va = 180 L/min.
Aerospace 08 00060 g011
Figure 12. Frequency spectrum of acoustic pressure fluctuations of different Ti at SN = 0.6 and Va = 180 L/min.
Aerospace 08 00060 g012
Figure 13. (a) Pressure fluctuation in the time domain, (b) acoustic energy per unit volume in the time domain, and (c) corresponding spectrum of pressure fluctuations, where SN = 0.45, Va = 180 L/min and Ti = 300 K.
Aerospace 08 00060 g013
Figure 14. Temperature contour along with zero axial velocity isolines and streamlines and over a period. (a) τ/4 (b) τ/2 (c) 3 τ/4 and (d) τ at TH = 500 K, where SN = 0.45, Va = 180 L/min and Ti = 300 K.
Aerospace 08 00060 g014
Figure 15. Temperature contour along with zero axial velocity isolines and streamlines and over a period. (a) τ/4 (b) τ/2 (c) 3 τ/4 and (d) τ at TH = 1800 K, where SN = 0.45, Va = 180 L/min and Ti = 300 K.
Aerospace 08 00060 g015
Figure 16. (a) Radical variation of instantaneous over an oscillation period at the x/Rc = 1.2 cross section for TH = 500 K (left) and TH = 1800 K (right). (b) Corresponding axial velocity frequency spectrum at the maximum axial velocity value point, where SN = 0.45, Va = 180 L/min and Ti = 300 K.
Aerospace 08 00060 g016
Figure 17. Local Rayleigh Index distribution: (a) TH = 500 K and (b) TH = 1800 K, where SN = 0.45, Va = 180 L/min and Ti = 300 K.
Aerospace 08 00060 g017
Figure 18. Global Rayleigh Index analysis: phase difference between the pressure and heat release fluctuations (a) TH = 500 K and (b) TH = 1800 K, where SN = 0.45, Va = 180 L/min and Ti = 300 K.
Aerospace 08 00060 g018
Table 1. Numerical schemes and boundary conditions.
I. Boundary Conditions
1. Inlet2. Outlet3. Solid Boundaries
Velocity inlet,
corresponding air flow rate:
Va = 130, 180, 250 L/min
Inlet temperature: Ti = 300, 450, 600 K
Equivalence ratio Φ = 0.9.
Pressure outlet
Constant relative pressure,
0 Pa
Combustor wall: adiabatic
Heat exchanger:
TH = Tad, 300 K, 1800 K
II. Numerical Schemes
1. Turbulence Model2. Combustion Model3. Pressure-Velocity Coupling
RNG k–εEDC modelCOUPLE
4. Discretization Schemes5. Time Step6. reaction Mechanism
Second order implicit for temporal discretization
Second-order upwind for turbulence dissipation
Third-order MUSCL for others
1 × 10⁻⁴ s2-steps global mechanism
Publisher’s Note: MDPI stays neutral with regard to jurisdictional claims in published maps and institutional affiliations.

