
β-Band Analysis from Simulated Flight Experiments


1
Instituto de Telecomunicações (IT-IUL), Instituto Universitário de Lisboa (ISCTE-IUL), Av. das Forças Armadas, 1649-026 Lisbon, Portugal
2
Centro de Tecnologia (CT), Universidade Federal do Rio Grande do Norte (UFRN), Av. Sen. Salgado Filho, 3000, Candelária, Natal 59064-741, Brazil
*
Author to whom correspondence should be addressed.
Aerospace 2021, 8(5), 120; https://0-doi-org.brum.beds.ac.uk/10.3390/aerospace8050120
Submission received: 8 March 2021
/
Revised: 13 April 2021
/
Accepted: 15 April 2021
/
Published: 21 April 2021
Abstract
:Several safety-related improvements are applied every year to try to minimize the total number of civil aviation accidents. Fortunately, these improvements work well, reducing the number of accident occurrences. However, while the number of accidents due to mechanical failures has decreased, the number of accidents due to human errors seems to grow. On that basis, this work presents a contribution regarding the brain’s -band activities for different levels of volunteers’ expertise on flight simulator, i.e., experienced, mid-level and beginner, in which they acted as pilots in command during several simulated flights. Spectrogram analysis and statistical measurements of each volunteer’s brain’s -band were carried out. These were based on seven flight tasks: takeoff, climb, cruise flight, descent, approach, final approach and landing. The results of the proposed experiment showed that the takeoff, approach and landing corresponded to the highest brain activities, i.e., close to 37.06–67.33% more than the brain activity of the other flight tasks: when some accidents were about to occur, the intensities of the brain activity were similar to those of the final approach task. When the volunteers’ expertise and confidence on flight simulation were considered, it was shown that the highest brain magnitudes and oscillations observed of more experienced and confident volunteers were on average close to less, compared to less experienced and less confident volunteers. Moreover, more experienced and confident volunteers in general presented different patterns of brain activities compared to volunteers with less expertise or less familiarity with fight simulations and/or electronic games.
1. Introduction
The present research considers the analysis of the beta band, based on electroencephalography (EEG) data in the context of simulated flight, with several flight tasks. With such analysis, it is possible to reinforce the need for studies on this field and also the development of new technologies that increase the ability of real pilots to regulate their physiological response before, during and after real flights.
Nowadays, aviation accidents continue to occur, and together with these undesirable situations come the aviation safety’s improvements. Some of these improvements were presented in the airline safety report on 6 April 2020 by the International Air Transport Association (IATA). It revealed the accident rates of 2019 and showed all improvements compared to 2018–2014. In 2019, there were 53 accidents, 8 of which were fatal, includin g 240 deaths. In 2018, there were a total of 62 accidents, 11 of which were fatal, including 523 deaths. The represents a reduction by 9 accidents (3 fatal) and 283 deaths in 2019 compared to 2018. For the period of 2014–2018, there were an average of 63.2 accidents, including 8.2 fatal, with 303.4 deaths per year [1]. In 2017, the Boeing Aerospace Company presented a statistical summary [2] of commercial jet airplane accidents confirmed for worldwide operations for 1959 through 2016. It considered airplanes that are heavier than 60,000 pounds maximum gross weight, showing a very clear statistical analysis of accidents, which it was possible to note the impressive evolution of aviation safety in recent years. Despite these improvements, aviation accidents caused by human failure seem to be more recurrent compared to accidents due to mechanical failures [2,3]. As well as the Boeing accident report, the International Civil Aviation Organization (ICAO) also presented a similar report considering the period between 2008 and 2018, showing the same evolution of aviation safety along this period [3]. Regarding aviation accidents during flight training, Walton et al. presented a report after analyzing a large dataset with occurrences between the years of 2000 and 2015, which it considers data from 240 airplanes involved in fatal accidents (432 fatalities) during flight training. Moreover, in this analysis, the Loss of Control In-flight—LOC-I was the leading accident category, with a total of 129 fatal accidents (54%), followed by Mid-Air Collisions—MACs, with 24 fatal training flights (10%), Controlled Flight Into Terrain—CFIT (15 accidents), Powerplant failure or malfunction—SCF-PP (13 accidents), Fuel starvation—FUEL (12 accidents), Low Altitude operations—LALT (10 accidents), Collision with obstacle(s) during Take-off and Landing—CTOL (9 accidents) and other factors [4]. Fortunately, aviation has become safer every year, reaching lower levels of accidents, considering fatalities with hull losses or not.
Given the possibility of aviation accidents caused by human failures, this work tries to contribute to those involving human factors (pilot context) using a multi data approach, considering different levels of volunteers’ expertise, i.e., experienced, mid-level and beginner on flight simulation or electronic games, in which these volunteers acted as pilots in command. How confident the volunteers are during the flights is another point considered in this work. These volunteers are not real pilots, and before the experiment, they signed a consent form. Furthermore, this work is a continuation of the work presented by [5,6,7], with the possibility to adapt the present work methodology (changing the experiments and results) to be applied on other contexts, e.g., smart city [8], biophilia, automobilism [9], music [10] or even administrative works (secretaries or customer services, for instance). Regarding the aviation context, this research brings a contribution, showing that it is indeed necessary to improve the training of the pilot, decreasing the cognition effect over their actions and thus attenuating the level of brain activity (also called as brain energy) during critical phases of a real flight.
Motivation
Although air reports say that accidents have decreased, this is not a reason to disregard these risks, because there are other problems to solve in the future, e.g., the physiological analysis of the aircrew on real flight activities [11], which it can surely result in a massive mitigation of accidents by human failures.
Analyzing several accident reports of the last 10 years has shown that the main causes of these accidents [11,12,13] were human failure and their respective physiological aspects (human factors) [14]. It is therefore possible to note that the aviation safety is facing an age of accident factors caused by human failure. These human failures motivate us to find new solutions to minimize these undesirable occurrences. These human factors may also be related to the people of the ground staff, air traffic controls and aircrew (flight crew), among others. The lack of a proper attention on these aspects, can provoke irreversible problems, e.g., serious injuries and fatal accidents. It can be caused by several factors: stress, drugs, fatigue, high workload, lack of pilot skills during an unexpected event and emotional disorders [14,15,16].
2. Methodology—Multisensing Approach
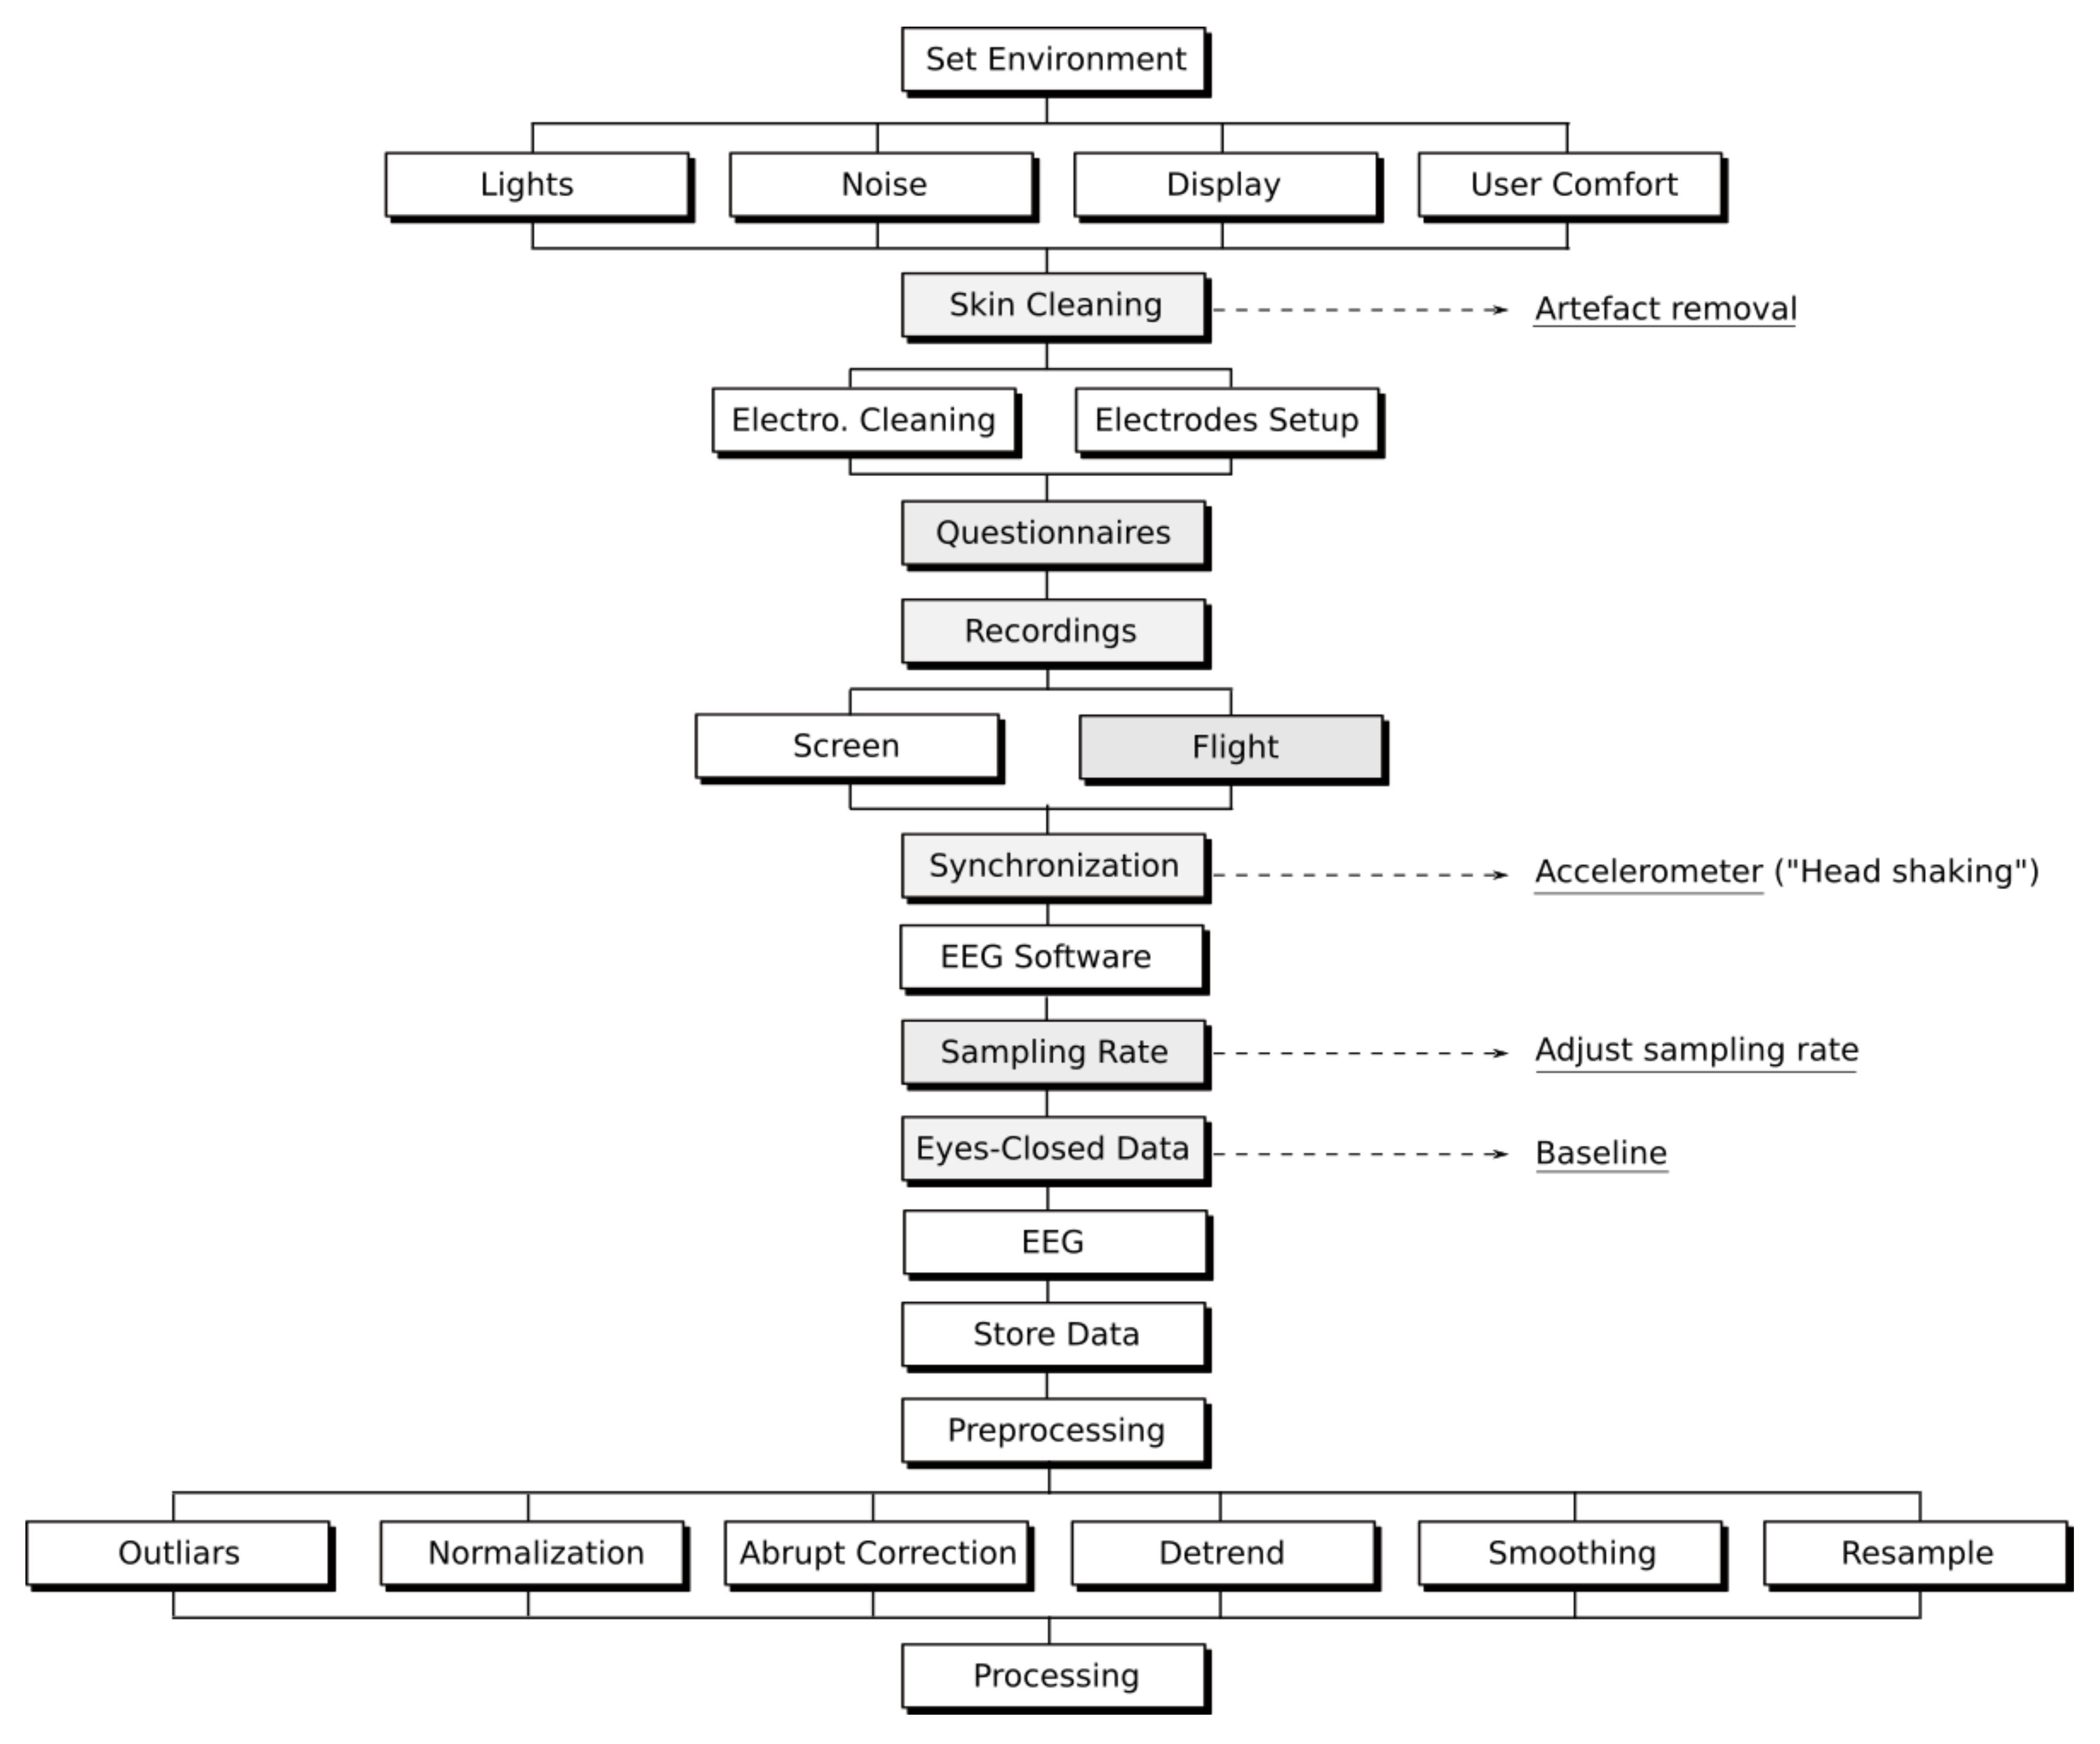
The present work is a continuation of a multisensing (or multimodal) architecture, initially defined and developed in 2018 by Roza and Postolache [7]. It is based on 3 different types of biosignals, i.e., HR, GSR and EEG, and other auxiliary channels, such as face recording and emotion questionnaires. Important variables were also considered during the multisensing architecture execution, such as environment setup, data acquisition, sampling rate synchronization, processing and so on. The main multisensing architecture was adapted in this work to present only EEG information (Figure 1).
A multisensing approach can also be applied in several research contexts, for instance, in aviation, using flight simulations [7]; using summarizing functions of complementary visual descriptors for video modeling [17]; identification of cognitive states of aircraft pilots while they are using flight simulators [18,19]; and testing the usefulness of psychophysiological measurements in a bio-cooperative feedback loop to adjust the difficulty of an upper extremity rehabilitation task [20].
2.1. Flight Experiment Description
The present work based its experiments on several simulated flights. These flights were executed using the software Microsoft Flight Simulator-Steam Edition (FSX-SE) and the aircraft Cessna 172 (C172 Skyhawk), adding some auxiliary add-ons based on turbulence, sound, light and terrain, to produce more realism during the flight [21], e.g., EZdok Camera Version 2 (EZCA2). Each simulated flight considered 7 flight tasks: takeoff (Task 1), climb (Task 2), cruise flight (Task 3), descent (Task 4), approach (Task 5), final approach (Task 6) and landing (Task 7).
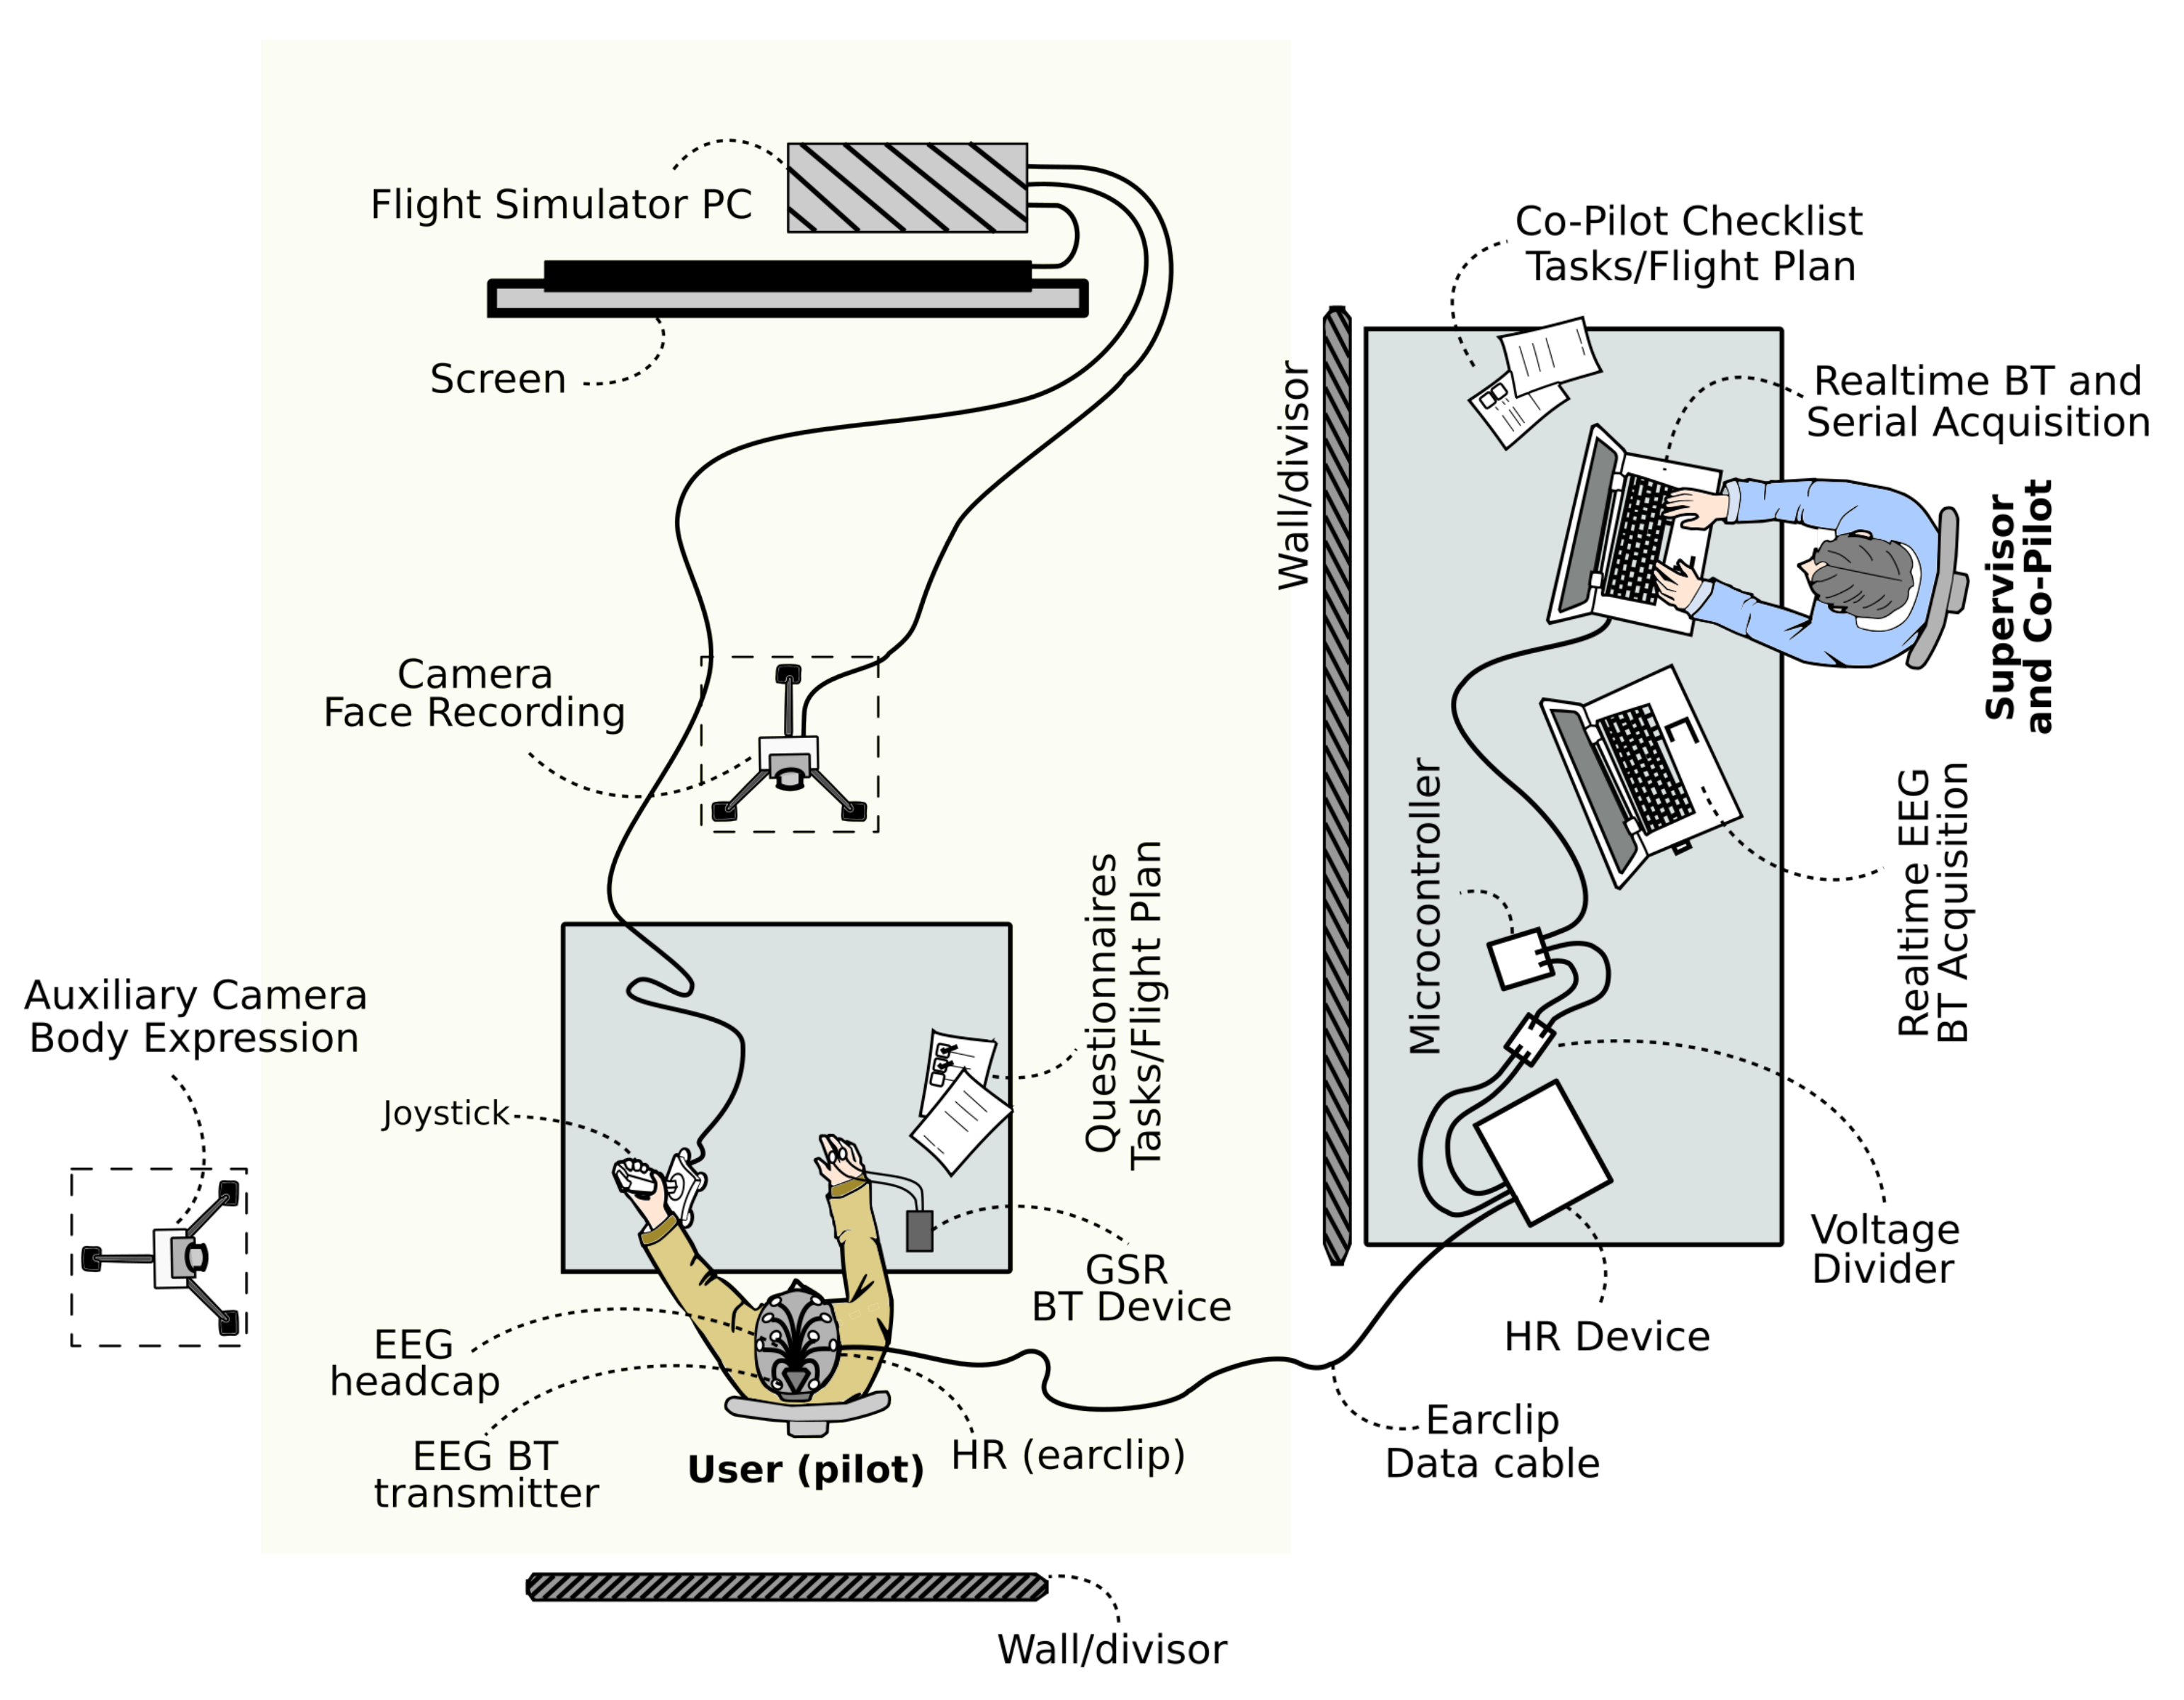
The environment setup is an important procedure to consider. It is useful to prevent the environment interference on the level of EGG e.g., by better noise reduction and light levels along the experiments. The setup is described in Figure 2, of which the EEG context (the biosignal analyzed in this present work) represents part of the proposed multisensing architecture described in [7]. In addition, this final setup was the improvement of two different proof of concepts (PoCs) [5], resulting in several changes: a large screen to improve the immersive experience during the simulation, maintaining an average distance of 1.70 to 1.90 m of the volunteer; a computer to run the flight simulator and to record facial expression; the use of only one hand to control the aircraft by the joystick, due to the GSR sensors being placed on another hand; a headcap with dry electrodes that was used to acquire EEG data; the GSR electrodes placed on the free hand, i.e., without movements to avoid motion artifacts; a microcontroller (e.g., Arduino board) used to acquire the HR data of the HR device (Medlab P100); the supervisor using two computers, one to receive HR and GSR data of Bluetooth communication, and another to receive the Bluetooth data of EEG device; and an auxiliary or additional camera, used to record the volunteers’ body gestures.
All volunteers signed a consent form, and during the flight experiment, they acted like a pilot in command, having no contact with the supervisor. The supervisor only communicated with the volunteers before and after each simulation. It was also recommended to the volunteers that they should avoid talking and moving the hand with the GSR electrodes, because doing so could produce additional noises and motion artifacts.
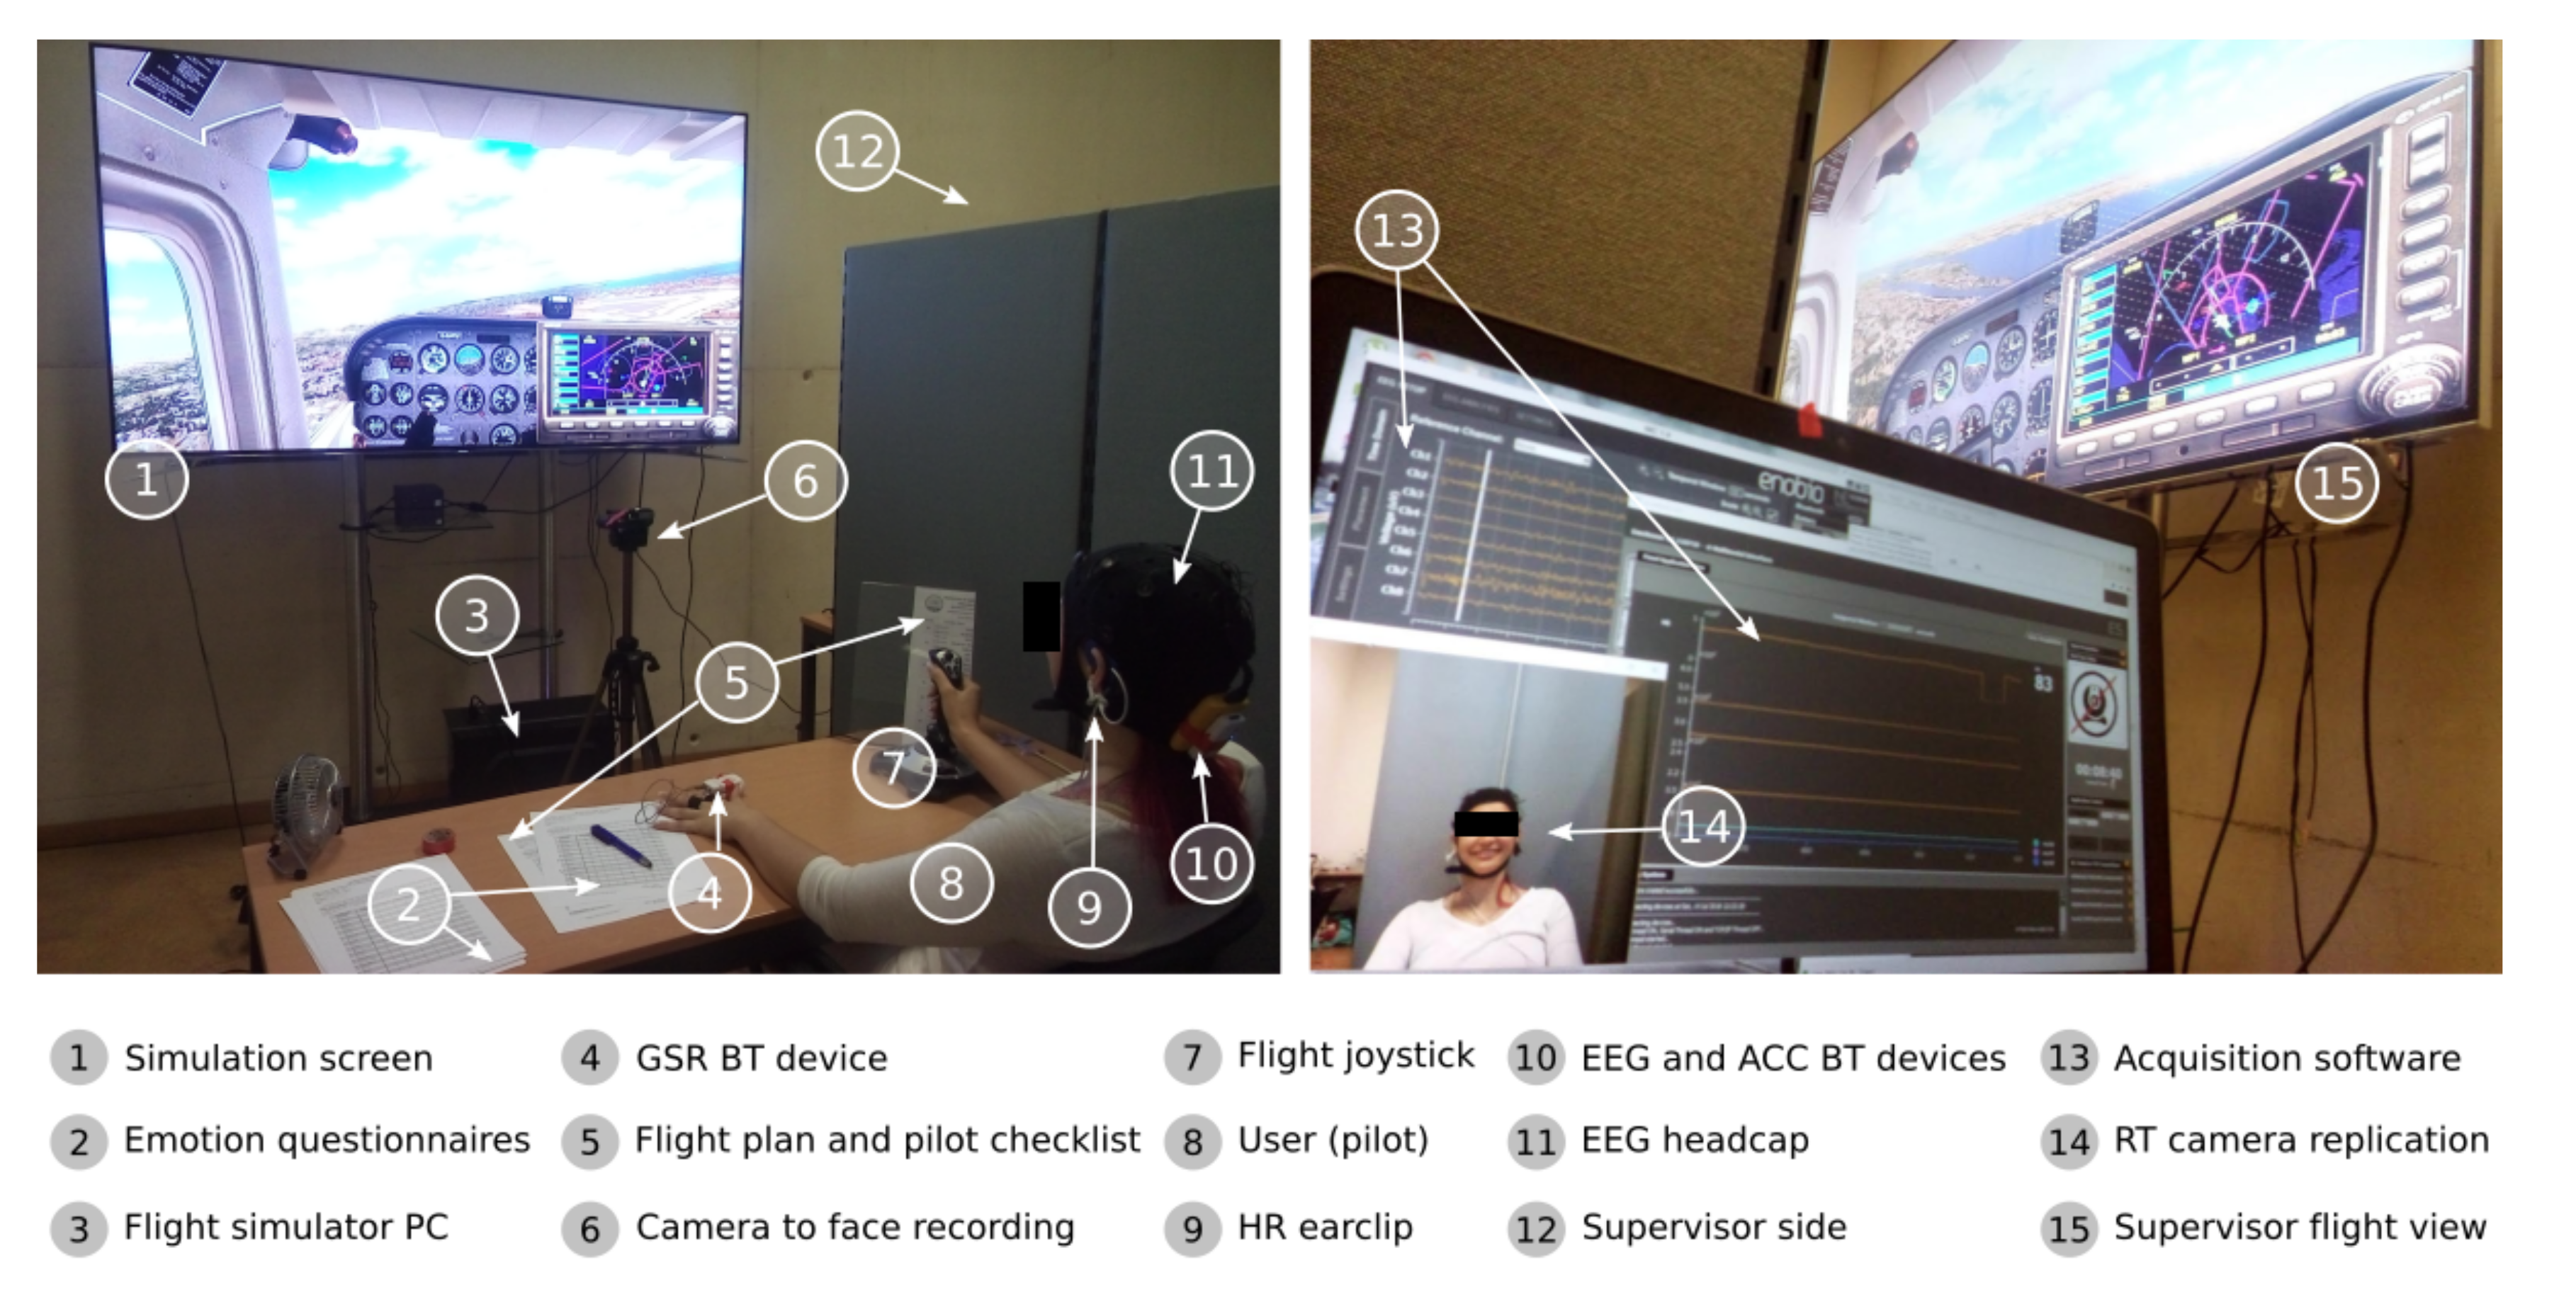
Figure 3 shows the real environment setup used in the flight simulations. The environmental illumination and sound, the position of the desk table (through auxiliary marks on the floor), and the position of the small camera and the screen were kept the same during all experiments. The supervisor watched in real time the simulated flights and was responsible for the data acquisition and flap setting throughout each flight, as shown in Figure 3-right.
Considering the practical context and the complexity of the proposed experiment, i.e., aviation based on flight simulations and multimodal sensing, different execution checklists were developed to aim the volunteers (flight checklist) and supervisor (experiment checklists) to correctly accomplish the several steps regarding the proposed multimodal sensing system and flight procedures.
Head Shaking Indicator—Beginning and End of the Experiment
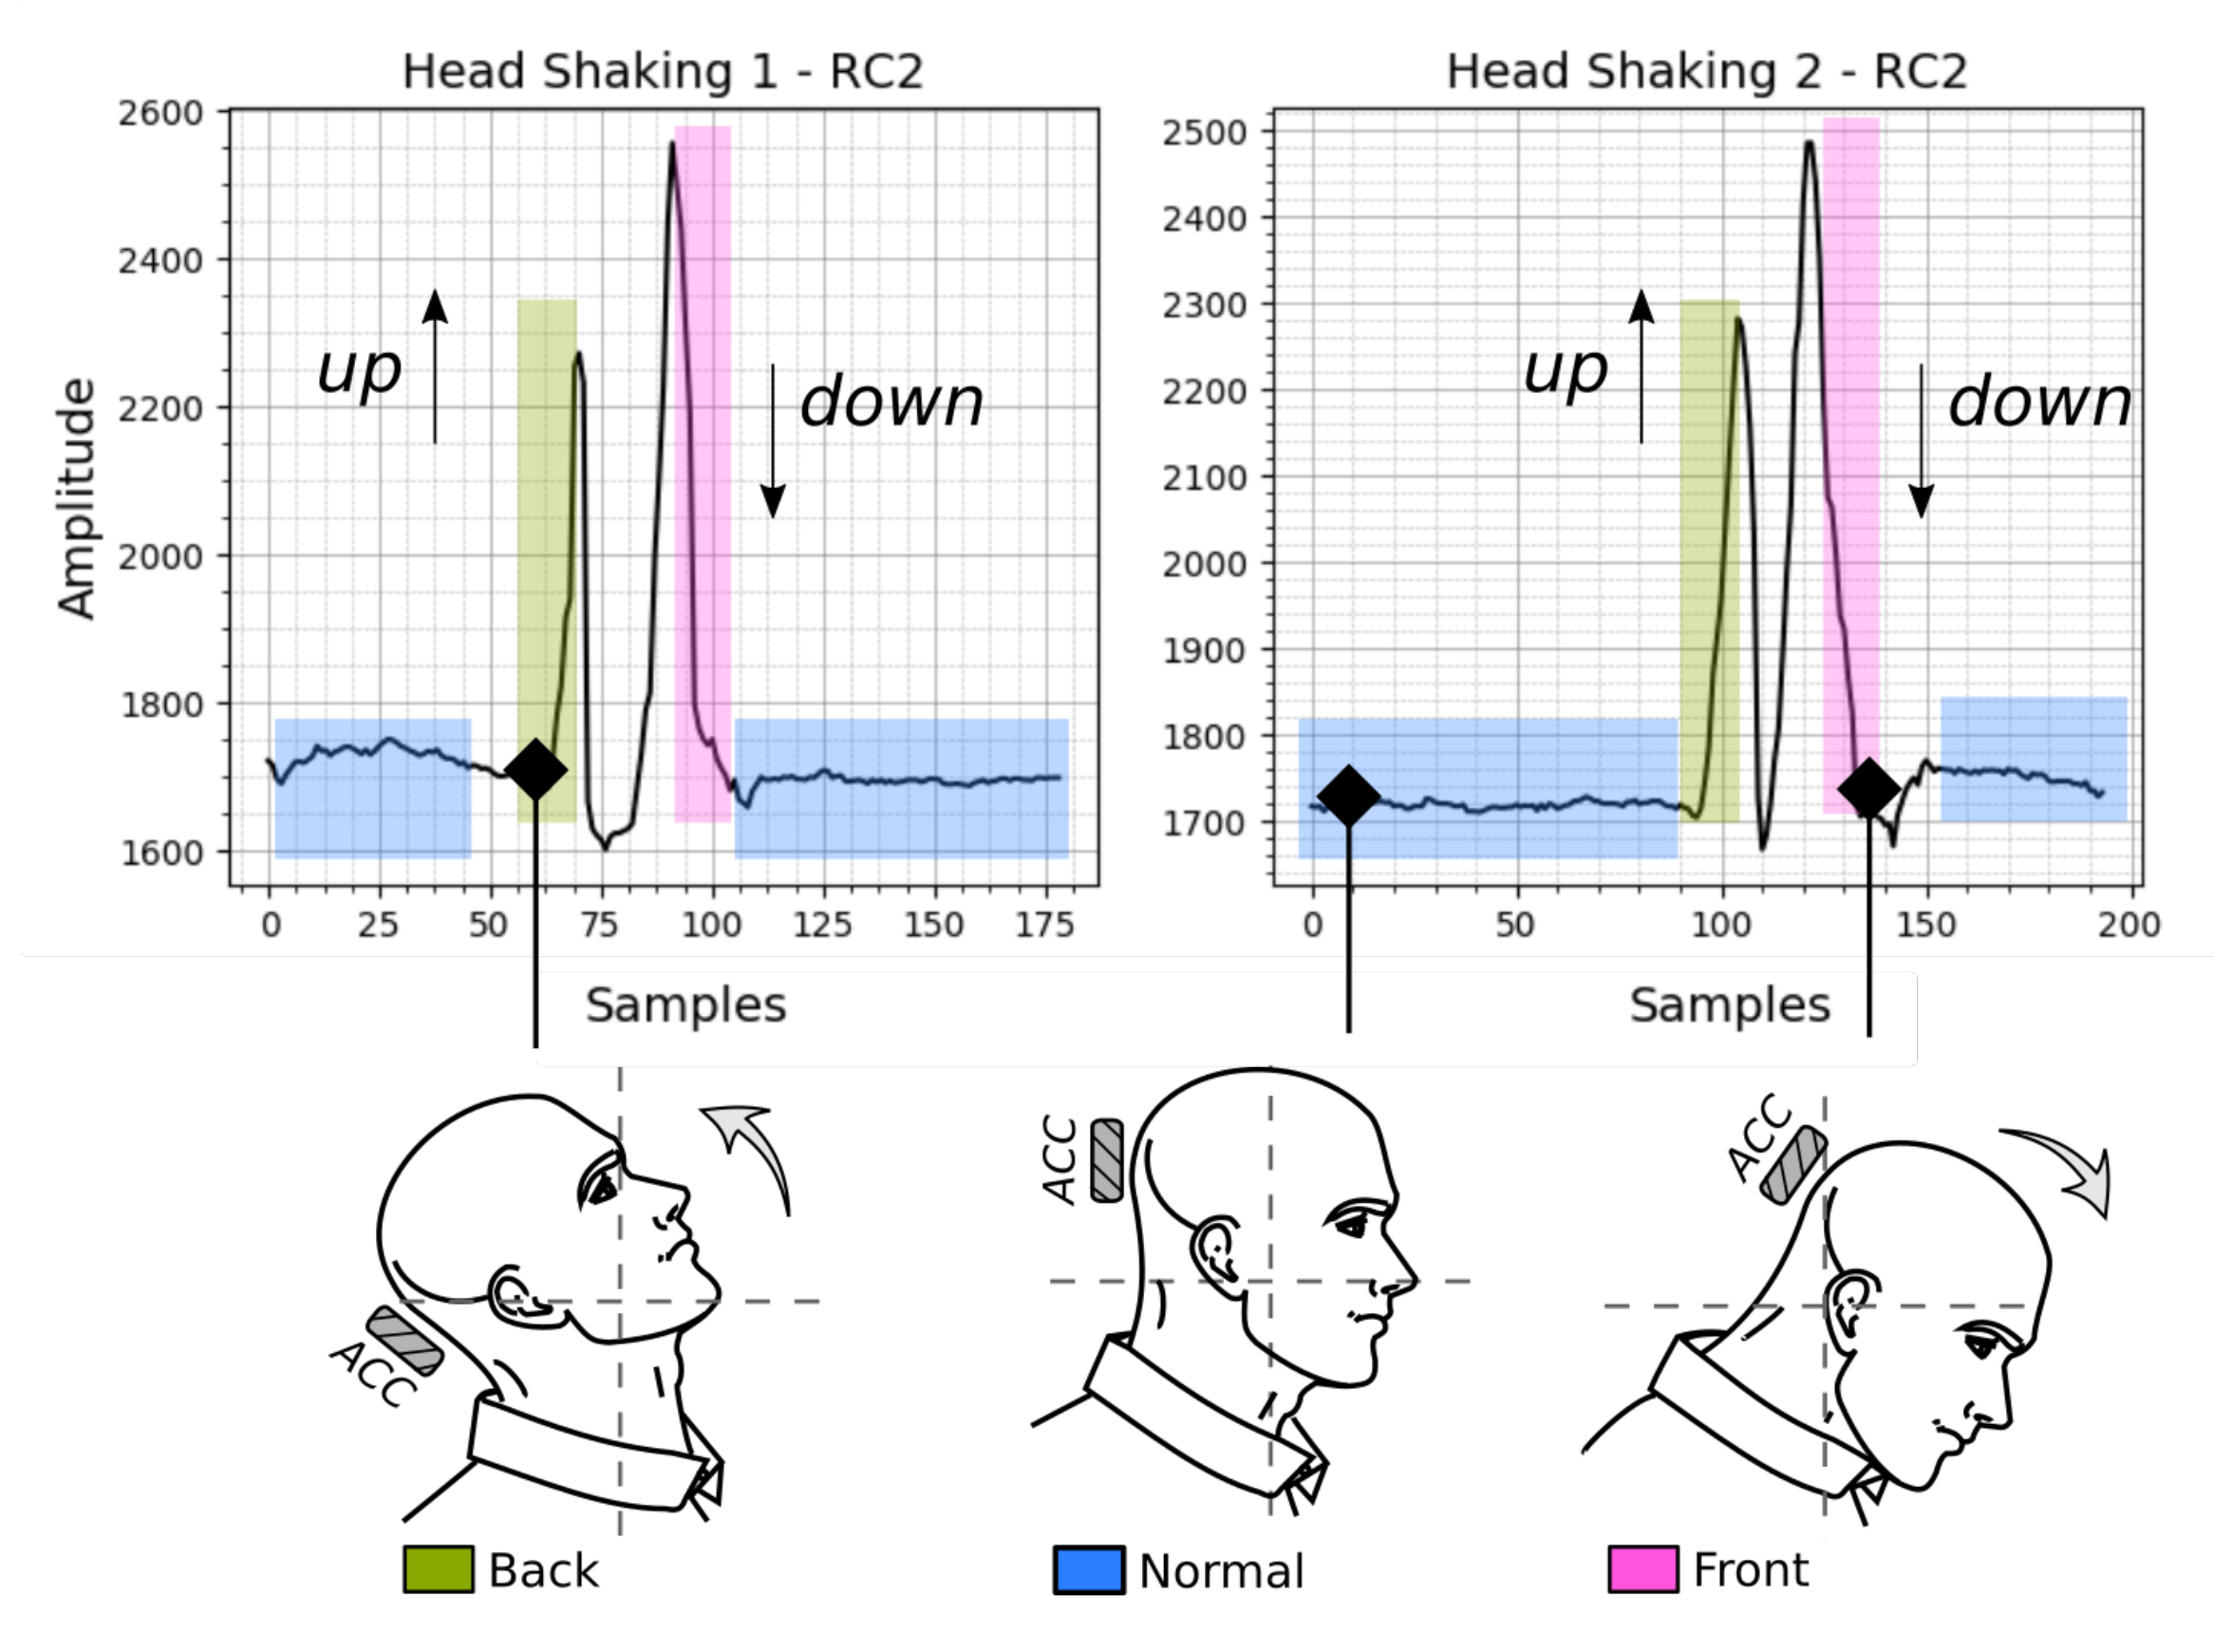
The head shaking indicator was the strategy used to synchronize the real-time EEG sensing acquisition with the other data having different sampling rate. The head shaking methodology was inspired by standard procedures of real military pilots, in which they quickly shake their heads to indicate the beginning or the synchronization of some flight procedures, for instance, synchronized takeoff and maneuvers (Figure 4).
The EEG and GSR devices used in this work have also embedded accelerometers, which they were used to capture the head shaking (placed on the head back) of the volunteers during the flight. The head shaking represents a signal like a wave “mark” used in the further data split process. It was used in four different moments of the experiment: double head shaking to indicate the beginning of the eyes-closed baseline; double head shaking to indicate the end of this baseline; double head shaking to indicate the beginning of the flight (i.e., takeoff); and double head shaking to indicate the end of the flight experiment.
2.2. Dataset Description
In this work, a total of 21 multisensing datasets were acquired, which it came from 21 simulated flights obtained from 8 volunteers ( = 8), where each volunteer executed at most 3 flights. Between these datasets, 13 datasets were valid to be analyzed, and 8 were invalid for several reasons, such as bad electrode connections, error in BT communication, wrong video frame rate and so on.
These 13 datasets include the emotion questionnaires, face recordings, HR, GSR and EEG data. The dataset names are a sequence of two letters and one number to indicate the volunteer name and the flight sequence of such volunteer, respectively, [5,6,7].
Dataset Resampling
Since this work’s design was a multisensing experiment, several other datasets were considered in order to synchronize it by time and flight tasks. Originally, these raw and huge datasets presented different sampling rates and it was interesting to equalize it before the analysis: 22,237 samples of the face dataset (5 S/s-samples per second or Hz), 44,237 samples of each HR and GSR dataset (sampling rate of 10 Hz) and 2,157,087 × 8-channels (or 17,256,696 total samples) of the EEG dataset (sampling rate of 500 Hz), presenting a total of 17,367,407 multisensing samples to be processed and analyzed.
To optimize these huge datasets and then to save processing time and complexity, they were reduced to a common sampling rate of 10 Hz, presenting a final length of 44,237 samples for each data channel, i.e., 44,237 reduced samples for Face, HR and GSR and 44,237 × 8-channels for EEG. It represents a total multisensing sample of 44,237 × 11-channels (Face, HR, GSR and EEG), or a total of 486,607 reduced samples, representing a total reduction of 97.19% samples to be processed. These sampling rate changes presented some loss of information being mostly corrected by the data processing.
Table 1, presents the raw dataset description with its individual number of samples and time, considering the sampling rates between 5 and 500 Hz.
It is important to emphasize that in this present work, only the EEG datasets were considered. Other datasets such as HR and GSR were only presented in this section, to show the reason of the EEG dataset resampling, since it is a continuation of a bigger experiment [5].
2.3. Brain Signal Acquisition
The proposed experiment based on flight simulation was shown to be an efficient way to produce brain stimulation during different flight moments. The brain activities were acquired by the device Neuroelectrics Enobio-N8, which it had 8 channels, Bluetooth communication and a sampling rate of 500 samples per second.
Although emotions are not the analyzed part of the present work, they are also strongly related to aviation accidents cause by human failures. Some studies claim that it is difficult to find the specific region of scalp where the brain activity is sufficiently high to detect emotional states [22,23]; however, if one intendeds to detect emotional responses, it is recommended to use the prefrontal cortex or frontal lobe (located near the front of the head) because it be more involved with cognition and decision making of emotional responses [24,25].
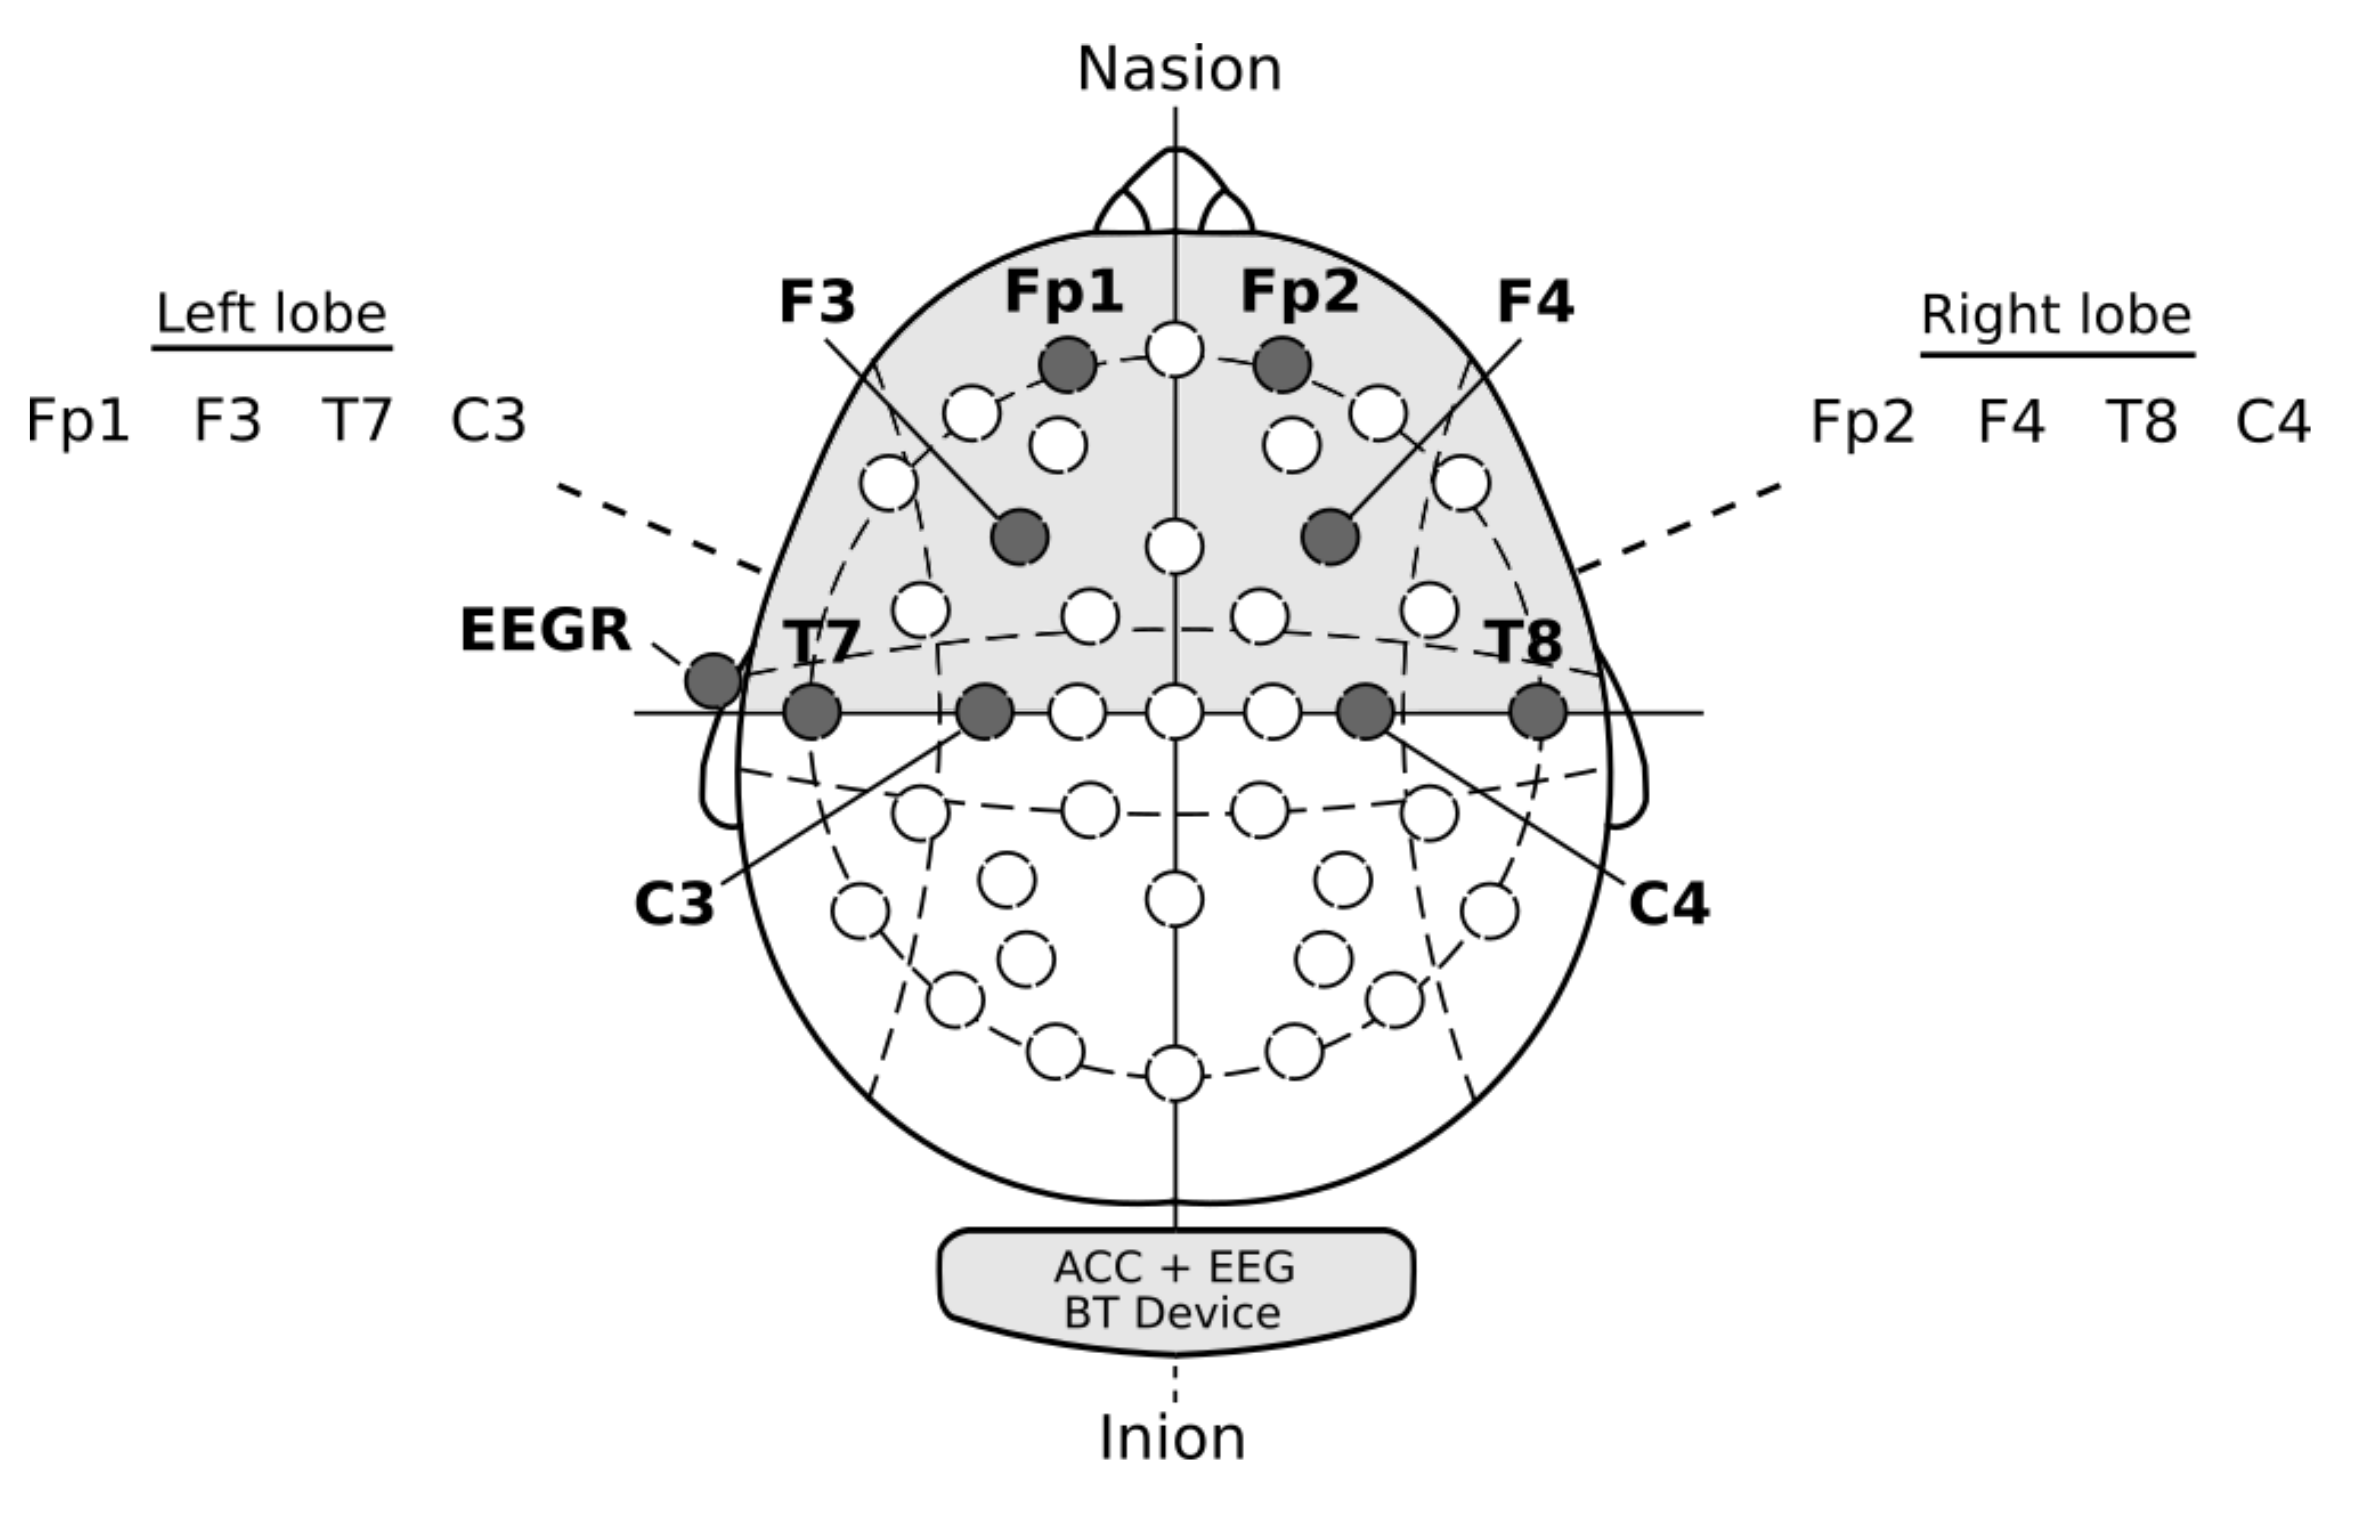
The 10–20 system or International 10–20 system was the method used to describe and apply the location of scalp electrodes. This way, to better detect emotion, alertness situations and cognition artifacts of the scalp, the electrodes were placed on that recommended areas [10,24,25], some of which were also used by [18,19] in other simulated flight experiments: Fp1 (channel 1), F3 (channel 2), C3 (channel 3), T7 (channel 4), Fp2 (channel 5), F4 (channel 6), C4 (channel 7) and T8 (channel 8). The EEG reference electrode (EEGR) was placed on the volunteers’ earlobes [22,26] (Figure 5).
The Beta Rhythms
The beta rhythms (or beta band) are expressed by distinct peaks on the spectrograms and may be found in various locations of the cortex in normal conditions. According to Kropotov [27], the beta band is more often found in the frontal or central areas when compared to posterior regions of the brain cortex, showing a frequency around 13 Hz. It is conventionally divided into the following sub-bands: low beta (from 13 to 20 Hz), high beta (from 21 to 30 Hz) and gamma activity (from 31 Hz and higher). He also says that there is a special beta frequency activity at 40 Hz. For this reason, the present work considered the beta band analysis from 12 to 30 Hz and 40 Hz. Unfortunately, from analyzing only 40 Hz, it is hard to conclude relevant results; thus, it was decided to also consider a small part of gamma band, i.e., 31 to 40 Hz [27], to produce continuous plots from 12 to 40 Hz.
The most prominent hypotheses suggest that the beta band indicates ongoing sensorimotor integration [28], being more related to awareness and concentration contexts. In the beta state, our brain easily does the analysis and preparation of the information and generates solutions and new ideas. Furthermore, it is very beneficial for work productivity, studying for exams or other activities that require high concentration and alertness, as is reported in [28,29].
At least two distinct beta rhythms can be found: the beta rhythms located over the sensorimotor strip (primary motor cortex)—the Rolandic beta rhythms, and the beta rhythms located more frontally-–frontal beta rhythms [27,30]. In this work, the Rolandic or pericentral beta rhythms were also considered. The selected beta rhythm is modulated during various motor and cognitive tasks [18,19], being observed as a spontaneous activity during eyes-open and eyes-closed conditions in healthy subjects over the areas C3, Cz and C4. The close relation of the prefrontal cortex and beta rhythm, with the emotion artifacts and the cognitive tasks, makes these brain outputs an important data to be used in this work as well [24,25].
2.4. Data Processing
During the EEG data processing, the data were filtered and corrected (i.e., artifacts were removed) [5] before the statistical analysis. Signal detrend, removal and filtering were some the processing steps executed in this work.
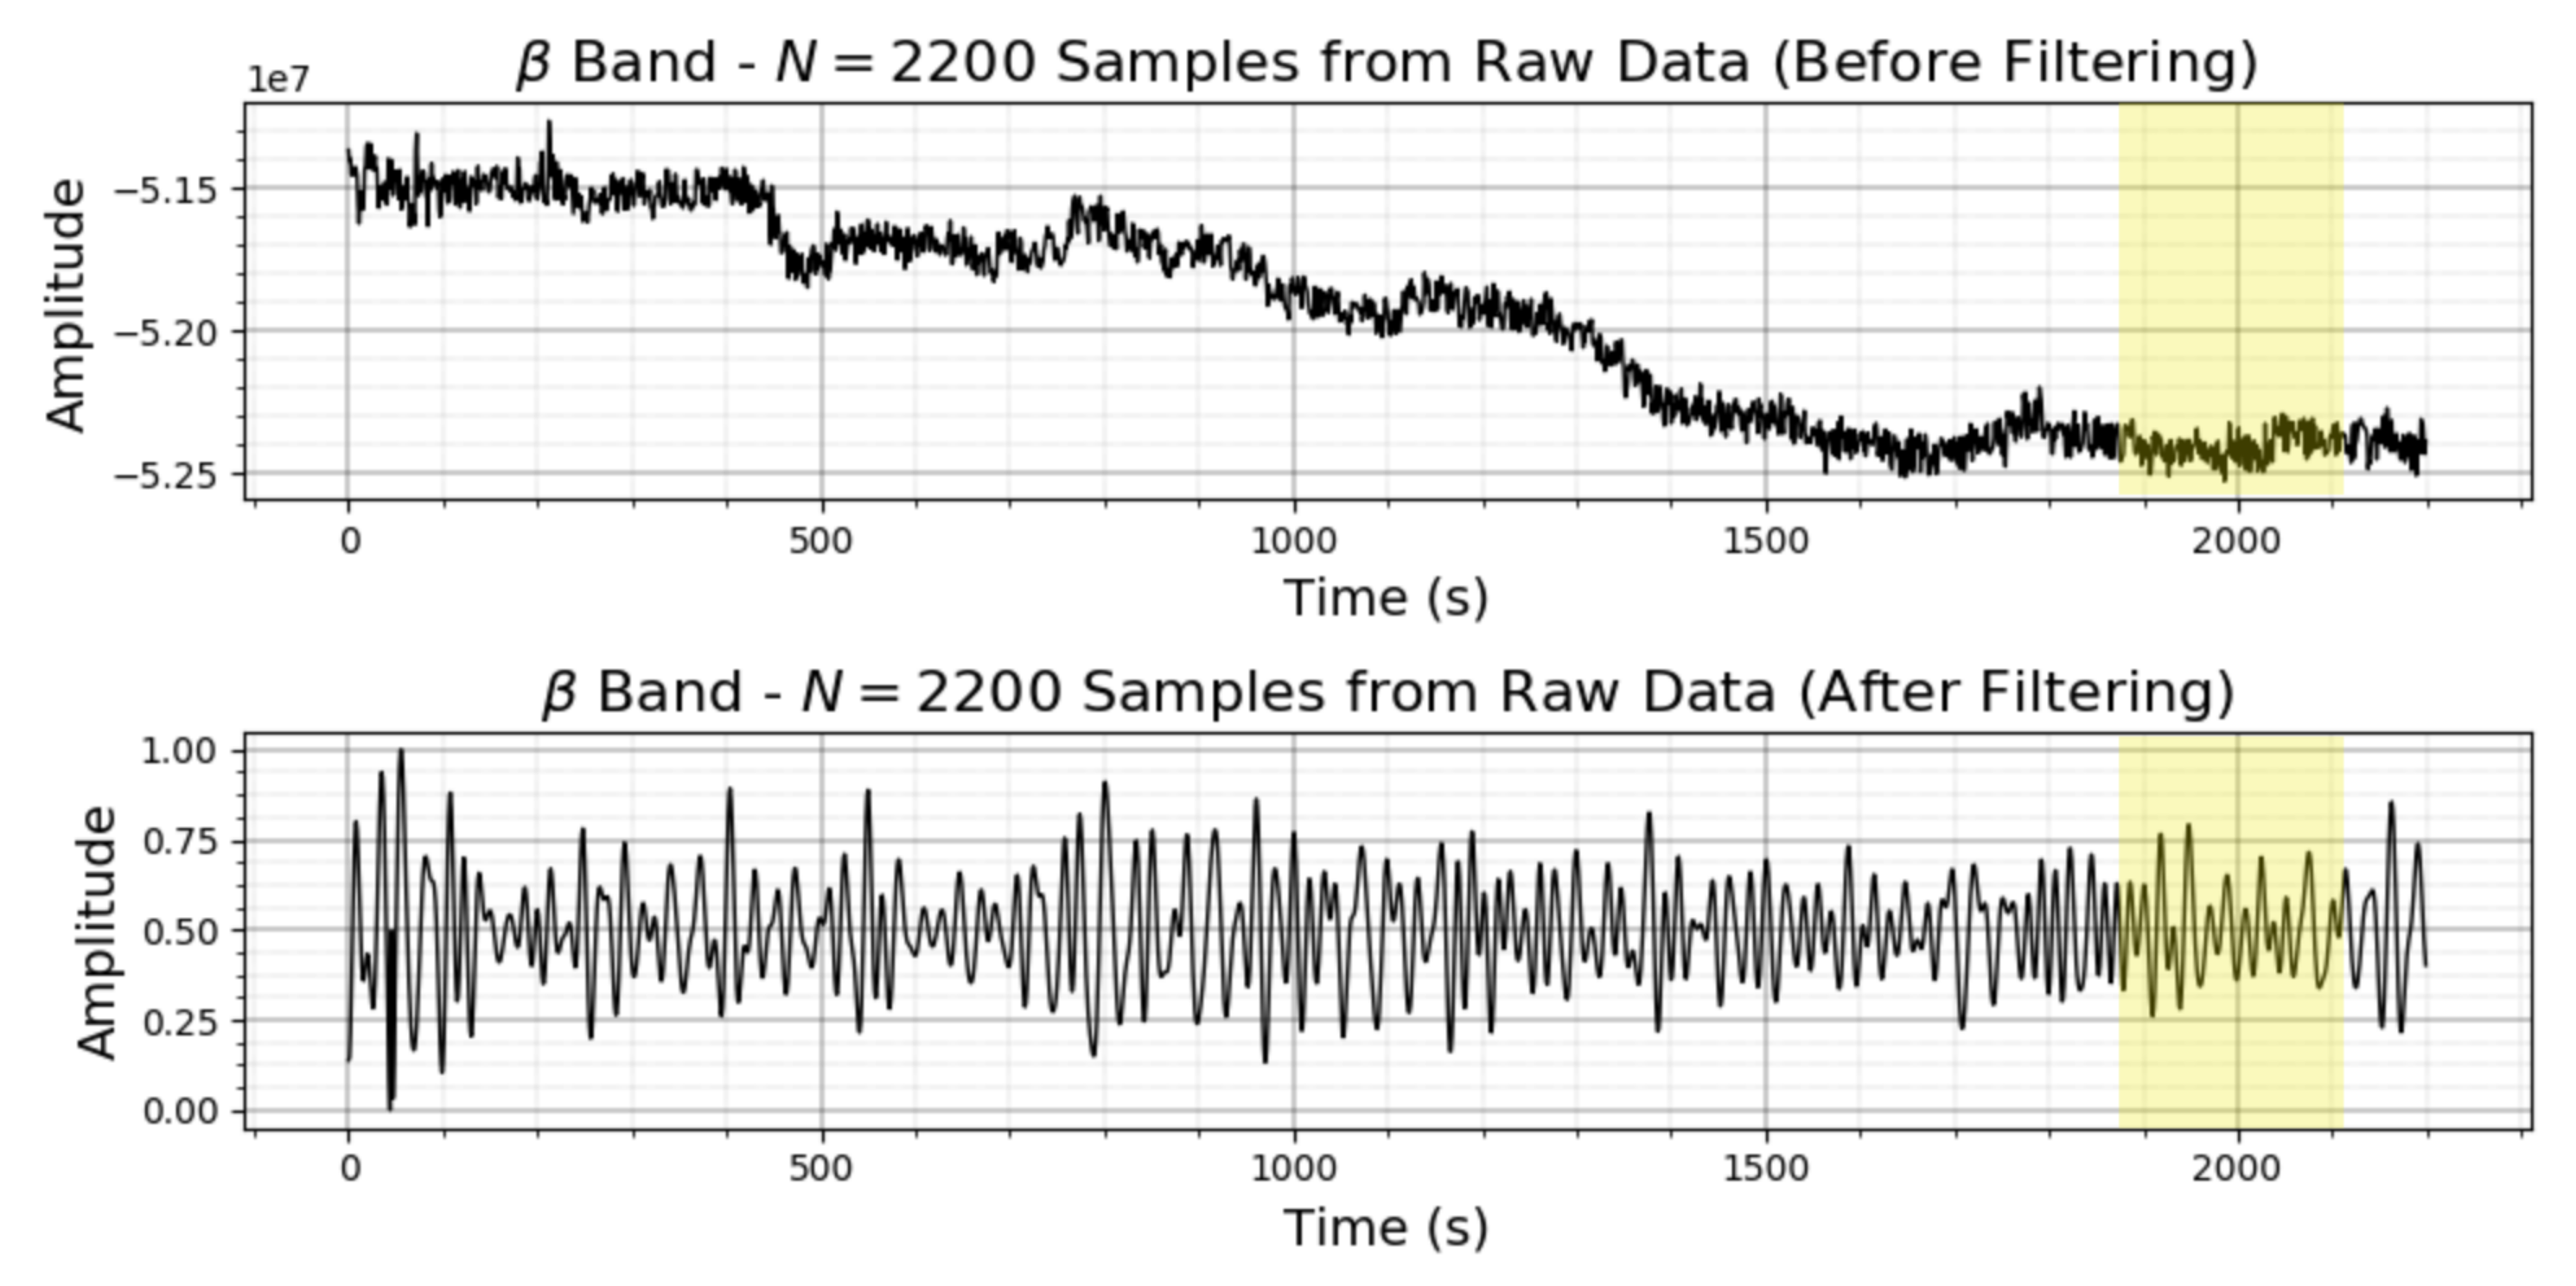
The raw EEG dataset presented many signal fluctuations and some motion artifacts during the experiment, caused mainly due to the head movements. These fluctuations and artifacts change the absolute signal amplitudes and must to be removed. One of possible methods to correct it is based on detrend (or drift removal) using small recursive filter called dc blocker. It is an efficient method and preserves the main characteristics of each peak shape and removes the dc-component of a signal [31]. Other filtering was also applied to consider only the -band on these experiments. The frequency range between 12 and 40 Hz was applied using a band pass filter (BPF) to ensure a minimum noise over the -band (Figure 6).
The filtering also removed the highest electrooculogram (EOG) artifacts. These EOG artifacts are one of the main types of noises in the EEG data and must be avoided. They were caused by the eyes’ globe movements during the experiments, since that the EOG frequencies are mainly between 0.5 to 12 Hz.
The Discrete Fourier Transform (DFT) plays a central role in this work, since most of the processing is based on it. It is also used to visualize the effect of the filtering process. The DFT transforms the data of the space of time to space the of frequency, defined by direct transform as defined in Equation (1). In other words, it is represented as linear combinations of bounded exponents through the Fourier transform [32]. The application of the DFT to spectral analysis will be shown further.
3. Results and Discussion
Considering the simulation experiment and the acquired EEG data of the volunteers, the -band analysis was carried out based on spectrogram analysis and statistical analysis of the brain activities, according to each proposed flight task.
3.1. Flight Analysis
The practical results of 21 flights are presented in Table 2. In 21 flights executed, 62% of it presented general accidents; all flight tasks were accomplished in 38% of the flights i.e., landing successfully; 19% crashed during the climb task, including 14.2% due to stall occurrences and 4.8% due to direct collision occurrences; 9% crashed at final approach task; and 33.3% crashed at landing. The landing tasks were classified as abrupt landing (A-Landing), less smooth landing (LS-Landing) and smooth landing (S-Landing). Regarding the volunteers’ gender, 52.3% (11 out of 21) of the flights were executed by male volunteers and 47.7% by female volunteers. The latter reported having no experience with flight simulation and rarely had contact with electronic games. It is likely that these reasons were why the landing tasks were successfully concluded only by male volunteers.
It is also important to consider that of the eight volunteers, one volunteer (male), reported to be an advanced user on flight simulation, i.e., 12.5% of them; four other volunteers (male) were considered to have a mid-level in flight simulation but an experienced level in electronic games, i.e., 50.0% of them. The remaining three volunteers (female) were reported to be beginner level on all these approaches. The volunteers were between 21 and 40 years old.
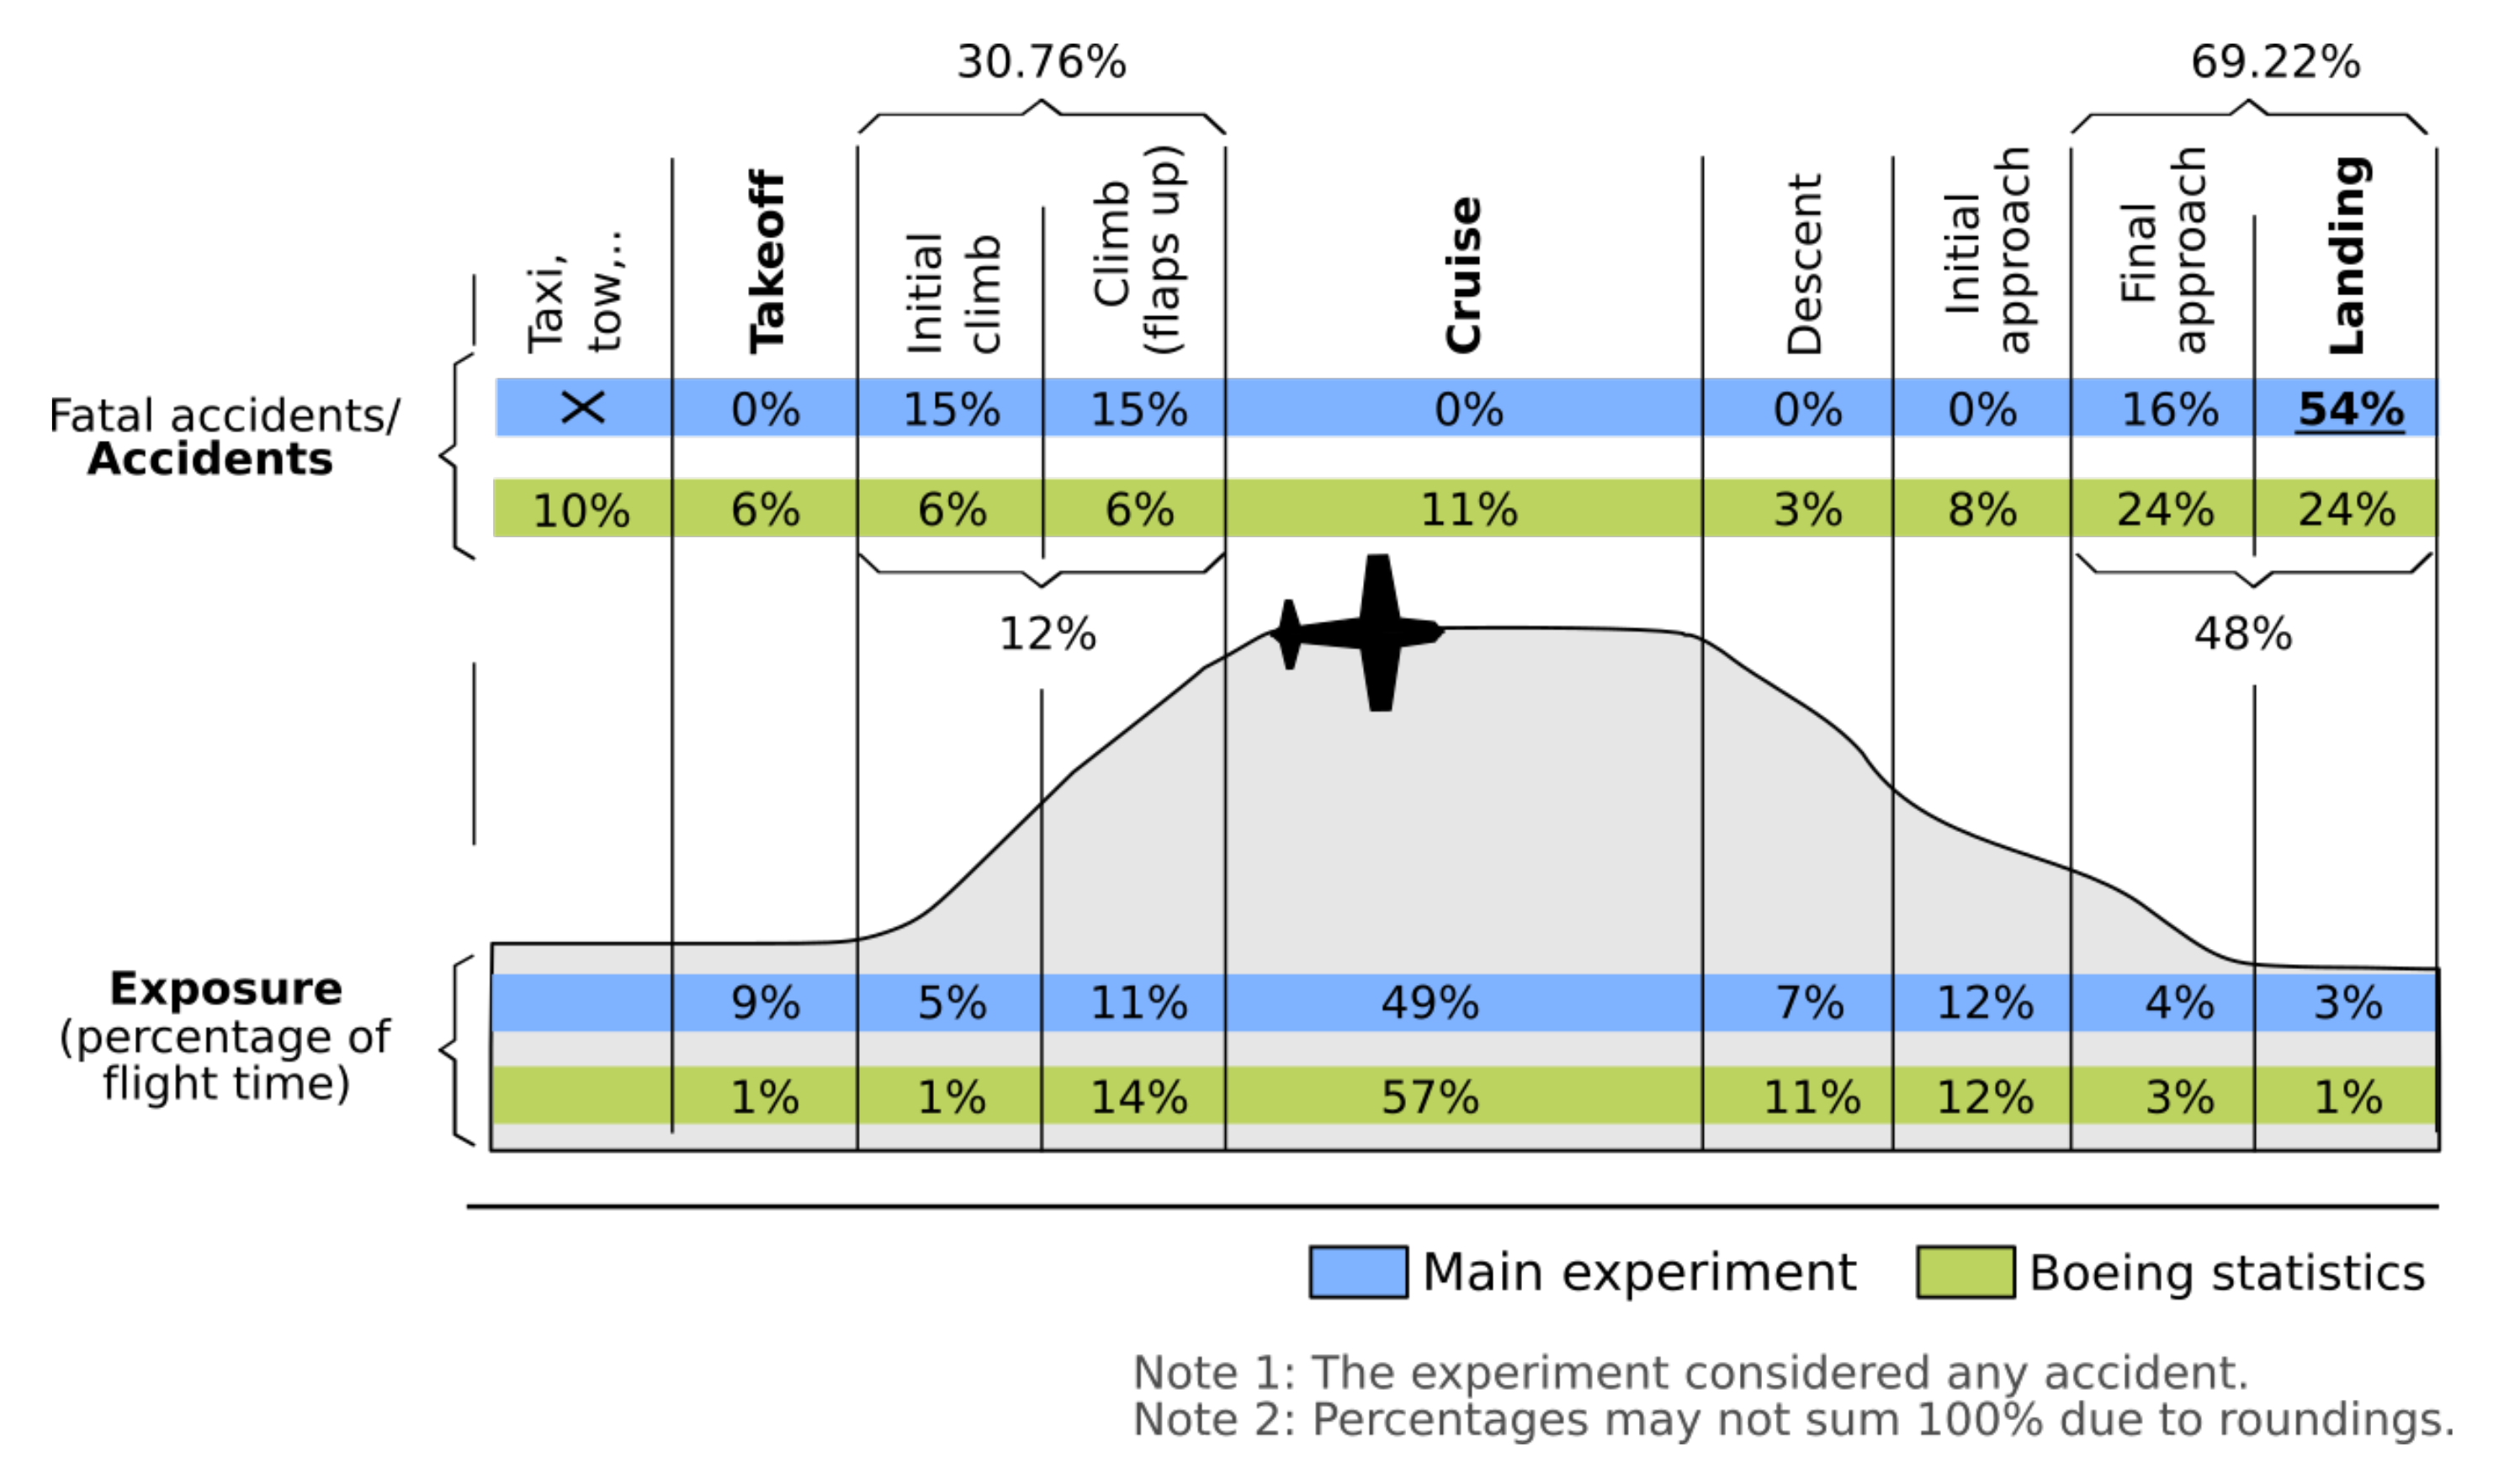
Figure 7 shows a comparison between the accidents or crashes occurrences during the simulated flights experiment ( = 13) and the accident report of the Boeing Aerospace Company (statistics from 1959 to 2016) [2].
The percentage of accidents in the present experiment is based on a total of 13 accidents over 21 flights. The landing task presented the higher accident rate, with 7 occurrences among the 13 accidents, i.e., 53.84%. The accident rate on the final approach was 2 occurrences out of 13, i.e., 15.38%, and in the climb task, it were four out of 13, i.e., 30.76%. It is also possible to see that the present experiment showed a similar proportional occurrence percentages if compared with real data reported by the Boeing Aerospace Company [2].
3.2. Confidence Versus Expertise
The volunteers’ confidence during the flights is another point to be considered, reinforcing the need for massive training of the pilots and then to avoid insecurities during the flights.
Aldhous [33] presented briefly the relation between confidence and the expertise, showing why confidence matters more than expertise. A similar approach was also observed by Kawamura [34], in which he presented a study showing that overconfidence on the expert’s side may enhance information transmission when he or she is severely biased, while this is not the case for underconfidence. Therefore, since the proposed tasks were the same for all volunteers, which they had the same time to train for and complete, the volunteers’ confidence to execute the proposed tasks may in fact outweigh the expertise on flight simulations, because they could be experts in flight but not necessarily on the proposed tasks and specific questions [33].
3.3. -Band Spectrogram Analysis
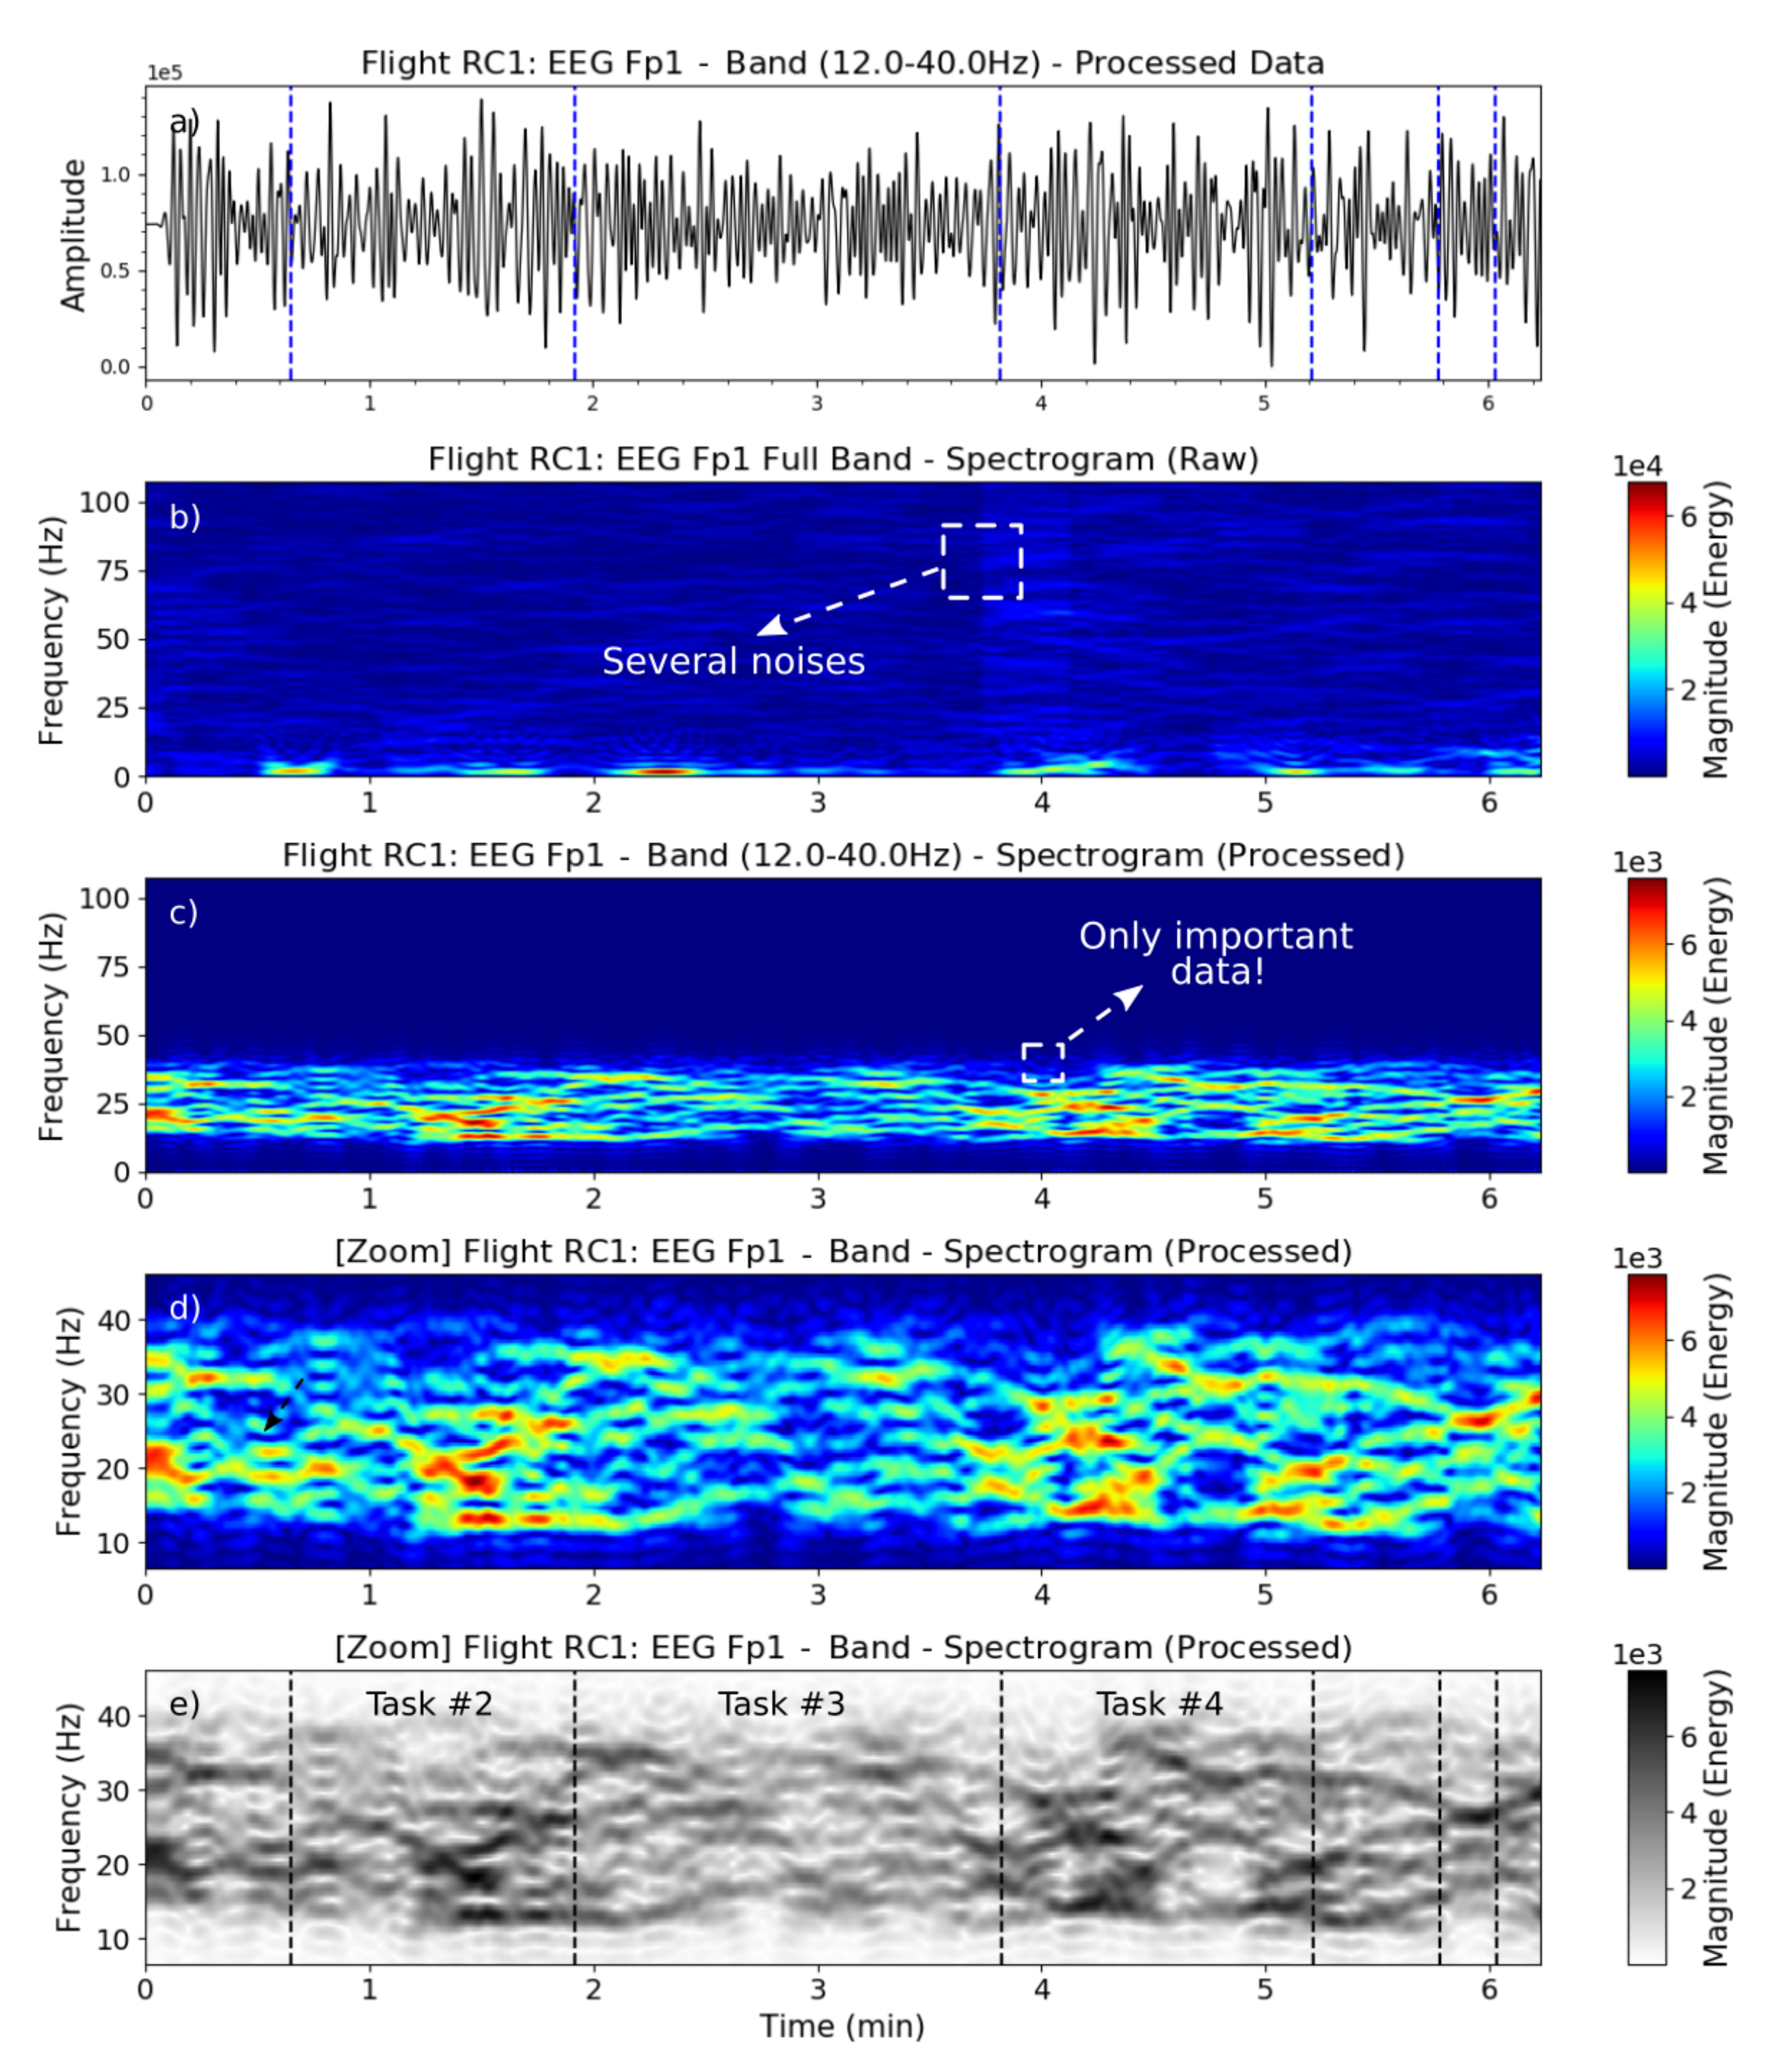
All presented plots were based on Python libraries e.g., the spectrograms that it were executed by the scipy.signal.spectrogram() method. Figure 8, shows the EEG spectrogram referent to the flight dataset RC1, which each vertical line delimits the tasks from 1 up to 7. It was acquired of the volunteer’s frontal left lobe (channel Fp1). Figure 8a, shows the data already filtered (between 12 to 40 Hz) correspondent to beta band [27]. The raw EEG dataset (already detrended), is shown in Figure 8b; there, it is possible to note a full band data, which it is not filtered yet to analyze the data according to each flight task.
To try to relate the volunteer brain activities according to each flight task, the EEG spectrogram was considered over the -band, showing different magnitudes, according to each flight task. Based on Figure 8d,e, it is possible to note lower magnitudes during task 3, which it corresponds mainly to frequency intervals between 12 and 30 Hz, which it may also indicate a relaxation of the beta brain activity and thus also of the volunteer, due to the low complexity of the present task.
According to some safety reports, in a real aviation context [2,3], the safest flight phase, having the lowest number of accidents, occurs in the flight phase equivalent to task 3. This shows that the proposed experiments were able to produce similar physiological responses of a real pilot in flight. The considered spectral results can be useful to understand better why some flight phases present a high probability of accidents occurring. These physiological responses felt by each volunteers of these experiments were naturally produced; i.e., the experiment supervisor did not interfere with their reactions and did not even say which tasks were the most risky.
These higher spectra magnitudes are the result of a natural complexity of some flight tasks, e.g., takeoff and landing, which it require more attention and precise use of flight commands. This is why the beta band magnitudes increased when the landing approached, for instance.
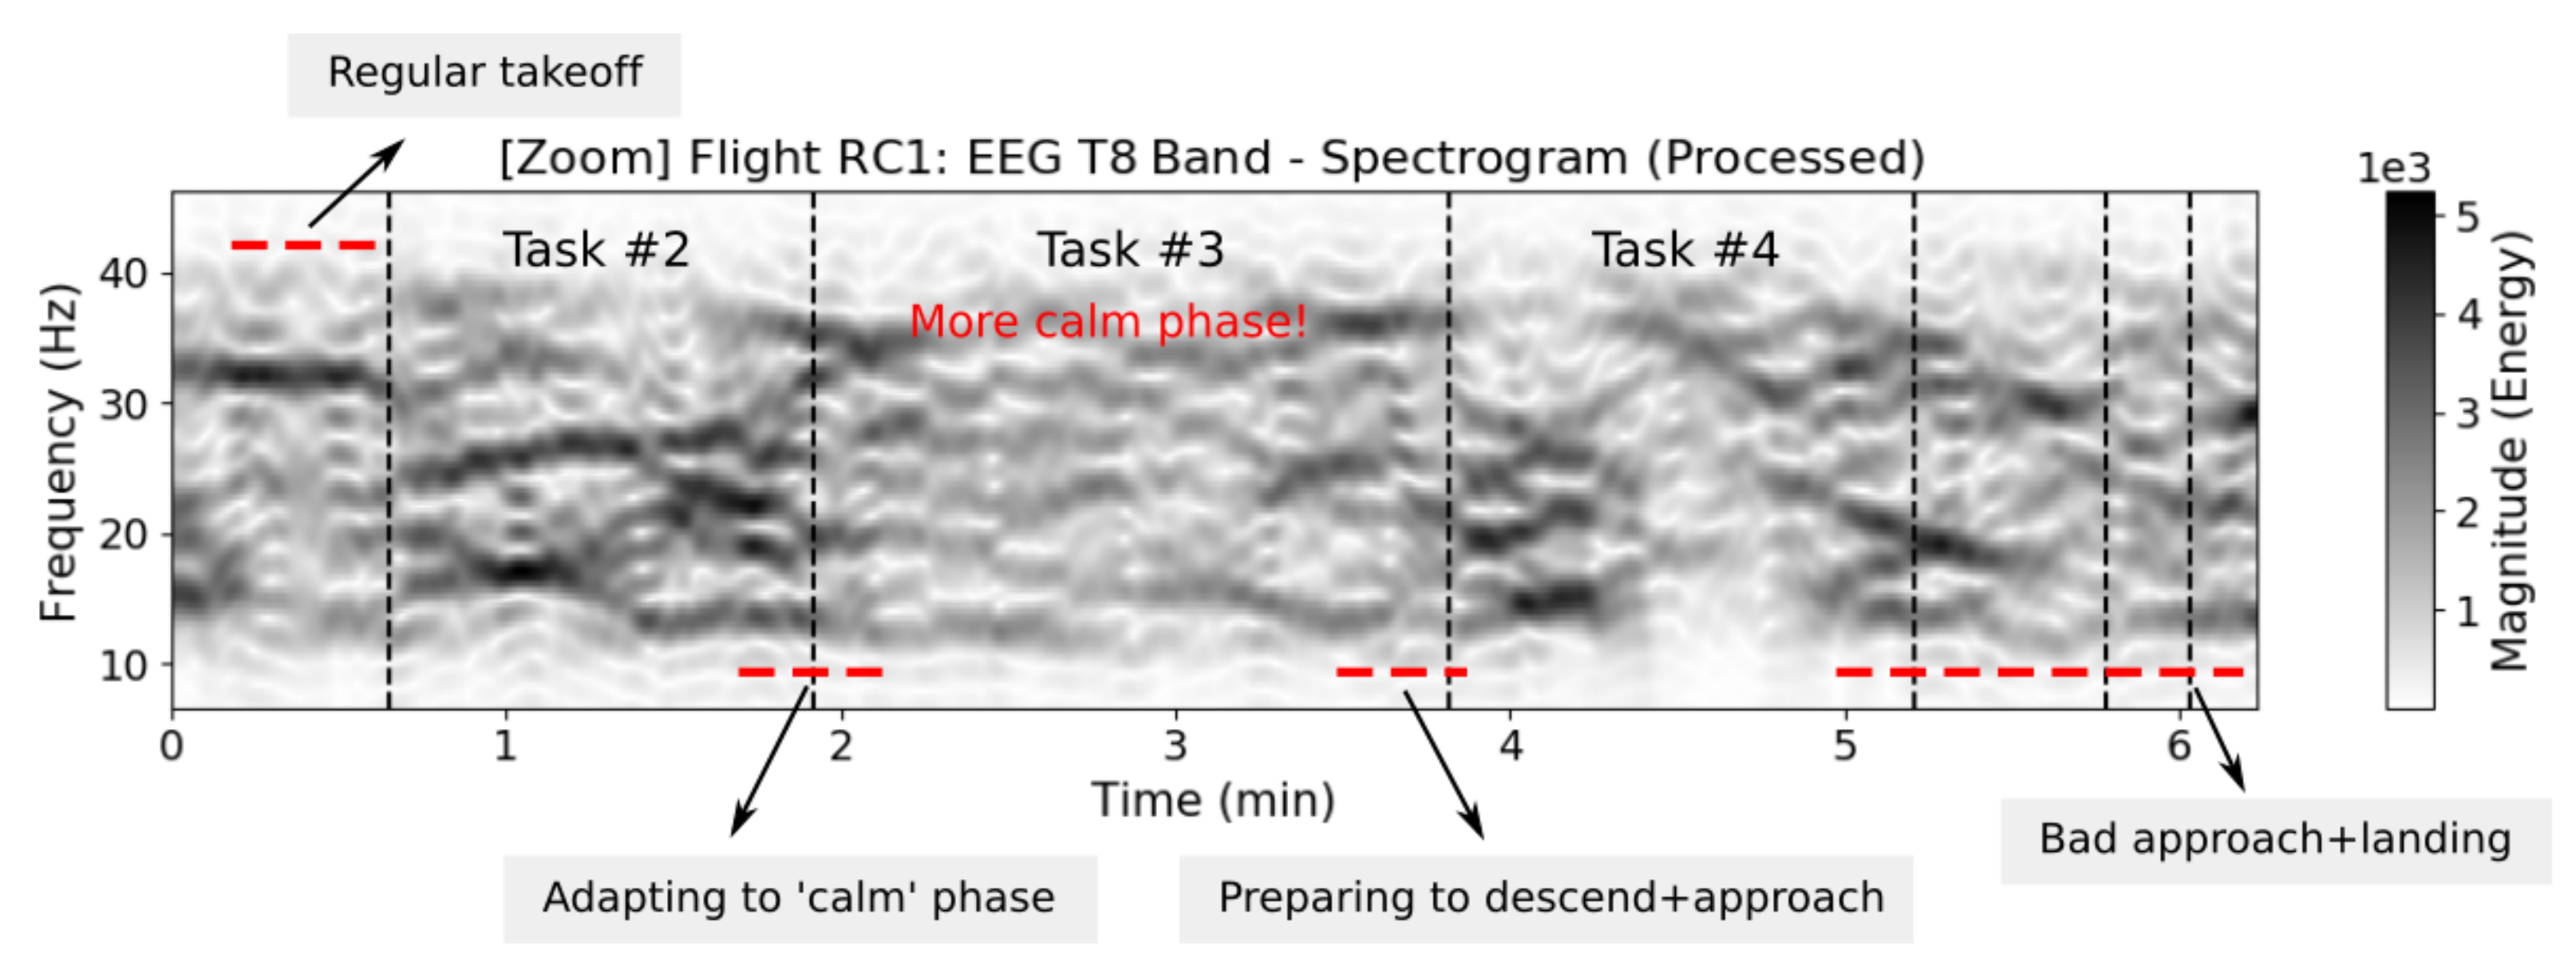
By observing the temporal brain area (channel T8) of the same volunteer (flight RC1), it was also possible to see the brain responses during the flight (Figure 9). It is interesting to analyze the feelings of the volunteers (e.g., by using questionnaires), just after they started a cruise flight (task 3), which it came after a situation that was more intense (higher brain activity) due to problems during the climb task, in which they experienced a more stabilized flight; in the same way, when the volunteer felt that they were close to the start of the descent of the aircraft (task 4), the brain activity (from frontal lobe Fp1 and temporal lobe T8) was shown to increase again, reflecting that the volunteer started to be alert (or even stressed) to execute the next task.
The volunteer of the flight RC1 reported feeling not too confident about executing the climb, approach and landing tasks (tasks 2, 5, 6, and 7) correctly. Surely for this reason, in this flight, the volunteer’s brain presented high magnitude and oscillation during those tasks, resulting in an accident on the last task, i.e., landing.
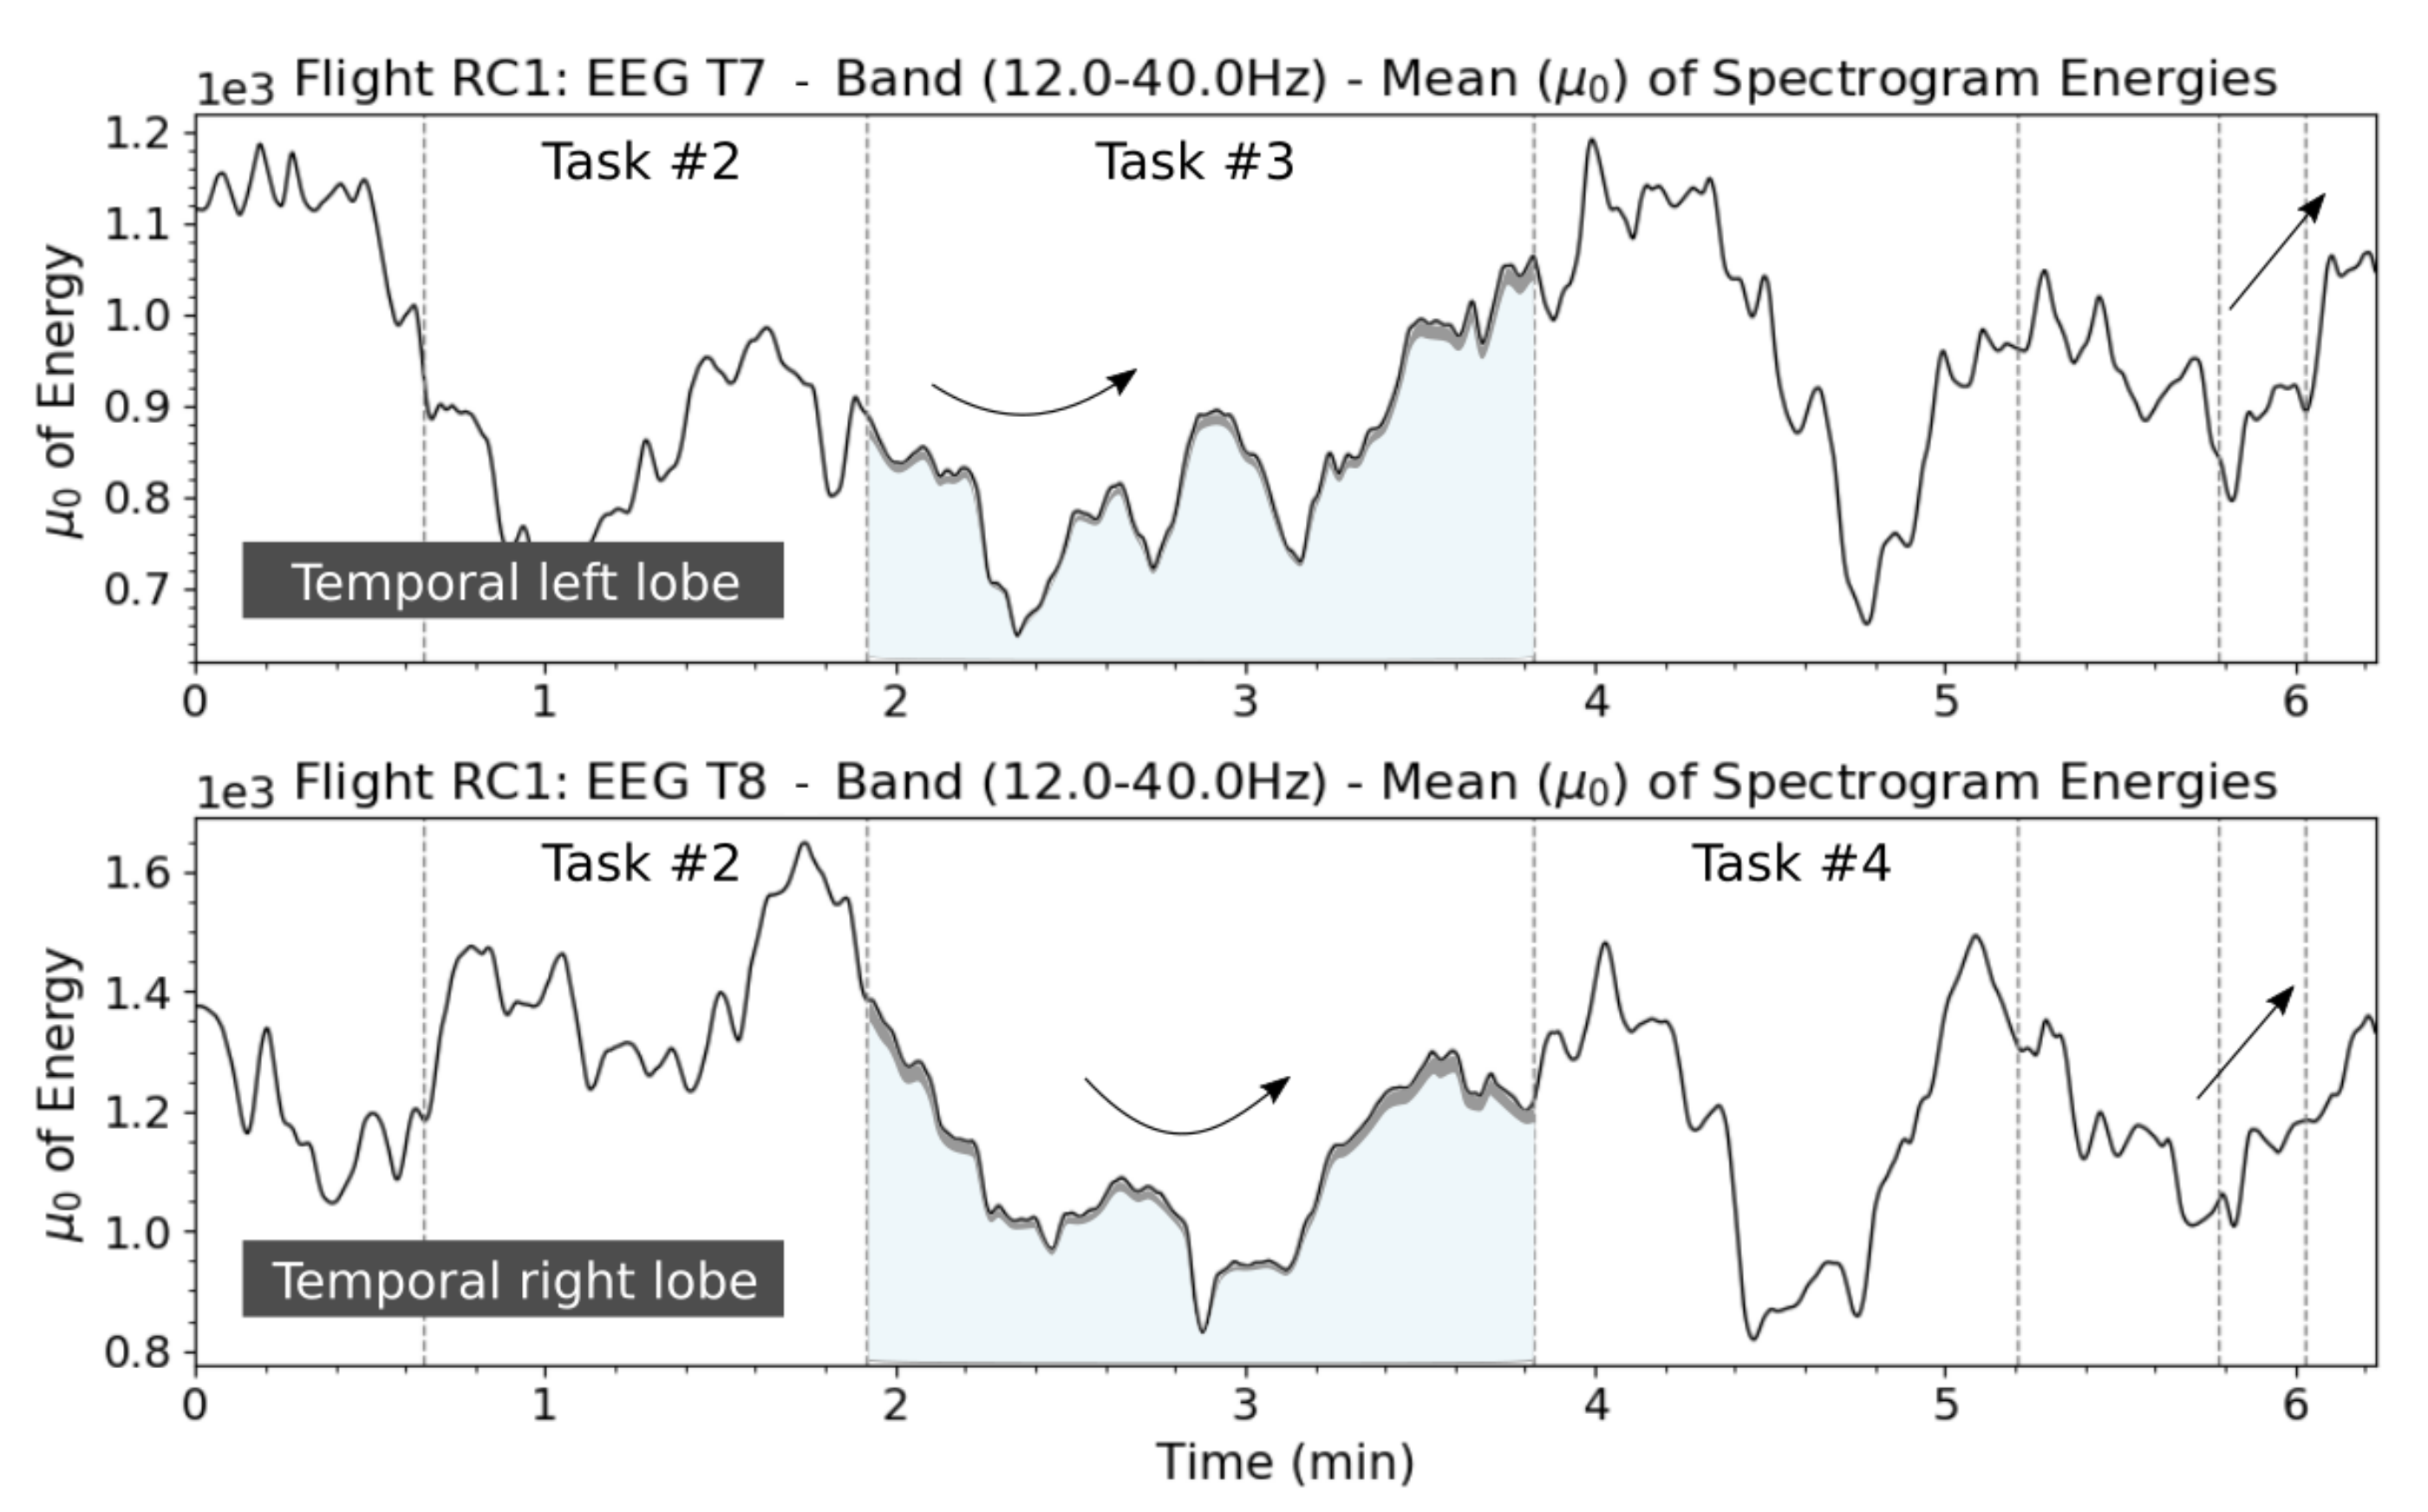
A different way to represent the prior spectrogram (bottom plot), is shown in Figure 10. It represents the mean of all magnitudes (on each frequency) computed by time. This representation shows the brain magnitudes over time, of the temporal left and right lobes T7 and T8, for each flight.
As shown in position T7, the brain signal starts high at takeoff (task 1), decreases a little during the climb (task 2), and becomes low during the cruise flight (task 3); the signal starts to reach high magnitudes again when the volunteer prepares to descend (task 4), which it obviously must demand more attention and alertness, until the landing (task 7). Even though the volunteer of the flight RC1 was a mid-level volunteer on the flight simulator, he reported feeling not too confident for some tasks of the current flight. The opposite activity of T7 and T8, observed during task 1, happened probably because of the influence of other positions from the brain or due to the volunteers move only one hand along the experiment reflecting these action on the other side.
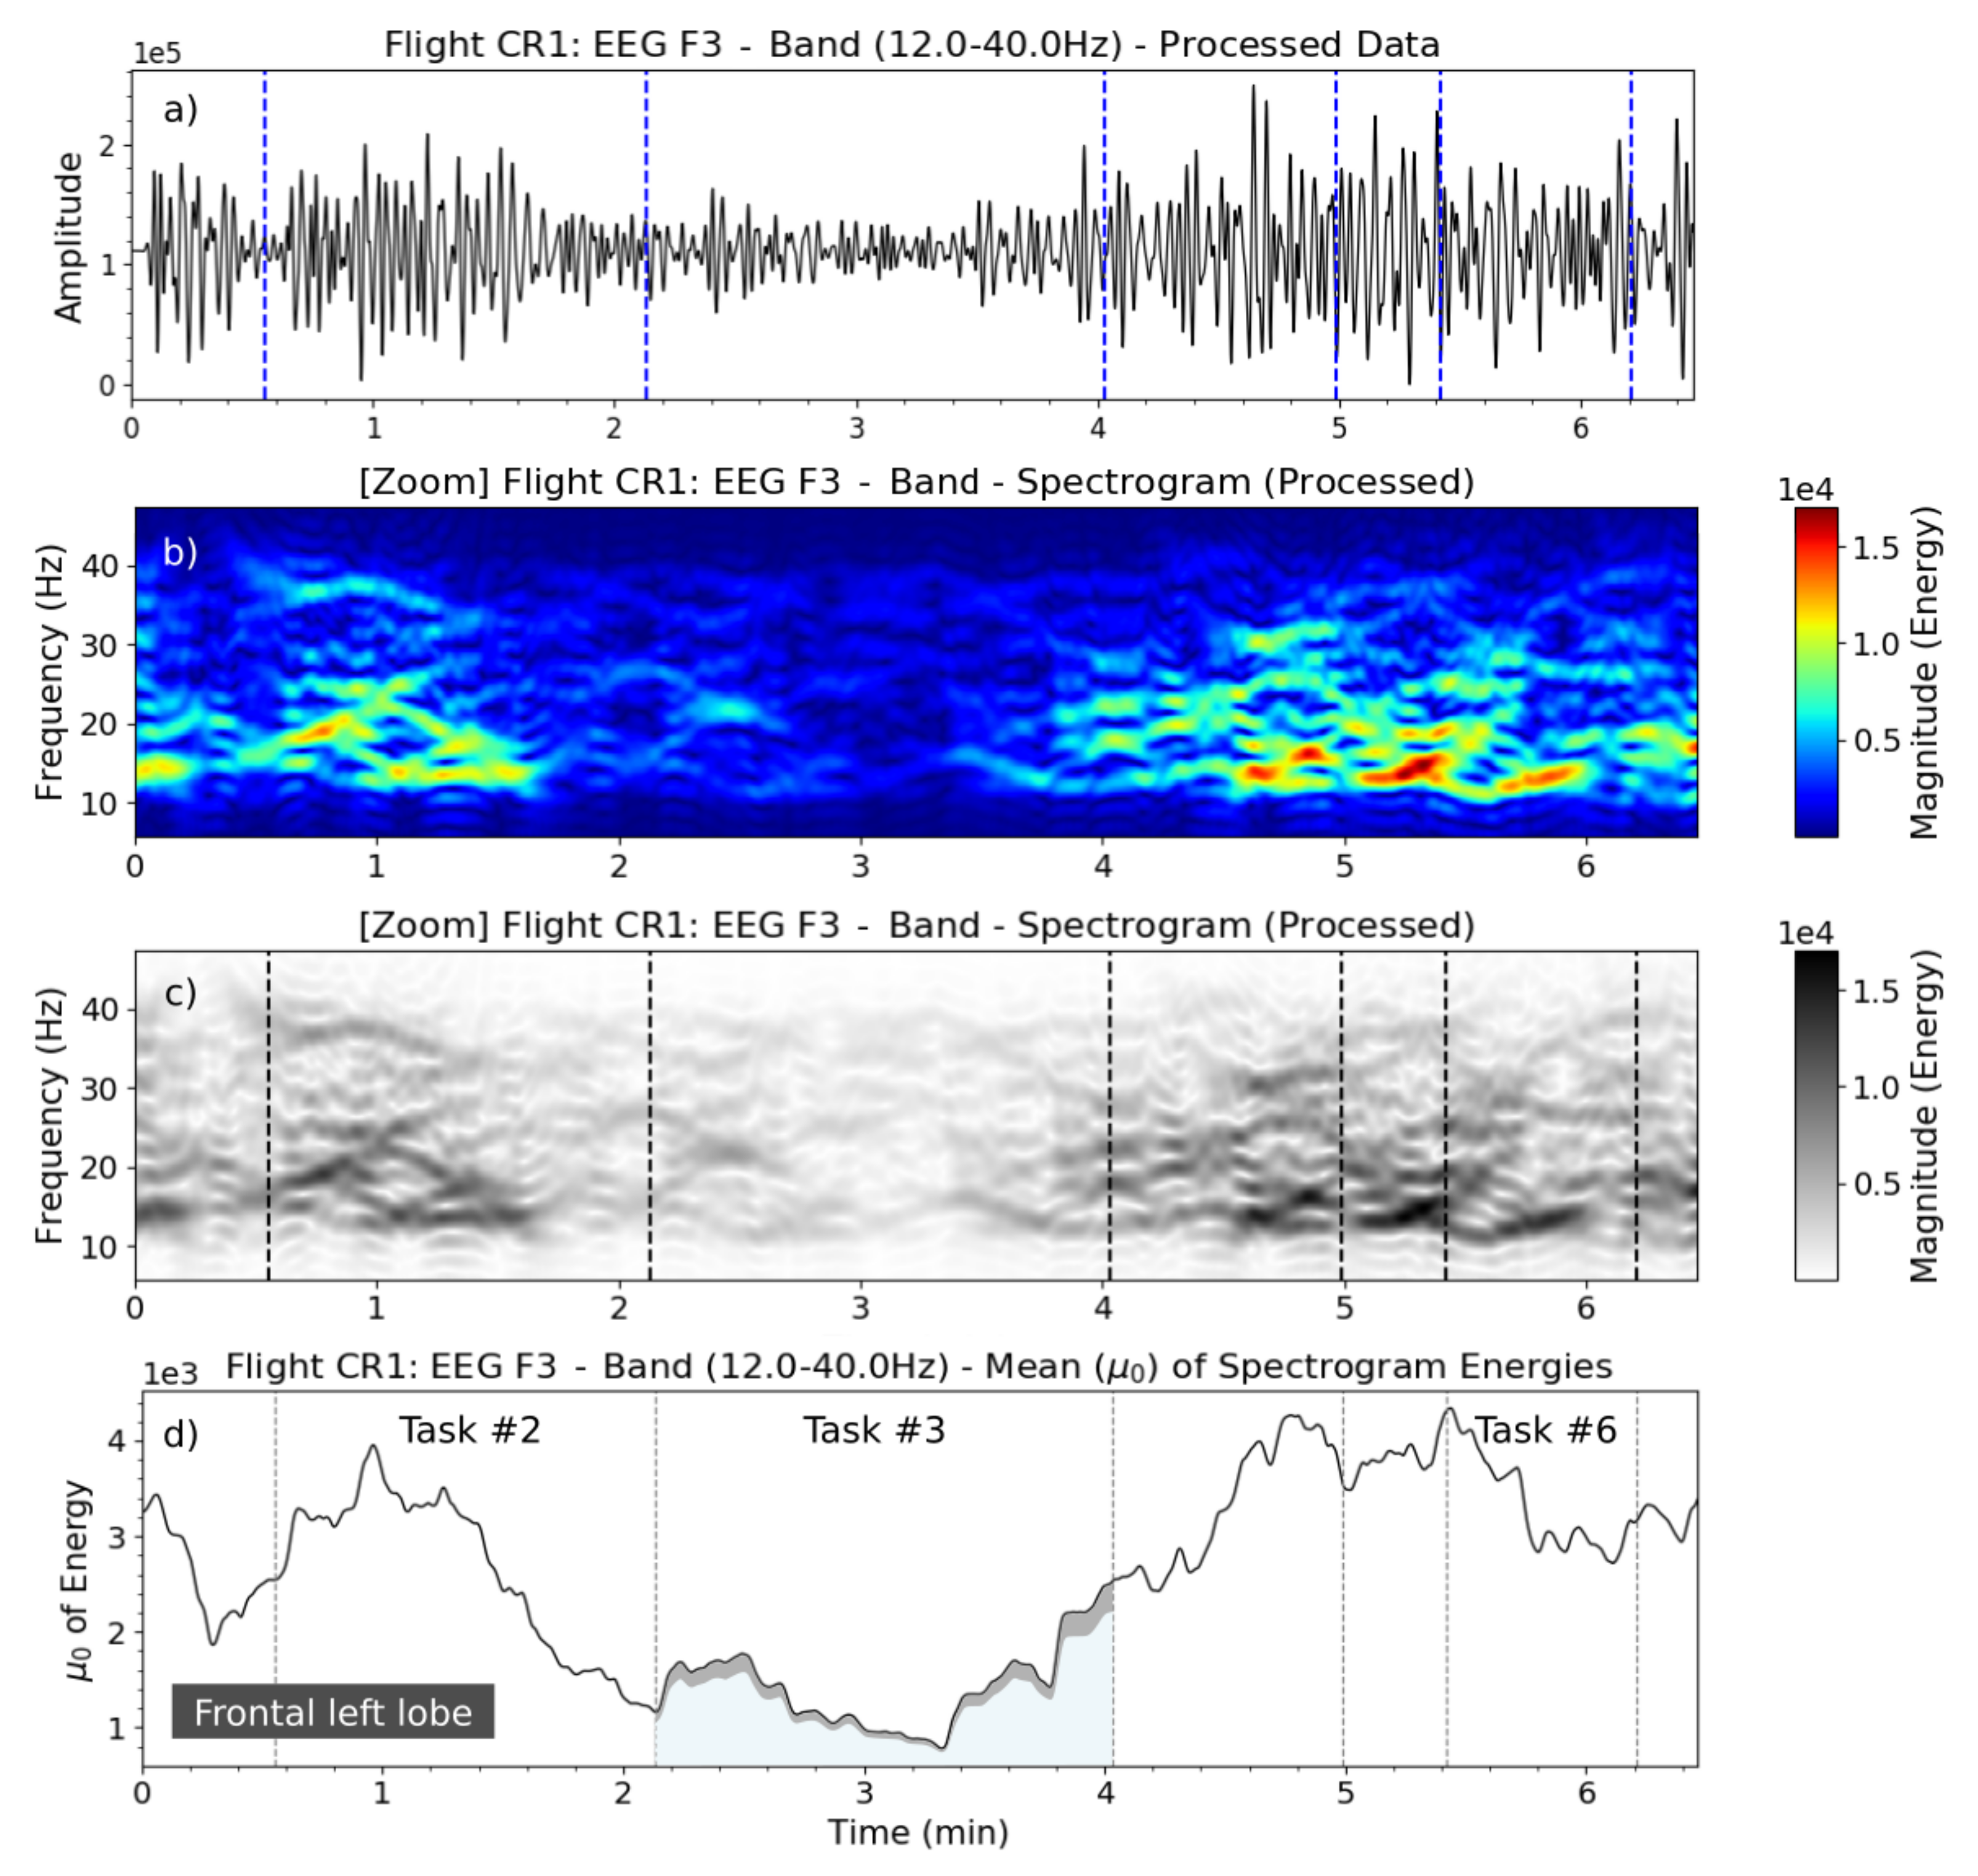
Another situation of low brain activity during some flight tasks can be found in the recorded data of the flight CR1 (frontal left lobe-F3) (Figure 11).
This diagram shows clearly the lower levels of magnitude (mainly between 12 and 30 Hz) just after takeoff (task 1) and during the cruise flight (task 3). The highest brain magnitudes were produced during the critical flight situations, i.e., takeoff, approach and landing. In fact, different patterns of magnitudes were acquired on the same tasks of both flights, RC1 and CR1. The probable reason for such differences are explained in Section 3.3.2.
3.3.1. Situations of Imminent Accident or Loss of Control
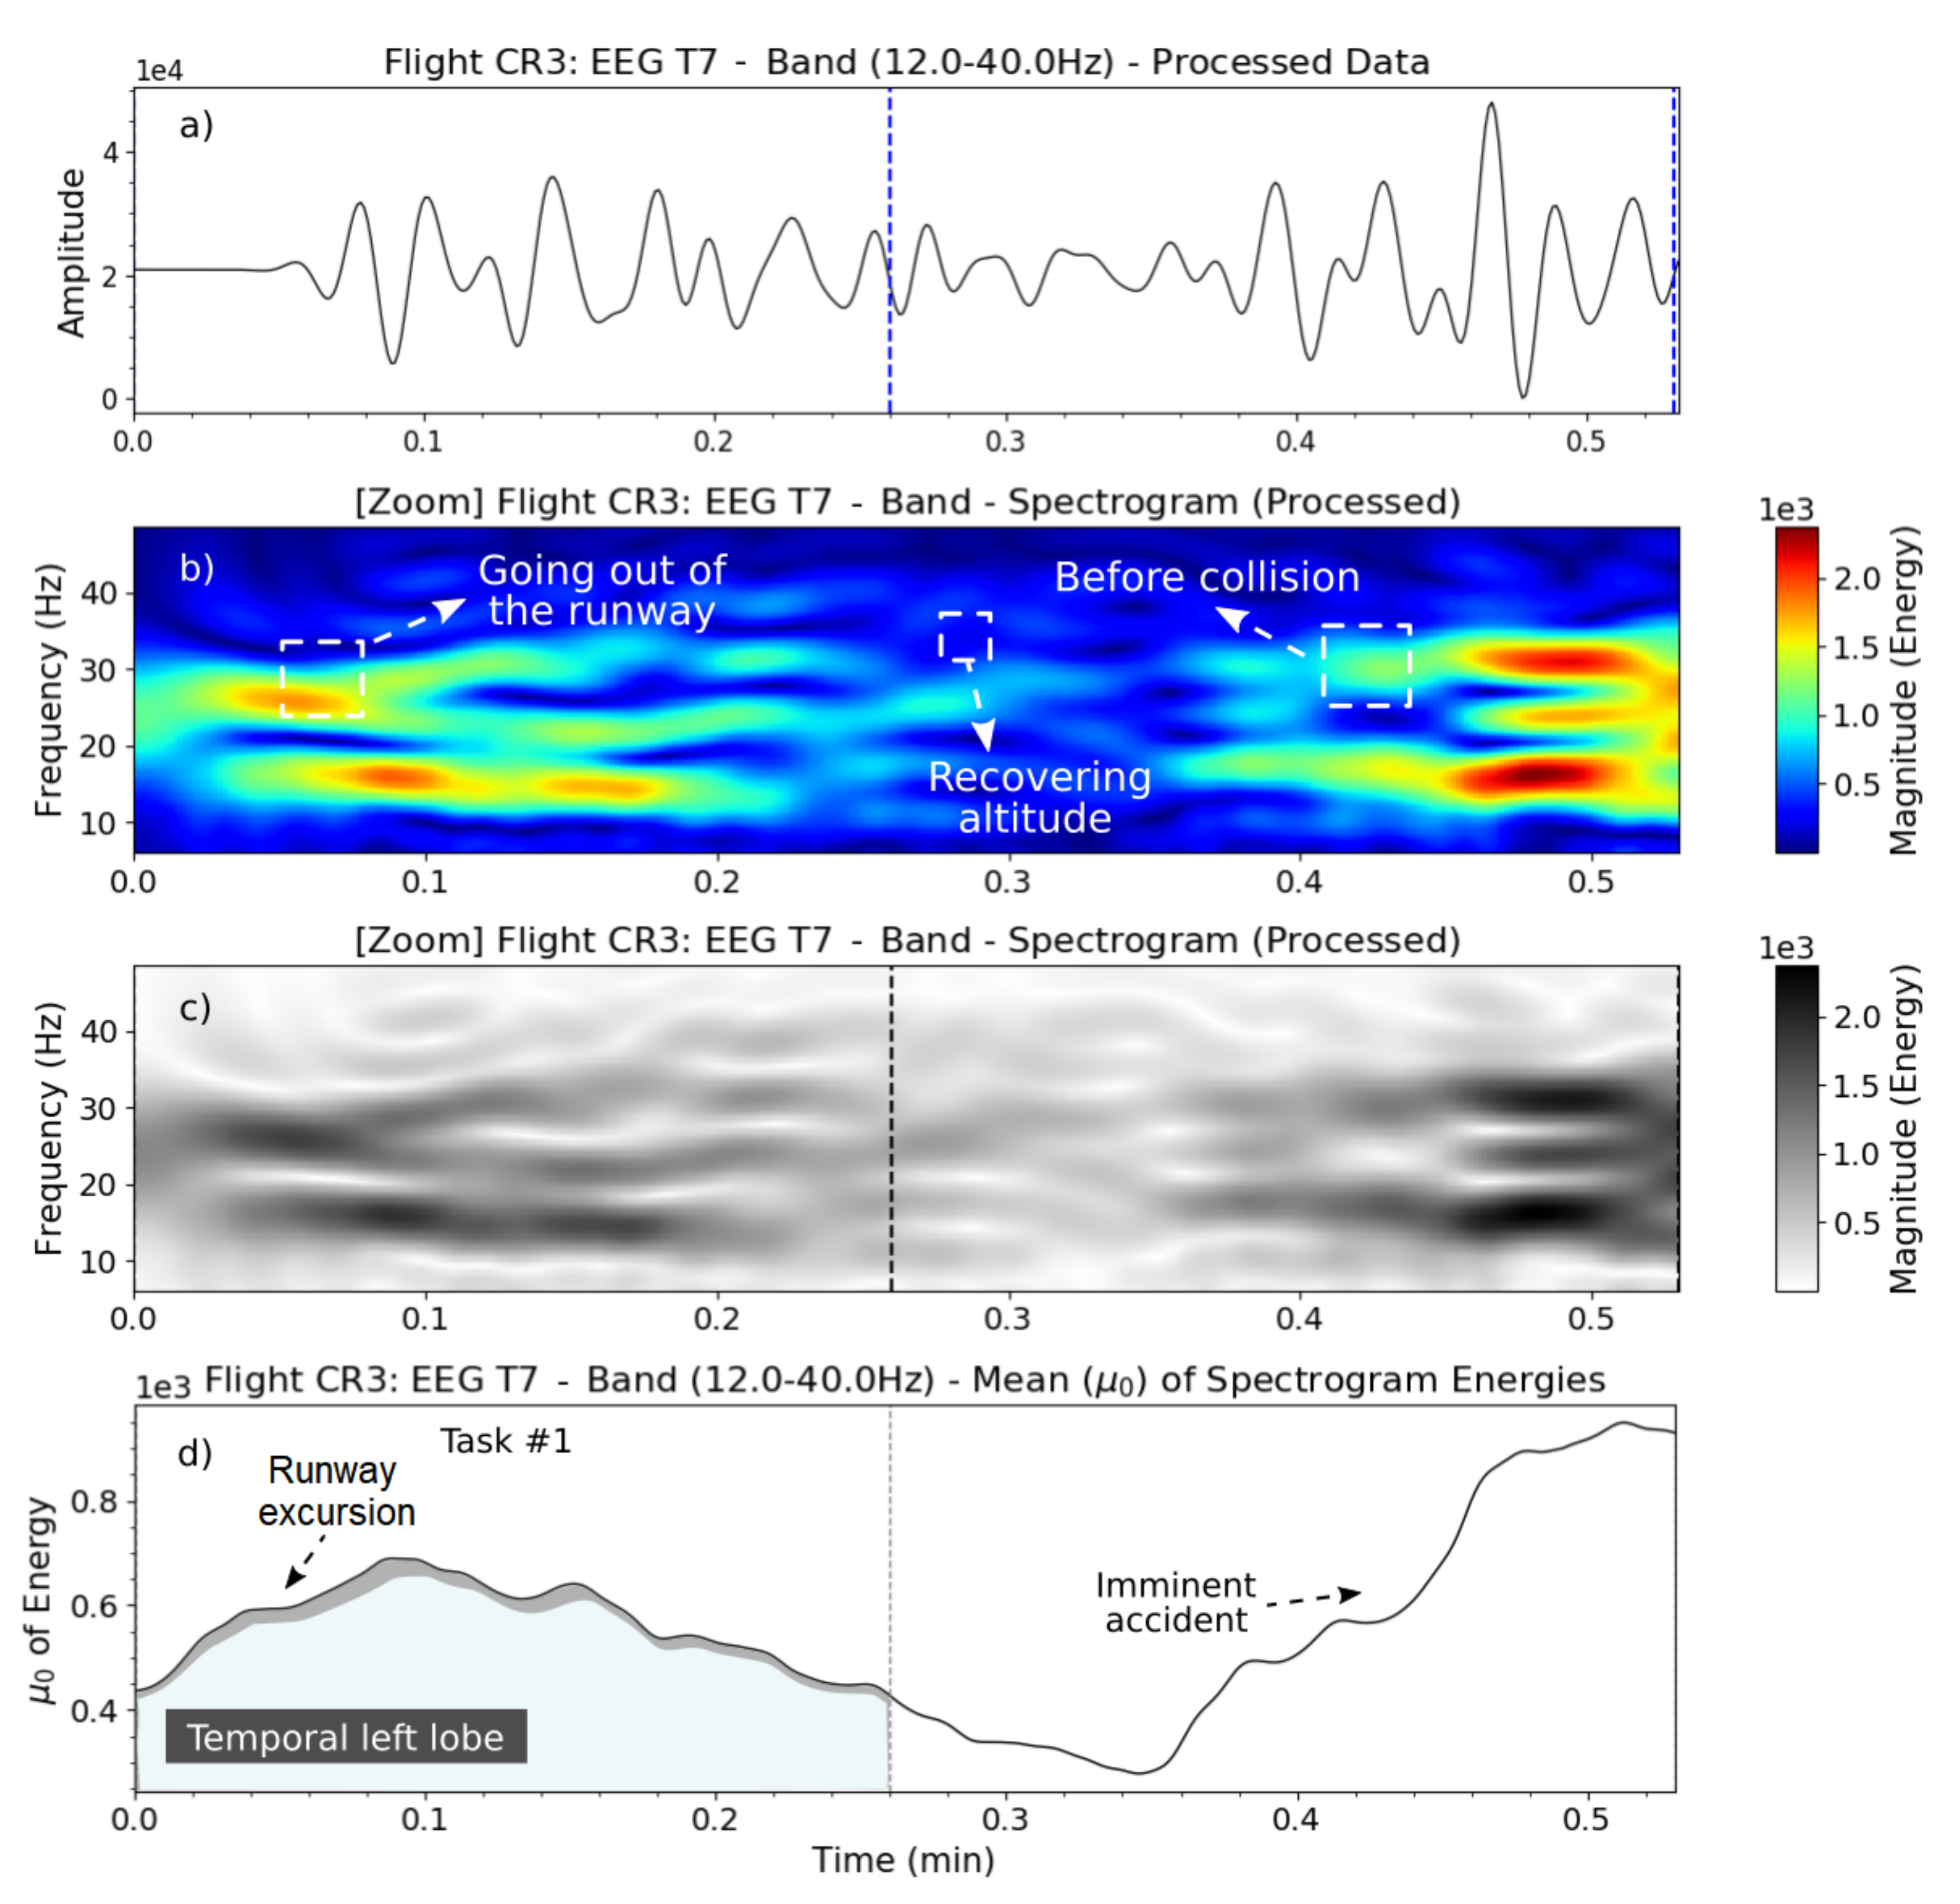
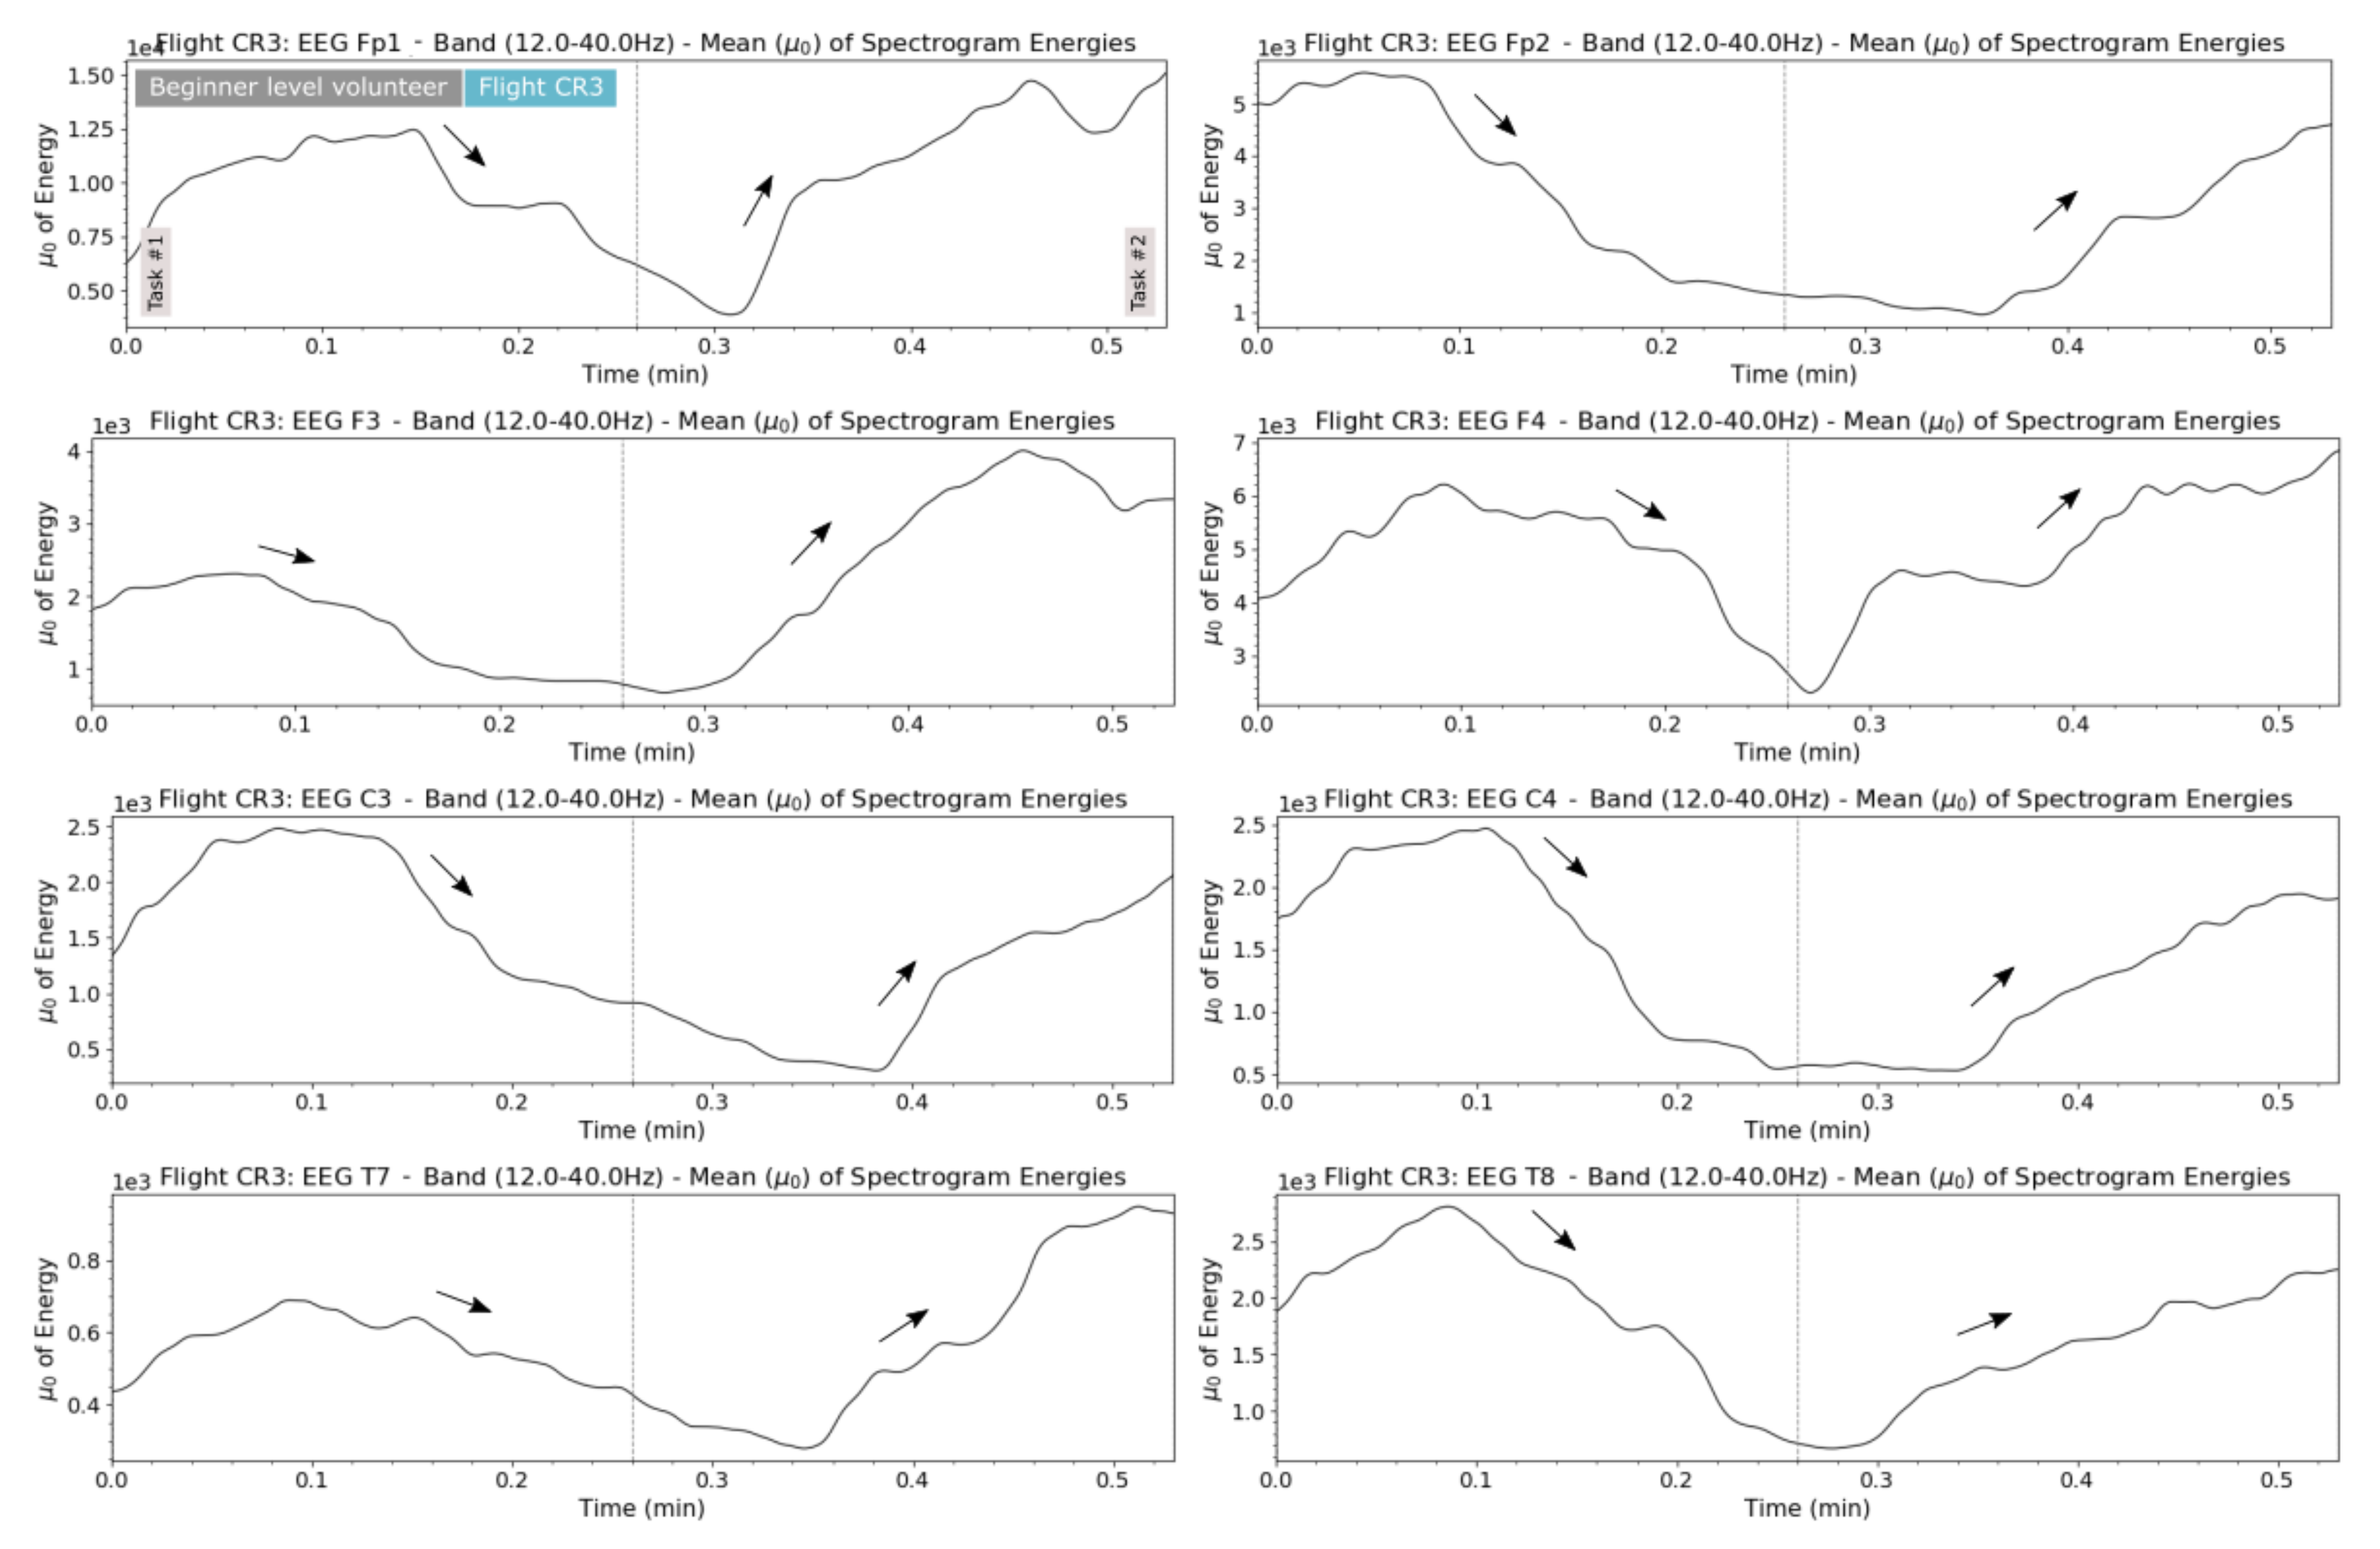
When the volunteers felt totally not confident about executing the tasks and/or in a situation close to an accident occurring, it was possible to see a high brain activities, as shown in Figure 12, with plots of the short flight experiment CR3, in which the volunteer lots the control of the airplane during the beginning of the climb (task 2), going off of the runway (runway excursion) and not reaching the ideal velocity for takeoff. For that reason, the airplane did not reached an ideal altitude and vertical speed, colliding with the ground a few seconds later.
Regarding to the temporal left lobe (channel T7), the spectrogram of this flight clearly shows the brain activity just after the volunteer lost the aircraft controls and before the collision, with some trees over the airport area. For almost 8 s, the volunteer thought to get the airplane’s controls again; probably for this reason, we can see a short period of lower brain magnitudes at the middle of the spectrogram (Figure 12b–d). Unfortunately, the accident occurred just few seconds after.
The same patterns of brain activities were also identified in other volunteers data; however, such a brain response depends on how the volunteer reacts when facing some flight phases. These experiments show that, when the volunteers have more experience with virtual simulation or even aviation, their brain activities presented a more normalized average of amplitudes during most of the flight. This is important information for carrying out further research.
From analyzing the recorded video of the flight CR3 to detail the accident events, it was possible to see that the volunteer pushed the joystick back (i.e., takeoff command) at 40 knots (20.57 m/s), instead of the recommended takeoff velocity of 80 knots (flight experiment’s checklist). After that, the aircraft started to climb slowly for almost 8 s (period of lower brain activity—fake sensation of the correct fight procedure) and suddenly experienced a stall situation, colliding with the ground at 21 s. Then, the aircraft dragged on the ground, until it collided with some obstacles at 32 s (this was the second scared moment reported by the volunteer).
3.3.2. Volunteer’s Expertise and Brain Activity
Considering a healthy volunteer, spectrogram analysis was used to show important information, e.g., to try to answer some questions like “how calm were the volunteers when facing some flight situations or moments?”, or “how was the volunteer’s biological reaction throughout the flight?”. The obtained data showed a direct relation between the volunteers’ expertise (or their confidence on flight simulation) and the observed amplitude and oscillation of their brain activity during the flight. The experiment also showed that more experienced and confident volunteers in the proposed flight tasks presented, in general, different patterns of brain activities compared to volunteers with less expertise or less familiarity with fight simulations and/or electronic games.
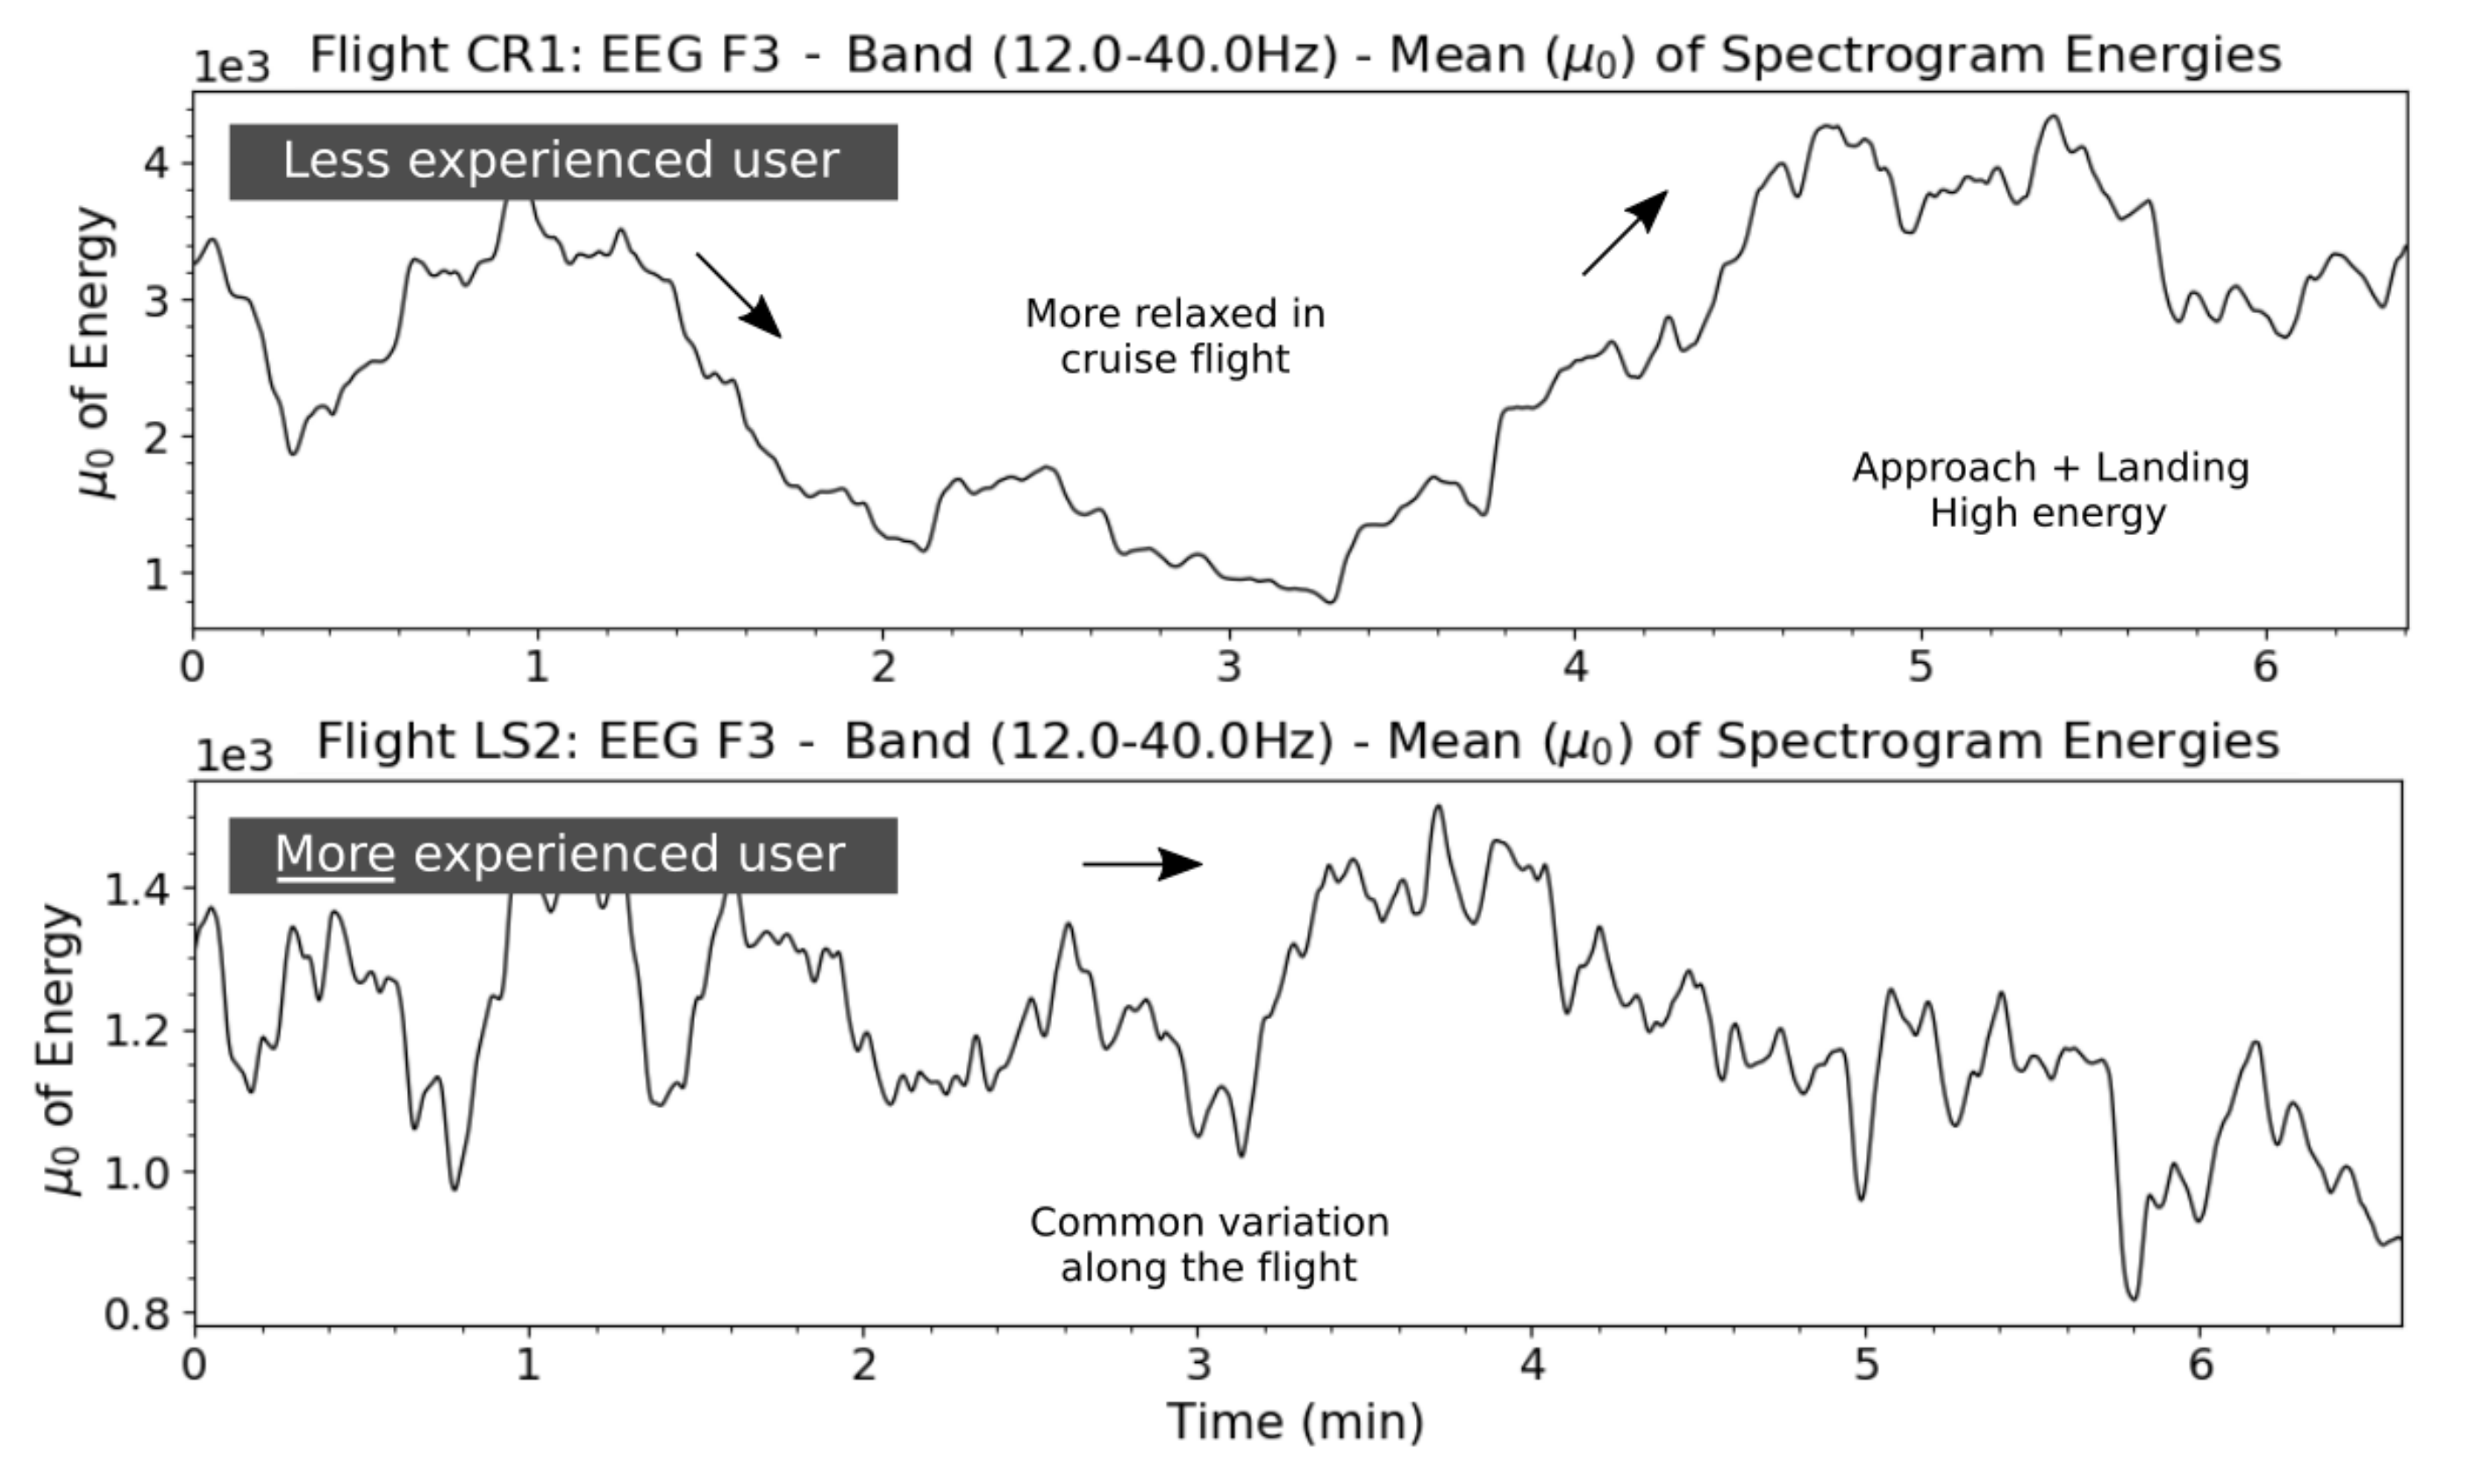
Figure 13, shows the -band activity acquired of the frontal lobe (channel F3) of two different volunteers: one volunteer feeling not confident about executing the proposed flight tasks and the other volunteer feeling more confident about executing the same tasks. The brain activities of the less experienced volunteer (top plot) changed more intensely during the more calm flight phases, reaching mean values close to units and a concave signal shape (e.g., in task 3). Regarding the more experienced and confident volunteers, it is possible to see that their brain activities presented lower intensities and less variability of magnitude according to each flight tasks; it also reached an average amplitude close to units, i.e., 68% less, compared to the first case. Such patterns were repeated for most flights and volunteers.
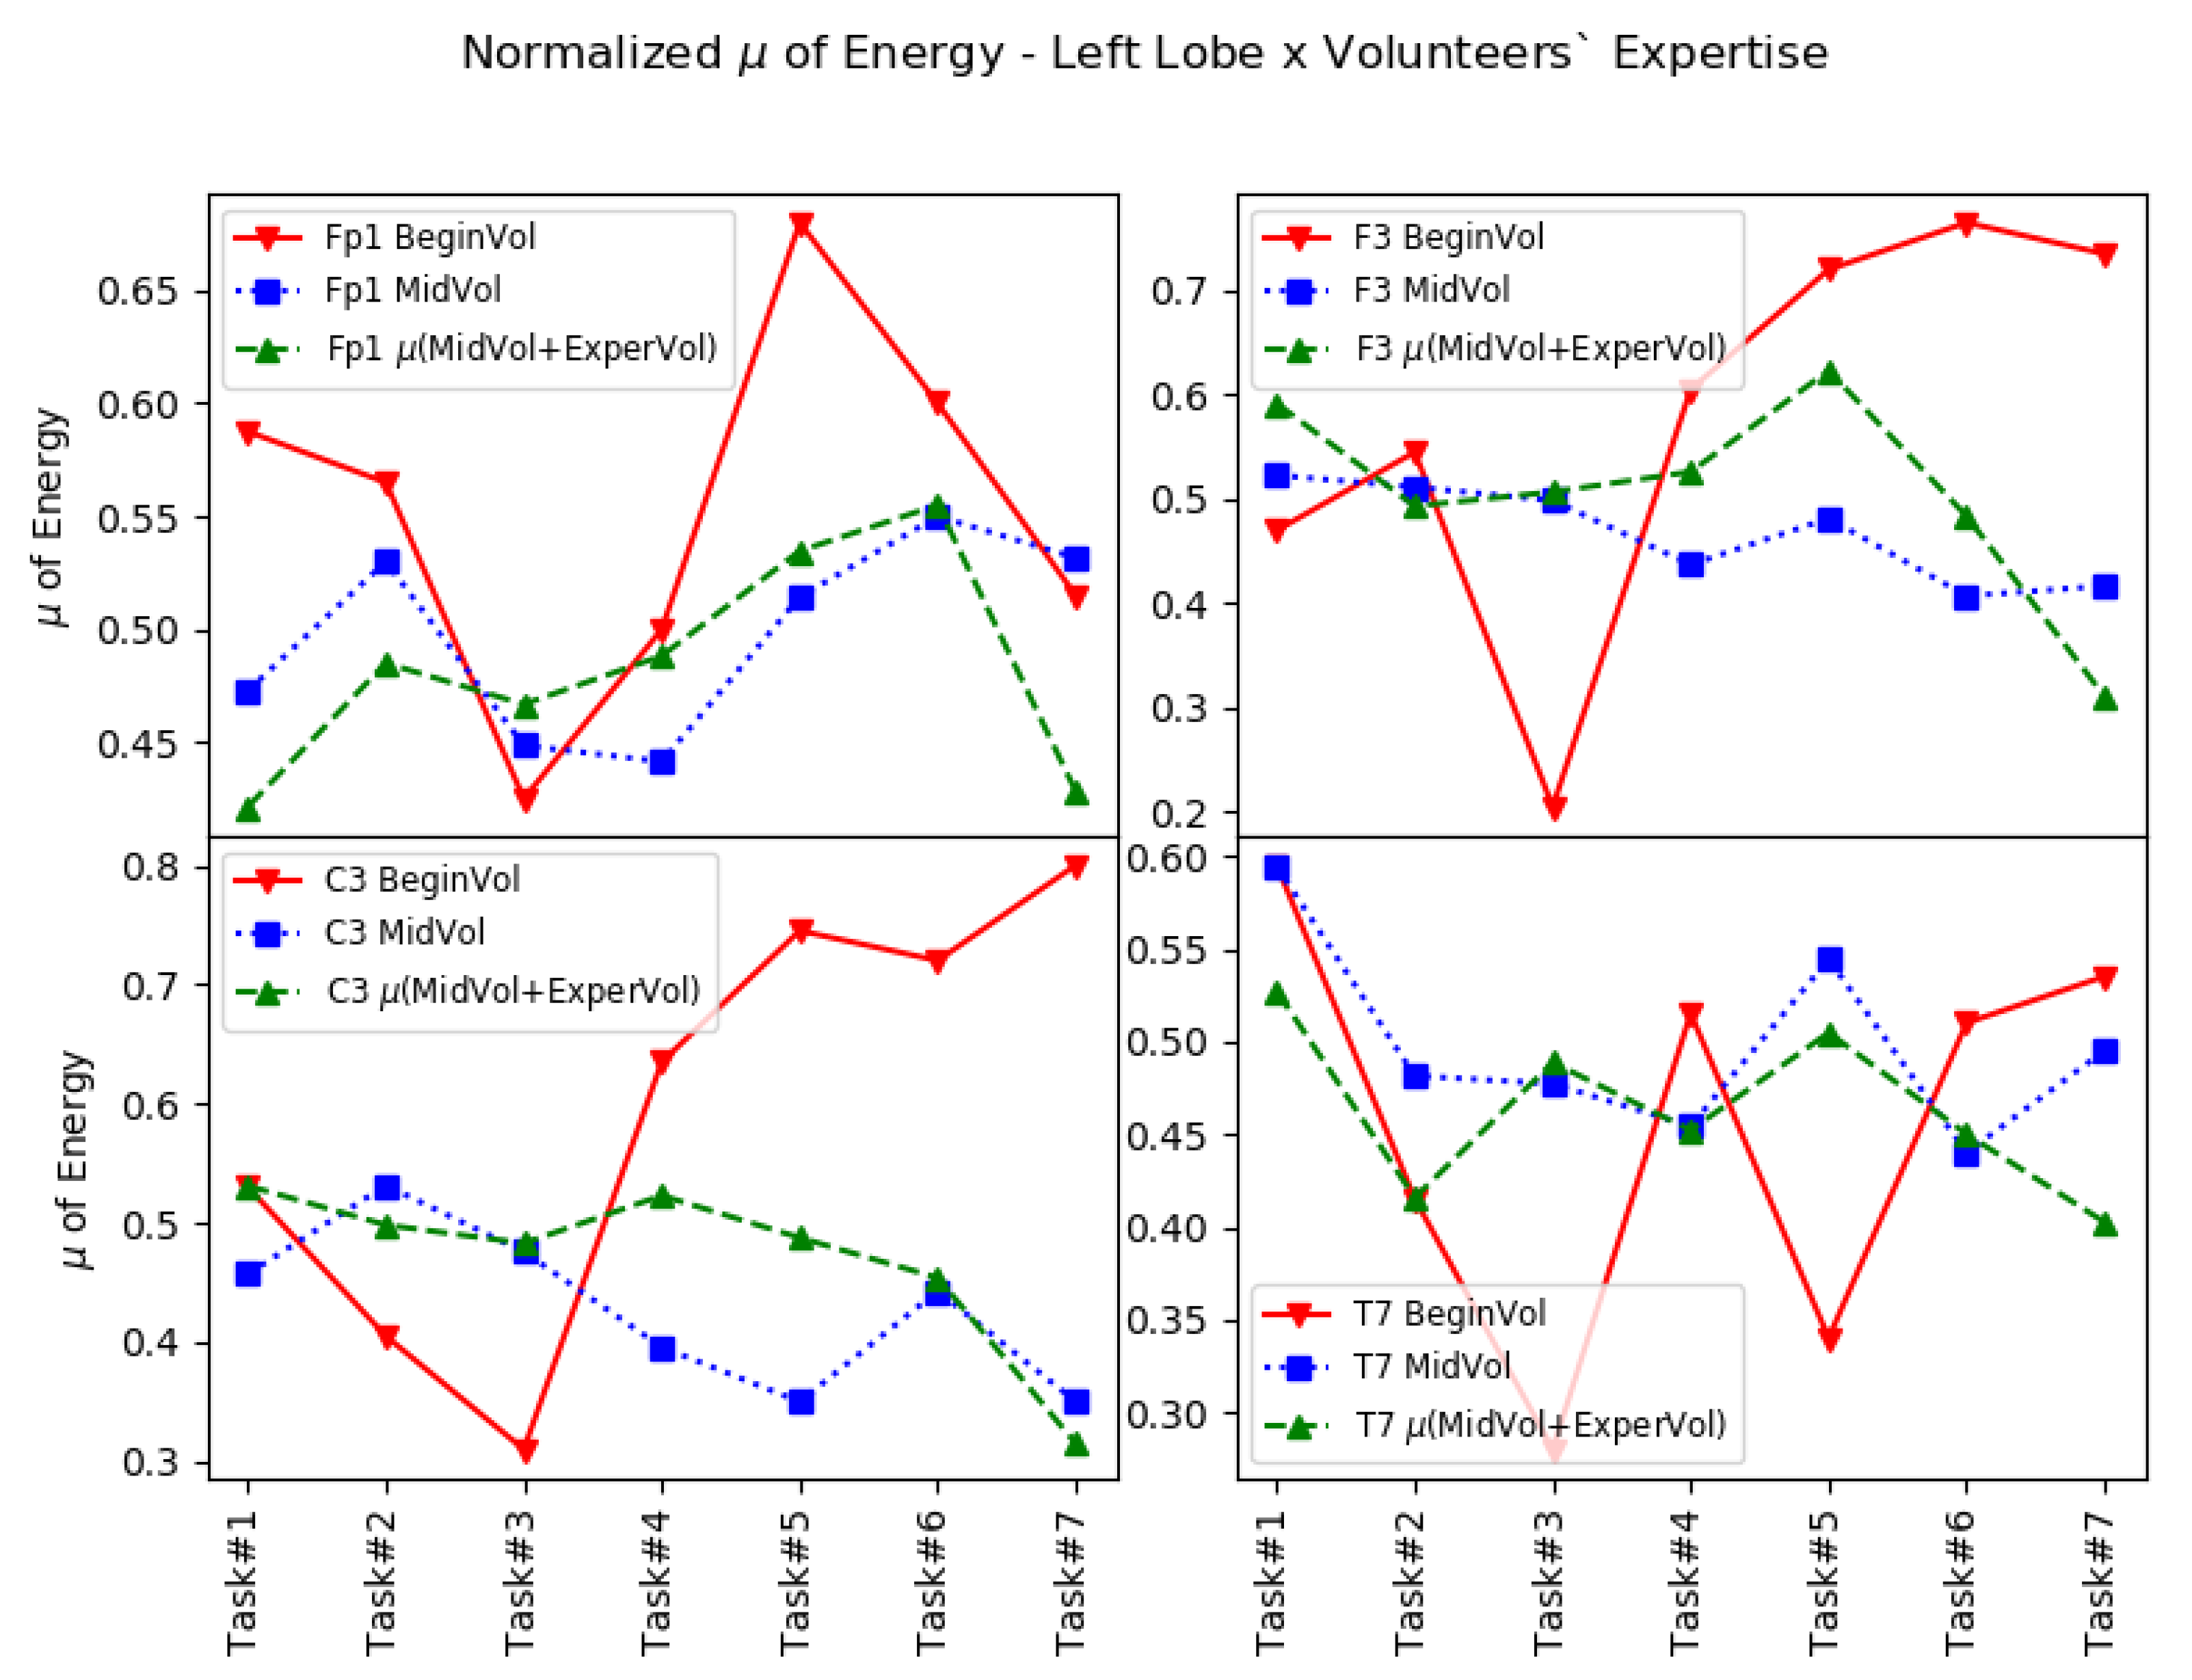
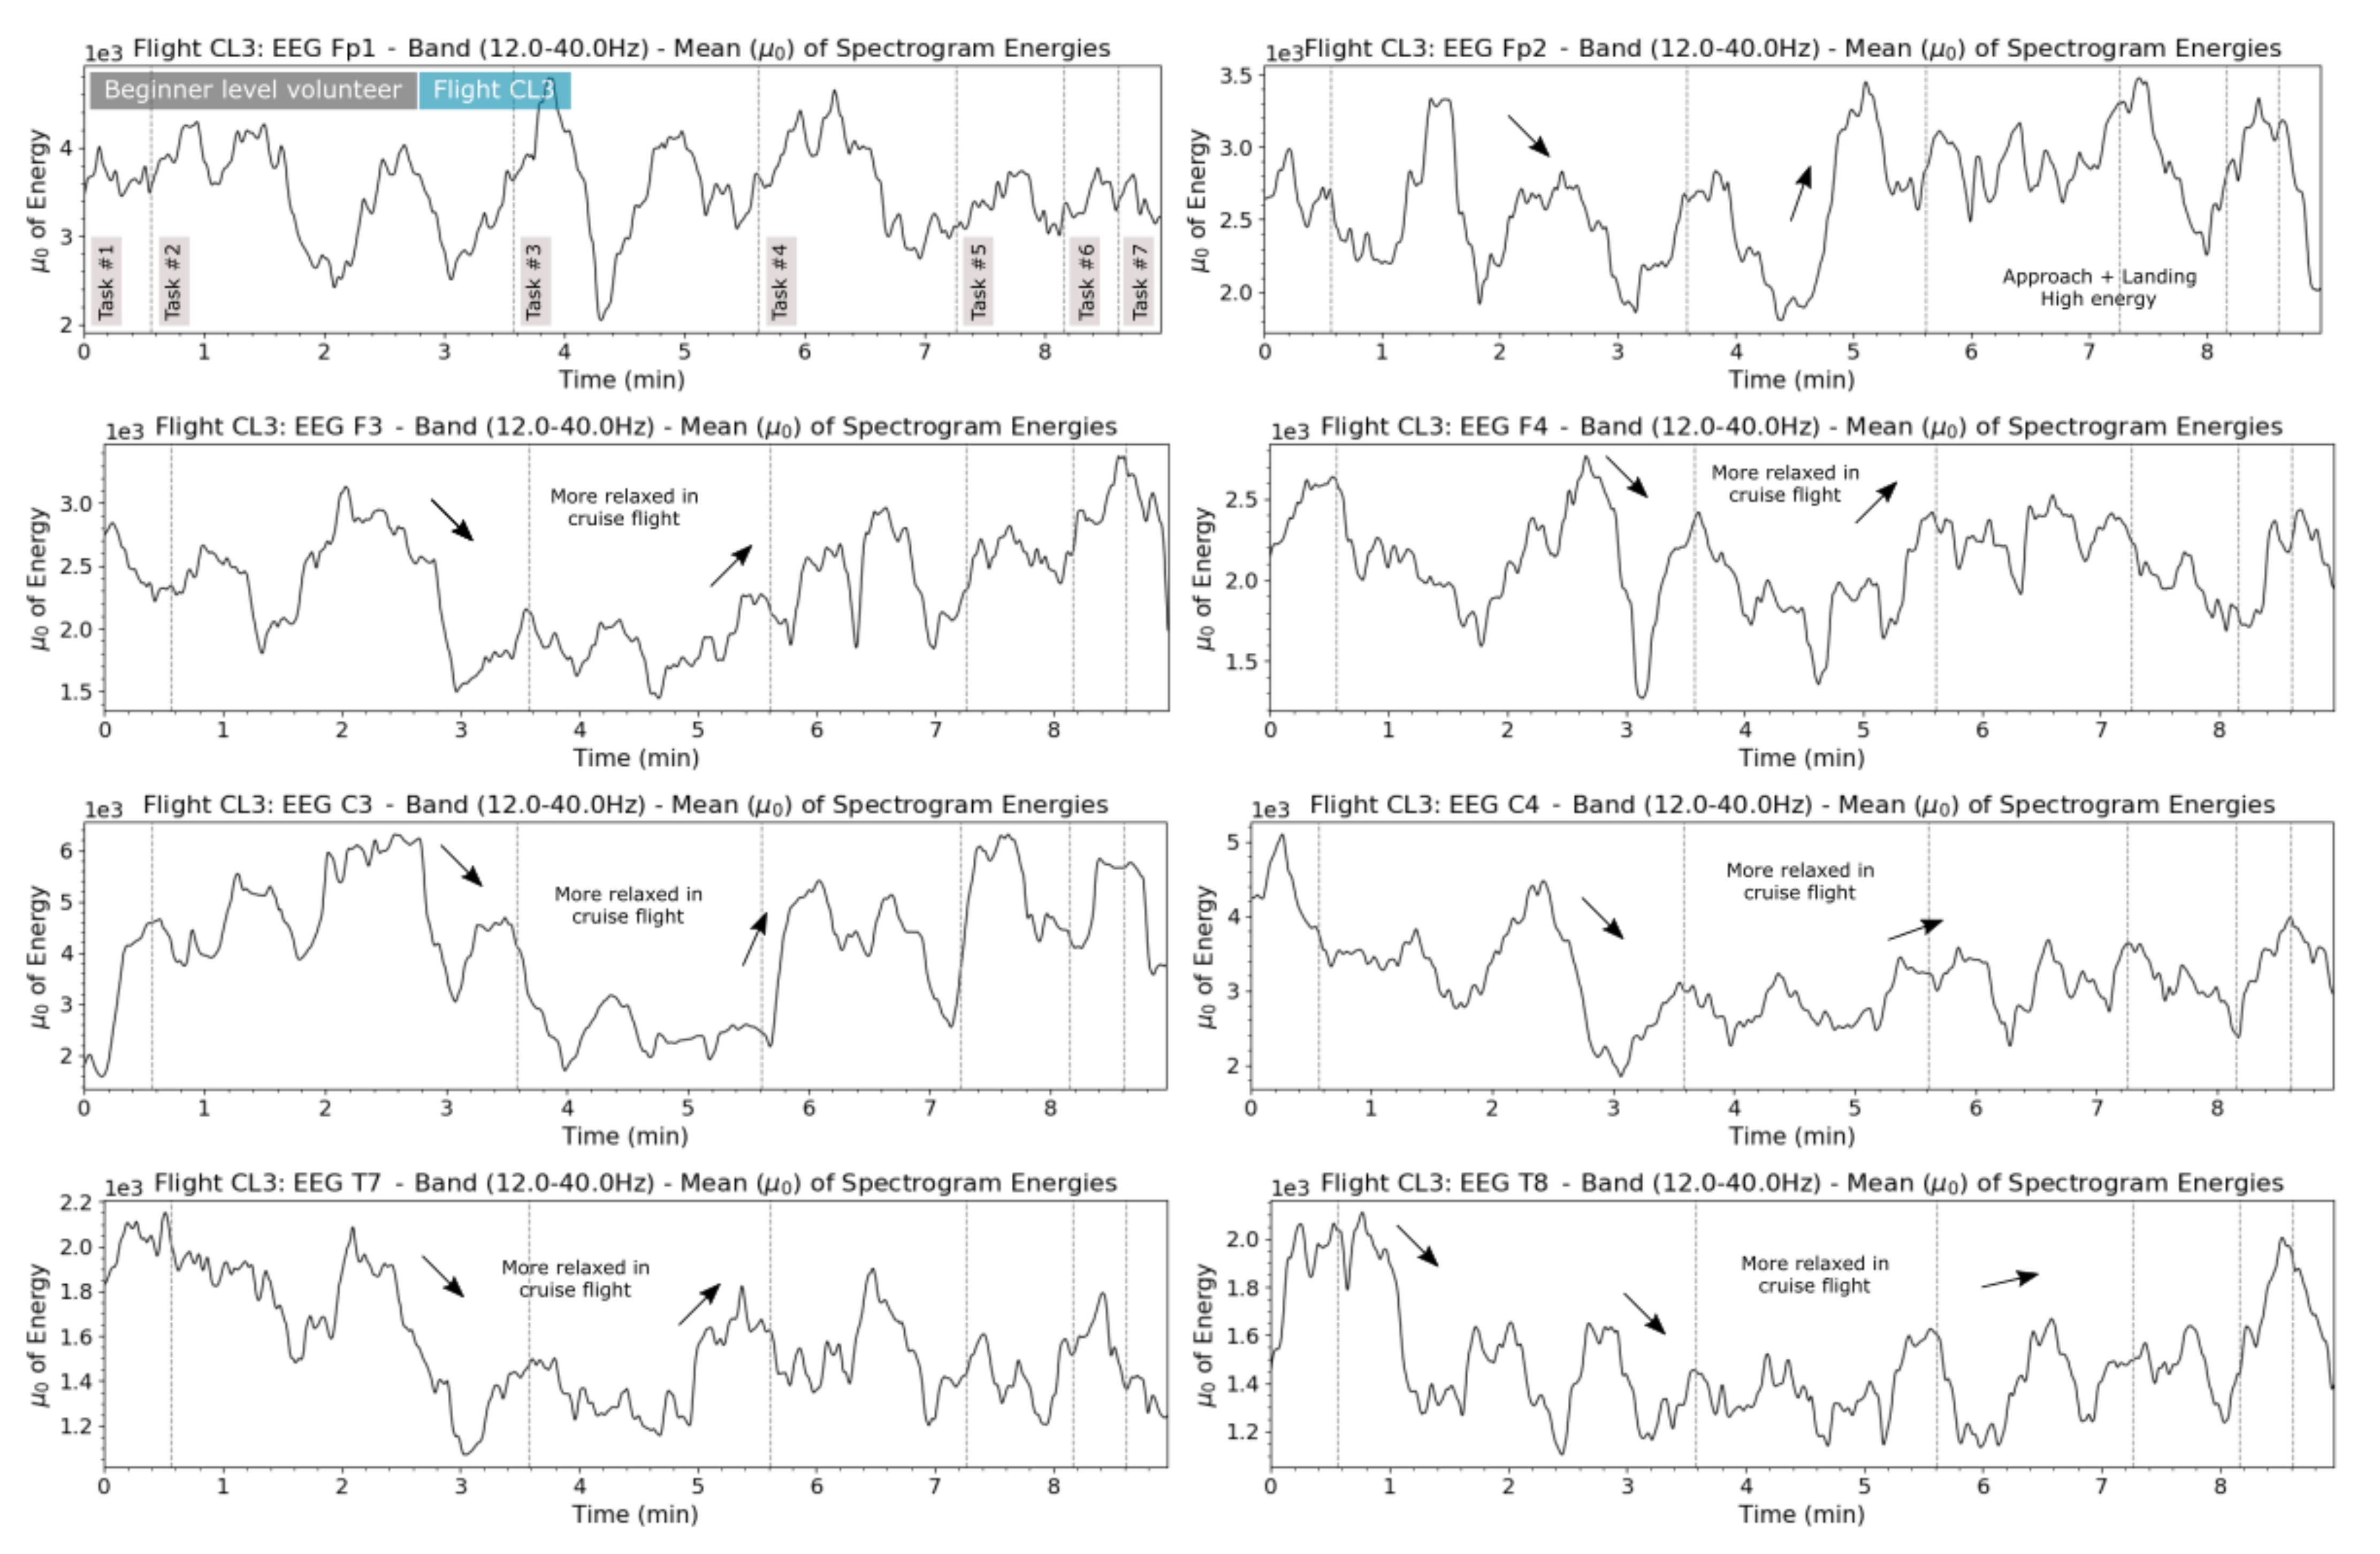
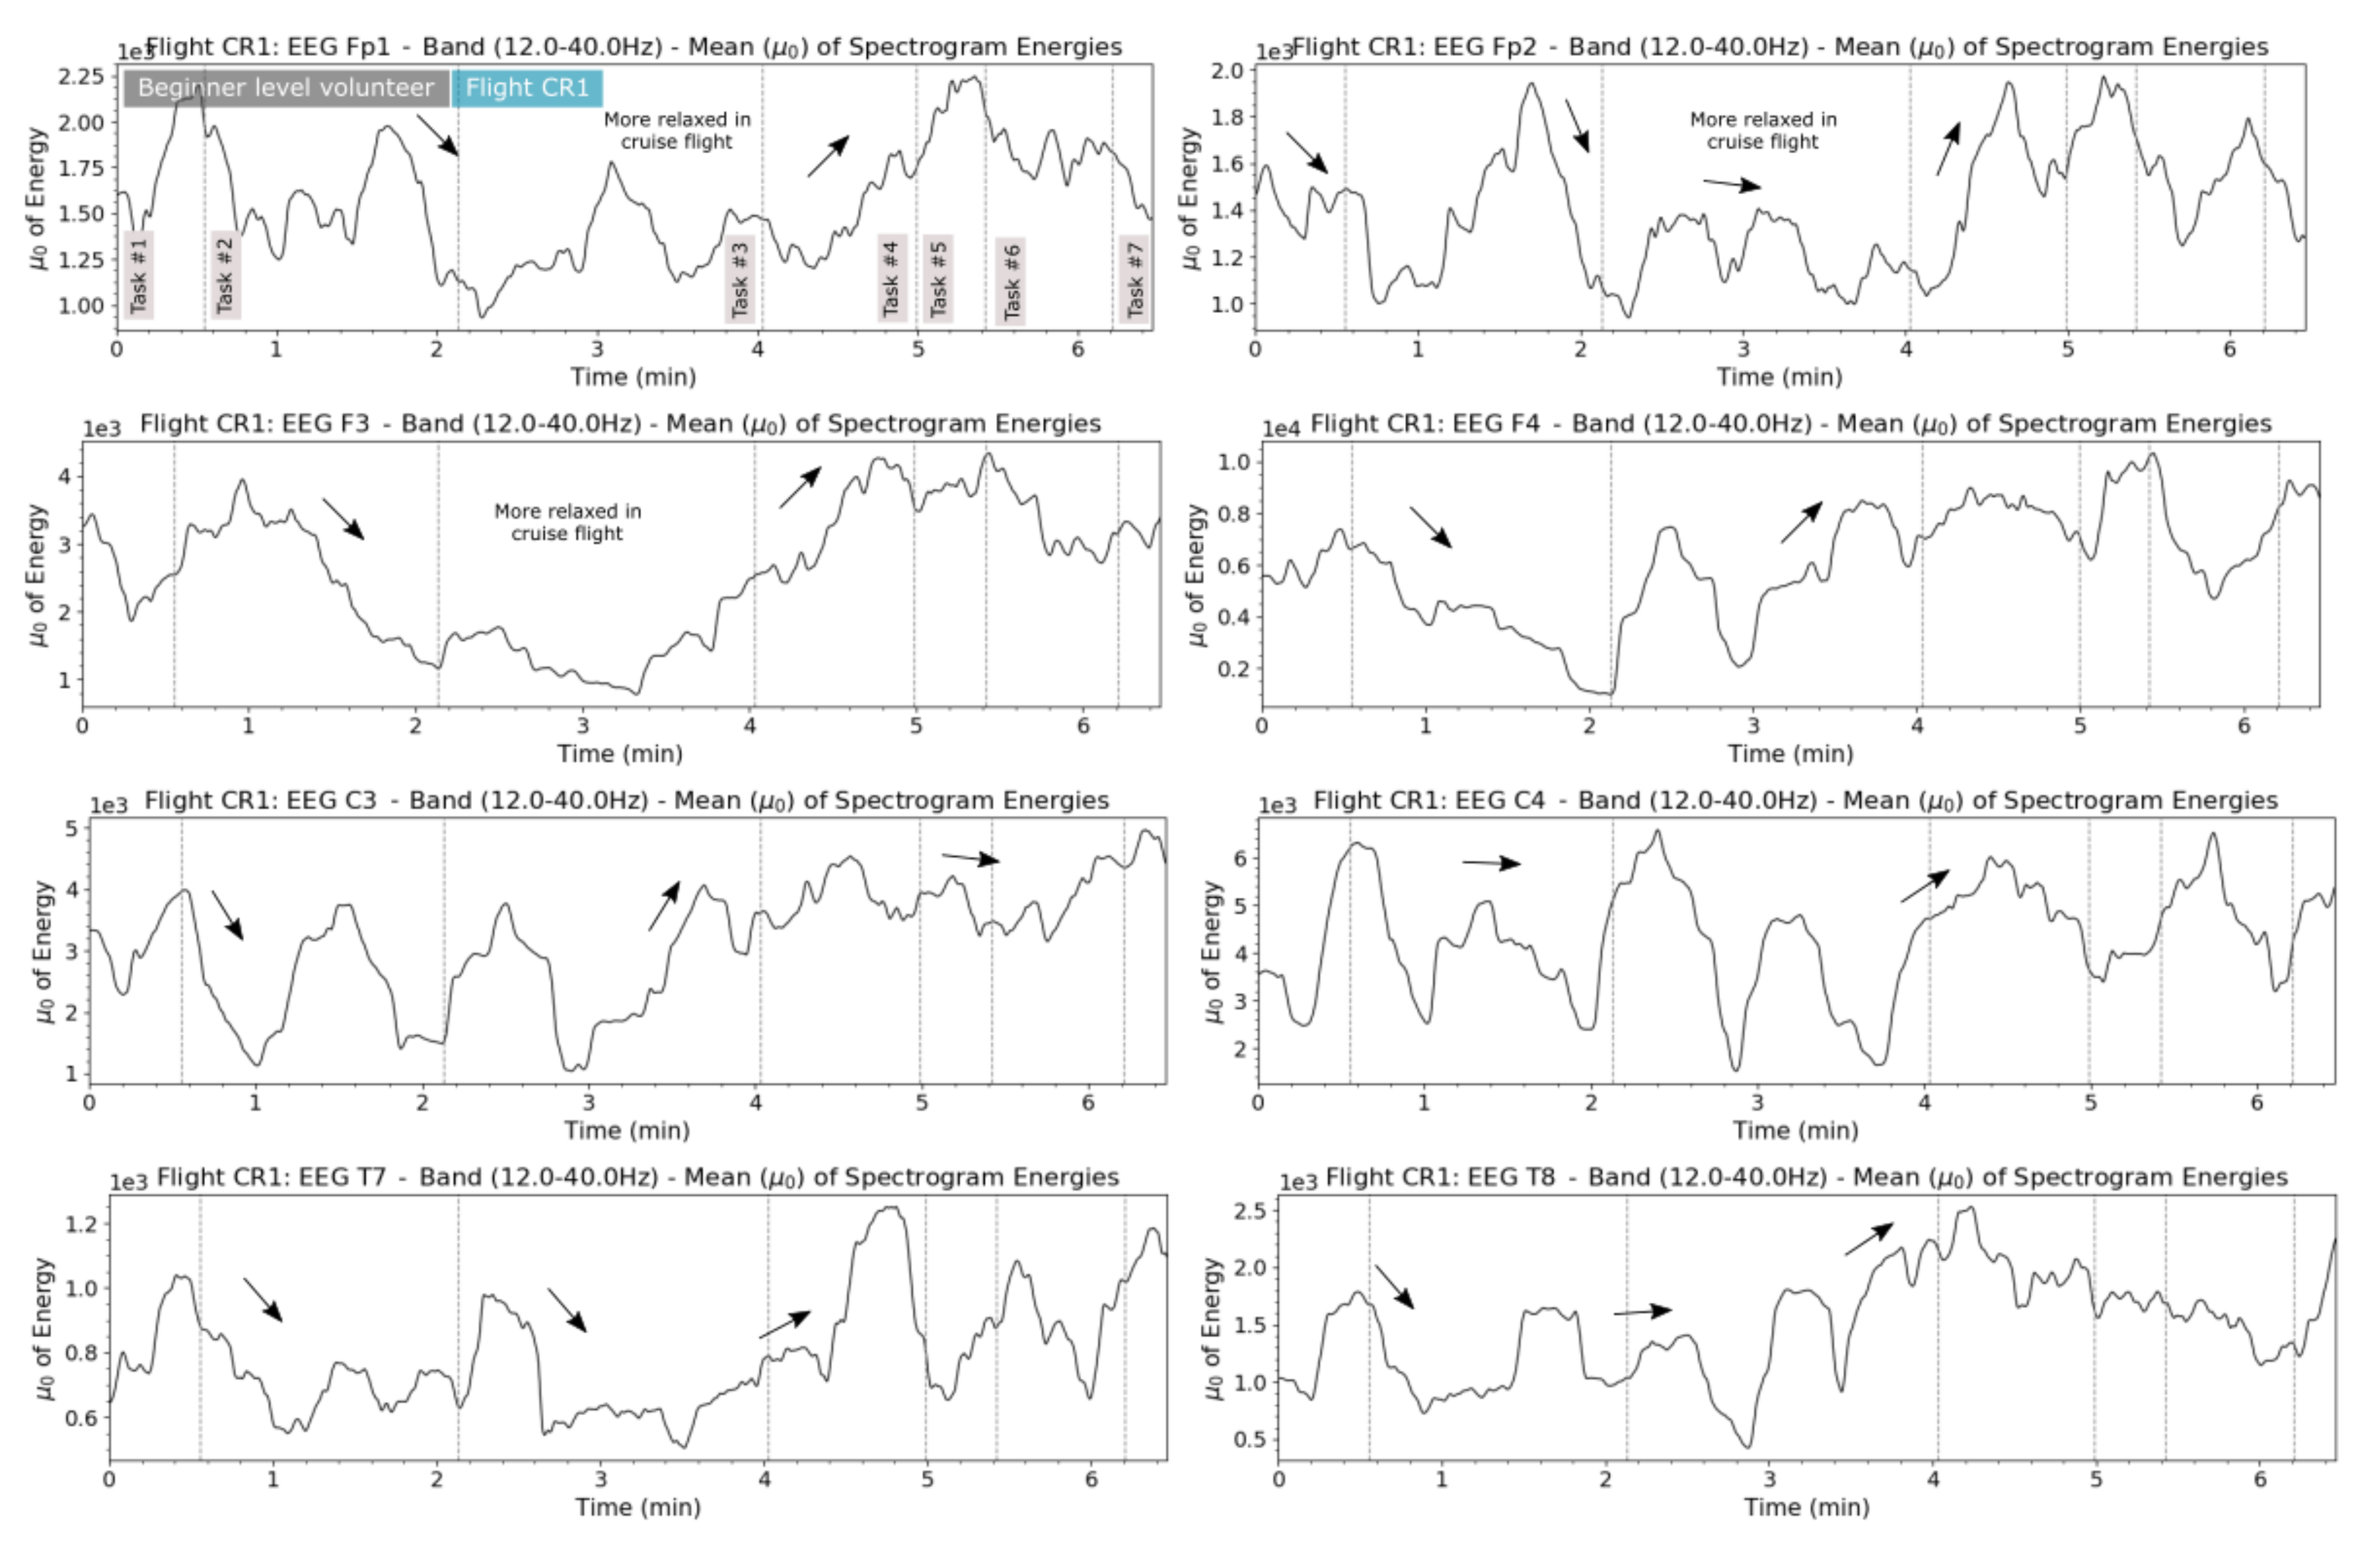
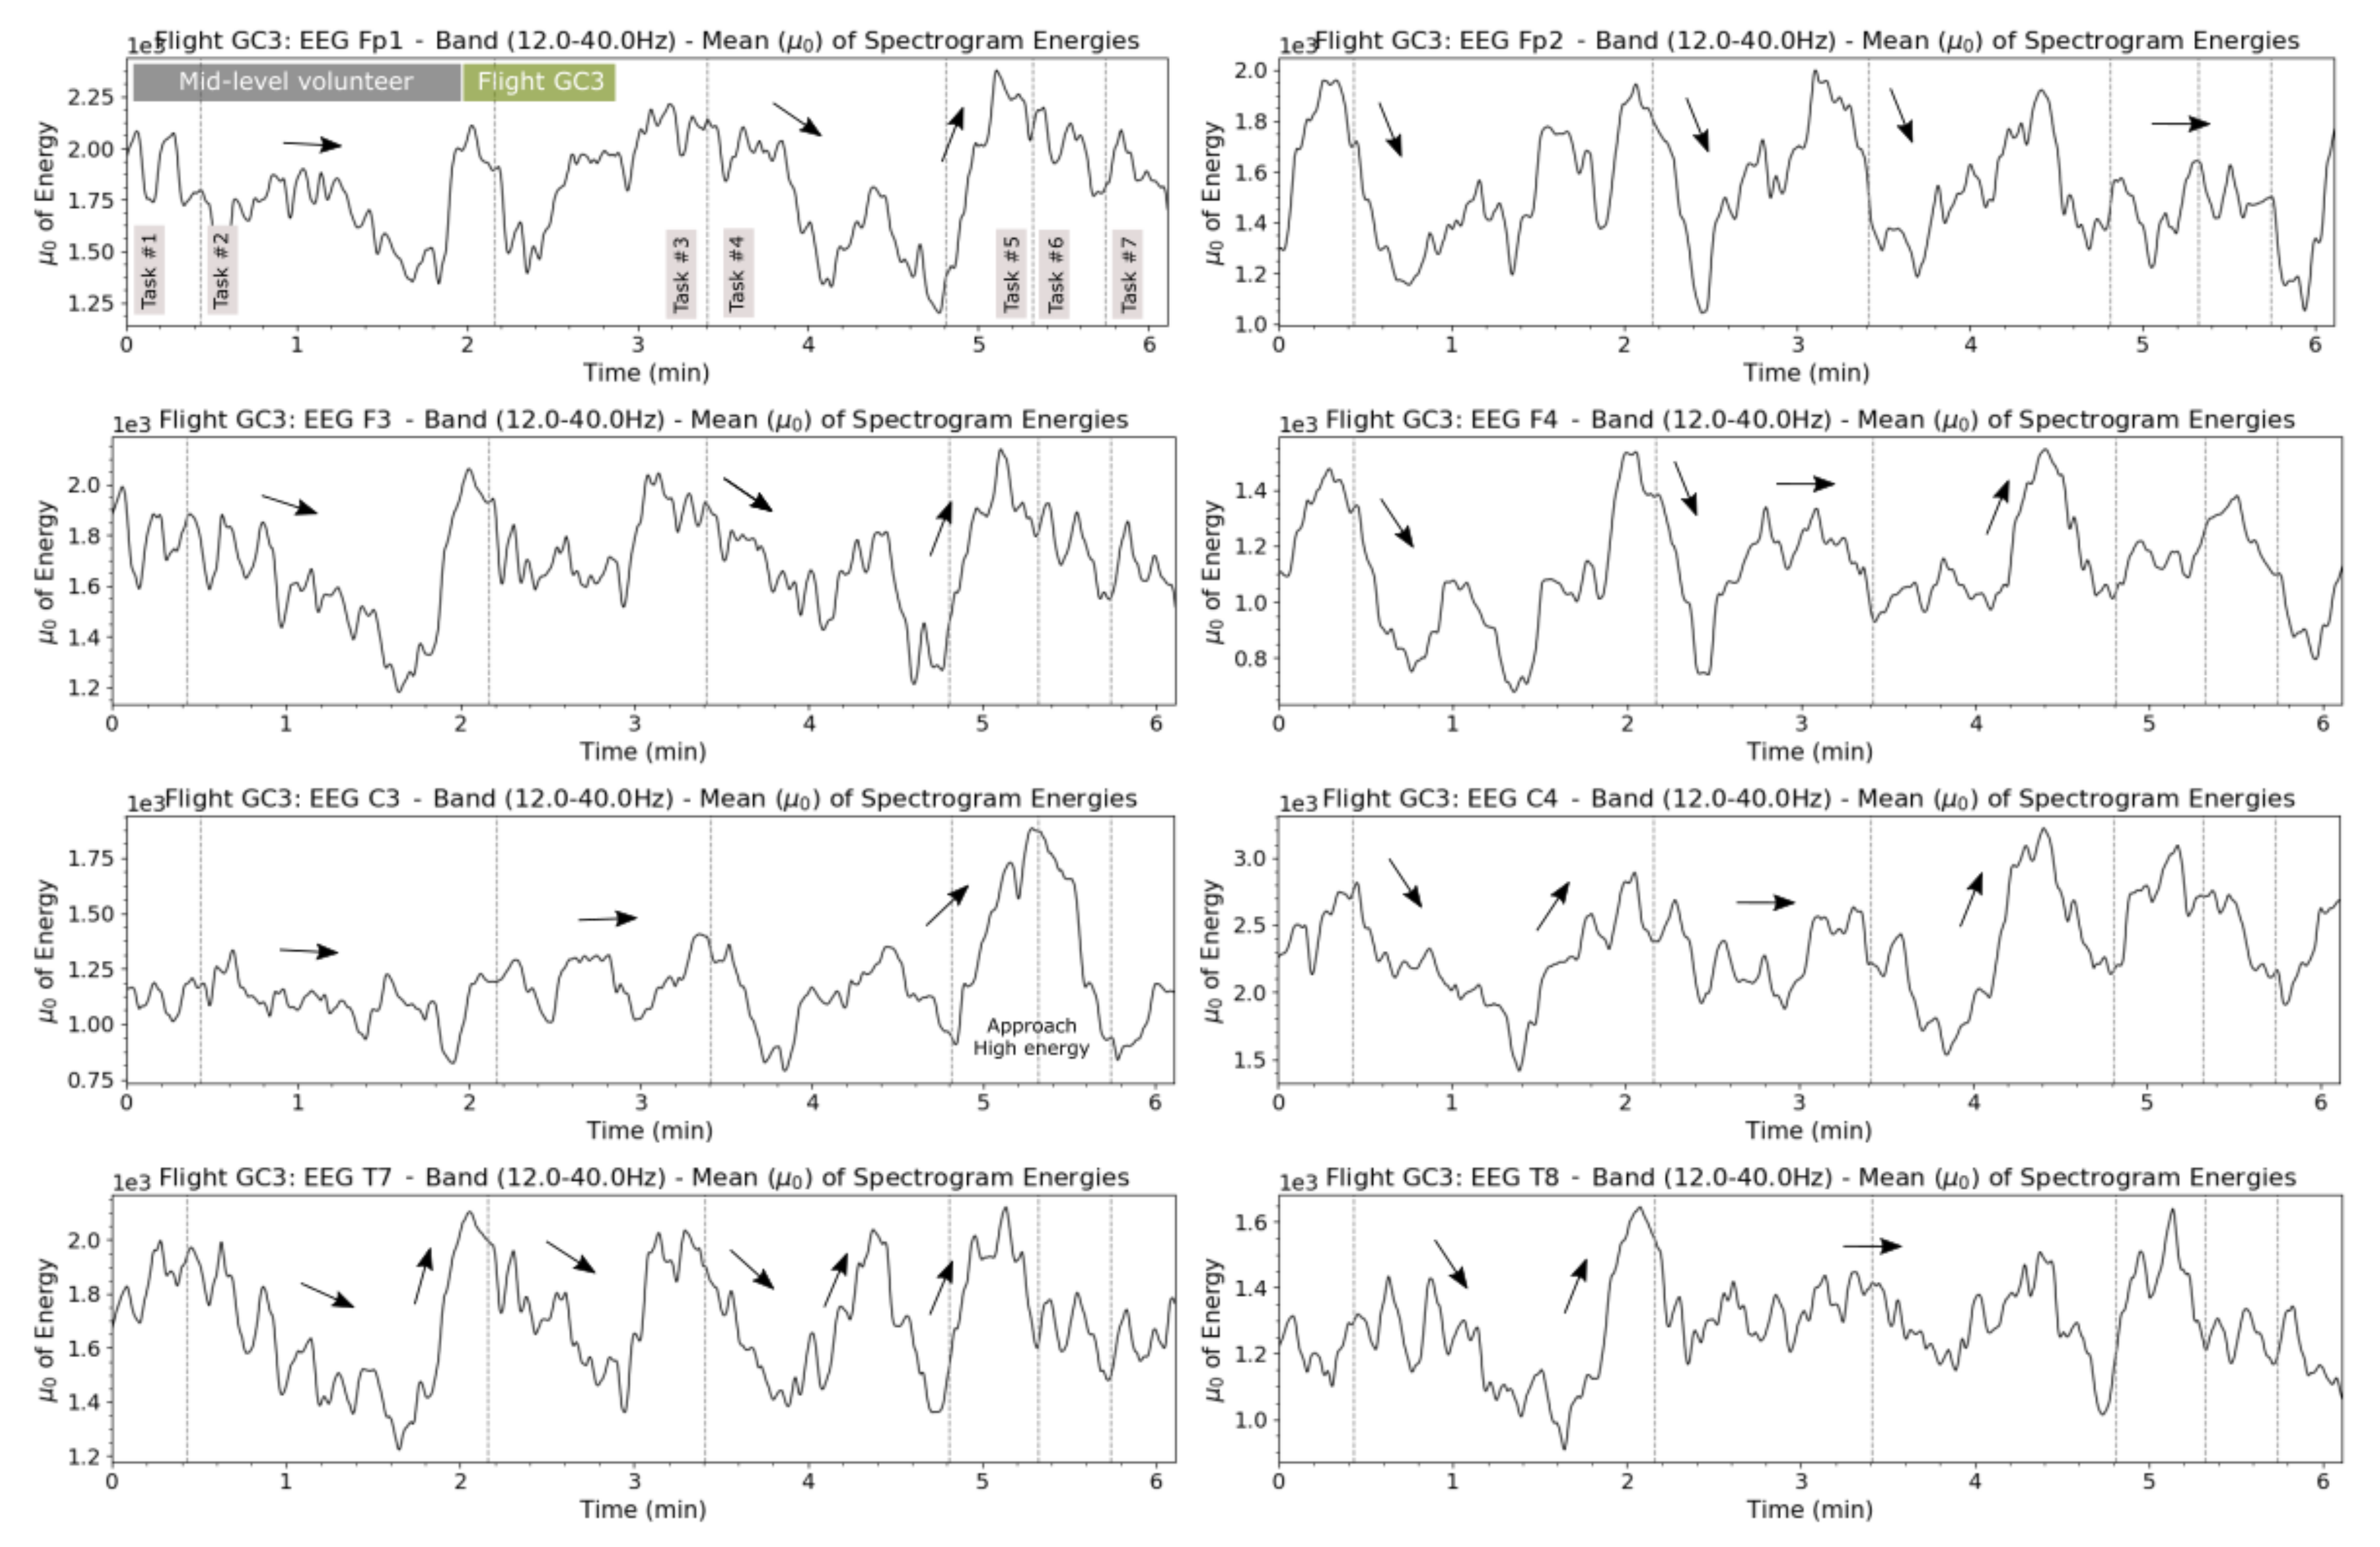
The normalized mean of the brain activities according to the volunteers’ expertise are shown in Figure 14, Figure 15 and Figure 16, in which the red line represents the beginner-level volunteers (i.e., datasets CR1, CR3, CLX and CLX), the blue line the mid-level volunteers (i.e., datasets RC1, RC2, RC3, GC1, GC3, LS1 and LS2) and the green line the mean of the mid-level and experienced-level volunteer (VC1 and VC2); this is because the experienced-level datasets refer to only one volunteer, which it was not reliable enough to be analyzed alone. This clearly shows that more experienced volunteers present, in general, lower variations and amplitudes of the brain activities over time; in the flight tasks that had complexity and risk to execute (i.e., task 1 and tasks 4–7), the beginner-level volunteers were shown to be unsafe and thus showed high amplitudes of the -band, as can be seen in Figure 14-Fp1, for instance.
In addition, these figures also show that for all electrode positions, the beginner volunteers present the highest amplitudes in risky tasks and lowest amplitudes in task 3 (cruise flight), where they felt more relaxed after concluding the risky task takeoff. The same situation did not happen with the more experienced volunteers, who they shown to be more confident along most of the flight tasks, as shown in Figure 15-Fp2 to T8.
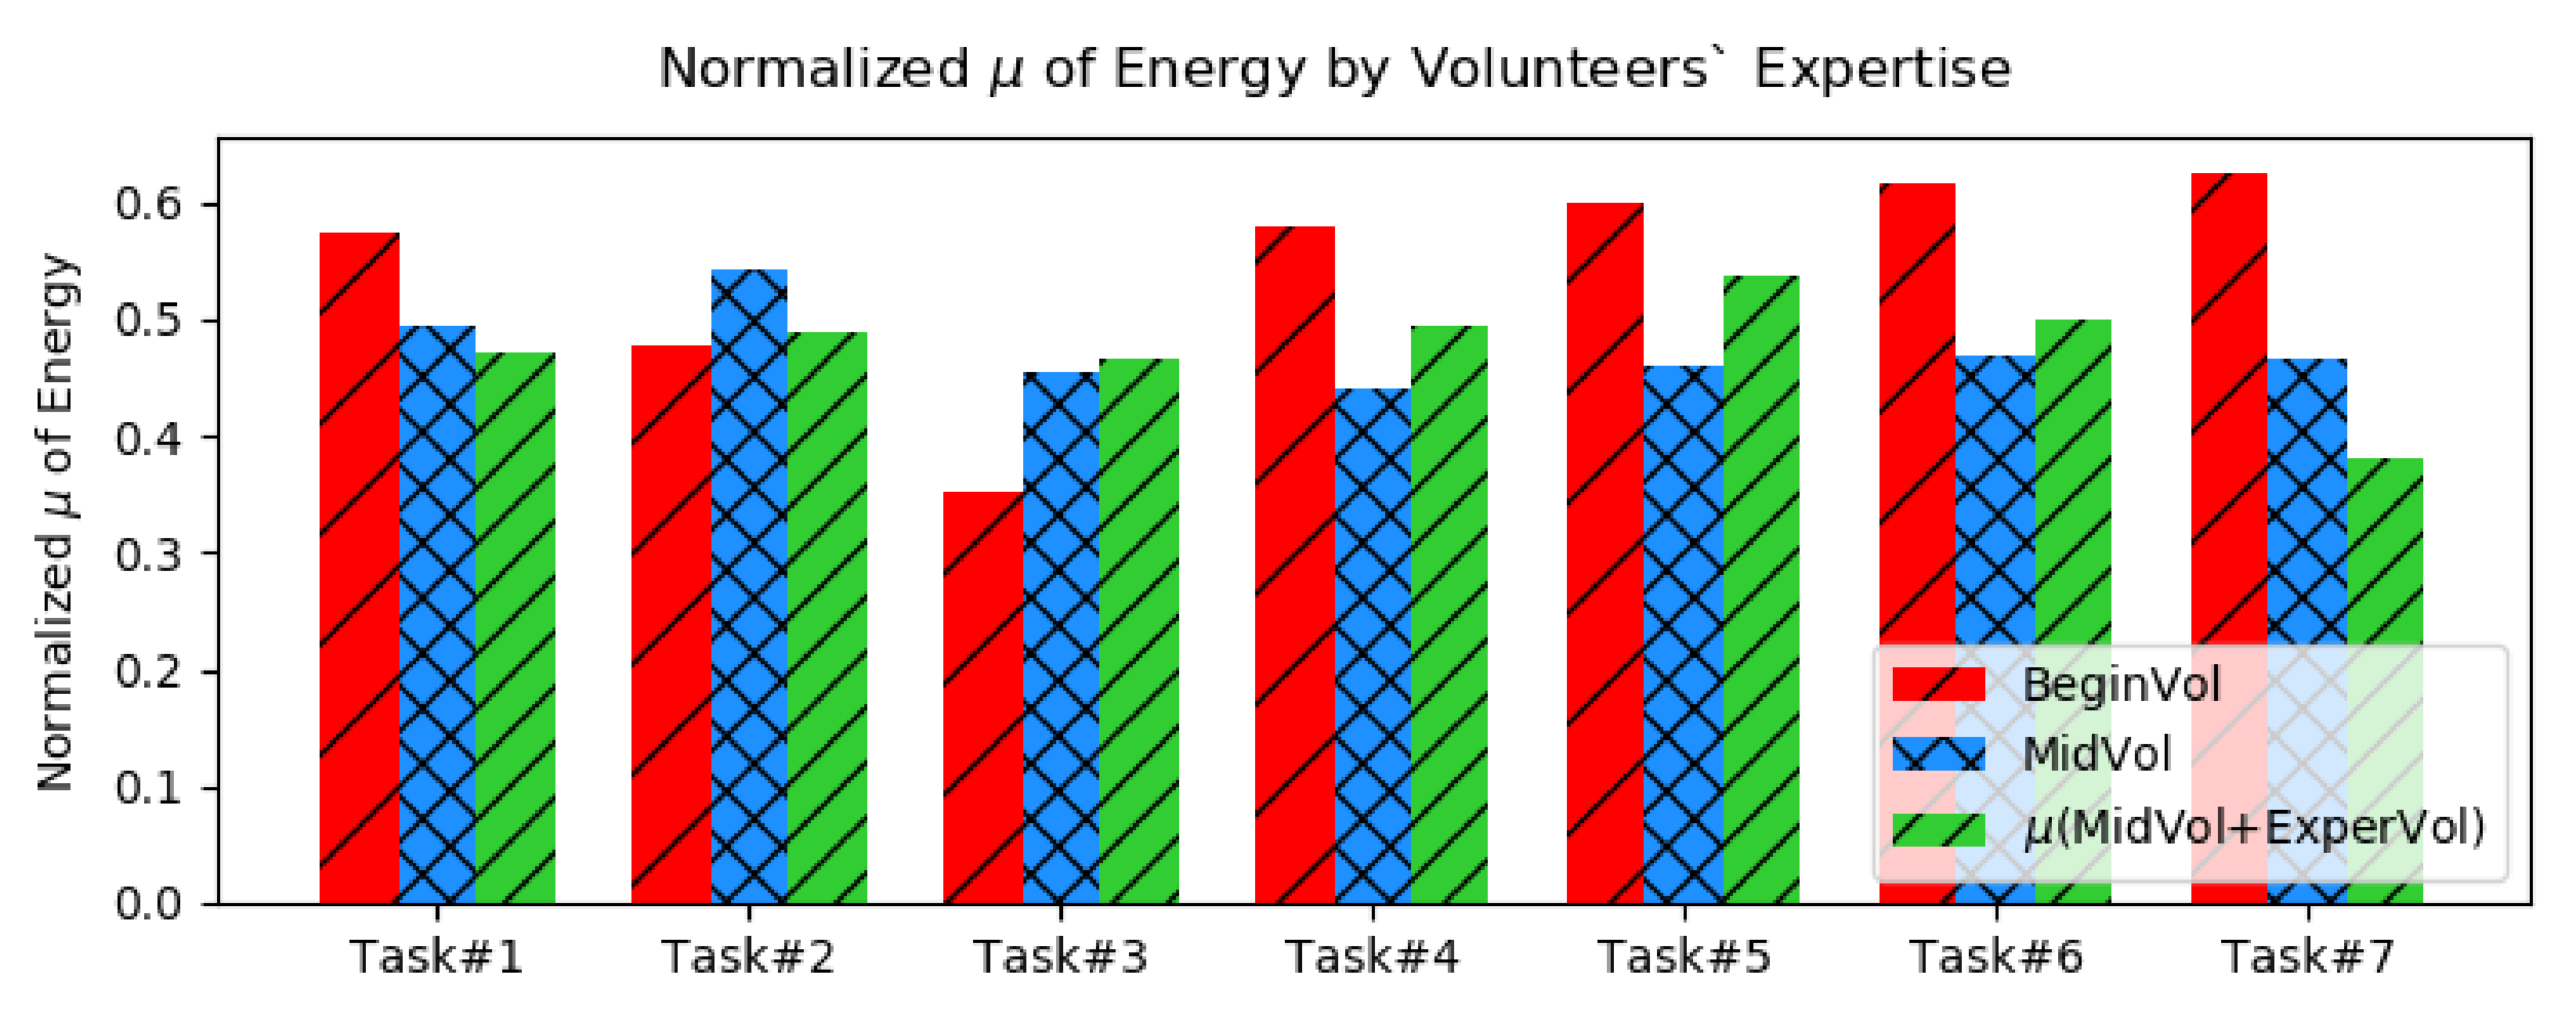
In all plots, the mean of brain activities for both levels of volunteers (mid-level and experienced-level), presents less oscillation between the tasks and lower amplitudes in critical flight phases such as, takeoff, approach and landing, for instance. Another way to see that is through Figure 16, where, in the takeoff, descend, approach and landing, the beginner volunteers presented higher amplitudes of brain activities compared to more experienced volunteers on flight simulations.
3.4. -Band Analysis for Flight Tasks
A quantification of the brain responses for each flight task is described in this section based on some statistical features.
The brain activities were analyzed according to each flight task: takeoff, climb, cruise flight (route), descent, approach, final approach and landing. They were measured based on some statistical features, such as mean, standard deviation and variance. This information was useful to show the relation between the brain activities and those flight phases.
It is sometimes possible to observe that the signal from one left lobe, e.g., seems to have opposite activities compared to the signal from the right lobe. Some probable reasons for that are based on the brain signals coming from one lobe or position, which it interfered over the signal from the other part, or due to the volunteers movements during the experiments, in which they used the right hand to control the airplane, while the left hand was immovable throughout each flight. Such movement artifacts observed on the beta band, mainly over the motor cortex, are presented by Khanna and Carmena [28], Chung et al. [35] and Chung et al. [36].
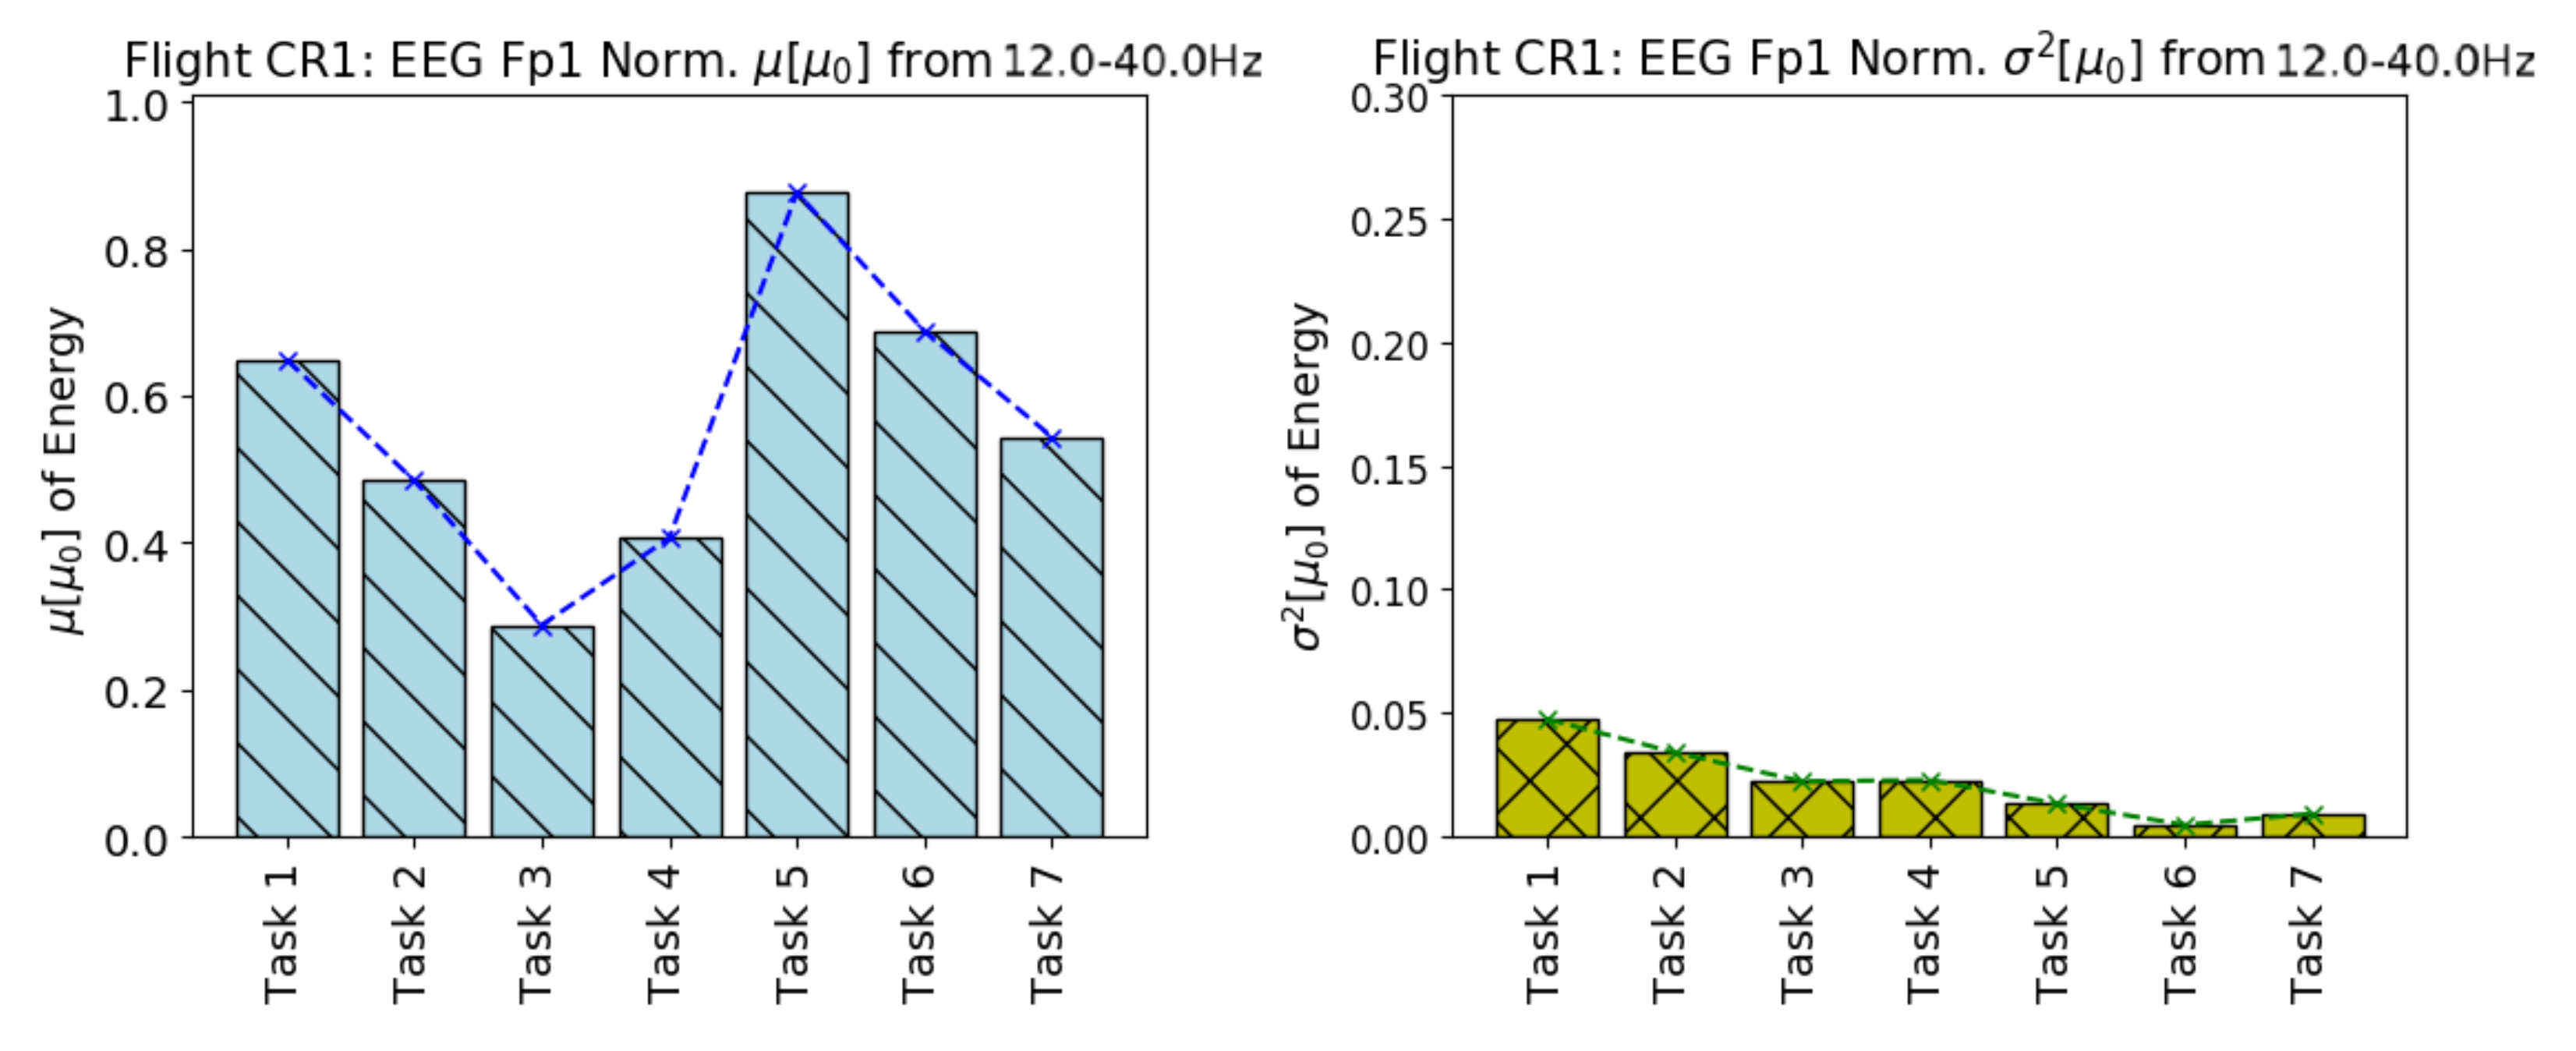
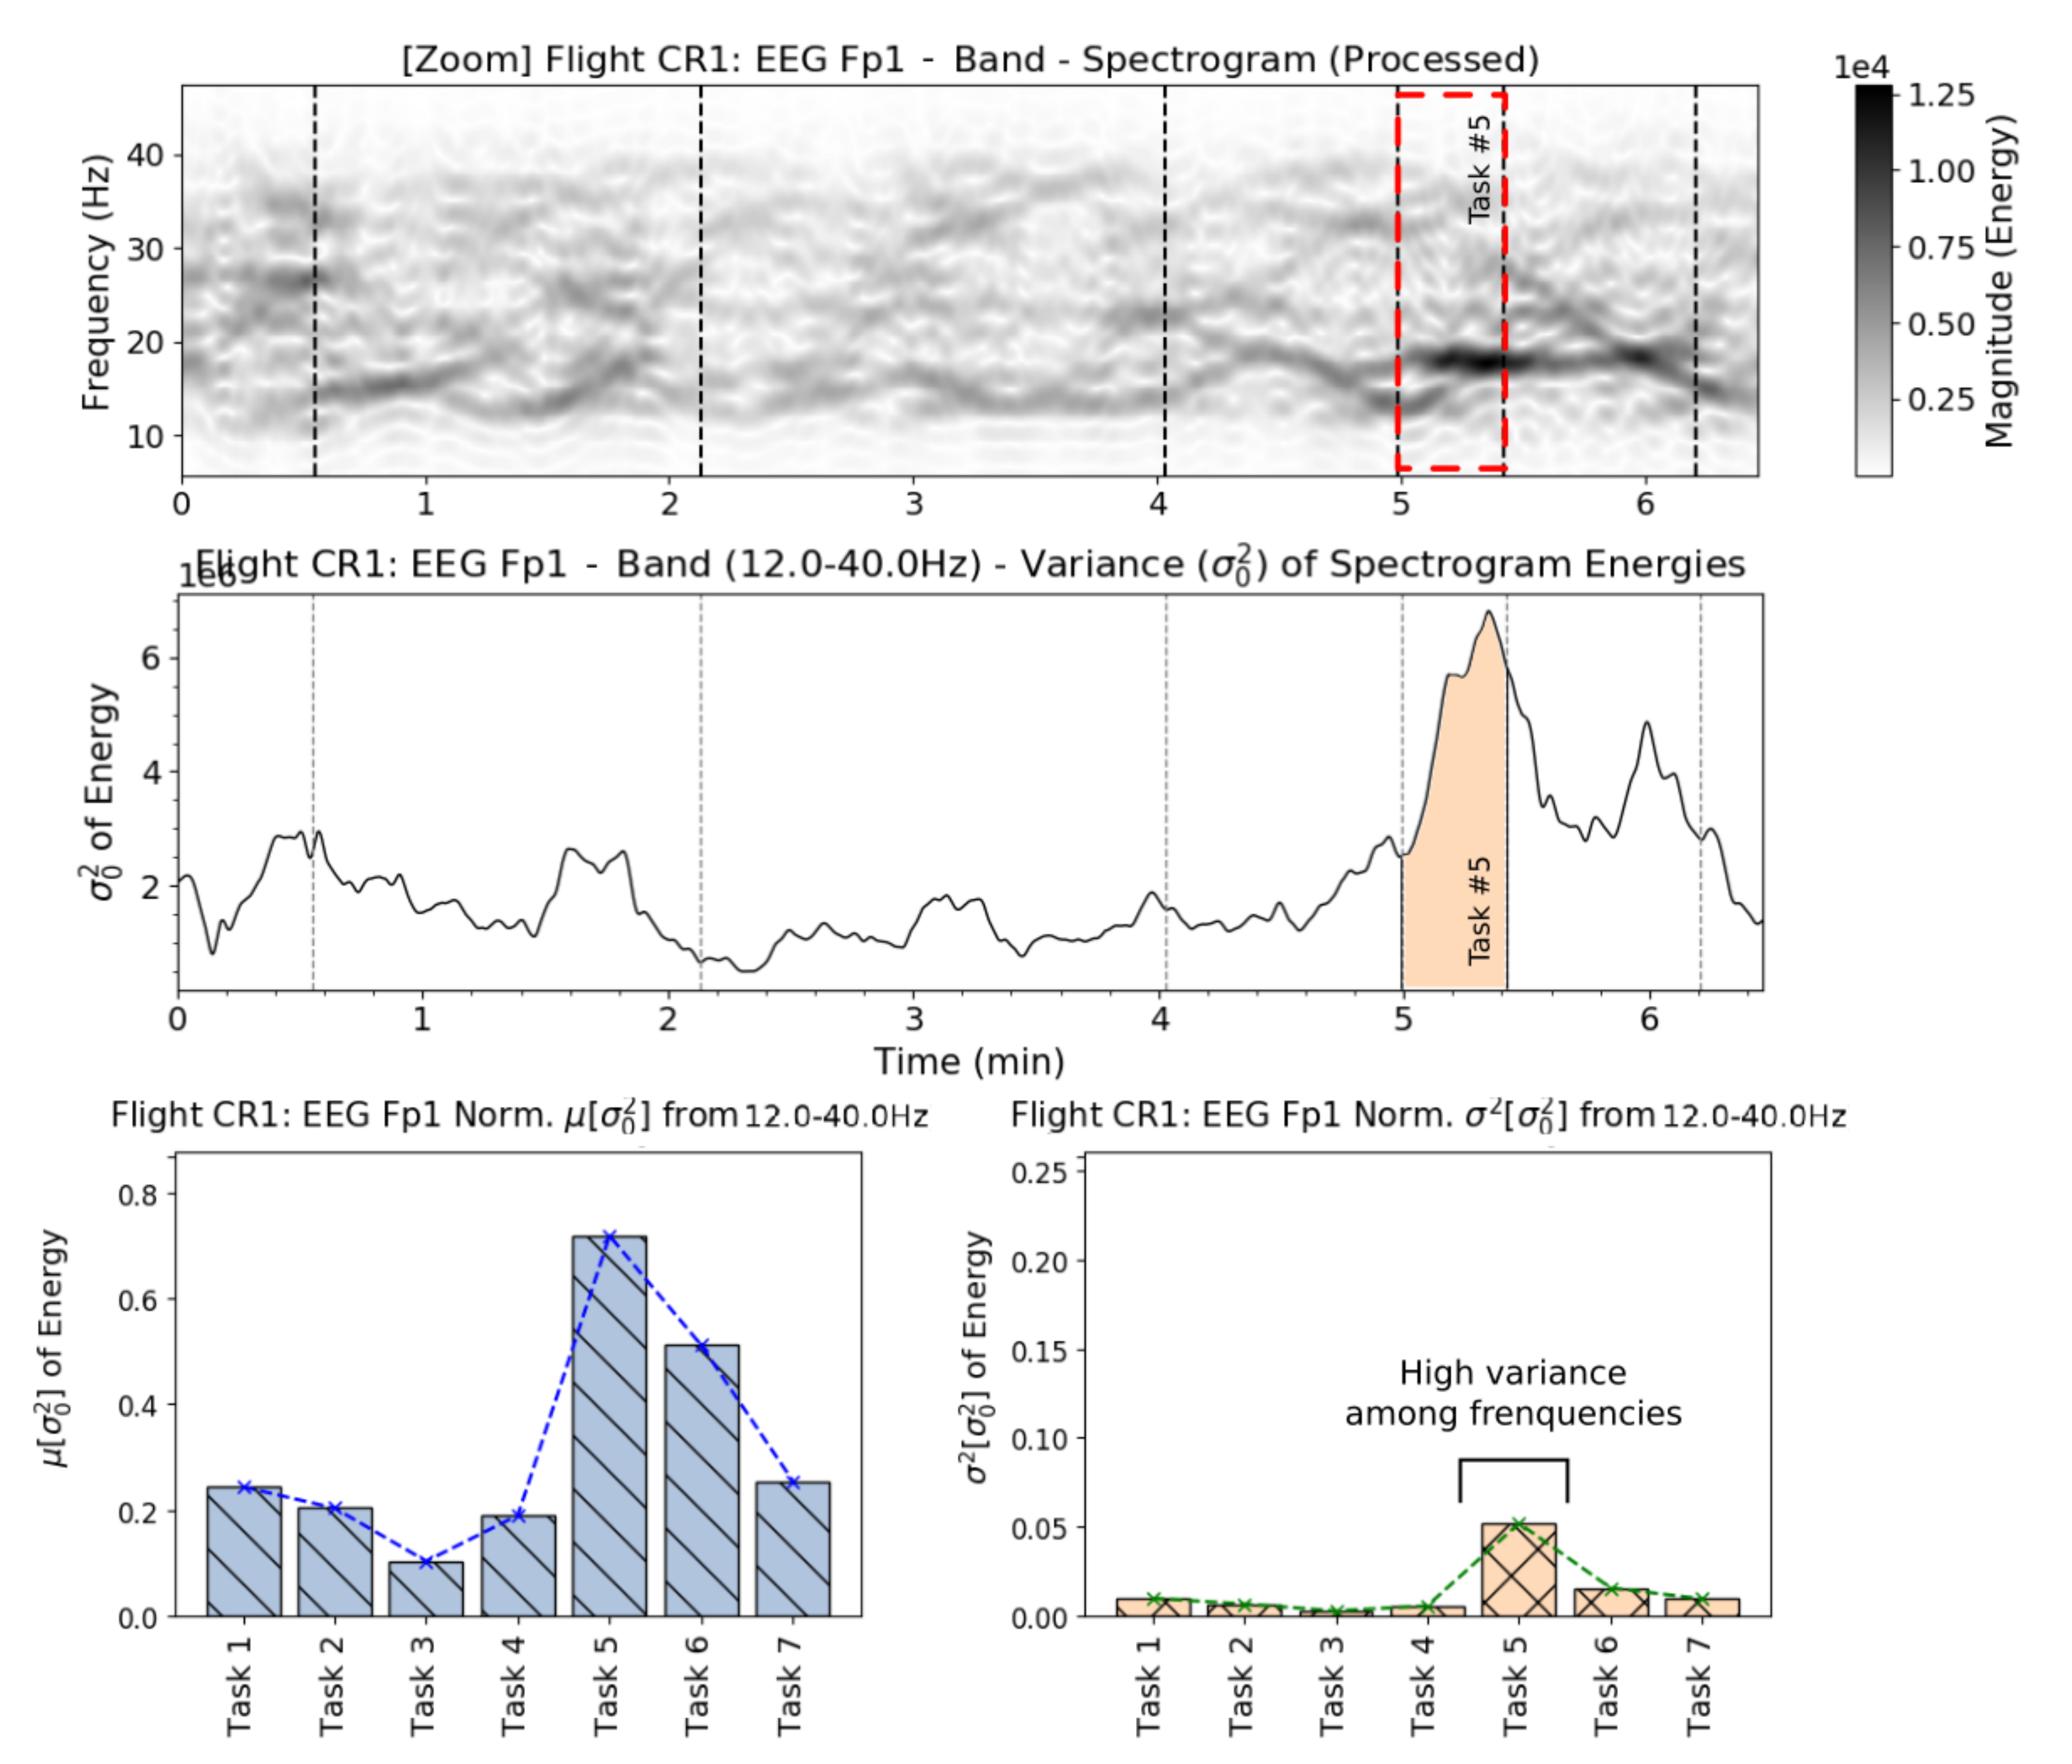
Figure 17-left shows the mean of the brain magnitude for each flight task, regarding to the frontal left lobe (channel Fp1). The parameter of the Figure 17-right represents the variance of the mean spectrogram . It is important to show how the mean spectrum varies over time.
It is possible to see that each volunteer seemed to feel more calm or confident during the task 3; the initial approach (task 5) and final approach (task 6) presented the higher intensities (see Table 3 and additional tables in Appendix A).
The variance in the brain amplitudes over the considered spectrum, i.e., 12 to 40 Hz, are shown in Figure 18, which it shows the variance along the flight CR1 according to each frequency by time.
High variance between the frequencies at the same time (vertical axis) means that the spectrum magnitude of each frequency is highly different. It also means that the brain magnitude at the same time presented more similar intensities for each frequency. It is useful to measure which tasks presented more magnitude variance by the frequencies axis over time.
4. Conclusions and Future Works
This work presented an innovative approach of brain analysis using a multisensing system based on several simulated flights; the experimental setup used the Microsoft Flight Simulator-Steam Edition (FSX-SE), EEG device, cameras, checklists, questionnaires and EEG data. The planned flight route was from Lisbon to Alverca, Portugal. A total of eight volunteers and 13 datasets were considered in the present analysis, including data from both genders. The present experiment was executed from the volunteers side (who acted like pilots in command), also considering several flight tasks and the respective volunteers’ brain activities based mainly on the -band.
Several results were obtained from this experiment. For instance, it was possible to visualize the brain spectrograms during the quietest moments of the flight (reported by the volunteers through the use of questionnaires), for which its spectrograms are shown to have less magnitude and variation compared to the stressful or critical flight moments. The opposite situations were also identified; i.e., in flight moments that require more attention (i.e., during the takeoff, approach and landing), the brain presented higher magnitudes and variations. This is mainly due to the level of attention and alertness that these tasks required.
Spectrograms of the EEG data were acquired from the frontal and temporal lobes, and it was shown to reflect better the flight phases, according to the feelings reported by each volunteer. When the volunteers’ expertise and confidence on the proposed flight simulation were considered, it showed that the highest brain magnitudes and oscillations observed of more experienced and confident volunteers, were on average close to less compared to less experienced and not-confident volunteers. Moreover, more experienced and confident volunteersin general presented different patterns of brain activities compared to volunteers with less expertise or less familiarity with fight simulations and/or electronic games. In addition, the mean of the volunteer’s brain activity presented the highest magnitudes during the the takeoff, approach, final approach and landing, with values close to 37.06–67.33% higher. Additional plots of normalized mean of brain activities for each lobe position also confirmed that the less experienced and not confident volunteers presented higher amplitudes of -band mainly during critical flight tasks, which it demand more attention and self-control.
For future works, we intend to apply these experiments in a real context, storing all biosignals (e.g., HR, GSR and EEG) from several real pilots during their real flights, processing these acquired data after each flight and producing a more precise diagnosis of the pilot feelings and brain activities along the flights; we also intend to develop more experiments including more volunteers, to develop methods to optimize noisy datasets, to apply our prior research based on ANN and deep learning using the present work methodology, and to execute similar idea in other contexts, e.g., administrative works, music, biophilia, automobilism and smart city.
Author Contributions
Conceptualization, V.C.C.R. and O.P.; methodology, V.C.C.R.; software, V.C.C.R.; validation, V.C.C.R.; formal analysis, V.C.C.R. and O.P.; investigation, V.C.C.R.; resource, V.C.C.R. and O.P.; data curation, V.C.C.R.; writing—original draft preparation, V.C.C.R.; review, V.C.C.R. and O.P.; editing, V.C.C.R.; visualization, V.C.C.R. and O.P.; supervision, O.P.; administration, O.P.; founding acquisition, O.P. All authors have read and agreed to the published version of the manuscript.
Funding
This work was supported by Fundação para a Ciência e Tecnologia, Project UIDB/50008/2020, ISCTE-Instituto Universitário de Lisboa and Instituto de Telecomunicações (IT-IUL).
Institutional Review Board Statement
Not applicable.
Informed Consent Statement
All volunteers signed a consent form, authorizing us to publish and use their data.
Data Availability Statement
The data are not publicly available due to commercial sensitivity.
Conflicts of Interest
The authors declare no conflict of interest.
Appendix A
Table A1, Table A2, Table A3, Table A4, Table A5, Table A6, Table A7, Table A8, Table A9, Table A10, Table A11 and Table A12, present the means, standard deviations and variances of all flights, considering two decimal places.

Table A1.
, and of -band, 31–39 Hz and 40 Hz of the flight dataset RC1 (mid-level volunteer).
| Electrode Channel | Simulator/Flight Tasks-Flight DS:RC1 [Normalized ] | ||||||
|---|---|---|---|---|---|---|---|
| Task 1 | Task 2 | Task 3 | Task 4 | Task 5 | Task 6 | Task 7 | |
| EEG-Fp1 | 0.46 ± 0.21 | 0.55 ± 0.22 | 0.28 ± 0.13 | 0.61 ± 0.19 | 0.55 ± 0.13 | 0.36 ± 0.04 | 0.51 ± 0.06 |
| EEG-F3 | 0.69 ± 0.22 | 0.40 ± 0.19 | 0.39 ± 0.14 | 0.51 ± 0.13 | 0.46 ± 0.06 | 0.25 ± 0.07 | 0.55 ± 0.12 |
| EEG-C3 | 0.60 ± 0.15 | 0.49 ± 0.17 | 0.32 ± 0.11 | 0.33 ± 0.15 | 0.11 ± 0.07 | 0.37 ± 0.16 | 0.69 ± 0.21 |
| EEG-T7 | 0.85 ± 0.10 | 0.37 ± 0.16 | 0.36 ± 0.18 | 0.59 ± 0.26 | 0.56 ± 0.08 | 0.43 ± 0.08 | 0.69 ± 0.10 |
| EEG-Fp2 | 0.36 ± 0.32 | 0.60 ± 0.23 | 0.49 ± 0.22 | 0.68 ± 0.16 | 0.65 ± 0.07 | 0.65 ± 0.08 | 0.59 ± 0.06 |
| EEG-F4 | 0.51 ± 0.09 | 0.64 ± 0.15 | 0.46 ± 0.32 | 0.50 ± 0.18 | 0.73 ± 0.12 | 0.33 ± 0.08 | 0.73 ± 0.16 |
| EEG-C4 | 0.77 ± 0.15 | 0.60 ± 0.17 | 0.26 ± 0.12 | 0.53 ± 0.25 | 0.37 ± 0.19 | 0.42 ± 0.19 | 0.93 ± 0.05 |
| EEG-T8 | 0.45 ± 0.12 | 0.70 ± 0.14 | 0.36 ± 0.16 | 0.44 ± 0.25 | 0.43 ± 0.12 | 0.36 ± 0.07 | 0.53 ± 0.08 |
| Electrode Channel | Simulator/Flight Tasks-Flight DS:RC1 [Normalized ] | ||||||
| Task 1 | Task 2 | Task 3 | Task 4 | Task 5 | Task 6 | Task 7 | |
| EEG-Fp1 | 0.05 | 0.05 | 0.02 | 0.04 | 0.02 | 0.00 | 0.00 |
| EEG-F3 | 0.05 | 0.03 | 0.02 | 0.02 | 0.00 | 0.01 | 0.02 |
| EEG-C3 | 0.02 | 0.03 | 0.01 | 0.02 | 0.00 | 0.03 | 0.04 |
| EEG-T7 | 0.01 | 0.02 | 0.03 | 0.07 | 0.01 | 0.01 | 0.01 |
| EEG-Fp2 | 0.10 | 0.05 | 0.05 | 0.02 | 0.01 | 0.01 | 0.00 |
| EEG-F4 | 0.01 | 0.02 | 0.10 | 0.03 | 0.01 | 0.01 | 0.03 |
| EEG-C4 | 0.02 | 0.03 | 0.02 | 0.06 | 0.03 | 0.04 | 0.00 |
| EEG-T8 | 0.01 | 0.02 | 0.03 | 0.06 | 0.01 | 0.00 | 0.01 |
Table A2.
, and of -band, 31–39 Hz and 40 Hz of the flight dataset RC2 (mid-level volunteer).
| Electrode Channel | Simulator/Flight Tasks-Flight DS:RC2 [Normalized ] | ||||||
|---|---|---|---|---|---|---|---|
| Task 1 | Task 2 | Task 3 | Task 4 | Task 5 | Task 6 | Task 7 | |
| EEG-Fp1 | 0.50 ± 0.07 | 0.45 ± 0.18 | 0.44 ± 0.15 | 0.34 ± 0.18 | 0.56 ± 0.13 | 0.82 ± 0.13 | 0.48 ± 0.11 |
| EEG-F3 | 0.46 ± 0.20 | 0.63 ± 0.28 | 0.65 ± 0.20 | 0.38 ± 0.18 | 0.37 ± 0.09 | 0.67 ± 0.16 | 0.47 ± 0.08 |
| EEG-C3 | 0.35 ± 0.23 | 0.55 ± 0.22 | 0.59 ± 0.27 | 0.55 ± 0.31 | 0.21 ± 0.10 | 0.71 ± 0.10 | 0.67 ± 0.05 |
| EEG-T7 | 0.52 ± 0.13 | 0.52 ± 0.22 | 0.42 ± 0.18 | 0.33 ± 0.21 | 0.63 ± 0.10 | 0.70 ± 0.18 | 0.45 ± 0.05 |
| EEG-Fp2 | 0.48 ± 0.17 | 0.66 ± 0.15 | 0.53 ± 0.16 | 0.40 ± 0.26 | 0.65 ± 0.15 | 0.54 ± 0.06 | 0.48 ± 0.05 |
| EEG-F4 | 0.47 ± 0.06 | 0.55 ± 0.18 | 0.28 ± 0.11 | 0.47 ± 0.22 | 0.31 ± 0.08 | 0.61 ± 0.07 | 0.56 ± 0.09 |
| EEG-C4 | 0.27 ± 0.17 | 0.43 ± 0.16 | 0.47 ± 0.23 | 0.27 ± 0.16 | 0.24 ± 0.12 | 0.57 ± 0.13 | 0.42 ± 0.05 |
| EEG-T8 | 0.23 ± 0.02 | 0.54 ± 0.13 | 0.37 ± 0.15 | 0.48 ± 0.32 | 0.32 ± 0.05 | 0.59 ± 0.18 | 0.74 ± 0.09 |
| Electrode Channel | Simulator/Flight Tasks-Flight DS:RC2 [Normalized ] | ||||||
| Task 1 | Task 2 | Task 3 | Task 4 | Task 5 | Task 6 | Task 7 | |
| EEG-Fp1 | 0.00 | 0.03 | 0.02 | 0.03 | 0.02 | 0.02 | 0.01 |
| EEG-F3 | 0.04 | 0.08 | 0.04 | 0.03 | 0.01 | 0.03 | 0.01 |
| EEG-C3 | 0.05 | 0.05 | 0.07 | 0.10 | 0.01 | 0.01 | 0.00 |
| EEG-T7 | 0.02 | 0.05 | 0.03 | 0.04 | 0.01 | 0.03 | 0.00 |
| EEG-Fp2 | 0.03 | 0.02 | 0.02 | 0.07 | 0.02 | 0.00 | 0.00 |
| EEG-F4 | 0.00 | 0.03 | 0.01 | 0.05 | 0.01 | 0.01 | 0.01 |
| EEG-C4 | 0.03 | 0.02 | 0.05 | 0.03 | 0.01 | 0.02 | 0.00 |
| EEG-T8 | 0.00 | 0.02 | 0.02 | 0.11 | 0.00 | 0.03 | 0.01 |
Table A3.
, and of -band, 31–39 Hz and 40 Hz of the flight dataset RC3 (mid-level volunteer).
| Electrode Channel | Simulator/Flight Tasks-Flight DS:RC3 [Normalized ] | ||||||
|---|---|---|---|---|---|---|---|
| Task 1 | Task 2 | Task 3 | Task 4 | Task 5 | Task 6 | Task 7 | |
| EEG-Fp1 | 0.27 ± 0.20 | 0.31 ± 0.09 | 0.39 ± 0.11 | 0.10 ± 0.09 | 0.23 ± 0.17 | 0.66 ± 0.08 | 0.86 ± 0.09 |
| EEG-F3 | 0.20 ± 0.15 | 0.26 ± 0.11 | 0.51 ± 0.23 | 0.22 ± 0.15 | 0.53 ± 0.10 | 0.52 ± 0.06 | 0.61 ± 0.10 |
| EEG-C3 | 0.41 ± 0.15 | 0.84 ± 0.11 | 0.49 ± 0.29 | 0.06 ± 0.07 | 0.24 ± 0.06 | 0.39 ± 0.01 | 0.38 ± 0.22 |
| EEG-T7 | 0.36 ± 0.04 | 0.33 ± 0.13 | 0.54 ± 0.20 | 0.09 ± 0.04 | 0.19 ± 0.05 | 0.26 ± 0.02 | 0.66 ± 0.17 |
| EEG-Fp2 | 0.31 ± 0.13 | 0.51 ± 0.15 | 0.33 ± 0.16 | 0.91 ± 0.05 | 0.56 ± 0.21 | 0.40 ± 0.06 | 0.51 ± 0.06 |
| EEG-F4 | 0.20 ± 0.10 | 0.65 ± 0.26 | 0.43 ± 0.22 | 0.14 ± 0.08 | 0.30 ± 0.10 | 0.52 ± 0.03 | 0.75 ± 0.12 |
| EEG-C4 | 0.33 ± 0.15 | 0.36 ± 0.06 | 0.49 ± 0.21 | 0.05 ± 0.05 | 0.58 ± 0.16 | 0.91 ± 0.10 | 0.78 ± 0.12 |
| EEG-T8 | 0.42 ± 0.10 | 0.56 ± 0.16 | 0.64 ± 0.20 | 0.14 ± 0.13 | 0.31 ± 0.19 | 0.82 ± 0.08 | 0.82 ± 0.04 |
| Electrode Channel | Simulator/Flight Tasks-Flight DS:RC3 [Normalized ] | ||||||
| Task 1 | Task 2 | Task 3 | Task 4 | Task 5 | Task 6 | Task 7 | |
| EEG-Fp1 | 0.04 | 0.01 | 0.01 | 0.01 | 0.03 | 0.01 | 0.01 |
| EEG-F3 | 0.02 | 0.01 | 0.05 | 0.02 | 0.01 | 0.00 | 0.01 |
| EEG-C3 | 0.02 | 0.01 | 0.08 | 0.01 | 0.00 | 0.00 | 0.05 |
| EEG-T7 | 0.00 | 0.02 | 0.04 | 0.00 | 0.00 | 0.00 | 0.03 |
| EEG-Fp2 | 0.02 | 0.02 | 0.03 | 0.00 | 0.04 | 0.00 | 0.00 |
| EEG-F4 | 0.01 | 0.07 | 0.05 | 0.01 | 0.01 | 0.00 | 0.01 |
| EEG-C4 | 0.02 | 0.00 | 0.04 | 0.00 | 0.02 | 0.01 | 0.01 |
| EEG-T8 | 0.01 | 0.02 | 0.04 | 0.02 | 0.04 | 0.01 | 0.00 |
Table A4.
, and of -band, 31–39 Hz and 40 Hz of the flight dataset GC1 (mid-level volunteer).
| Electrode Channel | Simulator/Flight Tasks-Flight DS:GC1 [Normalized ] | ||||||
|---|---|---|---|---|---|---|---|
| Task 1 | Task 2 | Task 3 | Task 4 | Task 5 | Task 6 | Task 7 | |
| EEG-Fp1 | 0.61 ± 0.16 | 0.62 ± 0.18 | 0.48 ± 0.28 | 0.46 ± 0.15 | 0.68 ± 0.27 | 0.32 ± 0.12 | 0.31 ± 0.10 |
| EEG-F3 | 0.65 ± 0.15 | 0.68 ± 0.24 | 0.43 ± 0.28 | 0.43 ± 0.15 | 0.40 ± 0.13 | 0.22 ± 0.13 | 0.13 ± 0.10 |
| EEG-C3 | 0.74 ± 0.12 | 0.52 ± 0.23 | 0.52 ± 0.27 | 0.40 ± 0.24 | 0.44 ± 0.06 | 0.37 ± 0.12 | 0.11 ± 0.10 |
| EEG-T7 | 0.83 ± 0.15 | 0.61 ± 0.22 | 0.50 ± 0.28 | 0.43 ± 0.13 | 0.49 ± 0.11 | 0.33 ± 0.14 | 0.33 ± 0.11 |
| EEG-Fp2 | 0.71 ± 0.19 | 0.71 ± 0.14 | 0.30 ± 0.18 | 0.53 ± 0.11 | 0.60 ± 0.05 | 0.47 ± 0.14 | 0.26 ± 0.09 |
| EEG-F4 | 0.74 ± 0.08 | 0.66 ± 0.11 | 0.29 ± 0.19 | 0.52 ± 0.21 | 0.65 ± 0.10 | 0.50 ± 0.16 | 0.22 ± 0.08 |
| EEG-C4 | 0.80 ± 0.13 | 0.50 ± 0.11 | 0.26 ± 0.10 | 0.22 ± 0.14 | 0.38 ± 0.07 | 0.23 ± 0.09 | 0.29 ± 0.11 |
| EEG-T8 | 0.80 ± 0.14 | 0.63 ± 0.19 | 0.48 ± 0.23 | 0.42 ± 0.10 | 0.49 ± 0.11 | 0.31 ± 0.09 | 0.31 ± 0.09 |
| Electrode Channel | Simulator/Flight Tasks-Flight DS:GC1 [Normalized ] | ||||||
| Task 1 | Task 2 | Task 3 | Task 4 | Task 5 | Task 6 | Task 7 | |
| EEG-Fp1 | 0.02 | 0.03 | 0.08 | 0.02 | 0.07 | 0.01 | 0.01 |
| EEG-F3 | 0.02 | 0.06 | 0.08 | 0.02 | 0.02 | 0.02 | 0.01 |
| EEG-C3 | 0.01 | 0.06 | 0.07 | 0.06 | 0.00 | 0.01 | 0.01 |
| EEG-T7 | 0.02 | 0.05 | 0.08 | 0.02 | 0.01 | 0.02 | 0.01 |
| EEG-Fp2 | 0.04 | 0.02 | 0.03 | 0.01 | 0.00 | 0.02 | 0.01 |
| EEG-F4 | 0.01 | 0.01 | 0.04 | 0.05 | 0.01 | 0.03 | 0.01 |
| EEG-C4 | 0.02 | 0.01 | 0.01 | 0.02 | 0.01 | 0.01 | 0.01 |
| EEG-T8 | 0.02 | 0.04 | 0.05 | 0.01 | 0.01 | 0.01 | 0.01 |
Table A5.
, and of -band, 31–39 Hz and 40 Hz of the flight dataset GC3 (mid-level volunteer).
| Electrode Channel | Simulator/Flight Tasks-Flight DS:GC3 [Normalized ] | ||||||
|---|---|---|---|---|---|---|---|
| Task 1 | Task 2 | Task 3 | Task 4 | Task 5 | Task 6 | Task 7 | |
| EEG-Fp1 | 0.59 ± 0.11 | 0.42 ± 0.16 | 0.59 ± 0.19 | 0.42 ± 0.23 | 0.68 ± 0.26 | 0.68 ± 0.11 | 0.59 ± 0.07 |
| EEG-F3 | 0.64 ± 0.11 | 0.45 ± 0.23 | 0.61 ± 0.15 | 0.45 ± 0.19 | 0.71 ± 0.17 | 0.59 ± 0.12 | 0.51 ± 0.08 |
| EEG-C3 | 0.30 ± 0.05 | 0.29 ± 0.09 | 0.38 ± 0.10 | 0.30 ± 0.13 | 0.61 ± 0.27 | 0.61 ± 0.30 | 0.20 ± 0.11 |
| EEG-T7 | 0.68 ± 0.10 | 0.46 ± 0.27 | 0.59 ± 0.20 | 0.47 ± 0.21 | 0.73 ± 0.17 | 0.49 ± 0.10 | 0.46 ± 0.08 |
| EEG-Fp2 | 0.74 ± 0.22 | 0.48 ± 0.23 | 0.59 ± 0.25 | 0.49 ± 0.19 | 0.43 ± 0.12 | 0.48 ± 0.07 | 0.28 ± 0.20 |
| EEG-F4 | 0.74 ± 0.14 | 0.41 ± 0.26 | 0.53 ± 0.18 | 0.54 ± 0.20 | 0.54 ± 0.06 | 0.66 ± 0.10 | 0.30 ± 0.11 |
| EEG-C4 | 0.60 ± 0.10 | 0.44 ± 0.18 | 0.48 ± 0.12 | 0.49 ± 0.26 | 0.72 ± 0.13 | 0.58 ± 0.13 | 0.49 ± 0.14 |
| EEG-T8 | 0.42 ± 0.08 | 0.45 ± 0.24 | 0.58 ± 0.10 | 0.51 ± 0.15 | 0.70 ± 0.14 | 0.46 ± 0.07 | 0.39 ± 0.11 |
| Electrode Channel | Simulator/Flight Tasks-Flight DS:GC3 [Normalized ] | ||||||
| Task 1 | Task 2 | Task 3 | Task 4 | Task 5 | Task 6 | Task 7 | |
| EEG-Fp1 | 0.01 | 0.03 | 0.04 | 0.05 | 0.07 | 0.01 | 0.01 |
| EEG-F3 | 0.01 | 0.05 | 0.02 | 0.03 | 0.03 | 0.01 | 0.01 |
| EEG-C3 | 0.00 | 0.01 | 0.01 | 0.02 | 0.07 | 0.09 | 0.01 |
| EEG-T7 | 0.01 | 0.07 | 0.04 | 0.04 | 0.03 | 0.01 | 0.01 |
| EEG-Fp2 | 0.05 | 0.05 | 0.06 | 0.04 | 0.01 | 0.00 | 0.04 |
| EEG-F4 | 0.02 | 0.07 | 0.03 | 0.04 | 0.00 | 0.01 | 0.01 |
| EEG-C4 | 0.01 | 0.03 | 0.02 | 0.07 | 0.02 | 0.02 | 0.02 |
| EEG-T8 | 0.01 | 0.06 | 0.01 | 0.02 | 0.02 | 0.00 | 0.01 |
Table A6.
, and of -band, 31–39 Hz and 40 Hz of the flight dataset LS1 (mid-level volunteer).
| Electrode Channel | Simulator/Flight Tasks-Flight DS:LS1 [Normalized ] | ||||||
|---|---|---|---|---|---|---|---|
| Task 1 | Task 2 | Task 3 | Task 4 | Task 5 | Task 6 | Task 7 | |
| EEG-Fp1 | 0.43 ± 0.08 | 0.61 ± 0.19 | 0.51 ± 0.18 | 0.63 ± 0.22 | 0.40 ± 0.23 | 0.66 ± 0.02 | – |
| EEG-F3 | 0.39 ± 0.06 | 0.52 ± 0.25 | 0.32 ± 0.12 | 0.42 ± 0.09 | 0.39 ± 0.09 | 0.29 ± 0.03 | – |
| EEG-C3 | 0.48 ± 0.17 | 0.55 ± 0.21 | 0.55 ± 0.16 | 0.71 ± 0.17 | 0.46 ± 0.12 | 0.43 ± 0.01 | – |
| EEG-T7 | 0.48 ± 0.15 | 0.61 ± 0.23 | 0.54 ± 0.22 | 0.74 ± 0.13 | 0.57 ± 0.15 | 0.47 ± 0.04 | – |
| EEG-Fp2 | 0.42 ± 0.09 | 0.63 ± 0.21 | 0.45 ± 0.13 | 0.51 ± 0.07 | 0.25 ± 0.14 | 0.31 ± 0.01 | – |
| EEG-F4 | 0.33 ± 0.11 | 0.58 ± 0.27 | 0.37 ± 0.17 | 0.49 ± 0.12 | 0.32 ± 0.09 | 0.34 ± 0.01 | – |
| EEG-C4 | 0.35 ± 0.14 | 0.52 ± 0.23 | 0.46 ± 0.16 | 0.50 ± 0.13 | 0.34 ± 0.14 | 0.48 ± 0.02 | – |
| EEG-T8 | 0.31 ± 0.13 | 0.51 ± 0.23 | 0.40 ± 0.22 | 0.29 ± 0.10 | 0.26 ± 0.11 | 0.31 ± 0.02 | – |
| Electrode Channel | Simulator/Flight Tasks-Flight DS:LS1 [Normalized ] | ||||||
| Task 1 | Task 2 | Task 3 | Task 4 | Task 5 | Task 6 | Task 7 | |
| EEG-Fp1 | 0.01 | 0.04 | 0.03 | 0.05 | 0.05 | 0.00 | – |
| EEG-F3 | 0.00 | 0.06 | 0.02 | 0.01 | 0.01 | 0.00 | – |
| EEG-C3 | 0.03 | 0.04 | 0.03 | 0.03 | 0.01 | 0.00 | – |
| EEG-T7 | 0.02 | 0.05 | 0.05 | 0.02 | 0.02 | 0.00 | – |
| EEG-Fp2 | 0.01 | 0.04 | 0.02 | 0.01 | 0.02 | 0.00 | – |
| EEG-F4 | 0.01 | 0.07 | 0.03 | 0.02 | 0.01 | 0.00 | – |
| EEG-C4 | 0.02 | 0.05 | 0.03 | 0.02 | 0.02 | 0.00 | – |
| EEG-T8 | 0.02 | 0.05 | 0.05 | 0.01 | 0.01 | 0.00 | – |
Table A7.
, and of -band, 31–39 Hz and 40 Hz of the flight dataset LS2 (mid-level volunteer).
| Electrode Channel | Simulator/Flight Tasks-Flight DS:LS2 [Normalized ] | ||||||
|---|---|---|---|---|---|---|---|
| Task 1 | Task 2 | Task 3 | Task 4 | Task 5 | Task 6 | Task 7 | |
| EEG-Fp1 | 0.45 ± 0.22 | 0.75 ± 0.16 | 0.45 ± 0.23 | 0.53 ± 0.22 | 0.50 ± 0.09 | 0.35 ± 0.13 | 0.44 ± 0.10 |
| EEG-F3 | 0.63 ± 0.12 | 0.64 ± 0.20 | 0.58 ± 0.15 | 0.65 ± 0.18 | 0.51 ± 0.07 | 0.31 ± 0.15 | 0.23 ± 0.09 |
| EEG-C3 | 0.32 ± 0.12 | 0.48 ± 0.11 | 0.48 ± 0.22 | 0.42 ± 0.16 | 0.38 ± 0.06 | 0.22 ± 0.08 | 0.05 ± 0.03 |
| EEG-T7 | 0.44 ± 0.07 | 0.47 ± 0.18 | 0.39 ± 0.27 | 0.53 ± 0.28 | 0.64 ± 0.14 | 0.40 ± 0.15 | 0.38 ± 0.09 |
| EEG-Fp2 | 0.51 ± 0.17 | 0.76 ± 0.16 | 0.46 ± 0.26 | 0.56 ± 0.20 | 0.34 ± 0.08 | 0.29 ± 0.10 | 0.33 ± 0.06 |
| EEG-F4 | 0.50 ± 0.07 | 0.74 ± 0.11 | 0.50 ± 0.16 | 0.53 ± 0.19 | 0.38 ± 0.09 | 0.36 ± 0.15 | 0.29 ± 0.07 |
| EEG-C4 | 0.39 ± 0.10 | 0.58 ± 0.13 | 0.51 ± 0.19 | 0.54 ± 0.20 | 0.40 ± 0.08 | 0.42 ± 0.11 | 0.11 ± 0.08 |
| EEG-T8 | 0.26 ± 0.13 | 0.59 ± 0.23 | 0.39 ± 0.18 | 0.37 ± 0.11 | 0.23 ± 0.08 | 0.45 ± 0.17 | 0.52 ± 0.13 |
| Electrode Channel | Simulator/Flight Tasks-Flight DS:LS2 [Normalized ] | ||||||
| Task 1 | Task 2 | Task 3 | Task 4 | Task 5 | Task 6 | Task 7 | |
| EEG-Fp1 | 0.05 | 0.02 | 0.05 | 0.05 | 0.01 | 0.02 | 0.01 |
| EEG-F3 | 0.01 | 0.04 | 0.02 | 0.03 | 0.00 | 0.02 | 0.01 |
| EEG-C3 | 0.02 | 0.01 | 0.05 | 0.03 | 0.00 | 0.01 | 0.00 |
| EEG-T7 | 0.00 | 0.03 | 0.07 | 0.08 | 0.02 | 0.02 | 0.01 |
| EEG-Fp2 | 0.03 | 0.02 | 0.07 | 0.04 | 0.01 | 0.01 | 0.00 |
| EEG-F4 | 0.00 | 0.01 | 0.03 | 0.04 | 0.01 | 0.02 | 0.01 |
| EEG-C4 | 0.01 | 0.02 | 0.04 | 0.04 | 0.01 | 0.01 | 0.01 |
| EEG-T8 | 0.02 | 0.05 | 0.03 | 0.01 | 0.01 | 0.03 | 0.02 |
Table A8.
, and of -band, 31–39 Hz and 40 Hz of the flight dataset VC1 (experienced volunteer).
| Electrode Channel | Simulator/Flight Tasks-Flight DS:VC1 [Normalized ] | ||||||
|---|---|---|---|---|---|---|---|
| Task 1 | Task 2 | Task 3 | Task 4 | Task 5 | Task 6 | Task 7 | |
| EEG-Fp1 | 0.55 ± 0.14 | 0.22 ± 0.11 | 0.45 ± 0.06 | 0.52 ± 0.21 | 0.85 ± 0.03 | 0.88 ± 0.11 | 0.48 ± 0.09 |
| EEG-F3 | 0.77 ± 0.14 | 0.31 ± 0.13 | 0.42 ± 0.09 | 0.42 ± 0.30 | 0.92 ± 0.07 | 0.67 ± 0.18 | 0.31 ± 0.11 |
| EEG-C3 | 0.47 ± 0.04 | 0.06 ± 0.11 | 0.14 ± 0.14 | 0.85 ± 0.07 | 0.78 ± 0.08 | 0.19 ± 0.17 | 0.29 ± 0.13 |
| EEG-T7 | 0.59 ± 0.09 | 0.17 ± 0.11 | 0.38 ± 0.14 | 0.36 ± 0.30 | 0.84 ± 0.04 | 0.85 ± 0.13 | 0.47 ± 0.13 |
| EEG-Fp2 | 0.49 ± 0.12 | 0.21 ± 0.09 | 0.35 ± 0.13 | 0.38 ± 0.21 | 0.72 ± 0.09 | 0.88 ± 0.07 | 0.43 ± 0.15 |
| EEG-F4 | 0.62 ± 0.06 | 0.38 ± 0.17 | 0.48 ± 0.20 | 0.49 ± 0.31 | 0.89 ± 0.10 | 0.61 ± 0.22 | 0.45 ± 0.15 |
| EEG-C4 | 0.45 ± 0.21 | 0.48 ± 0.31 | 0.43 ± 0.18 | 0.40 ± 0.12 | 0.74 ± 0.12 | 0.58 ± 0.21 | 0.54 ± 0.15 |
| EEG-T8 | 0.34 ± 0.02 | 0.29 ± 0.13 | 0.41 ± 0.07 | 0.45 ± 0.23 | 0.69 ± 0.03 | 0.80 ± 0.10 | 0.59 ± 0.14 |
| Electrode Channel | Simulator/Flight Tasks-Flight DS:VC1 [Normalized ] | ||||||
| Task 1 | Task 2 | Task 3 | Task 4 | Task 5 | Task 6 | Task 7 | |
| EEG-Fp1 | 0.02 | 0.01 | 0.00 | 0.05 | 0.00 | 0.01 | 0.01 |
| EEG-F3 | 0.02 | 0.02 | 0.01 | 0.09 | 0.00 | 0.03 | 0.01 |
| EEG-C3 | 0.00 | 0.01 | 0.02 | 0.01 | 0.01 | 0.03 | 0.02 |
| EEG-T7 | 0.01 | 0.01 | 0.02 | 0.09 | 0.00 | 0.02 | 0.02 |
| EEG-Fp2 | 0.01 | 0.01 | 0.02 | 0.04 | 0.01 | 0.00 | 0.02 |
| EEG-F4 | 0.00 | 0.03 | 0.04 | 0.10 | 0.01 | 0.05 | 0.02 |
| EEG-C4 | 0.04 | 0.10 | 0.03 | 0.02 | 0.02 | 0.04 | 0.02 |
| EEG-T8 | 0.00 | 0.02 | 0.01 | 0.05 | 0.00 | 0.01 | 0.02 |
Table A9.
, and of -band, 31–39 Hz and 40 Hz of the flight dataset VC2 (experienced volunteer).
| Electrode Channel | Simulator/Flight Tasks-Flight DS:VC2 [Normalized ] | ||||||
|---|---|---|---|---|---|---|---|
| Task 1 | Task 2 | Task 3 | Task 4 | Task 5 | Task 6 | Task 7 | |
| EEG-Fp1 | 0.19 ± 0.08 | 0.66 ± 0.25 | 0.52 ± 0.20 | 0.55 ± 0.14 | 0.26 ± 0.05 | 0.24 ± 0.06 | 0.17 ± 0.08 |
| EEG-F3 | 0.55 ± 0.03 | 0.64 ± 0.19 | 0.61 ± 0.22 | 0.81 ± 0.14 | 0.61 ± 0.04 | 0.45 ± 0.13 | 0.10 ± 0.06 |
| EEG-C3 | 0.74 ± 0.05 | 0.87 ± 0.07 | 0.84 ± 0.09 | 0.45 ± 0.13 | 0.47 ± 0.21 | 0.74 ± 0.03 | 0.27 ± 0.22 |
| EEG-T7 | 0.33 ± 0.08 | 0.53 ± 0.12 | 0.62 ± 0.26 | 0.54 ± 0.13 | 0.09 ± 0.07 | 0.07 ± 0.04 | 0.15 ± 0.07 |
| EEG-Fp2 | 0.28 ± 0.02 | 0.69 ± 0.24 | 0.43 ± 0.17 | 0.49 ± 0.21 | 0.21 ± 0.05 | 0.23 ± 0.04 | 0.14 ± 0.05 |
| EEG-F4 | 0.23 ± 0.02 | 0.45 ± 0.17 | 0.62 ± 0.23 | 0.67 ± 0.09 | 0.49 ± 0.02 | 0.34 ± 0.07 | 0.09 ± 0.05 |
| EEG-C4 | 0.35 ± 0.07 | 0.32 ± 0.11 | 0.43 ± 0.18 | 0.77 ± 0.06 | 0.82 ± 0.11 | 0.46 ± 0.16 | 0.06 ± 0.05 |
| EEG-T8 | 0.21 ± 0.03 | 0.67 ± 0.21 | 0.49 ± 0.15 | 0.59 ± 0.18 | 0.47 ± 0.11 | 0.51 ± 0.08 | 0.16 ± 0.12 |
| Electrode Channel | Simulator/Flight Tasks-Flight DS:VC2 [Normalized ] | ||||||
| Task 1 | Task 2 | Task 3 | Task 4 | Task 5 | Task 6 | Task 7 | |
| EEG-Fp1 | 0.01 | 0.06 | 0.04 | 0.02 | 0.00 | 0.00 | 0.01 |
| EEG-F3 | 0.00 | 0.04 | 0.05 | 0.02 | 0.00 | 0.02 | 0.00 |
| EEG-C3 | 0.00 | 0.01 | 0.01 | 0.02 | 0.04 | 0.00 | 0.05 |
| EEG-T7 | 0.01 | 0.02 | 0.07 | 0.02 | 0.00 | 0.00 | 0.00 |
| EEG-Fp2 | 0.00 | 0.06 | 0.03 | 0.04 | 0.00 | 0.00 | 0.00 |
| EEG-F4 | 0.00 | 0.03 | 0.05 | 0.01 | 0.00 | 0.00 | 0.00 |
| EEG-C4 | 0.00 | 0.01 | 0.03 | 0.00 | 0.01 | 0.03 | 0.00 |
| EEG-T8 | 0.00 | 0.05 | 0.02 | 0.03 | 0.01 | 0.01 | 0.01 |
Table A10.
, and of -band, 31–39 Hz and 40 Hz of the flight dataset CR3 (beginner-level volunteer).
| Electrode Channel | Simulator/Flight Tasks-Flight DS:CR3 [Normalized ] | ||||||
|---|---|---|---|---|---|---|---|
| Task 1 | Task 2 | Task 3 | Task 4 | Task 5 | Task 6 | Task 7 | |
| EEG-Fp1 | 0.49 ± 0.14 | 0.51 ± 0.28 | – | – | – | – | – |
| EEG-F3 | 0.28 ± 0.17 | 0.54 ± 0.36 | – | – | – | – | – |
| EEG-C3 | 0.70 ± 0.26 | 0.31 ± 0.24 | – | – | – | – | – |
| EEG-T7 | 0.41 ± 0.11 | 0.38 ± 0.32 | – | – | – | – | – |
| EEG-Fp2 | 0.56 ± 0.34 | 0.27 ± 0.25 | – | – | – | – | – |
| EEG-F4 | 0.56 ± 0.18 | 0.54 ± 0.24 | – | – | – | – | – |
| EEG-C4 | 0.58 ± 0.35 | 0.31 ± 0.27 | – | – | – | – | – |
| EEG-T8 | 0.62 ± 0.28 | 0.39 ± 0.23 | – | – | – | – | – |
| Electrode Channel | Simulator/Flight Tasks-Flight DS:CR3 [Normalized ] | ||||||
| Task 1 | Task 2 | Task 3 | Task 4 | Task 5 | Task 6 | Task 7 | |
| EEG-Fp1 | 0.02 | 0.08 | – | – | – | – | – |
| EEG-F3 | 0.03 | 0.13 | – | – | – | – | – |
| EEG-C3 | 0.07 | 0.06 | – | – | – | – | – |
| EEG-T7 | 0.01 | 0.10 | – | – | – | – | – |
| EEG-Fp2 | 0.12 | 0.06 | – | – | – | – | – |
| EEG-F4 | 0.03 | 0.06 | – | – | – | – | – |
| EEG-T8 | 0.08 | 0.05 | – | – | – | – | – |
Table A11.
, and of -band, 31–39 Hz and 40 Hz of the flight dataset CLX (beginner-level volunteer).
| Electrode Channel | Simulator/Flight Tasks-Flight DS:CLX [Normalized ] | ||||||
|---|---|---|---|---|---|---|---|
| Task 1 | Task 2 | Task 3 | Task 4 | Task 5 | Task 6 | Task 7 | |
| EEG-Fp1 | 0.62 ± 0.22 | 0.76 ± 0.09 | – | – | – | – | – |
| EEG-F3 | 0.55 ± 0.21 | 0.66 ± 0.32 | – | – | – | – | – |
| EEG-C3 | 0.58 ± 0.26 | 0.27 ± 0.24 | – | – | – | – | – |
| EEG-T7 | 0.61 ± 0.29 | 0.48 ± 0.23 | – | – | – | – | – |
| EEG-Fp2 | 0.70 ± 0.25 | 0.54 ± 0.17 | – | – | – | – | – |
| EEG-F4 | 0.43 ± 0.29 | 0.73 ± 0.26 | – | – | – | – | – |
| EEG-C4 | 0.74 ± 0.24 | 0.72 ± 0.11 | – | – | – | – | – |
| EEG-T8 | 0.68 ± 0.28 | 0.72 ± 0.21 | – | – | – | – | – |
| Electrode Channel | Simulator/Flight Tasks-Flight DS:CLX [Normalized ] | ||||||
| Task 1 | Task 2 | Task 3 | Task 4 | Task 5 | Task 6 | Task 7 | |
| EEG-Fp1 | 0.05 | 0.01 | – | – | – | – | – |
| EEG-F3 | 0.04 | 0.10 | – | – | – | – | – |
| EEG-C3 | 0.07 | 0.06 | – | – | – | – | – |
| EEG-T7 | 0.08 | 0.05 | – | – | – | – | – |
| EEG-Fp2 | 0.06 | 0.03 | – | – | – | – | – |
| EEG-F4 | 0.08 | 0.07 | – | – | – | – | – |
| EEG-C4 | 0.06 | 0.01 | – | – | – | – | – |
| EEG-T8 | 0.08 | 0.04 | – | – | – | – | – |
Table A12.
, and of -band, 31–39 Hz and 40 Hz of the flight dataset CL3 (beginner-level volunteer).
| Electrode Channel | Simulator/Flight Tasks-Flight DS:CL3 [Normalized ] | ||||||
|---|---|---|---|---|---|---|---|
| Task 1 | Task 2 | Task 3 | Task 4 | Task 5 | Task 6 | Task 7 | |
| EEG-Fp1 | 0.59 ± 0.05 | 0.51 ± 0.20 | 0.56 ± 0.23 | 0.59 ± 0.20 | 0.48 ± 0.08 | 0.51 ± 0.06 | 0.49 ± 0.06 |
| EEG-F3 | 0.54 ± 0.10 | 0.46 ± 0.22 | 0.23 ± 0.10 | 0.49 ± 0.17 | 0.59 ± 0.06 | 0.81 ± 0.11 | 0.79 ± 0.13 |
| EEG-C3 | 0.31 ± 0.24 | 0.69 ± 0.18 | 0.20 ± 0.10 | 0.55 ± 0.19 | 0.78 ± 0.16 | 0.73 ± 0.15 | 0.67 ± 0.20 |
| EEG-T7 | 0.88 ± 0.08 | 0.54 ± 0.25 | 0.32 ± 0.16 | 0.41 ± 0.15 | 0.32 ± 0.11 | 0.49 ± 0.10 | 0.25 ± 0.06 |
| EEG-Fp2 | 0.53 ± 0.09 | 0.40 ± 0.21 | 0.45 ± 0.27 | 0.65 ± 0.10 | 0.64 ± 0.23 | 0.75 ± 0.10 | 0.49 ± 0.26 |
| EEG-F4 | 0.80 ± 0.10 | 0.56 ± 0.21 | 0.45 ± 0.16 | 0.68 ± 0.09 | 0.47 ± 0.09 | 0.49 ± 0.16 | 0.66 ± 0.09 |
| EEG-C4 | 0.78 ± 0.12 | 0.42 ± 0.19 | 0.30 ± 0.09 | 0.39 ± 0.10 | 0.39 ± 0.09 | 0.46 ± 0.13 | 0.53 ± 0.08 |
| EEG-T8 | 0.77 ± 0.18 | 0.39 ± 0.25 | 0.27 ± 0.12 | 0.28 ± 0.15 | 0.36 ± 0.11 | 0.64 ± 0.17 | 0.58 ± 0.15 |
| Electrode Channel | Simulator/Flight Tasks-Flight DS:CL3 [Normalized ] | ||||||
| Task 1 | Task 2 | Task 3 | Task 4 | Task 5 | Task 6 | Task 7 | |
| EEG-Fp1 | 0.00 | 0.04 | 0.05 | 0.04 | 0.01 | 0.00 | 0.00 |
| EEG-F3 | 0.01 | 0.05 | 0.01 | 0.03 | 0.00 | 0.01 | 0.02 |
| EEG-C3 | 0.06 | 0.03 | 0.01 | 0.04 | 0.03 | 0.02 | 0.04 |
| EEG-T7 | 0.01 | 0.06 | 0.03 | 0.02 | 0.01 | 0.01 | 0.00 |
| EEG-Fp2 | 0.01 | 0.04 | 0.07 | 0.01 | 0.05 | 0.01 | 0.07 |
| EEG-F4 | 0.01 | 0.04 | 0.03 | 0.01 | 0.01 | 0.03 | 0.01 |
| EEG-C4 | 0.01 | 0.04 | 0.01 | 0.01 | 0.01 | 0.02 | 0.01 |
| EEG-T8 | 0.03 | 0.06 | 0.01 | 0.02 | 0.01 | 0.03 | 0.02 |
Figure A1, Figure A2, Figure A3, Figure A4, Figure A5, Figure A6 and Figure A7 show the brain magnitudes of several lobes along each proposed flight tasks and volunteers’ expertise.
Figure A1.
Mean of magnitudes by tasks and lobes of the flight dataset CL3 (beginner-level volunteer).
Figure A1.
Mean of magnitudes by tasks and lobes of the flight dataset CL3 (beginner-level volunteer).

Figure A2.
Mean of magnitudes by tasks and lobes of the flight dataset CR1 (beginner-level volunteer).
Figure A2.
Mean of magnitudes by tasks and lobes of the flight dataset CR1 (beginner-level volunteer).

Figure A3.
Mean of magnitudes by tasks and lobes, of the flight dataset CR3 (beginner level volunteer).
Figure A3.
Mean of magnitudes by tasks and lobes, of the flight dataset CR3 (beginner level volunteer).

Figure A4.
Mean of magnitudes by tasks and lobes of the flight dataset GC3 (mid-level volunteer).

Figure A5.
Mean of magnitudes by tasks and lobes of the flight dataset LS1 (mid-level volunteer).

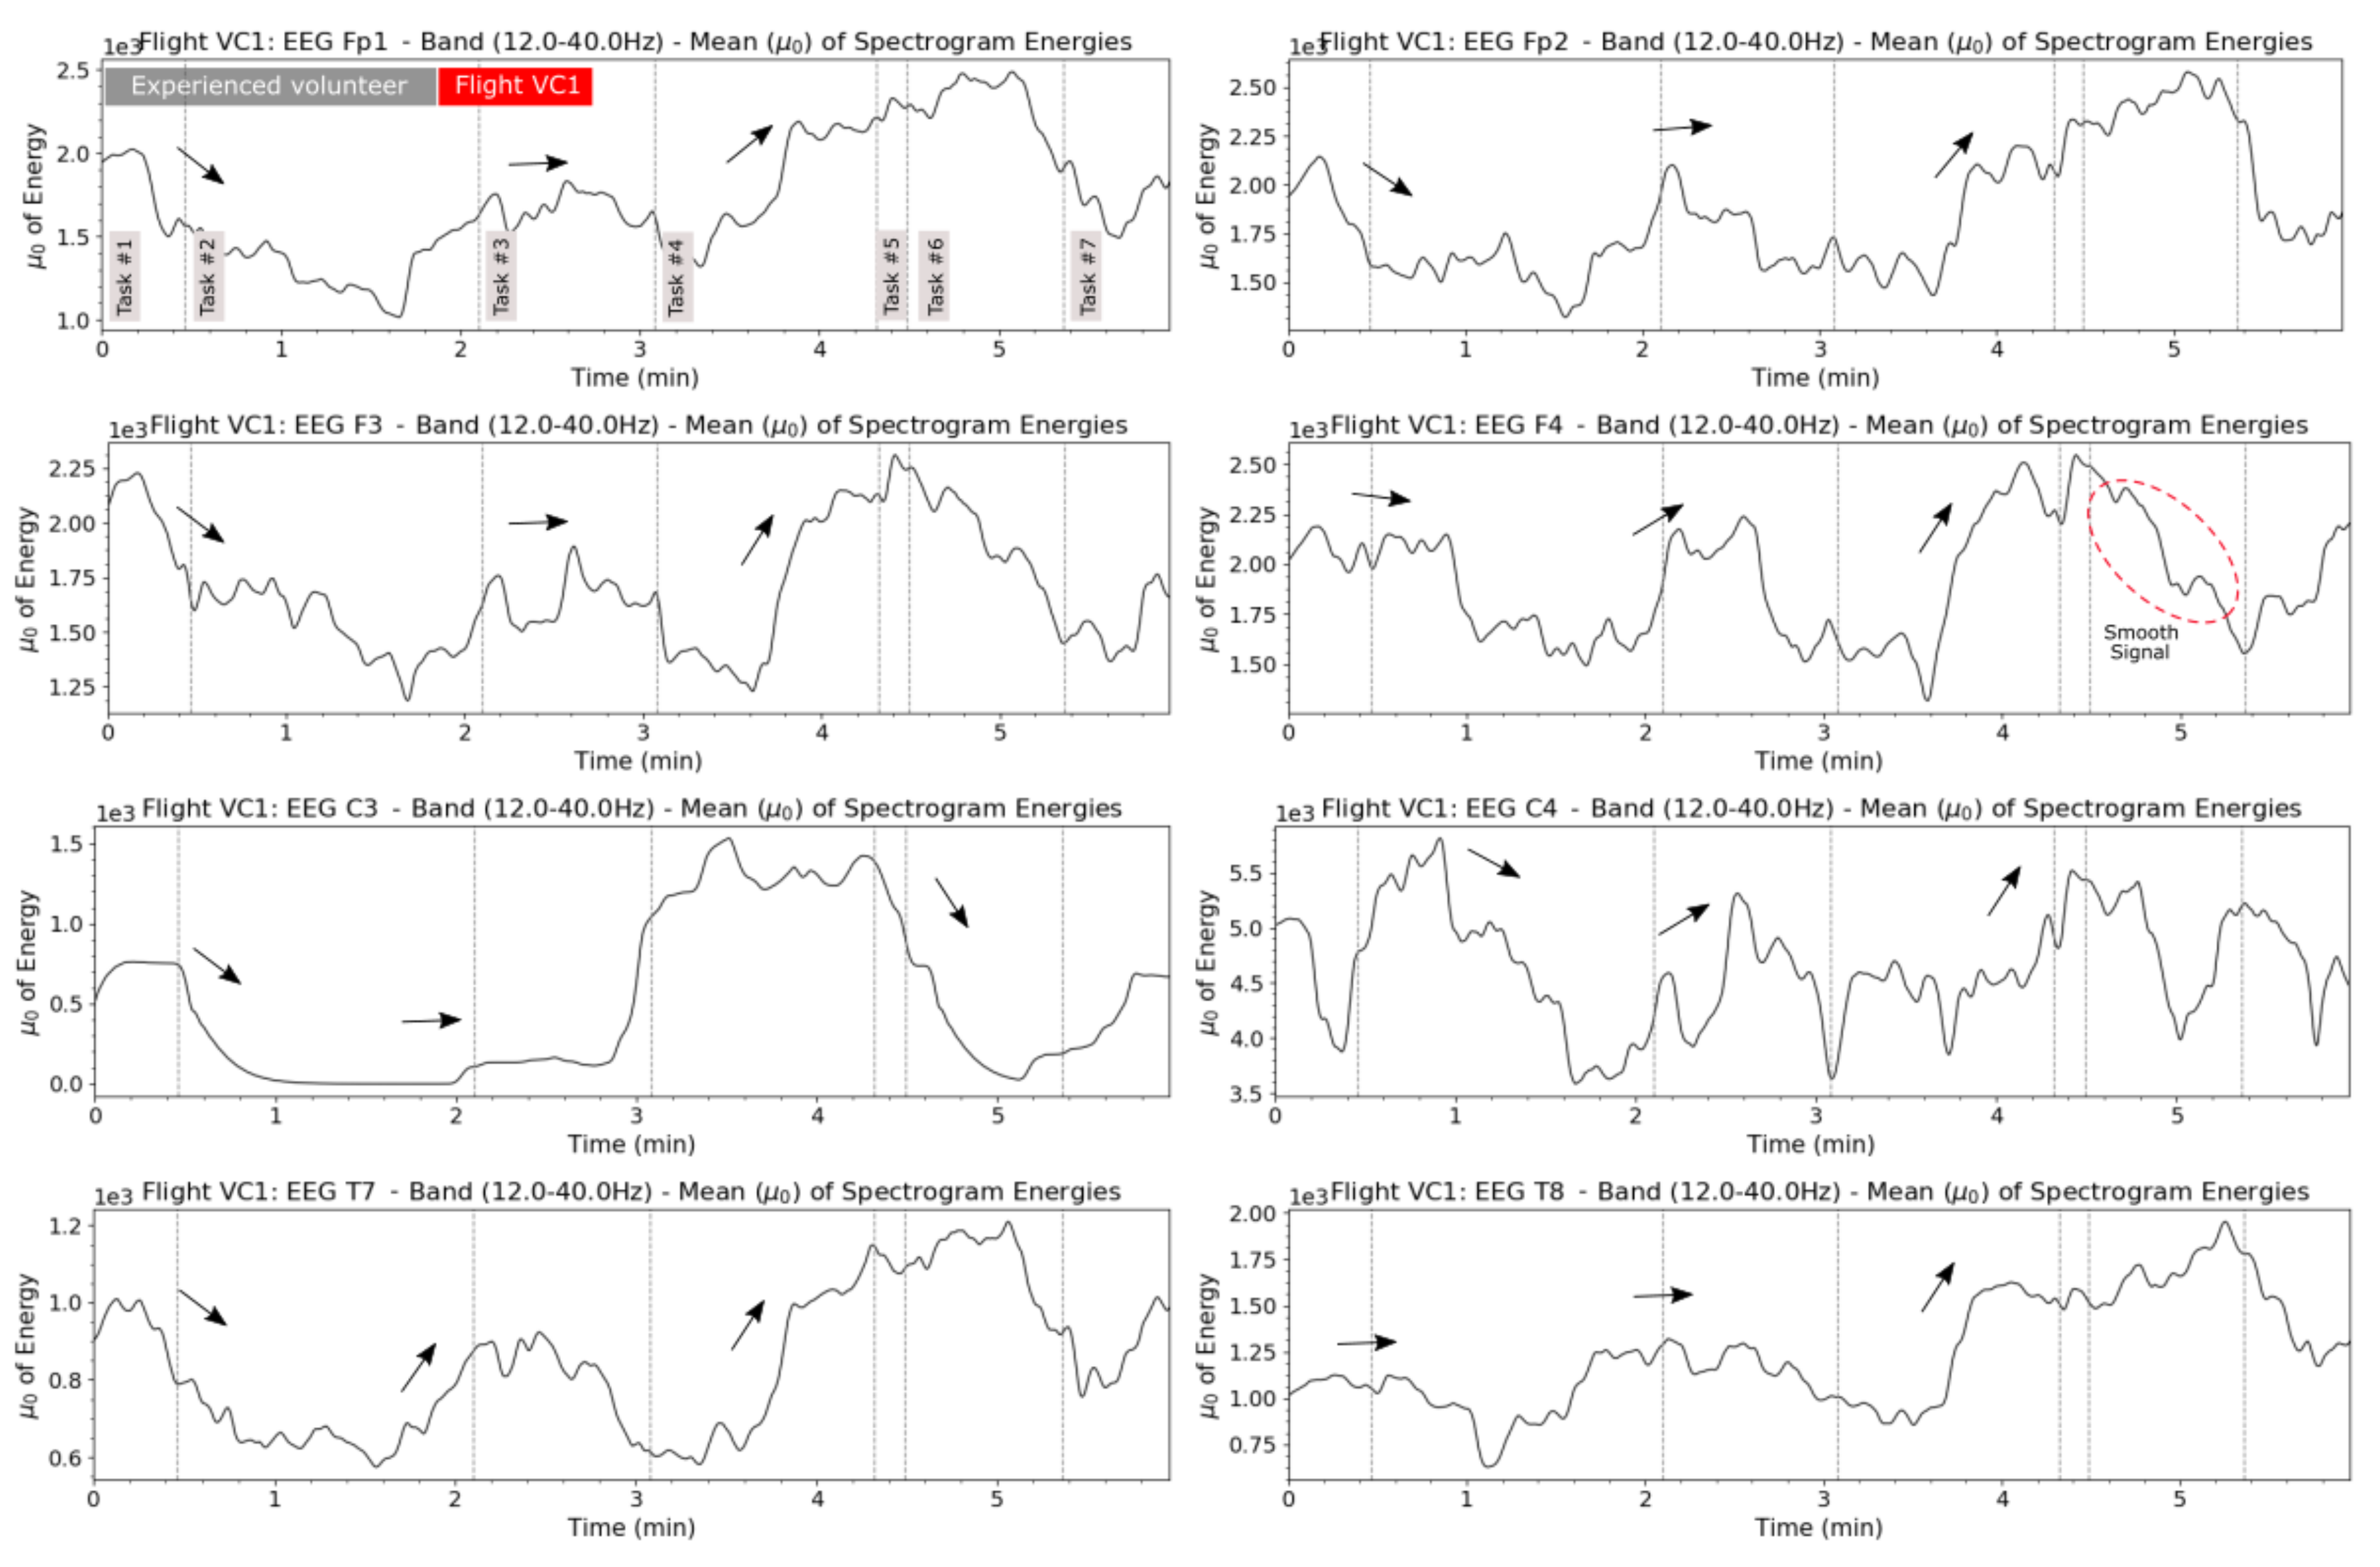
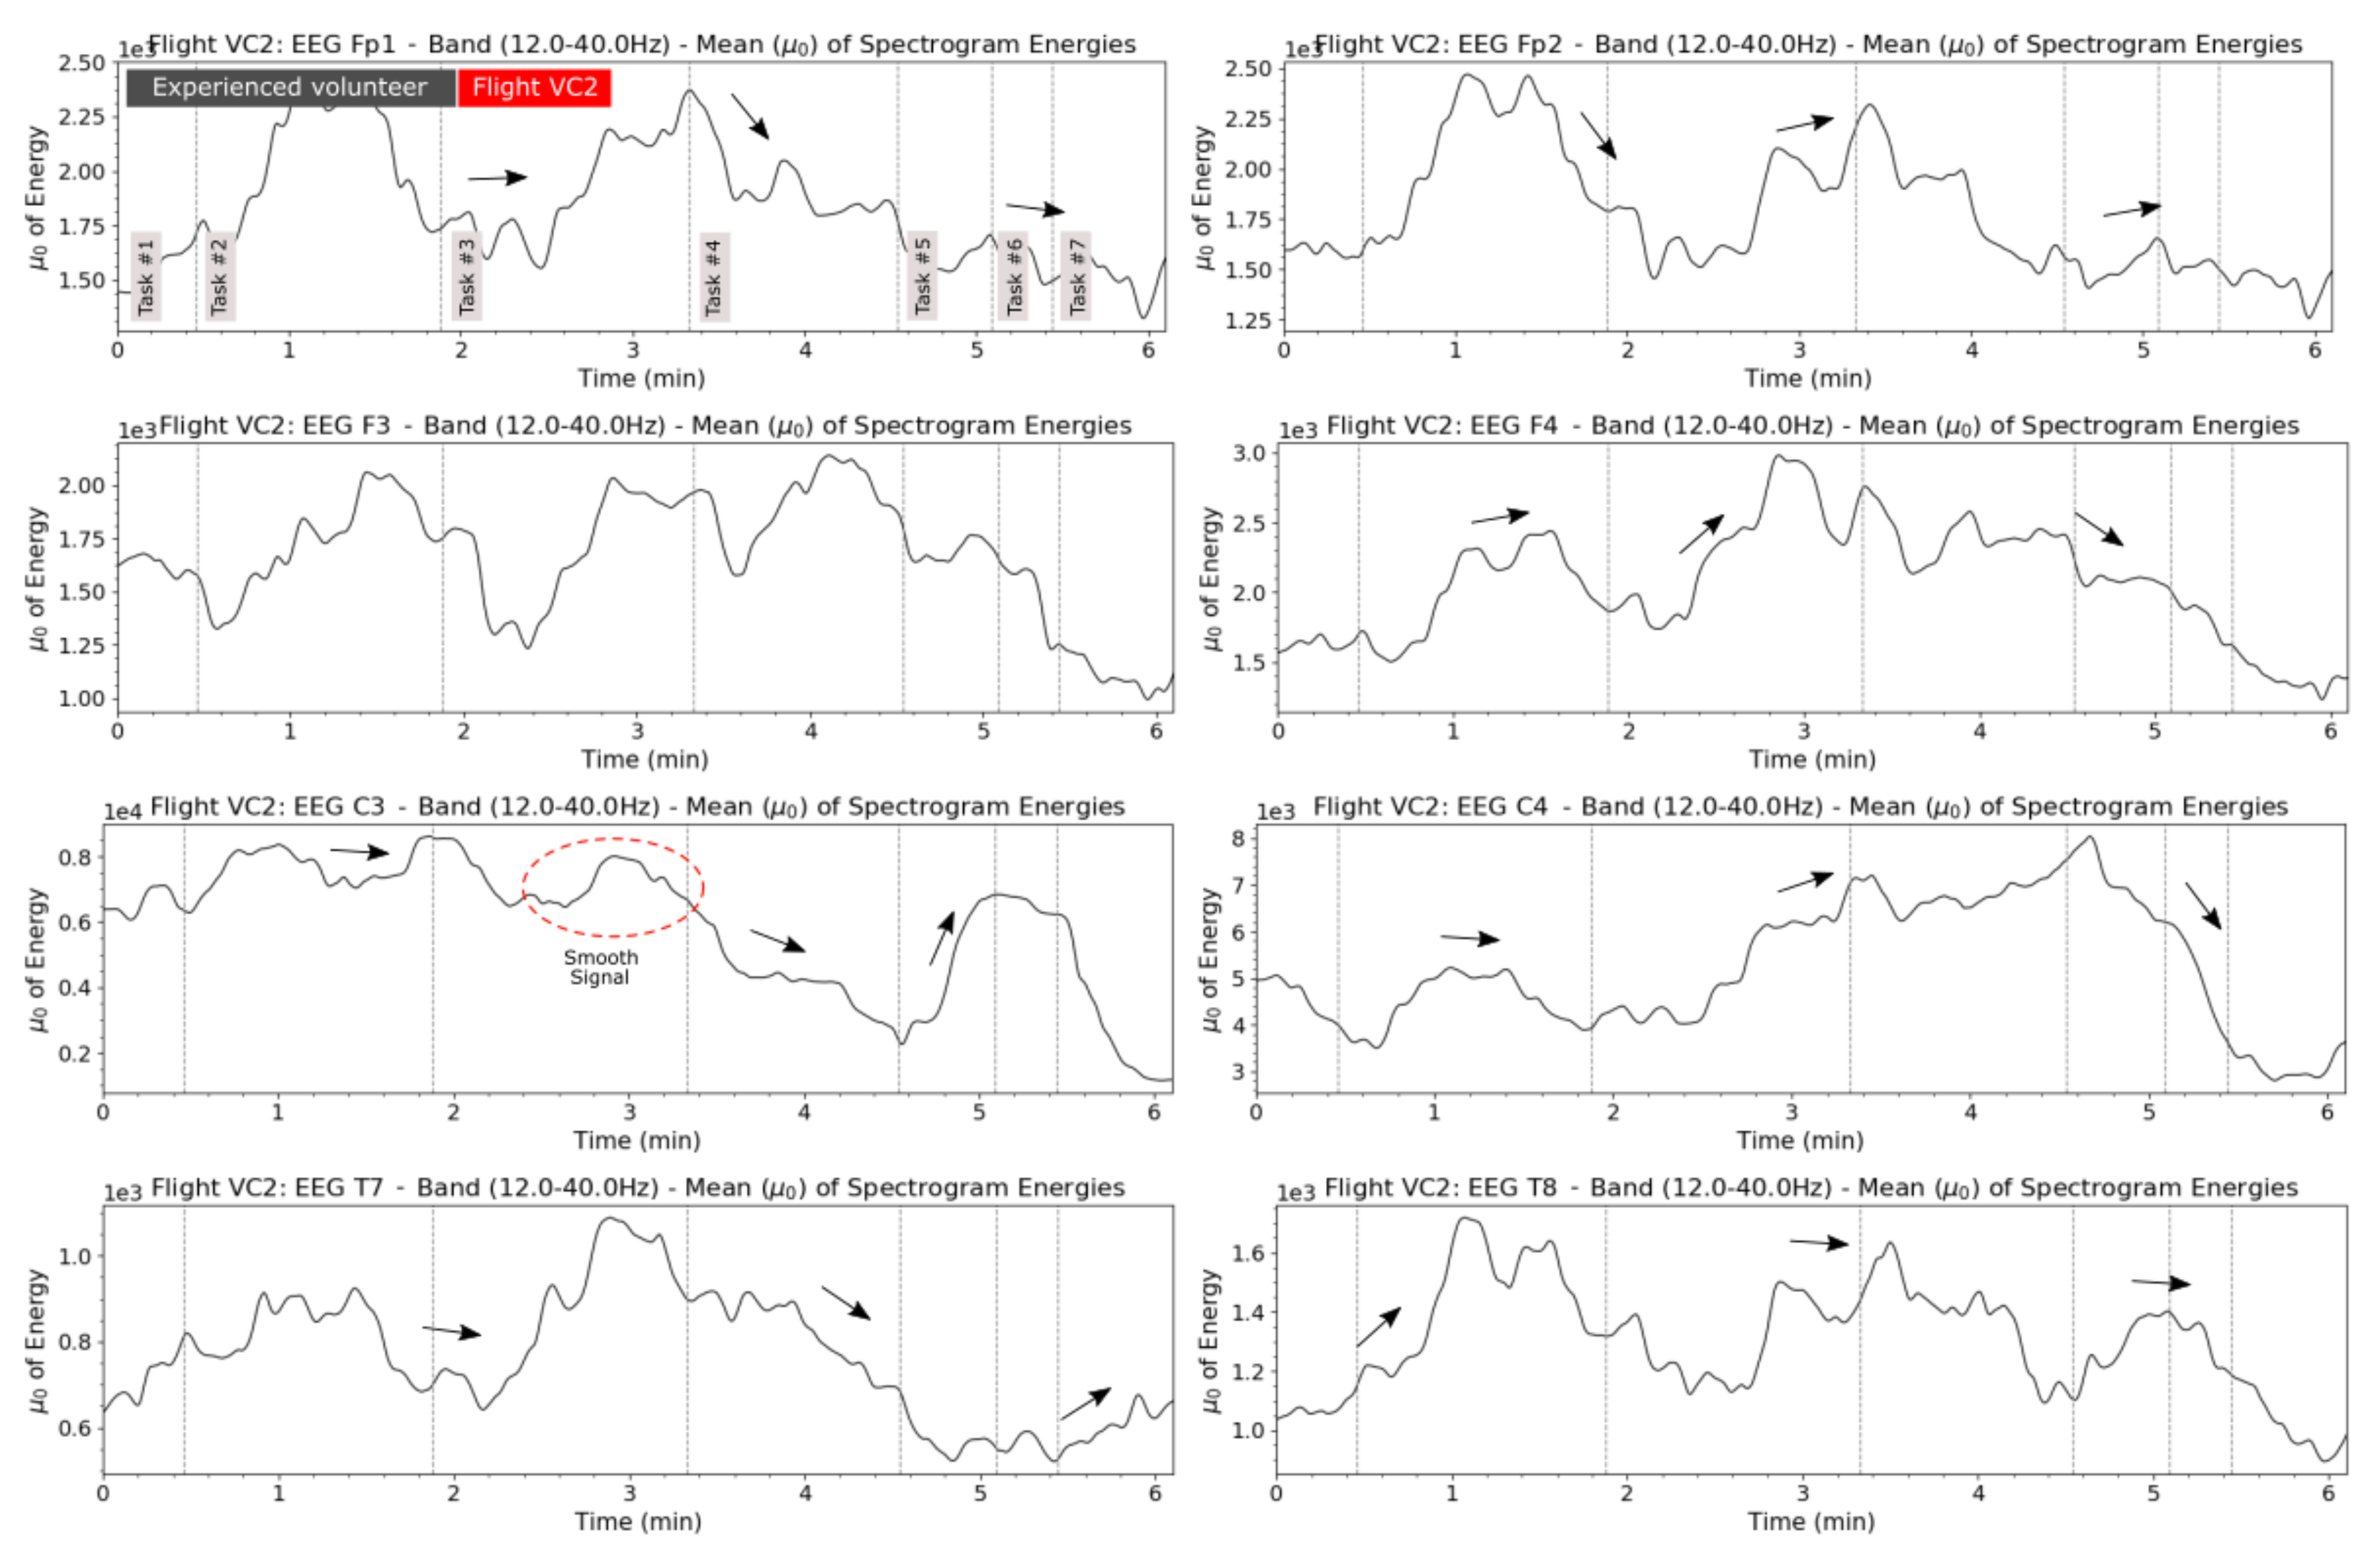
Figure A6 and Figure A7 show smoother signals, having less abrupt variation over a short window of time, compared to the signal variation and shape of the beginner and mid-level volunteers.
Figure A6.
Mean of magnitudes by tasks and lobes of the flight dataset VC1 (experienced volunteer).

Figure A7.
Mean of magnitudes by tasks and lobes of the flight dataset VC2 (experienced volunteer).

Based on all these analyses, it is possible to conclude that a significant amount training for each different flight and aircraft is the key point to produce low amplitudes of brain activity, and for this reason, volunteers of different expertise may sometimes reflect similar -band patterns if they are not confident in some flight moment. Training is the key to a successful flight, and this work tries to show clearly the need to provide pilots with more trianing to avoid several problems during the flight.
Regarding to these low amplitudes and signal variations (smoothness) over time on flights VC1 and VC2 compared to other flight datasets, it may mean that the volunteer is more relaxed during the flight, presenting less brain oscillations over short time periods. This makes sense, since the volunteers of flights VC1 and VC2 was reported to be confident with the proposed flight tasks and aircraft commands; sometimes, he is also said to push himself to execute the tasks as well as possible.
References
- IATA. IATA Releases 2019 Airline Safety Report. In International Air Transport Association (IATA); IATA: Montreal, QC, Canada, 2020; pp. 1–4. [Google Scholar]
- Boeing. Statistical Summary of Commercial Jet Airplane Accidents-Boeing Aerospace Company. In Worldwide Operations | 1959–2016; Boeing: Chicago, IL, USA, 2017; pp. 1–26. [Google Scholar]
- ICAO. Accident Statistics; Aviation Safety-International Civil Aviation Organization: Montreal, QC, Canada, 2017. [Google Scholar]
- Walton, A.; University, L.; Baumann, C.; Institute, A.A.S.; Geske, R.C. Fatal Flight Training: Accident Report 2000–2015; Liberty University and AOPA Air Safety Institute: Frederick, MA, USA, 2016; pp. 1–11. [Google Scholar]
- Roza, V.C.C.; Postolache, O.A. Multimodal Approach for Emotion Recognition Based on Simulated Flight Experiments. Sensors 2019, 19, 5516. [Google Scholar] [CrossRef] [PubMed] [Green Version]
- Roza, V.C.C.; Groza, V.; Pereira, J.D.; Postolache, O.A. Emotion Assessment on Simulated Flights. In Proceedings of the 14th IEEE International Symposium on Medical Measurements & Applications (MEMEA 2019), Istanbul, Turkey, 26–28 June 2019; Volume 14, pp. 1–6. [Google Scholar]
- Roza, V.C.C.; Postolache, O.A. Emotion Analysis Architecture Based on Face and Physiological Sensing Applied with Flight Simulator. In Proceedings of the 2018 International Conference and Exposition on Electrical and Power Engineering (EPE), Iasi, Romania, 18–19 October 2018; pp. 1036–1040. [Google Scholar] [CrossRef]
- Roza, V.C.C.; Postolache, O.A. Citizen emotion analysis in Smart City. In Proceedings of the 2016 7th International Conference on Information, Systems & Applications (IISA), Chalkidiki, Greece, 13–15 July 2016; Volume 1, pp. 1–6. [Google Scholar] [CrossRef]
- Benoit, A.; Bonnaud, L.; Caplier, A.; Ngo, P.; Lawson, L.; Trevisan, D.; Levacic, V.; Mancas, C.; Chanel, G. Multimodal Focus Attention and Stress Detection and Feedback in an Augmented Driver Simulator. In Proceedings of the IFIP International Conference on Artificial Intelligence Applications and Innovations; Springer: Boston, MA, USA, 2006; Volume 204, pp. 337–344. [Google Scholar] [CrossRef] [Green Version]
- Kucikienė, D.; Praninskienė, R. The impact of music on the bioelectrical oscillations of the brain. Acta Med. Litu 2018, 25, 101–106. [Google Scholar] [CrossRef] [PubMed] [Green Version]
- IATA. Environmental Factors Affecting Loss of Control In-Flight: Best Practice for Threat Recognition & Management. In The International Air Transport Association (IATA); IATA: Montreal, QC, Canada, 2016; Volume 1, pp. 1–33. [Google Scholar]
- ANAC. Stabilised Approach Report—Aproximação Estabilizada. In Grupo Brasileiro de Segurança Operacional da Aviação; ANAC: Brasília, Brazil, 2019; pp. 1–2. [Google Scholar]
- Ancel, E.; Shih, A.T. The Analysis of the Contribution of Human Factors to the In-flight Loss of Control Accidents. In Proceedings of the 12th AIAA Aviation Technology, Integration and Operations (ATIO) Conference, Indianapolis, Indiana, 17–19 September 2012; pp. 1–13. [Google Scholar]
- McKay, M.P.; Groff, L. 23 years of toxicology testing fatally injured pilots: Implications for aviation and other modes of transportation. Accid. Anal. Prev. 2016, 90, 108–117. [Google Scholar] [CrossRef] [PubMed]
- Bendak, S.; Rashid, H.S. Fatigue in aviation: A systematic review of the literature. Int. J. Ind. Ergon. 2020, 76, 102928. [Google Scholar] [CrossRef]
- Kandera, B.; Škultéty, F.; Mesárošová, K. Consequences of flight crew fatigue on the safety of civil aviation. Transp. Res. Procedia 2019, 43, 278–289. [Google Scholar] [CrossRef]
- Kaya, H.; Gurpinar, F.; Salah, A. Video-based emotion recognition in the wild using deep transfer learning and score fusion. Image Vis. Comput. 2017, 65, 66–75. [Google Scholar] [CrossRef]
- Harrivel, A.; Pope, A. Prediction of Cognitive States during Flight Simulation using Multimodal Psychophysiological Sensing. Inf. Syst. AIAA Infotech Aerosp. 2017, 1, 1–10. [Google Scholar]
- Wang, X.; Gong, G.; Li, N.; Ding, L. Use of multimodal physiological signals to explore pilots’ cognitive behaviour during flight strike task performance. Med. Novel Technol. Devices 2020, 5, 100030. [Google Scholar] [CrossRef]
- Novak, D.; Mihelj, M.; Ziherl, J.; Olensek, A.; Munih, M. Psychophysiological Measurements in a Biocooperative Feedback Loop for Upper Extremity Rehabilitation. IEEE Trans. Neural Syst. Rehabil. Eng. 2011, 19, 400–410. [Google Scholar] [CrossRef] [PubMed]
- Steam; Microsoft. Microsoft Flight Simulator X: Steam Edition. 2006. Available online: https://store.steampowered.com/app/314160/Microsoft_Flight_Simulator_X_Steam_Edition/ (accessed on 1 August 2018).
- Murugappan, M.; Nagarajan, R.; Yaacob, S. Discrete Wavelet Transform Based Selection of Salient EEG Frequency Band for Assessing Human Emotions. In Discrete Wavelet Transforms-Biomedical Applications; IntechOpen: Seriab, Malaysia; Kangar, Malaysia, 2011; pp. 33–52. [Google Scholar] [CrossRef] [Green Version]
- Min, Y.K.; Chung, S.C.; Min, B.C. Physiological Evaluation on Emotional Change Induced by Imagination. Appl. Psychophysiol. Biofeedback 2005, 30, 137–150. [Google Scholar] [CrossRef] [PubMed]
- Umeda, S. Emotion, Personality, and the Frontal Lobe. In Emotions of Animals and Humans: Comparative Perspectives; Watanabe, S., Kuczaj, S., Eds.; Springer: Tokyo, Japan, 2013; pp. 223–241. [Google Scholar] [CrossRef]
- Rosso, I.M.; Young, A.D.; Femia, L.A.; Yurgelun-Todd, D.A. Cognitive and emotional components of frontal lobe functioning in childhood and adolescence. Ann. N. Y. Acad. Sci. 2004, 1021, 355–362. [Google Scholar] [CrossRef] [PubMed]
- Othman, M.; Wahab, A.; Karim, I.; Dzulkifli, M.A.; Alshaikli, I.F.T. EEG Emotion Recognition Based on the Dimensional Models of Emotions. Procedia-Soc. Behav. Sci. 2013, 97, 30–37. [Google Scholar] [CrossRef] [Green Version]
- Kropotov, J.D. Beta Rhythms. Quantitative EEG, Event-Related Potentials and Neurotherapy; Academic Press: Cambridge, MA, USA, 2009; pp. 59–77. [Google Scholar] [CrossRef]
- Khanna, P.; Carmena, J.M. Beta band oscillations in motor cortex reflect neural population signals that delay movement onset. eLife 2017, 6, 1–31. [Google Scholar] [CrossRef] [PubMed]
- Woaswi, W.; Hanif, M.; Mohamed, S.; Hamzah, N.; Ismael Rizman, Z. Human Emotion Detection via Brain Waves Study by Using Electroencephalogram (EEG). Int. J. Adv. Sci. Eng. Inf. Technol. 2016, 6, 1005. [Google Scholar] [CrossRef] [Green Version]
- Ritter, P.; Moosmann, M.; Villringer, A. Rolandic alpha and beta EEG rhythms’ strengths are inversely related to fMRI-BOLD signal in primary somatosensory and motor cortex. Hum. Brain Mapp. 2009, 30, 1168–1187. [Google Scholar] [CrossRef]
- Julius, O.S. Introduction to Digital Filters—With Audio Applications, 2nd ed.; BookSurge: Charleston, SC, USA, 2008; pp. 1–460. ISBN 978-0-9745607-1-7. [Google Scholar]
- Oppenheim, A.V.; Verghese, G.C. Signals, Systems and Inference. Prentice Hall 2015, 1, 1–561. [Google Scholar]
- Aldhous, P. Why confidence matters more than expertise. New Sci. 2009, 202, 15. [Google Scholar] [CrossRef]
- Kawamura, K. Confidence and Competence in Expertise; Semantic Scholar–Psychology; ResearchGate: Berlin, Germany, 2007. [Google Scholar]
- Chung, J.W.; Burciu, R.G.; Ofori, E.; Coombes, S.A.; Christou, E.A.; Okun, M.S.; Hess, C.W.; Vaillancourta, D.E. Beta-band oscillations in the supplementary motor cortex are modulated by levodopa and associated with functional activity in the basal ganglia. Neuroimage Clin. 2018, 19, 559–571. [Google Scholar] [CrossRef]
- Chung, J.W.; Ofori, E.; Misra, G.; Hess, C.W.; Vaillancourt, D.E. Beta-band Activity and Connectivity in Sensorimotor and Parietal Cortex are Important for Accurate Motor Performance. Neuroimage 2016, 144, 164–173. [Google Scholar] [CrossRef] [Green Version]
Figure 1.
General multimodal sensing architecture developed in this work.

Figure 2.
Setup used in the main experiment.

Figure 3.
Experiment setup. Volunteer side (left); supervisor side (right).

Figure 4.
EEG’s accelerometer output of the double head shaking movement.

Figure 5.
Electrodes placed on the scalp and ear and the EEG + accelerometer Bluetooth device.

Figure 6.
Filtering output over EEG data regarding the -band.

Figure 7.
Distribution of fatal accidents by civil aviation (Boeing report) and general accidents (proposed experiment) (adapted from [2]).
Figure 7.
Distribution of fatal accidents by civil aviation (Boeing report) and general accidents (proposed experiment) (adapted from [2]).

Figure 8.
Spectrogram of the flight dataset RC1-frontal left lobe (Fp1). (a) Processed 12–40 Hz data; (b) Raw data spectrogram; (c) Spectrogram of the processed 12–40 Hz data; (d) Processed data on delimited Y-axis; (e) Grayscale spectrogram with tasks delimitation.
Figure 8.
Spectrogram of the flight dataset RC1-frontal left lobe (Fp1). (a) Processed 12–40 Hz data; (b) Raw data spectrogram; (c) Spectrogram of the processed 12–40 Hz data; (d) Processed data on delimited Y-axis; (e) Grayscale spectrogram with tasks delimitation.

Figure 9.
Spectrogram of the flight dataset RC1-temporal right lobe (T8).

Figure 10.
Mean of spectrogram magnitudes of the flight dataset RC1-temporal left and right lobes (T7 and T8).
Figure 10.
Mean of spectrogram magnitudes of the flight dataset RC1-temporal left and right lobes (T7 and T8).

Figure 11.
Spectrogram of the flight dataset CR1-frontal left lobe (F3). (a) Processed 12–40 Hz data; (b) Spectrogram of the processed 12–40 Hz data; (c) Grayscale spectrogram with tasks delimitation; (d) Mean of spectrogram energies.
Figure 11.
Spectrogram of the flight dataset CR1-frontal left lobe (F3). (a) Processed 12–40 Hz data; (b) Spectrogram of the processed 12–40 Hz data; (c) Grayscale spectrogram with tasks delimitation; (d) Mean of spectrogram energies.

Figure 12.
Spectrogram of the flight dataset CR3-temporal left lobe (T7). (a) Processed 12–40 Hz data; (b) Spectrogram of the processed 12–40 Hz data; (c) Grayscale spectrogram with tasks delimitation; (d) Mean of spectrogram energies.
Figure 12.
Spectrogram of the flight dataset CR3-temporal left lobe (T7). (a) Processed 12–40 Hz data; (b) Spectrogram of the processed 12–40 Hz data; (c) Grayscale spectrogram with tasks delimitation; (d) Mean of spectrogram energies.

Figure 13.
Mean of spectrogram magnitudes of the flight dataset CR1 and LS2-frontal left lobe (F3).

Figure 14.
Normalized mean of the brain activities and the volunteers’ expertise (left lobe).

Figure 15.
Normalized mean of the brain activities and the volunteers’ expertise (right lobe).

Figure 16.
General mean of brain activities for each task according to the volunteers’ expertise.

Figure 17.
Mean of magnitudes by tasks of the flight dataset CR1-frontal left lobe (Fp1).

Figure 18.
Mean of magnitudes by tasks of the flight dataset CR1-frontal left lobe (Fp1).

Table 1.
Raw valid dataset description according to number of samples and time.
| Dataset | Face (5 Hz) | HR (10 Hz) | GSR (10 Hz) | EEG (500 Hz) × 8 Ch | ||
|---|---|---|---|---|---|---|
| (Raw) | Samples | Samples | Samples | Samples | Time (s) | Time (min) |
| DS:RC1 | 1877 | 3671 | 3671 | 190,000 | 373.80 | 6.23 |
| DS:RC2 | 1880 | 4247 | 4247 | 188,510 | 375.00 | 6.25 |
| DS:RC3 | 1784 | 3981 | 3981 | 178,498 | 355.80 | 5.93 |
| DS:GC1 | 1881 | 4081 | 4081 | 188,600 | 375.60 | 6.26 |
| DS:GC3 | 1842 | 4255 | 4255 | 184,600 | 366.60 | 6.11 |
| DS:LS1 | 2271 | 5558 | 5558 | 220,000 | 453.00 | 7.55 |
| DS:LS2 | 2043 | 4096 | 4096 | 198,500 | 405.60 | 6.76 |
| DS:VC1 | 1790 | 2611 | 2611 | 179,500 | 357.00 | 5.95 |
| DS:VC2 | 1831 | 2042 | 2042 | 183,400 | 366.00 | 6.10 |
| DS:CR1 | 1946 | 3998 | 3998 | 95,500 | 387.60 | 6.46 |
| DS:CR3 | 165 | 457 | 457 | 16,879 | 31.80 | 0.53 |
| DS:CLX | 237 | 518 | 518 | 18,000 | 45.60 | 0.76 |
| DS:CL3 | 2690 | 4722 | 4722 | 215,100 | 537.60 | 8.96 |
| Total: | 22,237 | 44,237 | 44,237 | 2,157,087 | 4431 | 73.85 |
Table 2.
Dataset description according to the flight experiment tasks.
| Dataset | Simulation/Flight Tasks | Result | Gender | ||||||
|---|---|---|---|---|---|---|---|---|---|
| Task 1 | Task 2 | Task 3 | Task 4 | Task 5 | Task 6 | Task 7 | |||
| DS:RC1 | × | × | × | × | × | × | − | Crash (collision) | Male |
| DS:RC2 | × | × | × | × | × | × | − | Crash (collision) | Male |
| DS:RC3 | × | × | × | × | × | × | × | A Landing | Male |
| DS:GC1 | × | × | × | × | × | × | × | S-Landing | Male |
| DS:GC3 | × | × | × | × | × | × | × | S-Landing | Male |
| DS:LS1 | × | × | × | × | × | − | − | Crash (collision) | Male |
| DS:LS2 | × | × | × | × | × | × | × | LS-Landing | Male |
| DS:VC1 | × | × | × | × | × | × | × | S-Landing | Male |
| DS:VC2 | × | × | × | × | × | × | × | S-Landing | Male |
| DS:CR1 | × | × | × | × | × | × | − | Crash (collision) | Female |
| DS:CR3 | × | − | − | − | − | − | − | Crash (stall) | Female |
| DS:CLX | × | − | − | − | − | − | − | Crash (collision) | Female |
| DS:CL3 | × | × | × | × | × | × | − | Crash (collision) | Female |
| Dataset | Invalid Flight Datasets | Result | Gender | ||||||
| Task 1 | Task 2 | Task 3 | Task 4 | Task 5 | Task 6 | Task 7 | |||
| DS:CL1 | × | × | × | × | × | × | − | Crash (collision) | Female |
| DS:CL2 | × | − | − | − | − | − | − | Crash (stall) | Female |
| DS:CR2 | × | × | × | × | × | − | − | Crash (collision) | Female |
| DS:JO1 | × | × | × | × | × | × | × | LS-Landing | Male |
| DS:GC2 | × | × | × | × | × | × | × | S-Landing | Male |
| DS:RN1 | × | × | × | × | × | × | − | Crash (collision) | Female |
| DS:RN2 | × | − | − | − | − | − | − | Crash (stall) | Female |
| DS:RN3 | × | × | × | × | × | × | − | Crash (collision) | Female |
Table 3.
, and of -band, 31–39 Hz and 40 Hz of the flight dataset CR1 (beginner level volunteer).
| Electrode Channel | Simulator/Flight Tasks-Flight DS:CR1 [Normalized ] | ||||||
|---|---|---|---|---|---|---|---|
| Task 1 | Task 2 | Task 3 | Task 4 | Task 5 | Task 6 | Task 7 | |
| EEG-Fp1 | 0.65 ± 0.22 | 0.48 ± 0.18 | 0.29 ± 0.15 | 0.41 ± 0.15 | 0.88 ± 0.12 | 0.69 ± 0.07 | 0.54 ± 0.10 |
| EEG-F3 | 0.51 ± 0.13 | 0.52 ± 0.23 | 0.18 ± 0.12 | 0.72 ± 0.19 | 0.85 ± 0.05 | 0.72 ± 0.14 | 0.68 ± 0.03 |
| EEG-C3 | 0.53 ± 0.12 | 0.35 ± 0.22 | 0.42 ± 0.21 | 0.72 ± 0.09 | 0.71 ± 0.07 | 0.71 ± 0.11 | 0.93 ± 0.06 |
| EEG-T7 | 0.48 ± 0.17 | 0.26 ± 0.11 | 0.24 ± 0.17 | 0.62 ± 0.25 | 0.36 ± 0.11 | 0.53 ± 0.15 | 0.82 ± 0.07 |
| EEG-Fp2 | 0.48 ± 0.08 | 0.42 ± 0.26 | 0.25 ± 0.13 | 0.52 ± 0.27 | 0.85 ± 0.10 | 0.58 ± 0.14 | 0.49 ± 0.12 |
| EEG-F4 | 0.54 ± 0.07 | 0.30 ± 0.17 | 0.50 ± 0.20 | 0.76 ± 0.06 | 0.81 ± 0.15 | 0.61 ± 0.15 | 0.84 ± 0.03 |
| EEG-C4 | 0.45 ± 0.23 | 0.51 ± 0.21 | 0.49 ± 0.28 | 0.72 ± 0.09 | 0.47 ± 0.05 | 0.66 ± 0.17 | 0.68 ± 0.06 |
| EEG-T8 | 0.43 ± 0.17 | 0.34 ± 0.14 | 0.48 ± 0.23 | 0.77 ± 0.11 | 0.61 ± 0.03 | 0.50 ± 0.08 | 0.56 ± 0.14 |
| Electrode Channel | Simulator/Flight Tasks-Flight DS:CR1 [Normalized ] | ||||||
| Task 1 | Task 2 | Task 3 | Task 4 | Task 5 | Task 6 | Task 7 | |
| EEG-Fp1 | 0.05 | 0.03 | 0.02 | 0.02 | 0.01 | 0.00 | 0.01 |
| EEG-F3 | 0.02 | 0.05 | 0.01 | 0.03 | 0.00 | 0.02 | 0.00 |
| EEG-C3 | 0.01 | 0.05 | 0.05 | 0.01 | 0.01 | 0.01 | 0.00 |
| EEG-T7 | 0.03 | 0.01 | 0.03 | 0.06 | 0.01 | 0.02 | 0.01 |
| EEG-Fp2 | 0.01 | 0.07 | 0.02 | 0.08 | 0.01 | 0.02 | 0.01 |
| EEG-F4 | 0.01 | 0.03 | 0.04 | 0.00 | 0.02 | 0.02 | 0.00 |
| EEG-C4 | 0.05 | 0.04 | 0.08 | 0.01 | 0.00 | 0.03 | 0.00 |
| EEG-T8 | 0.03 | 0.02 | 0.05 | 0.01 | 0.00 | 0.01 | 0.02 |
Publisher’s Note: MDPI stays neutral with regard to jurisdictional claims in published maps and institutional affiliations. |
© 2021 by the authors. Licensee MDPI, Basel, Switzerland. This article is an open access article distributed under the terms and conditions of the Creative Commons Attribution (CC BY) license (https://creativecommons.org/licenses/by/4.0/).
Share and Cite
MDPI and ACS Style
Roza, V.C.C.; Postolache, O. β-Band Analysis from Simulated Flight Experiments. Aerospace 2021, 8, 120. https://0-doi-org.brum.beds.ac.uk/10.3390/aerospace8050120
AMA Style
Roza VCC, Postolache O. β-Band Analysis from Simulated Flight Experiments. Aerospace. 2021; 8(5):120. https://0-doi-org.brum.beds.ac.uk/10.3390/aerospace8050120
Chicago/Turabian StyleRoza, Válber César Cavalcanti, and Octavian Postolache. 2021. "β-Band Analysis from Simulated Flight Experiments" Aerospace 8, no. 5: 120. https://0-doi-org.brum.beds.ac.uk/10.3390/aerospace8050120
Note that from the first issue of 2016, this journal uses article numbers instead of page numbers. See further details here.