
The Lunar Radiation Environment: Comparisons between PHITS, HETC-HEDS, and the CRaTER Instrument


1
Nuclear Engineering Department, University of Tennessee, Knoxville, TN 37996, USA
2
Earth, Oceans, and Space Science Center, University of New Hampshire, Durham, NH 03824, USA
*
Author to whom correspondence should be addressed.
Aerospace 2021, 8(7), 182; https://0-doi-org.brum.beds.ac.uk/10.3390/aerospace8070182
Submission received: 15 June 2021
/
Revised: 1 July 2021
/
Accepted: 5 July 2021
/
Published: 8 July 2021
Abstract
:Understanding the radiation environment near the lunar surface is a key step towards planning for future missions to the Moon. However, the complex variety of energies and particle types constituting the space radiation environment makes the process of replicating such environment very difficult in Earth-based laboratories. Radiation transport codes provide a practical alternative covering a wider range of particle energy, angle, and type than can be experimentally attainable. Comparing actual measurements with simulation results help in validating particle flux input models, and input collision models and databases involving nuclear and electromagnetic interactions. Thus, in this work, we compare the LET spectra simulated using the Monte Carlo transport code PHITS with measurements made by the CRaTER instrument that is currently orbiting the Moon studying its radiation environment. In addition, we utilize a feature in PHITS that allows the user to run the simulations without Vavilov energy straggling to test whether it is the root cause of erroneous phenomena exhibited in similar studies in literature. The results herein show good agreement between the LET spectra of PHITS and the CRaTER instrument. They also confirm that using a Vavilov distribution correction would ultimately provide a better agreement between CRaTER measurements and the previous LET spectra from the transport codes HETC-HEDS and HZETRN.
1. Introduction
With the increased interest in crewed missions to the Moon, it becomes important to properly understand the radiation environment near the lunar surface to assure the safety of future astronauts. One of the instruments currently orbiting the Moon to study its radiation environment is the Cosmic Ray Telescope for the Effects of Radiation (CRaTER) aboard the NASA’s Lunar Reconnaissance Orbiter (LRO), which was launched to lunar orbit in 2009. As described in [1],
A NASA-established LRO Objectives/Requirements Definition Team (ORDT) identifies the following high-priority objective for this initial robotic mission in the Lunar Exploration Program (LEP): “Characterization of the global lunar radiation environment and its biological impacts and potential mitigation, as well as investigation of shielding capabilities and validation of other deep space radiation mitigation strategies involving materials.”
In response, the CRaTER instrument was designed to satisfy this objective by characterizing the global lunar radiation environment and its biological impacts. The instrument investigates the effects on tissue-equivalent plastic (TEP) of incident galactic cosmic rays (GCR) and solar energetic particles (SEP) impinging in the detector, as well as any secondary radiation produced by their interactions, including interactions with the lunar surface, to inform constraints for models of biological response to radiation in the lunar environment. This is accomplished by measuring linear energy transfer (LET) spectra from approximately 0.1 keV m to 2.2 MeV m, behind different areal densities of TEP and levels of solar activity and GCR flux.
Since replicating the space radiation environment in Earth-based laboratories is a difficult process due the large variations in energies and particle types, radiation transport codes provide a practical alternative to study space radiation in wider ranges of particle energy, angle, and type than can be experimentally attainable. Comparing measured and simulated results helps in characterizing the experimental data, validating transport codes, and improving the understating of the underlying radiation mechanisms. The high energy aspect of the space radiation makes measurements by the CRaTER instrument a valuable database for transport code comparisons. They can be used for validating particle flux input models, and input collision models or databases involving nuclear and electromagnetic interactions.
Measurements by the CRaTER instrument were compared to several radiation transport codes including HETC-HEDS [2], HZERTN [3], Geant4 [4,5], and MCNP6 [6]. Analyses comparing LET spectra produced by HETC-HEDS and HZETRN simulations of measured LET spectra from the CRaTER instrument, obtained for the period from 29 June 2009 through 31 December 2010, were reported in [3]. Prior to that study, HETC-HEDS simulations had been previously used to characterize the CRaTER environment [2,7,8,9,10]. The 2014 Porter paper [3] also investigated utilizing measured LET data from CRaTER for purposes of validating space radiation transport codes, such as the NASA-standard deterministic code HZETRN [11]. In this work, we compare measurements made by the CRaTER instrument to the Monte Carlo radiation transport code PHITS [12]. PHITS has been previously used to study space radiation [13,14,15]. Here, we compare LET spectra measured by the CRaTER instrument during a period of solar minimum to the simulated results from PHITS.
In addition, as reported in [3], the agreement between HETC-HEDS LET results and the CRaTER measurements of LET was reasonably good except that the minimum ionizing peaks (MIPs) for the various ion species were much narrower and higher for HETC-HEDS than the CRaTER measurements. For HETC-HEDS, the proton peak was at ~0.39 keV m. The minimizing ionizing value obtained from Bethe–Bloch theory is 0.37 keV m [16]. The observed CRaTER data have a proton peak located at ~0.3 keV m, which is lower than the theoretical Bethe–Bloch value. For HETC-HEDS, the He peak was again located, using Bethe–Bloch theory, at higher LET values (~1.55 keV m) than the observed data peak of ~1.2 keV m for CRaTER. Two assumptions used in [3] HETC-HEDS input methodology resulted in the differences in location and magnitude between the MIPs for the HETC-HEDS LET spectra and the CRaTER LET spectra.
First, 100,000 particle histories for each incident ion type, energy, and direction of travel were separately discretized (as discussed in [3]), and input into the HETC-HEDS transport code. The output energies deposited per source particle were then recorded as single values in lookup tables for each incident particle discrete energy and angle within those bins. These tables were then folded with the June 2009 through December 2010 GCR spectrum to produce the LET spectra for comparison with the CRaTER measurements. In the present work, incident particle types, energies, and directions were selected from the continuous distributions provided by the Badhwar-O’Neill 2020 model, without discretizing the incident particle spectra into a subset of discrete energy and angle values [17].
Second, the authors in [3] suggested that the differences in MIP peak locations from HETC-HEDS may be due to using the average energy loss obtained from Bethe–Bloch theory in the calculation, whereas peaks in the CRaTER data reflect the most probable energy loss, since actual energy loss distributions in thin detectors follow the Landau–Vavilov form, with a peak (most probable) energy value that is always smaller than the mean. Investigating Vavilov distribution corrections in the HETC-HEDS simulations, postponed for future work in [3], is addressed in the present work.
2. Methodology
2.1. The CRaTER Instrument
The CRaTER instrument has been monitoring the radiation environment since entering lunar orbit in 2009. It consists of three stacks of silicon detectors pairs: D1/D2 pair facing deep space, D3/D4 pair in between two TEP volumes and the other detector pairs, and D5/D6 pair facing lunar surface. A detailed description of the instrument can be found in [1]. The detector of interest in this work is the D5/D6 detector. For a GCR particle to deposit energy in the D6 detector, it can either penetrate from the side of the detector, or enter from the D1/D2 detector pair passing through the D3/D4 detector pair and the two TEP volumes. Here, we focus on the particles triggering the three sets of detectors in a triple coincidence. The CRaTER data for flux of triple-coincident particles in the third detector pair as a function of LET were obtained from the CRaTER data products website, https://crater-web.sr.unh.edu (accessed on 5 June 2021). These data cover the time period of 26 November through 26 December 2009. The dates used in this study are selected to represent the solar minimum conditions of Solar Cycle 24. Although the measurements made by the CRaTER instrument are more accurately described as lineal energy (the energy deposited per mean chord length), they will be referred to in this work as LET.
2.2. PHITS
PHITS (Particle and Heavy Ion Transport code System) is a multipurpose Monte Carlo transport code developed by JAEA and other institutes [12]. The code allows the transport of all particles with various ranges of energies and emission angles. It utilizes different data libraries and physics models that are dependent on the energy of the transported particle. In this work, we use PHITS version 3.2 to simulate the energy deposited in CRaTER’s D6 detector. According to the manual:
In the transport process, PHITS can simulate a motion under external fields such as magnetic and gravity. Without the external fields, neutral particles move along a straight trajectory with constant energy up to the next collision point. However, charged particles and heavy ions interact many times with electrons in the material losing energy and changing direction. PHITS treats ionization processes not as collision but as a transport process under an external field. The average dE/dx is given by the charge density of the material and the momentum of the particle taking into account the fluctuations of the energy loss and the angular deviation. The second category of the physical processes is the collision with the nucleus in the material. In addition to the collision, we consider the decay of the particle as a process in this category. The total reaction cross section, or the lifetime of the particle, is an essential quantity in the determination of the mean free path of the transport particle. According to the mean free path, PHITS chooses the next collision point using the Monte Carlo method. To generate the secondary particles of the collision, we need the information on the final states of the collision. For neutron induced reactions in the low energy region, PHITS employs the cross sections from Evaluated Nuclear Data libraries. For high energy neutrons and other particles, we have incorporated two models, JAM [18] and JQMD [19], to simulate the particle induced reactions up to 200 GeV and the nucleus–nucleus collisions, respectively.
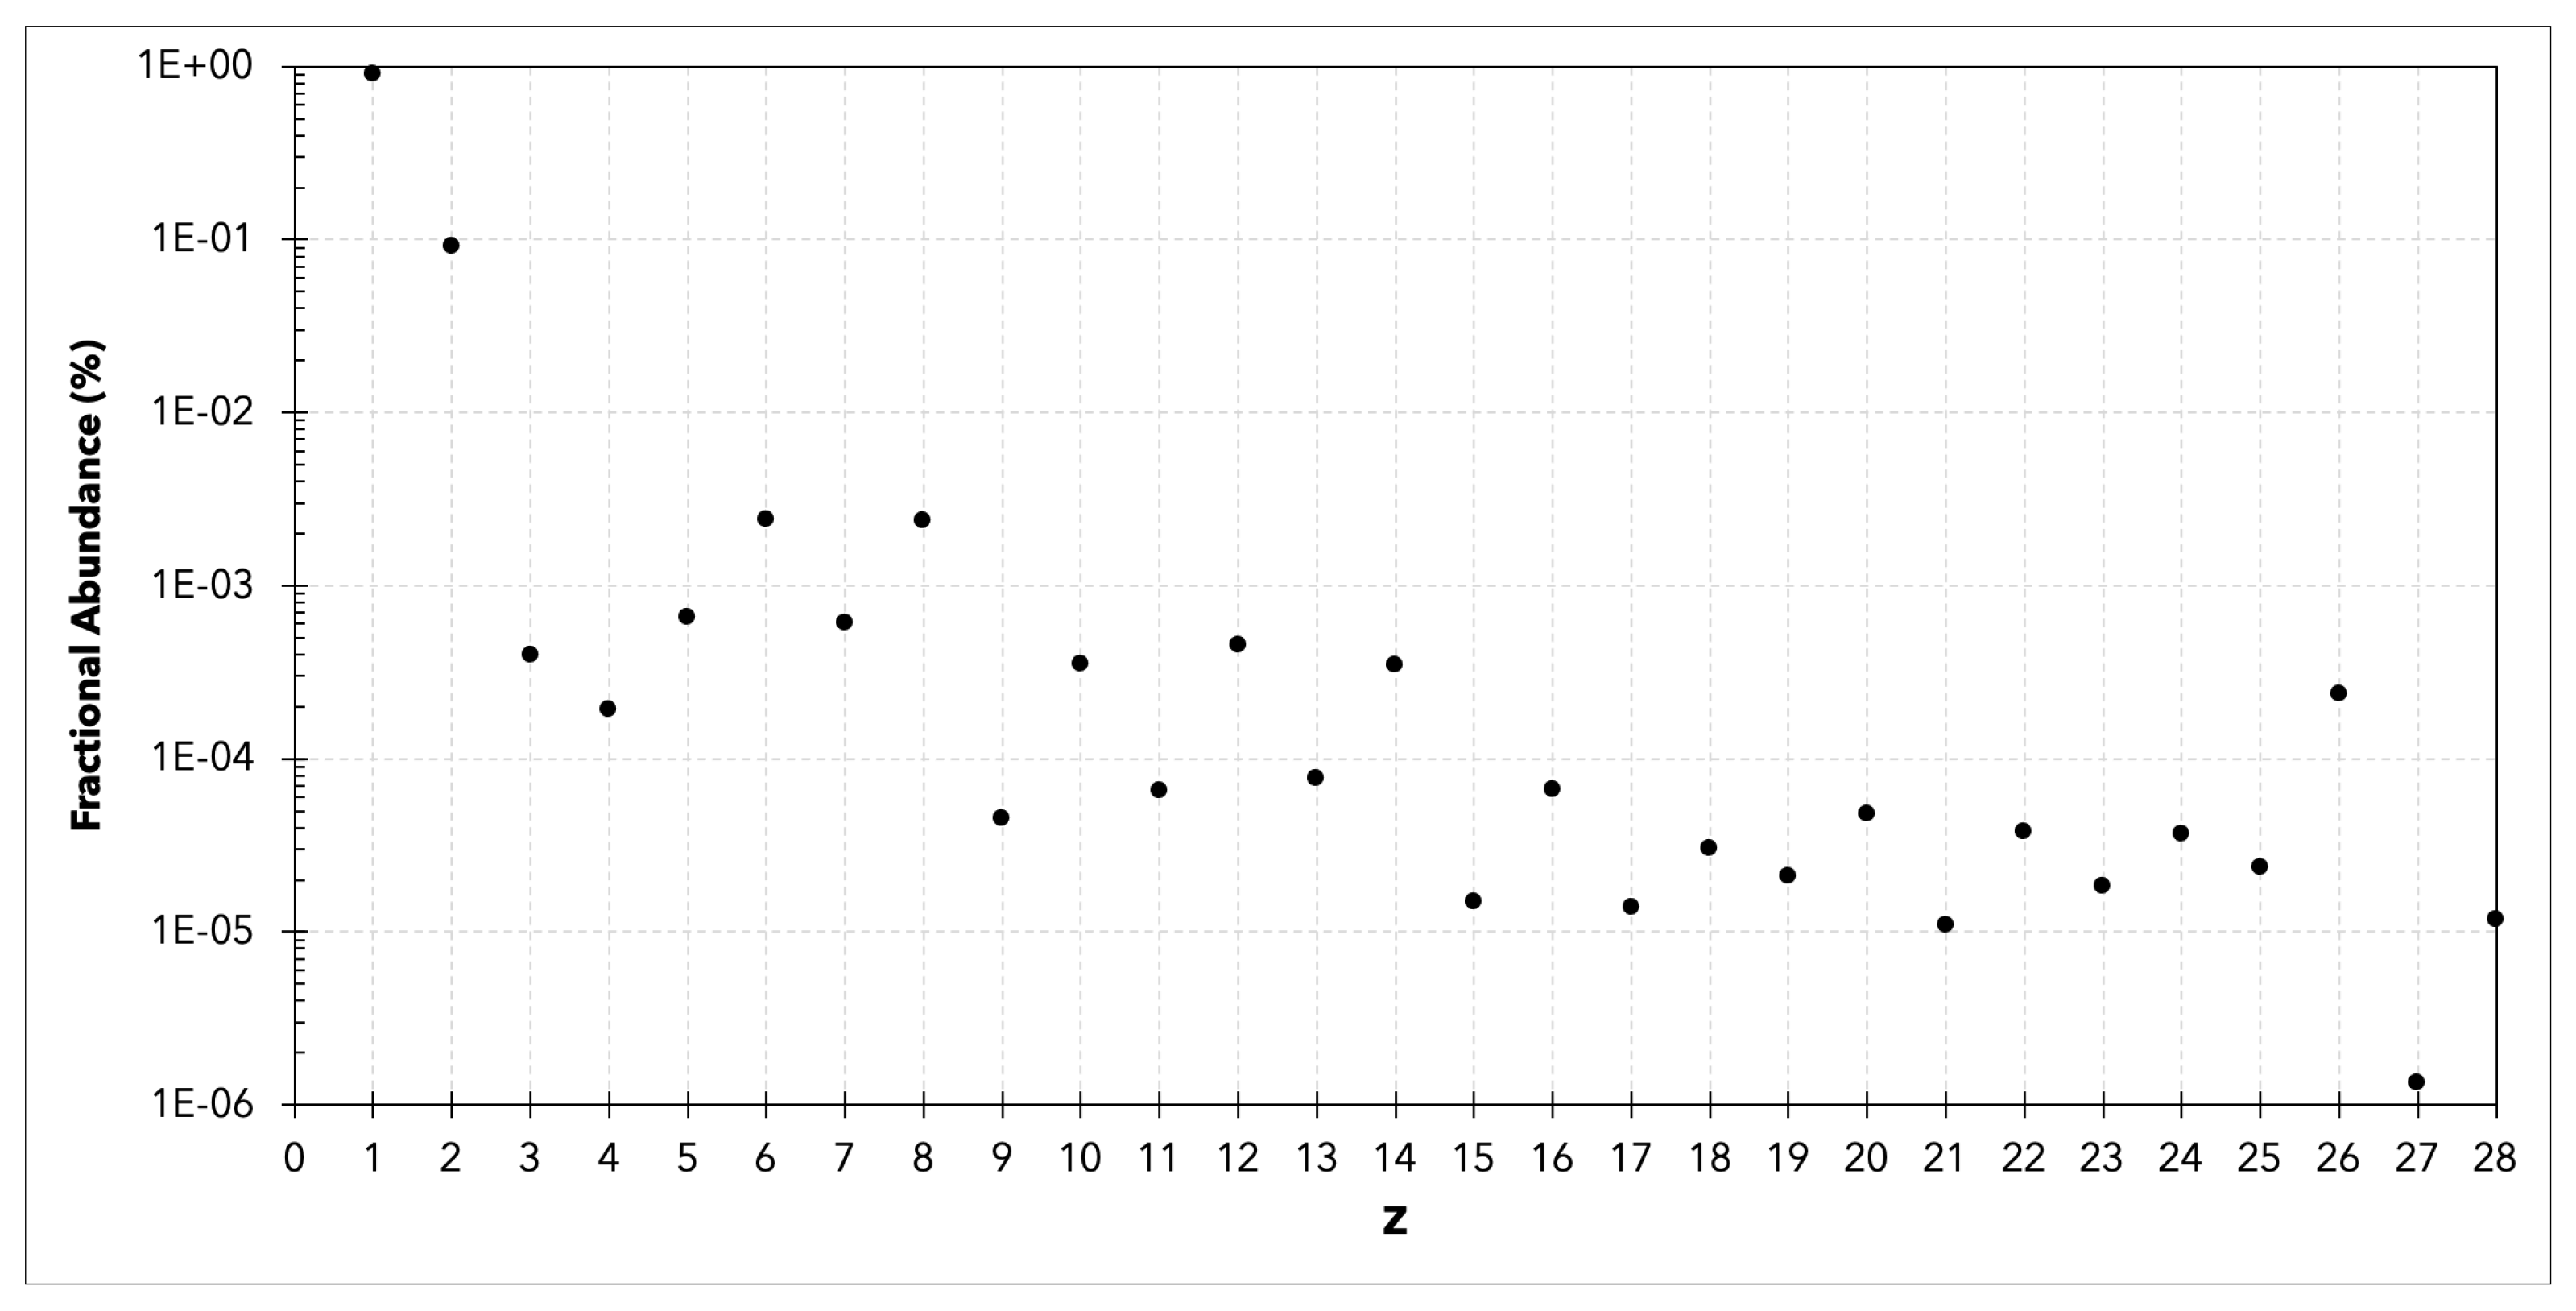
In general, the code requires an input file containing the desired parameters, source term, geometry, and tallies. The source term used in this work is obtained from the Badhwar–O’Neill 2020 model for a solar modulation of 400 MV to represent a period of a solar minimum [17]. The abundances of the source particles transported in this work (from Z = 1 to Z = 28) are presented in Figure 1, and their corresponding energy spectra are illustrated in Figure 2. The geometry used to represent the CRaTER instrument consists of stacks of cylinders lying on top of each other with the exact thickness of the sides, detectors, TEP volumes, and void regions of the CRaTER instrument. Table 1 provides the thickness and composition of each component used in the geometry simulated in this paper. To obtain the count rate as a function of LET, a tally was first used to calculate the energy deposited per source particle in D6, and was then divided by the detector thickness and multiplied by the source strength. We also utilized the unique feature in PHITS that allows the user to turn on and off the Landau–Vavilov energy straggling function to provide a comparison between the two resulting spectra. The results of the run with the Vavilov function are compared to the CRaTER instrument, while the results with this feature turned off are compared to the results obtained from HETC-HEDS, which is described in the following subsection. When comparing PHITS results to the measurements made by the CRaTER instrument, a geometric factor adjustment, , was applied to the simulated LET spectra to correct for ‘false’ triple coincidences. The functional form of the correction for the D5/D6 detector pair is given as
This geometric factor adjustment is applied to all LET spectra measurements made in-flight and calibrated using experimental measurements performed at the Heavy Ion Medical Accelerator in Chiba, Japan. Therefore, it should also be applied in the simulated data. In this scenario, a ‘false’ triple coincidence occurs when a particle enters the detector stack from the D2 end of the telescope with an incident trajectory that places it within the D2/D4 coincidence cone but outside of the D2/D6 coincidence cone and produces secondary particles via interactions deep in the TEP that subsequently trigger D6. This correction is described in detail by [20].
2.3. HETC-HEDS
HETC-HEDS (High-Energy Transport Code-Human Exploration and Development in Space) is a three-dimensional, Monte Carlo particle transport code used to simulate particle cascades for a wide variety of nuclear species including nucleons, light ions, heavy ions, and any secondaries produced by nuclear collisions. Particle trajectories, characterized by their scattering angles, kinetic energies and collision probabilities are followed until the particle undergoes an interaction, escapes the system, decays, or comes to rest from energy losses due to Coulomb interactions with the target medium. For each simulation, there is an input geometry file that models the dimensions and material densities and composition. The user inputs the initial angle, energy, and particle type of the incoming ion. Using these geometry and source particle input data, HETC-HEDS simulates transporting the primary particles and all the subsequent generations of secondary, tertiary, etc., products produced through interactions with the target materials. For describing Coulomb collisions, HETC-HEDS uses the continuous slowing down approximation, Bethe–Bloch theory [21], to treat excitation and ionization reactions for lighter ion and heavy ions, protons, charged pions, and muons [22]. Fragmentation of heavy charged particles into lighter ion and neutron secondaries in nuclear collisions is modeled using a modified version of the NUCFRG2 semiempirical nuclear fragmentation code developed at NASA Langley [23]. A detailed explanation of HETC-HEDS inner workings and benchmarking is available elsewhere [22,24,25,26,27]. HETC-HEDS does not follow the tracks produced by liberated electrons (delta rays) in Coulomb collisions. Thus, the code calculates energy lost using the difference between the particle energies entering and exiting a target component (true LET) but not the actual energy deposited.
In HETC-HEDS runs, the source term and geometry were identical to what was used in PHITS. However, the source term here is different from the one used in [3], which used discrete energy values. In this work, we use a continuous energy distribution for each incident particle that was later combined according to the corresponding abundances. This is followed by separate analysis of each run to find the energy deposited in the D6 detector. LET is finally calculated by the same methodology used in PHITS in an attempt to compare the results from each code to test whether the absence of the Vavilov distribution is the reason behind the differences observed in [3].
3. Results and Discussion
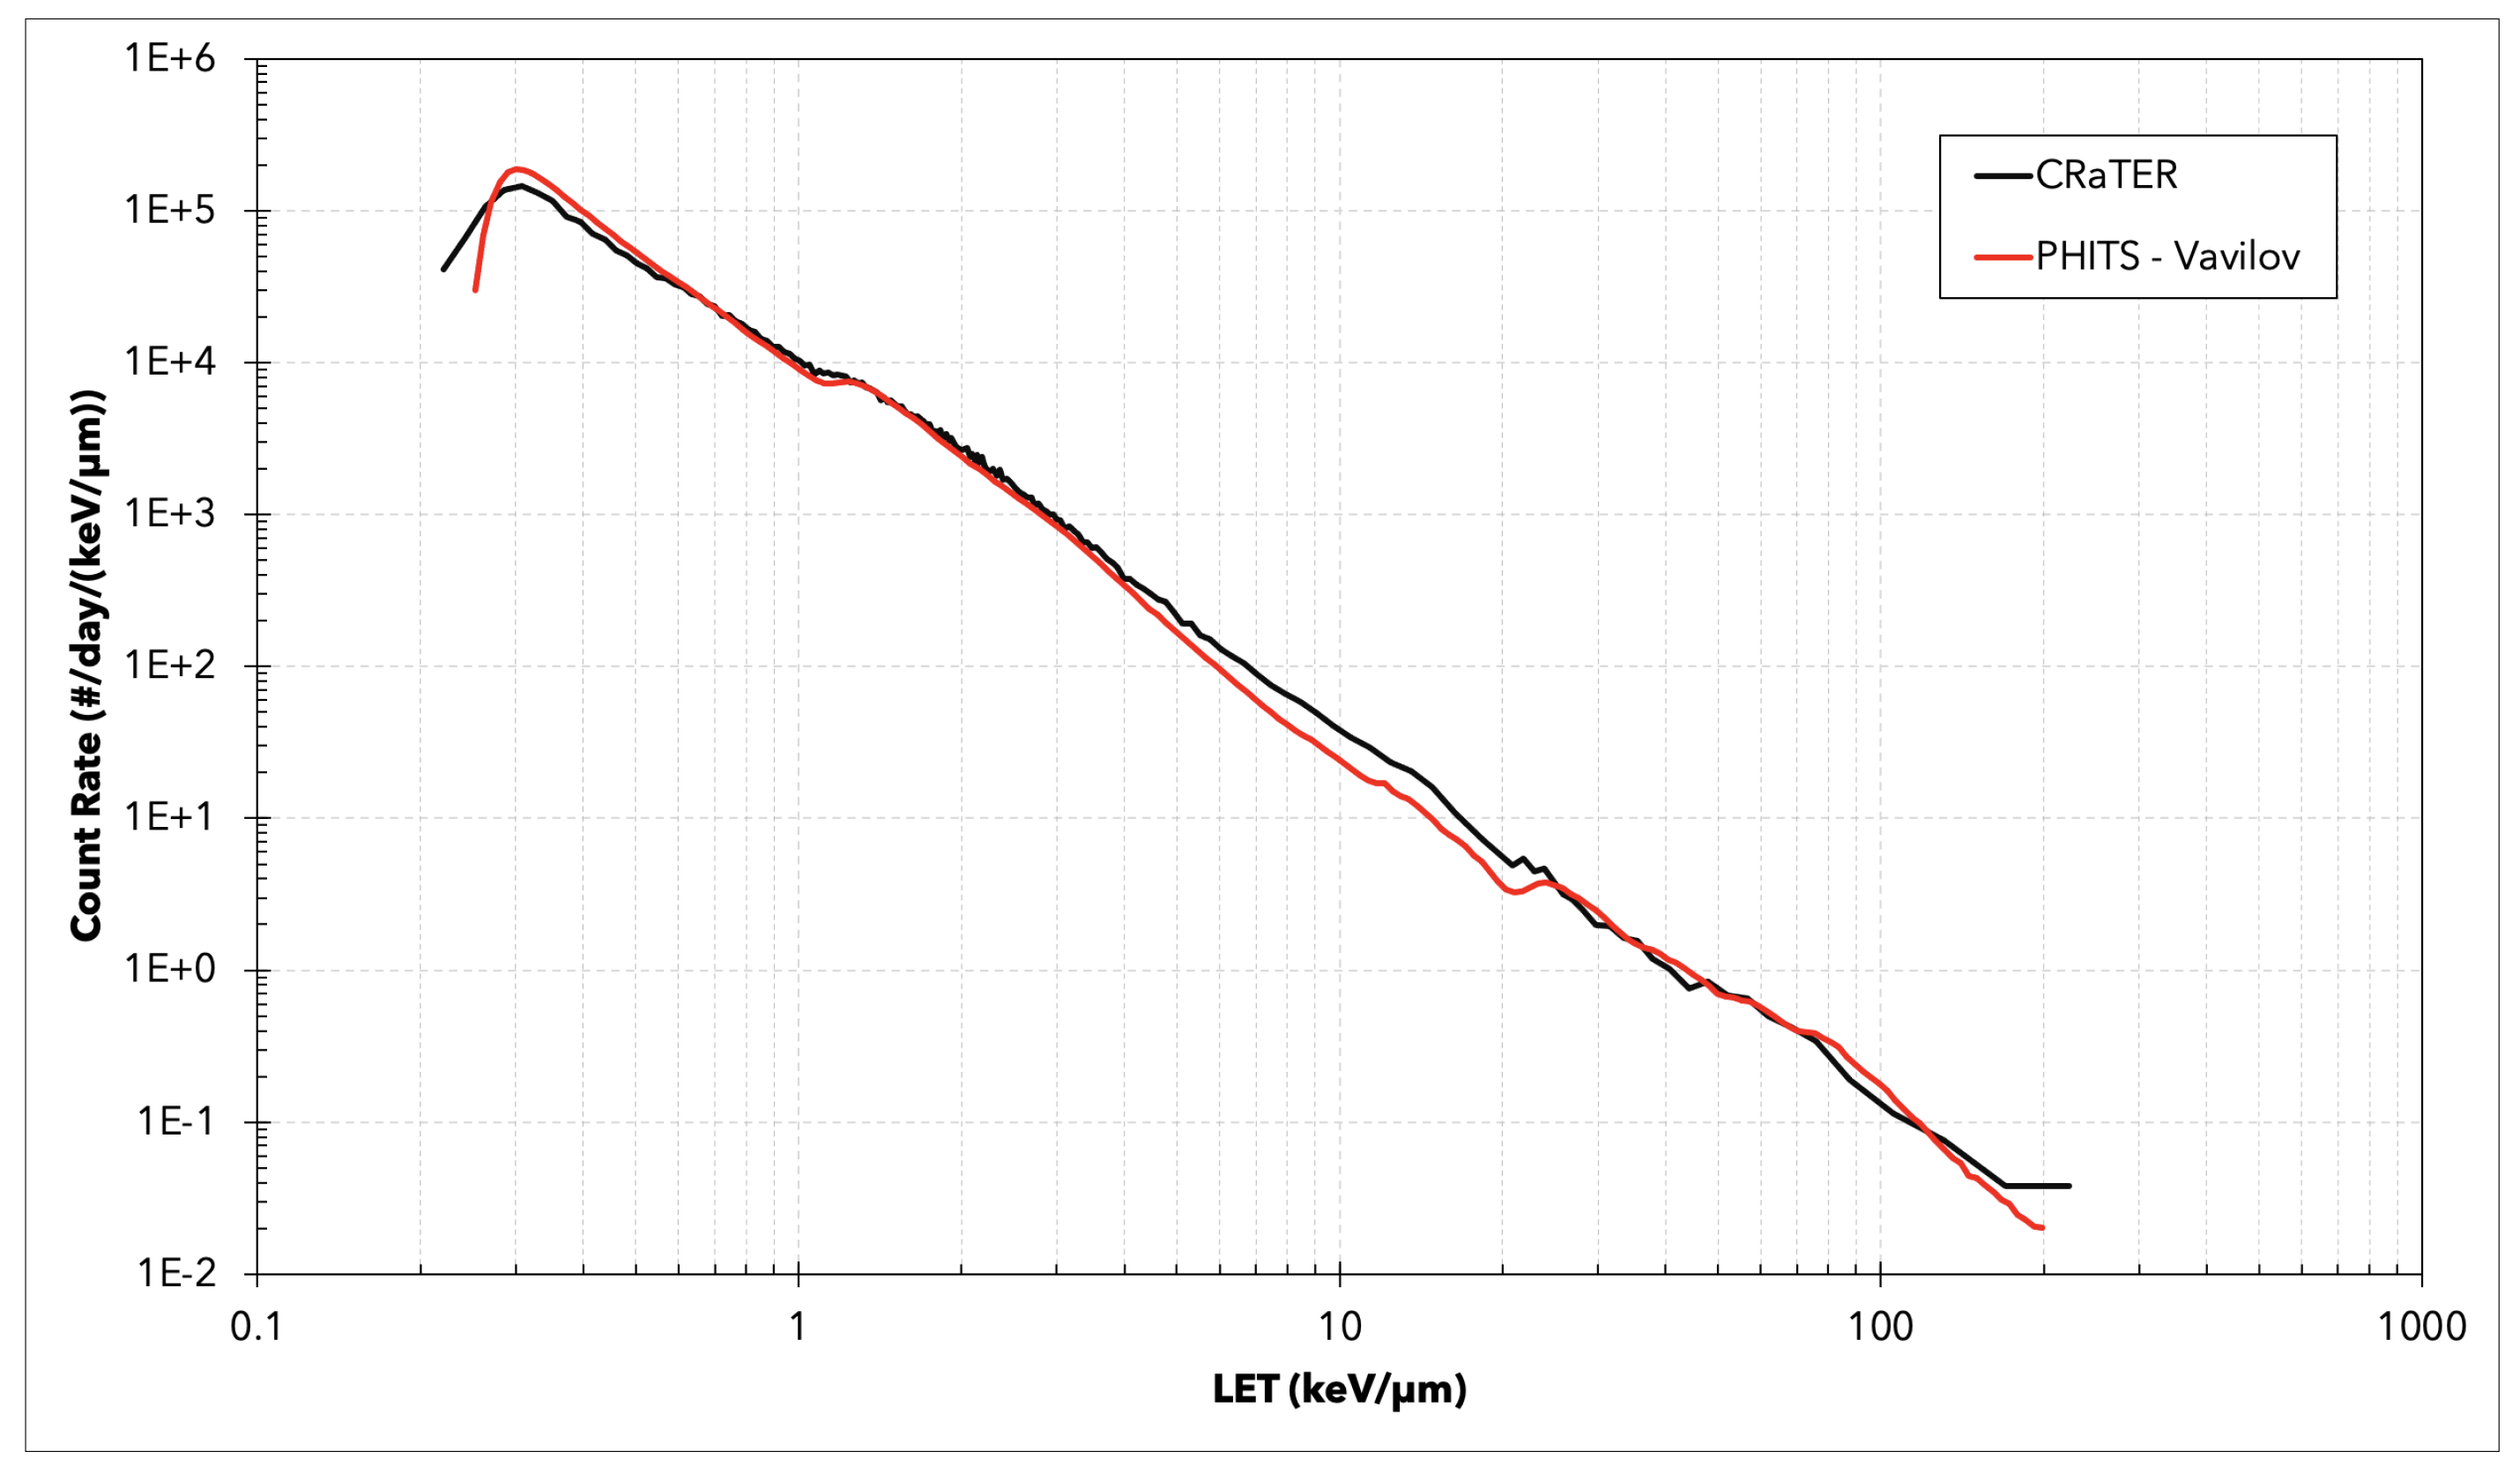
Figure 3 presents the LET spectra in D6 from PHITS simulations in comparison with the measurements made by the CRaTER instrument for a period of solar minimum. An agreement can be seen in the general trends of both LET spectra and in the proton peak at ~0.3 keV m, the He peak at ~1.2 keV m, and the oxygen peak at ~24 keV m. The fractional difference in the total LET-averaged count rate between CRaTER measurements and PHITS results is ~22% between 0.3 and 0.6 keV m, ~5% between 0.6 and 4 keV m, ~24% between 4 and 25 keV m, and ~9% between 25 and 130 keV m.
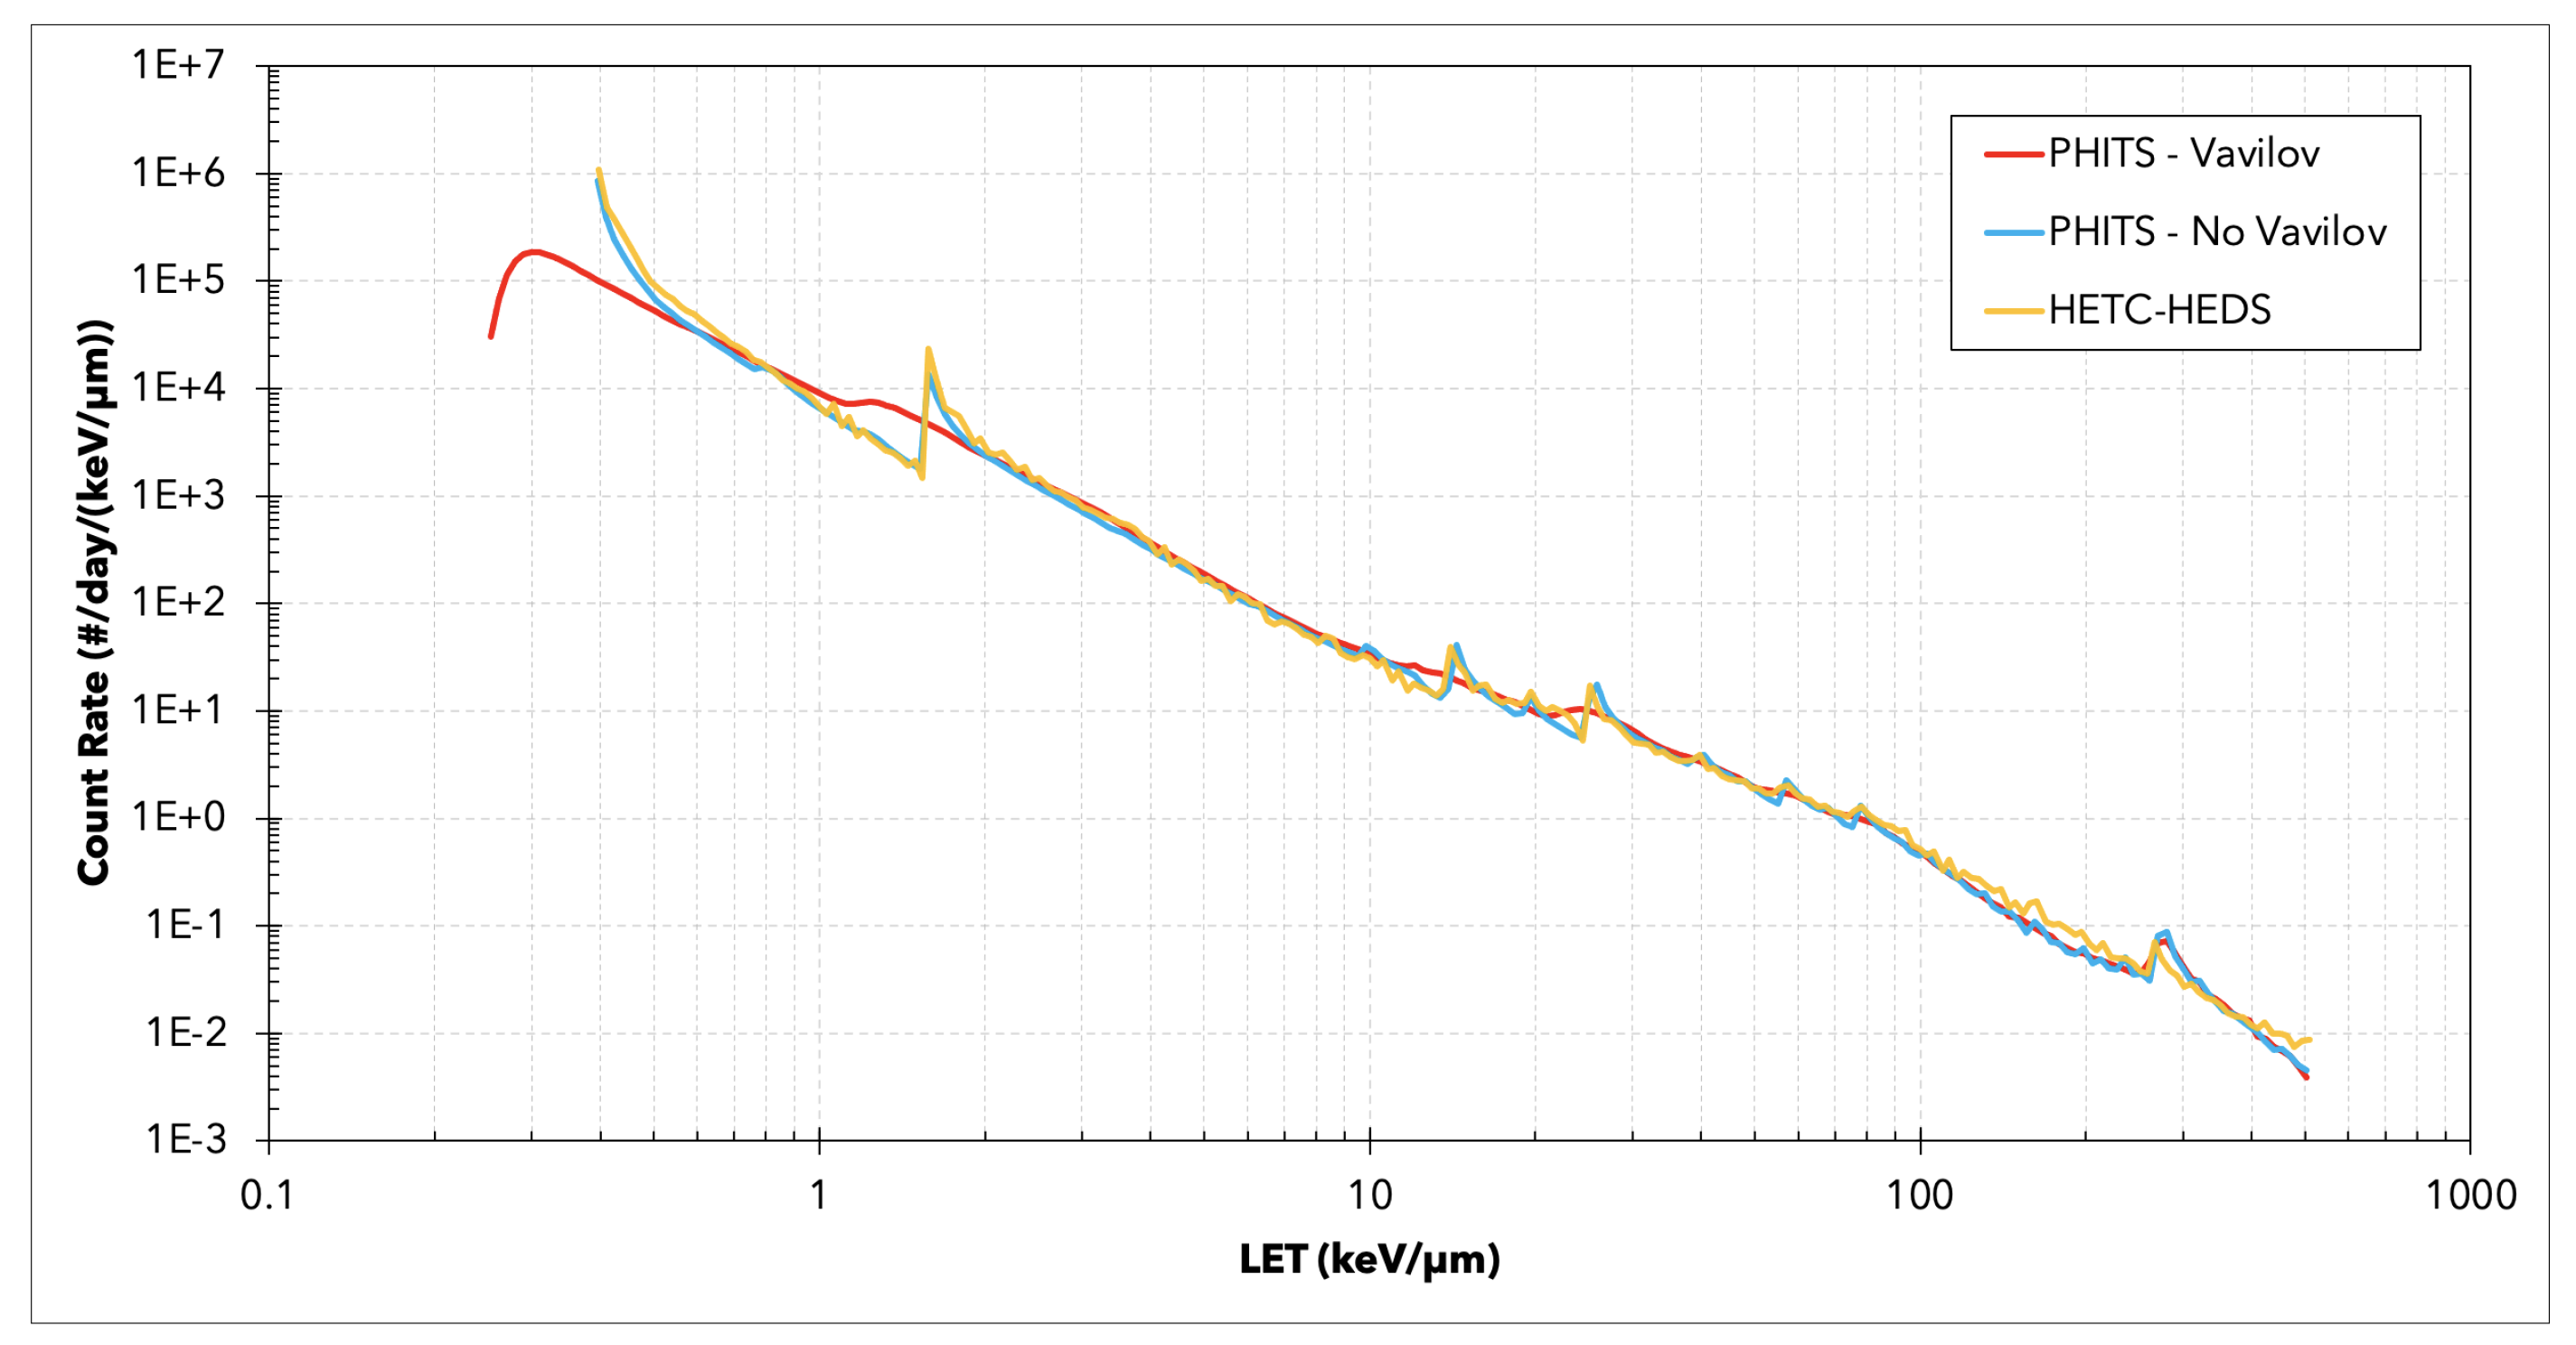
The LET spectra obtained from HETC-HEDS and PHITS without Vavilov energy straggling are presented in Figure 4. In comparison with the HETC-HEDS LET spectrum presented in [3], an improved smoothness is observed in the HETC-HEDS LET spectra created in this work, which is the result of sampling from a continuous GCR flux distribution rather than utilizing discrete lookup tables. Without Vavilov energy straggling, the LET spectrum from PHITS is very close to the one obtained from HETC-HEDS. Recall that the use of the Vavilov distribution shifts the HETC-HEDS LET MIPS from the average energy, which is what is provided by the Bethe–Bloch formula, to the most probable energy loss, which is smaller. The outstanding agreement in the LET spectra of HETC-HEDS and PHITS without Vavilov energy straggling, along with the agreements between CRaTER measurements and PHITS results utilizing Vavilov energy straggling, confirms the assertion provided in [3] that using a Vavilov distribution correction should fix the problem of the MIP peaks’ location and sharpness. This assertion also applies to the results of the deterministic code HZERTN presented in [3] as those results were shown to agree with the HETC-HEDS results.
4. Conclusions and Future Work
In this work, we compare measurements taken from the CRaTER instrument for a period representing a solar minimum with the Monte Carlo radiation transport code PHITS. The results show a very good agreement in the LET spectra between CRaTER measurements and PHITS simulations. In addition, we utilize the Vavilov energy straggling feature in PHITS to provide a comparison with HETC-HEDS. Using an updated version of source term in HETC-HEDS improved the smoothness of the resulting LET spectra. The updated HETC-HEDS LET spectra were then compared to PHITS after turning off the Vavilov correction. The remarkable agreement with the LET spectra of HETC-HEDS and PHITS confirms that the absence of the Vavilov distribution is the reason behind the differences in MIP locations observed in [3]. With the promising results from PHITS, future work will include running the code for various solar modulations and compare them with the CRaTER LET database. Incorporating Vavilov energy straggling into the HETC-HEDS transport code is also planned for future work.
Author Contributions
Conceptualization, F.A.Z., L.W.T., and W.C.d.W.; methodology, F.A.Z., L.W.T., and W.C.d.W.; software, F.A.Z., W.C.d.W., and N.T.B.; formal analysis, F.A.Z., L.W.T., and W.C.d.W.; writing—original draft preparation, F.A.Z., L.W.T., and W.C.d.W.; writing—review and editing, F.A.Z., L.W.T., W.C.d.W., and N.T.B.; visualization, F.A.Z. and W.C.d.W. All authors have read and agreed to the published version of the manuscript.
Funding
This work was partially funded by NASA Grant No. NNG11PA03C. CRaTER data are available at http://crater-web.sr.unh.edu.
Institutional Review Board Statement
Not applicable.
Informed Consent Statement
Not applicable.
Data Availability Statement
This study does not report any data.
Conflicts of Interest
The authors declare no conflict of interest.
References
- Spence, H.E.; Case, A.W.; Golightly, M.J.; Heine, T.; Larsen, B.A.; Blake, J.B.; Caranza, P.; Crain, W.R.; George, J.; Lalic, M.; et al. CRaTER: The cosmic ray telescope for the effects of radiation experiment on the lunar reconnaissance orbiter mission. J. Space Sci. Rev. 2010, 150, 243–284. [Google Scholar] [CrossRef] [Green Version]
- Townsend, L.W.; Moussa, H.M.; Charara, Y.M. Monte Carlo simulations of energy losses by space protons in the CRaTER detector. J. Acta Astronaut. 2009, 66, 643–647. [Google Scholar] [CrossRef]
- Porter, J.A.; Townsend, L.W.; Spence, H.; Golightly, M.; Schwadron, N.; Kasper, J.; Case, A.W.; Blake, J.B.; Zeitlin, C. Radiation environment at the Moon: Comparisons of transport code modeling and measurements from the CRaTER instrument. J. Space Weather 2014, 12, 329–336. [Google Scholar] [CrossRef] [Green Version]
- Looper, M.D.; Mazur, J.E.; Blake, J.B.; Spence, H.E.; Schwadron, N.A.; Golightly, M.J.; Case, A.W.; Kasper, J.C.; Townsend, L.W. The radiation environment near the lunar surface: CRaTER observations and Geant4 simulations. J. Space Weather 2013, 11, 142–152. [Google Scholar] [CrossRef] [Green Version]
- Spence, H.E.; Golightly, M.J.; Joyce, C.J.; Looper, M.D.; Schwadron, N.A.; Smith, S.S.; Townsend, L.W.; Wilson, J.; Zeitlin, C. Relative contributions of galactic cosmic rays and lunar proton “albedo” to dose and dose rates near the Moon. J. Space Weather 2013, 11, 643–650. [Google Scholar] [CrossRef]
- Zaman, F.; Townsend, L.W.; Wouter, C.; Schwadron, N.A.; Spence, H.E.; Wilson, J.K.; Jordan, A.P.; Smith, S.S.; Looper, M.D. Absorbed doses from GCR and albedo particles emitted by the lunar surface. Acta Astronaut. 2020, 175, 185–189. [Google Scholar] [CrossRef]
- Farmer, C.; Charara, Y.M.; Townsend, L.W. LET spectra of iron particles on A-150: Model predictions for the CRaTER detector. In Proceedings of the 37th International Conference on Environmental Systems, Chicago, IL, USA, July 2007. [Google Scholar]
- Charara, Y.M. Characterization of the cosmic ray telescope for the effects. Ph.D. Dissertation, Department of Nuclear Engineering, University of Tennessee, Knoxville, TN, USA, 2008. [Google Scholar]
- Anderson, J.A.; Townsend, L.W. LET comparisons for the CRaTER instrument on LRO and HETC-HEDS. In Proceedings of the 2011 IEEE Aerospace Conference, Big Sky, MT, USA, 5–12 March 2011. [Google Scholar]
- Anderson, J.A.; Townsend, L.W. Dose estimates for the CRaTER instrument on LRO using HETC-HEDS. In Proceedings of the 56th Annual Meeting of Health Physics Society, West Palm Beach, FL, USA, 26–30 June 2011. [Google Scholar]
- Slaba, T.C.; Blattnig, S.R.; Badavi, F.F. Faster and more accurate transport procedures for HZETRN. J. Comput. Phys. 2010, 229, 9397–9417. [Google Scholar] [CrossRef] [Green Version]
- Sato, T.; Iwamoto, Y.; Hashimoto, S.; Ogawa, T.; Furuta, T.; Abe, S.; Kai, T.; Tsai, P.; Ratliff, H.; Matsuda, N.; et al. Features of Particle and Heavy Ion Transport code System (PHITS) version 3.02. J. Nucl. Sci. Technol. 2018, 55, 684–690. [Google Scholar] [CrossRef] [Green Version]
- Sihver, L.; Sato, T.; Puchalska, M.; Reitz, G. Simulations of the MATROSHKA experiment at the international space station using PHITS. Radiat. Environ. Biophys. 2010, 49, 351–357. [Google Scholar] [CrossRef] [PubMed]
- Bahadori, A.A.; Sato, T.; Slaba, T.C.; Shavers, M.R.; Semones, E.J.; Van Baalen, M.; Bolch, W.E. A comparative study of space radiation organ doses and associated cancer risks using PHITS and HZETRN. Phys. Med. Biol. 2013, 58, 7183–7207. [Google Scholar] [CrossRef]
- Heilbronn, L.H.; Borak, T.B.; Townsend, L.W.; Tsai, P.E.; Burnham, C.A.; McBeth, R.A. Neutron yields and effective doses produced by Galactic Cosmic Ray interactions in shielded environments in space. Phys. Med. Biol. 2015, 7, 90–99. [Google Scholar] [CrossRef] [PubMed]
- Wilson, J.W. Transport Methods and Interactions for Space Radiations; NASA RP 1257; NASA: Washington, DC, USA, 1991. [Google Scholar]
- Slaba, T.C.; Whitman, K. The Badhwar-O’Neill 2020 GCR Model. Space Weather 2020, 18, e2020SW002456. [Google Scholar] [CrossRef]
- Nara, Y.; Otuka, N.; Ohnishi, A.; Niita, K.; Chiba, S. Relativistic nuclear collisions at 10A GeV energies from p + Be to Au + Au with the hadronic cascade model. Phys. Rev. 1999, 61, 024901. [Google Scholar]
- Niita, K.; Chiba, S.; Maruyama, T.; Maruyama, T.; Takada, H.; Fukahori, T.; Nakahara, Y.; Iwamoto, A. Analysis of the (N,xN’) reactions by quantum molecular dynamics plus statistical decay model. Phys. Rev. 1995, 52, 2620. [Google Scholar] [CrossRef] [Green Version]
- Case, A.W.; Kasper, J.C.; Spence, H.E.; Zeitlin, C.J.; Looper, M.D.; Golightly, M.J.; Schwadron, N.A.; Townsend, L.W.; Mazur, J.E.; Blake, J.B.; et al. The deep-space galactic cosmic ray lineal energy spectrum at solar minimum. Space Weather 2013, 11, 361–368. [Google Scholar] [CrossRef] [Green Version]
- Turner, J.T. Atoms, Radiation, and Radiation Protection; Wiley-VCH: Weinheim, Germany, 2004; ISBN 0–471-59581-0. [Google Scholar]
- Townsend, L.W.; Miller, T.M.; Gabriel, T.A. HETC radiation transport code development for cosmic ray shielding applications in space. Radiat. Prot. Dosim. 2005, 116, 135–139. [Google Scholar] [CrossRef] [PubMed]
- Wilson, J.W.; Shinn, J.L.; Townsend, L.W.; Tripathi, R.K.; Badavi, F.F.; Chun, S.Y. NUCFRG2: A semiempirical nuclear fragmentation model. Nucl. Instrum. Methods Phys. Res. 1994, 94B, 95–102. [Google Scholar] [CrossRef]
- Miller, T.M.; Townsend, L.W. Double differential heavy ion production cross sections. Radiat. Prot. Dosim. 2004, 110, 53–60. [Google Scholar] [CrossRef]
- Charara, Y.M.; Townsend, L.W.; Gabriel, T.A.; Zeitlin, C.J.; Heilbronn, L.H.; Miller, J. HETC-HEDS code validation using laboratory beam energy loss spectra data. IEEE Trans. Nucl. Sci. 2008, 55, 3164–3168. [Google Scholar] [CrossRef]
- Heinbockel, J.H.; Slaba, T.C.; Blattnig, S.R.; Tripathi, R.K.; Townsend, L.W.; Handler, T.; Gabriel, T.A.; Pinsky, L.S.; Reddell, B.; Clowdsley, M.S.; et al. Comparison of the transport codes HZETRN, HETC, and FLUKA for a solar particle event. Adv. Space Res. 2011, 47, 1079–1088. [Google Scholar] [CrossRef]
- Heinbockel, J.H.; Slaba, T.C.; Tripathi, R.K.; Blattnig, S.R.; Norbury, J.W.; Badavi, F.F.; Townsend, L.W.; Handler, T.; Gabriel, T.A.; Pinsky, L.S.; et al. Comparison of the transport codes HZETRN, HETC, and FLUKA for galactic cosmic rays. Adv. Space Res. 2011, 47, 1089–1105. [Google Scholar] [CrossRef]
Figure 1.
The relative abundance of each incident GCR ion simulated in this work obtained from [17] for solar modulation of 400 MV.
Figure 1.
The relative abundance of each incident GCR ion simulated in this work obtained from [17] for solar modulation of 400 MV.

Figure 2.
The energy spectra of the source term used in this work obtained from [17] for solar modulation of 400 MV. All ions were run collectively in PHITS, while each ion was run separately in HETC-HEDS. The division of GCR ions into three categories in this plot is for demonstration purposes.
Figure 2.
The energy spectra of the source term used in this work obtained from [17] for solar modulation of 400 MV. All ions were run collectively in PHITS, while each ion was run separately in HETC-HEDS. The division of GCR ions into three categories in this plot is for demonstration purposes.

Figure 3.
A comparison between the LET spectra in D6 obtained from CRaTER measurements and PHITS simulations (with Vavilov energy straggling) during a period of solar minimum.
Figure 3.
A comparison between the LET spectra in D6 obtained from CRaTER measurements and PHITS simulations (with Vavilov energy straggling) during a period of solar minimum.

Figure 4.
A comparison between the LET spectra in D6 obtained from HETC-HEDS and PHITS with and without Vavilov energy straggling.
Figure 4.
A comparison between the LET spectra in D6 obtained from HETC-HEDS and PHITS with and without Vavilov energy straggling.


Table 1.
The components of the CRaTER instrument starting from S1 facing the zenith (deep space) and S2 facing the nadir (lunar surface). A schematic of the CRaTER instrument is provided in [1].
Table 1.
The components of the CRaTER instrument starting from S1 facing the zenith (deep space) and S2 facing the nadir (lunar surface). A schematic of the CRaTER instrument is provided in [1].
| Component | Material | Thickness (mm) |
|---|---|---|
| S1 | Aluminum | 0.813 |
| V1 | Void | 2.363 |
| D1 | Silicon | 0.148 |
| V2 | Void | 3.360 |
| D2 | Silicon | 1.000 |
| V3 | Void | 3.943 |
| A1 | A-150 | 53.97 |
| V4 | Void | 3.554 |
| D3 | Silicon | 0.149 |
| V5 | Void | 3.568 |
| D4 | Silicon | 1.000 |
| V6 | Void | 11.90 |
| A2 | A-150 | 26.98 |
| V7 | Void | 11.90 |
| D5 | Silicon | 0.149 |
| V8 | Void | 3.060 |
| D6 | Silicon | 1.000 |
| V9 | Void | 2.362 |
| S2 | Aluminum | 0.811 |
Publisher’s Note: MDPI stays neutral with regard to jurisdictional claims in published maps and institutional affiliations. |
© 2021 by the authors. Licensee MDPI, Basel, Switzerland. This article is an open access article distributed under the terms and conditions of the Creative Commons Attribution (CC BY) license (https://creativecommons.org/licenses/by/4.0/).
Share and Cite
MDPI and ACS Style
Zaman, F.A.; Townsend, L.W.; de Wet, W.C.; Burahmah, N.T. The Lunar Radiation Environment: Comparisons between PHITS, HETC-HEDS, and the CRaTER Instrument. Aerospace 2021, 8, 182. https://0-doi-org.brum.beds.ac.uk/10.3390/aerospace8070182
AMA Style
Zaman FA, Townsend LW, de Wet WC, Burahmah NT. The Lunar Radiation Environment: Comparisons between PHITS, HETC-HEDS, and the CRaTER Instrument. Aerospace. 2021; 8(7):182. https://0-doi-org.brum.beds.ac.uk/10.3390/aerospace8070182
Chicago/Turabian StyleZaman, Fahad A., Lawrence W. Townsend, Wouter C. de Wet, and Naser T. Burahmah. 2021. "The Lunar Radiation Environment: Comparisons between PHITS, HETC-HEDS, and the CRaTER Instrument" Aerospace 8, no. 7: 182. https://0-doi-org.brum.beds.ac.uk/10.3390/aerospace8070182
Note that from the first issue of 2016, this journal uses article numbers instead of page numbers. See further details here.