
Ion Source—Thermal and Thermomechanical Simulation


Research Institute of Applied Mechanics and Electrodynamics of Moscow Aviation Institute, 125080 Moscow, Russia
*
Author to whom correspondence should be addressed.
Aerospace 2021, 8(7), 189; https://doi.org/10.3390/aerospace8070189
Submission received: 20 May 2021
/
Revised: 24 June 2021
/
Accepted: 7 July 2021
/
Published: 14 July 2021
Abstract
:The main purpose of this work is to conduct ground development testing of the ion source intended for use the space debris contactless transportation system. In order to substantiate the operating capability of the developed ion source, its thermal and thermomechanical simulation was carried out. The ion source thermal model should verify the ion source operating capability under thermal loading conditions, and demonstrate the conditions for ion source interfacing with the systems of the service spacecraft with the ion source installed as a payload. The mechanical and mathematical simulation for deformation of the ion source ion-extraction system profiled electrodes under thermal loading in conjunction with the prediction of the strained state based on the numerical simulation of the ion source ion-extraction system units, making it possible to ensure the stability of the ion source performance. Good agreement between the thermal and thermo-mechanical ion source simulation results and experimental data has been demonstrated. It is shown that the developed ion source will be functional in outer space and can be used as an element of the space debris contactless transportation system into graveyard orbits.
1. Introduction
Non-functioning spacecraft (SC), or their fragments are understood to be space debris (SD). The problem of near-Earth space pollution by SD has acquired an exceptional urgency at the present time as it significantly complicates and encumbers further space-related activities [1]. As the simulation of the processes of near-Earth space operations and pollution shows, an annual active removal of 5–20 large-sized objects from near-Earth space can result in reducing the growth of space debris population caused by collisions and fragmentation of available, both functioning and non-functioning, space objects [2]. By now, a large number of different methods to remove SD from the vicinity of the geostationary orbit and from low Earth orbits have been proposed [1,3,4,5,6,7,8,9,10,11,12,13,14,15,16]. However, the optimum way to clear the near-Earth space has not yet been found while technological aspects to solve the problem of near-Earth space pollution are under development and demonstration testing.
The service spacecraft (SSC) that approach the SD to be removed and that tug it into a graveyard orbit by means of mechanical contact or by contactless impact can be used for SD removal. A large-sized SD can have great residual angular momenta, or can be tumbling, making it difficult to remove it by contact methods, especially in cases with large solar panels and/or uncontrolled high angular velocities. These circumstances increase the risks of destruction for SSC structural elements or SD to be removed, which can lead to an increase in the number of SD fragments with a simultaneous reduction in their size, and, consequently, to growing difficulties in their detection and control. In this regard, contactless removal methods are of great interest.
Transportation of space objects by an ion beam was proposed in order to perform transportation in the “Earth-Moon” system [17], and to remove space debris [18,19,20]. This SD removal method was named the Ion Beam Shepherd. The use of anion source (IS) for transportation of dead SC or SD appears to be the most promising due to the SD material ablation observed during SD removal by IS beam.
It is necessary to show the IS sustainable operating capability in outer space under the conditions of thermal and thermomechanical loading to assess the possibility and efficiency of contactless SD transportation method.
2. The Status of the Problem
The IS thermal model development, taking into account the requirements of reliable functioning and integration with the SSC systems, is considered to be one of the most challenging research and engineering issues in the development of a system for contactless transportation in space [21,22,23,24,25,26,27,28,29].
The complexity of the problem is in the need to develop reliable computational models for IS thermo-physical processes that would take processes of different natures into account, including plasma processes, driven by ionization of the plasma-forming gas in a self-sustained inductive discharge, taking into account thermal dissipation characteristics during interaction of plasma with the SSC structural elements, as well as the heterogeneity of the materials used in the IS structure.
Structurally, the IS ion-extraction system (IES) is the most complex unit. It is necessary to consider the electrode performance features while developing the IES design [30,31,32]. This is driven by the complexity in providing a gap between the IES electrodes. IES electrodes are most often made in the form of thin-walled slightly sloping rotary shells with close-packed perforation. Peculiarities of IES electrode operation include uneven heating along the radius and thickness, which creates prerequisites for the reduction of output IES performance and of those of IS as a whole, and also enhances the likelihood of electrical breakdown in the inter-electrode gap. As a result, internal temperature stresses arise even in freely fixed electrodes, which inevitably leads to deformation of the electrodes.
One should expect the occurrence of additional deflections of the IES electrodes taking the following into account: a difference in electrode thicknesses, usage of various construction materials, and operation under conditions of temperature gradients. There is a need to solve the problem of ensuring stable operation of the IES electrodes and their stability under nonlinear bending. The problem is further complicated by the tendency for the electrode thickness to be decreased down to 0.3 mm.
In order to solve the problematic issues indicated, the task was set to develop an IES thermo-mechanical model to account for the thinness of walls and non-uniform thickness of electrodes, the effect of perforation, uneven heating along the radius of the electrodes; as well as the task to develop an IS thermal model taking into account the usage of various materials and operation in heterogeneous thermal load conditions. During ground experimental development, it is necessary to demonstrate operating capability of the IS produced on the basis of simulation results, and to show consistency between simulation results and experimental data.
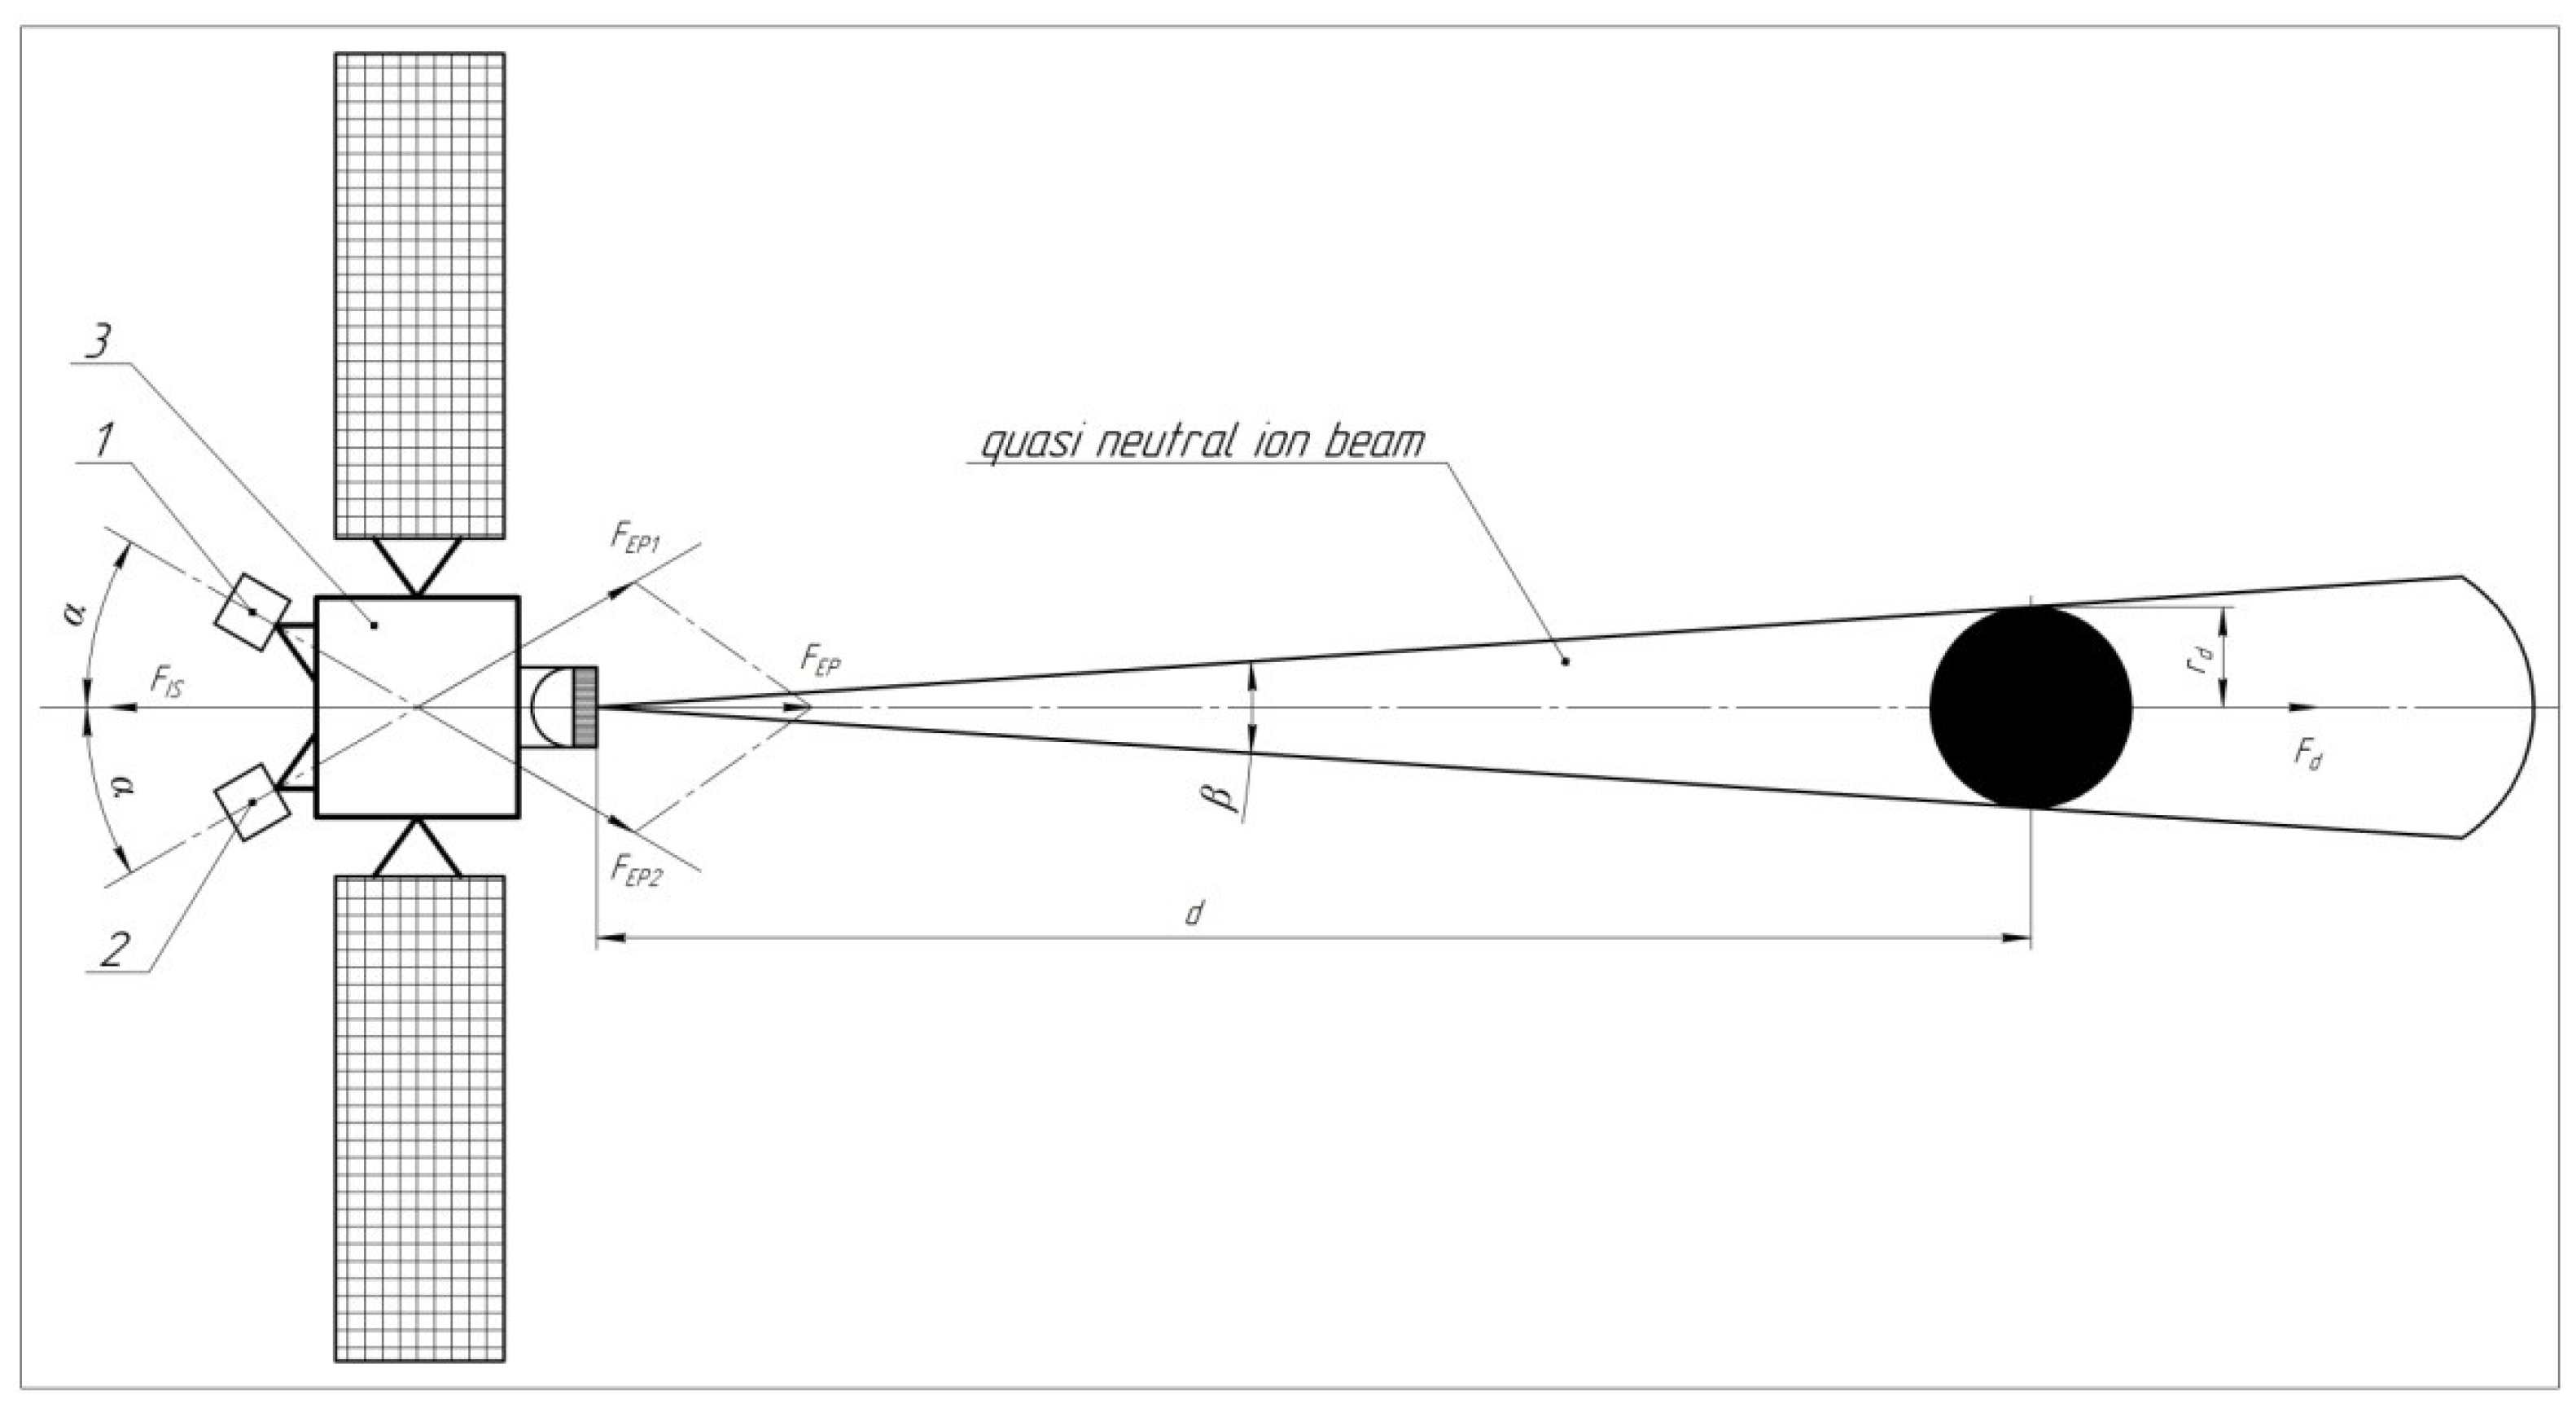
In order to implement the contactless transportation method, force coupling between the SSC and SD is ensured using a quasi-neutral ion beam injected by the IS from the SSC. The “SSC-SD” virtual assembly orbital motion is controlled with the help of a compensating propulsion system. The diagram of propelling force action arising during transportation of SD by an ion beam is shown in Figure 1. The compensating propulsion system comprises two thrusters mounted on a two-axis gimbal unit. This configuration allows us to change thrust of the compensating propulsion system (FEP) and its projections on mutually perpendicular axes by the thruster gimballing.
The ion beam acts on the SD by a momentum transfer to it. In this case, the SSC must escort the SD at some distance (d). To that end, the SSC and the SD average accelerations must be equal, which can be achieved under the following condition: , where: MSC is the SSC mass; MSD is the SD mass; k = Fd/FIS ≤ 1 is a coefficient equal to the ratio of momentum Fd transferred by the IS ion beam to the SD, to the momentum generated by the IS. The contactless method efficiency is largely determined by the k coefficient value. Many publications have been devoted to consideration of the quasi-neutral ion beam behavior, for example, [33].
The current surface that limits 95% of the ion current is generally considered to be the beam boundary. Dimensions of the near zone are 2–3 diameters of the ion beam at the IS exit plane. Ion beam characteristics at a distance equal to 2–3 diameters of the ion beam from the IS exit plane are defined by the conditions for the ion beam formation by the IS electrostatic system. Distribution of the ion current density along the radius and angle in the IS exit plane is an initial condition to analyze the ion beam behavior in the near zone. Similar characteristics at the outer boundary of the near zone are the initial parameters for considering the problem regarding the ion beam evolution during its further propagation in space. Further behavior of the ion beam is dictated by the presence of the so-called ambipolar electric field in the beam. This field emerges due to the presence of electrons in the beam that are introduced into the beam by the neutralizer (in flight conditions), or come from the vacuum chamber walls (during ground development testing) to offset the volume charge of ions in the beam. In this case, the condition of equality for electron and ion densities is locally satisfied in the volume of the beam: ne = ni, and the condition of equality for the ion and electron currents flowing out through the cross section at the near zone outer boundary is metal so: Ii = Ie.
3. Balance of Particles and Power in the Discharge
The IS distinguishing characteristic is that the only thermal power source is the electromagnetic field initiating an inductive discharge. The main processes that stipulate the IS thermophysical state are the following:
- -
- Absorption of HF power by plasma due to plasma electrical conductivity;
- -
- Plasma formation driven by ionization and heating of electrons and leading to an increase in the ionized propellant gas internal energy;
- -
- Carry-over of a portion of plasma power by ions and electrons onto the walls, including ionization energy released during recombination of ions and electrons of the propellant gas, which is also converted into heat.
The IS operation principle is that high-frequency (HF) currents in the inductor generate a HF magnetic field with induction in the IS gas discharge chamber (GDC) volume. In turn, the magnetic field induces a HF electric field with intensity where is HF generator frequency.
Electrons oscillating with the electric field frequency are accelerated under the action of the electric field. In the case of inelastic collisions of electrons with propellant gas atoms or ions, their excitation and/or ionization occurs. Simultaneously, as a result of ionization, free electrons are generated, while some electrons escape the discharge and deposit on the surfaces limiting the discharge (the GDC walls and/or IES electrodes). The RF discharge in the IS is inductive and self-sustained. It does not require a permanently operating cathode as a source of electrons inside the IS GDC. After feeding the propellant gas and supplying power from the RF generator, the initial pulse injection of electrons emitted by an external source of electrons (for example, a neutralizer) can be used to ignite the discharge.
Intensities of electric and magnetic fields are relatively low. Consequently, due to the significant mass of propellant gas ions, it can be assumed that the electric and magnetic fields do not act on the propellant gas ions. Ions and atoms have a low temperature governed by the GDC wall temperature (on the order of 250–300 °C).
In accordance with the law of J.C. Maxwell and L.E. Boltzmann, the main mechanism to establish an equilibrium electron energy distribution are electron–electron collisions (thermalization). In this case, cold electrons formed as a result of an inelastic collision acquire the temperature of plasma electrons heated by an HF electric field. According to [34], electrons in plasma have the Maxwellian distribution with temperature Te and density exceeding ne = 1017 m−3. Te = 3–4 eV in the inductive discharge volume, and Te = 5–7 eV in the near-wall discharge area. The electron temperature weakly depends on the value of HF power supplied to the discharge [35,36,37,38].
A relatively low temperature of electrons, on one hand, leads to an increase in specific energy consumption to ionize the propellant gas within the volume, and on the other hand, it causes a low plasma potential relative to the GDC walls, and, consequently, a low energy of ions depositing onto the GDC inner surface and the surface of the IES screen grid facing the plasma. Low ion energy does not result in erosion of these surfaces.
The IS plasma is weakly ionized and the ionization degree does not exceed 5%. The fraction of doubly charged and multiply charged ions does not exceed 1%. Their presence is normally neglected when performing thermal simulation. The plasma-forming gas pressure in the GDC is about 10−1 Pa. The representative electron density values are about ne ~ 4 × 10¹⁷ m−3. The mean free path of electrons exceeds the characteristic GDC volume dimensions.
It has been experimentally proven that the HF discharge plasma in RIT (radio-frequency ion thruster) is rarefied and non-equilibrium. The photons emitted by the excited particles reach the GDC walls and are absorbed by it without interacting with the propellant gas atoms. The consequence of the non-equilibrium state is that the electron temperature Te is much higher than the temperature of atoms Ta and ions Ti.
In order to describe the plasma state correctly, it is necessary to know spatial distributions for the densities of atoms and electrons (densities of electrons and ions are equal under quasi-neutral conditions), as well as for the electron temperature. Simulation of processes in the GDC is based on the establishment of balance of particles and power in the plasma volume limited by the GDC walls and by the screen electrode surface [39].
In a self-sustained HF discharge, the balance of electrons is defined by the rate of their formation as a result of ionization (the ionization rate) and the rate of their escape (deposition) onto the GDC walls and into the holes in the IES electrodes, since the probability for recombination of ions and electrons in the GDC volume is close to zero. The deposition rate depends on the equilibrium plasma potential relative to the GDC walls, which is established automatically.
The balance model is developed similarly to the one described in [40] with an additional simplification with respect to neglecting the processes of stepwise ionization through metastable states, since the probability of such ionization is low.
The electron energy distribution function in all models is assumed to be the Maxwellian one. Obviously, only the electrons from the Maxwellian distribution tail area have an energy exceeding the atom ionization energy for almost any propellant that can be used in an IS. On the other hand, atom excitation energies are lower than the ionization energy, which leads to the fact that there can be several excitation events per an ionization event [41].
The excitation energy is primarily spent for radiation. The effective energy spent for the production of one ion in the discharge is CID = Vi + CR, where: CR are total radiation losses in all the events of excitation-quenching pertaining to one event of the propellant gas atom ionization; Vi is the first potential of the propellant gas atom ionization.
A relative amount of HF power consumption for the excitation of propellant gas atoms is defined by the ratio of cross sections of ionization and excitation of atomic levels of the propellant gas atoms, which is calculated by integrating over the Maxwellian distribution of the energy transferred by electrons to atoms in inelastic collisions, taking the cross section of atomic level excitation into account.
Specific energy losses for the formation of one propellant gas (Xenon) ion CR in the plasma discharge as a function of electron temperature Te are given in [42]. With Te growth, the specific radiation losses and, accordingly, the cost of an ion in the discharge decrease. Since the electron temperature in an inductive high-frequency discharge is 4–6 eV, the radiation losses amount to 4–6 eV per one ionization event. An increase in specific radiation losses with Te decrease is explained by an increase in the number of excitation events per one ionization event. The formation of a doubly charged xenon ion with the Maxwellian distribution of electrons with a temperature of 5 eV is unlikely. In an HF induction discharge, the fraction of doubly charged ions does not exceed 1% [43], which allows us to discard doubly charged ions in the discharge power balance.
Variations of the main plasma parameters in the discharge along the GDC radius is presented in [43]. The electron density decreases from the GDC axis towards its walls. The electron temperature is maximum on the GDC walls. The ion current density changes insignificantly, which makes it possible to use approximate relations for a homogeneous plasma with electron density and electron temperature being uniformly distributed over the volume. For electron density and electron temperature, their mean values that define integral plasma parameters derived from them (density, ion beam current, near-wall plasma potential drop near the GDC surface and emission electrode) are assumed. The total ion production in a plasma discharge is:
where Ve is the electron velocity; is the averaging of the ionization cross section over electron velocities Ve; Vd is the GDC plasma volume; M is the propellant gas atom (ion) mass; SGDC is the internal area of GDC surface surrounding the discharge volume.
The electron balance equation is as follows:
Here: ∆U is the near-wall plasma potential drop.
Equations (1) and (2) describe the balance between the particles depositing onto the walls (the left-hand sides) per unit time, and the particles being formed (the right-hand sides) per unit time in the discharge volume.
The total power can be determined by summing over the volume and surface. The power balance equation has the following form:
where NRF is the HF power absorbed by plasma.
4. Development of the Ion Source Thermal Model
The ion beam current (I0) is formed by ions entering the holes of the IES screen electrode (SE). Specific power consumption (Ci) to produce ion current (“the ion cost”) is [44,45]: Ci = NRF/I0, where: NRF is the RF generator power.
The ion cost is: Ci = CidI0/Iu.
The major portion of the RF power input (80–90%) is converted into heat when plasma components—ions, electrons, and photons—deposit on the internal surfaces of the GDC and the surface of the IES screen electrode facing the GDC. The value of the specific power flux converted into heat is defined by the flow density for ions and electrons depositing on the GDC walls.
In the conditions with unchanging plasma parameters, the number of particles formed in plasma per unit time should be equal to the number of particles leaving plasma per unit time. If dielectric or metal walls under a floating potential are present, the conditions for particles to escape towards the wall must satisfy the condition of density equality for the electron and ion currents:
ji = je
Since the electron mobility substantially exceeds the ion mobility, a transition (near-wall) layer, in which the quasi-neutrality condition is violated, should be established near the GDC surface. Between the GDC wall and undisturbed plasma, a potential barrier for electrons (∆U) is established, thanks to which the electrons are retained in plasma. The ∆U value is driven by the condition of the current continuity (a balance between the generation of charged particles in plasma and their deposition on the GDC walls).
It follows from Equation (3) taking Equations (1) and (2) into account that:
whence it follows that the near-wall potential drop in the vicinity of the GDC dielectric surface is:
The potential drop at the IES SE surface is defined by the following equation:
where σSE is transparency of the screen electrode (SE) (the ratio of the electrode total area to the area of its perforation).
For Xenon, the value of the near-wall potential drop in the vicinity of the GDC dielectric surface is: ∆UGDC = 5.8 Te, and the potential drop at the SE surface is: ∆USE = 5.1 Te.
The IES electrodes are exposed to heat fluxes from ions, electrons, and photons. During ion source operation, the charge-exchange ions formed in the volume of the outward ion flow, both in the inter-electrode gap and in the beam neutralization zone located beyond the output cross-section of the accelerating electrode (AE), deposit on the AE surface. The IES electrodes are exposed to thermal radiation coming from the internal surface of the GDC, heated up to temperatures of about 300 °C.
The resulting charge-exchange ions have thermal velocity and about-zero energy. They are accelerated in the electrostatic field, deposit on the negatively charged AE (usually minus 200–500 V), which leads to formation of a potential barrier for electrons from the neutralization zone. The charge-exchange ions accelerating in the AE electrostatic field bombard its surface with an energy that is a function of the potential at the point of their formation. If the acquired energy of the charge-exchange ion exceeds the sputtering threshold of the AE material (30–40 eV), its surface is sputtered. It is this mechanism of AE surface erosion that dictates, to a large extent, the IS lifetime [32,46,47]. Heat fluxes brought by the charge-exchange ions to the AE are determined by the charge-exchange ion current and by the average energy transferred by them to the AE surface atoms. Experimentally, these currents are determined as the current in the AE power-supply circuit (10–11% of the ion beam current).
As already noted, the electromagnetic field is the only supplier of thermal power to the IS. Electromagnetic energy is absorbed by plasma and carried over by ions and electrons to the GDC wall, being converted into heat, while a part of it is absorbed by the IS structural elements and dissipates as heat. Since the IS operates in vacuum, there is no convective heat transfer. In these conditions, it is sufficient to factor in conductive and radiative heat exchange in order to describe the IS thermal state (the source of heat dissipation is a gas-discharge plasma). The conductive heat exchange inside and between the IS structural elements is described by the Fourier law:
where is the differential operator; λ is the thermal conductivity coefficient; Qi is a function of volumetric heat sources (heat dissipation in the IS caused by the induced eddy currents);and T is the temperature.
In the presented thermal model, for any structural element the thermal conductivity coefficient is assumed to be constant and independent of temperature; then the equation is transformed into the P.–S. Laplace equation:
The radiative heat transfers between the surfaces of the IS structure units, between the external surfaces of the IS structure units and the environment is described by the law of J. Stefan, L.E. Boltzmann:
where ε is the emissivity of the material (it is equal to the absorption capacity over the entire wave length spectrum according to the gray body assumption [48]); Grad is the parameter that determines the input heat flux of the mutual radiative heat exchange between the units of the IS structure; Gpl is the parameter that determines the power flux from the discharge plasma; and σ is the Stefan–Boltzmann constant.
Qrad = ε(Grad + Gpl − σT4),
Generalization of thermal processes occurring in the IS is presented in [40].
Equations (4) and (6) fully describe the IS thermal state. Due to the overwhelming use of thin-walled elements in the IS structure, it is not necessary to take temperature distribution over the thickness of structural elements into account, i.e., the internal heat sources can be factored in as an integral part of Gpl, the more so since such sources are present in a thin skin layer during the inductive heating.
The main problem is the need to take contact resistances between different structural elements into account, which is determined as applicable, depending on the configuration under consideration.
The thermal state calculation procedure includes the following:
- -
- Calculate discharge plasma parameters in the GDC;
- -
- Determine heat fluxes from plasma over the surface of the IS structure;
- -
- Solve the problem of heat transfer from the IS structural elements using Equation (5) by numerical methods with account of the boundary conditions (environmental conditions), heat fluxes from the structural elements in view of contact resistances and input heat fluxes from plasma.
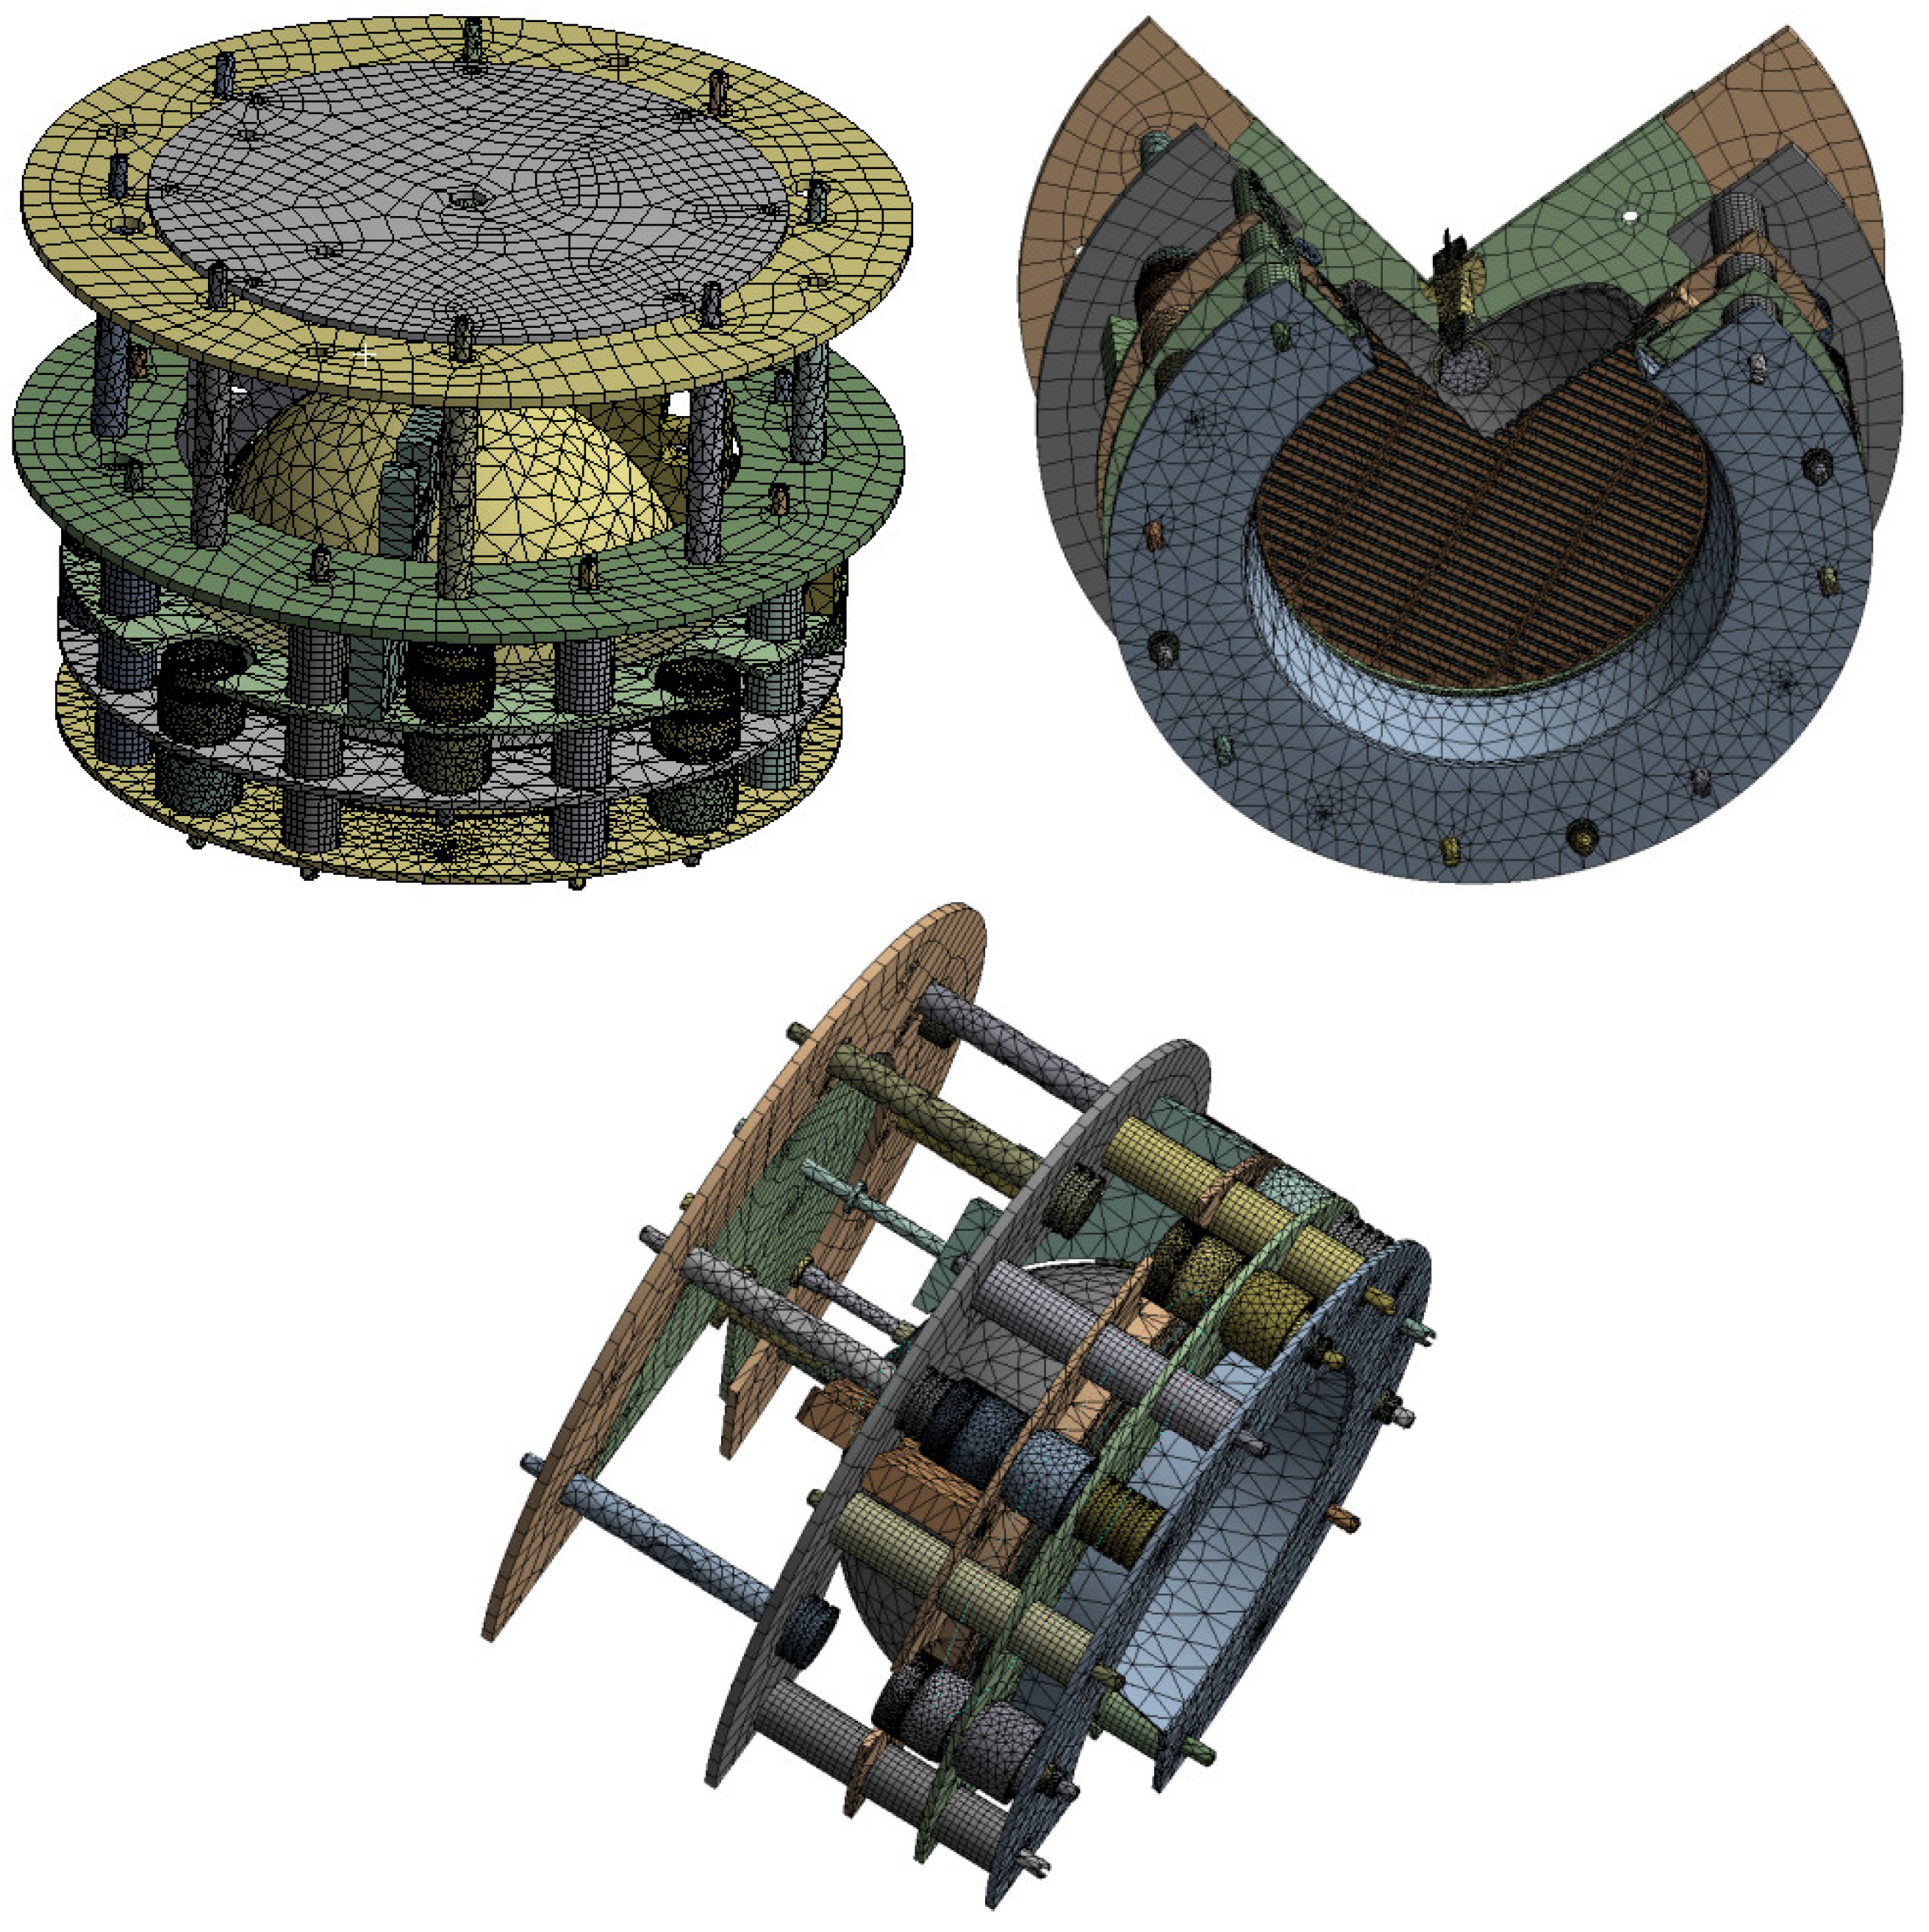
The IS design is transformed into a simplified model, which is covered by a computational grid to subsequently solve the problem by the method of discrete elements, in each of which the temperature, thermal conductivity, and degree of blackness (emissivity factor) are assumed to be the same. Accordingly, the accuracy of the performed calculation will be determined by the number of discrete, which in its turn depends on the computing system capacity available to the computing engineer. In our case of the IS thermo-physical state analysis, the structure was divided into more than 100,000 discrete elements (Figure 2), for each of which the following was assigned: spatial coordinates, the degree of blackness (emissivity factor), the thermal conductivity coefficient.
Radiation fluxes entering each element are presented in [40] and are determined by the following equations:
where is the degree of blackness (emissivity factor) for the surfaces of the elements; is the L. Kronecker symbol—the indicator of equality of the elements: a function of two integer variables, which is equal to one if the elements are equal, and equal to zero in any other case; are the areas of the elements; is the matrix of the element mutual radiation coefficients calculated by:
where are the angles between the normal to element i and the axis connecting the centers of elements i and j.
The heat balance equation for each partition element has the form:
where is the thermal power flux coming out of the i-th element of the computational grid; is the radiative heat flux coming to the i-th element from the j-th element derived from by (7); is the aggregate thermal power flux reaching leaving the surface of the element (in our case, these are the heat fluxes onto the GDC wall:
; onto the screen electrode surface facing the GDC: ; onto the AE surface facing the SE: —in some cases, they turn to zero); is the thermal power flux from the inductor, which is dissipated on the active resistance of the inductor and is defined by eddy currents in the inductor (in some cases, they turn to zero); is the internal area of GDC surface; is the charge-exchange ion current; is the average energy of the incident charge-exchange ions; is the ion energy accommodation coefficient; is the electronic work function of the AE material; is the area of the SE annular section; is the electronic work function of the SE conductive material; are the thermal conductive fluxes between the neighboring elements i and j, which are defined in the following way:
- -
- If discrete elements belong to one and the same structural element—by using the finite-difference expression of the Fourier thermal conductivity law, where, instead of the temperature gradient, the temperature difference of adjacent elements attributed to the effective distance between the elements is used [40]:
- -
- If discrete elements belong to different structural elements—this heat flux is software-defined, and the effective value of the thermal conductivity coefficient is used as that is derived from and of the contacting surfaces [49] in the case of an ideal thermal contact; in the case of a real thermal contact, the heat flux is derived from the relation:
The resulting equation defining the HF power balance has the following form:
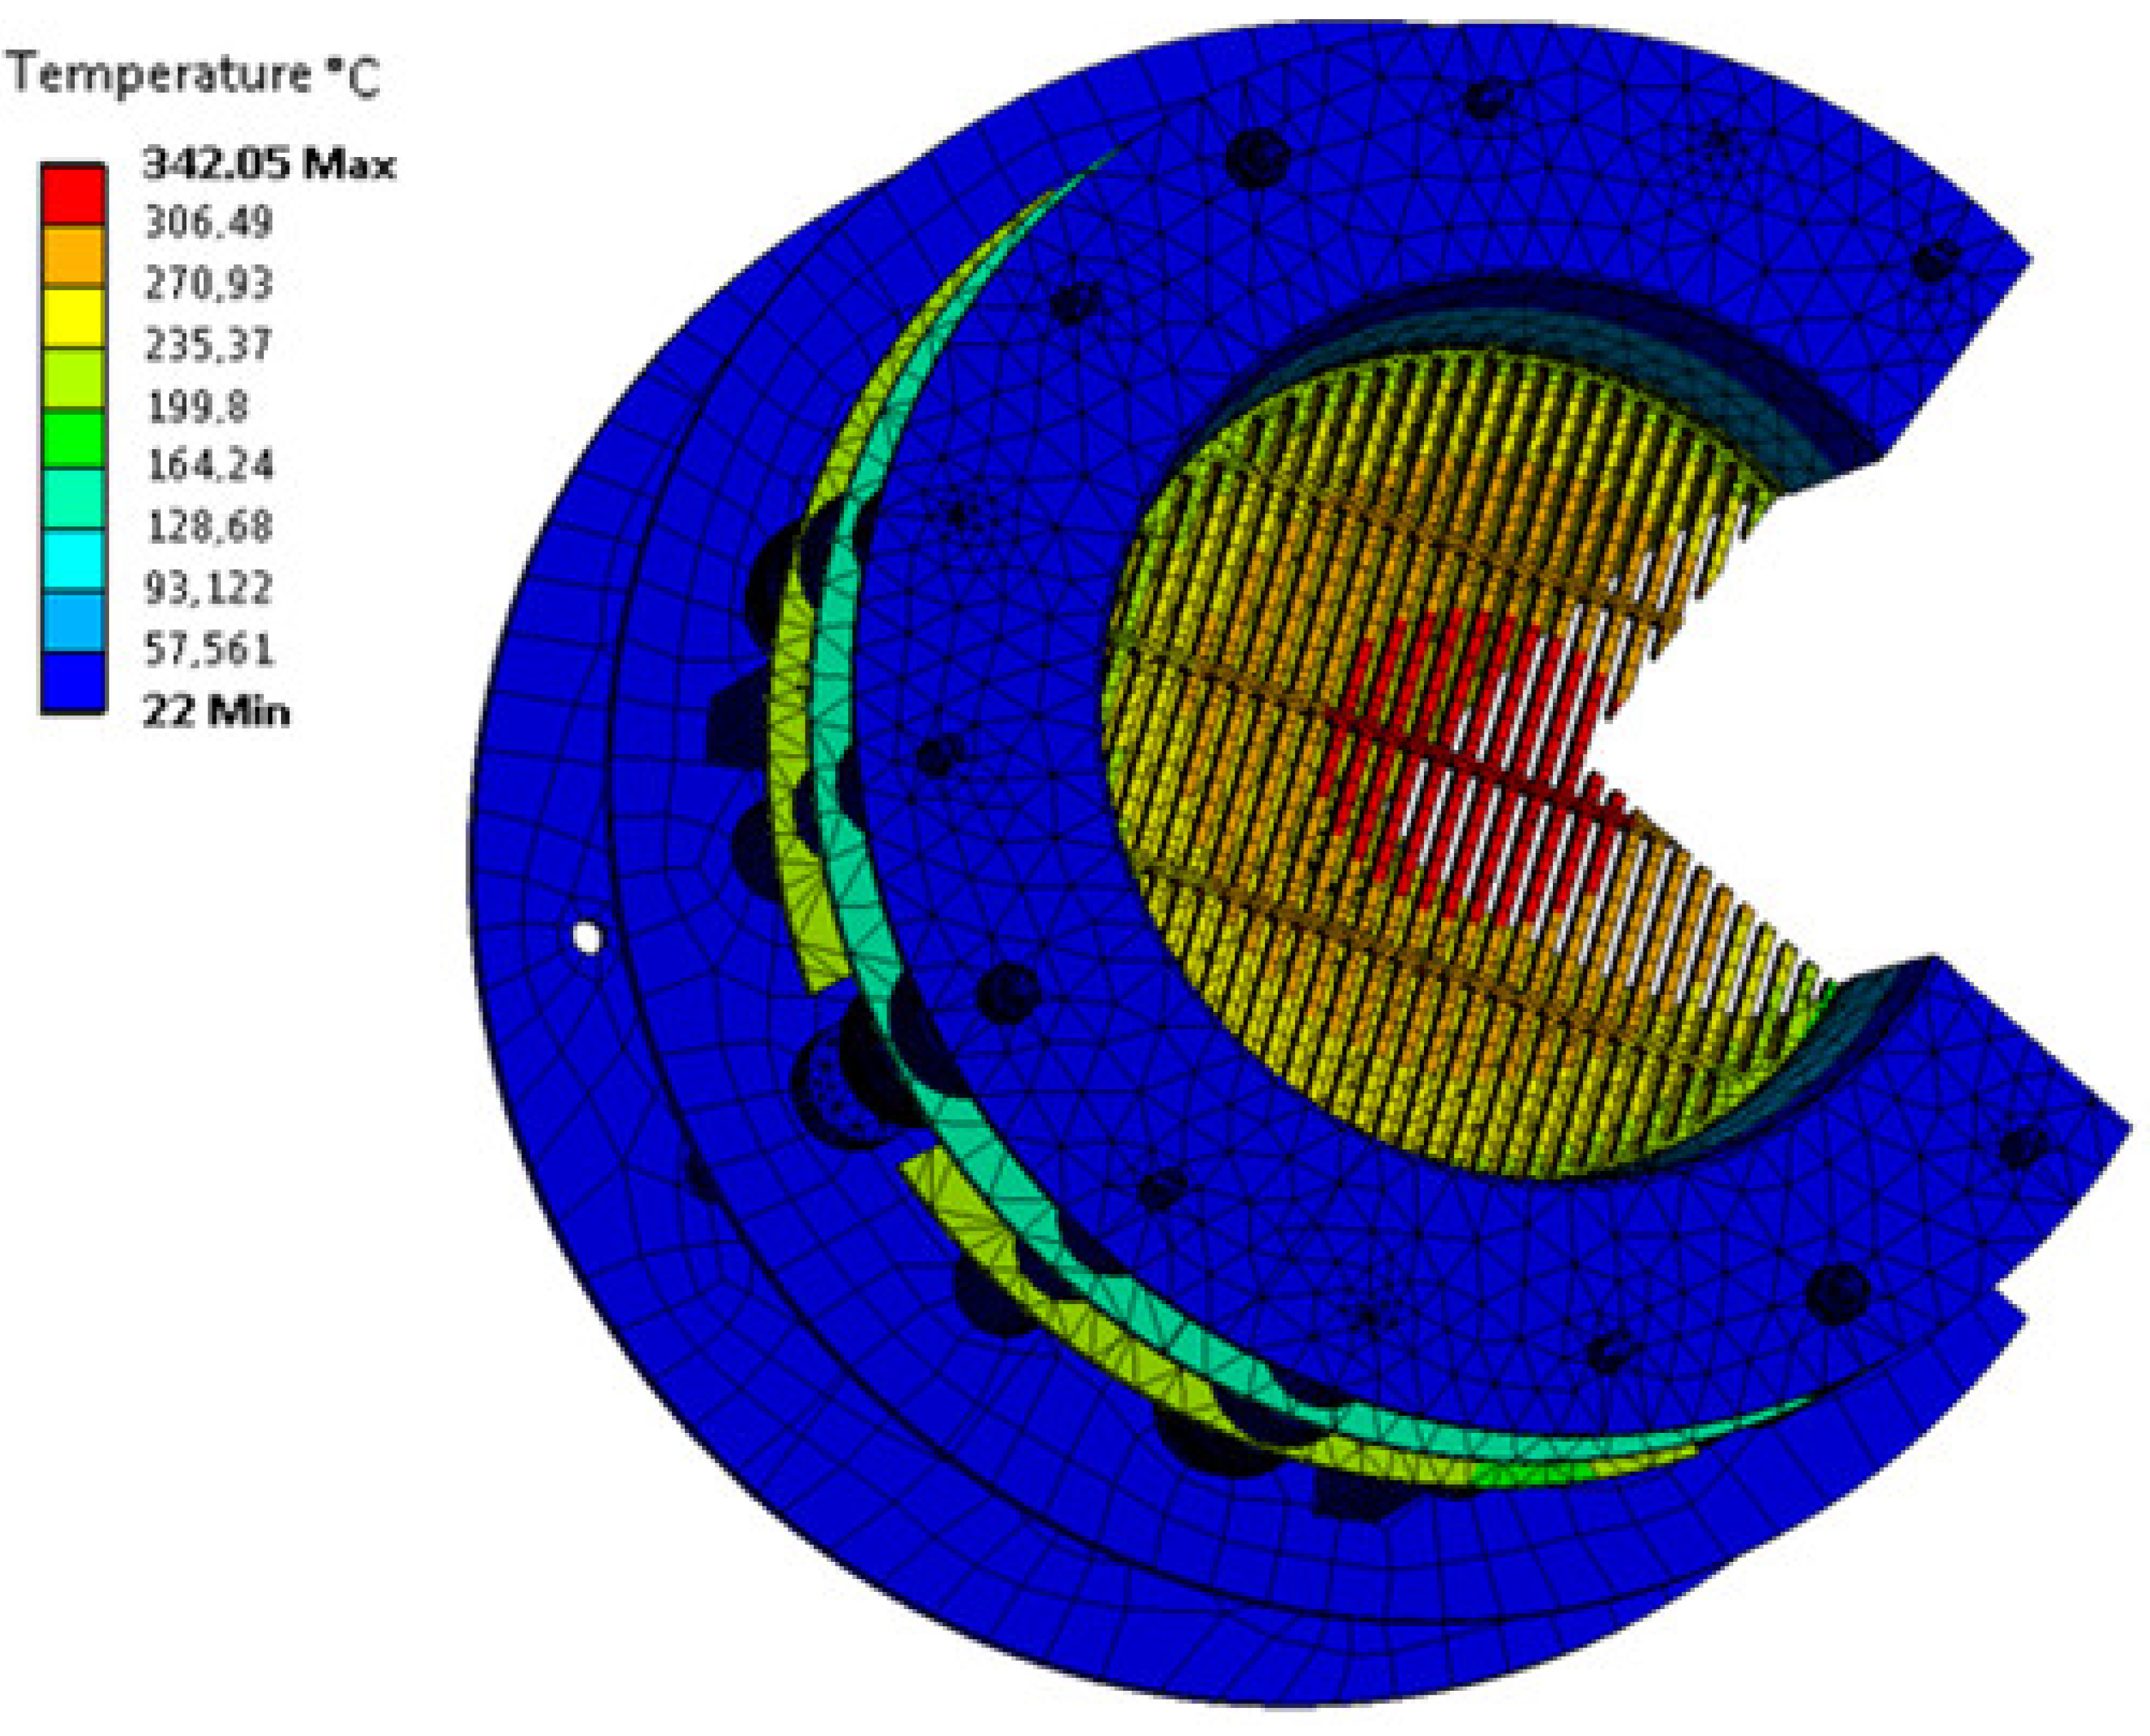
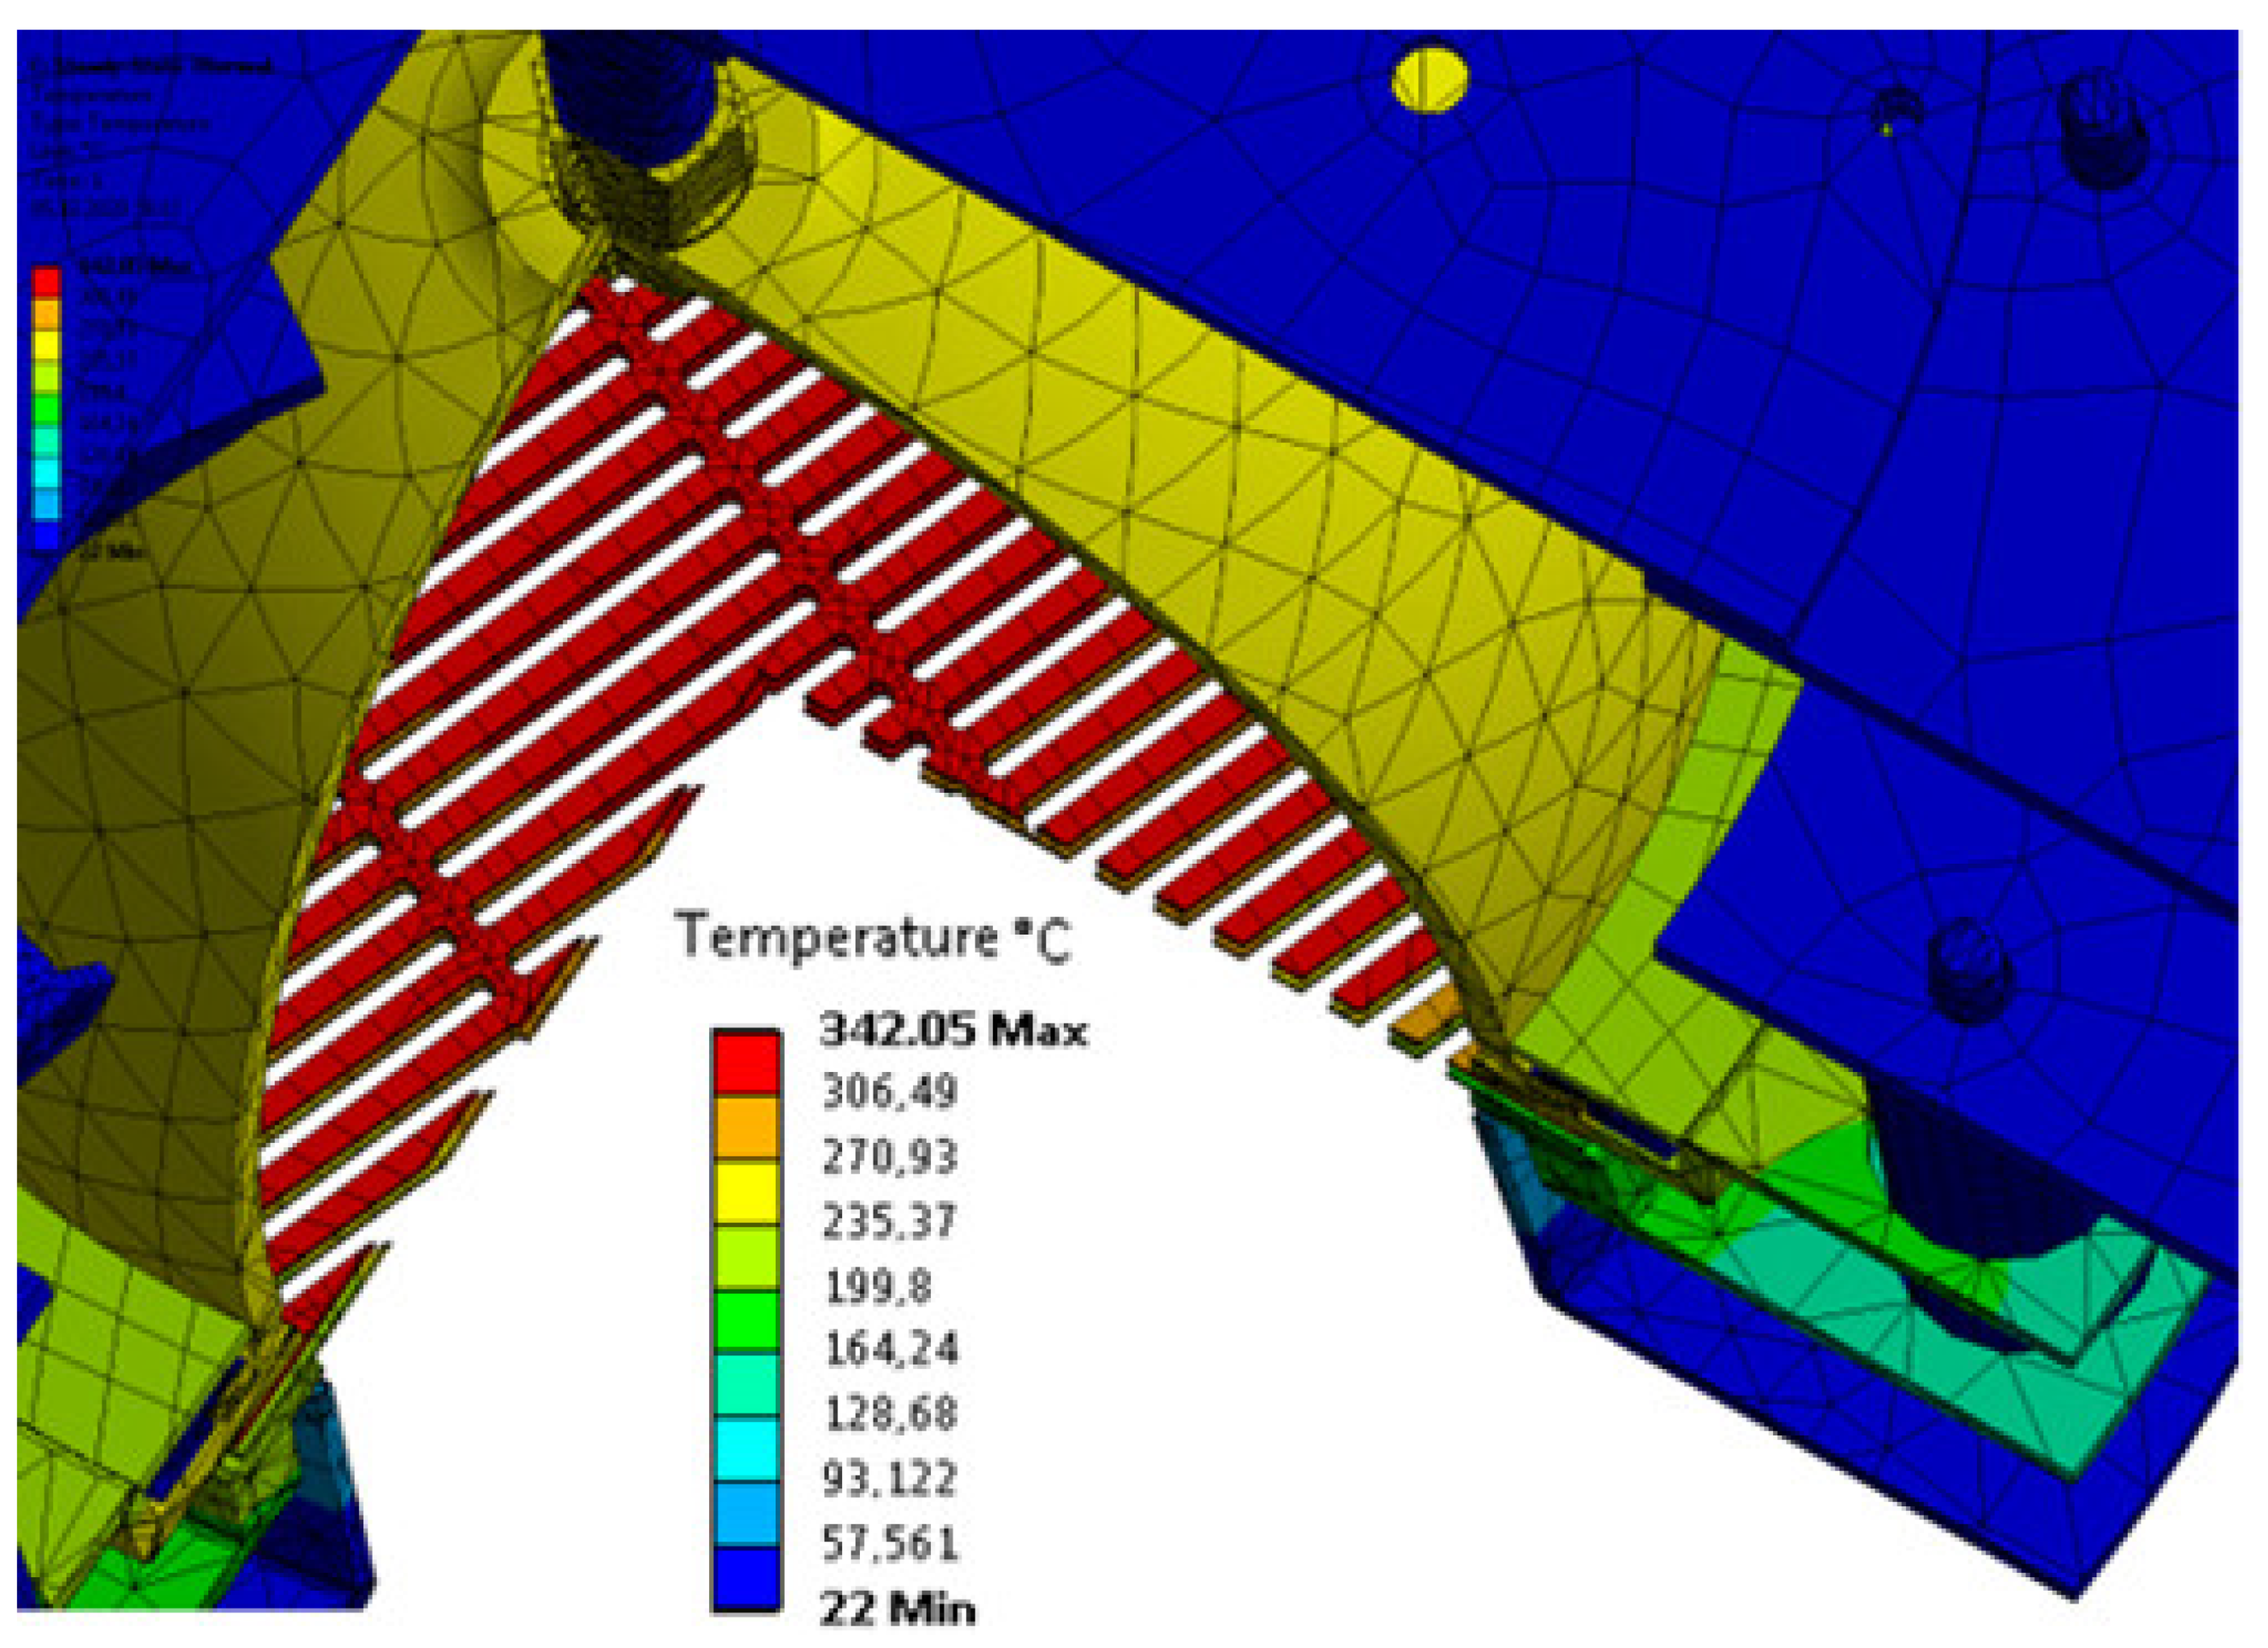
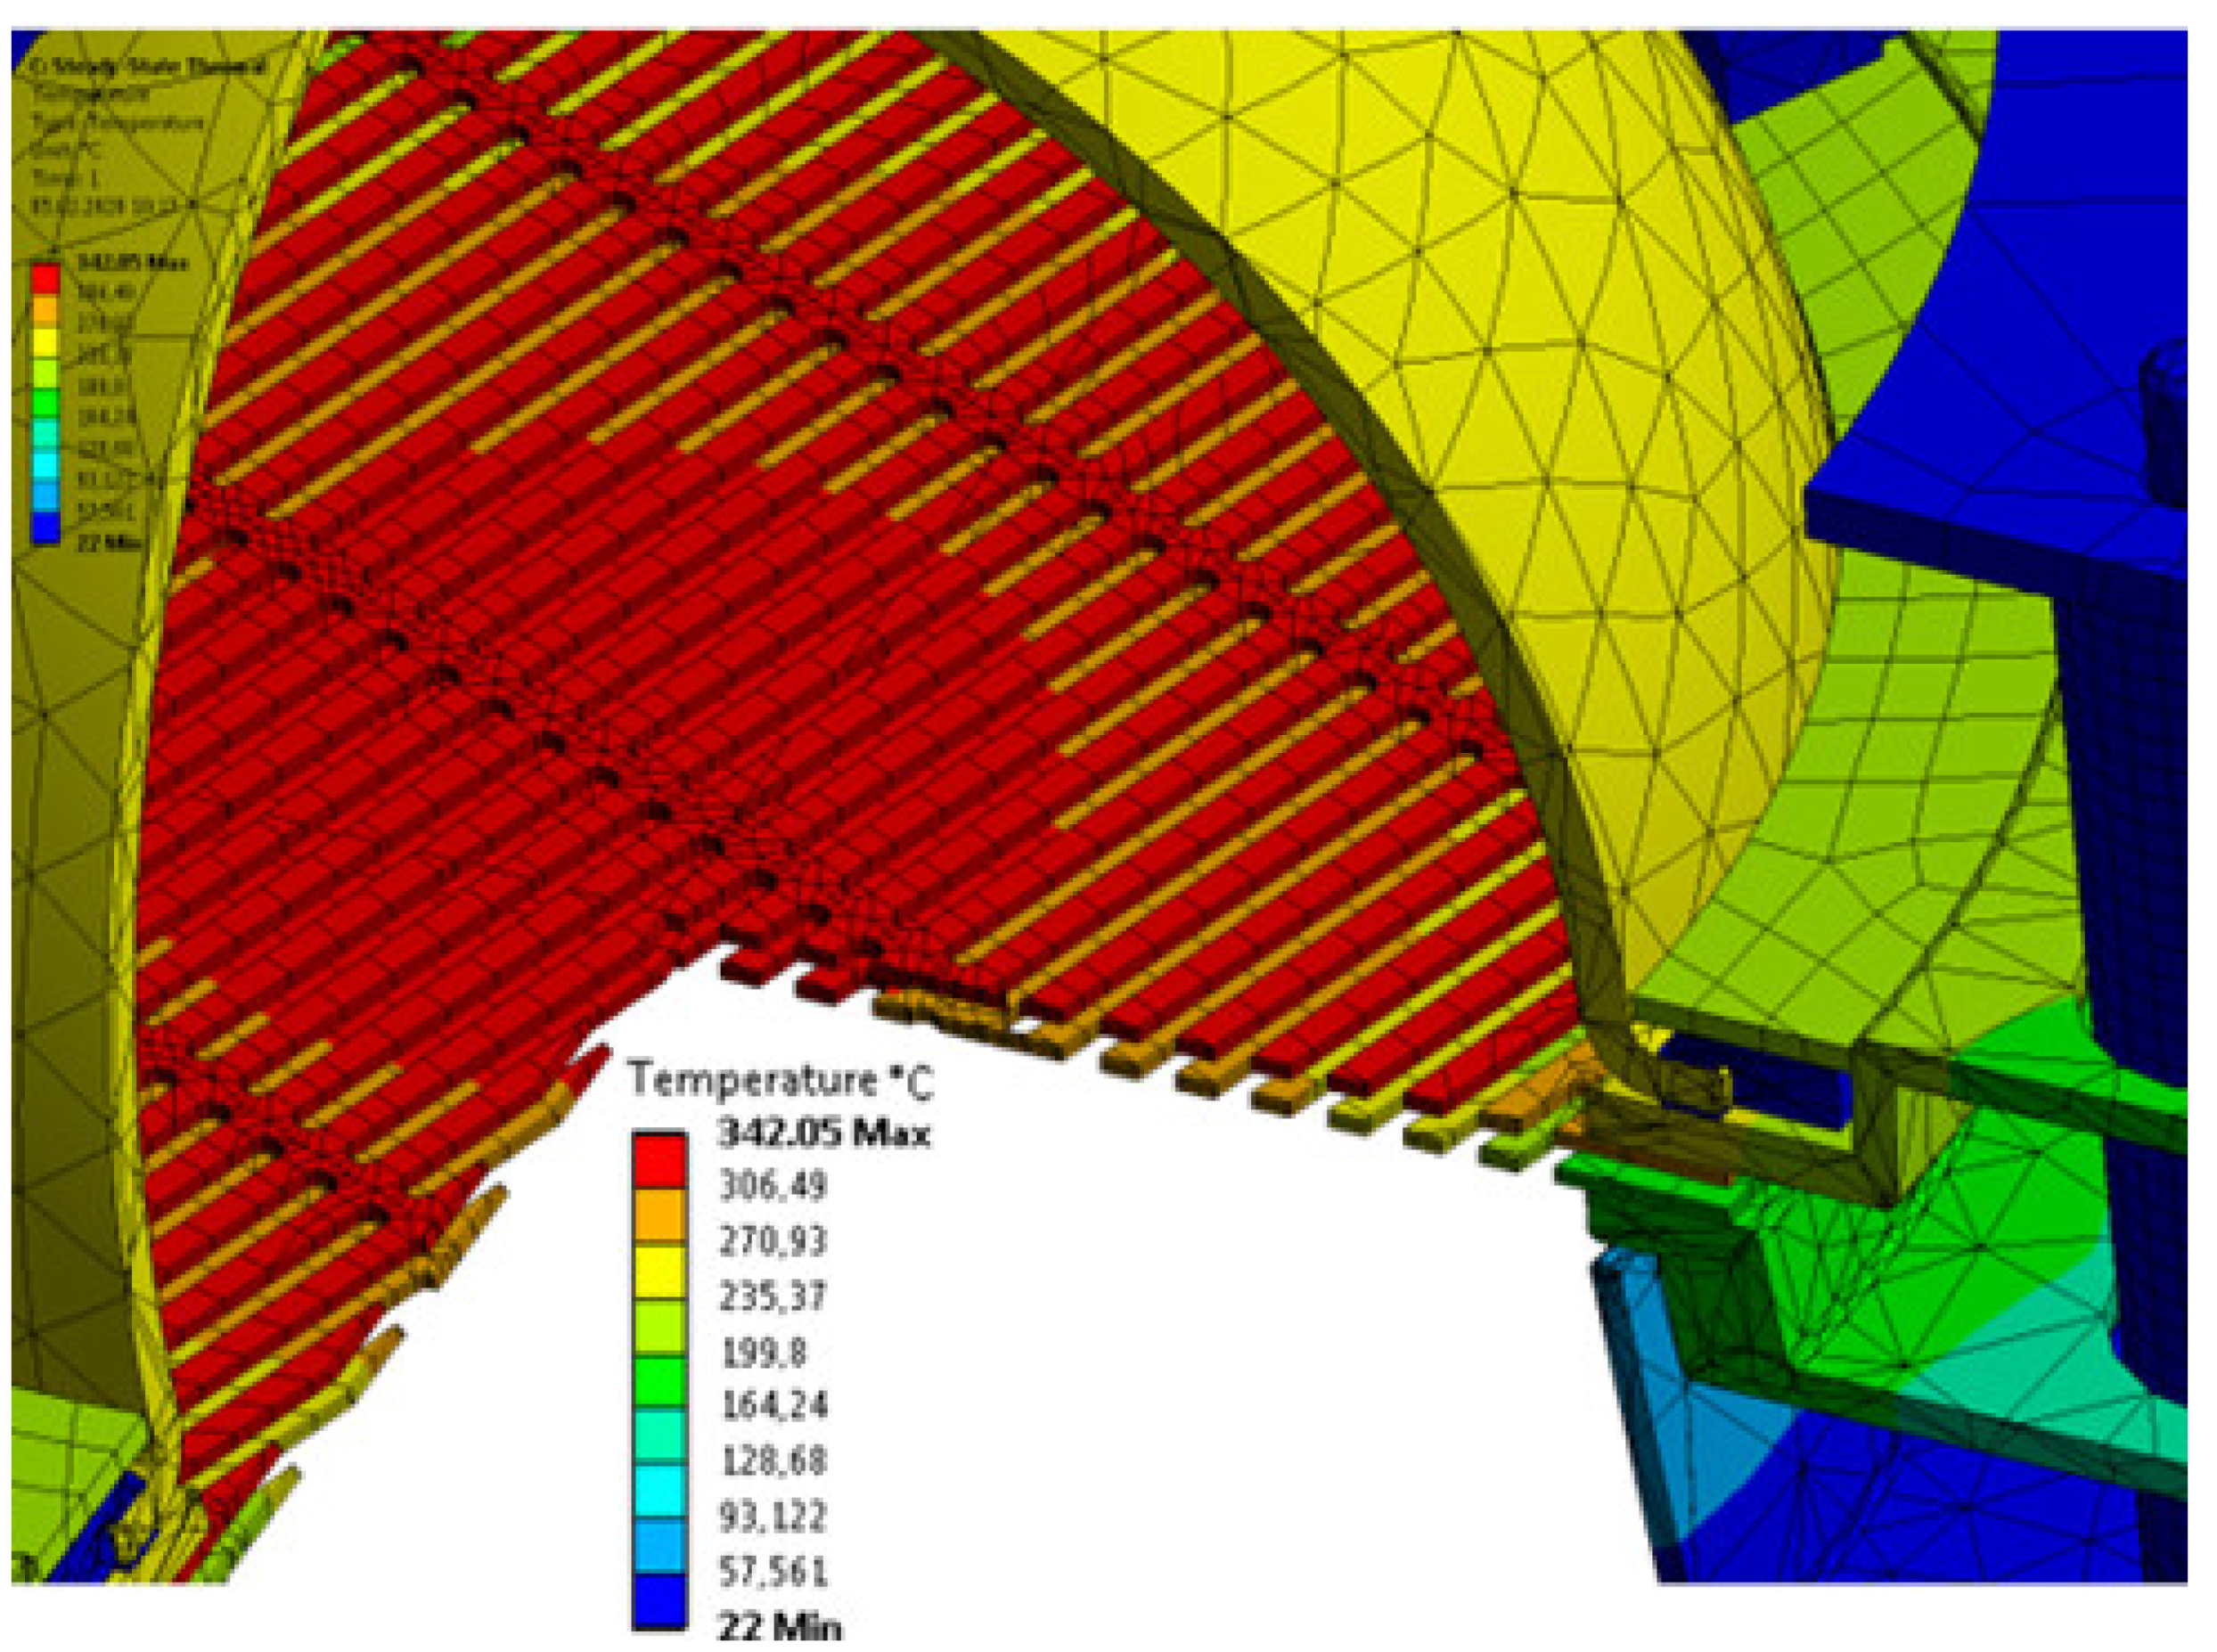
Model calculations for the developed IS design have been conducted. Physical parameters of the materials, of which the IS structural elements are made, and initial temperatures of such elements (room temperature) were assumed as initial data. The results of the IS analysis are shown in the diagrams below (Figure 3, Figure 4 and Figure 5).
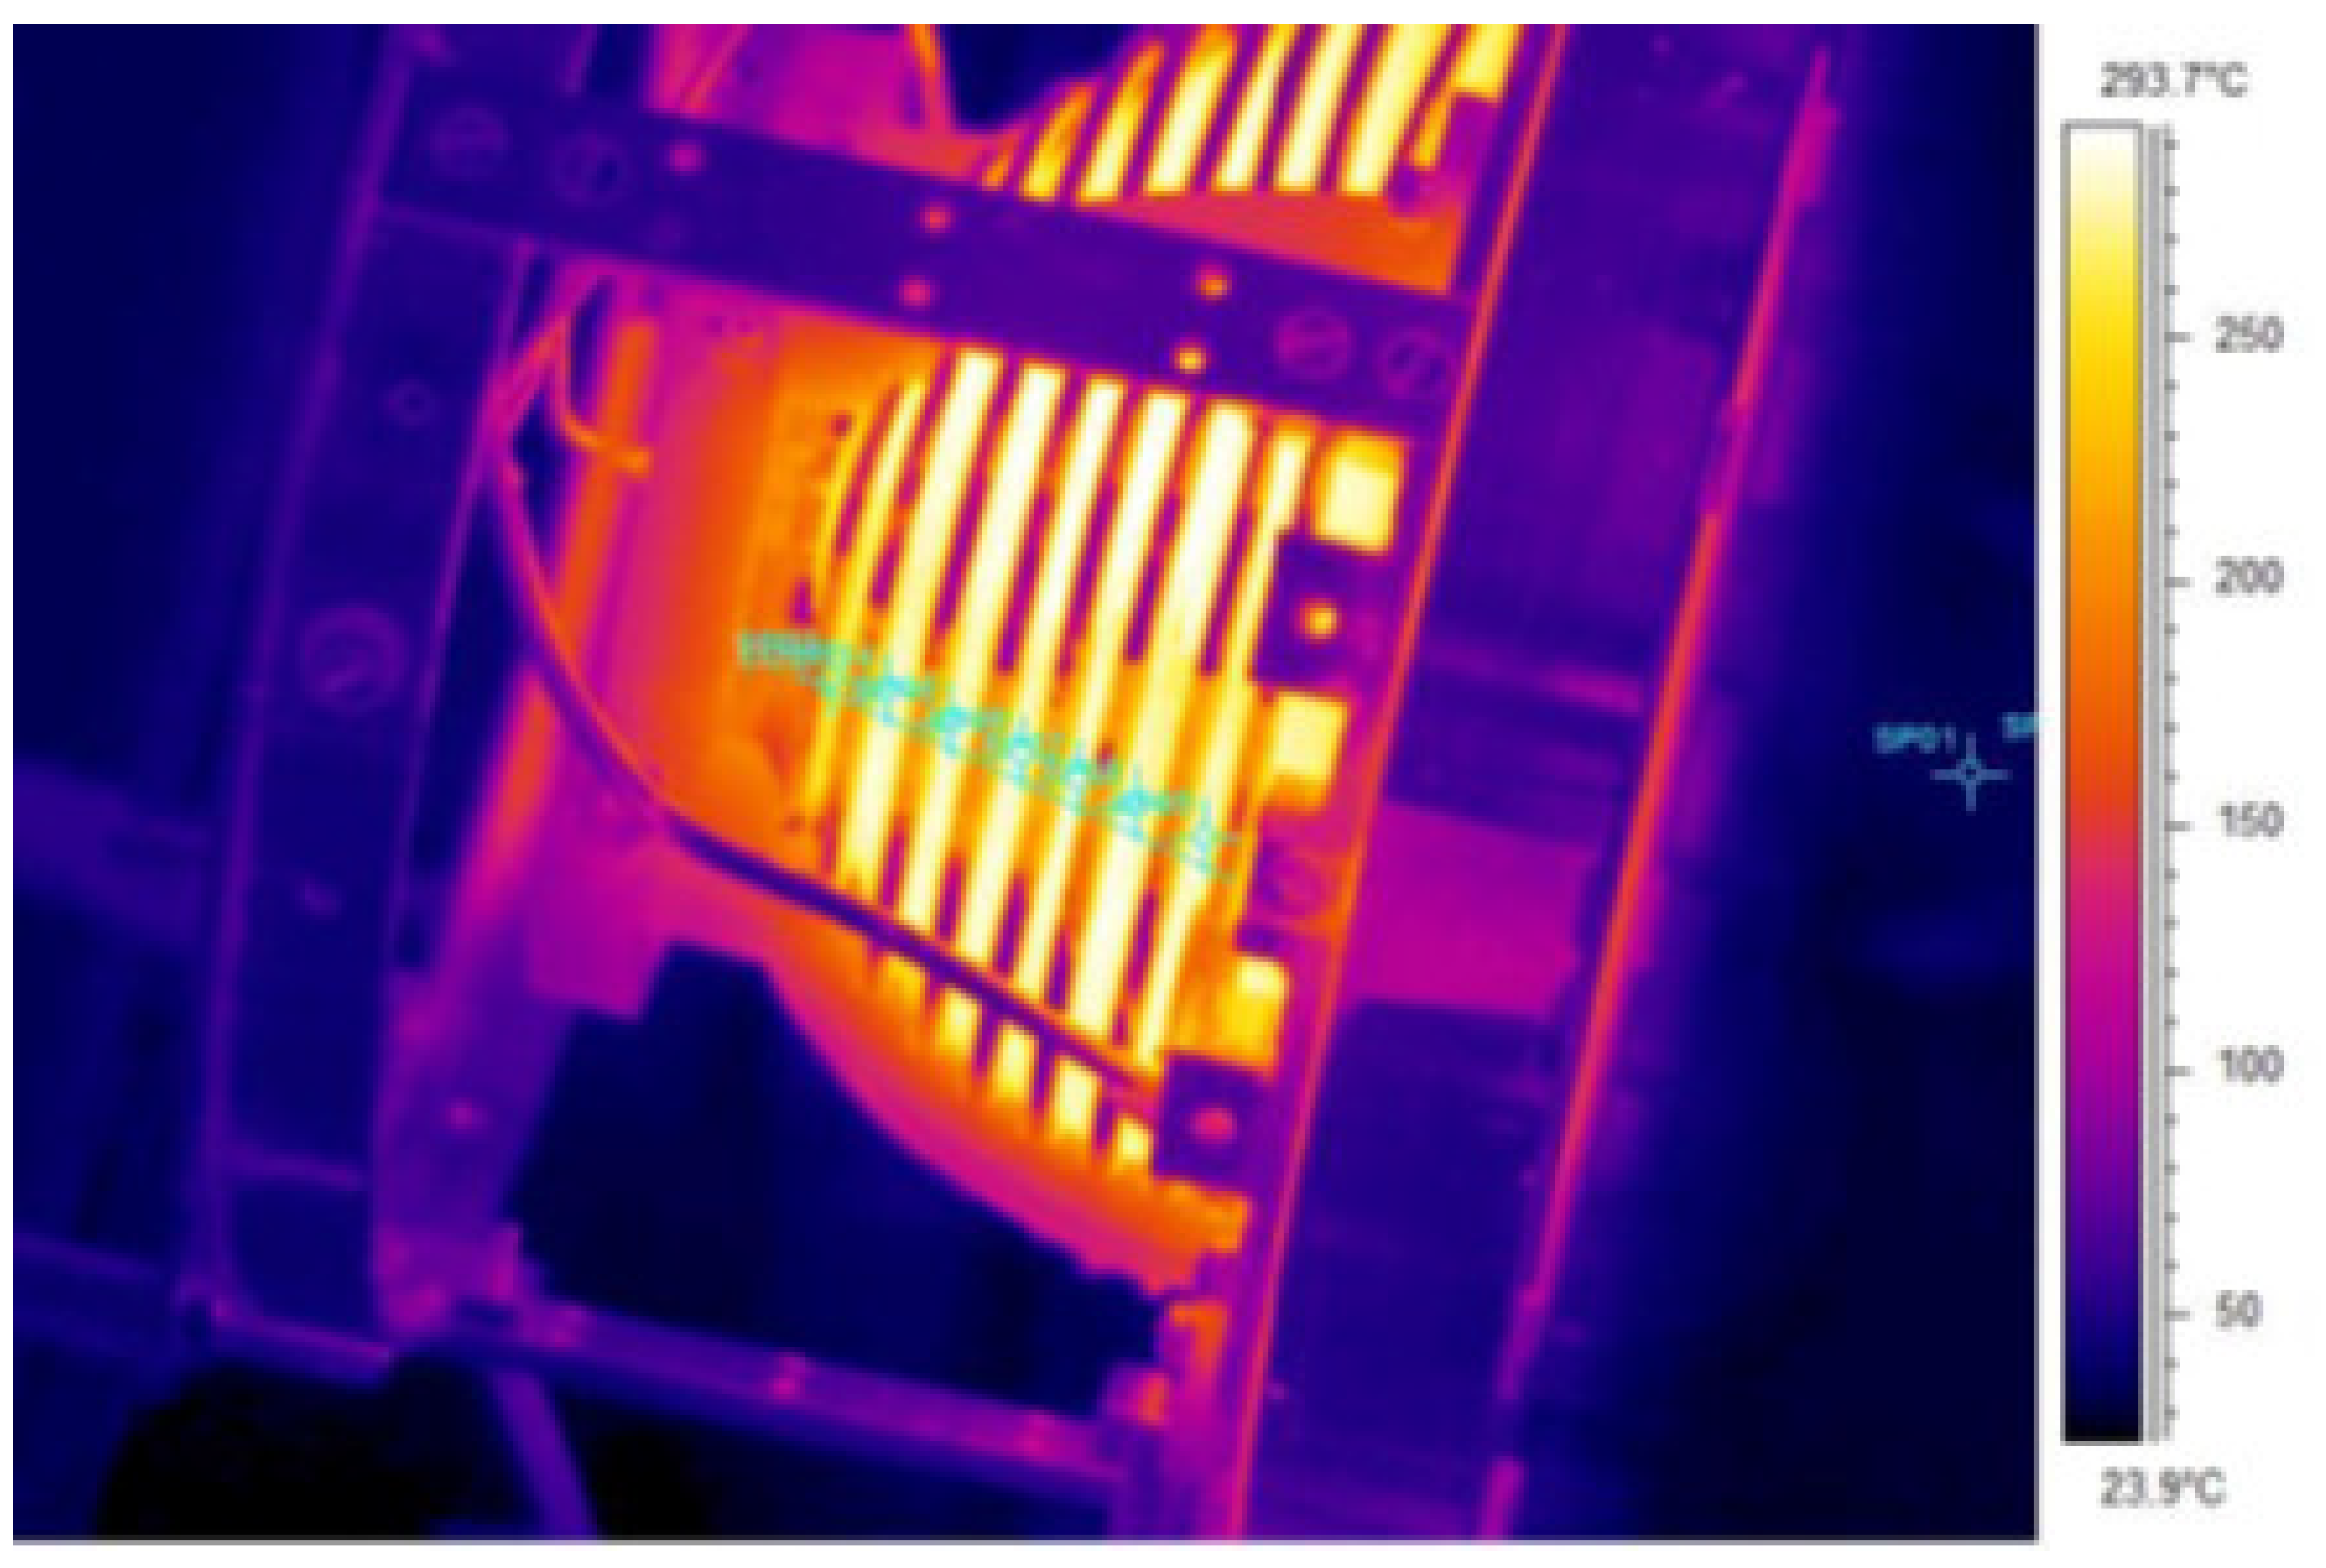
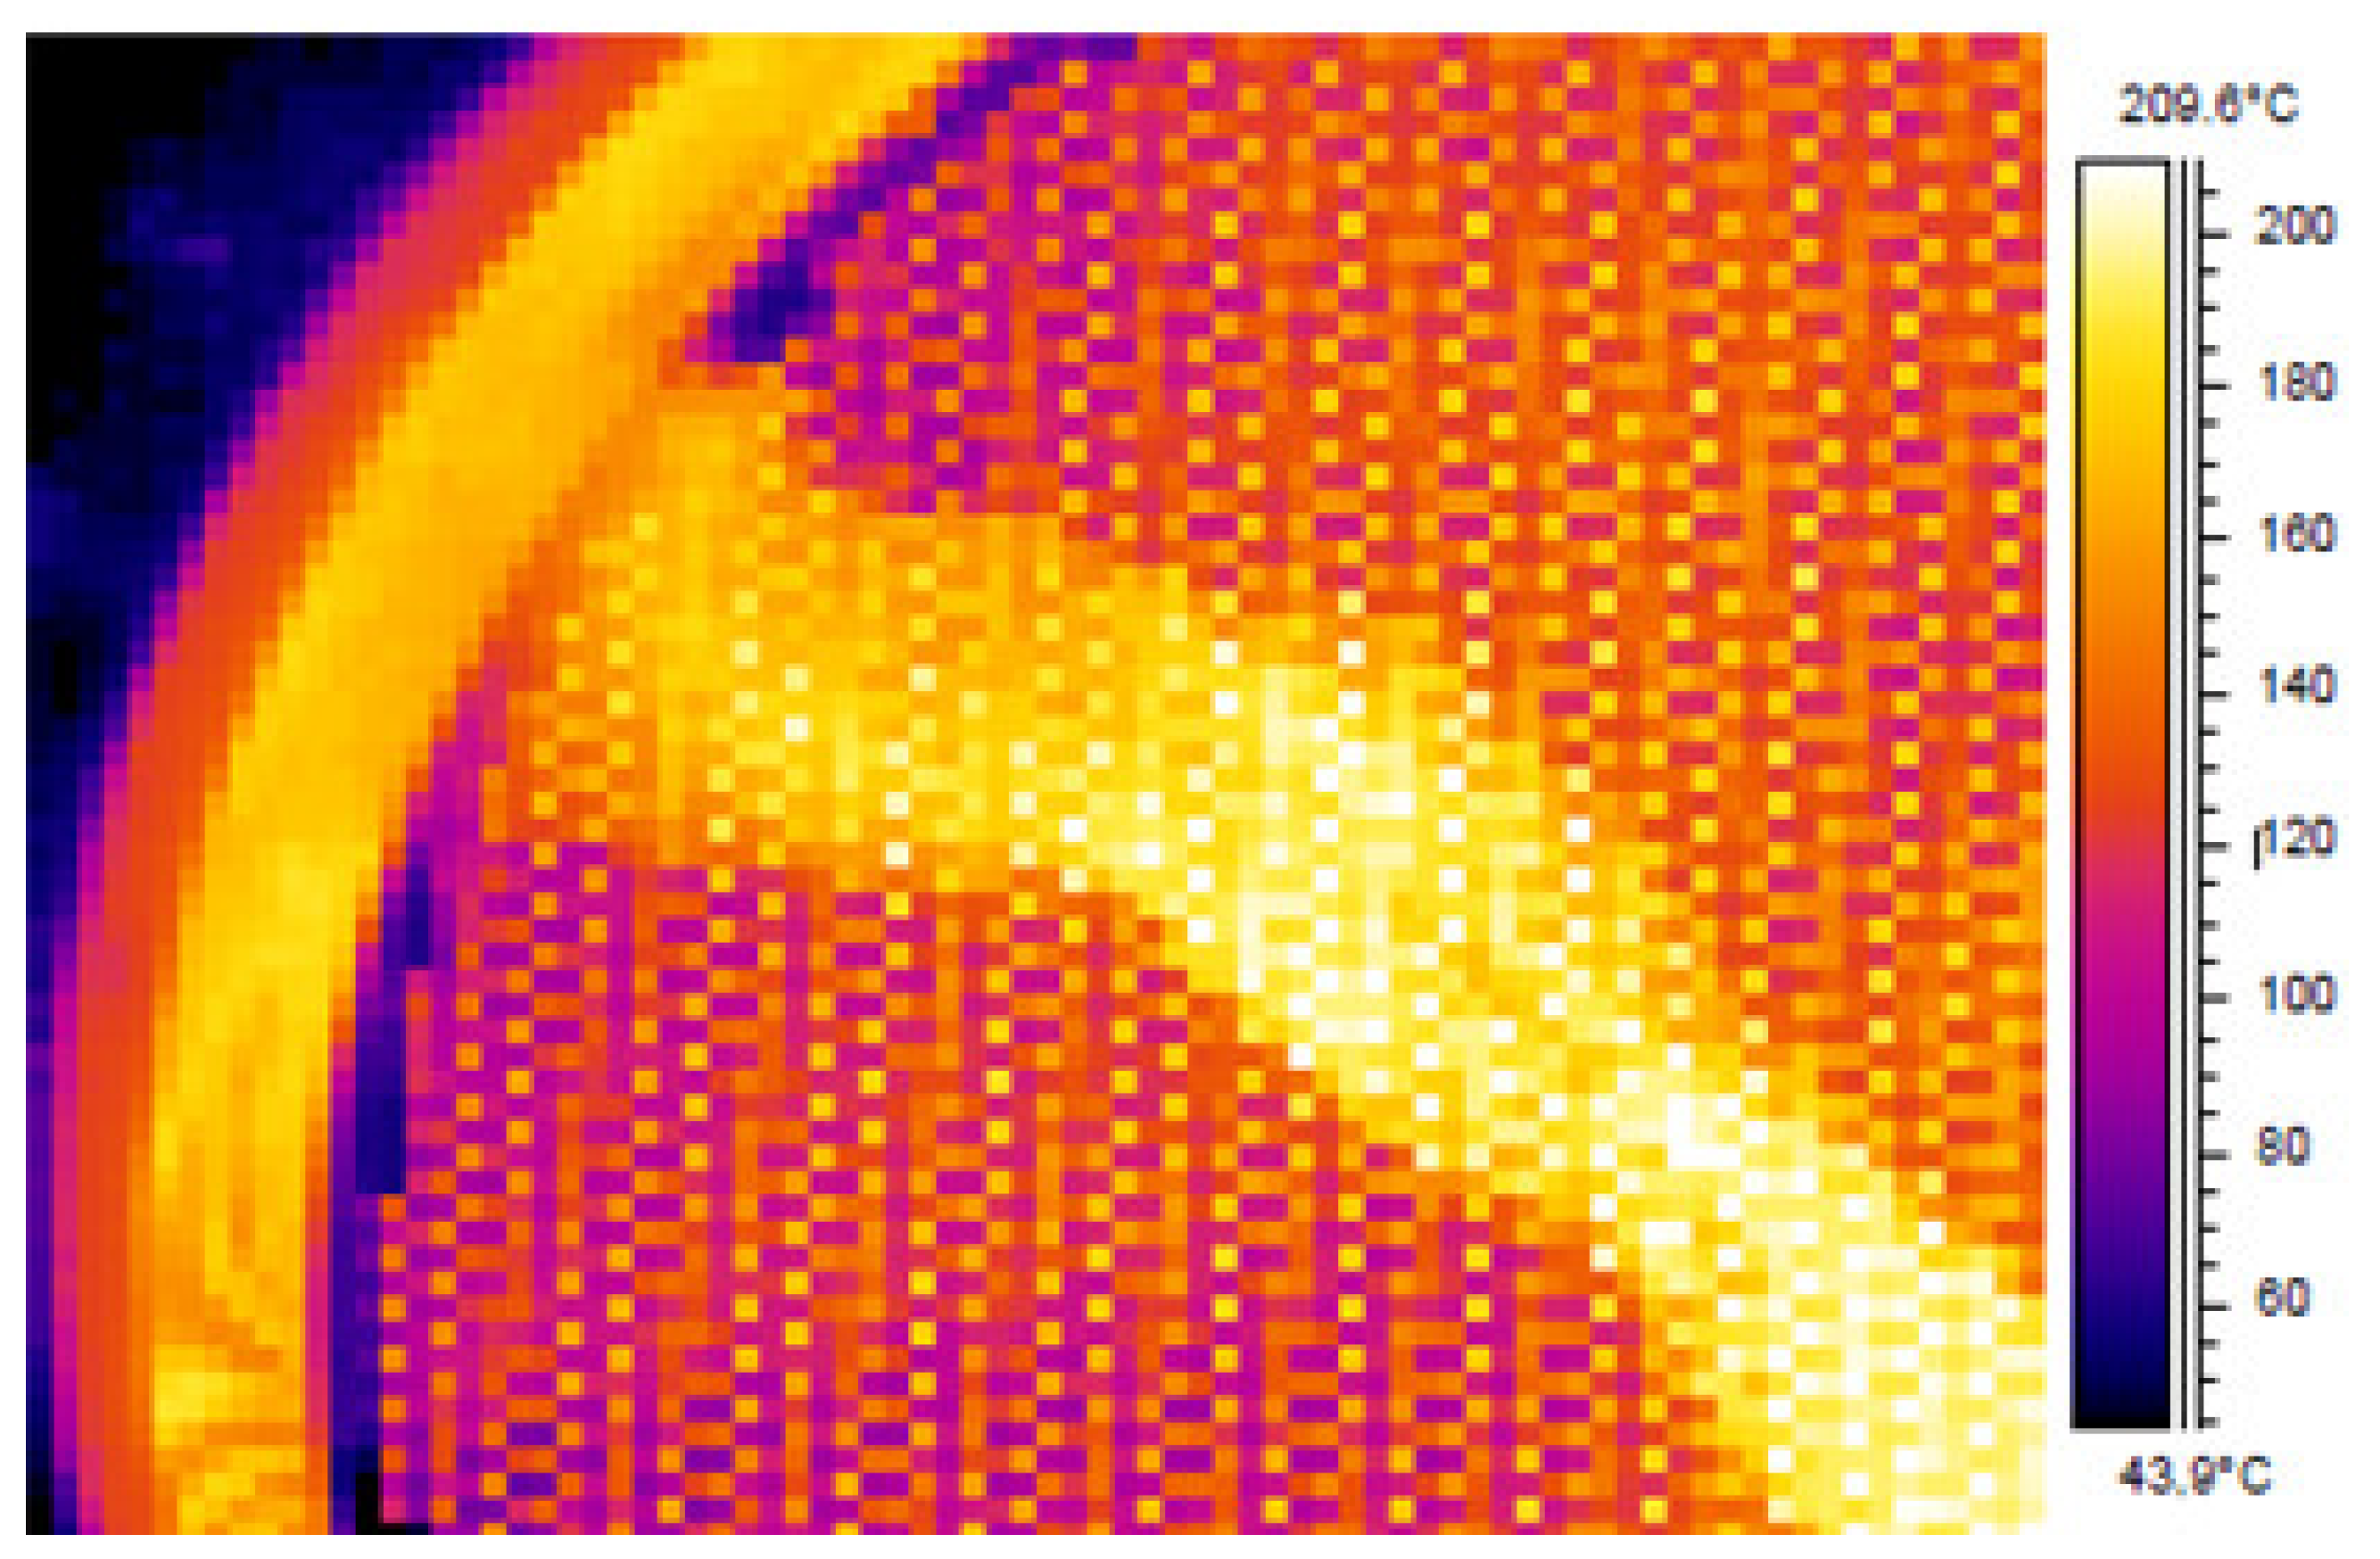
In situ measurements of IS temperature patterns using a thermal imager were performed to verify accuracy of the developed thermal model. As an example, the photo shows a IS GDC thermogram (Figure 6). It can be seen that the GDC is almost homogeneously heated. The temperature falls near the gas inlet. It is difficult to define temperature profile for the AE perforated part (Figure 7) due to the insufficient resolution of the thermal imaging camera. However, the conclusion can be made that the data obtained through the analytical model are correct.
The performed temperature measurements demonstrate consistency between the predicted and experimental temperature values for the IS surfaces with a high engineering accuracy, which makes it possible to use the proposed thermal model developed for predicting temperature distributions while making calculations for predicting heating of the IS structural elements.
5. Thermomechanical Model Development
Heating of the IS structural elements causes stress and strain (deformation) in these elements. Stability of the IES geometric parameters plays an especially important role in the IS operating capability. The IES unit is the most critical and complex IS element from the structural and technological stand point. More than 95% of power supplied to the IS is used in the IES [50]. To provide for the IES unit reliable operation, it is necessary to ensure the inter-electrode gap stability in various IS operation modes and the minimum possible deformation of IES electrodes. Operation of electrodes as part of the IES features significantly non-uniform heating and deformation that can cause deterioration in the source output characteristics (the ion current density and thrust), and also lead to a high-voltage breakdown [46,51,52].
One of the proven technical solutions to ensure stability of IES unit operation is the usage of profiled electrodes with an initially designed deflection (bend). Non-uniform heating leads to additional deflections of electrodes. Due to the above issues, it is important to perform, at the design engineering stage, a preliminary stress–strain electrode behavior analysis, as well as an analysis of their linear and angular displacements during the thermal deformation process.
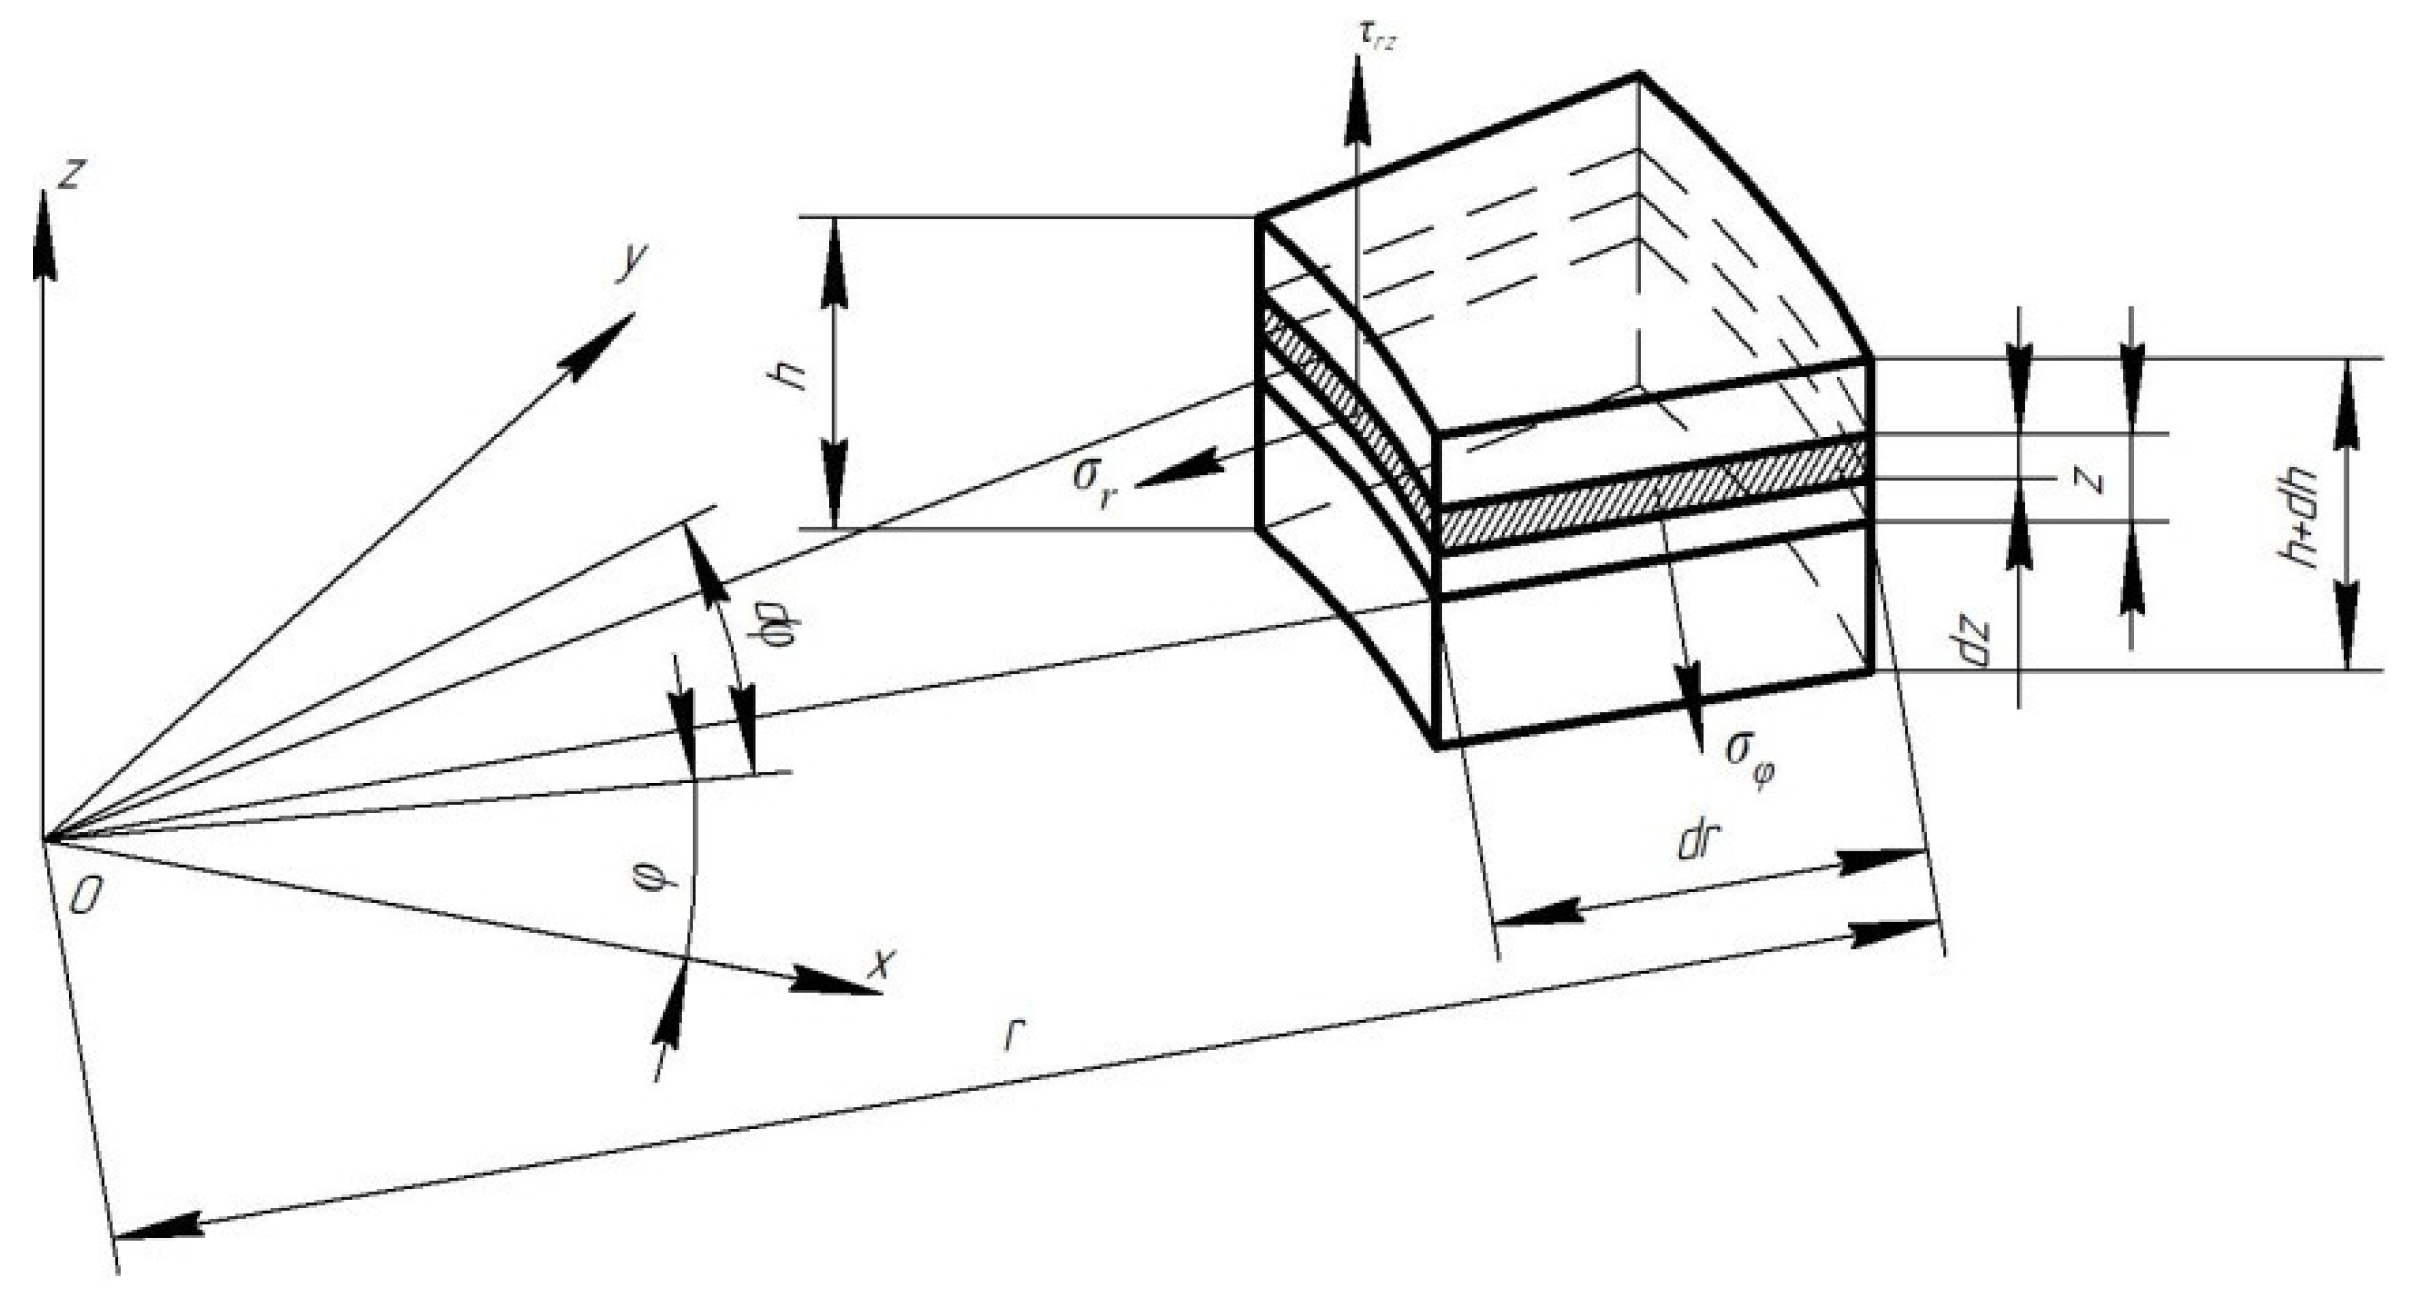
The approach to calculate IES electrodes is based on application of the electrode continuous model representing it as a structurally orthotropic round plate, or a shallow spherical panel (Figure 8) [53]. The electrode element located at distance r from the electrode center, with initial thickness h, and final thickness h + dh, with depth dr and width dφ is assumed as a calculation unit. This element is decomposed into sublayers with thickness dz, in each of which the radial σr and tangential σφ stress components are given.
The structural orthotropy coefficients for such model are the cylindrical section and the meridian section filling factors, kr and kφ, respectively, in a thin-walled structure with close-packed perforation. The use of these dimensionless factors made it possible to utilize the thermo-elasticity equations [53] in combination with solutions developed to calculate perforated shells loaded with pressure, membrane forces, or bending moments [54]. The solutions were additionally adjusted by introducing additional non-uniform heating in the radial direction with simultaneous application of active loads, which allowed us to calculate nonlinear deformation for both flat and spherical electrodes [55]. Based on such a thermomechanical model and on mathematical methods of the boundary integral and integro-differential equations [56], a method to calculate thermal stability, post-critical (post-buckling) behavior and nonlinear bending for the flat IES electrodes has been developed [57].
The basic differential equations for axisymmetric thermo-elastic deformation and nonlinear bending of structurally orthotropic annular plates and of shallow spherical segments with radially variable stiffness, being under the non-uniform heating conditions along the radius and thickness, were obtained with the following assumptions:
- -
- The elasticity modulus and thermal linear expansion coefficient depend on temperature in the radial direction only;
- -
- The Kirchhoff—Love’s hypotheses are valid [58] since we consider thin electrodes;
- -
- A rectilinear shell element that is normal to the median surface remains to be rectilinear, normal to the deformed surface and maintains its length after deformation (the straight normal hypothesis);
- -
- Normal stresses in area elements parallel to the median shell surface are low compared to others and can be neglected;
- -
- Tangent stresses are static and drive equilibrium conditions;
- -
- The segments under consideration have an axisymmetric initial deflection.
With such an approach, calculation errors do not exceed δ/R, where δ is the shell thickness and R is the shell radius.
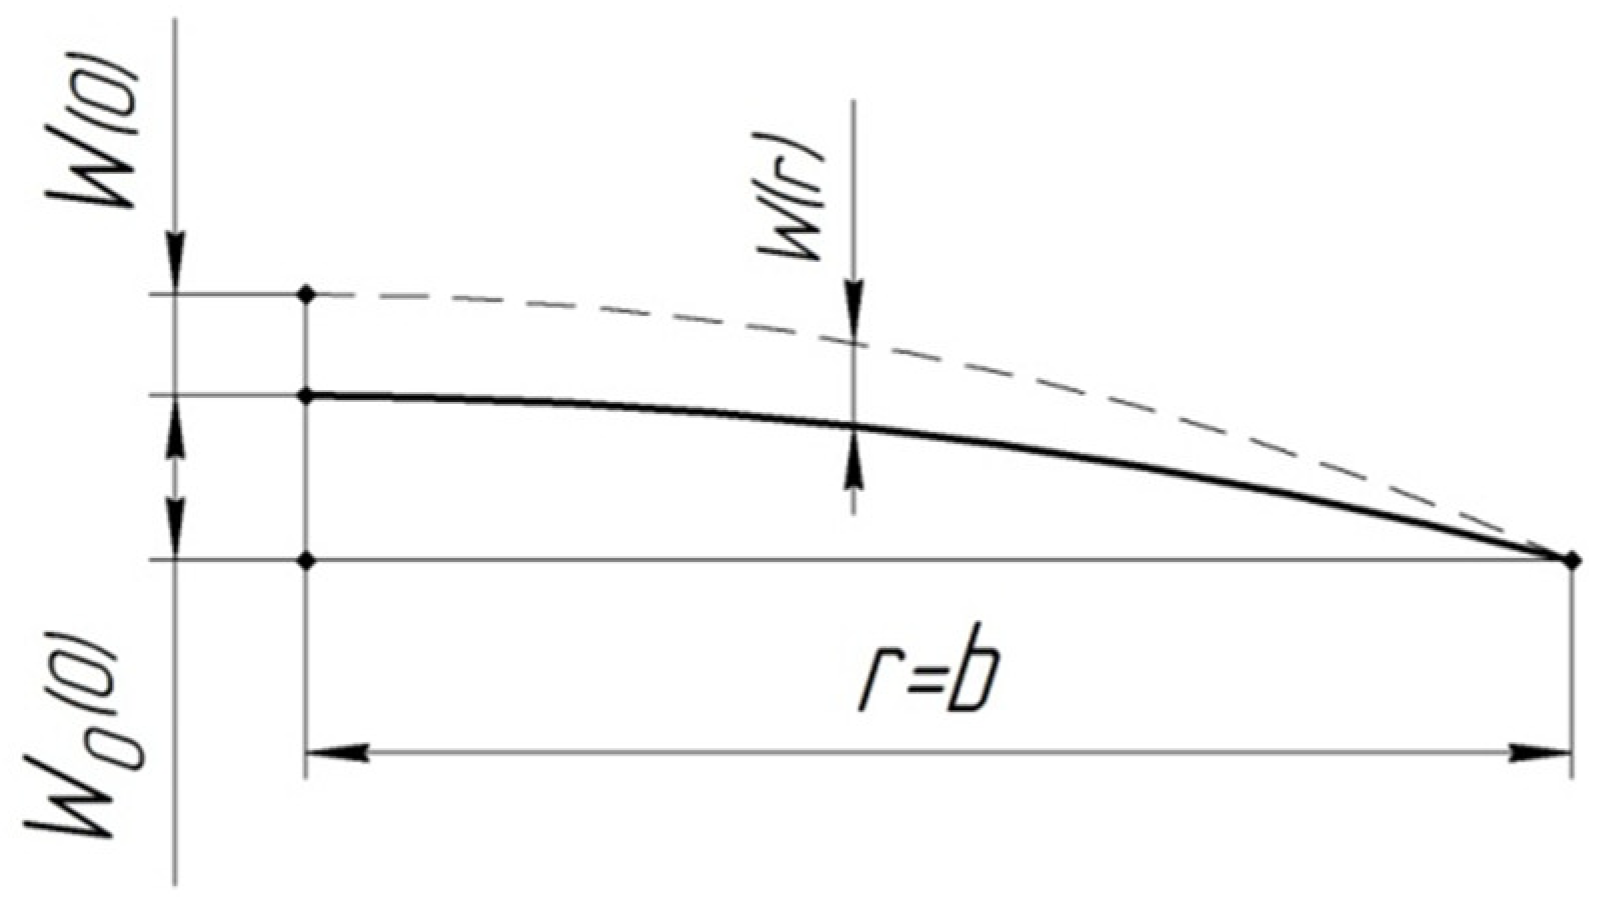
Stringent requirements are imposed on IES electrodes with respect to minimization of variations in the IES inter-electrode gaps during IS operation. The requirement relating to the permissible additional electrode deflections ∆w(0) (Figure 9) caused by the temperature fields during IS operation, is expressed as a fraction of the specified inter-electrode gap in the ES.
The electrodes are primarily impacted by the following:
- -
- Temperature fields in the IES, varying in the radial direction with a temperature differential of tens of degrees between the electrode center and the outer envelope;
- -
- Initially designed deflections of spherical electrodes w0(0) represented as spherical segments that can reach a height of 10–30 mm and more;
- -
- Electrode material linear thermal expansion coefficients;
- -
- Electrode structural orthotropy coefficients kr and kφ depending on the perforation geometry (they are constant over thickness since the electrodes have through holes).
With such initial data, thermo-elasticity equations for a structurally orthotropic modeling round-shape plate or a spherical segment that are made of an isotropic material, become as follows [50]:
where: and are the relative deformations in radial and circumferential directions for the plate points located at distance z from the median surface; and are the normal stresses in the plate acting along the edges of the elementary layer filled with material; E(r) is the elasticity modulus of the electrode material; α(r) is the electrode material thermal linear expansion coefficient; μ is the S.D. Poisson’s coefficient; T(r, z) is the change in the electrode temperature during its heating relative to the temperature of its assembly as a part of the IES.
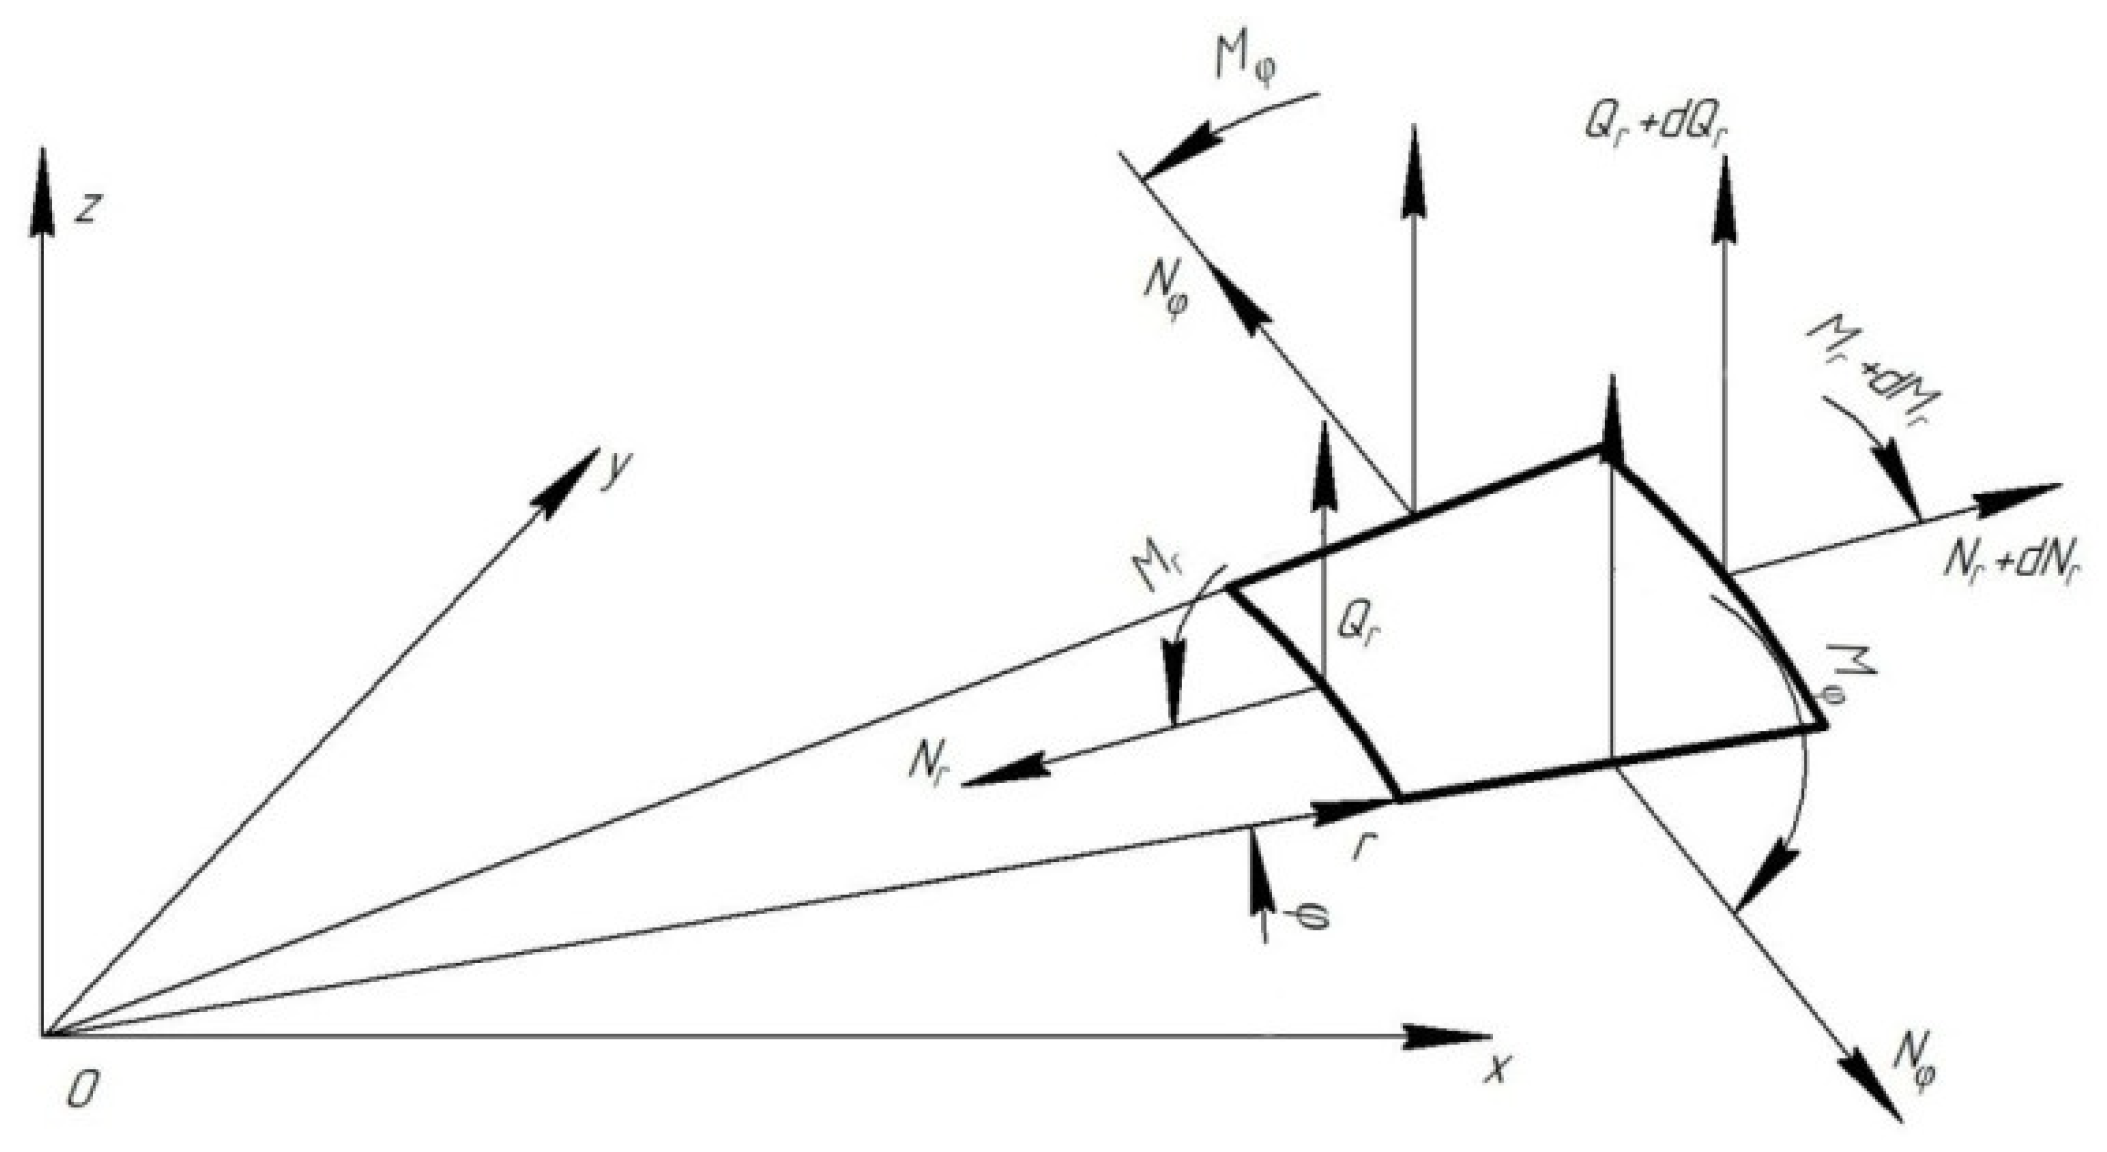
The problem concerning an equilibrium of a structurally orthotropic shallow shell spatial element is reduced to the problem concerning an equilibrium of a median surface element, to which the following forces and moments are applied: internal forces (the transverse force Qr in the shallow spherical segment cylindrical section, the normal force Nr in the cylindrical section of the shallow spherical segment, the normal force Nφ in the meridian section, and the tangential stress in the cylindrical section of the shallow spherical segment), and the moments (the radial and circumferential bending moments Mr, Mφ); the positive directions of such forces and moments are shown in Figure 10.
The element equilibrium equations given the initial electrode deflection are written as follows [50]:
The membrane forces and bending moments are defined by the following relations:
where DN is the cylindrical tensile stiffness of the electrode structural-orthotropic model; DM is the cylindrical bending stiffness of the electrode structural-orthotropic model; NT is the membrane force caused by thermal action on the electrode; MT is the bending moment caused by thermal action on the electrode.
The resolving integral equations describing nonlinear bending for electrodes with radially variable stiffness and with non-uniform heating along the radius and thickness, are presented in [50], whereas the temperature pattern of electrodes is represented as , where: T(1) is the temperature on the outer electrode envelope; is the law of temperature drop changes along the electrode radius.
The peculiarities of IES electrode loading and of their fixing are specified in boundary conditions, for example, for the case of loose fixing we have: , , , , where and is the intensity of radial compressive forces that are uniformly distributed on the inner and outer envelopes; , is the inner envelope radius; is the outer envelope radius; and are the intensities of the radial bending moments on the inner and outer envelopes, respectively.
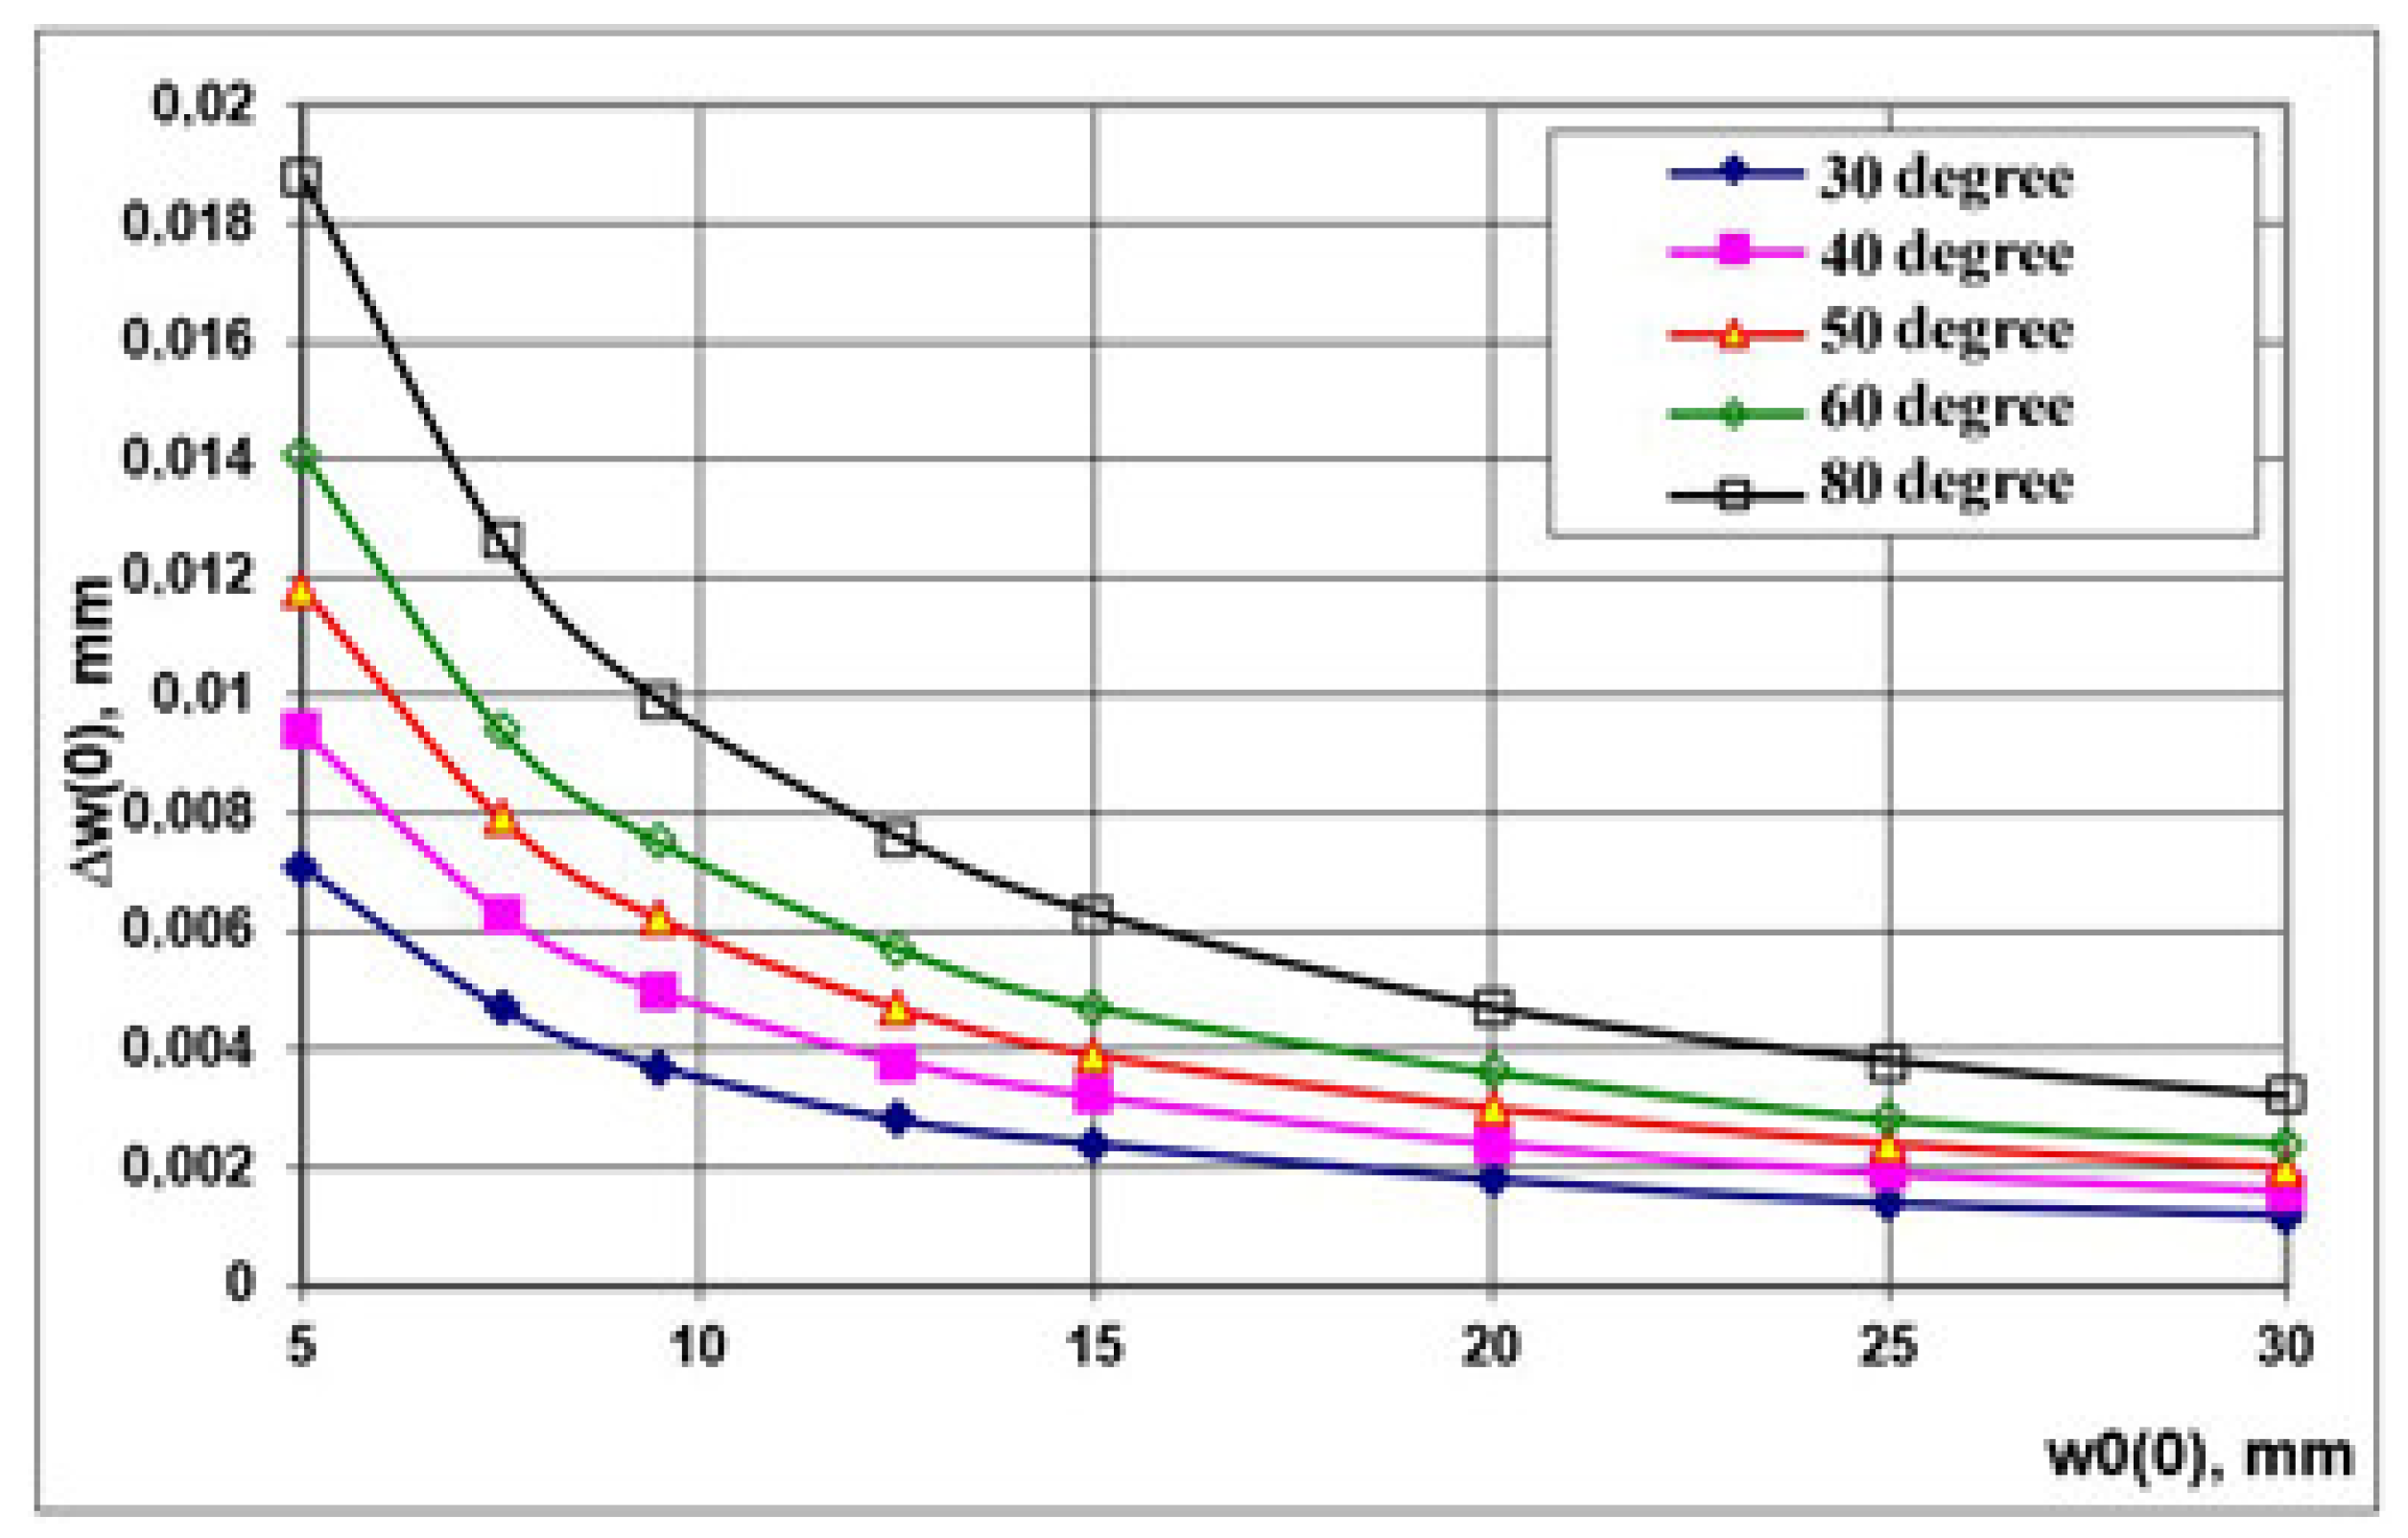
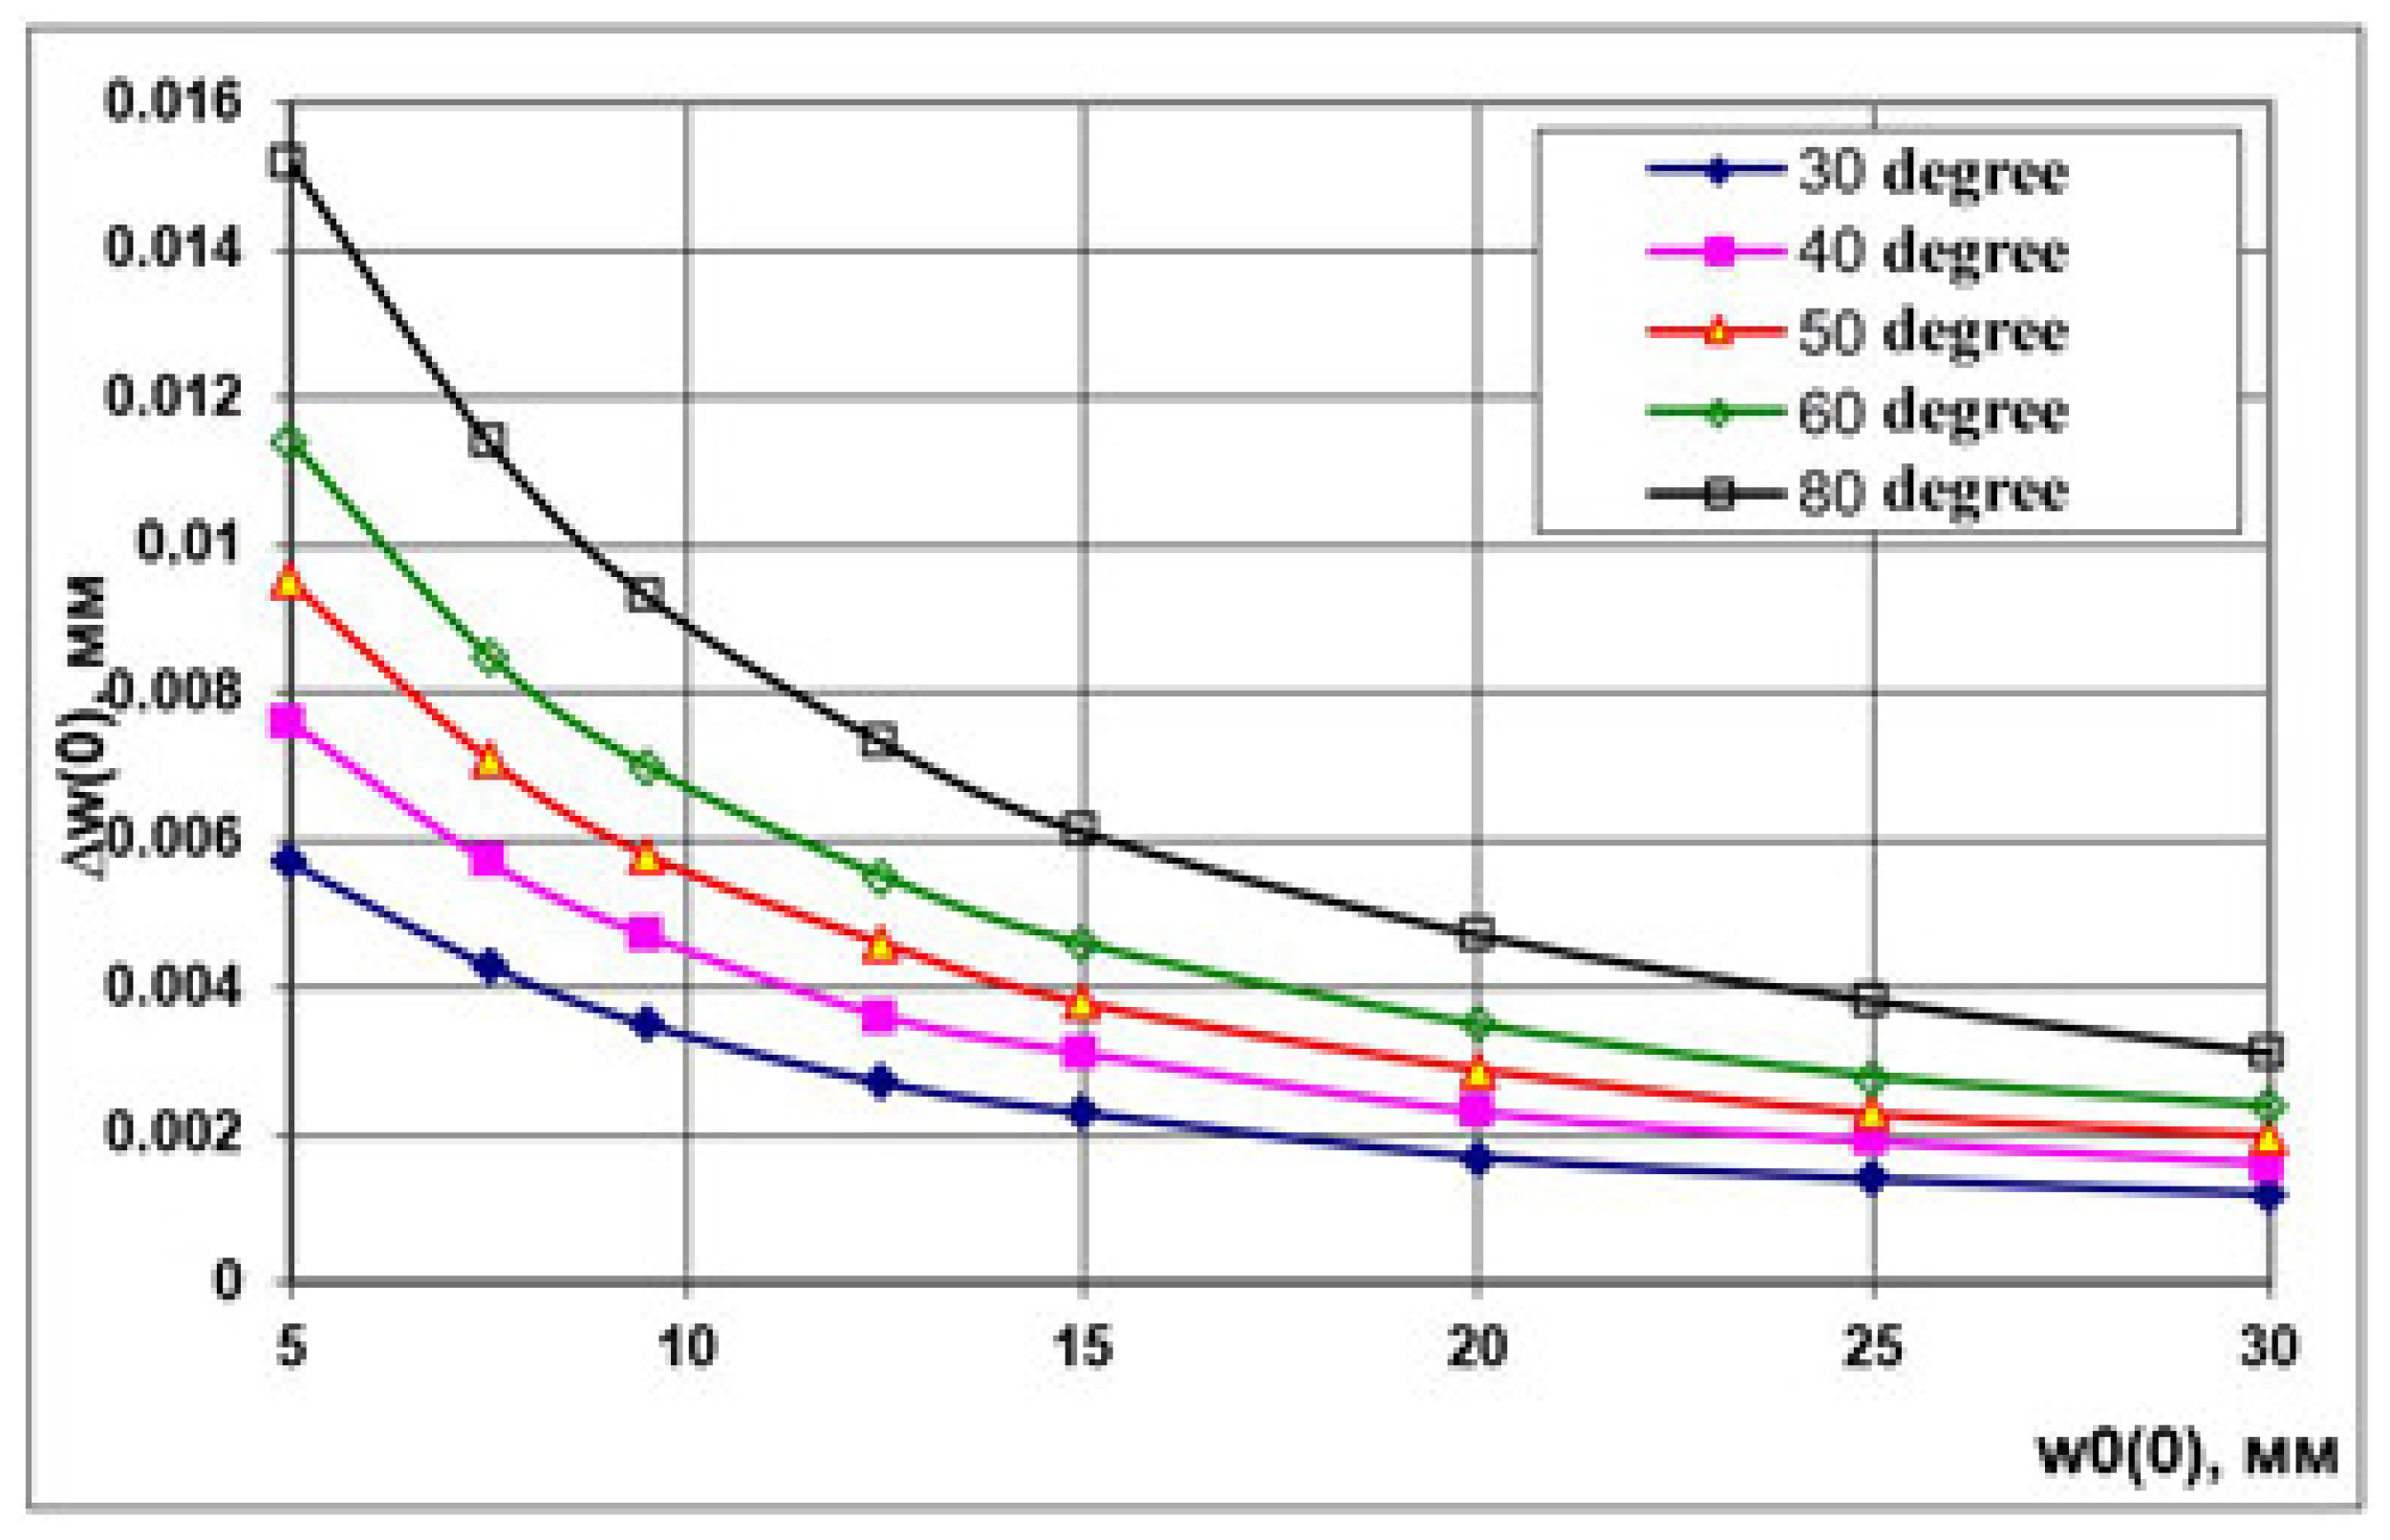
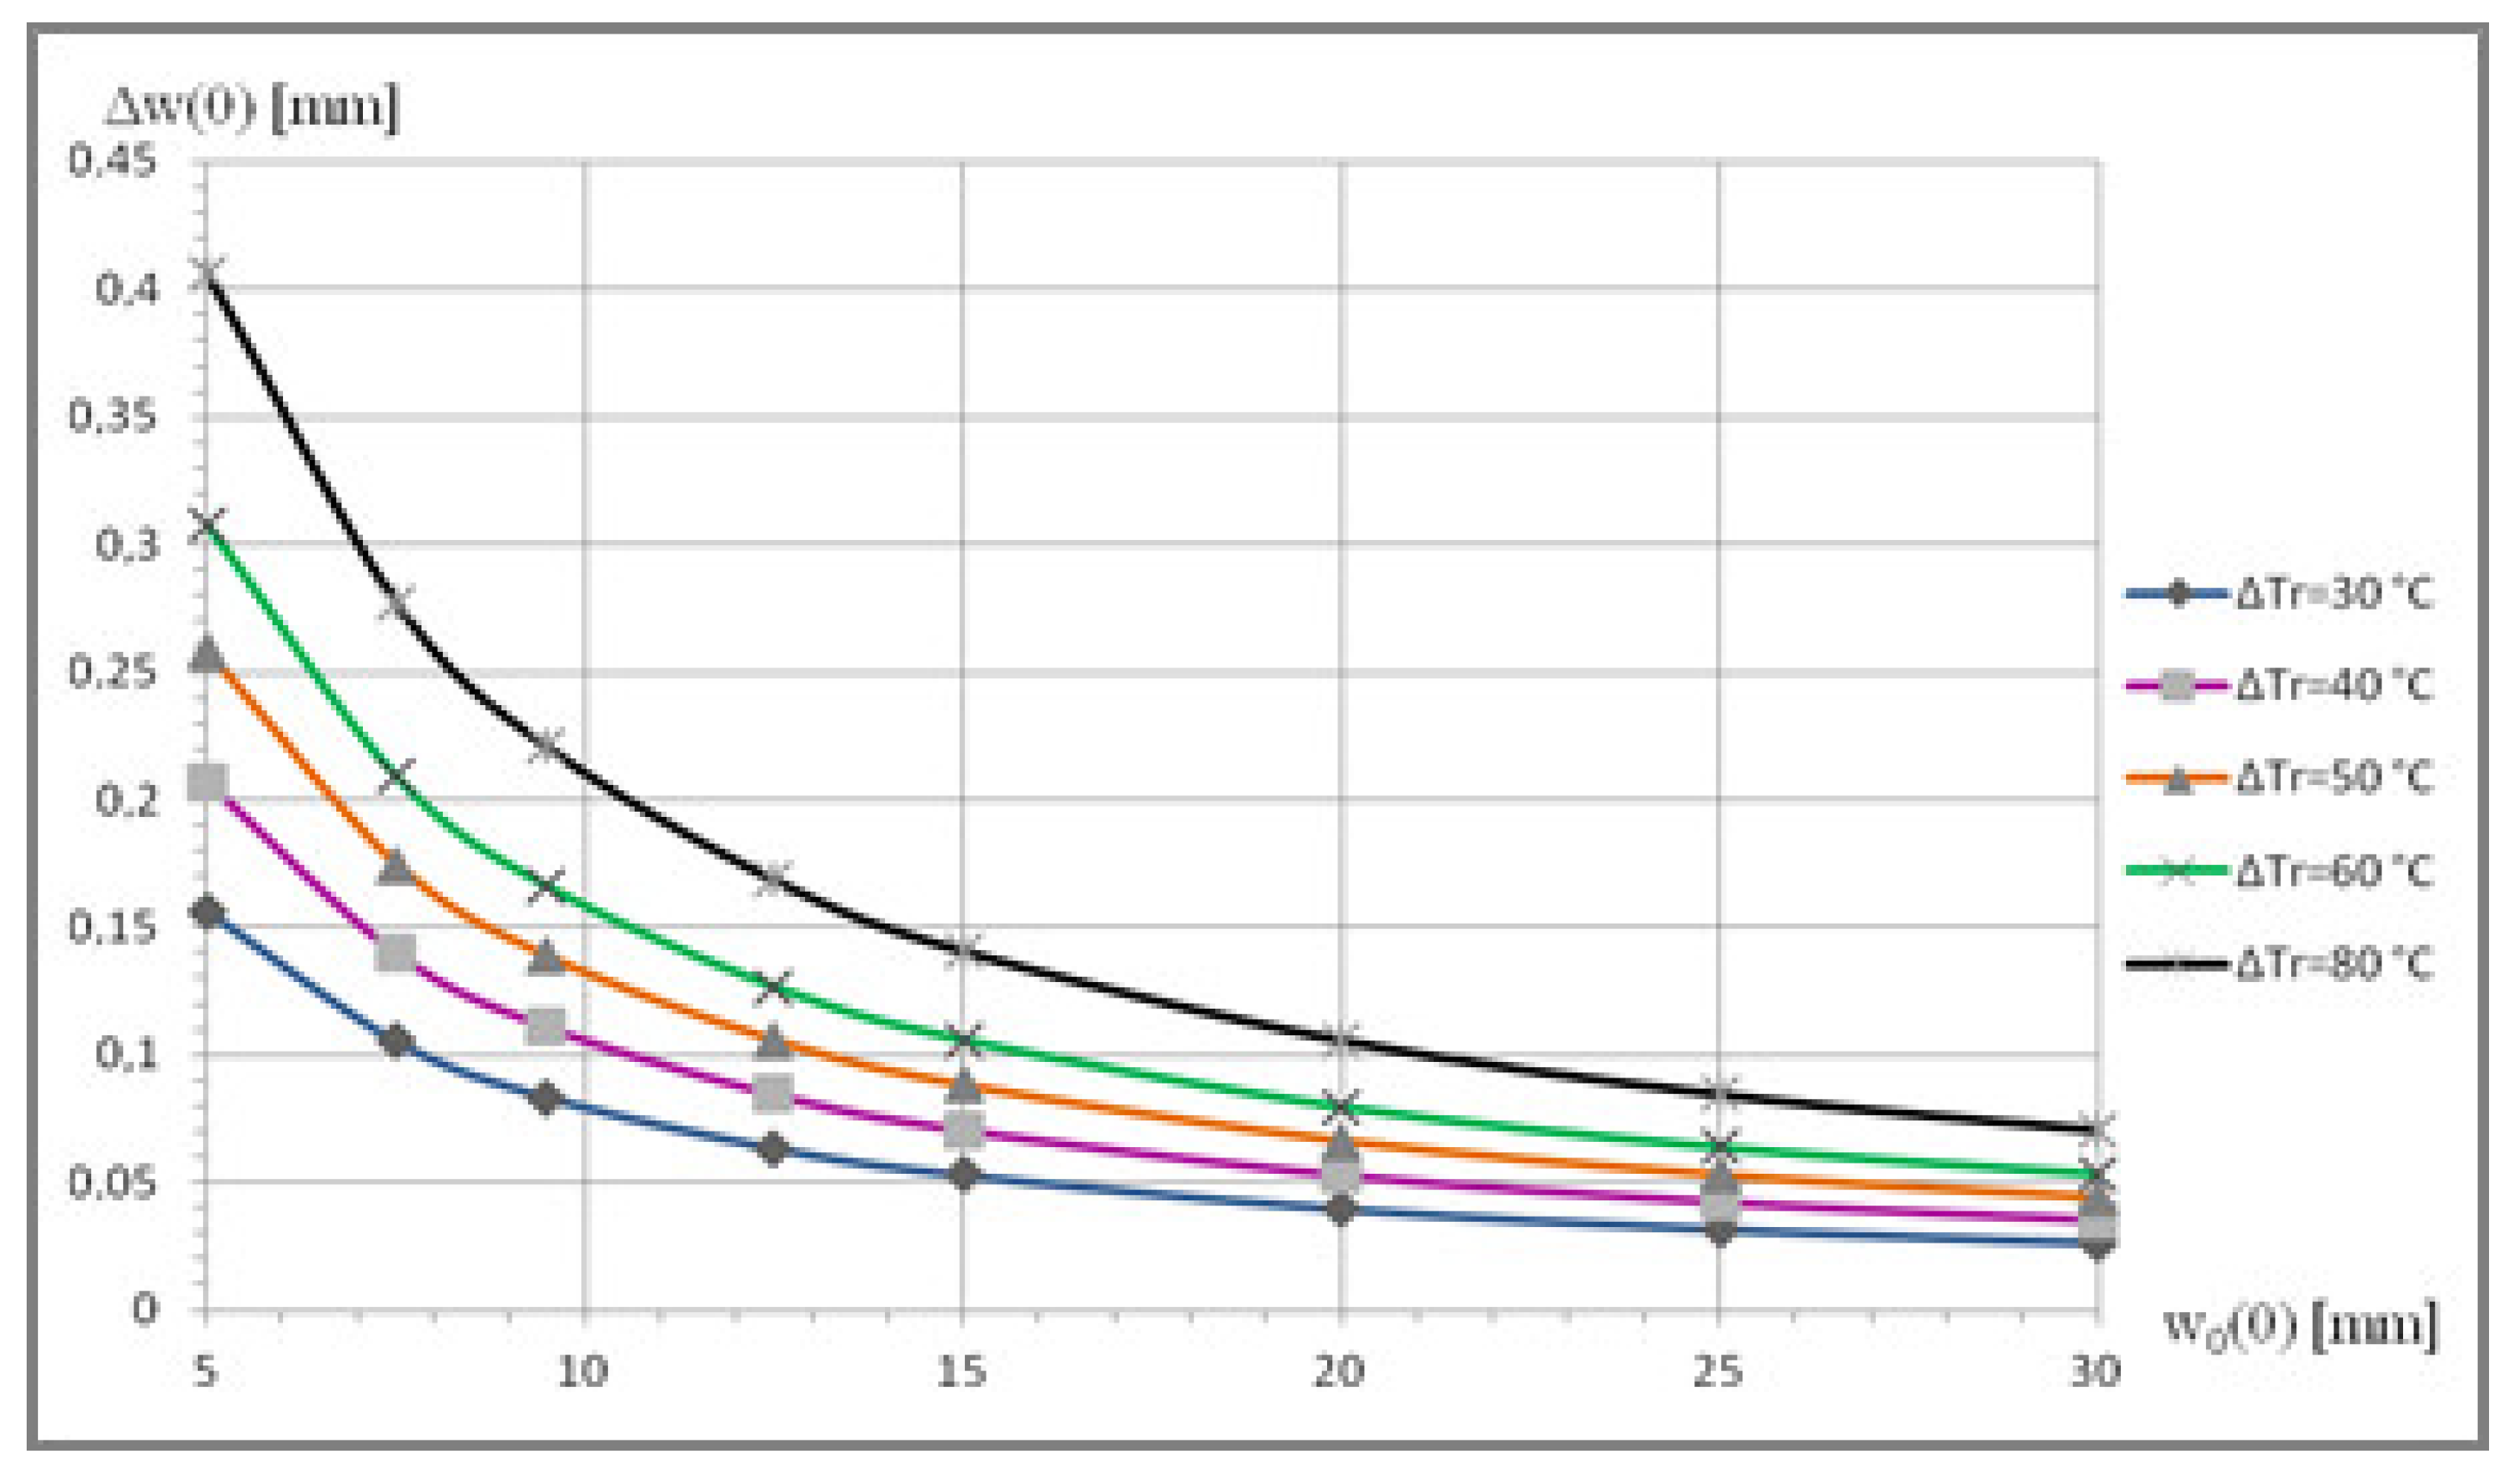
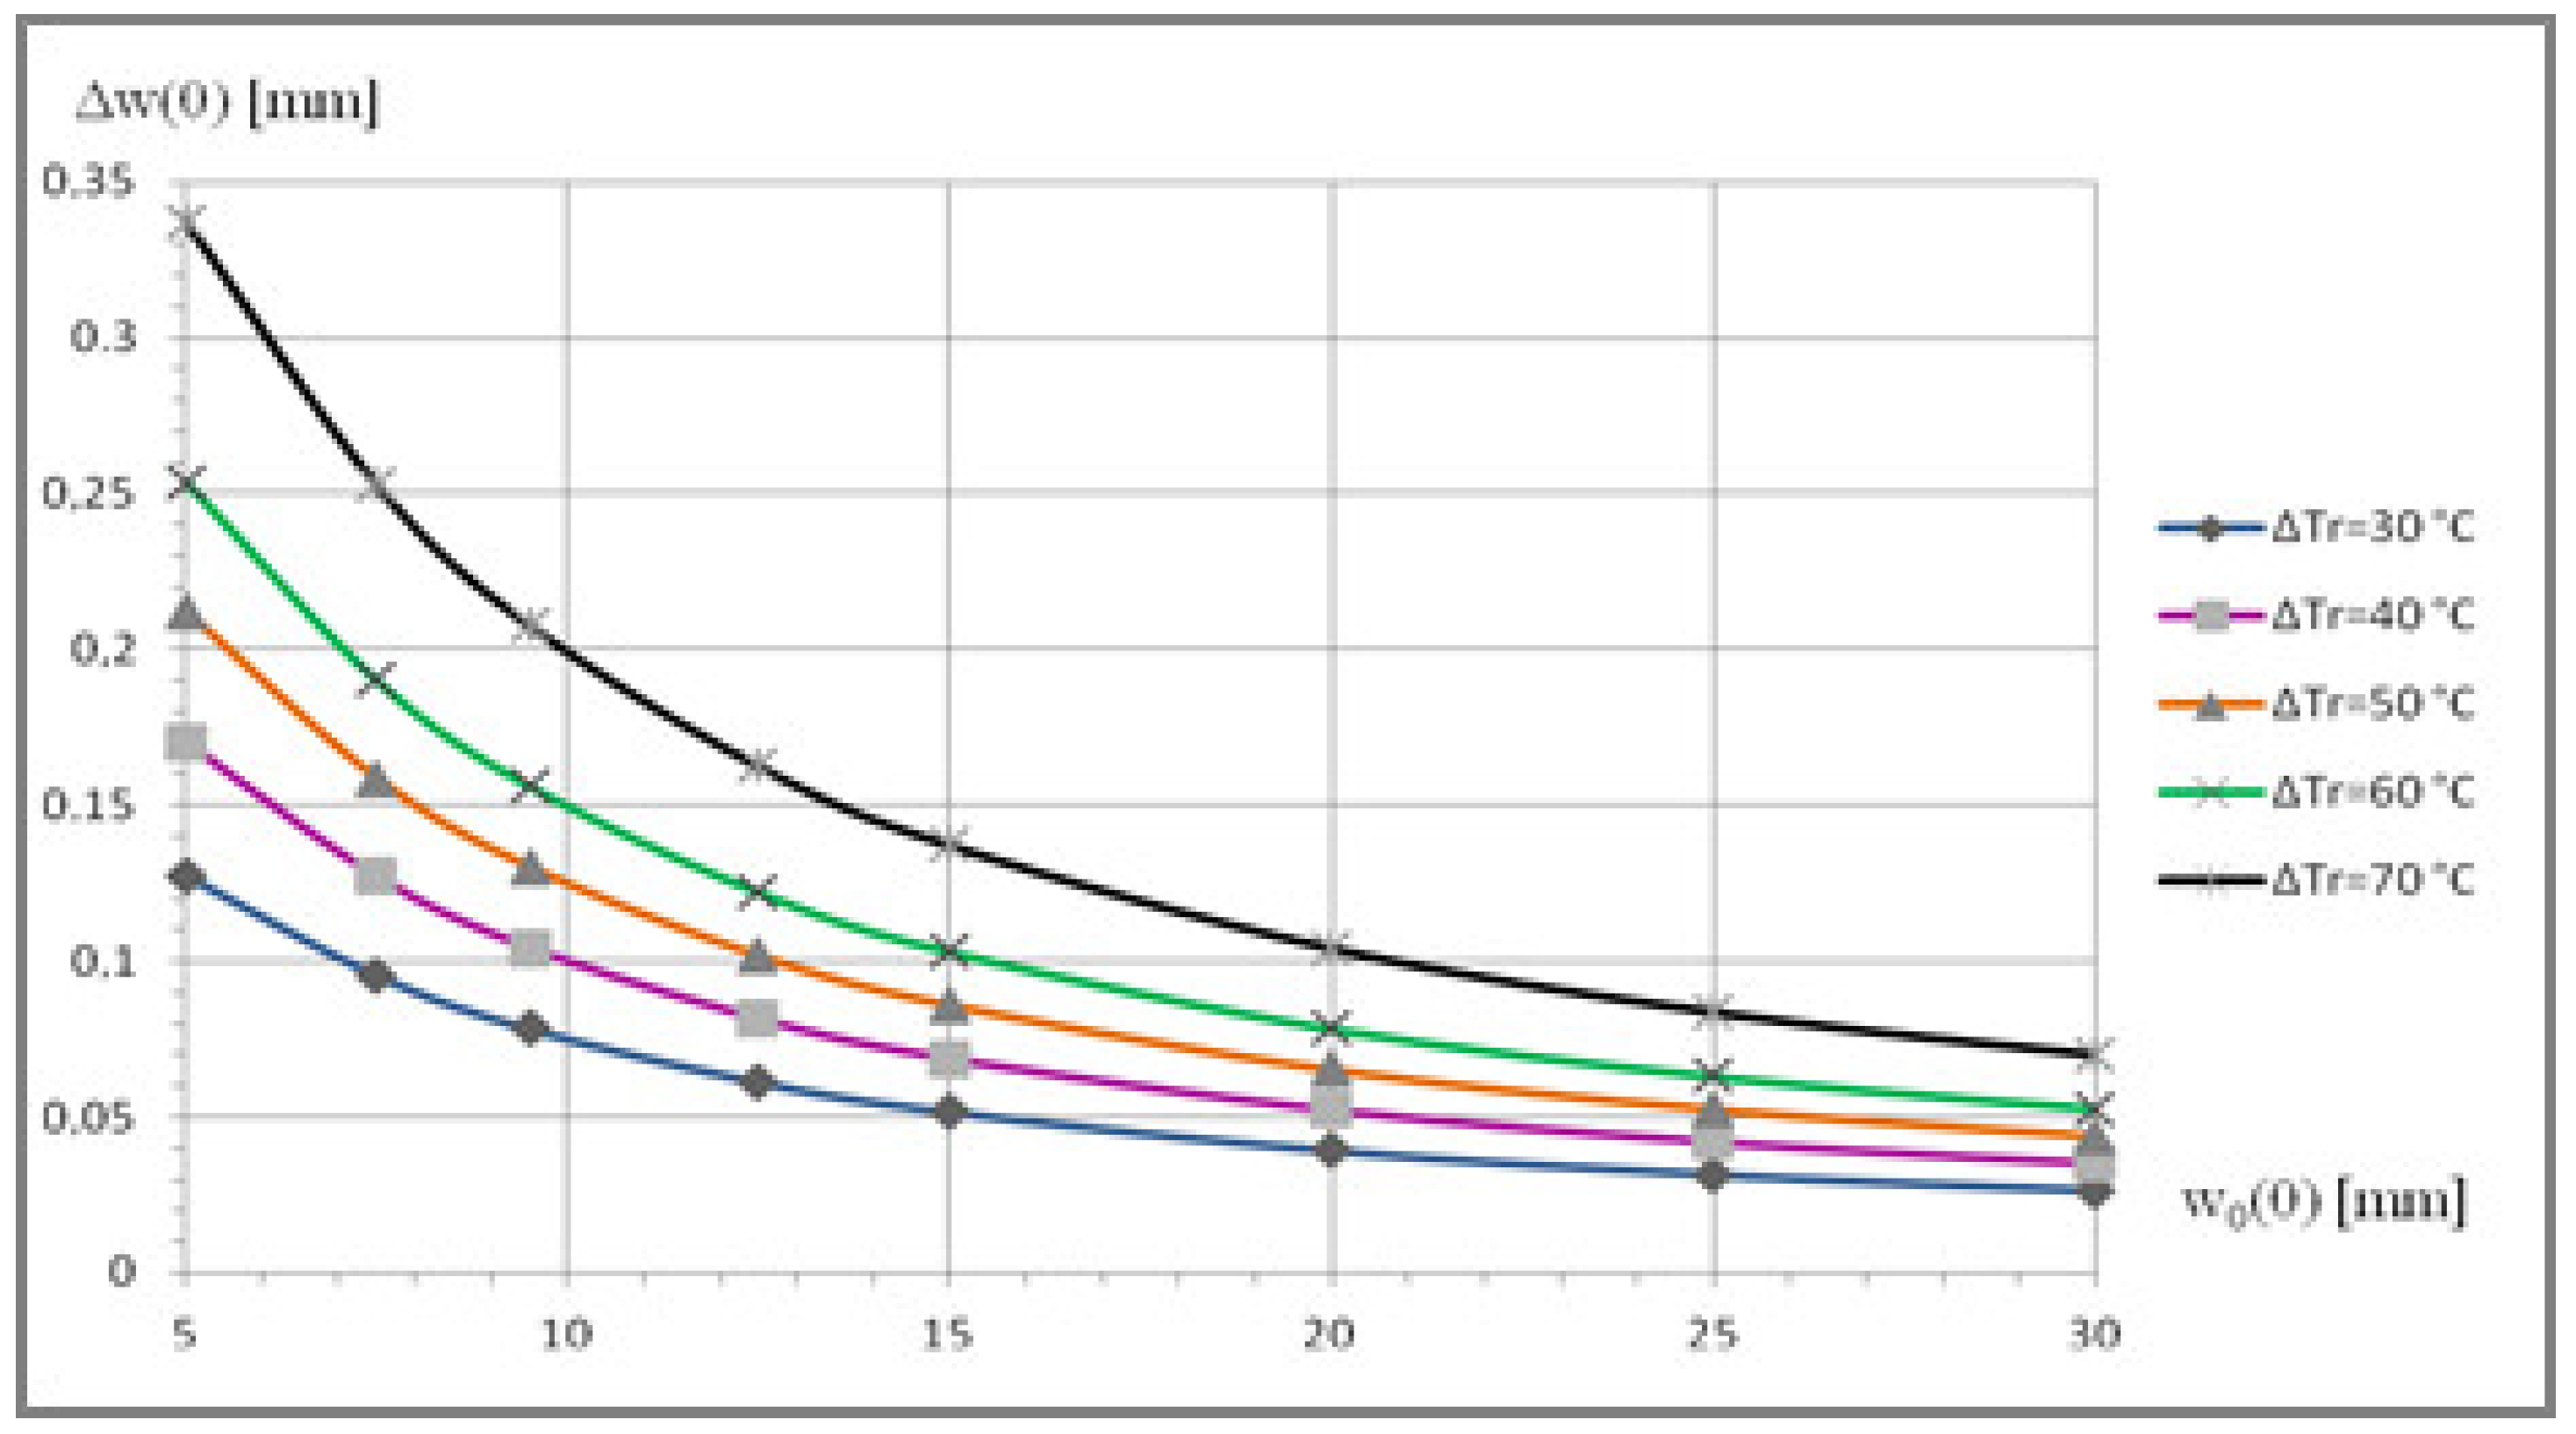
Calculations were carried out for a carbon–carbon composite high-density material based on the “IPRESSKON” nonwoven frame. The IS IES electrodes additional deflection values under various temperature loading for the case of loose IES electrode fixing are shown in the graphs (Figure 11 and Figure 12) and in Table 1.
It is obvious that the used material ensures sufficiently low values of additional electrode deflections that occurring the IES structure even with significant temperature gradients along the electrode radii, which are within 1.5 mm for a temperature gradient of 80 °C. According to the above calculations for temperature fields that will occur in the IS structure during its operation in the space flight conditions, the temperature gradient will not exceed 10 °C for the AE and 81 °C for the SE, which corresponds to the values of additional deflections at the level of 0.005 mm for the AE, and at the level of 1.5 mm for the SE.
6. The Study of Electrode Thermal Deformation
The ion-extraction system is the most critical and complicated part of an ion thruster/source in terms of its manufacturing and design. This is stipulated by the fact that more than 95% of supplied power is consumed by the ES, as well as by the challenging task to maintain a gap between the screen and acceleration electrodes. The electrodes operate under uneven thermal loading. Heating of electrodes leads to their deformation causing deterioration in IES performance and probable occurrence of a breakdown in the inter-electrode gap. Therefore, the gap should vary within a rigorously limited range.
The decision was made to assess the level of electrode deformation during IS operation. Similarly to the described above, this issue can be studied in two ways:
- -
- By using a well-known powerful resource, such as, for instance, the ANSYS computing system;
- -
- By using the developed simplified algorithm to evaluate the magnitude of additional deflection;
- -
- By determining the manufactured electrode deformation experimentally.
That is, it is necessary to determine additional deflection of the electrode, which occurs under uneven thermal heating, as a function of its initial shape and kind of material, and to define correlating between the magnitudes of electrode deformation obtained by the developed algorithm and by the numerical simulation in the ANSYS engineering simulation software with account of the data obtained through the electrode thermal deformation experimental study.
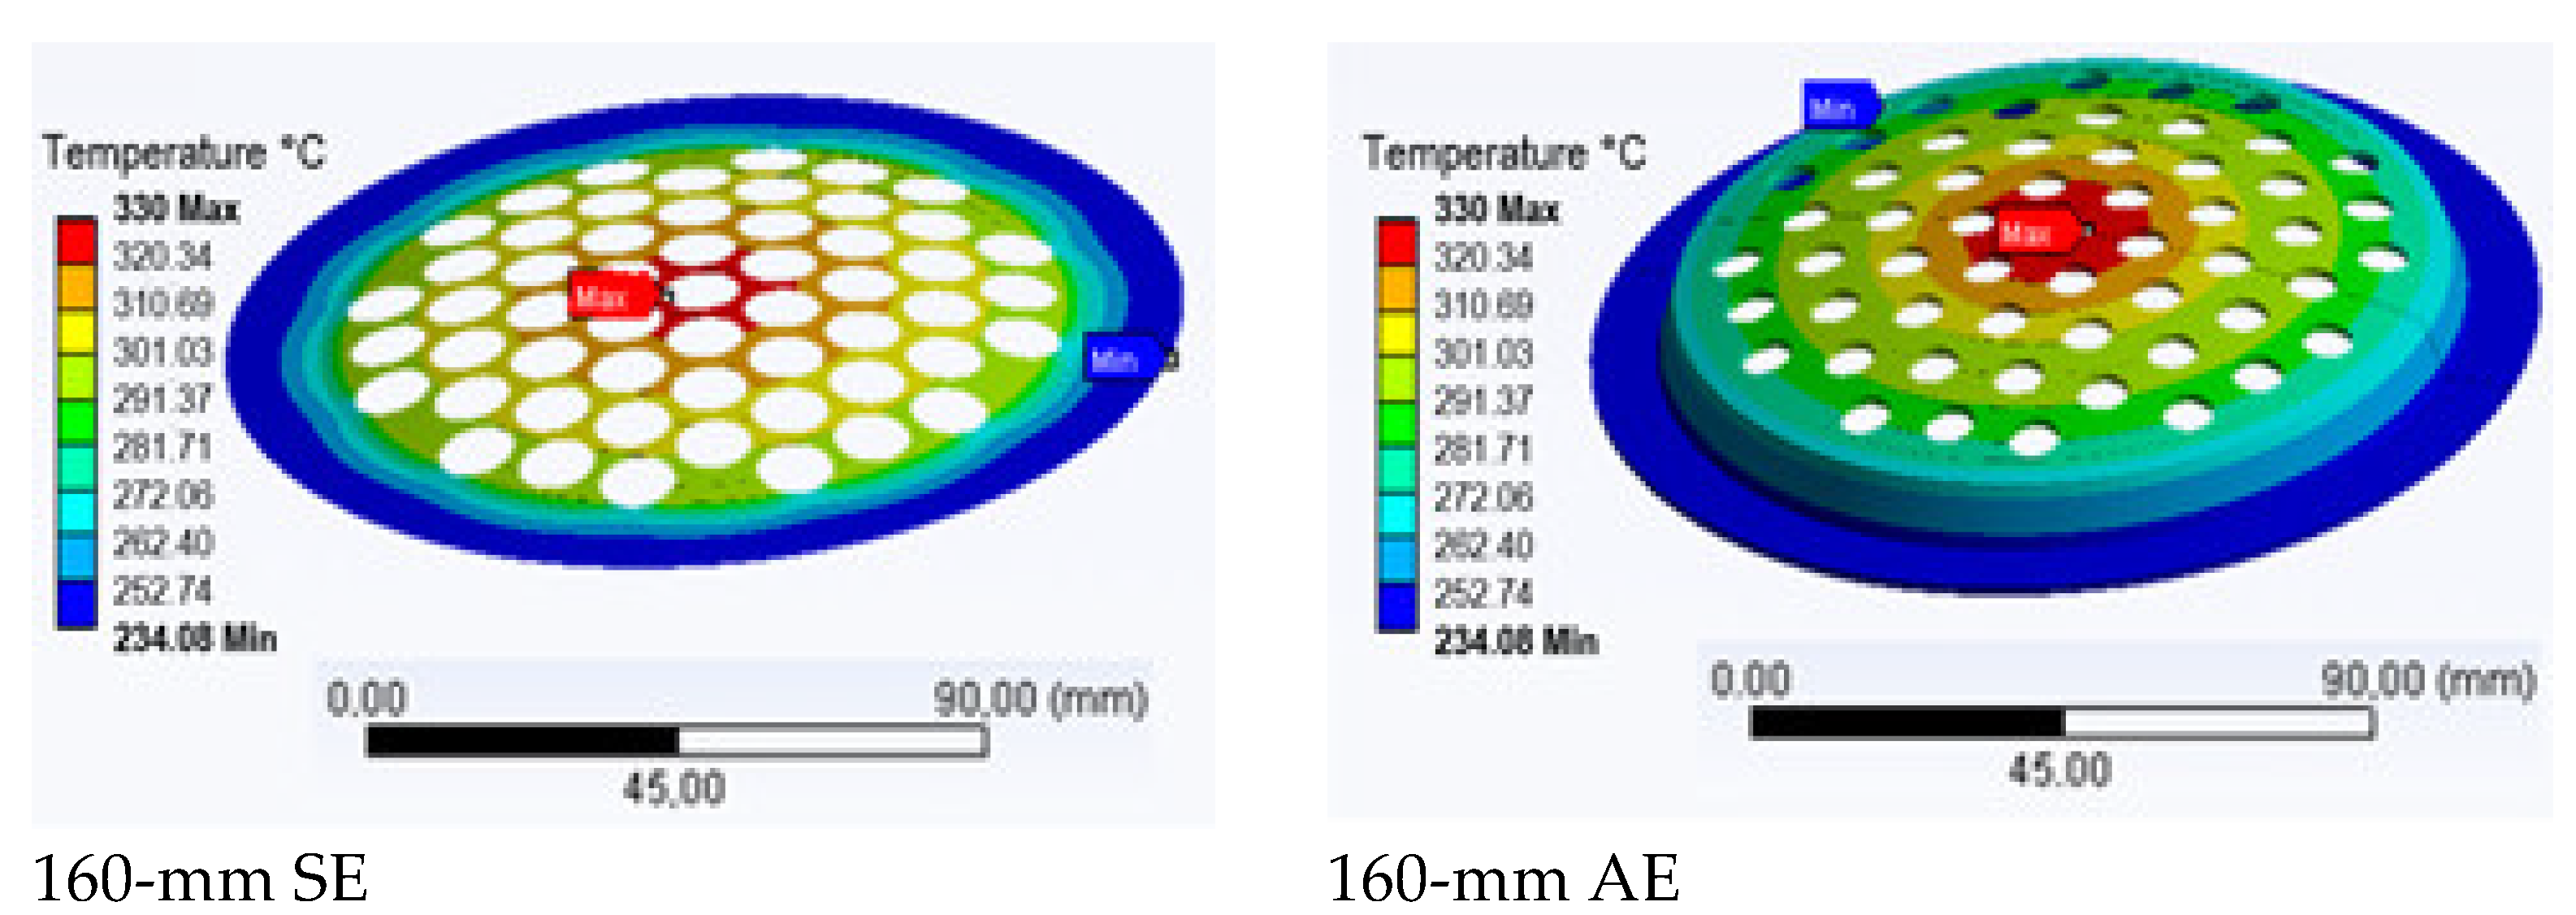
The IES perforated electrodes were selected for the sake of this experimental study. A numerical simulation of electrode deflection was conducted by a simplified algorithm with the use of the following basic design data: for SE − T = 330°; λ3kp = 35.5 (Figure 13), for AE − T = 272°; λ3kp = 36.4 (Figure 14). The graphs illustrate a possible choice of the initial electrode deflection required to ensure additional deflection (the additional deflection as a function of the initially designed one).
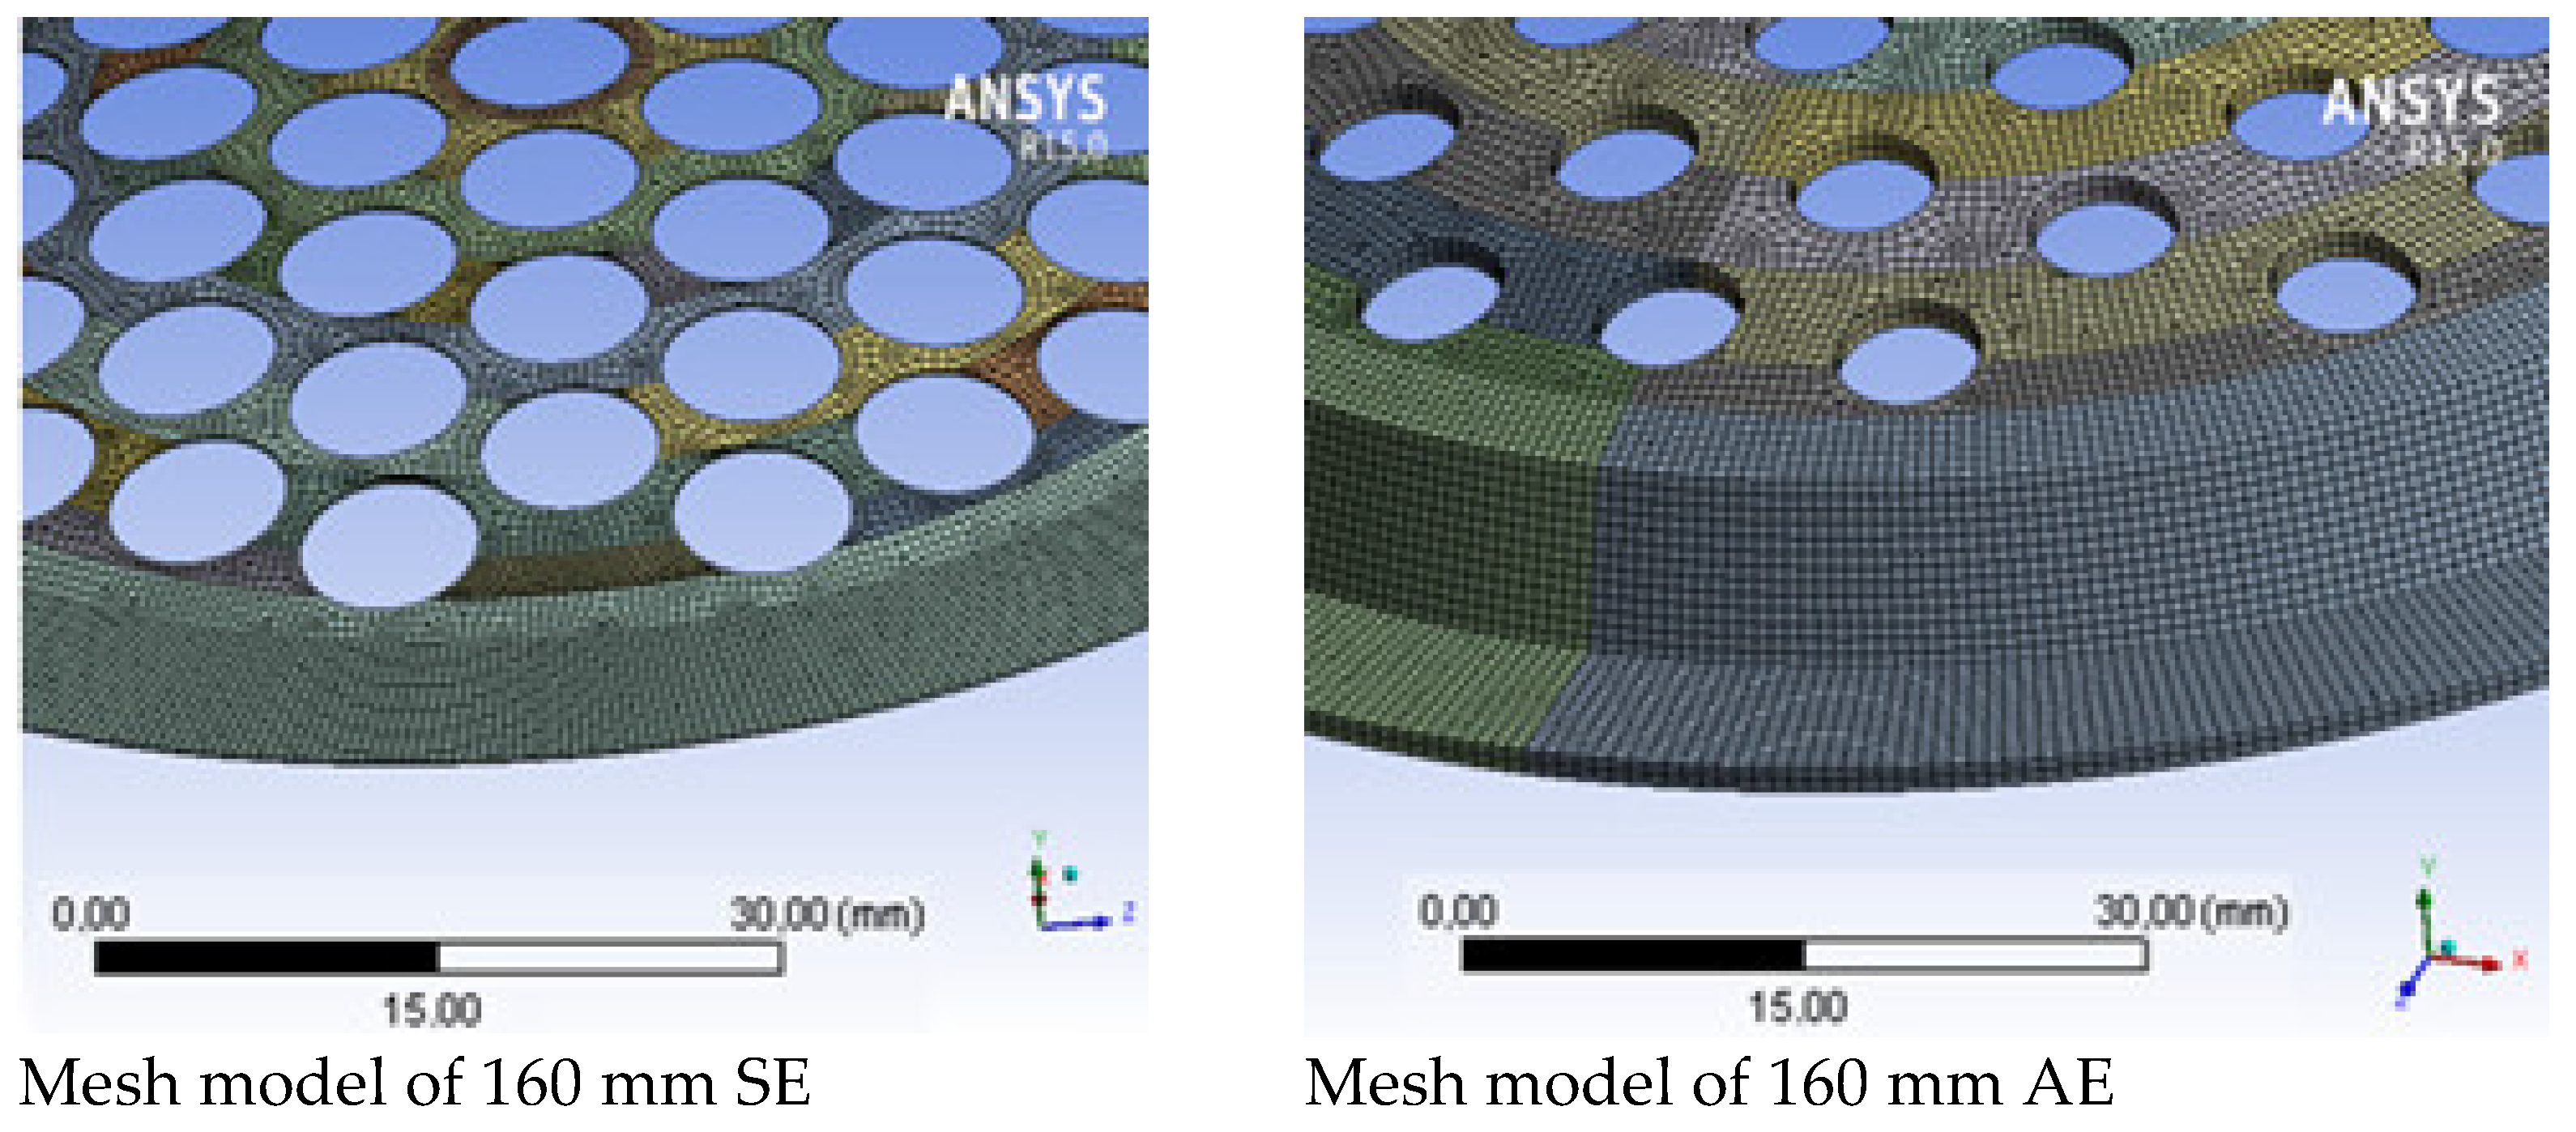
When performing numerical simulations in the ANSYS software environment, the number of holes was reduced while maintaining structural orthotropy to calculate loads and deformations (Figure 15 and Figure 16). Figure 17 shows the numerical simulation of the electrode thermal fields.
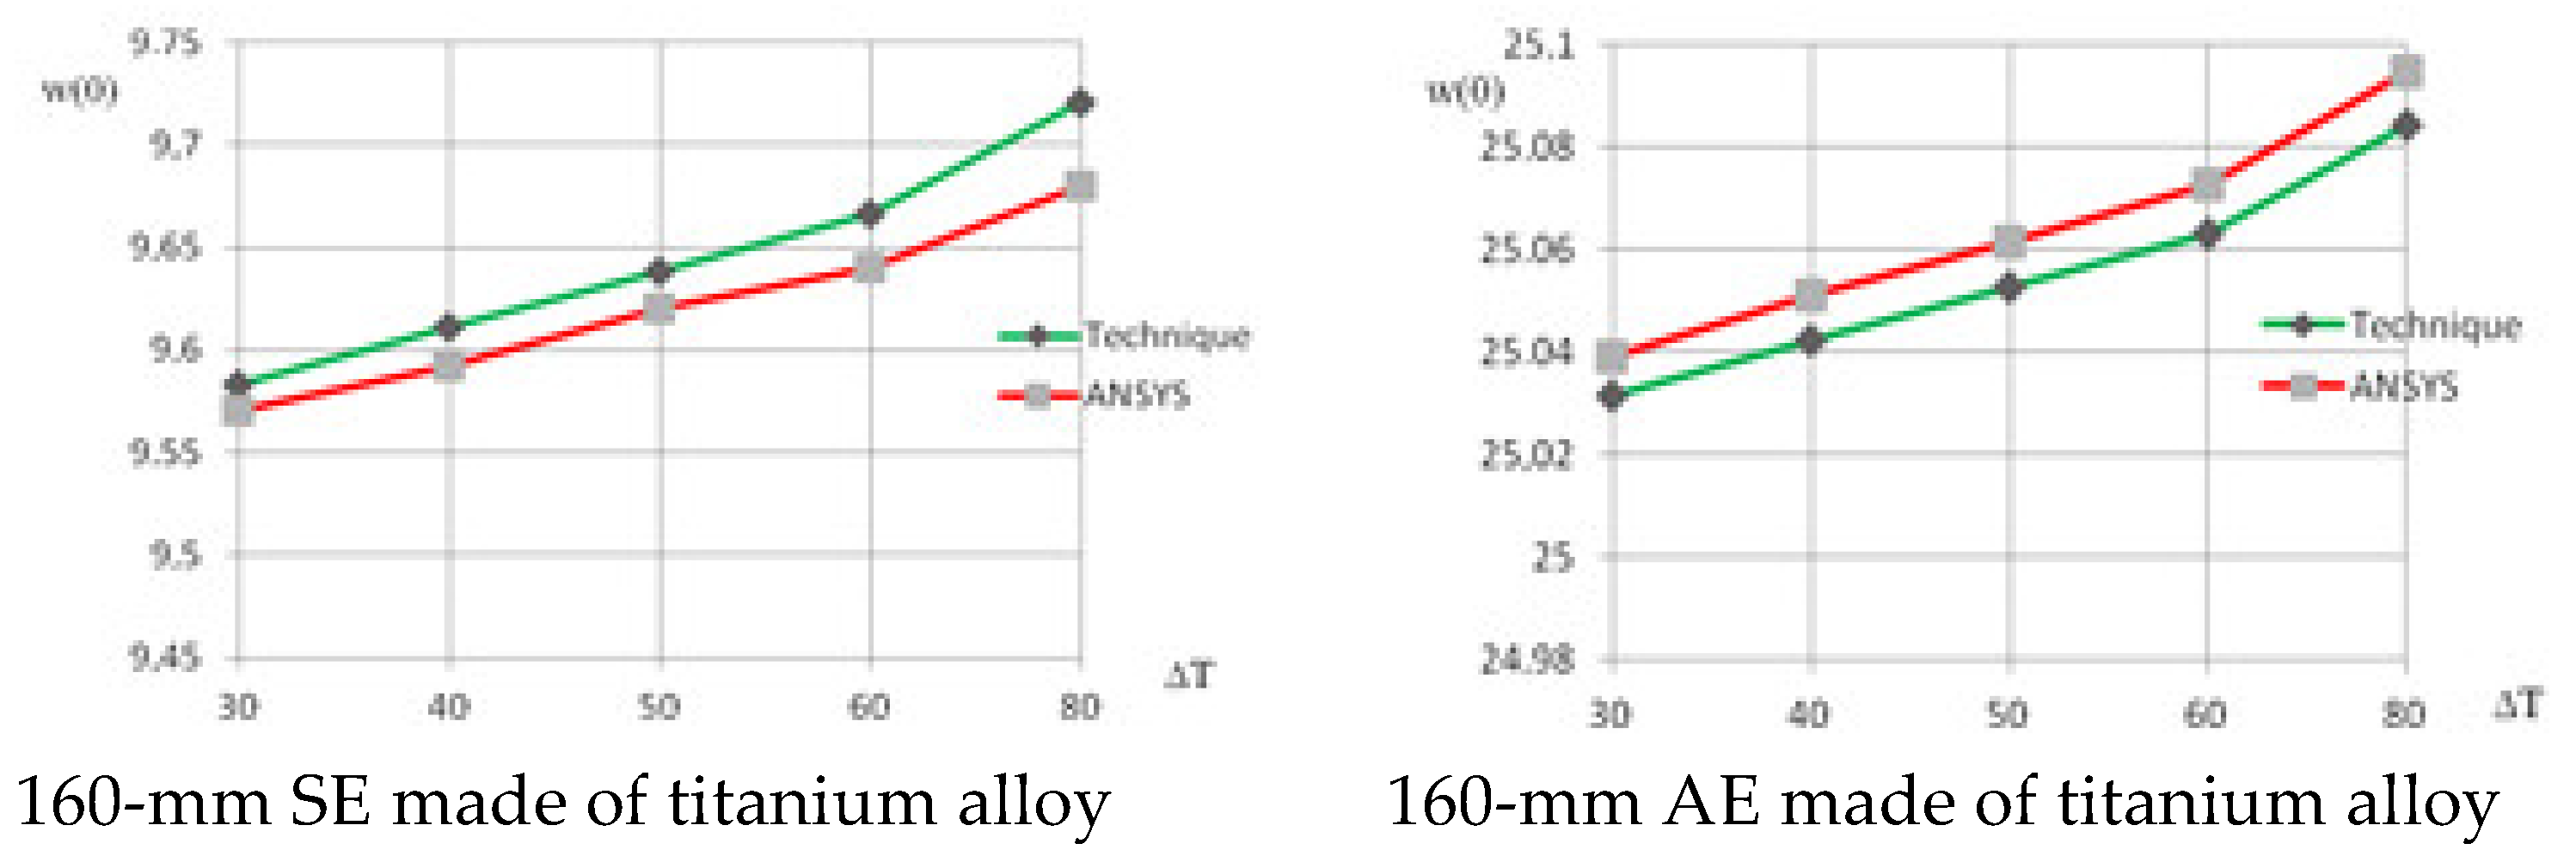
Figure 18 shows deflection as a function of the temperature differential along the electrode radius for a numerical simulation by a simplified algorithm and in the ANSYS software environment.
A high degree of consistency between the results of a numerical simulation and those obtained by simplified algorithm (over 90%) has been demonstrated with a significant reduction to the calculation time.
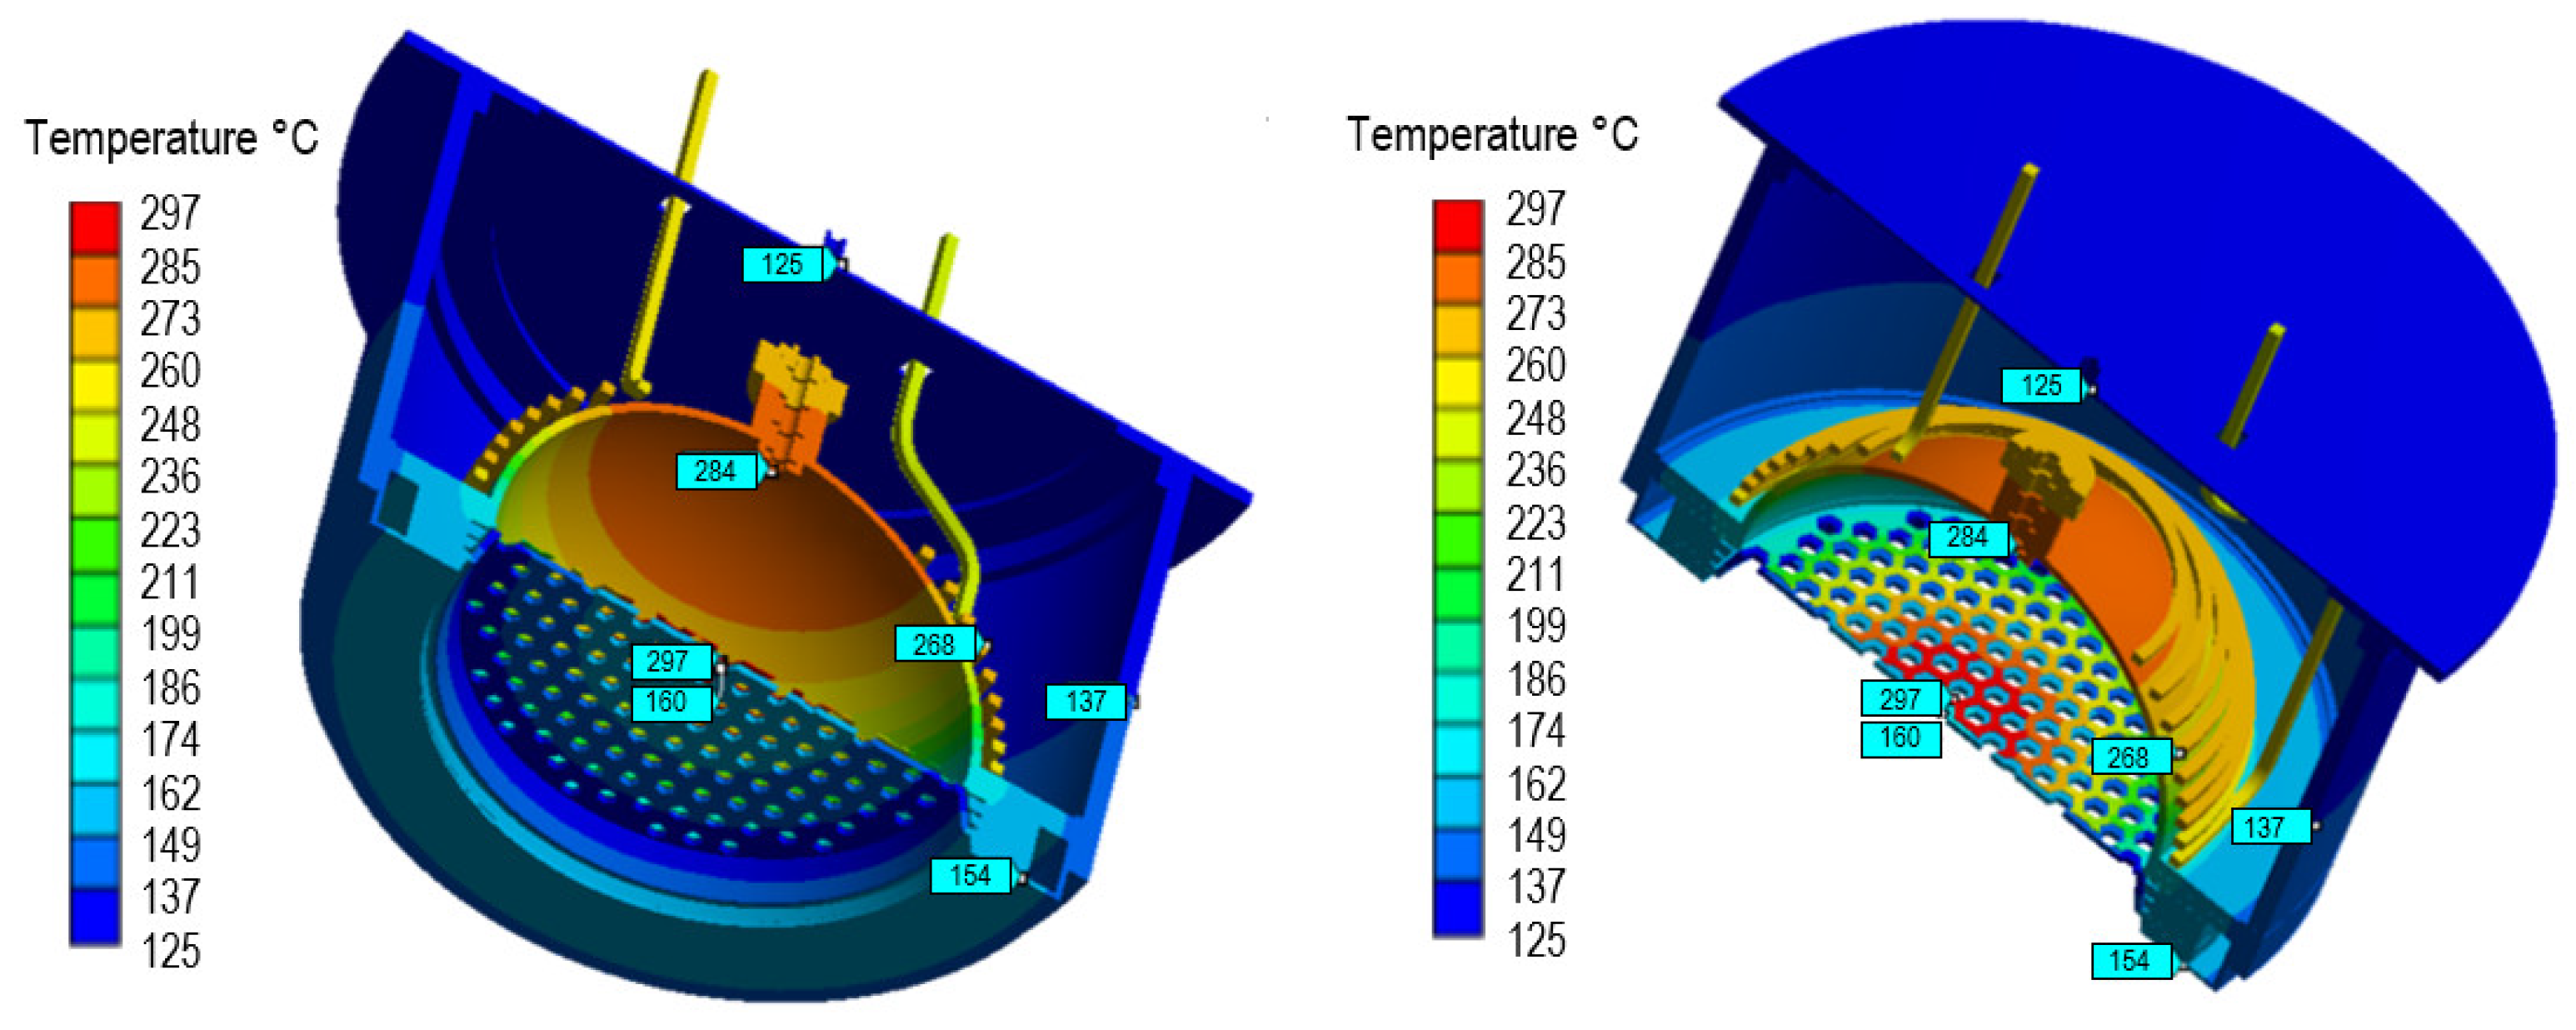
However, in order to assess experimental data on deformation of the manufactured AE as a part of the high-frequency IS structure, thermal fields of the IS structure as a whole were numerically simulated.
Figure 19 shows the IS thermal fields with the 350 W power supplied to the inductor.
Two pins were installed and their displacements were assessed in order to assess thermal deformation of the electrodes. The temperature of the electrodes was measured by thermocouples in the center and at the periphery. The AE temperature was additionally measured with a thermal imager. The following values for AE deformation were obtained with the power of 350 W supplied to the inductor:
- -
- According to experimental data, AE deformation for a spherical segment was 0.15 mm;
- -
- The deformation numerical simulation with loose AE fixing for a spherical segment without taking the cone height into account resulted in 0.13 mm;
- -
- The total deformation of AE with loose fixing was 0.16 mm;
- -
- The total deformation of AE with elastic fixing was 0.11 mm.
A high degree of consistency between the numerical modeling results both when using a simplified algorithm and the ANSYS software environment, and the experimental results for the AE deformation has been demonstrated.
7. Results and Discussion
A thermal model has been developed that links specific heat fluxes on the surfaces of GDC, SE and AE to the IS integral parameters that can be experimentally measured with high accuracy. It is shown that the ion beam current (current in the SE circuit) should be taken as the thermal state governing parameter, through the value of which the plasma parameters and specific power fluxes to the GDC walls and to the SE are defined. It is possible to define numerical values of the electron temperature more accurately, in order to derive the power balance on the GDC walls and on the SE surface, and the plasma potential, on the one hand, from the overall heat dissipation in the GDC volume compared with the incident RF power of the RF generator taking the efficiency of power input into plasma in to account, and, on the other hand, from the experiment concerning the beam ion energy spread. The model allows for its gradual complication by increasing the IS level of detail, which brings the simplified IS representation closer to the real one. The expected heating of IS surfaces can reach 300–400 °C, which is critical in terms of performance of structural materials. For this reason, it is impossible to use approximation of the smallness of the working surface temperature changes that allows the use of linear approximation and accepts analytical solutions to the thermal problem. The thermal model factors in the heat exchange between the structural units, either by radiation, or by thermal conductance. In the latter case, the model allows to account for thermal contact resistances in the interface surfaces.
The IS integral output characteristics (Table 2) providing the minimum ion beam divergence angle were determined by tests.
8. Conclusions
Thus, it is shown that the IS developed and manufactured on the basis of the conducted modeling results operates steadily. Its output characteristics correspond to the calculated values with high accuracy, and, therefore, the physical and mathematical IS models developed in the course of the project implementation can be extensively used going forward in the development of similar technical devices with a different standard size.
Based on numerical modeling results, and upon obtaining a high level of agreement with experimental data, we can conclude the following:
- -
- Correlation between the results obtained through numerical modeling using the ANSYS software system and by the developed algorithm was defined;
- -
- The additional deflection value calculated by the proposed algorithm agrees with the results obtained through the numerical simulation in ANSYS and with the experimental data within 10%;
- -
- The conducted study does not allow us to precisely assess the accuracy of the numerical modeling results, but a fairly good agreement between the calculation results obtained by two independent methods and the experimental data provides more confidence in the reliability of the developed model.
Author Contributions
Conceptualization, methodology, validation, writing—review and editing, supervision, project administration, funding acquisition V.V.S., software, A.I.M., A.Y.K.; formal analysis, investigation, resources, data curation, writing—original draft preparation, visualization, V.V.S., A.I.M., A.Y.K. All authors have read and agreed to the published version of the manuscript.
Funding
This work was supported by the Government of Russian Federation (Grant number 075-15-2019-1894).
Institutional Review Board Statement
Not applicable.
Informed Consent Statement
Not applicable.
Data Availability Statement
The data presented in this study are available on request from the corresponding author.
Acknowledgments
This research work was conducted in the Laboratory Space Flight Mechanics of the Moscow Aviation Institute.
Conflicts of Interest
The authors declare no conflict of interests.
Abbreviations
| AE | accelerating electrode |
| GDC | gas discharge chamber |
| HF | high-frequency |
| IES | ion-extraction system |
| IS | ion source |
| RIT | radio-frequency ion thruster |
| SC | spacecraft |
| SD | space debris |
| SSC | service spacecraft |
| SE | screen electrode |
Nomenclature
| Indexes | |
| AE | index of accelerating electrode parameter |
| EP | index of compensating propulsion system parameter |
| GDC | index of gas discharge chamber parameter |
| IS | index of ion source parameter |
| SC | index of spacecraft parameter |
| SD | index of space debris parameter |
| SE | index of screen electrode parameter |
| Parameters | |
| BHF | induction of high-frequency magnetic field |
| CI | specific power consumption |
| CID | effective energy spent for the production of one ion in the discharge |
| CR | total radiation loss |
| d | distance between service spacecraft and space debris |
| e | electron charge |
| ECP | average energy of the incident charge-exchange ions |
| EIND | intensity of high-frequency electric field |
| Fji | matrix of the element mutual radiation coefficient |
| Fd | force acting on space debris |
| FEP | force acting on the service spacecraft from compensating propulsion system |
| Grad | parameter that determines the input heat flux of the mutual radiative heat exchange between the units of the ion source structure |
| Gpl | parameter that determines the power flux from the discharge plasma |
| Ie | electron current |
| Ii | ion current |
| IiAE | charge-exchange ion current |
| I0 | ion beam current |
| k | ratio between force acting on space debris and force acting on the service spacecraft from compensating propulsion system |
| M | propellant gas atom (ion) mass |
| MSC | mass of service spacecraft |
| MSD | mass of space debris |
| ne | electron density |
| ni | ion density |
| NRF | high-frequency generator power |
| Qi | function of volumetric heat source |
| Qrad | radiative heat |
| RC | numerical value of the contact resistance |
| SGDC | internal area of gas discharge chamber surface |
| SK | area of the screen electrode annular section |
| T | temperature |
| Ta | atom temperature |
| Te | electron temperature |
| Ti | ion temperature |
| Ve | electron velocity |
| Vd | gas discharge chamber plasma volume |
| Vi | first potential of the propellant gas atomionization |
| WEE | thermal power flux onto screen electrode surface facing the gas discharge chamber |
| WiAE | thermal power flux onto accelerating electrode surface facing the screen electrode |
| WGDC | thermal power flux onto the gas discharge chamber wall |
| Wind | thermal power flux from the inductor |
| differential operator | |
| α | ion energy accommodation coefficient |
| δ | L. Kronecker symbol |
| ε | emissivity of the material |
| φe | electronic work function of the screen electrode conductive material |
| φeAE | electronic work function of the accelerating electrode material |
| σ | Stefan-Boltzmann constant |
| σSE | transparency of the screen electrode |
| λ | thermal conductivity coefficient |
| θI | angle between the normal to element I and the axis connecting the centers of elements i and j |
| ω | high-frequency generator frequency |
| ∆U | near-wall plasma potential drop |
| ∆UGDC | plasma potential drop near gas discharge chamber surface |
| ∆USE | plasma potential drop near screen electrode surface |
References
- Kaplan, M.H. Space Debris Realities and Removal. SOSTC Improving Space Operations Workshop Spacecraft Collision Avoidance and Co–Location; The Johns Hopkins University, Applied Physics Laboratory: Baltimore, MD, USA, 2010. [Google Scholar]
- Liou, J.C.; Johnson, N.L.; Hill, N.M. Controlling the Growth of Future LEO Debris Population with Active Debris Removal. Acta Astronaut. 2010, 66, 648–653. [Google Scholar] [CrossRef]
- Debus, T.J.; Dougherty, S.P. Overview and Performance of the Front-end Robotics Enabling Near-Term Demonstration (FREND) Robotic Arm. In Proceedings of the AIAA Infotech@Aerospace Conference, Seattle, WA, USA, 6–9 April 2009. [Google Scholar]
- Kaiser, C.; Sjoberg, F.; Delcura, J.M.; Eilertsen, B. SMART-OLEV—An Orbital Life Extension Vehicle for Servicing Commercial Spacecrafts in GEO. Acta Astronaut. 2008, 63, 400–410. [Google Scholar] [CrossRef]
- Melamed, N.; Griffice, C.P.; Chobotov, V. Survey of GEO Debris Removal Concepts. In Proceedings of the 59th International Astronautical Congress, Glasgow, UK, 29 September–3 October 2008. [Google Scholar]
- Bosse, A.B.; Barnds, W.J.; Brown, M.A.; Creamer, N.G.; Feerst, A.; Hensgaw, C.G.; Hope, A.S.; Kelm, B.E.; Klein, P.A.; Pipitone, F.; et al. SUMO: Spacecraft for the Universal Modification of Orbits. In Proceedings of the International Symposium on Defense and Security, Orlando, FL, USA, 12–16 April 2004. [Google Scholar]
- Norman, T.L.; Gaskin, D. Conceptual Design of an Orbital Debris Defense System; NASA-CR-197211; NASA: Morgantown, WV, USA, 1994.
- Murdoch, N.; Izzo, D.; Bombardelli, C.; Carnelli, I.; Hilgers, A.; Rodgers, D. Electrostatic Tractor for Near Earth Object Deflection. In Proceedings of the 59th International Astronautical Congress, Glasgow, UK, 29 September–3 October 2008. [Google Scholar]
- Bondarenko, S.G.; Lyagushin, S.F.; Shifrin, G.A. Prospects of Using Lasers and Military Space Technology for Space Debris Removal. In Proceedings of the 2nd European Conference on Space Debris, Darmstadt, Germany, 17–19 March 1997. [Google Scholar]
- Nishida, S.-I.; Kawamoto, S.; Okawa, Y.; Terui, F. Space debris removal system using a small satellite. Acta Astronaut. 2009, 65, 95–102. [Google Scholar] [CrossRef]
- Kawamoto, S.; Nishida, S.; Kibe, S. Research on a Space Debris Removal System; NAL Research Progress: Tokyo, Japan, 2003. [Google Scholar]
- Starke, J.; Bischof, B.; Foth, W.-O.; Gunther, J.J. Roger a Potential Orbital Space Debris Removal System. In Proceedings of the 38th COSPAR Scientific Assembly, Bremen, Germany, 15–18 July 2010. [Google Scholar]
- Absalamov, S.K.; Andreev, V.B.; Colbert, T.; Day, M.; Egorov, V.V.; Gnizdor, R.U.; Kaufman, H.; Kim, V.; Koryakin, A.I.; Kozubsky, K.N.; et al. Measurements of Plasma Parameters in the SPT-100 Plume and its effect on Spacecraft Components. In Proceedings of the 28 Joint Propulsion Conference and Exhibit, Nashville, TN, USA, 6–8 July 1992. [Google Scholar]
- Raikunov, G. (Ed.) Prevention of Space Debris Formation/Under the Science; Ed. Doct. Tech. Sciences; FIZMATLIT: Moscow, Russia, 2014; (In Russian). ISBN 9785922115049. [Google Scholar]
- Cherkasova, M.; Mogulkin, A.; Nigmatzyanov, V.; Peysakhovich, O.; Popov, G. Computational and experimental investigation of a weakly diverging ion beam source. In IOP Conference Series: Materials Science and Engineering, Proceedings of the 18th International Conference “Aviation and Cosmonautics” (AviaSpace-2019), Moscow, Russia, 18–22 November 2019; IOP: Bristol, UK, 2020; Volume 868, p. 012019. [Google Scholar]
- Obukhov, V.A.; Mogulkin, A.I.; Peysakhovich, O.D.; Nigmatzyanov, V.V.; Svotina, V.V. Modeling and experimental study of an ion source with a weakly diverging ion beam. In IOP Conference Series: Materials Science and Engineering, Proceedings of the II International Conference «MIP: Engineering-2020: Modernization, Innovations, Progress: Advanced Technologies in Material Science, Mechanical and Automation Engineering», Krasnoyarsk, Russia, 16–18 April 2020; IOP: Bristol, UK, 2020; Volume 862, p. 062082. [Google Scholar]
- Brown, I.; Lane, J.; Youngquist, R. A Lunar-Based Spacecraft Propulsion Concept—The Ion Beam Sail. Acta Astronaut. 2007, 60, 834–845. [Google Scholar] [CrossRef] [Green Version]
- Kitamura, S. Large Space Debris Reorbiter Using Ion Beam Irradiation. In Proceedings of the 61th International Astronautical Congress, Prague, Czech Republic, 27 September–1 October 2010. [Google Scholar]
- Bombardelli, C.; Peláez, J. Ion Beam Shepherd for Contactless Space Debris Removal. J. Guid. Control Dyn. 2011, 34, 916–920. [Google Scholar] [CrossRef] [Green Version]
- Bombardelli, C.; Pelaez, J. Universidad Politecnica de Madrid. Sistema de Modificación de la Posicióny Actitud de Cuerpos en Órbita por Medio de Satélites Guía. ES Patent 2365394B2, 3 October 2011. [Google Scholar]
- Edwards, C.H.; Wallace, N.C. The T5 Ion Propulsion Assembly for Drag Compensation on GOCE. In Proceedings of the 2nd International GOCE User Workshop GOCE, The Geoid and Oceanography, Frascati, Italy, 8–10 March 2004. [Google Scholar]
- Löb, H.W. Ein elektrostatisches Raketentriebwerk mit Hochfrequenzionenquelle. Astronaut. Acta VIII 1962, 1, 49. [Google Scholar]
- Loeb, H.W. Principle of Radio-Frequency Ion Thrusters RIT. In Workshop RIT-22 Demonstrator Test at Astrium at Giessen University; Giessen University: Giessen, Germany, 2010. [Google Scholar]
- Groh, K.H.; Loeb, H.W. State-of-the-art of radio-frequency ion thrusters. J. Propuls. Power 1991, 7, 573–579. [Google Scholar] [CrossRef]
- Killinger, R.; Kukies, R.; Surauer, M.; Tomasetto, A.; van Holtz, L. ARTEMIS Orbit Raising In-flight Experience with Ion Propulsion. Acta Astronaut. 2003, 53, 607–621. [Google Scholar] [CrossRef]
- Killinger, R.; Leiter, H.; Kukies, R. RITA Ion Propulsion Systems for Commercial and Scientific Applications. In Proceedings of the 43rd AIAA/ASME/SAE/ASEE Joint PropulsionConference & Exhibit, Cincinnati, OH, USA, 8–11 July 2007. [Google Scholar]
- Muller, H.; Kukies, R.; Bassner, H. EMC Tests on the RITA Ion Propulsion Assembly for the ARTEMIS Satellite. In Proceedings of the 28th AIAA, SAE, ASME, ASEE Joint Propulsion Conference and Exhibit, Nashville, NT, USA, 6–8 July 1992. [Google Scholar]
- Angelo, N.G.; Clark, S.; Wallace, N.; Collingwood, C.; Guarducci, F. Qualification of the T6 Ion Thruster for the BepiColombo Mission to the Planet Mercury. In Proceedings of the 32nd International Electric Propulsion Conference, Wiesbaden, Germany, 11–15 September 2011. [Google Scholar]
- Loeb, H.W.; Feili, D.; Popov, G.A.; Obukhov, V.A.; Balashov, V.V.; Mogulkin, A.I.; Murashko, V.M.; Nesterenko, A.N.; Khartov, S. Design of High-Power High-Specific Impulse RF-Ion Thruster. In Proceedings of the International Electric Propulsion Conference, Wiesbaden, Germany, 11–15 September 2011. [Google Scholar]
- Riaby, V.A.; Masherov, P.E.; Obukhov, V.A.; Savinov, V.P. Effectiveness of Radiofrequency Inductively Coupled Plasma Sources for Space Propulsion. High Volt. Eng. 2013, 39, 2077–2088. [Google Scholar]
- Abgaryan, V.K.; Akhmetzhanov, R.V.; Loeb, H.W.; Obukhov, V.A.; Cherkasova, M.V. High-Frequency Ion Sources of Inert and Chemically Active Gases. J. Surf. Investig. 2012, 6, 693–698. [Google Scholar] [CrossRef]
- Abgaryan, V.K.; Akhmetzhanov, R.V.; Loeb, H.W.; Obukhov, V.A.; Cherkasova, M.V. Numerical Simulation of a High-Perveance Ion-Extraction System with a Plasma Emitter. J. Surf. Investig. 2013, 7, 1092–1099. [Google Scholar] [CrossRef]
- Bombardelli, C.; Merino-Martinez, M.; Galilea, E.A.; Pelaez, J.; Urrutxua, H.; Herrera-Montojo, J.; Iturri-Torrea, A. Ariadna Call for Ideas: Active Removal of Space Debris. Ion Beam Shepherd for Contactless Debris Removal; Advanced Concept Team; Ariadna ID: 10-4611; ESTEC-ESA: Madrid, Spain, 2011. [Google Scholar]
- Godyak, V.A.; Piejak, R.B.; Alexandrovich, B.M. Experimental Setup and Electrical Characteristics of an Inductively Coupled Plasma. J. Appl. Phys. 1999, 85, 703–712. [Google Scholar] [CrossRef]
- Kozhevnikov, V.V.; Khartov, S.A. Investigation of Local Plasma Parameters in the Discharge Chamber of a Low-Power High-Frequency Ion Thruster. Bull. Russ. Acad. Sci. Energy 2017, 3, 13–20. (In Russian) [Google Scholar]
- Kozhevnikov, V.V.; Khartov, S.A. Investigation of Local Plasma Parameters in the Discharge Chamber of a Low-Power High-Frequency Ion Engine with Multi-Electrode Probes. Bull. Russ. Acad. Sci. Energy 2016, 2, 26–33. (In Russian) [Google Scholar]
- Ryabyi, V.A.; Masherov, P.E. Integral and Local Diagnostics of a Model of an Energy-Efficient RF Source of an Ion Beam. Bull. Russ. Acad. Sci. Energy 2016, 2, 46–57. (In Russian) [Google Scholar]
- Riaby, V.A.; Obukhov, V.A.; Masherov, P.E. On the Objectivity of Plasma Diagnostics Using Langmuir Probes. High Volt. Eng. 2012, 38, 790–793. [Google Scholar]
- Obukhov, V.A.; Grigoryan, V.G.; Latyshev, L.A. Sources of Heavy Ions. In Plasma Accelerators and Ion Injectors; Science: Moscow, Russia, 1984. (In Russian) [Google Scholar]
- Kruglov, K.I. Modeling of Thermophysical Processes in a High-Frequency Ion Thruster. Ph.D. Thesis, Moscow Aviation Institute, Moscow, Russia, 2017. (In Russian). [Google Scholar]
- Abgaryan, V.K.; Abgaryan, M.V.; Nadiradze, A.B.; Nigmatzyanov, V.V.; Semenov, A.A. Radiative Heat Flux from Excited Atoms in a Radiofrequency Ion Thruster. Tech. Phys. Lett. 2021, 47, 201–204. [Google Scholar] [CrossRef]
- Bugrov, G.E.; Kralkina, E.A. Calculation of Specific Energy Consumption for Radiation in a Low-Pressure Xenon Discharge. In Proceedings of the VI All-Union Conference on Plasma Accelerators and Ion Injectors, Dnepropetrovsk, Russia, 26–28 September 1986. (In Russian). [Google Scholar]
- Lotz, B. Plasma Physical and Material Physical Aspects of the Application of Atmospheric Gases as a Propellant for Ion-Thruster of the RIT-Type. Ph.D. Thesis, Justus-Liebig Universität, Bunkissen, Germany, 2013. [Google Scholar]
- Abgaryan, V.K.; Kruglov, K.I.; Mogulkin, A.I.; Obukhov, V.A.; Riaby, V.A. On the Cost of Ion Production in Radio-Frequency Ion Thrusters and Technological Ion Sources. J. Surf. Investig. 2017, 11, 1239–1245. [Google Scholar] [CrossRef]
- Abgaryan, V.K.; Riaby, V.A.; Yamashev, G.G. Power Loss to Generating Ion Current in Radio-Frequency Ion Thrusters and Technological Sources of Ions. J. Surf. Investig. 2017, 11, 1008–1013. [Google Scholar] [CrossRef]
- Antipov, E.A.; Balashov, V.V.; Weber, A.V.; Kuftyrev, R.Y.; Mogulkin, A.I.; Nigmatzyanov, V.V.; Pankov, A.I.; Popov, G.A.; Sitnikov, S.A.; Khartov, S.A. The Choice of Structural Materials for High-Frequency Ion Thruster. Electron. J. Proc. MAI 2013, 65. (In Russian) [Google Scholar]
- Abgaryan, V.K.; Akhmetzhanov, R.V.; Loeb, H.W.; Obukhov, V.A.; Cherkasova, M.V. Numerical Modeling of the Primary Ion Beam and Secondary Ion Flux in the Ion-Optical System of the Ion Thruster. Electron. J. Proc. MAI 2013, 71. (In Russian) [Google Scholar]
- Avduevsky, V.S.; Galitseysky, B.M.; Glebovetal, G.A. Basics of Heat Transfer in Aviation and Rocket and Space Technologies; Mashinostroenie: Moscow, Russia, 1992. (In Russian) [Google Scholar]
- Gartner, W.; Lotz, B.; Meyer, B.K. 3D Thermal Simulation of a μN-RIT. In Proceedings of the 33d International Electric Propulsion Conference, The George Washington University, Washington, DC, USA, 6–10 October 2013. [Google Scholar]
- Mogulkin, A.I. Mechanical–Mathematical Model of Deformations of Profiled Electrodes of Ion Thrusters. Ph.D. Thesis, Moscow Aviation Institute, Moscow, Russia, 2015. [Google Scholar]
- Balashov, V.V.; Mogulkin, A.I.; Nigmatzyanov, V.V.; Obukhov, V.A.; Smirnova, M.E.; Khartov, S.A. Ion Source. Russia Patent RU116273U1, 2 December 2011. (In Russian). [Google Scholar]
- Balashov, V.V.; Popov, G.A.; Antipov, E.A.; Ionov, A.V.; Mogulkin, A.I. Method of Manufacturing Electrodes of the Ion-Optical System. Russia Patent RU2543063C1, 9 October 2013. (In Russian). [Google Scholar]
- Birger, I.A. Round Plates and Shells of Rotation; Oborongiz: Moscow, Russia, 1961. (In Russian) [Google Scholar]
- Grigolyuk, E.I.; Filshtinsky, L.A. Perforated Plates and Shells; Nauka: Moscow, Russia, 1970. (In Russian) [Google Scholar]
- Gurov, A.F.; Fedorov, V.A. Investigation of Stability and Bending of Electrodes of Ion-Optical Systems. In Proceedings of the 3rd Interuniversity Conference on the Research and Design of Medium-Power Electric Propulsion Systems, Kharkov, Ukraine, 15–20 June 1975. (In Russian). [Google Scholar]
- Birger, I.A. Some Mathematical Methods for Solving Engineering Problems; Oborongiz: Moscow, Russia, 1956. (In Russian) [Google Scholar]
- Fedorov, V.A. Investigation of Thermal Stability, Supercritical Behavior and Nonlinear Bending of Densely Perforated Annular Plates of Variable Stiffness. Izv. SSSR Rigid Body Mech. 1976, 5, 197. (In Russian) [Google Scholar]
- Besukhov, N.N.; Goldenblat, I.I.; Badjanov, V.L. Calculations for Strength, Stability and Fluctuations in High Temperature Conditions; Mechanical Engineering: Moscow, Russia, 1965. (In Russian) [Google Scholar]
Figure 1.
Forces arising in the “SSC-SD” virtual assembly (FIS is the force acting on the SSC (3) from the IS; FEP is the force acting on the SSC from the compensating propulsion system (1,2); Fd is the force acting on space debris).
Figure 1.
Forces arising in the “SSC-SD” virtual assembly (FIS is the force acting on the SSC (3) from the IS; FEP is the force acting on the SSC from the compensating propulsion system (1,2); Fd is the force acting on space debris).

Figure 2.
IS discrete elements.

Figure 3.
Predicted temperature patterns in the IS from the Slit-Type IES end.

Figure 4.
Predicted temperature patterns in the IS from the GDC end (sectional view).

Figure 5.
Predicted temperature patterns in the IS for the screen electrode.

Figure 6.
IS GDC thermogram.

Figure 7.
IS acceleration electrode thermogram.

Figure 8.
Plate element.

Figure 9.
Deflection diagram.

Figure 10.
Internal forces and moments.

Figure 11.
IS screen electrode additional deflection (∆w(0)) as a function of initially designed deflection (w0(0)) at different levels of temperature drop along SE radius.
Figure 11.
IS screen electrode additional deflection (∆w(0)) as a function of initially designed deflection (w0(0)) at different levels of temperature drop along SE radius.

Figure 12.
IS acceleration electrode additional deflection (∆w(0)) as a function of initially designed deflection (w0(0)) at different levels of temperature drop along AE radius.
Figure 12.
IS acceleration electrode additional deflection (∆w(0)) as a function of initially designed deflection (w0(0)) at different levels of temperature drop along AE radius.

Figure 13.
Additional deflection (∆w(0)) for the SE made of titanium alloy with 160 mm diameter as a function of its initially designed deflection (w0(0)).
Figure 13.
Additional deflection (∆w(0)) for the SE made of titanium alloy with 160 mm diameter as a function of its initially designed deflection (w0(0)).

Figure 14.
Additional deflection (∆w(0)) for the AE made of titanium alloy with 160 mm diameter as a function of its initially designed deflection (w0(0)).
Figure 14.
Additional deflection (∆w(0)) for the AE made of titanium alloy with 160 mm diameter as a function of its initially designed deflection (w0(0)).

Figure 15.
Numerical simulations of electrode geometry in the ANSYS software.

Figure 16.
Element-by-element partition of electrodes in the ANSYS software—mesh model development.

Figure 17.
Thermal patterns of electrodes in the ANSYS software.

Figure 18.
Electrode deflection w(0) as a function of temperature differential along the electrode radius calculated by simplified algorithm and in the ANSYS software.
Figure 18.
Electrode deflection w(0) as a function of temperature differential along the electrode radius calculated by simplified algorithm and in the ANSYS software.

Figure 19.
IS thermal fields with 350 W power supplied to the inductor.


Table 1.
Electrode design deflection simulation results as a function of initially designed deflection and temperature gradient along electrode radius.
Table 1.
Electrode design deflection simulation results as a function of initially designed deflection and temperature gradient along electrode radius.
| ΔTr, °C | 30 | 40 | 50 | 60 | 80 |
|---|---|---|---|---|---|
| w0(0), mm | Δw(0), mm | ||||
| Screen electrode | |||||
| 5 | 0.0071 | 0.0094 | 0.0118 | 0.0141 | 0.0188 |
| 7.5 | 0.0047 | 0.0063 | 0.0079 | 0.0094 | 0.0126 |
| 9.5 | 0.0037 | 0.00498 | 0.0062 | 0.0075 | 0.0099 |
| 12.5 | 0.0028 | 0.0038 | 0.0047 | 0.0057 | 0.0076 |
| 15 | 0.0024 | 0.0032 | 0.0039 | 0.0047 | 0.0063 |
| 20 | 0.0018 | 0.0024 | 0.003 | 0.0036 | 0.0047 |
| 25 | 0.0014 | 0.0019 | 0.0024 | 0.0028 | 0.0038 |
| 30 | 0.0012 | 0.0016 | 0.002 | 0.0024 | 0.0032 |
| Acceleration electrode | |||||
| 5 | 0.0057 | 0.0076 | 0.0095 | 0.0114 | 0.0152 |
| 7.5 | 0.0043 | 0.0057 | 0.0071 | 0.0085 | 0.0114 |
| 9.5 | 0.0035 | 0.0047 | 0.0058 | 0.0070 | 0.0093 |
| 12.5 | 0.0027 | 0.0036 | 0.0046 | 0.0055 | 0.0073 |
| 15 | 0.0023 | 0.0031 | 0.0038 | 0.0046 | 0.0061 |
| 20 | 0.0017 | 0.0023 | 0.0029 | 0.0035 | 0.0047 |
| 25 | 0.0014 | 0.0019 | 0.0023 | 0.0028 | 0.0038 |
| 30 | 0.0012 | 0.0016 | 0.0020 | 0.0024 | 0.0031 |
Table 2.
Experimental results for the IS with the slit-type perforation.
| Mass Flow Rate, mg/s | PRFG, W | USE, V | ISE, A | UAE, V | IAE, A | Isp, s | Ip, A | P, mN | W, keV |
|---|---|---|---|---|---|---|---|---|---|
| 0.771 | 220 | 2500 | 0.190 | 240 | 0.008 | 2083 | 0.18 | 16.0 | 2.50 |
| 0.976 | 310 | 2400 | 0.400 | 220 | 0.001 | 3396 | 0.4 | 33.1 | 2.40 |
| 0.976 | 330 | 2400 | 0.410 | 220 | 0.001 | 3480 | 0.41 | 33.9 | 2.40 |
| 0.488 | 100 | 3000 | 0.100 | 300 | 0.008 | 1896 | 0.09 | 9.28 | 3.00 |
| 0.781 | 150 | 3000 | 0.150 | 300 | 0.009 | 1778 | 0.14 | 13.9 | 3.00 |
| 0.781 | 160 | 3000 | 0.170 | 300 | 0.009 | 2015 | 0.16 | 15.8 | 3.00 |
| 0.781 | 180 | 3000 | 0.190 | 300 | 0.009 | 2252 | 0.18 | 17.6 | 3.00 |
| 0.917 | 220 | 3000 | 0.240 | 300 | 0.010 | 2421 | 0.23 | 22.3 | 3.00 |
| 0.947 | 235 | 3000 | 0.260 | 300 | 0.010 | 2542 | 0.25 | 24.1 | 3.00 |
| 0.947 | 235 | 3000 | 0.280 | 300 | 0.010 | 2737 | 0.27 | 25.97 | 3.00 |
Publisher’s Note: MDPI stays neutral with regard to jurisdictional claims in published maps and institutional affiliations. |
© 2021 by the authors. Licensee MDPI, Basel, Switzerland. This article is an open access article distributed under the terms and conditions of the Creative Commons Attribution (CC BY) license (https://creativecommons.org/licenses/by/4.0/).
Share and Cite
MDPI and ACS Style
Svotina, V.V.; Mogulkin, A.I.; Kupreeva, A.Y. Ion Source—Thermal and Thermomechanical Simulation. Aerospace 2021, 8, 189. https://0-doi-org.brum.beds.ac.uk/10.3390/aerospace8070189
AMA Style
Svotina VV, Mogulkin AI, Kupreeva AY. Ion Source—Thermal and Thermomechanical Simulation. Aerospace. 2021; 8(7):189. https://0-doi-org.brum.beds.ac.uk/10.3390/aerospace8070189
Chicago/Turabian StyleSvotina, Victoria V., Andrey I. Mogulkin, and Alexandra Y. Kupreeva. 2021. "Ion Source—Thermal and Thermomechanical Simulation" Aerospace 8, no. 7: 189. https://0-doi-org.brum.beds.ac.uk/10.3390/aerospace8070189
Note that from the first issue of 2016, this journal uses article numbers instead of page numbers. See further details here.