
A Simplified Finite Element Model of Riveted Joints for Structural Analyses with Consideration of Nonlinear Load-Transfer Characteristics


Abstract
:
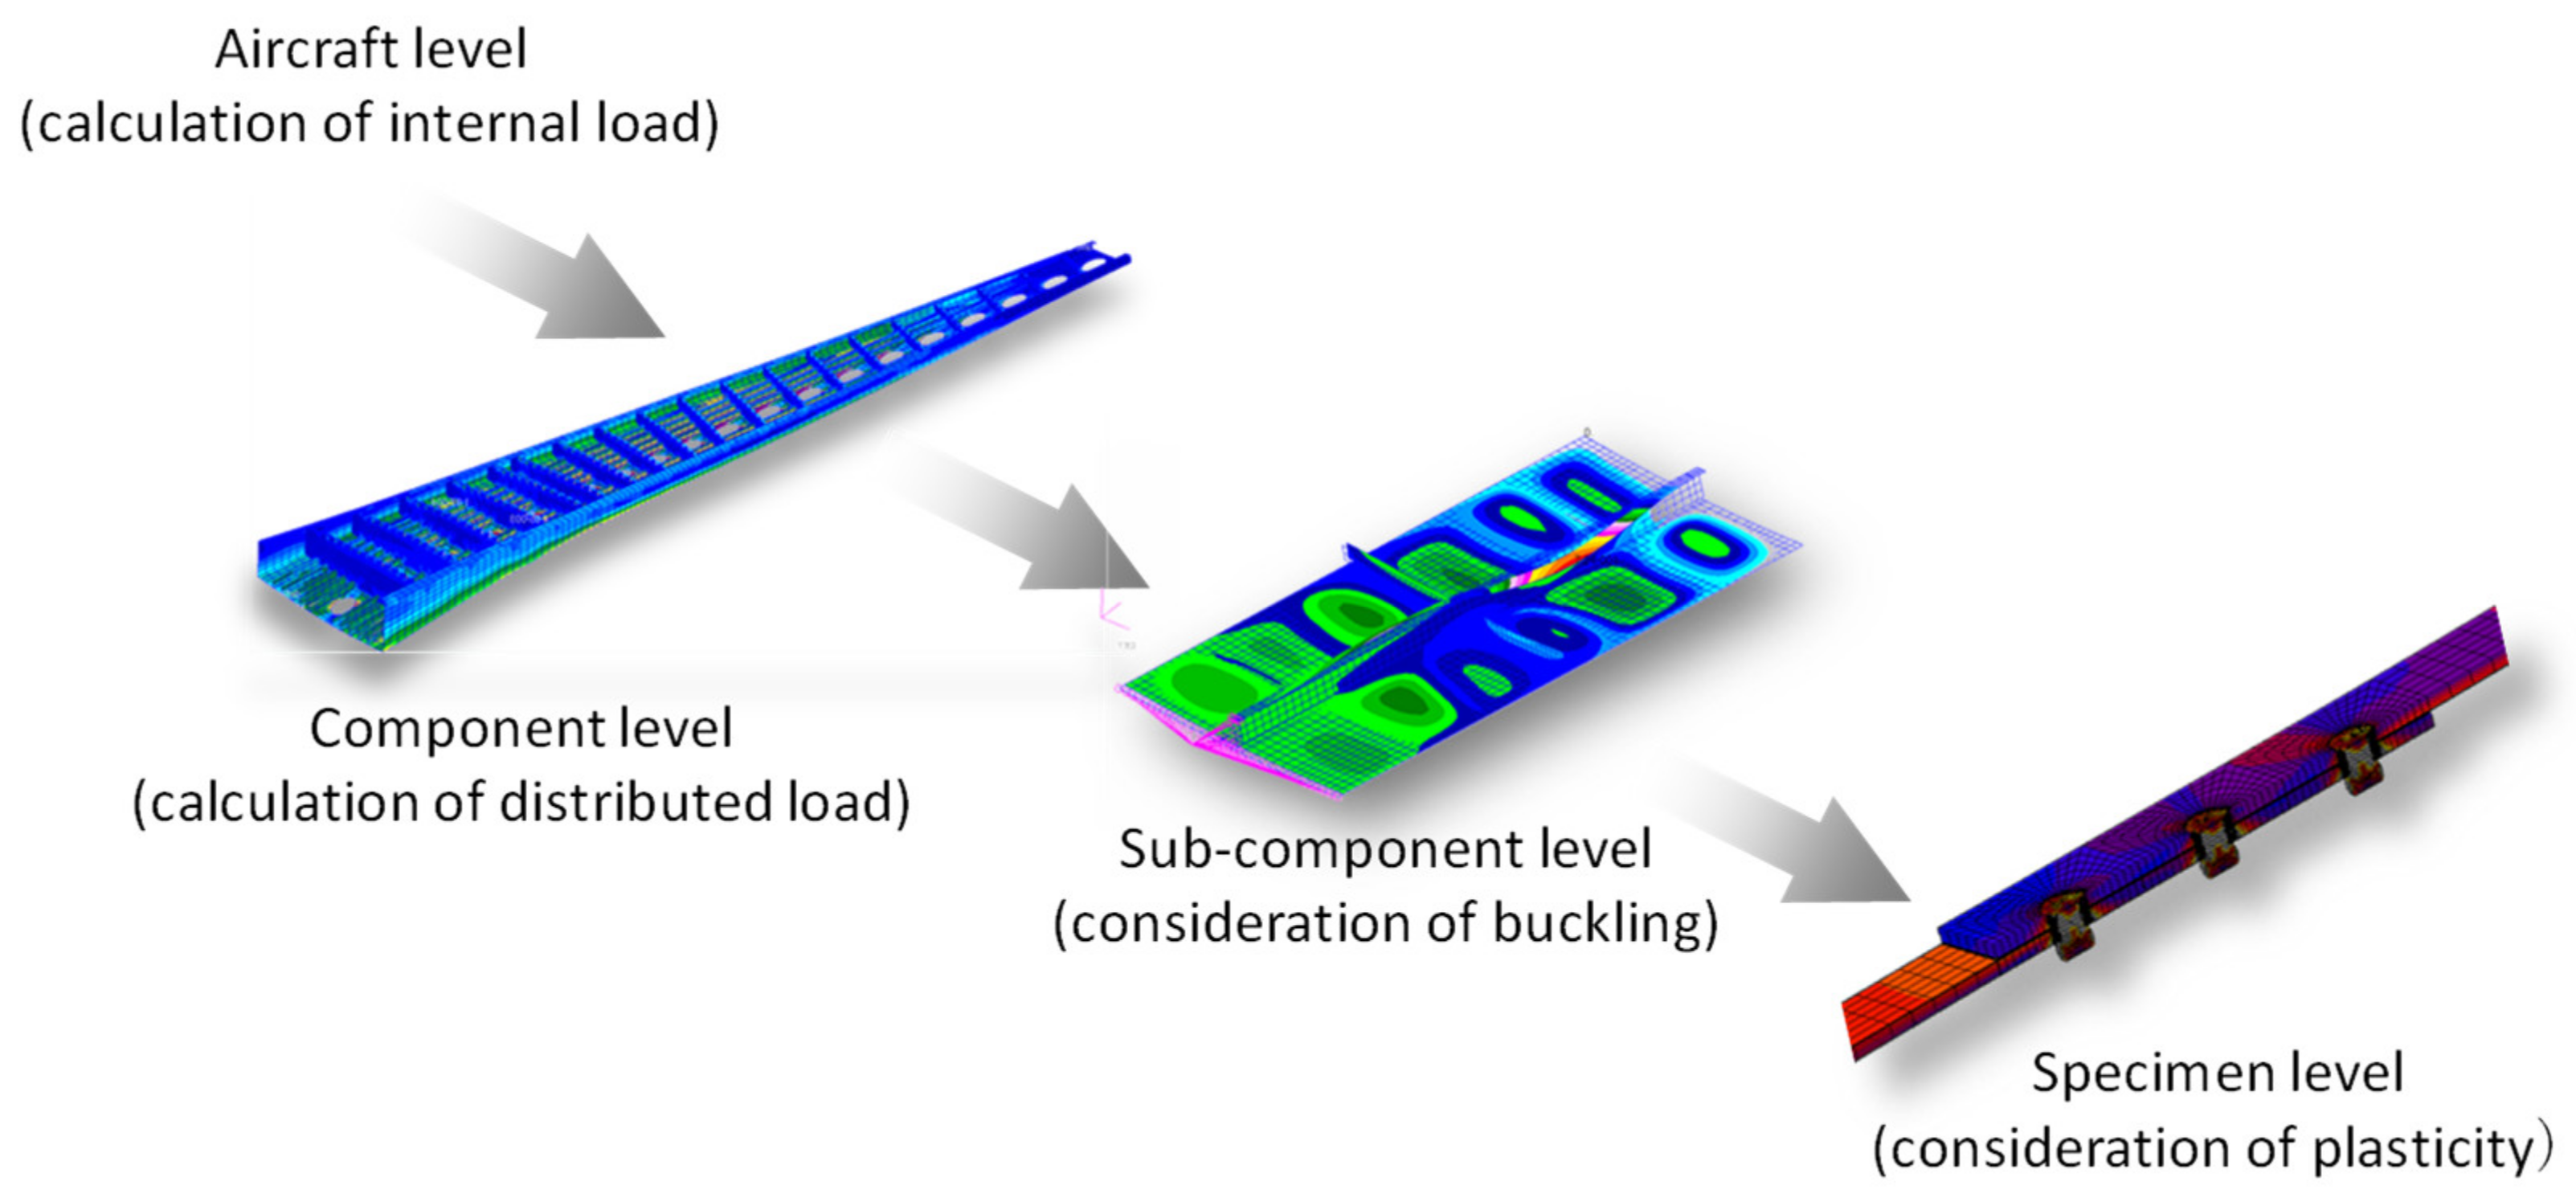
1. Introduction
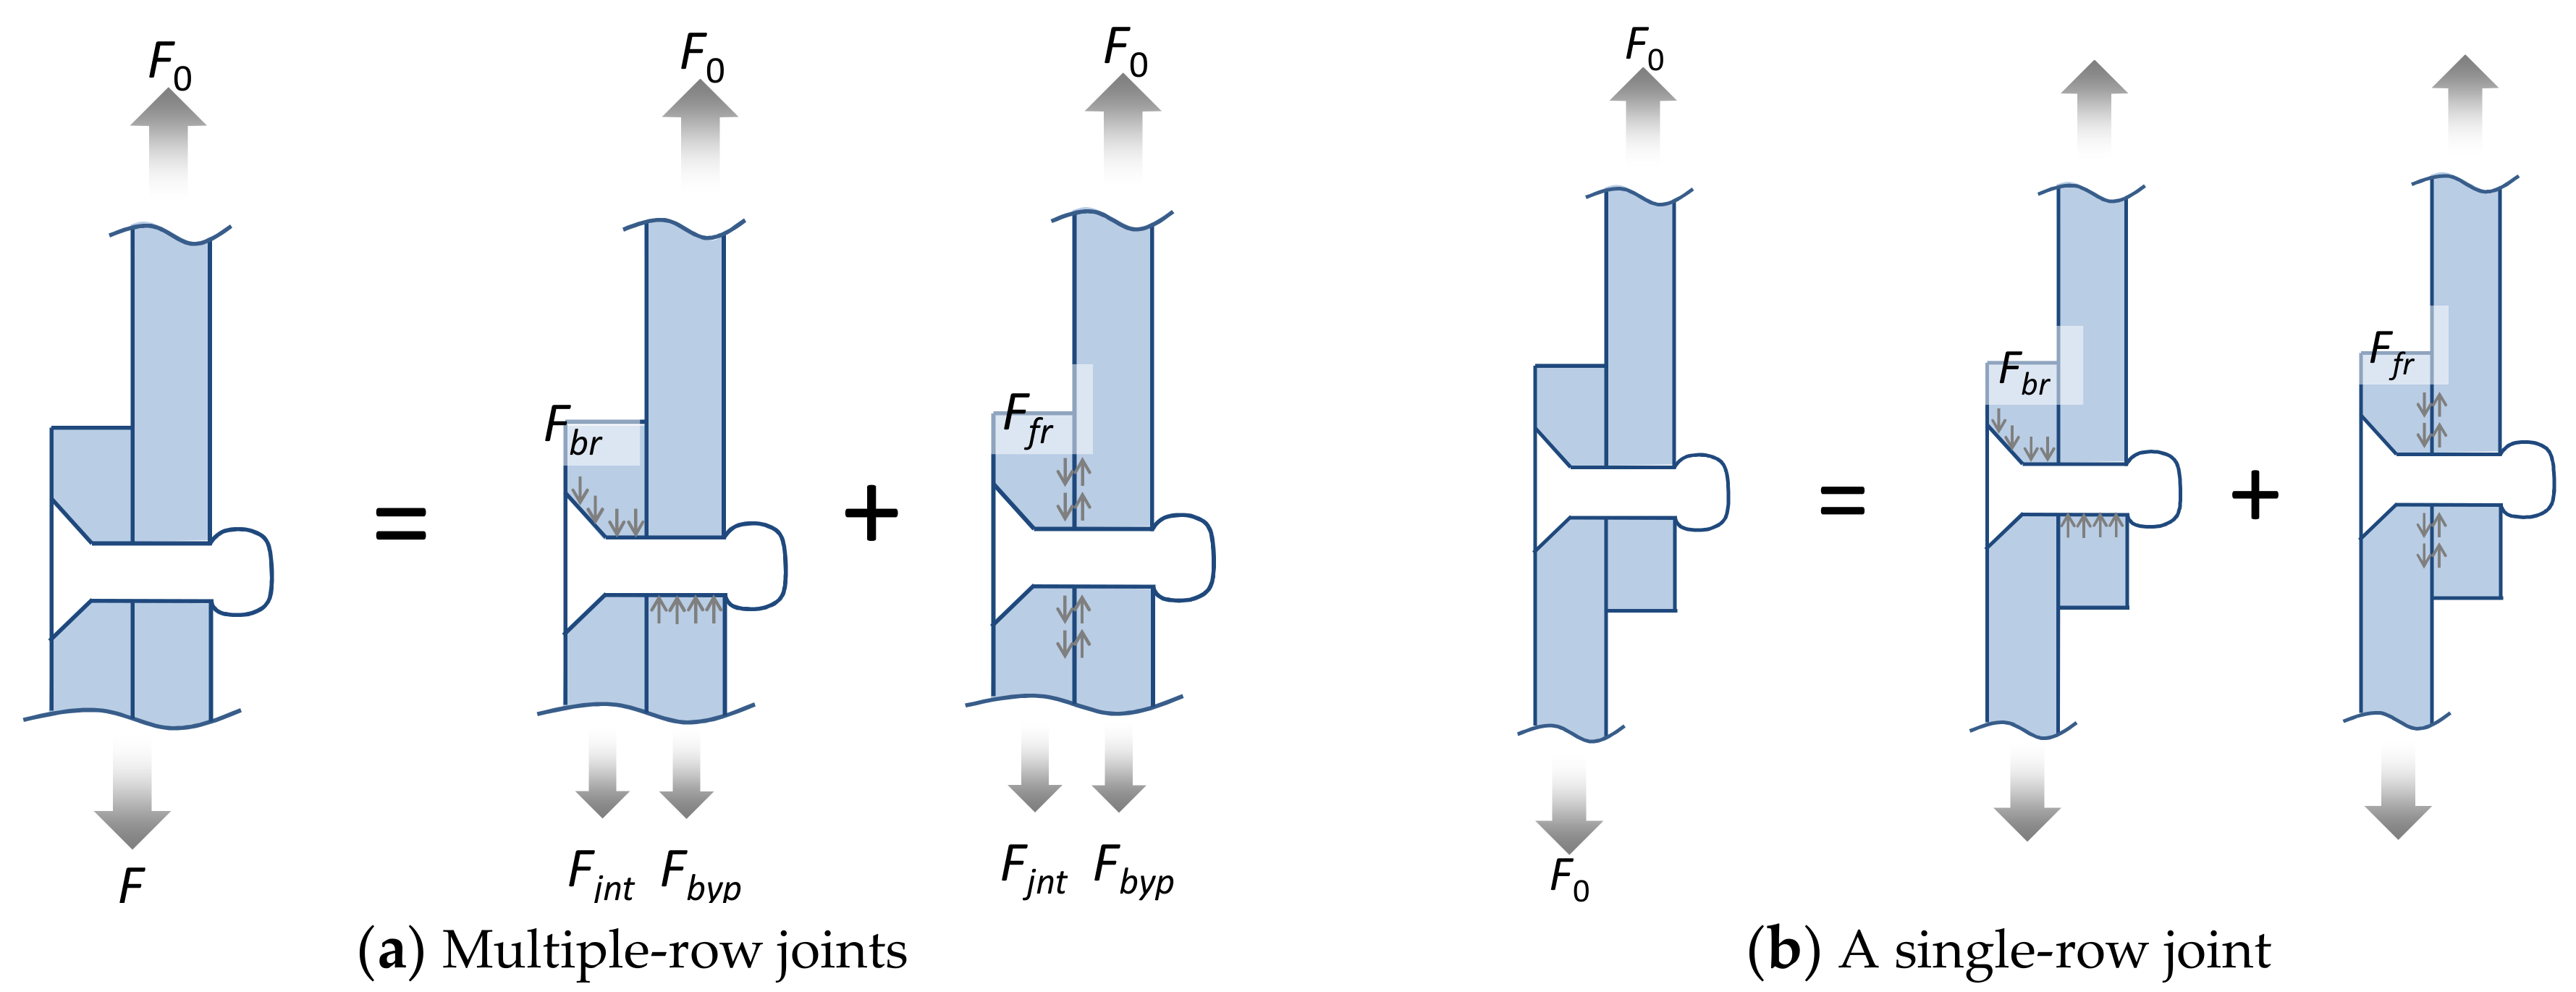
2. Definition of Loads Transferred through Rivet Joints
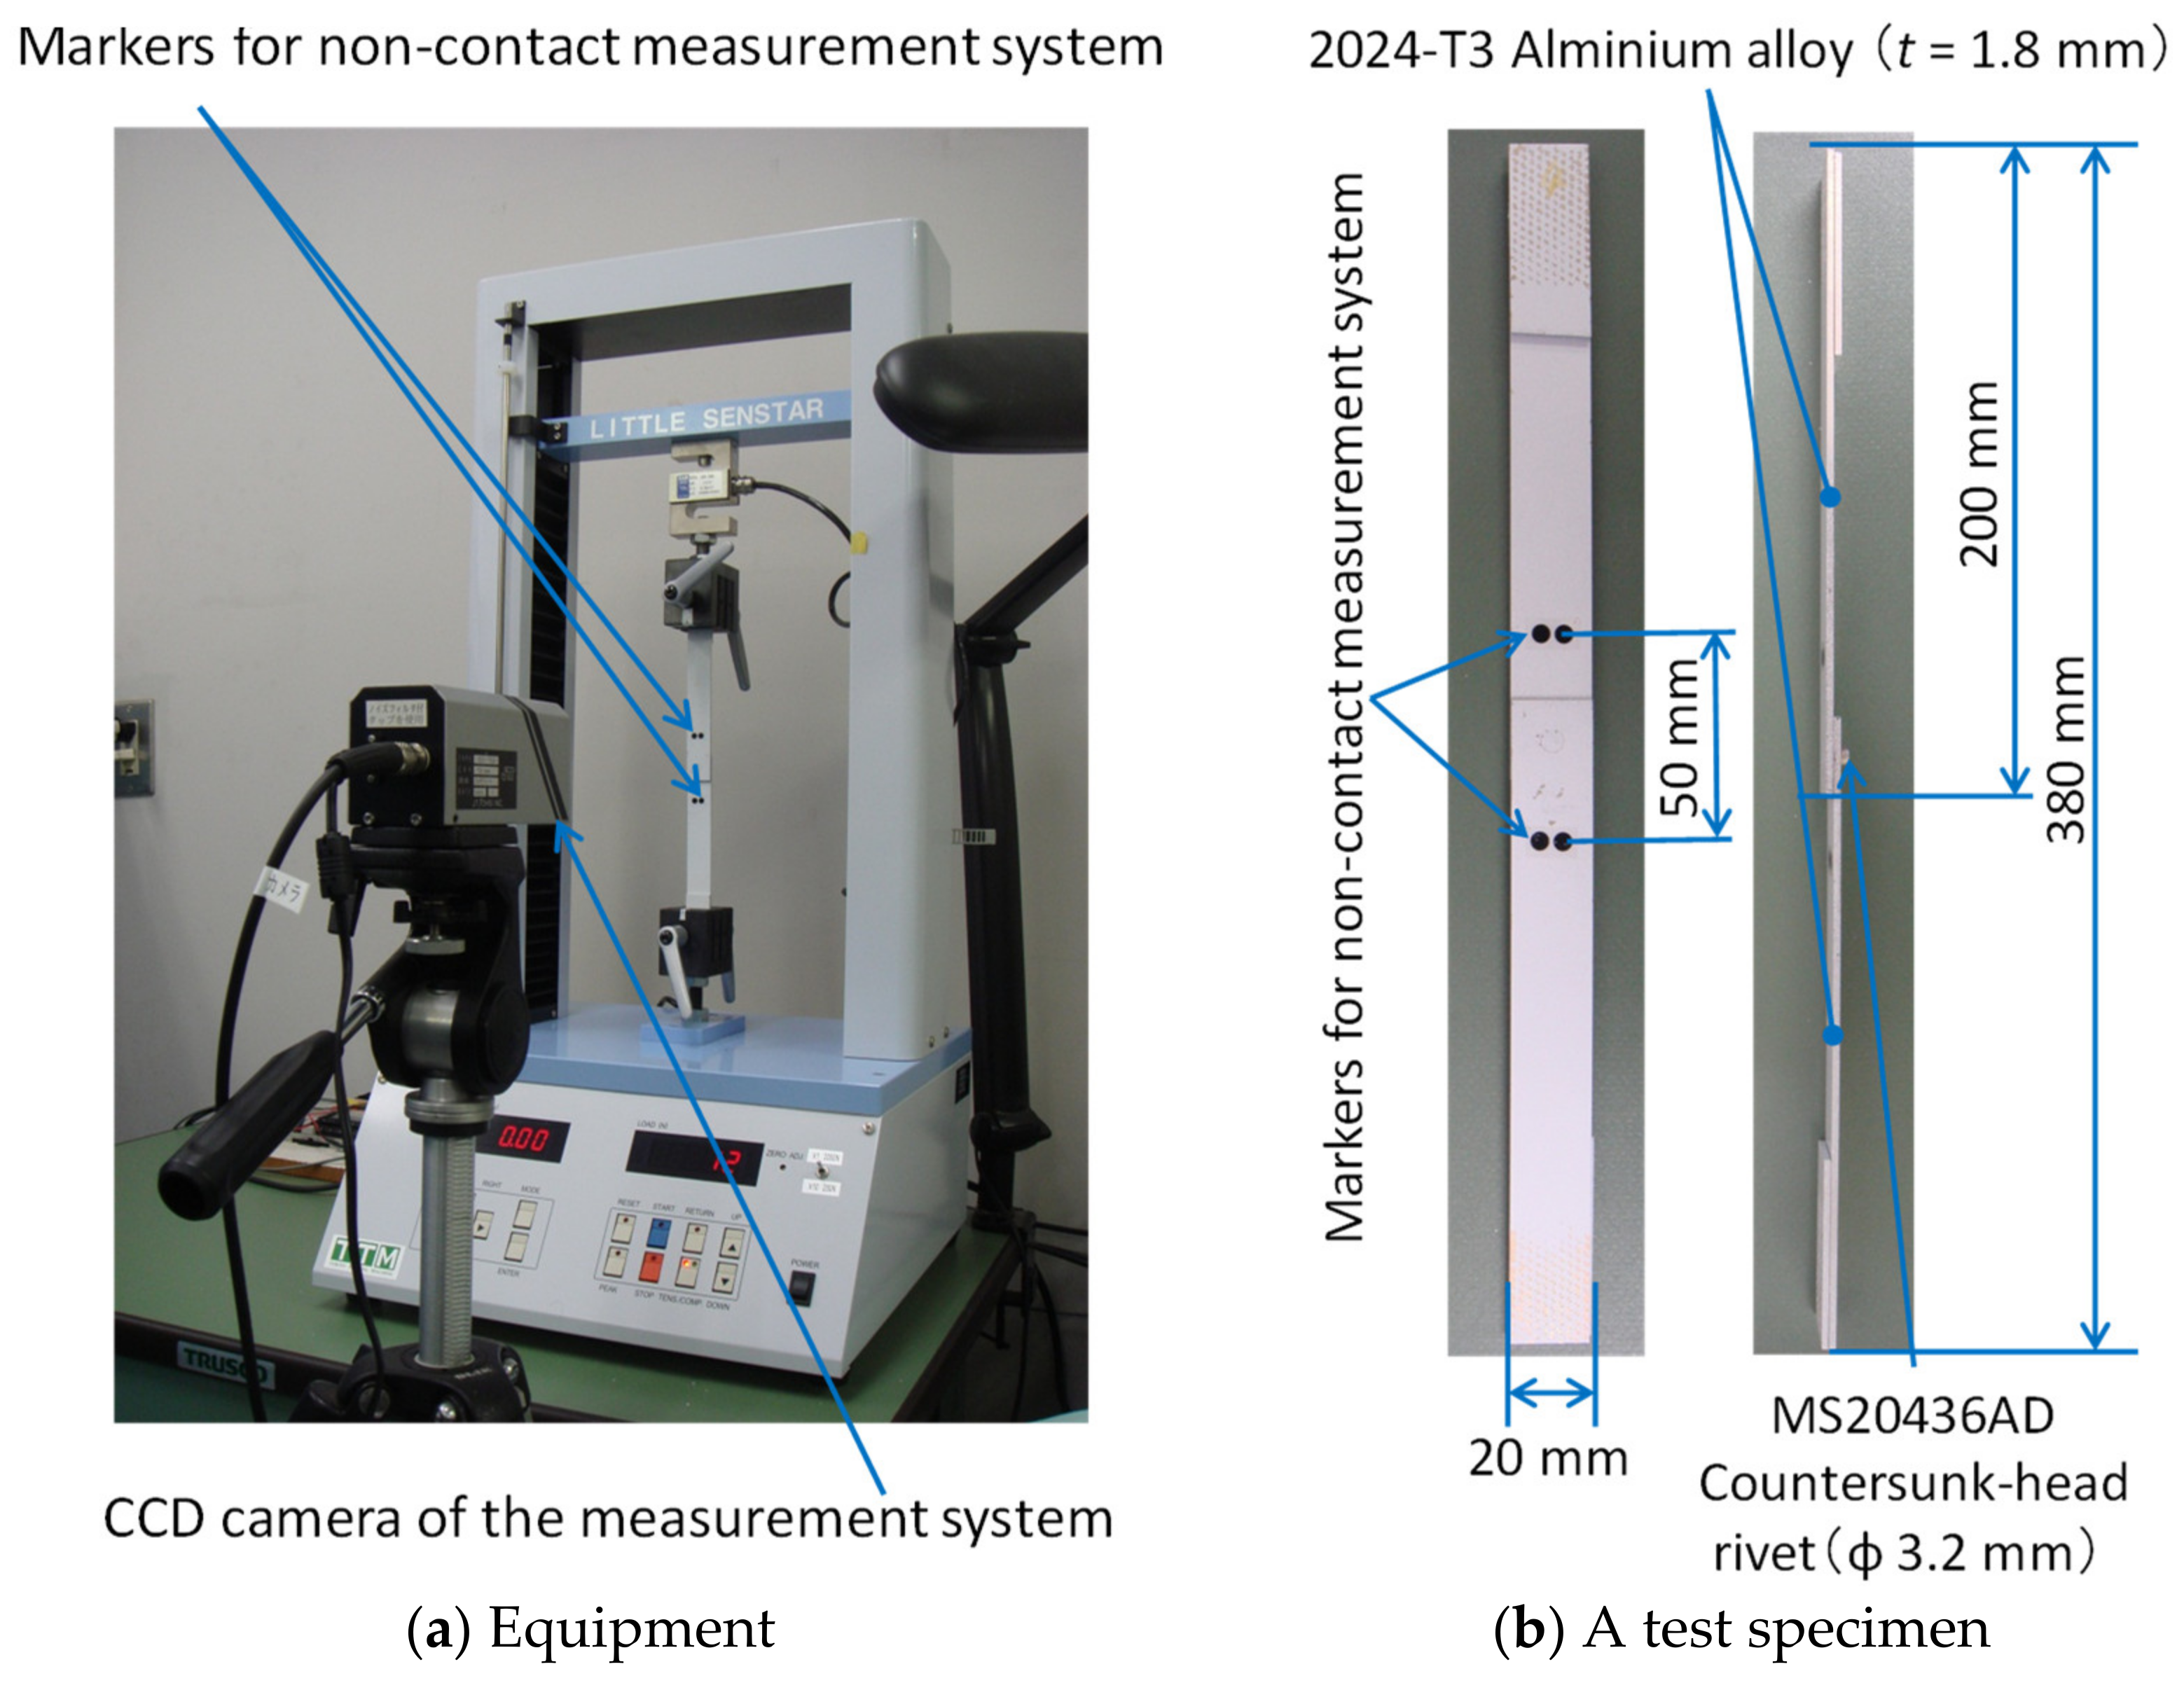
3. Experiment
3.1. Experimental Set Up
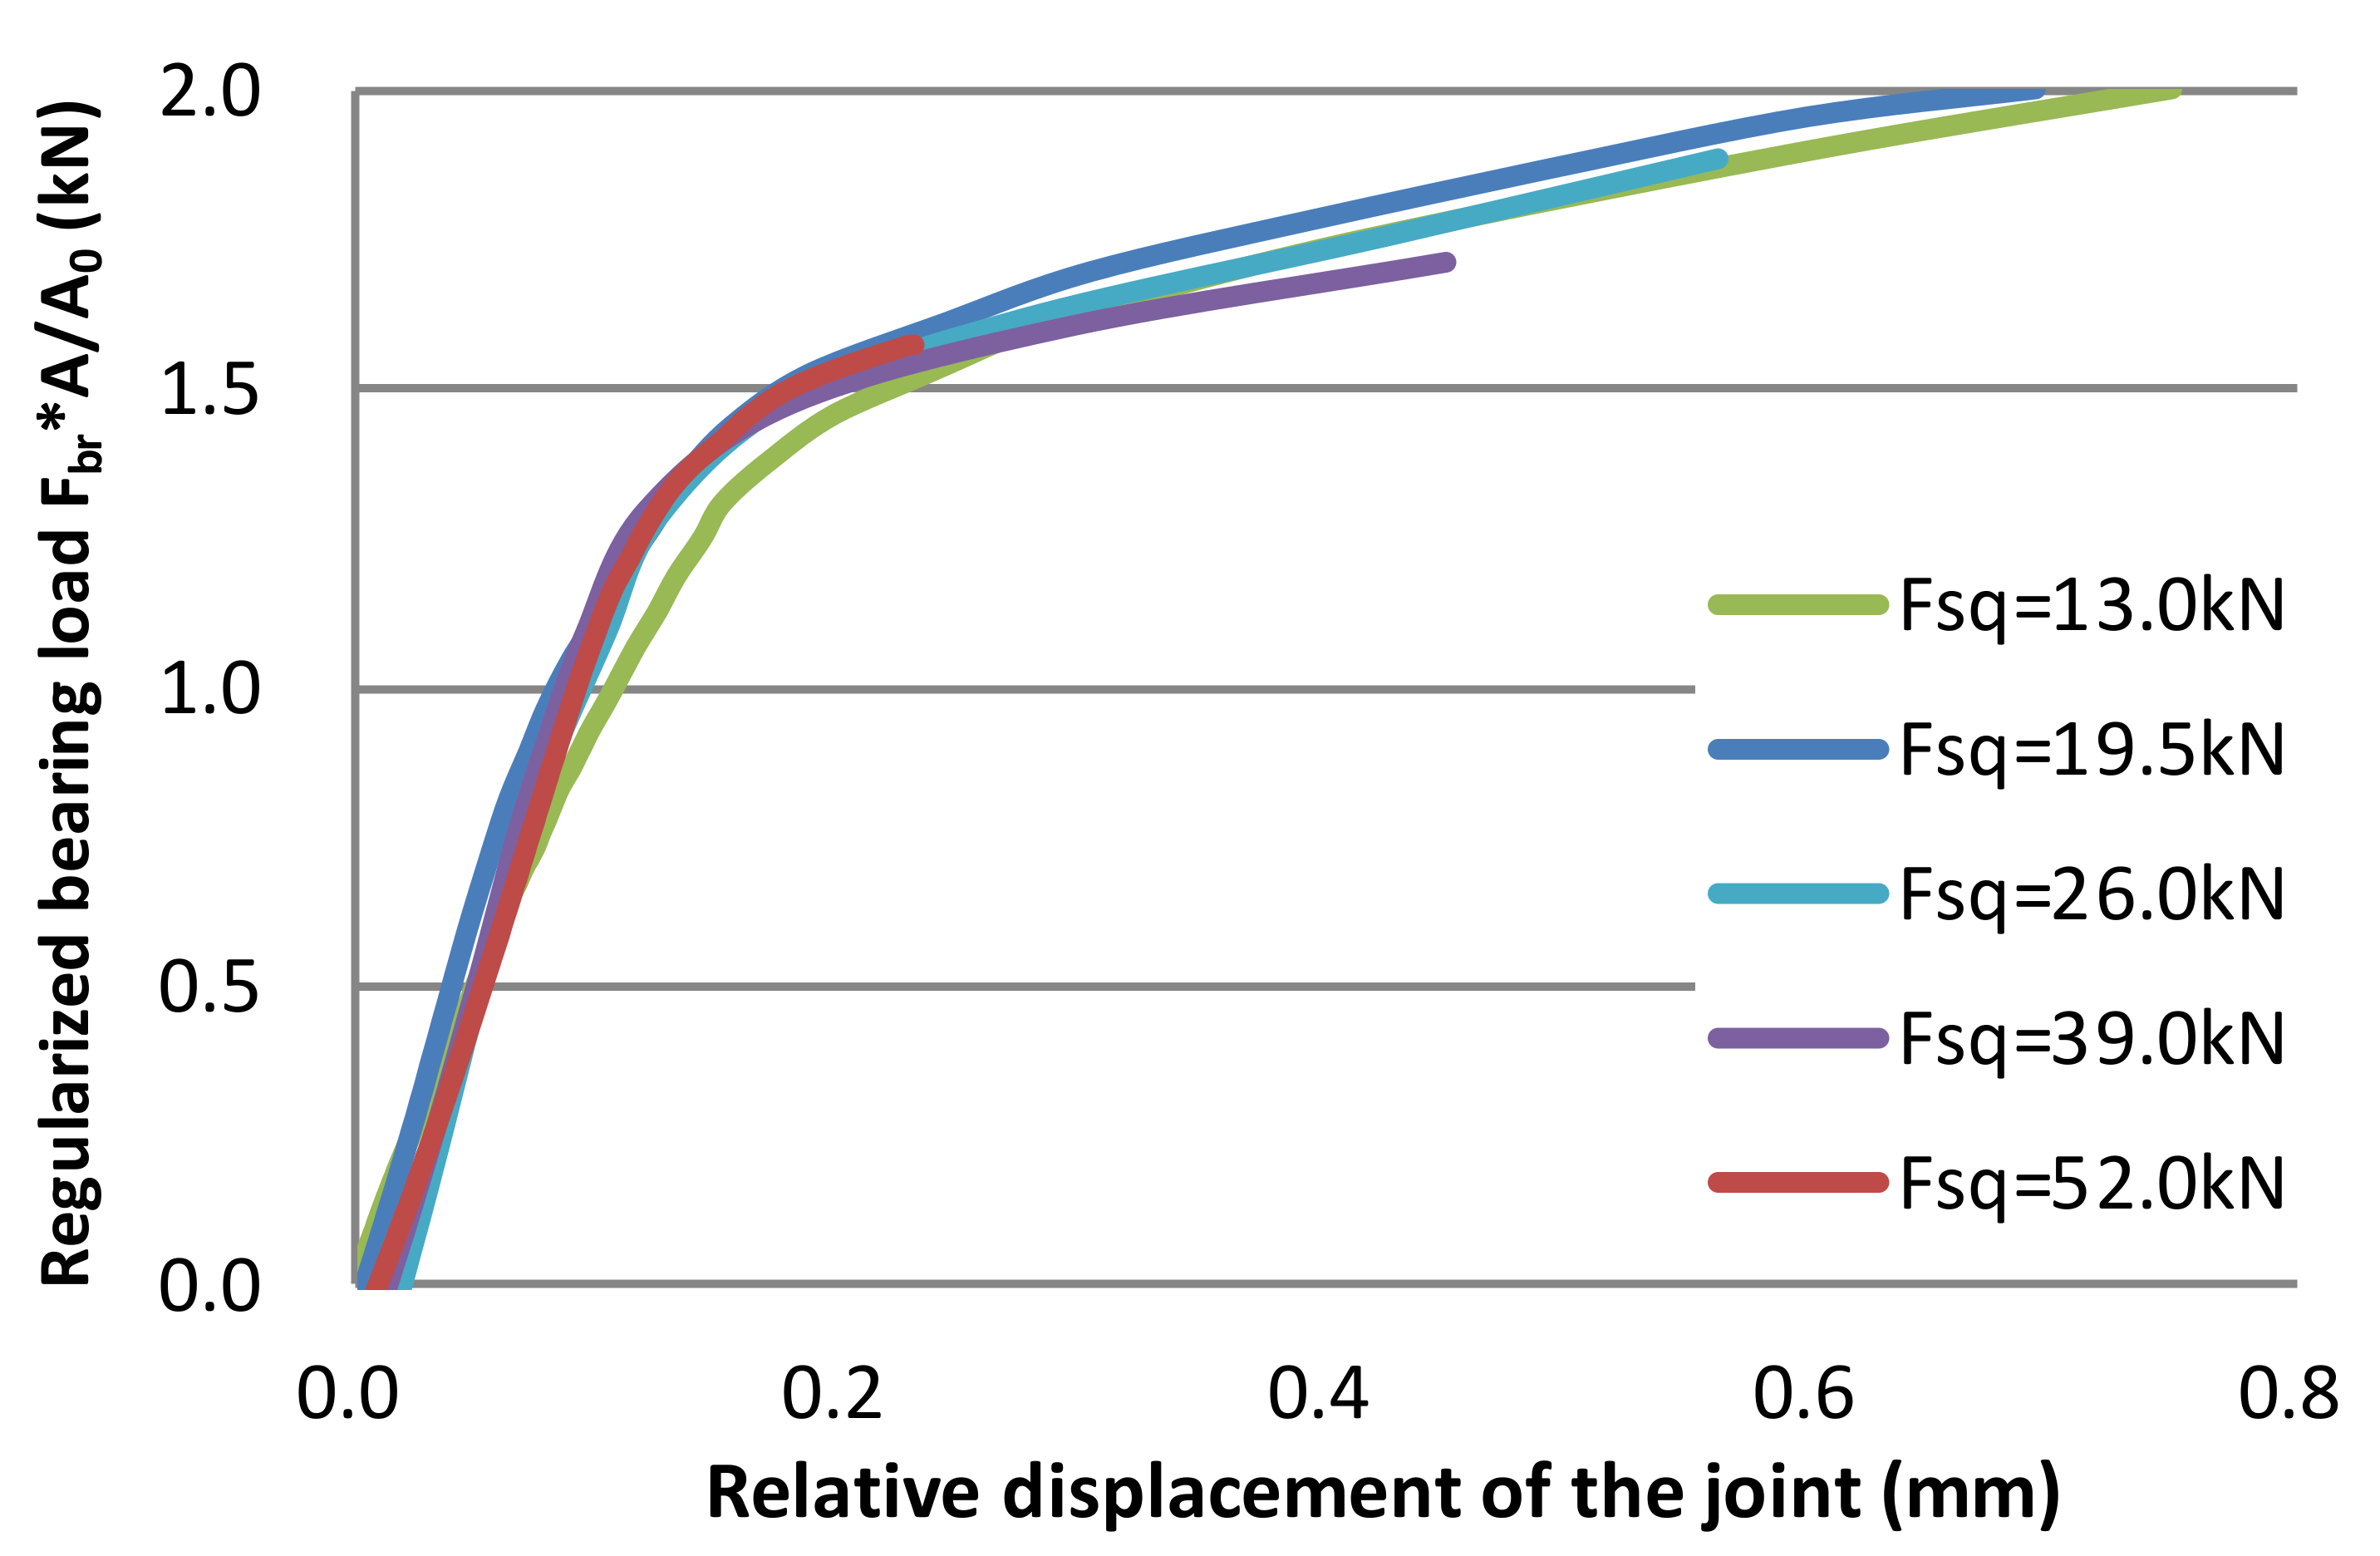
3.2. Results and Discussion
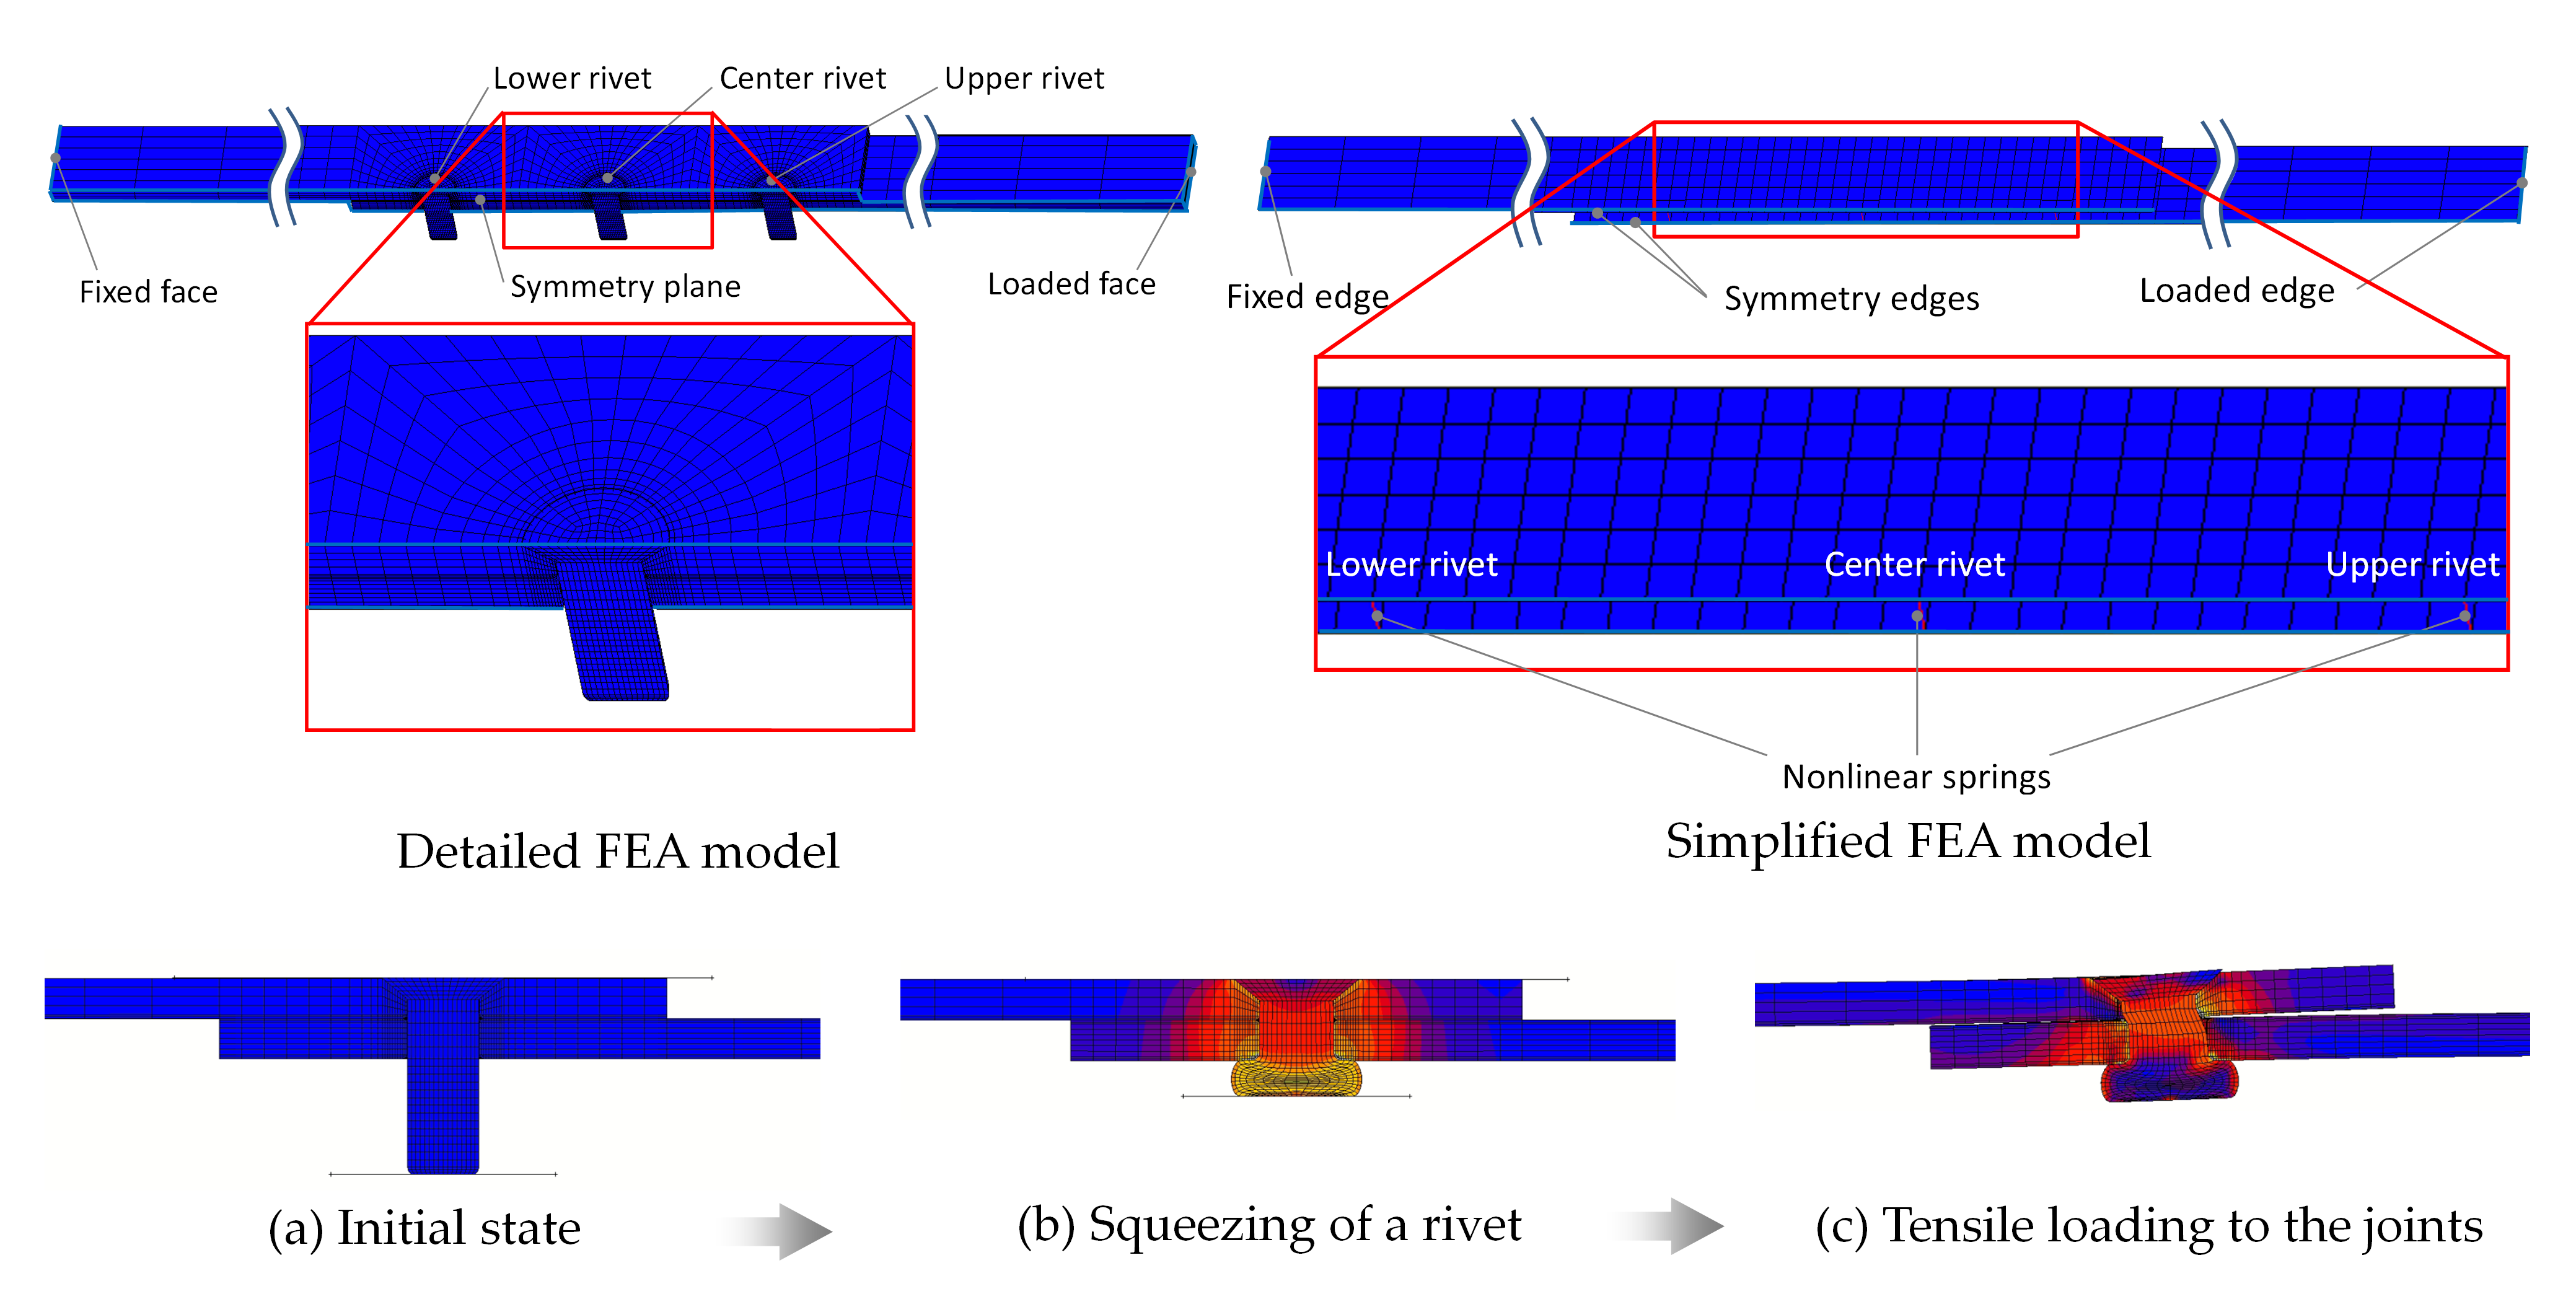
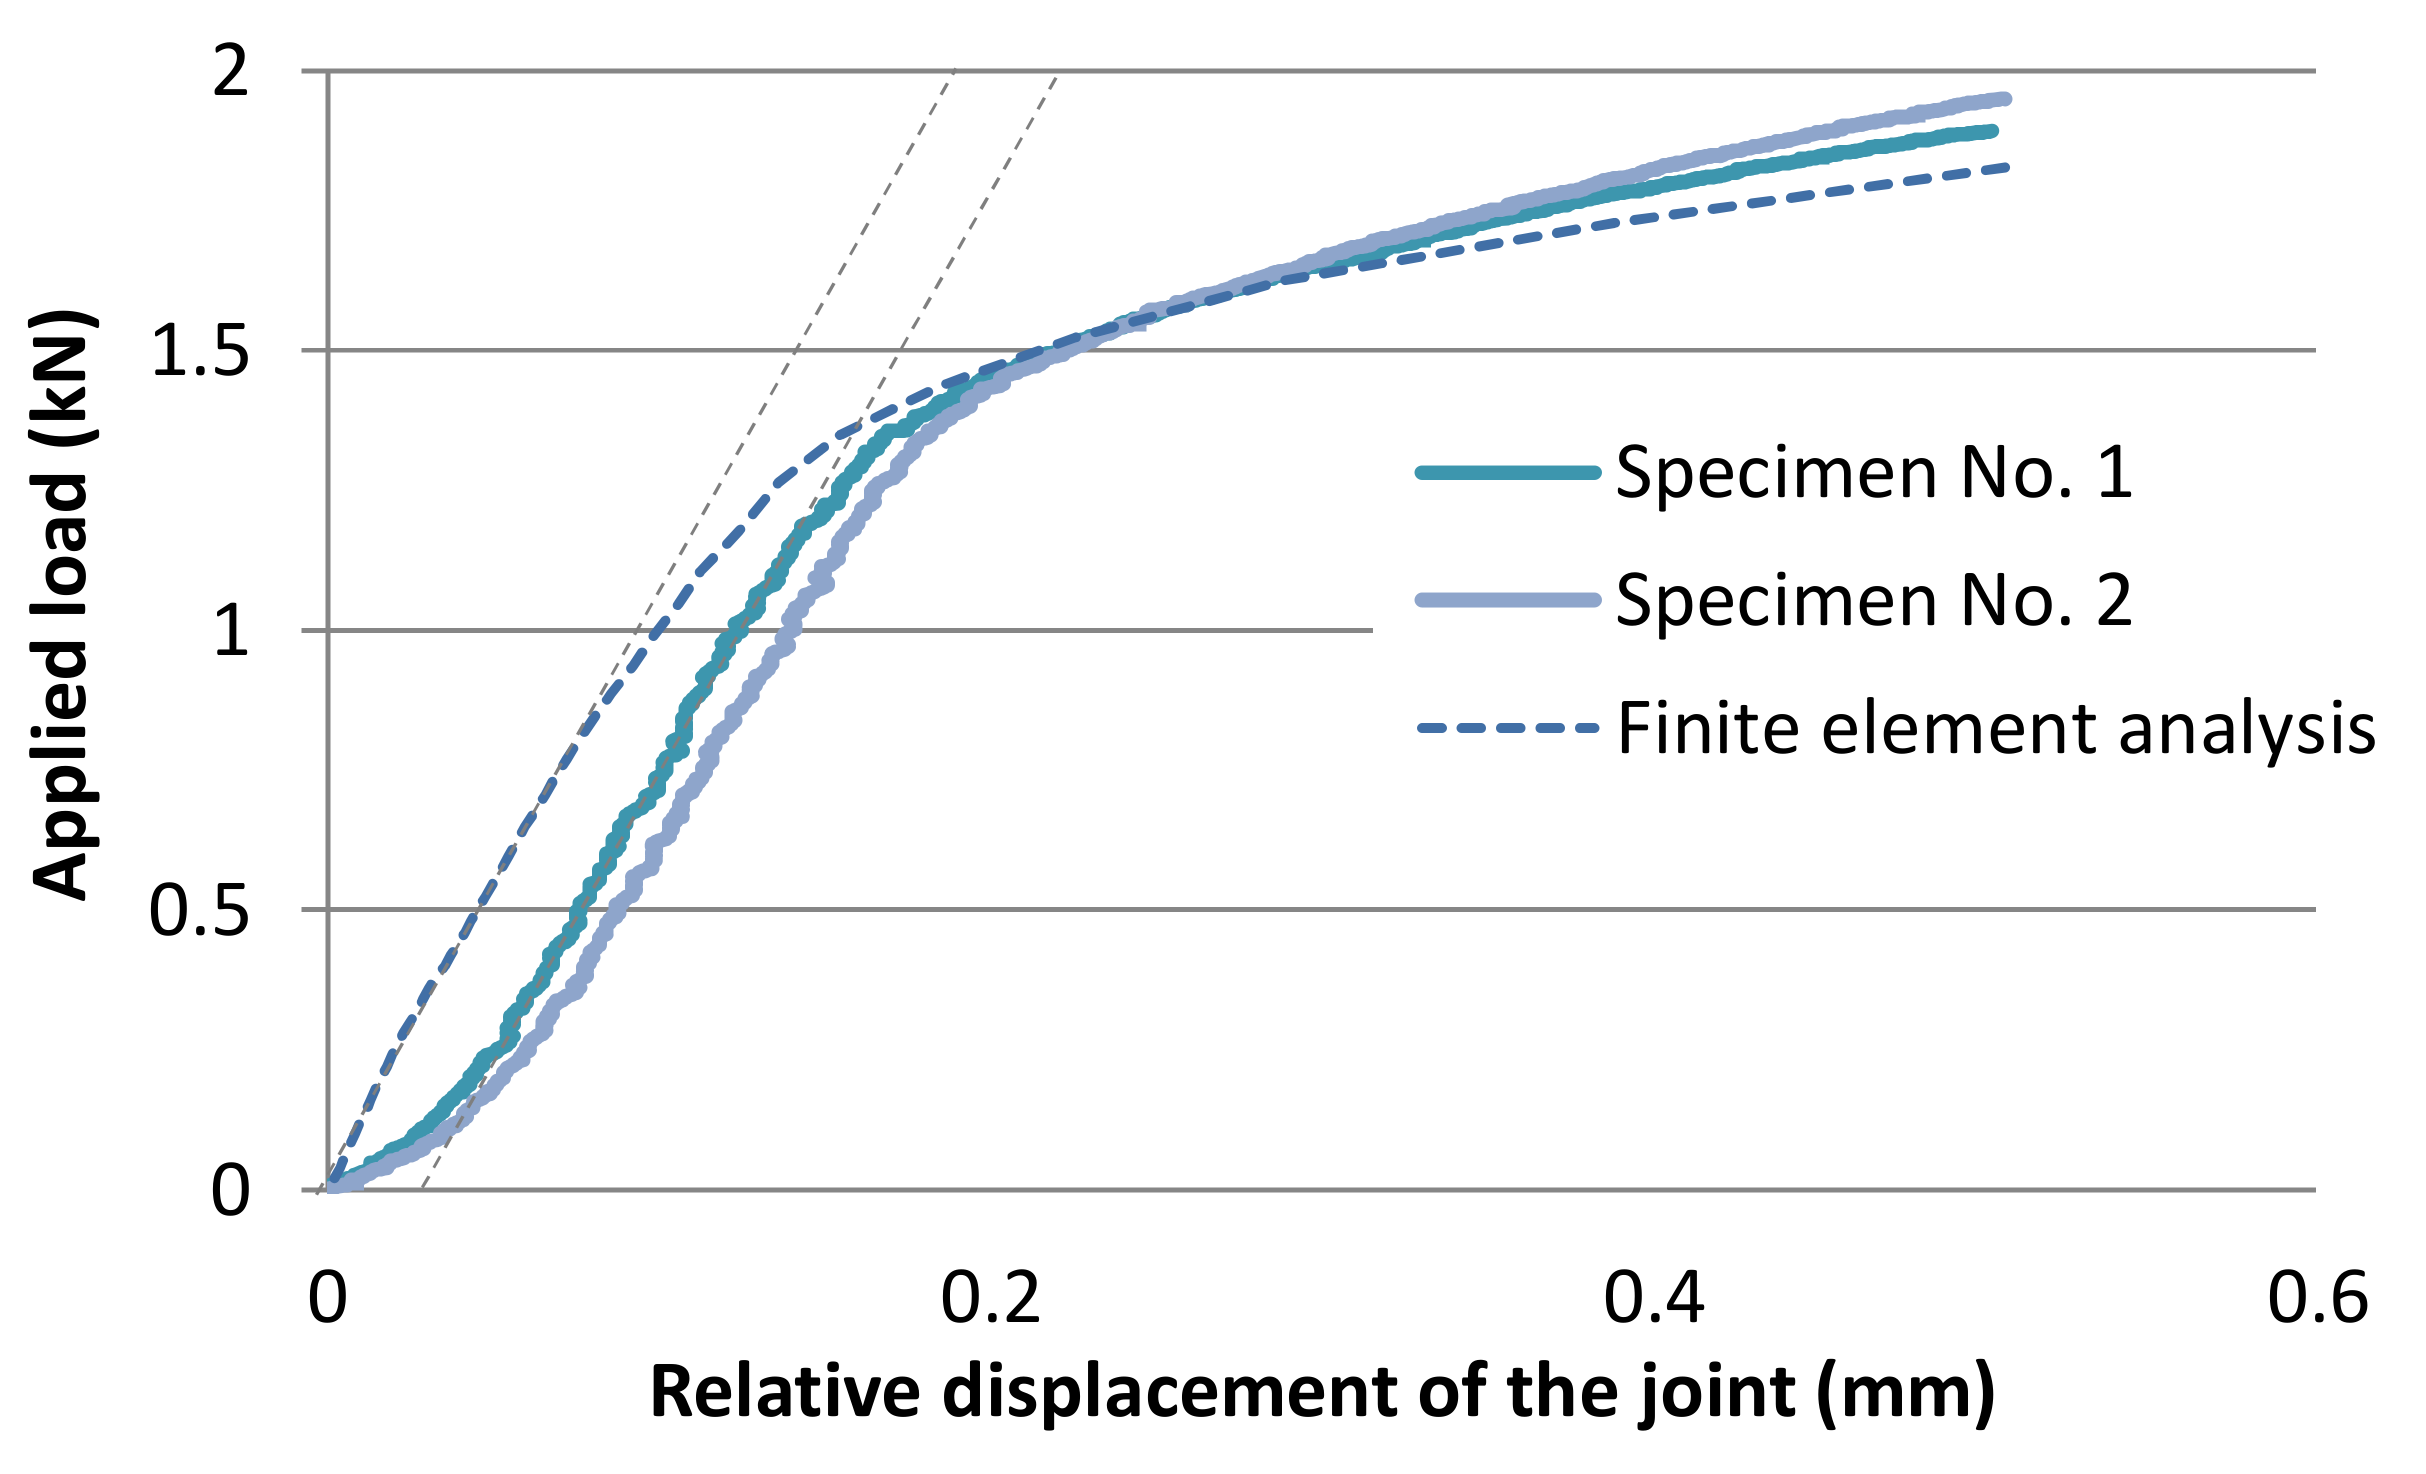
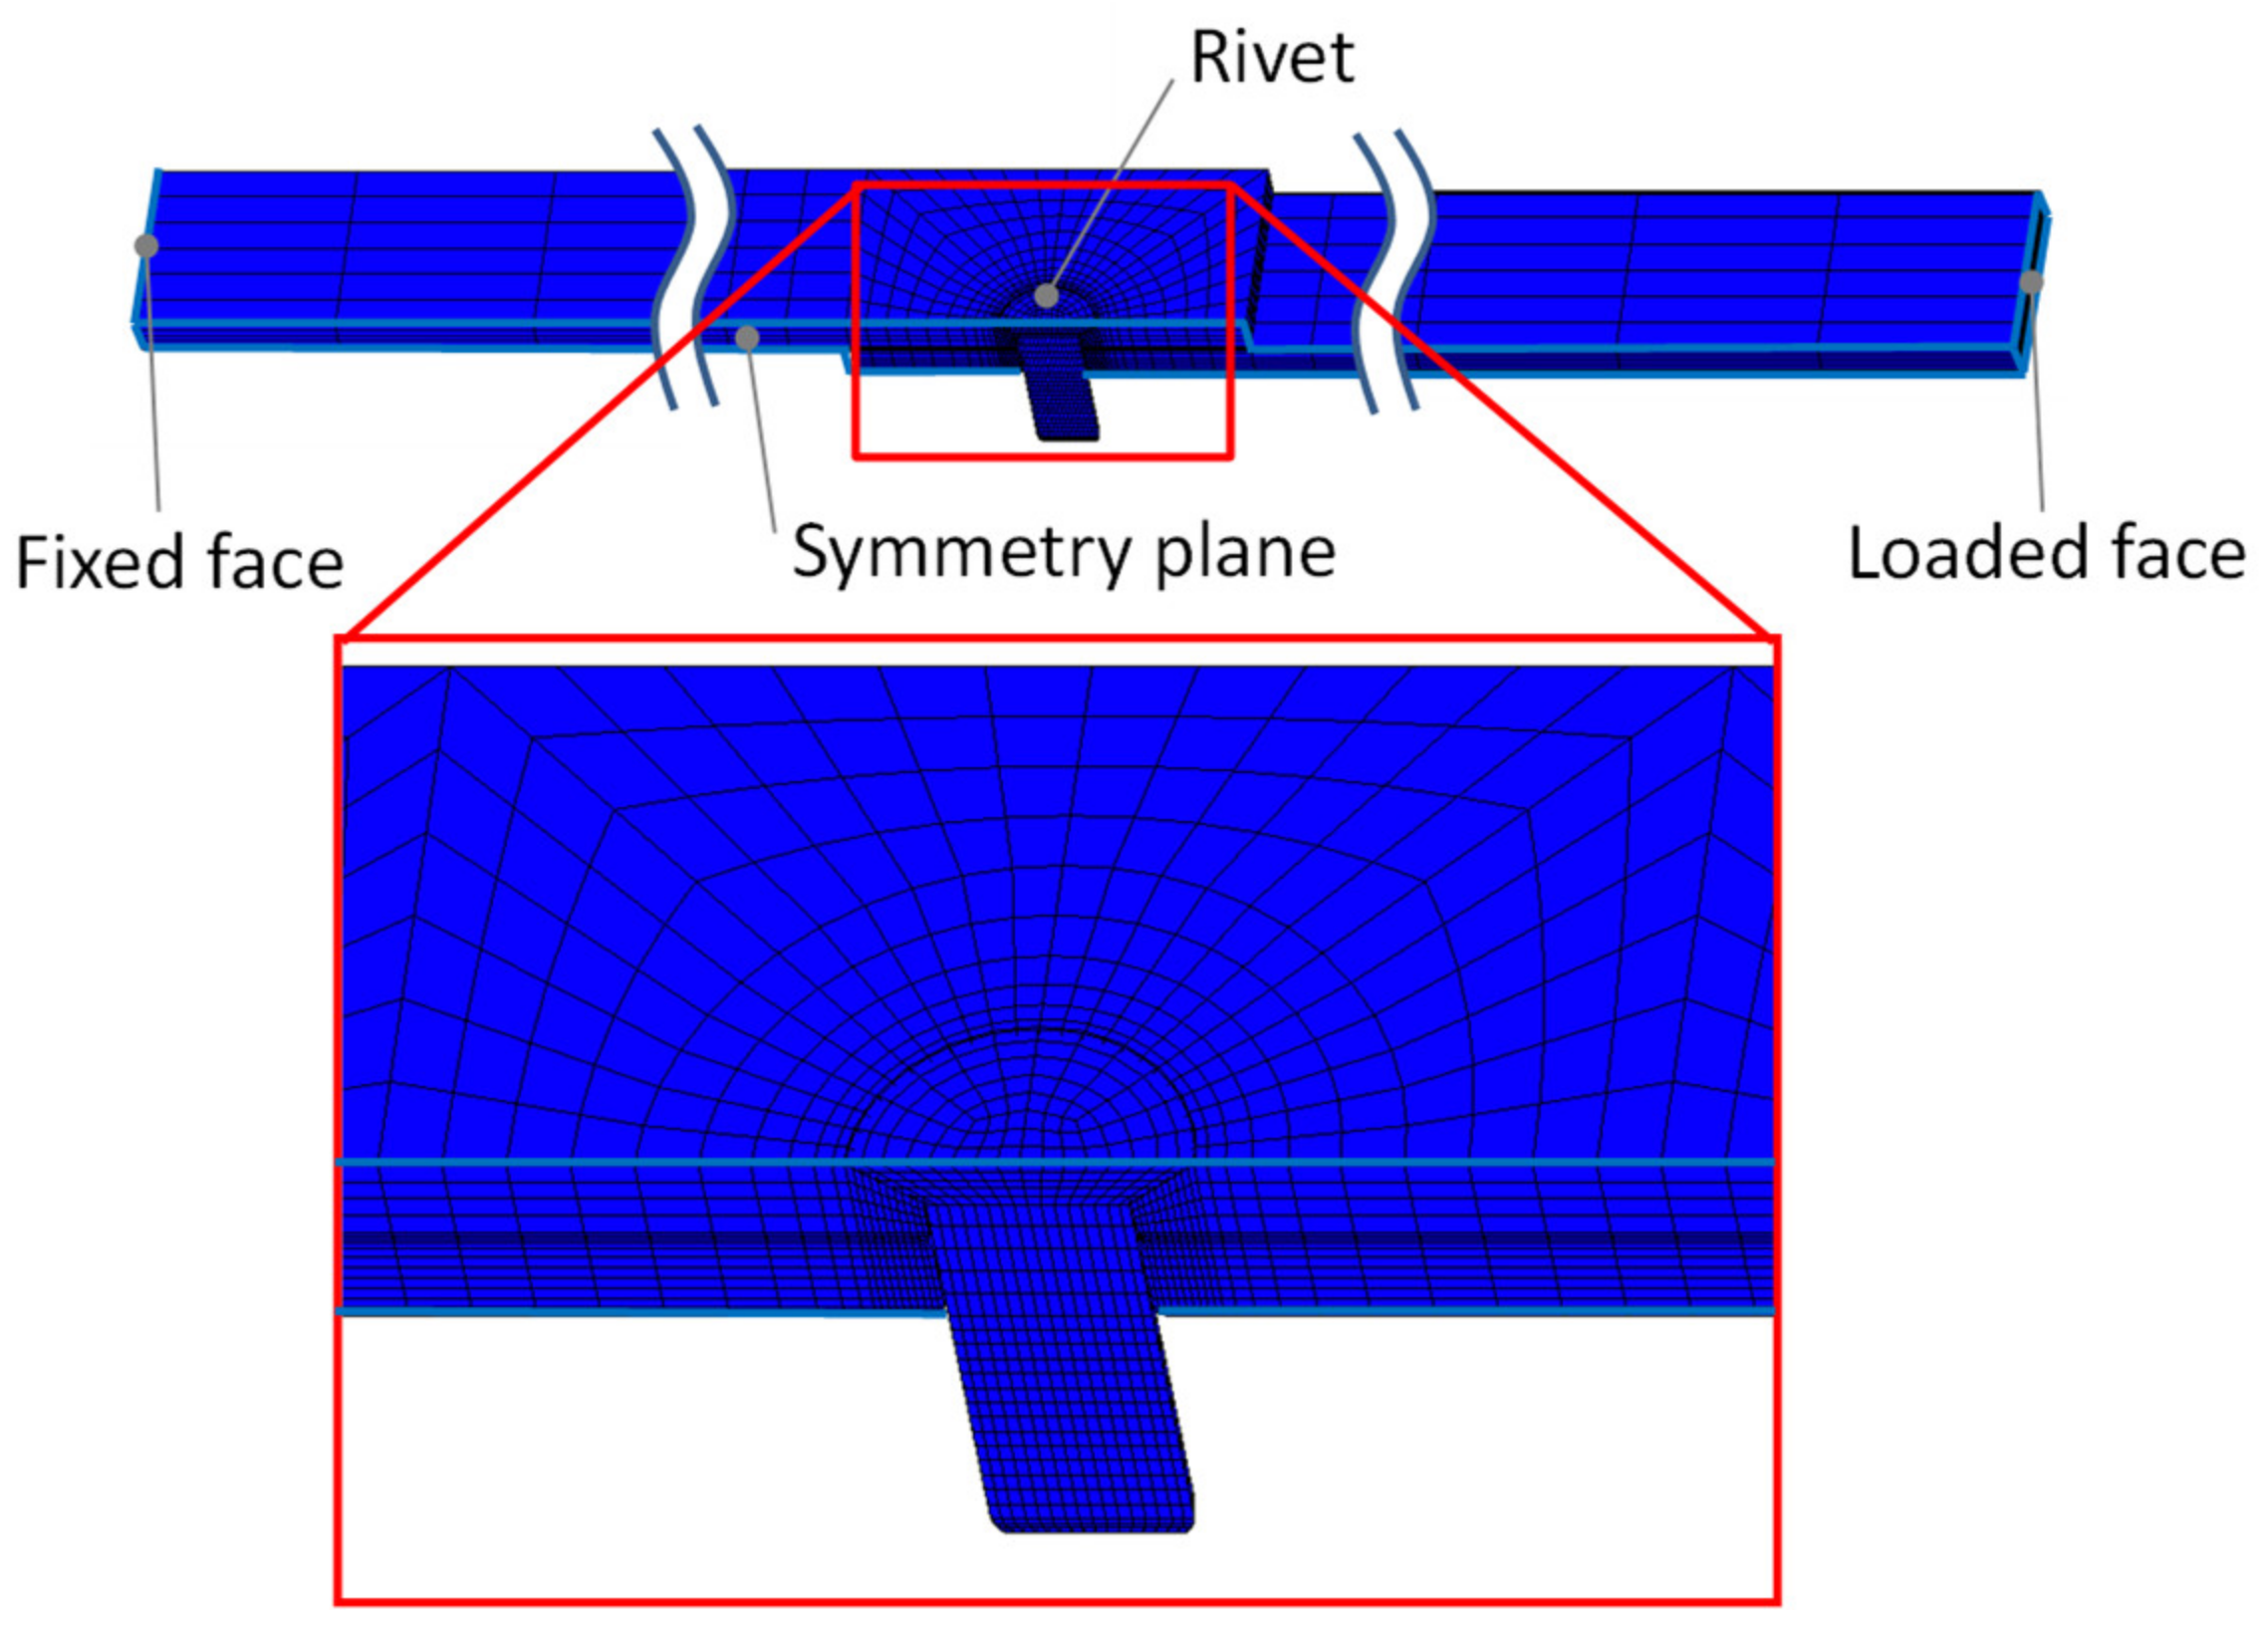
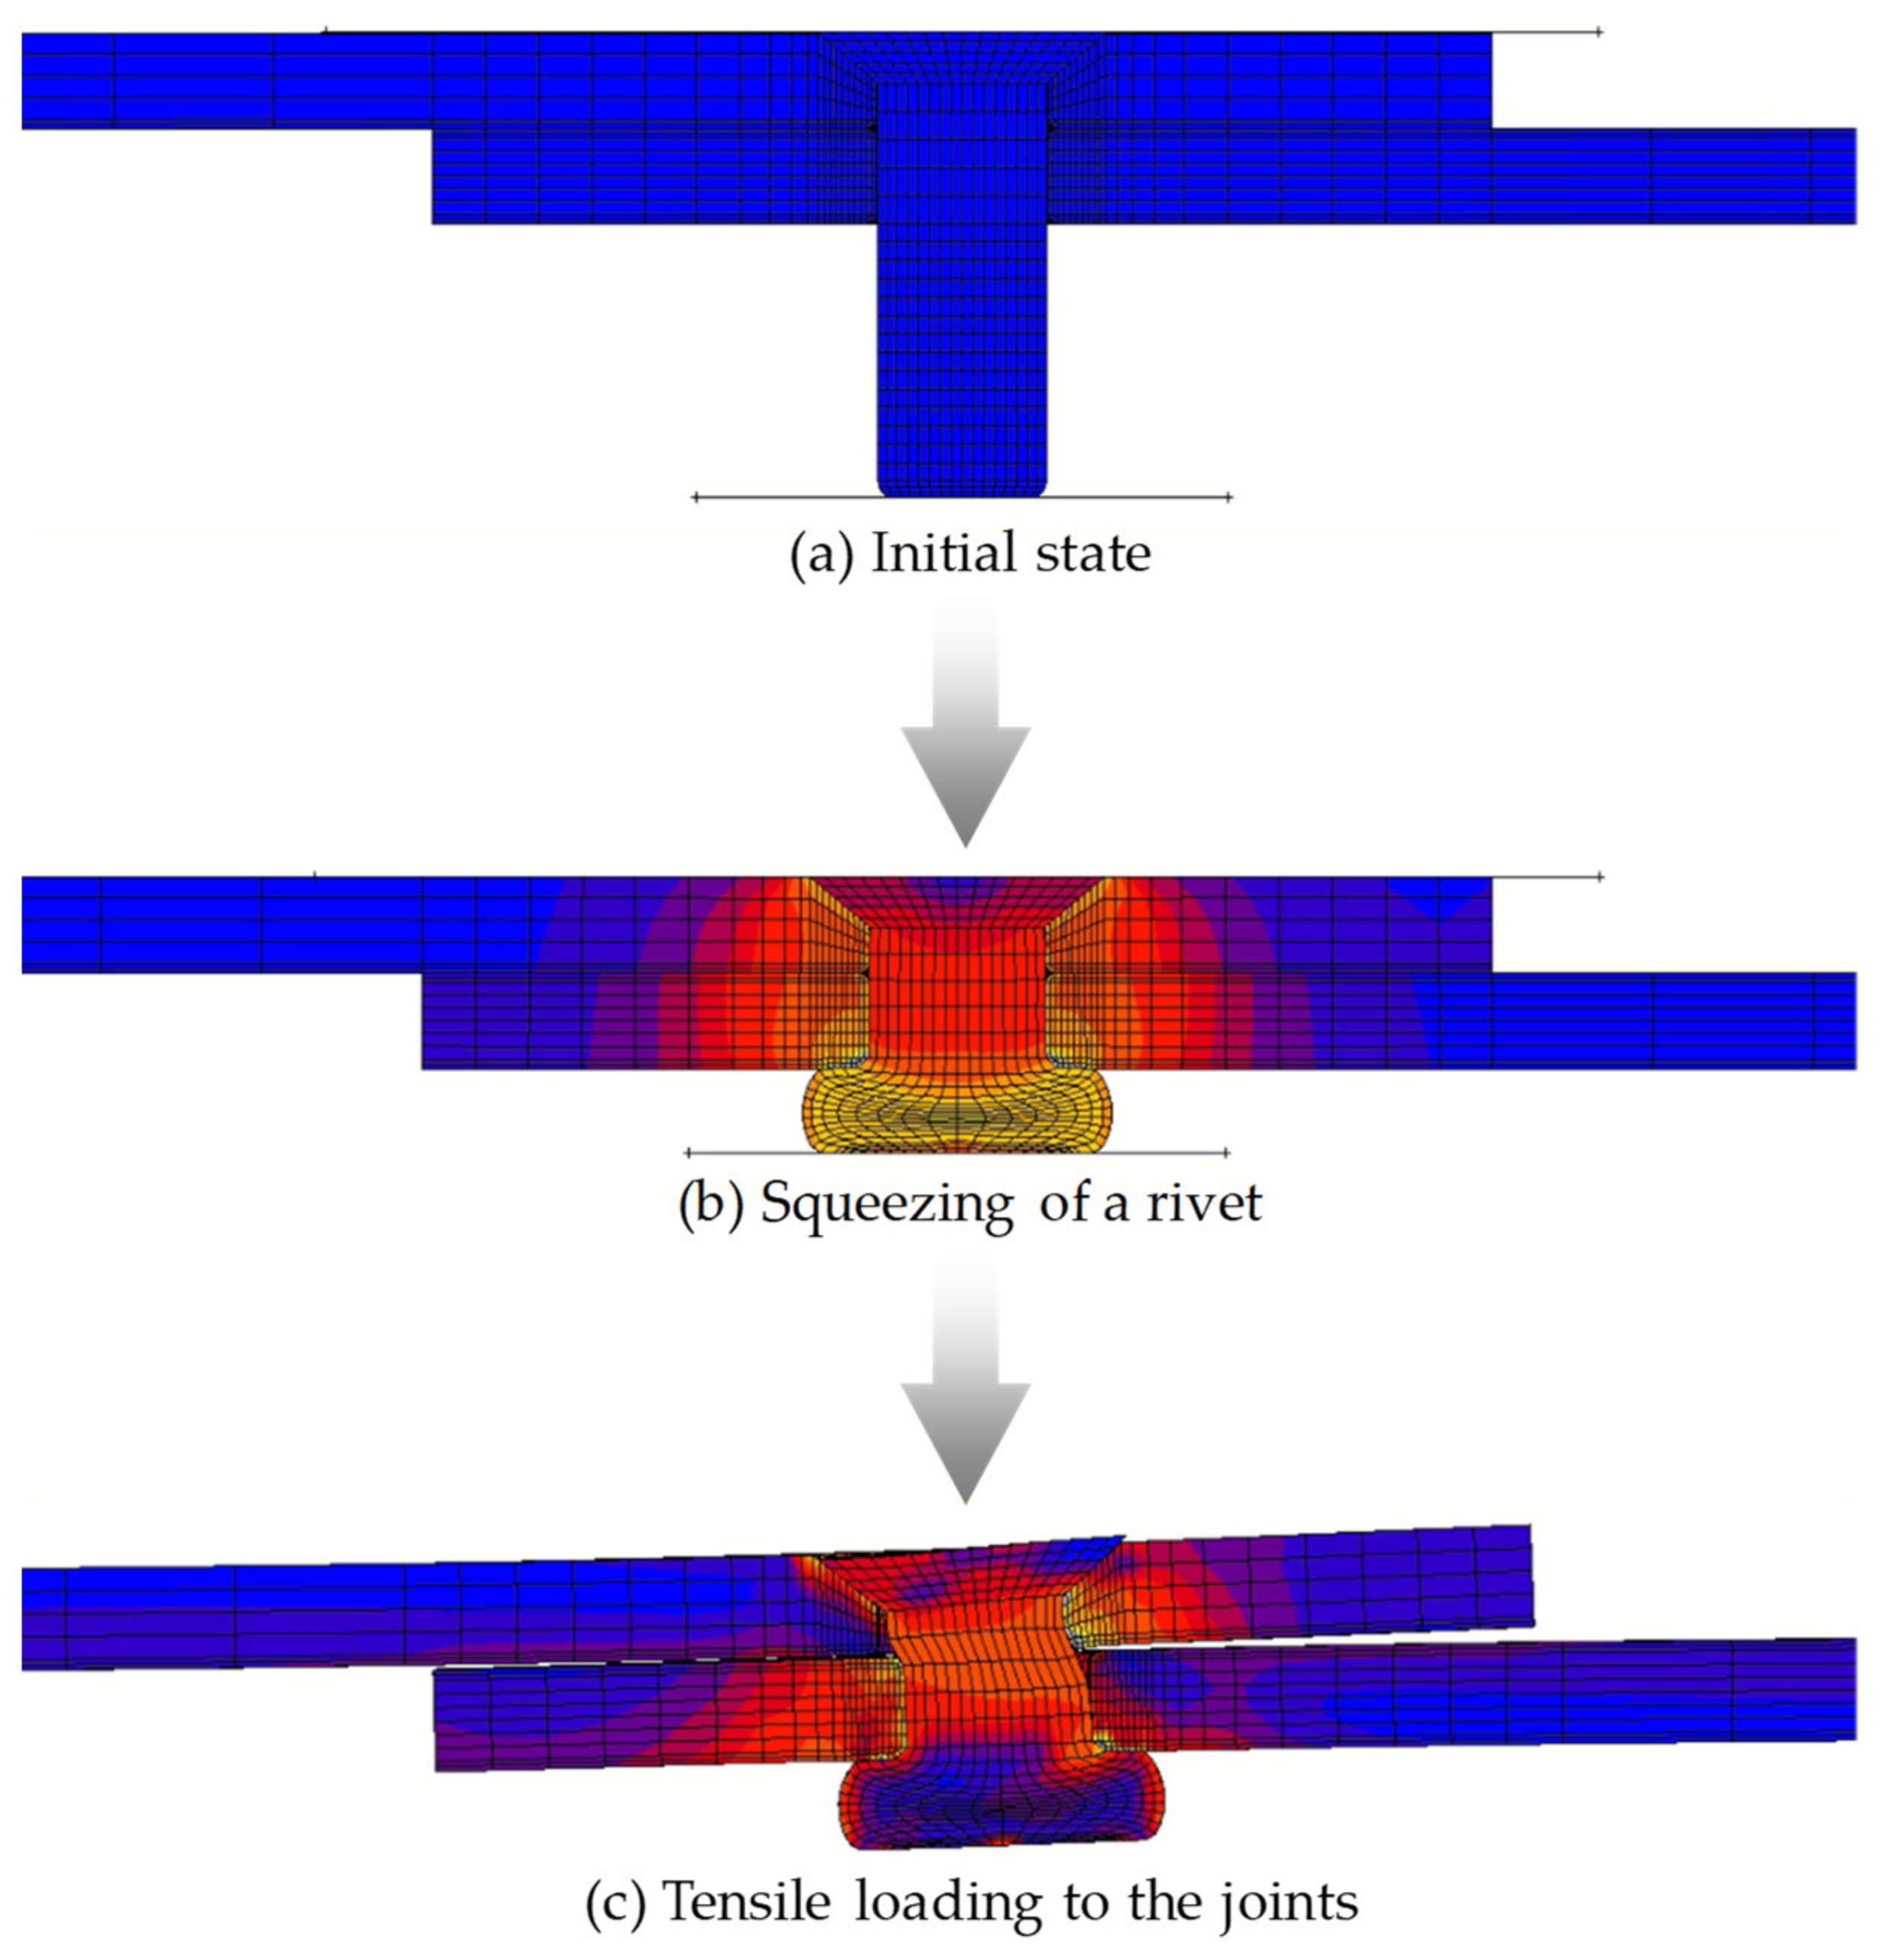
4. Finite Element Analysis of a Single-Row Rivet
4.1. Analytical Model
4.2. Results and Discussion
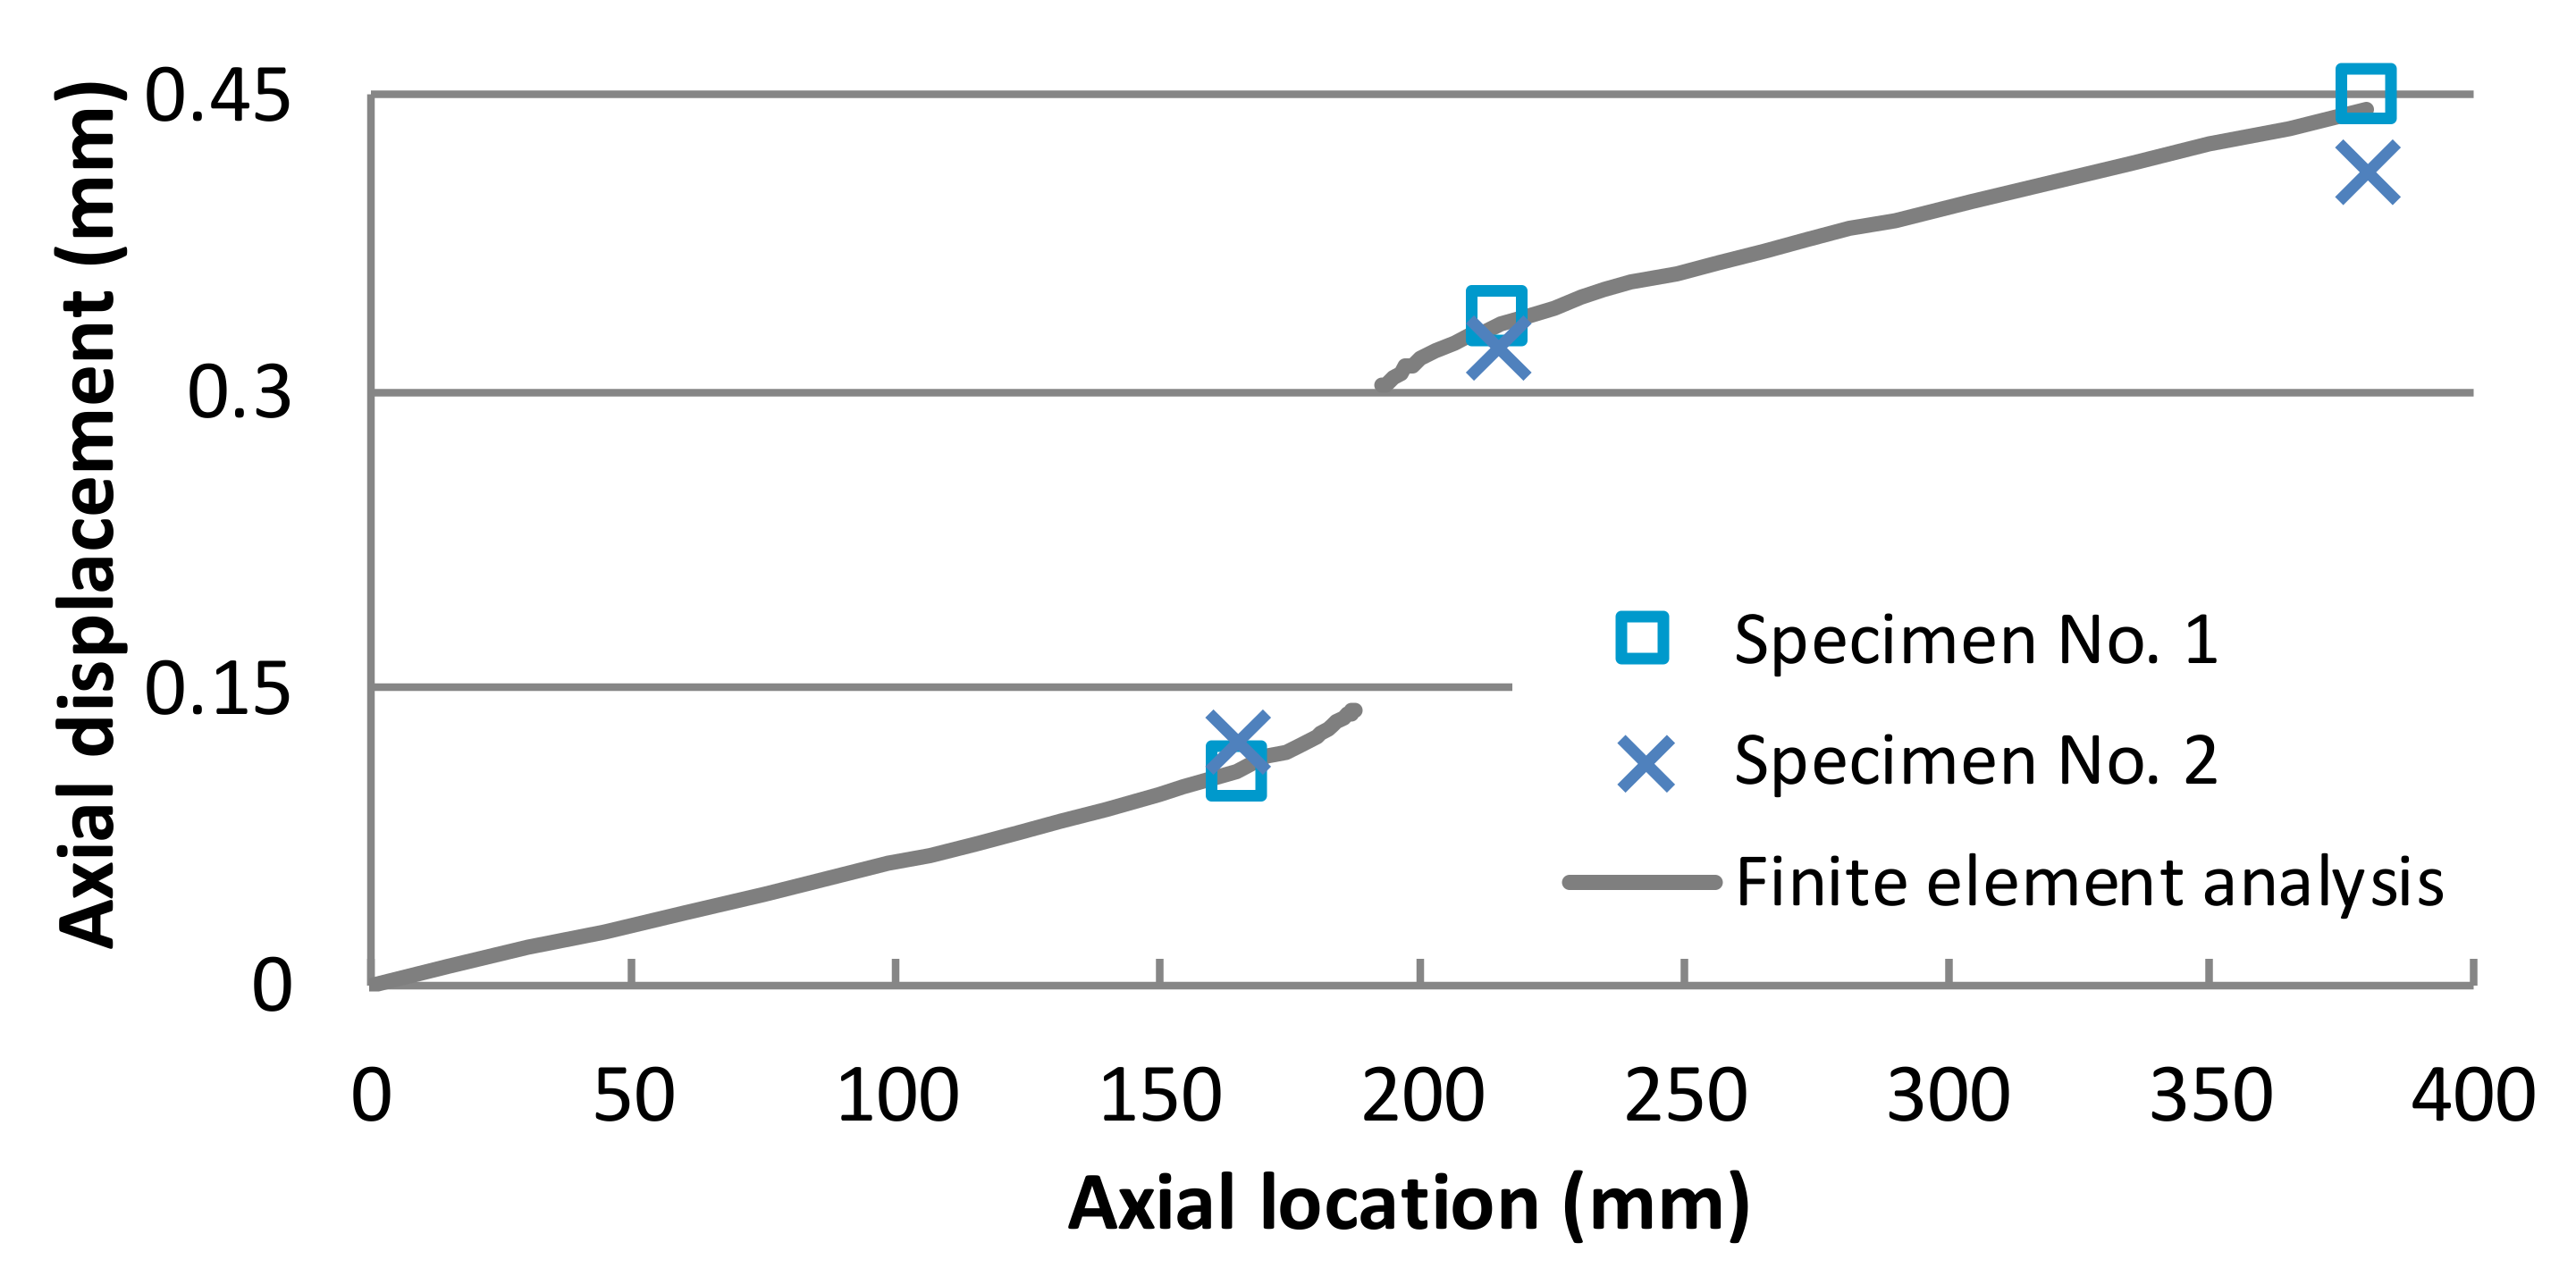
5. Finite Element Analysis of Multiple-Row Riveted Joints
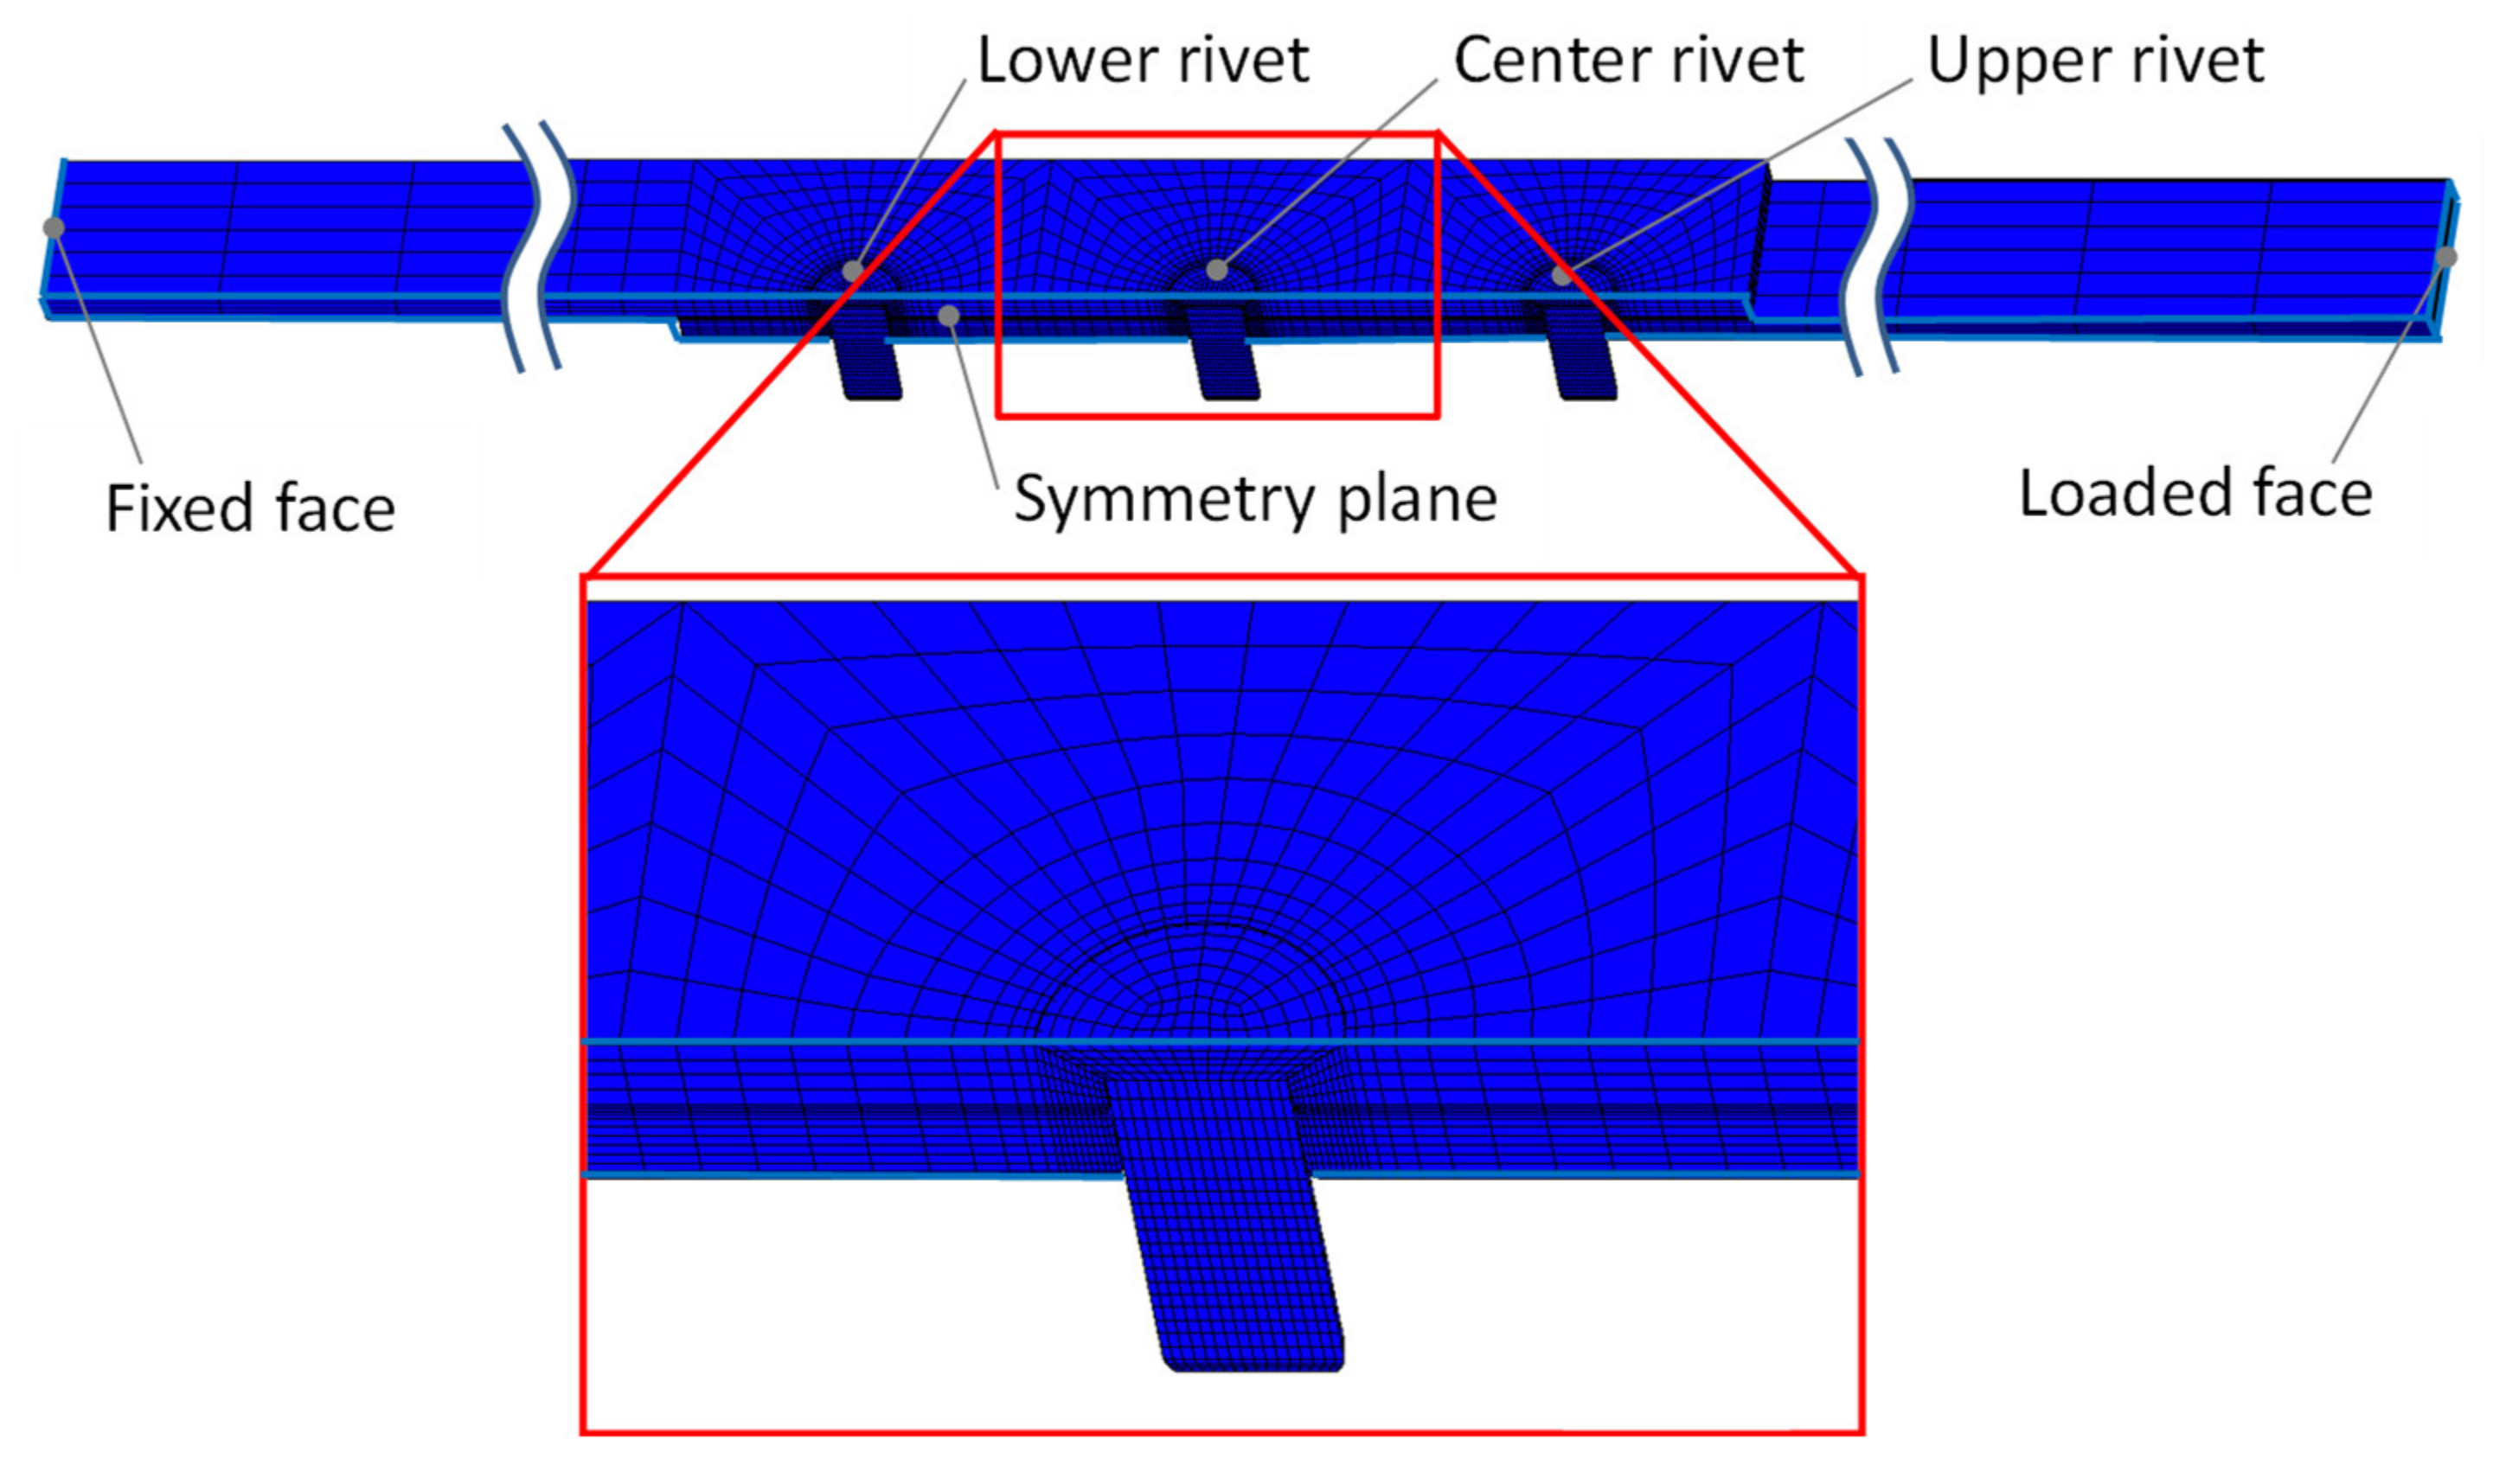
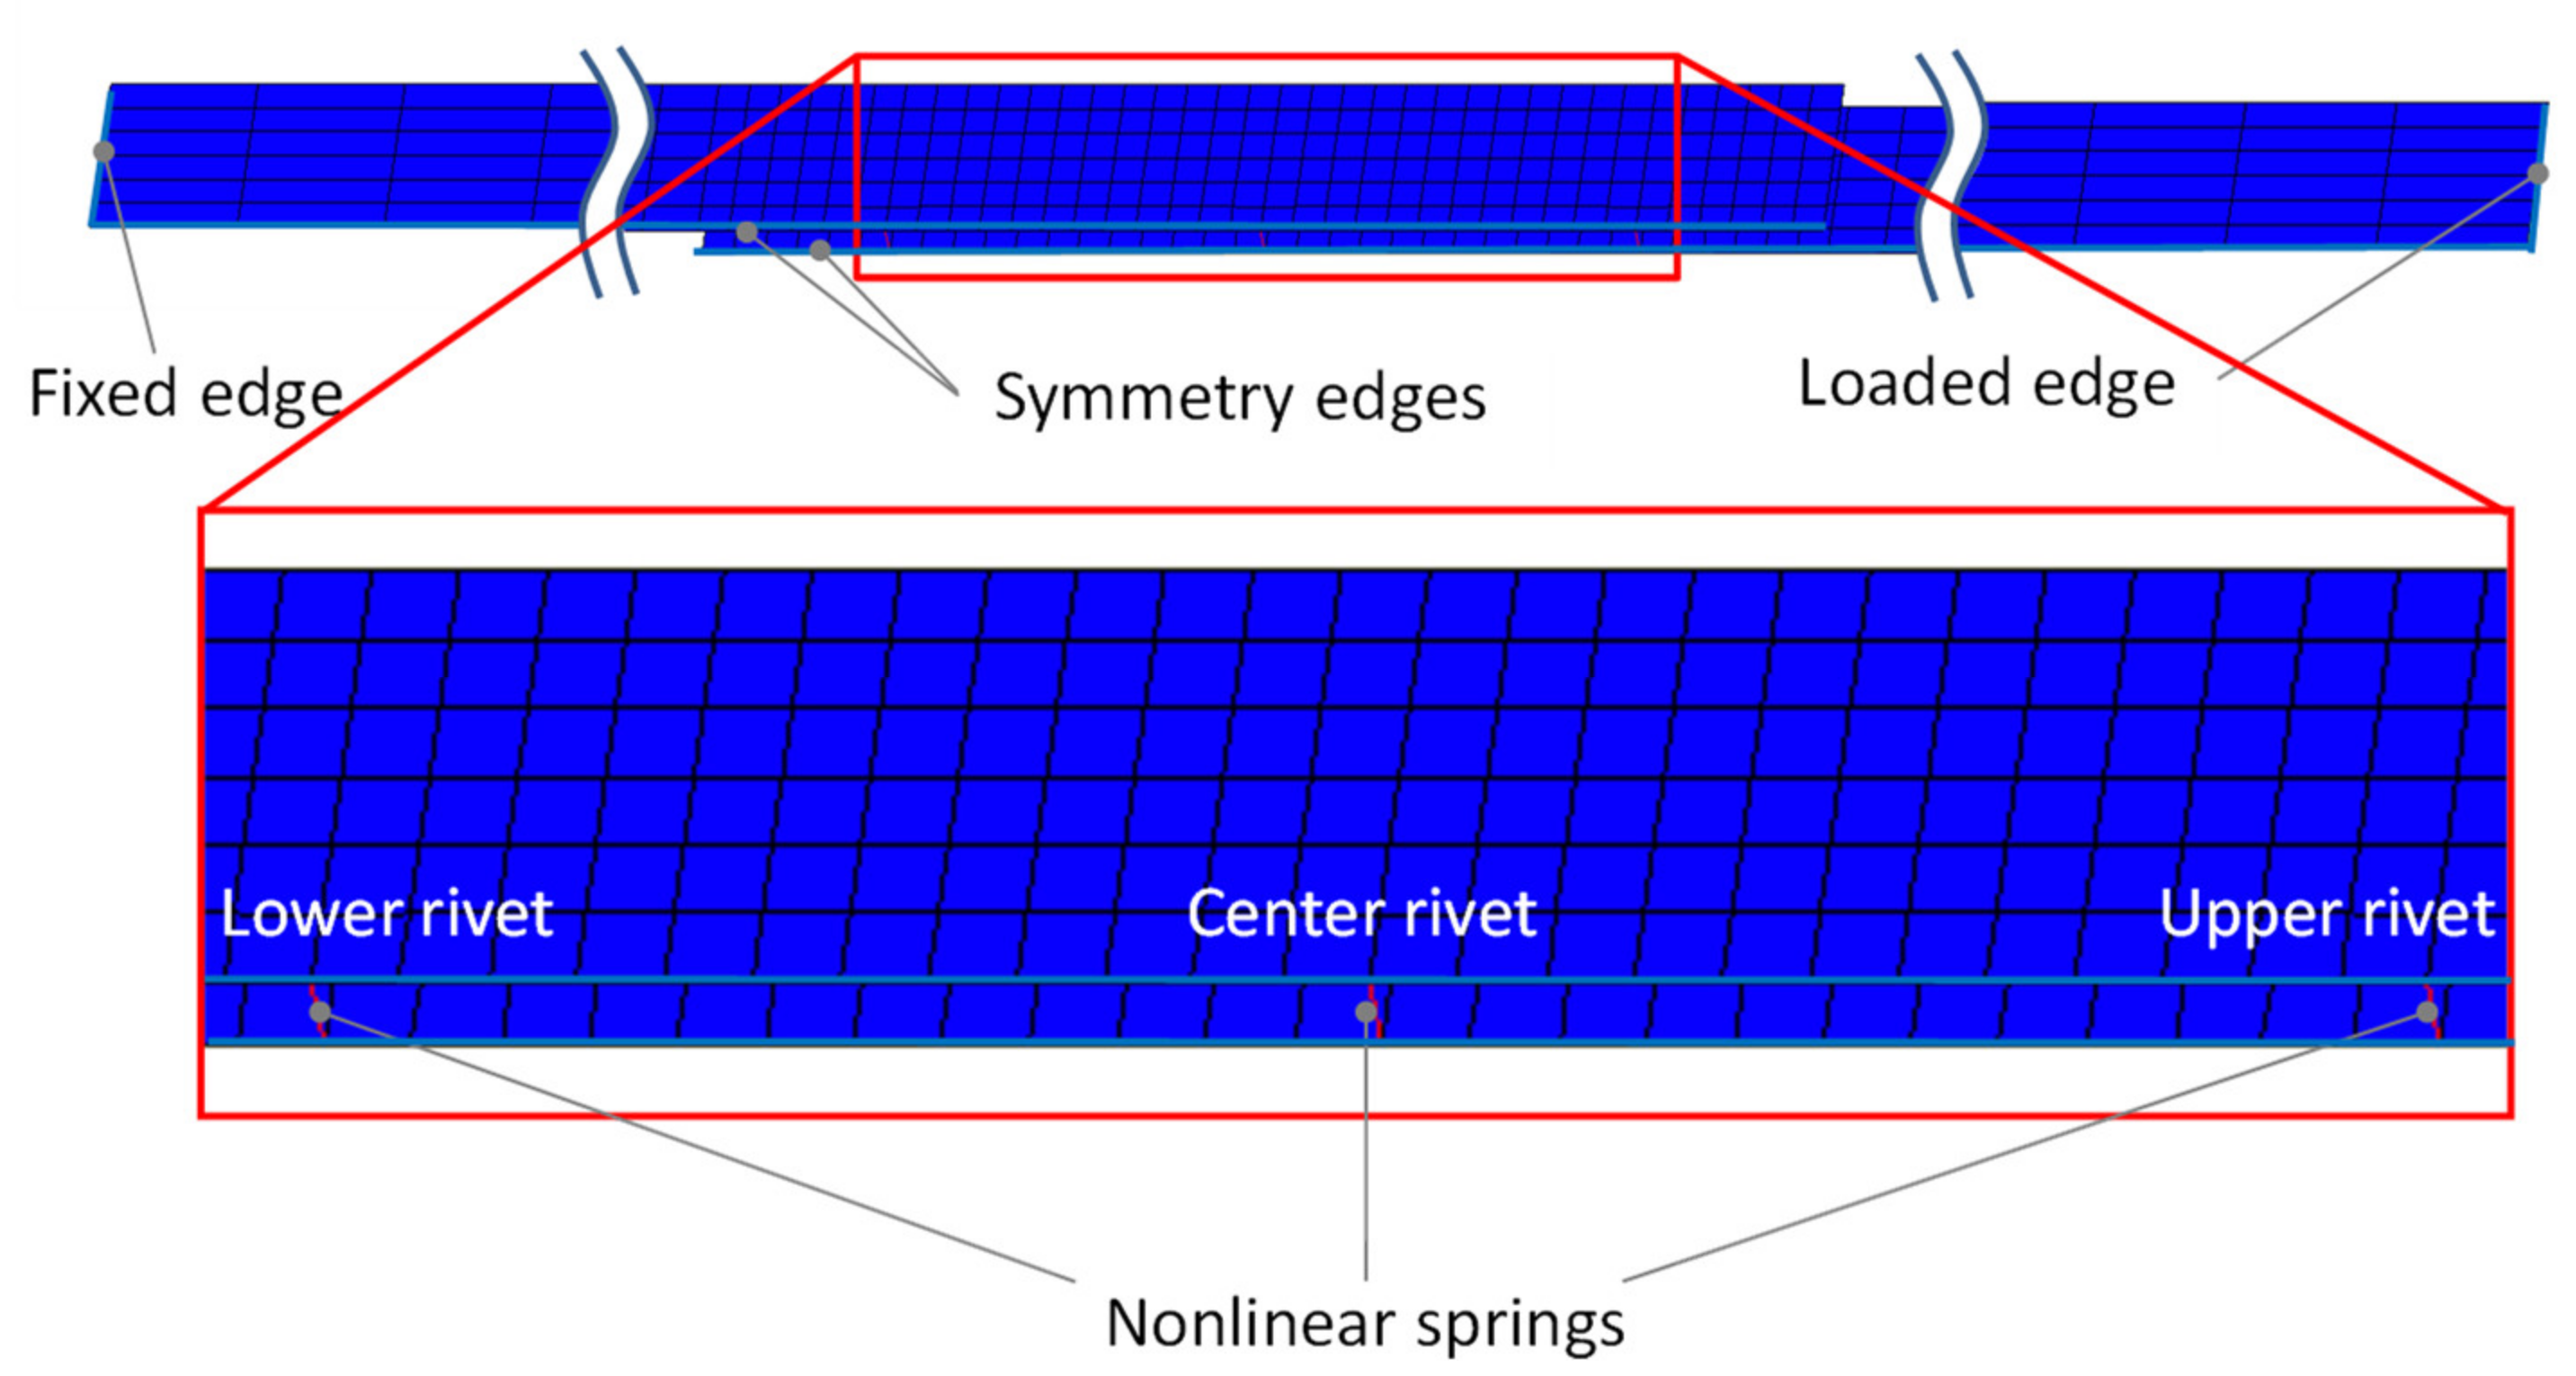
5.1. Analytical Model
5.2. Results and Discussion
6. Conclusions
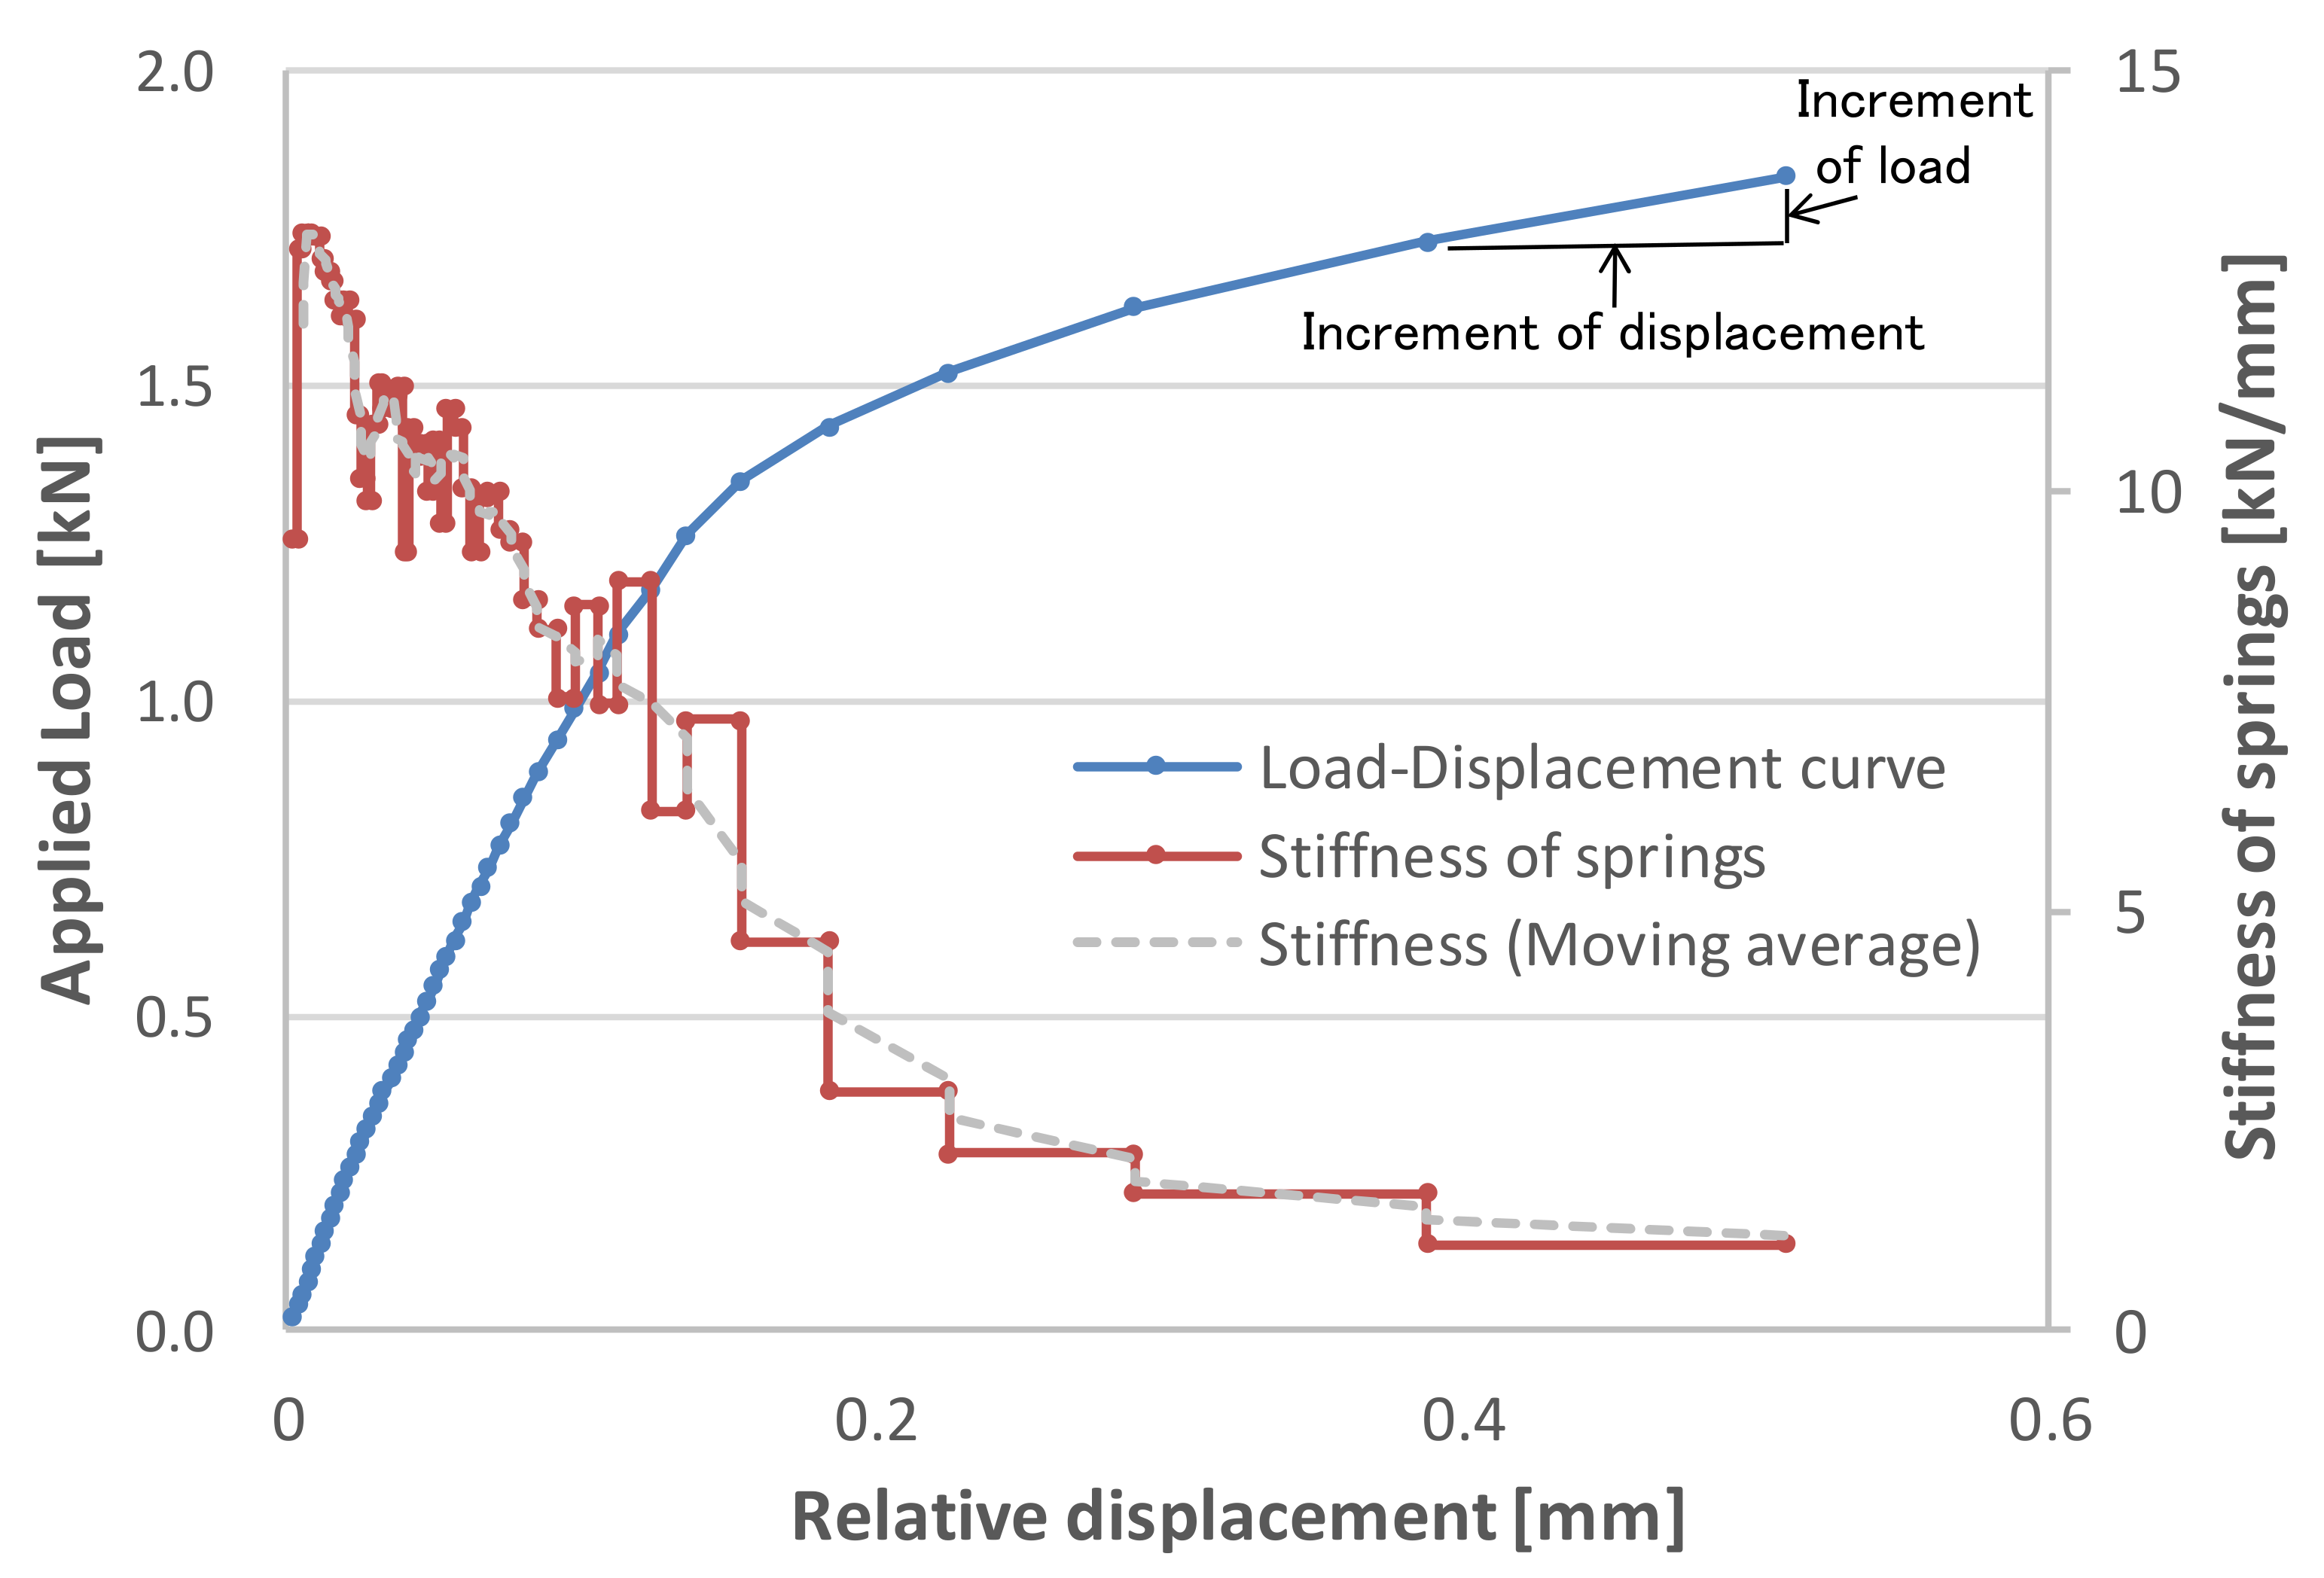
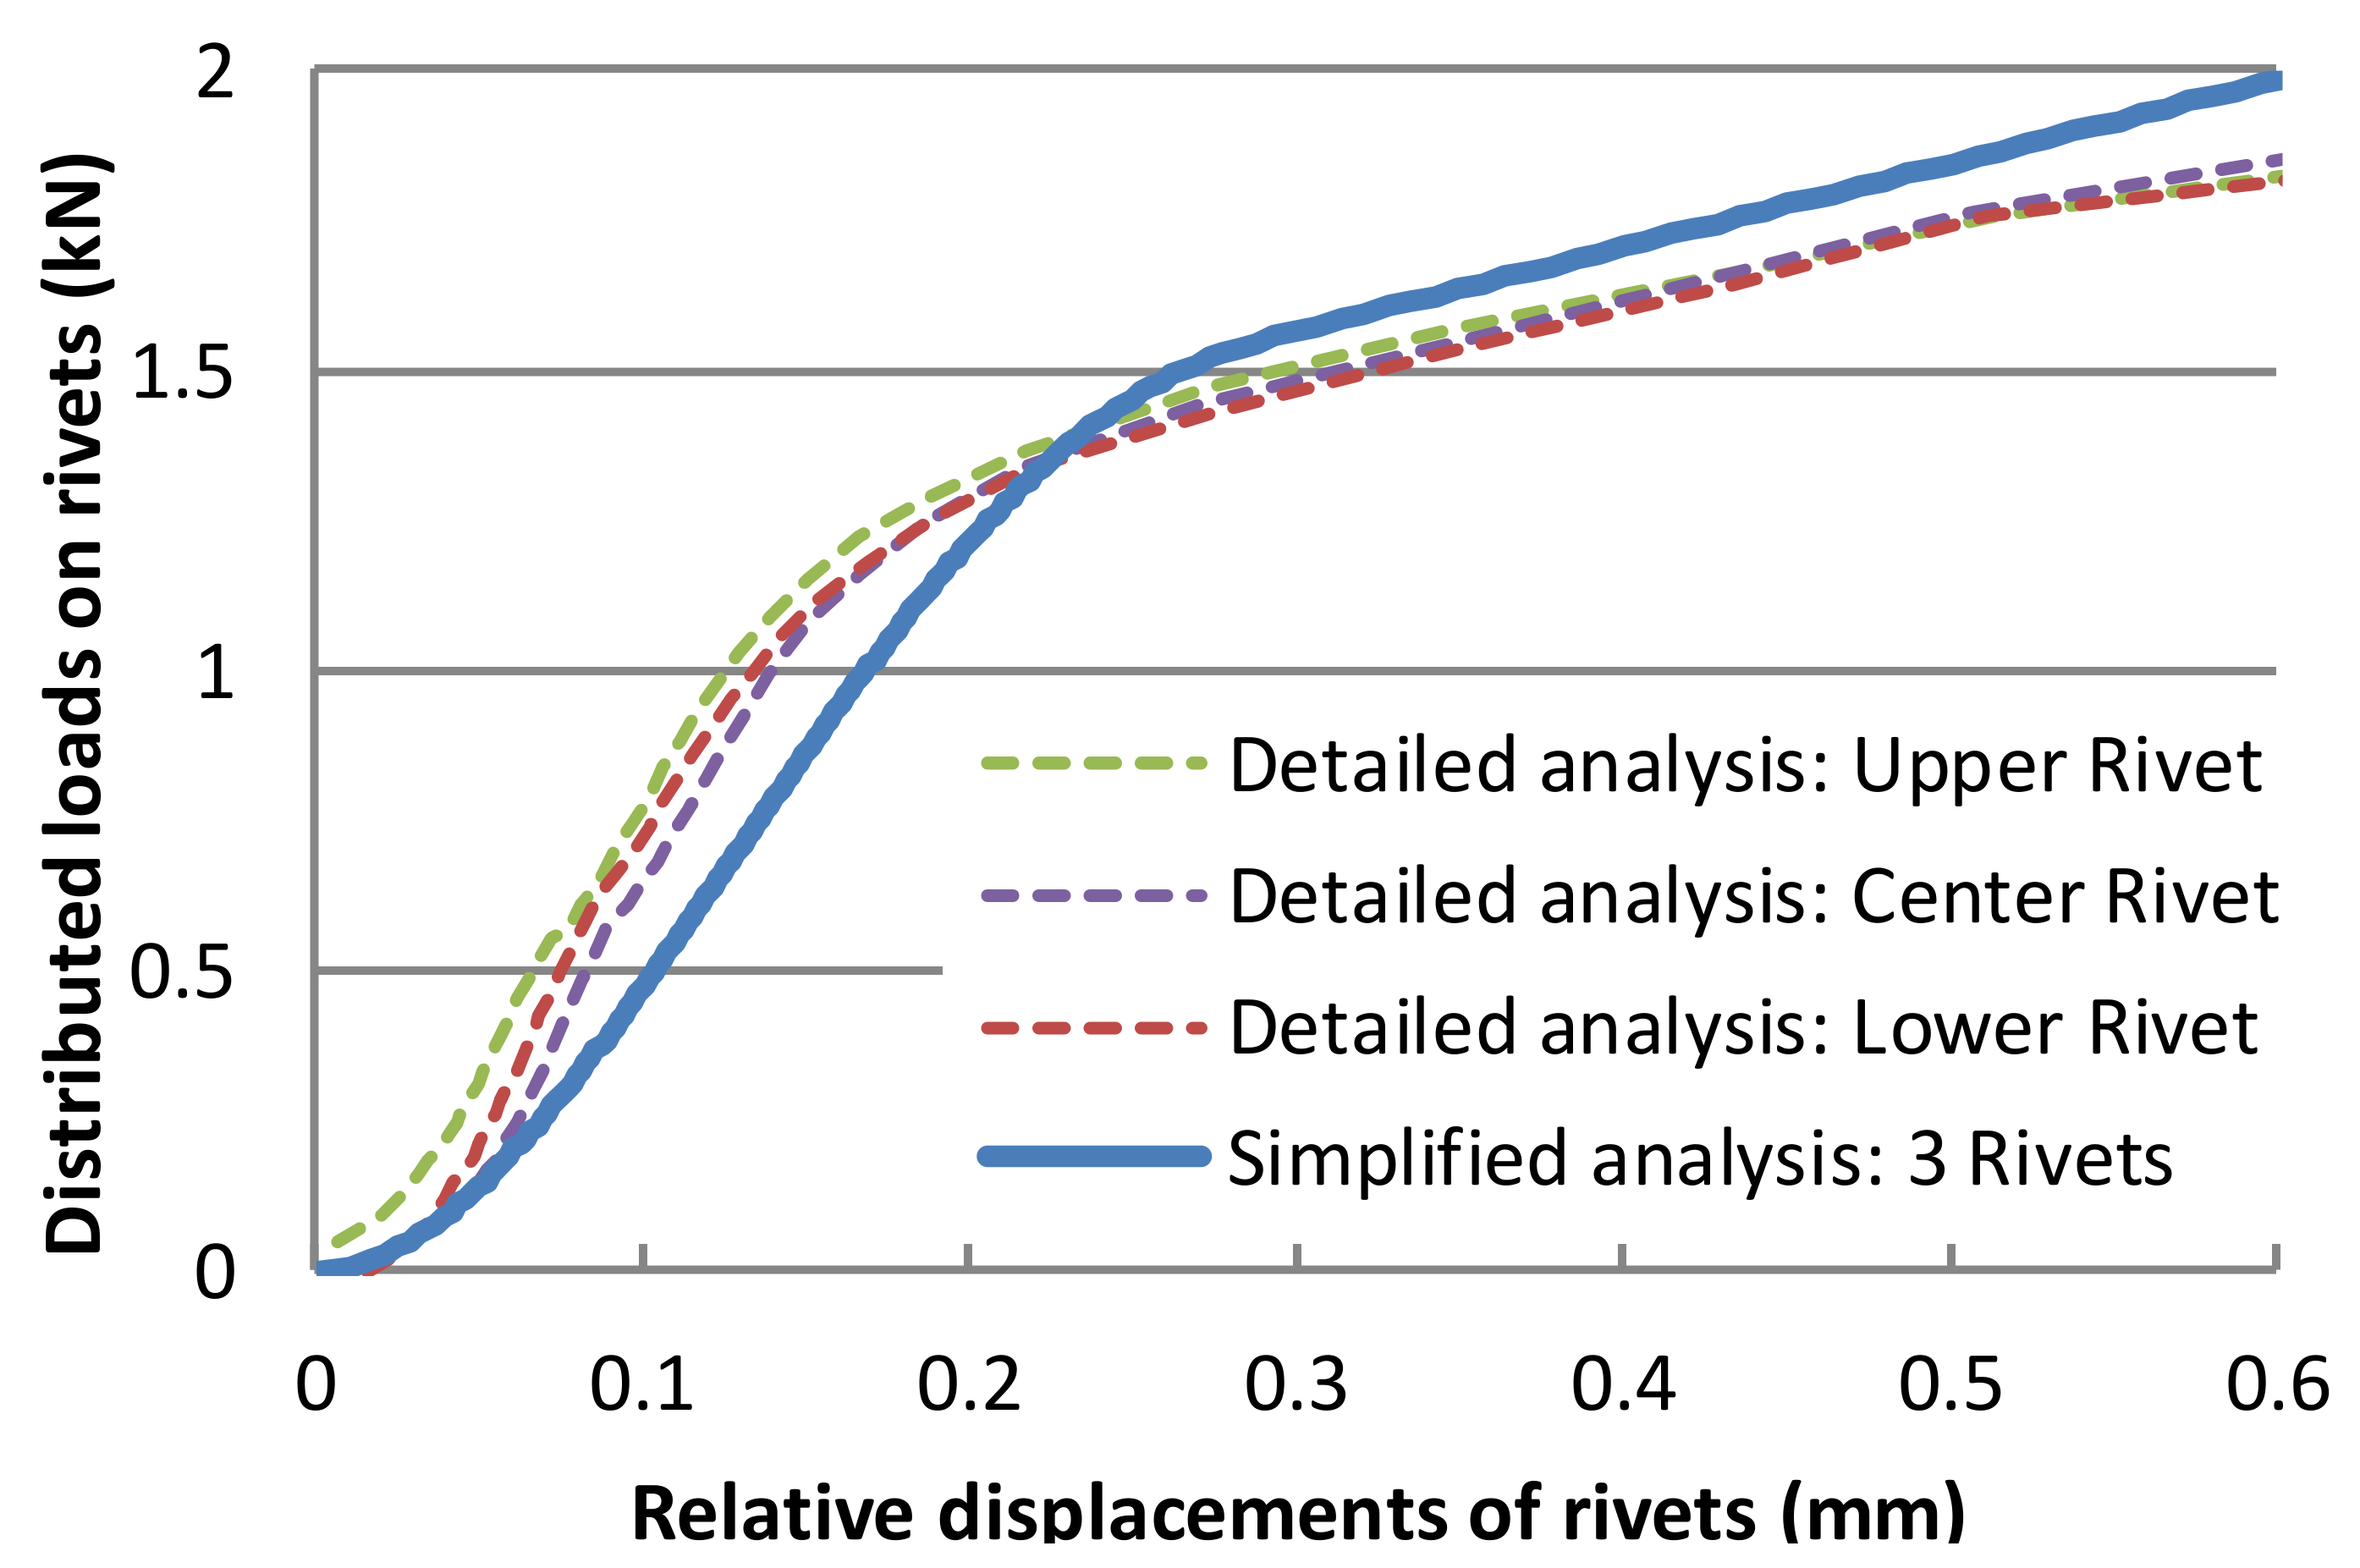
- The nonlinear relationship between load and relative displacement obtained from the detailed and simplified analyses of the triple-row joints agreed well.
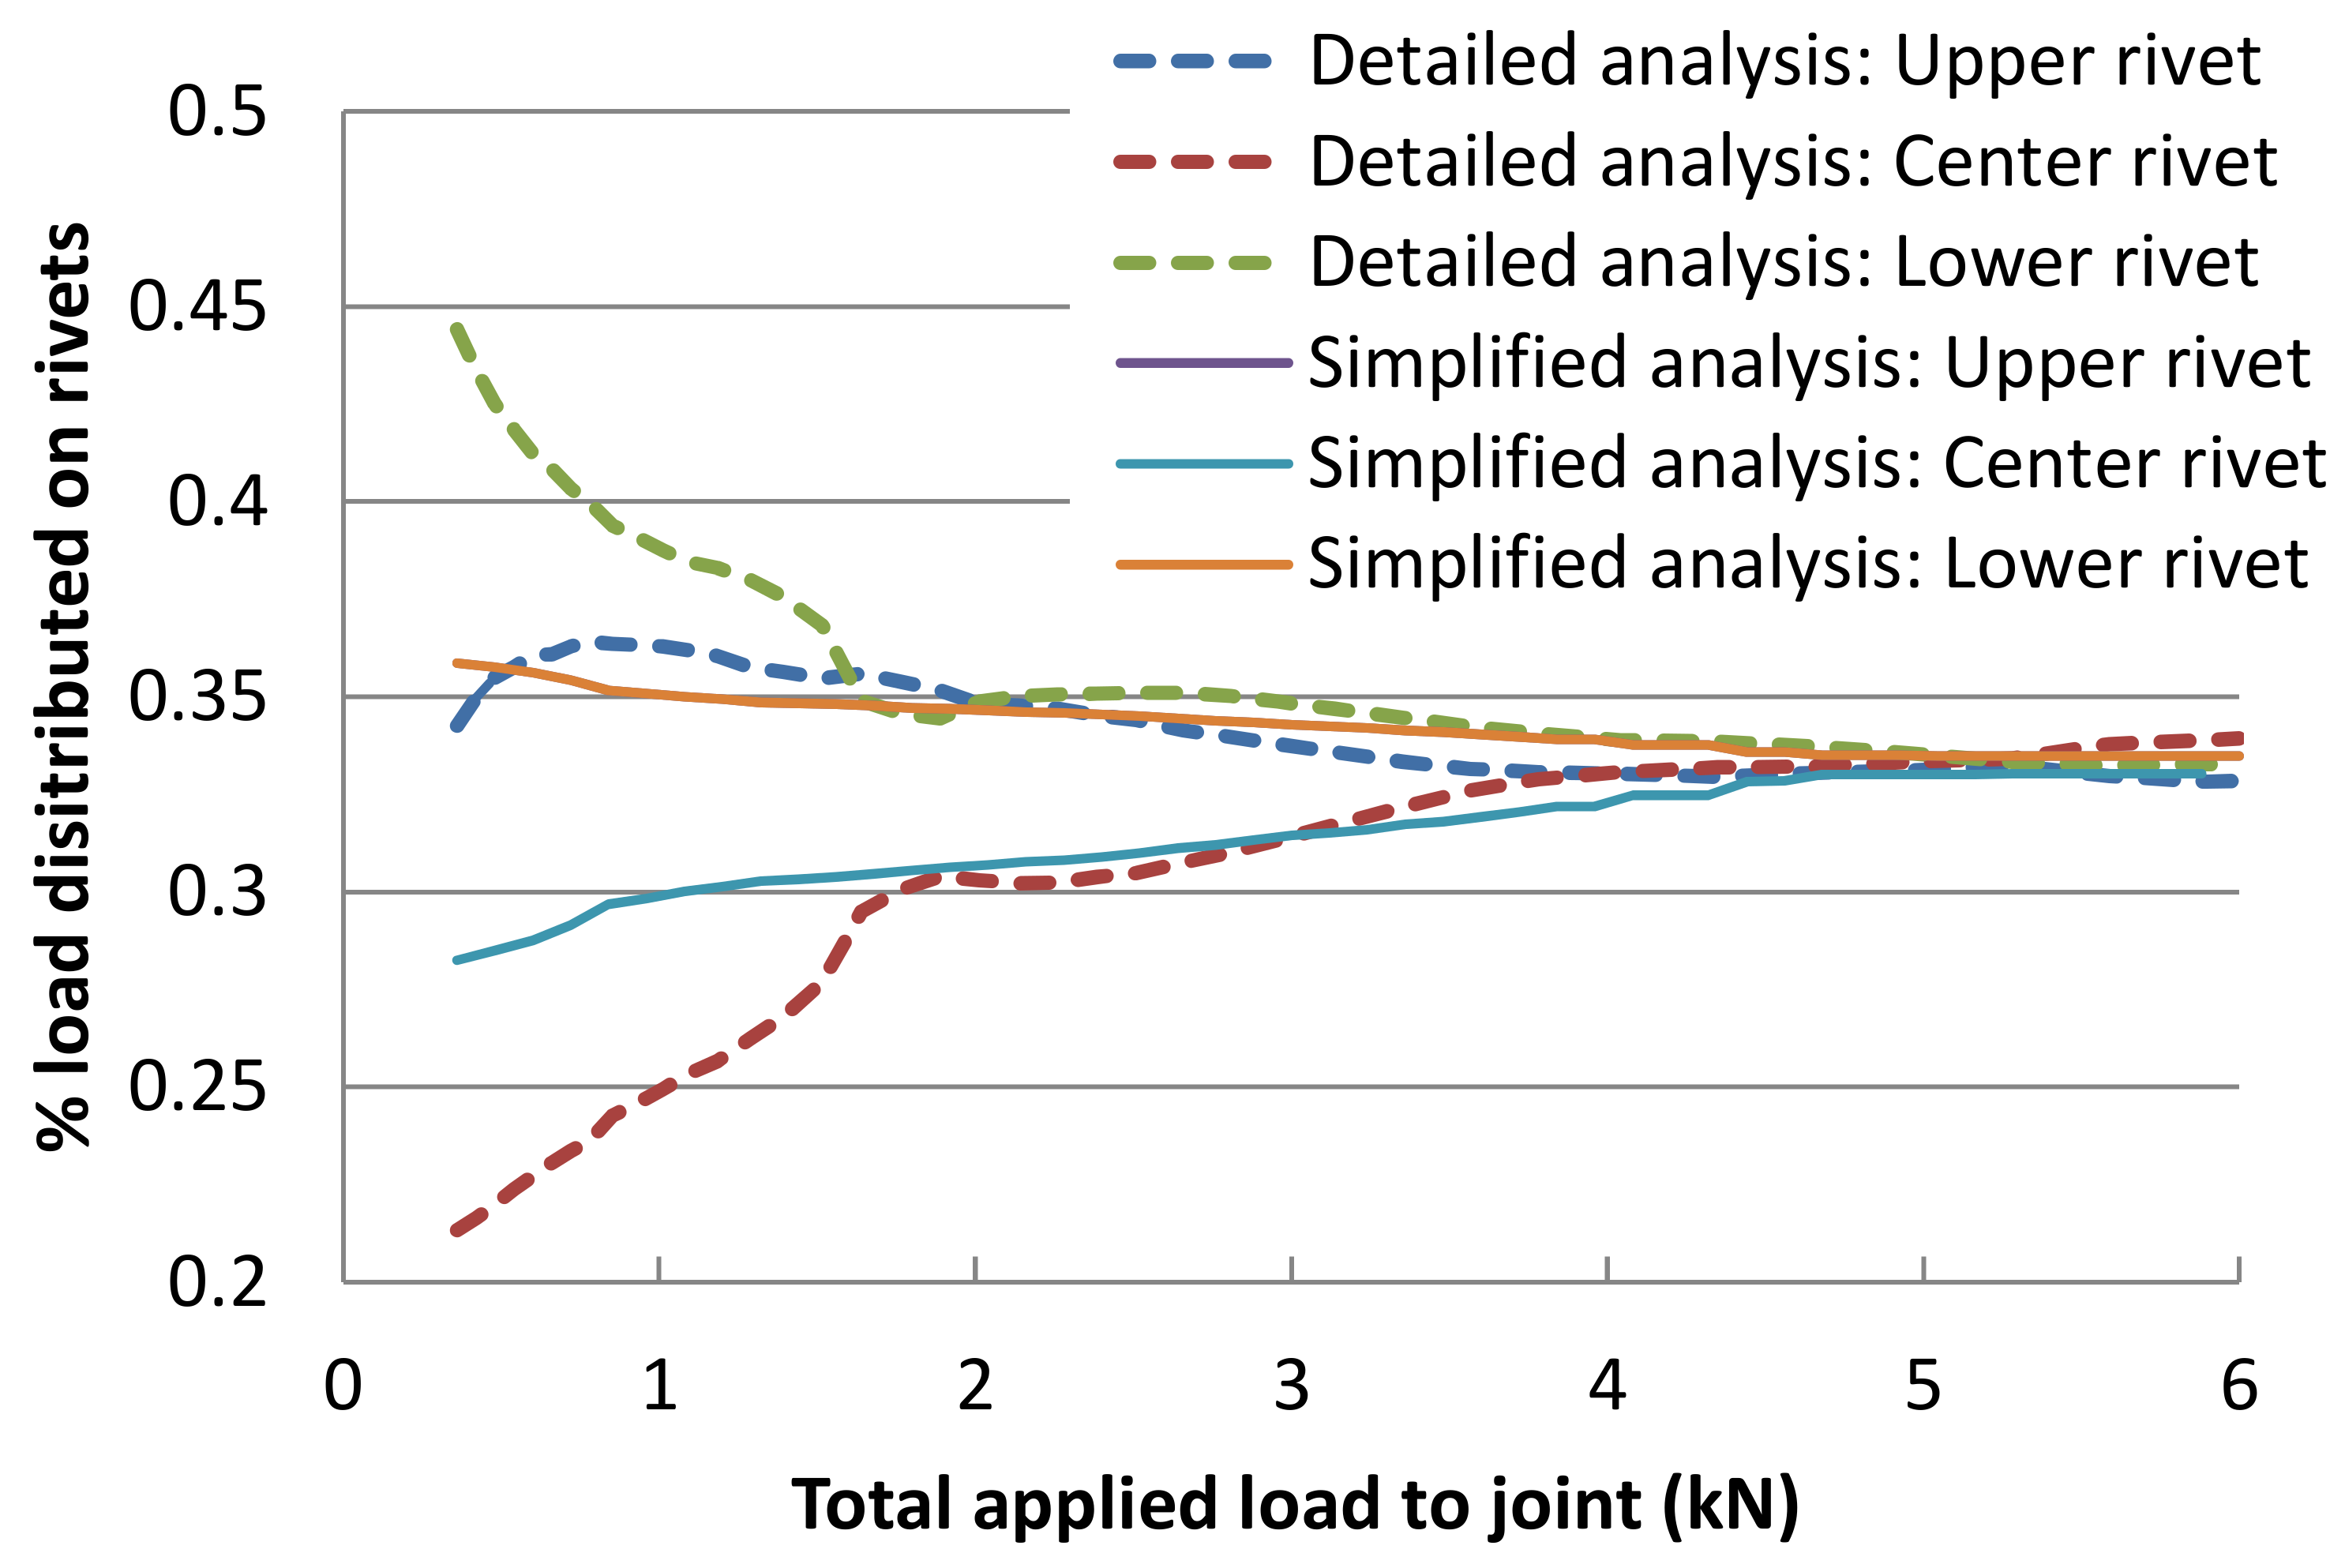
- The detailed and simplified analyses showed the same trend of distribution of loads to each rivet, i.e., the distributed loads, which were initially different from each other, came close with an increase in the applied load and were ultimately distributed evenly to all rivets.
- In the simplified analysis, the memory and CPU time required to run the analyses were reduced to about 1/4 and 1/6 compared to those of the detailed analysis, respectively.
7. Future Work
- 1.
- Further experimental investigation on displacement and strain field with methods such as digital image correlation.
- 2.
- Obtaining experimental results with different squeezing forces of rivets under conditions where the frictional force is not small.
Author Contributions
Funding
Institutional Review Board Statement
Informed Consent Statement
Data Availability Statement
Conflicts of Interest
References
- USA Federal Aviation Administration. AC20-107B, Composite Aircraft Structure. 2010. Available online: https://www.faa.gov/regulations_policies/advisory_circulars/index.cfm/go/document.information/documentID/99693 (accessed on 17 July 2021).
- Song, Y.; Horton, B.; Perino, S.; Thurber, A.; Bayandor, J. A contribution to full-scale high-fidelity aircraft progressive dynamic damage modelling for certification by analysis. Int. J. Crashworthiness 2018, 24, 243–256. [Google Scholar] [CrossRef]
- Degenhardt, R.; Kling, A.; Rohwer, K.; Orifici, A.C.; Thomson, R.S. Design and analysis of stiffened composite panels including post-buckling and collapse. Comput. Struct. 2008, 86, 919–929. [Google Scholar] [CrossRef]
- Buermann, P.; Rolfes, R.; Tessmer, J.; Schagerl, M. A semi-analytical model for local post-buckling analysis of stringer- and frame-stiffened cylindrical panels. Thin Walled Struct. 2006, 44, 102–114. [Google Scholar] [CrossRef]
- Linde, P.; Schulz, A.; Rust, W. Influence of modelling and solution methods on the FE-simulation of the post-buckling be-haviour of stiffened aircraft fuselage panels. Compos. Struct. 2006, 73, 229–236. [Google Scholar] [CrossRef]
- Murphy, A.; Price, M.; Lynch, C.; Gibson, A. The computational post-buckling analysis of fuselage stiffened panels loaded in shear. Thin Walled Struct. 2005, 43, 1455–1474. [Google Scholar] [CrossRef] [Green Version]
- Lynch, C.; Murphy, A.; Price, M.; Gibson, A. The computational post buckling analysis of fuselage stiffened panels loaded in compression. Thin Walled Struct. 2004, 42, 1445–1464. [Google Scholar] [CrossRef] [Green Version]
- Kapania, R.K.; Raciti, S. Recent advances in analysis of laminated beams and plates. Part I—Sheareffects and buckling. AIAA J. 1989, 27, 923. [Google Scholar] [CrossRef]
- Caputo, F.; Lamanna, G.; Perfetto, D.; Chiariello, A.; Di Caprio, F.; Di Palma, L. Experimental and numerical crashworthiness study of a full-scale composite fuselage section. AIAA J. 2021, 59, 700–718. [Google Scholar] [CrossRef]
- De Castro, P.; De Matos, P.; Moreira, P.; Da Silva, L. An overview on fatigue analysis of aeronautical structural details: Open hole, single rivet lap-joint, and lap-joint panel. Mater. Sci. Eng. A 2007, 468, 144–157. [Google Scholar] [CrossRef]
- Meng, F.X.; Zhou, Q.; Yang, J.L. Improvement of crashworthiness behaviour for simplified structural models of aircraft fuselage. Int. J. Crashworthiness 2009, 14, 83–97. [Google Scholar] [CrossRef]
- Lei, C.; Bi, Y.; Li, J. Continuous numerical analysis of slug rivet installation process using parameterized modeling method. Coatings 2021, 11, 189. [Google Scholar] [CrossRef]
- Mucha, J. The numerical analysis of the effect of the joining process parameters on self-piercing riveting using the solid rivet. Arch. Civ. Mech. Eng. 2014, 14, 444–454. [Google Scholar] [CrossRef]
- Mucha, J. The effect of material properties and joining process parameters on behavior of self-pierce riveting joints made with the solid rivet. Mater. Des. 2013, 52, 932–946. [Google Scholar] [CrossRef]
- Zhang, K.; Hui, C.; Li, Y. Riveting process modeling and simulating for deformation analysis of aircraft’s thin-walled sheet-metal parts. Chin. J. Aeronaut. 2011, 24, 369–377. [Google Scholar] [CrossRef] [Green Version]
- Darwish, F.; Tashtoush, G.; Gharaibeh, M. Stress concentration analysis for countersunk rivet holes in orthotropic plates. Eur. J. Mech. A Solids 2013, 37, 69–78. [Google Scholar] [CrossRef]
- Al-Bahkali, E.A. Finite element modeling for thermal stresses developed in riveted and rivet-bonded joints. Int. J. Eng. Technol. 2011, 11, 106–112. [Google Scholar]
- Herwan, J. Load-Displacement Curve Prediction of Weld Bonded Stainless Steel Using Finite Element Method. Master’s Thesis, King Saud University, Riyadh, Saudi Arabia, 2010. [Google Scholar]
- Hufenbach, W.; Dobrzański, L.A.; Gude, M.; Konieczn, J.; Czulak, A. Optimisation of the rivet joints of the CFRP composite material and aluminium alloy. J. Achiev. Mater. Manuf. Eng. 2017, 20, 119–122. [Google Scholar]
- Blanchot, V.; Daidie, A. Riveted assembly modelling: Study and numerical characterisation of a riveting process. J. Mater. Process. Technol. 2006, 180, 201–209. [Google Scholar] [CrossRef] [Green Version]
- De Matos, P.; Moreira, P.; Camanho, P.; de Castro, P. Numerical simulation of cold working of rivet holes. Finite Elem. Anal. Des. 2005, 41, 989–1007. [Google Scholar] [CrossRef]
- Langrand, B.; Deletombe, E.; Markiewicz, E.; Drazétic, P. Riveted joint modeling for numerical analysis of airframe crashworthiness. Finite Elem. Anal. Des. 2001, 38, 21–44. [Google Scholar] [CrossRef]
- Huth, H. Influence of fastener flexibility on the prediction of load transfer and fatigue life for multiple-row joints. In Fatigue in Mechanically Fastened Composite and Metallic Joints; Potter, J., Ed.; ASTM International: West Conshohocken, PA, USA, 1986; pp. 221–250. [Google Scholar]
- Kondo, A.; Kasahara, T.; Kanda, A. Finite element modeling of load transfer characteristics of riveted joints. In Proceedings of the 43rd Annual Conference for the Japan Society for Aeronautical and Space Sciences, Tokyo, Japan, 12 April 2012. (In Japanese). [Google Scholar]
- Li, G.; Shi, G.; Bellinger, N. Study of the residual strain in lap joints. J. Aircr. 2006, 43, 1145–1151. [Google Scholar] [CrossRef]
- Kondo, A.; Kasahara, T.; Kanda, A. Finite element analysis of riveted joints considering nonlinear load transfer characteristics. In Proceedings of the 54th Conference for Strength of Aerospace Structures, Kumamoto, Japan, 3 August 2012. (In Japanese). [Google Scholar]


| Parameters | MS20426AD Rivet | 2024-T3 Alloy Bare Sheet |
|---|---|---|
| Young’s modulus | 71.7 GPa | 72.4 GPa |
| Poisson’s ratio | 0.33 | 0.33 |
| Flow stress | σtrue = C (εtrue)m | σtrue = C (εtrue)m |
| Initial yield stress | 172 MPa | 310 MPa |
| Hardening parameters | C = 544 MPa, m = 0.23 (εinit ≤ εtrue ≤ 0.02) | C = 676 MPa, m = 0.14 (εinit ≤ εtrue ≤ 0.02) |
| C = 551 MPa, m = 0.15 (0.02 < εtrue ≤ 1.0) | C = 745 MPa, m = 0.164 (0.02 < εtrue ≤ 0.1) | |
| Slope of linear hardening curve | 1034 MPa (0.1 < εtrue ≤ 1.0) |
| Manufacturer | Hewlett Packard |
| Product name | ProDesk 600 G2 SFF |
| Operating system | Windows 10 Professional |
| CPU | Core i5-6500 Quad-core 3.20 GHz |
| Memory | PC4-17000 64 GBytes |
| Storage | 500 GBytes Hard disk |
Publisher’s Note: MDPI stays neutral with regard to jurisdictional claims in published maps and institutional affiliations. |
© 2021 by the authors. Licensee MDPI, Basel, Switzerland. This article is an open access article distributed under the terms and conditions of the Creative Commons Attribution (CC BY) license (https://creativecommons.org/licenses/by/4.0/).
Share and Cite
Kondo, A.; Kasahara, T.; Kanda, A. A Simplified Finite Element Model of Riveted Joints for Structural Analyses with Consideration of Nonlinear Load-Transfer Characteristics. Aerospace 2021, 8, 196. https://0-doi-org.brum.beds.ac.uk/10.3390/aerospace8070196
Kondo A, Kasahara T, Kanda A. A Simplified Finite Element Model of Riveted Joints for Structural Analyses with Consideration of Nonlinear Load-Transfer Characteristics. Aerospace. 2021; 8(7):196. https://0-doi-org.brum.beds.ac.uk/10.3390/aerospace8070196
Chicago/Turabian StyleKondo, Atsushi, Toshiyuki Kasahara, and Atsushi Kanda. 2021. "A Simplified Finite Element Model of Riveted Joints for Structural Analyses with Consideration of Nonlinear Load-Transfer Characteristics" Aerospace 8, no. 7: 196. https://0-doi-org.brum.beds.ac.uk/10.3390/aerospace8070196