Redefining Sociophonetic Competence: Mapping COG Differences in Phrase-Final Fricative Epithesis in L1 and L2 Speakers of French


1
Department of Languages, Literatures & Cultures, University of South Carolina, Columbia, SC 29208, USA
2
Department of Linguistics, University of Georgia, Athens, GA 30605, USA
*
Authors to whom correspondence should be addressed.
Languages 2020, 5(4), 59; https://0-doi-org.brum.beds.ac.uk/10.3390/languages5040059
Submission received: 9 September 2020
/
Revised: 30 October 2020
/
Accepted: 2 November 2020
/
Published: 12 November 2020
(This article belongs to the Special Issue Exploring Cross-linguistic Effects and Phonetic Interactions in the Context of Bilingualism)
Abstract
:This article presents a study of measures of center of gravity (COG) in phrase-final fricative epithesis (PFFE) produced by L1 and L2 speakers of Continental French (CF). Participants completed a reading task targeting 98 tokens of /i,y,u/ in phrase-final position. COG measures were taken at the 25%, 50% and 75% marks, normalized and submitted to a mixed linear regression. Results revealed that L2 speakers showed higher COG values than L1 speakers in low PFFE-to-vowel ratios at the 25%, 50%, and 75% marks. COG measures were then categorized into six profile types on the basis of their frequencies at each timepoint: flat–low, flat–high, rising, falling, rising–falling, and falling–rising. Counts of COG profile were then submitted to multinomial logistic regression. Results revealed that although L1 speakers produced predominantly flat–low profile types at lower percent devoicings, L2 speakers preferred multiple strategies involving higher levels of articulatory energy (rising, falling, rise–fall). These results suggest that while L1 speakers realize PFFE differently with respect to phonological context, L2 speakers rely on its most common allophone, strong frication, in most contexts. As such, the findings of this study argue for an additional phonetic dimension in the construct of L2 sociophonetic competence.
1. Introduction
Phrase-final fricative epithesis (PFFE), a phenomenon also known in the literature as phrase-final vowel devoicing (PFVD), refers to a well-attested phenomenon in Continental French (CF) in which breath group-final vowels lose their voicing and produce a short burst of high-frequency aperiodic energy, akin to a fricative, e.g., mais oui_hhh [mɛwiç], merci beaucoup_hhh [mɛʁsibokux] (see Figure 1). The first linguistic description of this phenomenon described it as the emergence of “sharp, phrase-final whistles” (Fónagy 1989); subsequent research witnessed a split in nomenclature, with North American researchers often opting for a name focusing on voicing loss—“vowel devoicing/dévoisement vocalique” (Fagyal and Moisset 1999; Smith 2002, 2003, 2006; Martin 2004) and most European researchers preferring a name focusing on the emergence of the downstream fricative—“fricative epithesis/épithèse (consonantique) fricative” (Fagyal 2010; Candea 2012; Candea et al. 2013). Because the present study will focus on characterizing the spectral and durational qualities of the emergent fricative, we the (North American) authors have explicitly chosen to heed the call of our European predecessors in adopting the term “fricative epithesis” for this discussion.
In the first description of PFFE in the literature, Fónagy hypothesized that not only did its characteristic phrase-final fricatives appear immediately following vowels that had lost a portion of their voicing band, but that he also suspected the fricatives themselves might correspond to the host vowel phonetically in terms of their backness dimension. Citing the ich-Laut/ach-Laut harmony phenomenon in standard German, in which the backness value of a voiceless fricative is selected by the backness value of its preceding vowel, he hypothesized that the fricatives epithesized after the high front vowels /i/ and /y/ in French would be more [ç]-like, i.e., front, than those appearing after high back /u/, which would be more [x]-like, i.e., back. This observation was corroborated by Dalola (2015a) who examined measures of center of gravity (COG) (average peak frequency) taken at the 1/4, 1/2 and 3/4 timepoints of PFFE fricatives produced by L1 CF speakers, and found evidence to suggest a three-way distinction in spectral energy at the first two timepoints; however, the spectral differences could not be characterized in terms of sheer [+/− back] and did not persist into the second half of the segment.
1.1. Phonological Predictors of PFFE
The best-studied dimension of PFFE is undoubtedly its phonological distribution. Originally described as occurring in high vowels (Fónagy 1989), subsequent studies documented the occurrence of PFFE in the full inventory of French vowels, including nasals (Smith 2006), but reported the highest rates of PFFE following the high vowels /i,y,u/ (Fagyal and Moisset 1999; Martin 2004; Smith 2003, 2006). When comparing reading passages, role-plays and impromptu conversation, PFFE has been found to occur at significantly higher rates in types of read, i.e., planned, speech (Fagyal and Moisset 1999; Dalola 2014), a finding that is perhaps explained by its higher rates of occurrence at the ends of both the intonation phrase and the declarative phrase (Fagyal and Moisset 1999; Smith 2003), where French sees the arrival of a low tone. Studies have also found an effect for the manner type of the preceding consonant, such that preceding stops condition PFFE at a significantly higher rate than more sonorous manner types, in addition to an effect for lexical frequency, which reports more frequent lexical items as more likely to exhibit the phenomenon than less frequent ones (Dalola 2015b).
1.2. Social Predictors of PFFE
The social distribution of PFFE presents a complex series of macro- and micro-group associations. Early work often described PFFE as occurring in the speech of women (Fónagy 1989; Fagyal and Moisset 1999; Smith 2006); however, later work has reported the variable to be used at similar rates among both men and women (Candea 2012; Candea et al. 2013; Dalola 2014). Fagyal and Moisset (1999), who took a categorical approach to age, found the variable at its highest rates among their youngest (16–35) and oldest (61–85) groups; Dalola (2014), who operationalized age continuously (testing ages 13–83), reported participants as more likely to use PFFE the older they were. From a socioeconomic standpoint, PFFE is often associated with the French middle class (la bourgeoisie) (Paternostro 2008; Fagyal 2010). Originally, the variable was associated with Parisians (Fagyal and Moisset 1999; Smith 2006; Fagyal 2010), though in recent years, it has also been documented in the speech of francophones from other metropolitan centers in France, namely Lyon and Strasbourg (Dalola 2014). Further afield, the variable has been described in the speech of French, Belgian and Canadian news anchors (Paternostro 2008; Candea et al. 2013); one study introduced intersectionality into this association by reporting it particularly among young, i.e., inexperienced, news anchors (Candea 2012). Despite the disagreement among social predictors, it is important to pursue research on the characterization of the PFFE variable.
1.3. L2 Speakers and PFFE
Given its salient phonetic energy and robust distribution among native francophone populations, it is somewhat unsurprising to learn that PFFE, despite its status as a sociophonetic variable, is also readily employed by L2 French speakers (Dalola and Bullock 2017). Investigating the nature of L1 and L2 PFFE as produced in different genres of speech, Dalola and Bullock (2017) revealed subtle but nuanced differences at every level of production. For rates of use of PFFE, L1 and L2 speakers performed similarly overall but were motivated by different genres of speech: L1 speakers used more PFFE in role-plays while L2s were more likely to use it when reading wordlists. In terms of duration of PFFE, or the proportional length of the epithesized fricative when compared to its host vowel, larger differences between speaker groups were documented: not only did L1 and L2 speakers produce PFFE segments that were statistically different in length (L1 PFFE length << L2 PFFE length), each group showed sensitivity to a different linguistic parameter: L1s produced longer PFFEs as a reaction to pragmatic shifts (indicated in the prompts to the role-plays), producing longer PFFEs in slower and formal speech, while L2s produced longer PFFEs as a reaction to task shifts, producing longer PFFEs in the wordlist task. Despite the various pragmatic and speaker group effects in this study, no effects were found in the participants for measures of gender or age.
1.4. Perception of PFFE
Differences in L1 versus L2 production of PFFE ushered in a rigorous examination of potential speaker group differences in the variable’s perception. Dalola (2016; in progress) reports significant differences in L1 and L2 perceptions of PFFE, namely that L2 speakers perceive it as a positive marker indexing “formality” and “trustworthiness,” whereas L1 speakers perceive it variably, sometimes as a positive marker indexing “admirability” and sometimes as a negative marker indexing “emotional affect.” Using a matched guide design and exploratory factor analysis, a related form of principal component analysis that partitions out the shared variance of each variable from its unique and error variance to reveal the underlying factor structure (Osborne and Costello 2009), L2 participants in Dalola (2016; in progress) rated users of PFFE similarly for two separate groups of adjectives: polite, well-educated, speaks clearly, speaks formally (a category the author refers to collectively as traits of FORMALITY) and confident, persuasive, I respect X, I trust X (a category the author refers to collectively as traits of TRUSTWORTHINESS). L1 speakers also rated users of PFFE similarly for two separate groups of adjectives; however, the adjectival members of the groups were both more numerous and compositionally different, with one group including the adjectives well-educated, professional, speaks clearly, polite, intelligent, patient, confident, persuasive, I trust X, I respect X, I believe what X says, I would like to speak like X (a category the author refers to collectively as traits of ADMIRABILITY), and the second including the adjectives aggressive, bourgeois, superficial, bossy, native French speaker, speaks with emotion (a category the author refers to collectively as EMOTIONAL AFFECT). It should be noted that all the traits that make up the L1 category of FORMALITY are also present in the L2 category of ADMIRABILITY, and that the reason for the difference in category name was due to the author’s desire to assign names that applied to the full collection of adjectives. No gender effects were found for the voices being rated, however, there was a significant gender effect among those giving ratings, such that women were more likely to assign higher ratings overall.
1.5. Motivation
This article reports on production differences in spectral tendencies in PFFE among L1 and advanced L2 speakers of Continental French. Since PFFE is a sociophonetic marker in CF (Dalola 2014, 2016), it presents an interesting testing ground for comparing spectral values across native and non-native speakers. While previous work has reported production differences in rate and degree of devoicing between native and non-native French speakers (Dalola and Bullock 2017), it has yet to extend the comparison to investigate the phonetic quality of the variable emergent fricatives. Combined with the many known articulatory differences and false similarities in vowel production between French and English (the L1 of the non-native population in this and previous studies), it is reasonable to expect that articulatory issues may arise, even among advanced L2 speakers (Flege and Hillenbrand 1984; Flege 1985, 1987; among others). The goal of this study is, therefore, to examine and characterize the fricatives epithesized after devoiced vowels using measures of fricative-to-vowel ratio (FVR) (length of fricative divided by length of full vowel) and center of gravity (COG) (average peak frequency reached at designated timepoints during fricative segment). The COG measures will then be used to create a multipoint spectral profile for each fricative that will be classified into more general profile types capturing the overall increase, decrease or static tendency of energy during articulation. We will then use inferential statistics to examine the predictability of each profile type by speaker, fricative-to-vowel ratio and vowel type. After presenting the results unique to each profile type, we will compare the most common profile types produced by each speaker group in order to assess the nature of any significant spectral differences occurring between L1 and advanced L2 PFFE.
1.6. Research Questions and Hypotheses
The current study puts forth the following research questions:
- Do L1 and advanced L2 French speakers produce PFFE differently in terms of measures of COG?
- Are speaker group-level differences in the production of PFFE modulated by vowel type and fricative-vowel ratio?
Due to the exploratory nature of the study, predictions will not be offered for each of the research questions, as previous work has not yet diagnosed this aspect of the PFFE variable.
2. Materials and Methods
2.1. Participants
40 speakers of CF participated in the experiment, of which 31 were L1-French and nine L1-English advanced L2-French. All participants were recorded in Paris or Strasbourg in France or in the United States. Among the L1 participants, 23 were women and eight were men, ranging in age from 20 to 66 years (mean = 38.4 years). All L1 speakers were L2 speakers of English, having studied it formally for four or more years and using it in interactions once a week or more. Among the L2 participants, five were women and four were men, ranging in age from 27 to 58 years (mean 38.6 years). L2 speakers were classified as “advanced” because they had all lived in France for at least two years, had prepared or were preparing an upper-level degree in French and used French regularly in their careers. All L2 speakers were L1 speakers of American English. All subjects gave their informed consent for inclusion before they participated in the study. The study was conducted in accordance with the Declaration of Helsinki, and the protocol was approved by the University of South Carolina Institutional Review Board (USC IRB).
2.2. Stimuli
Inspired by the task and pragmatic effects findings of Dalola and Bullock (2017) and several studies’ reports of PFFE’s robustness among news anchors reading off teleprompters (Paternostro 2008; Candea 2012; Candea et al. 2013), participants were asked to complete a reading task that consisted of 106 single sentences containing 98 phrase-final tokens of /i,y,u/, occurring after all licit (C)C(C) onset sequences in one- to three-syllable real words in French (see Table 1 for a breakdown of consonant environments).
2.3. Procedure
Participants were presented with sentences one at a time on a MacBook Pro via Microsoft Powerpoint and told to read each one aloud, imagining they were reading a story to a native francophone listener. Participants were instructed to read each sentence twice and to repeat any trials from the beginning in the event of a disfluency. As they read aloud, participants were recorded via a head-mounted unidirectional cardioid microphone (SHURE WH20) plugged into a solid-state digital recorder (Marantz PMD 660) digitized at 44.1 kHz (16 bit). The task was completed under the direction of the L1-English advanced L2-French researcher; it was self-paced and participants were given as much time as they needed to complete it.
2.4. Acoustic Measurements
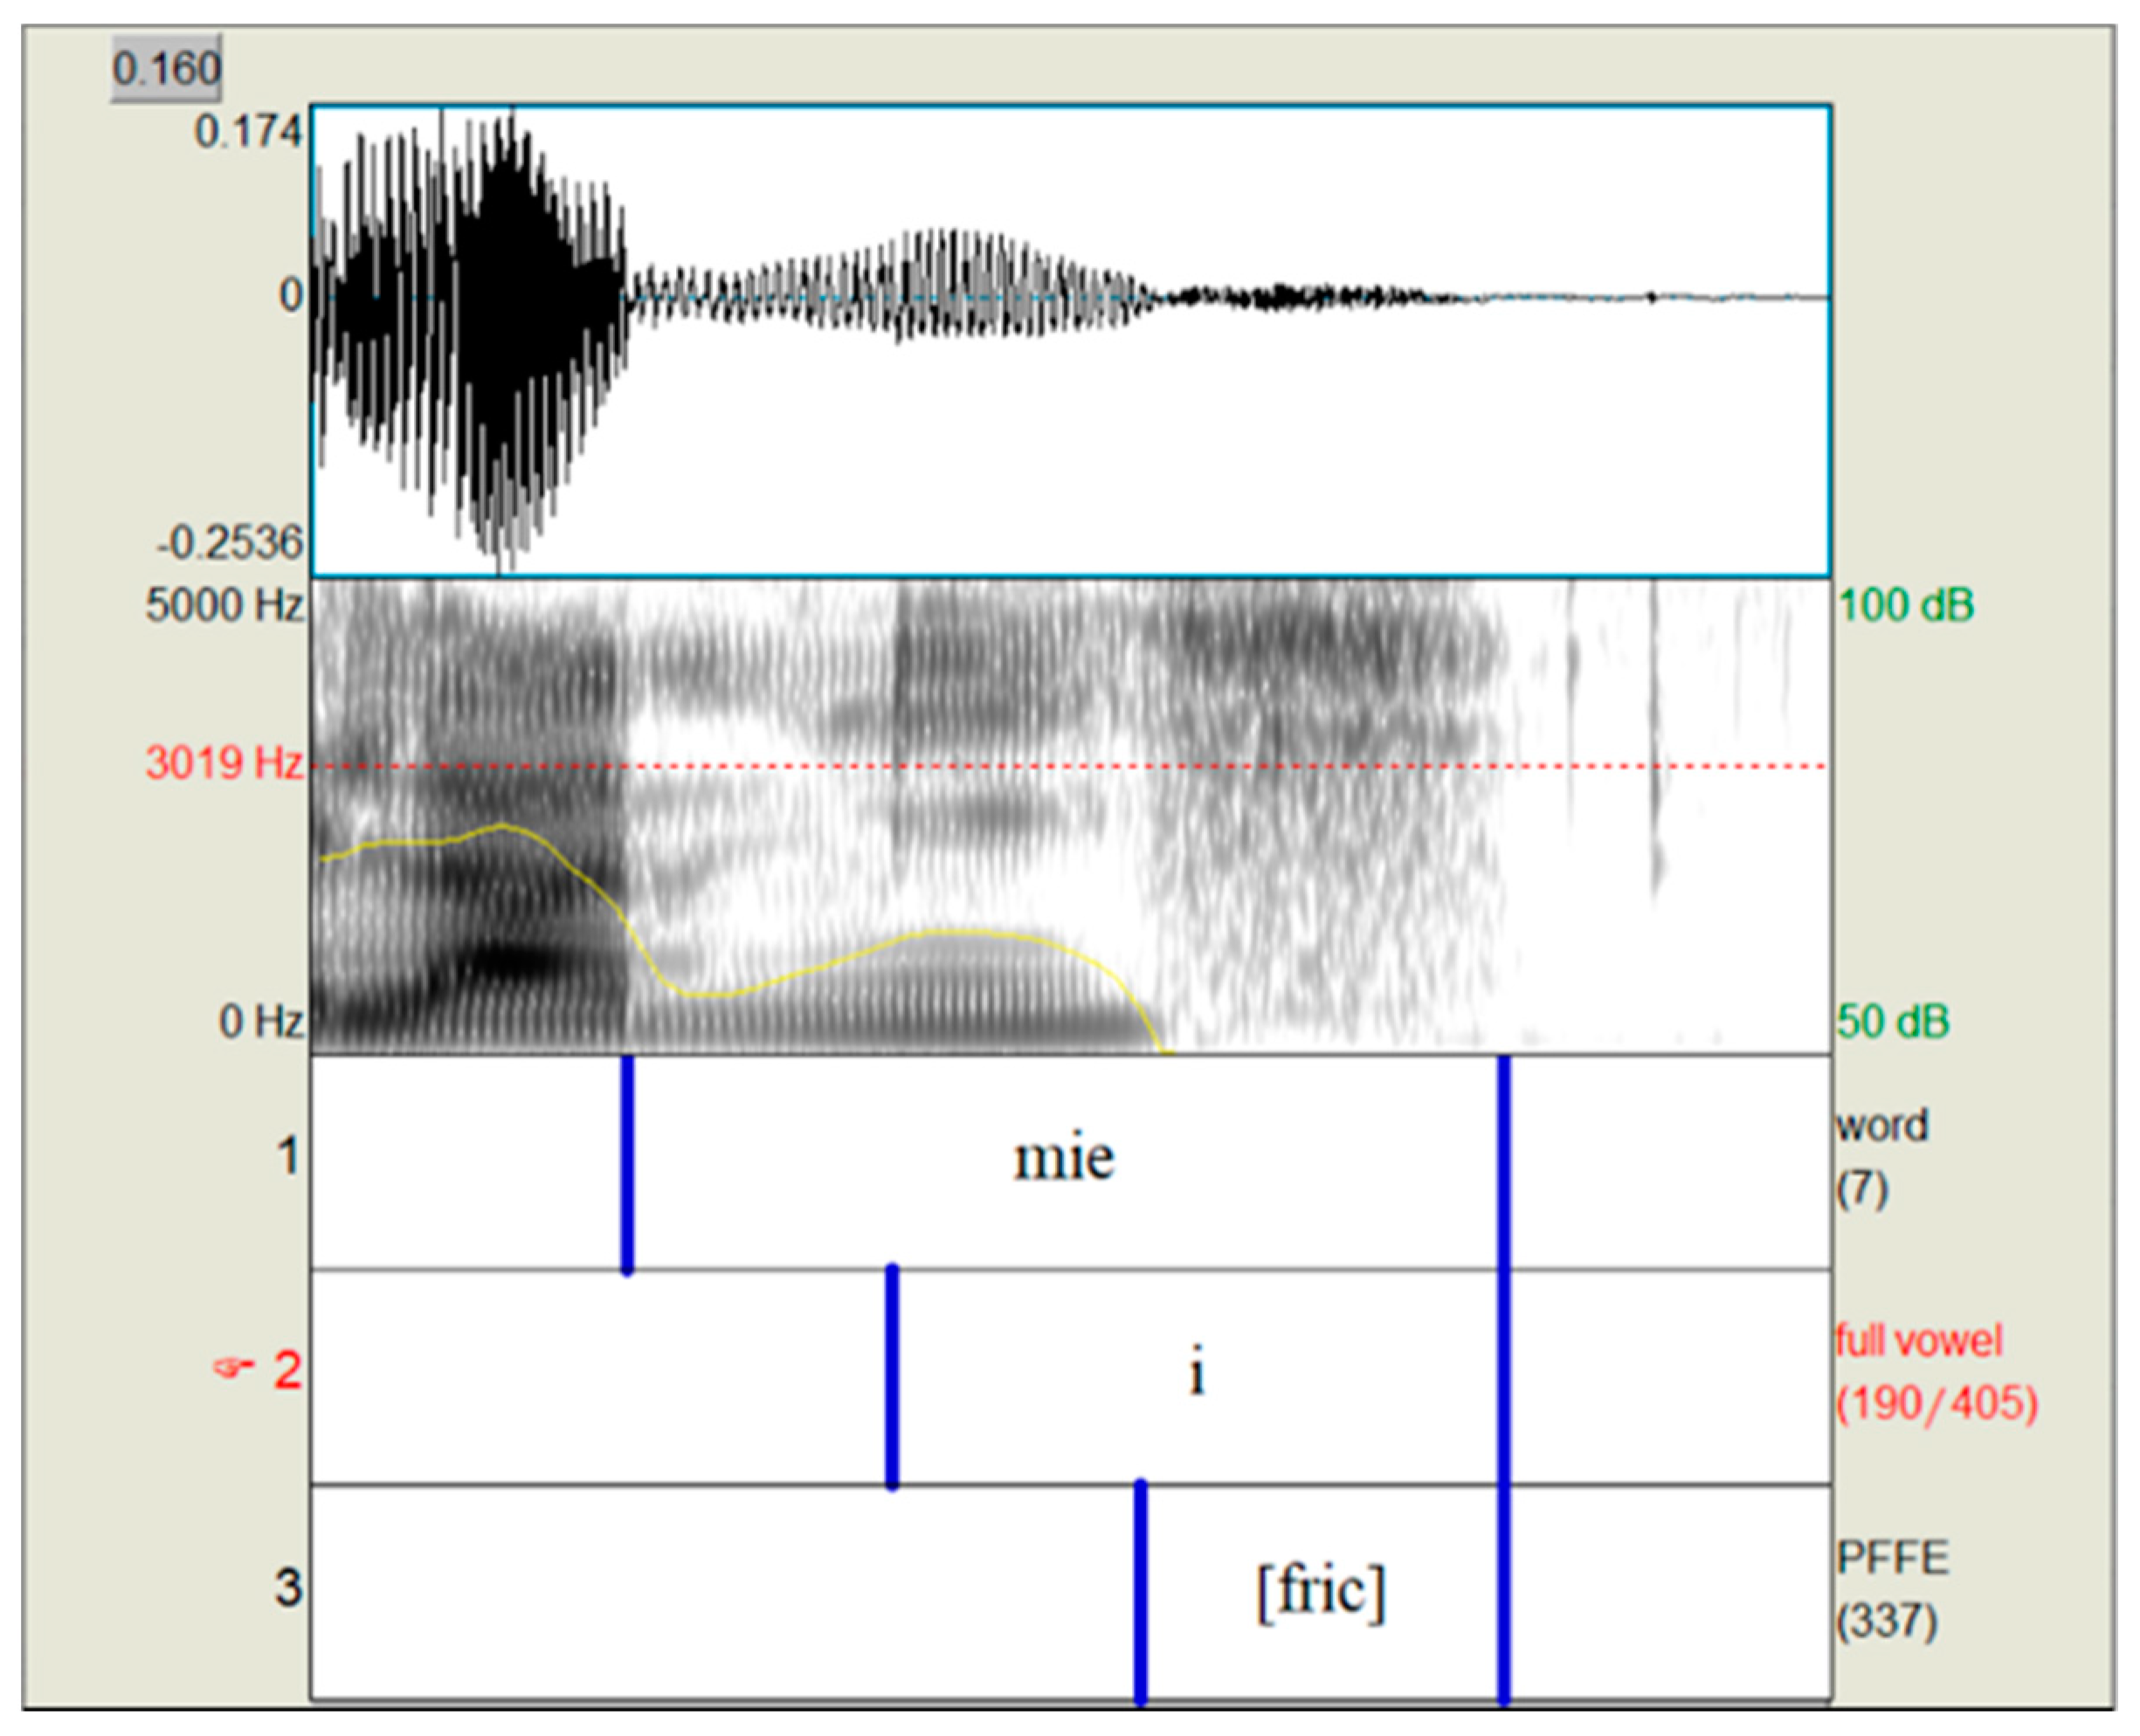
From the resulting recordings, target vowels were identified, delimited, and labeled manually in Praat based on the spectrographic and time displays, beginning at the onset of voicing and formant structure and ending with the end of formant structure. Instances of PFFE were counted as part of the vowel and were included in the overall duration (measured in milliseconds). Each target vowel was then inspected for the presence of PFFE, which was labeled and measured for duration on a separate tier. A derived measure of the fricative-vowel ratio (FVR) was calculated by dividing the length of frication by the length of the full vowel, i.e. the vocalic portion plus frication, as illustrated in Figure 2.
A script targeting the devoicing tier divided each instance of PFFE into quartiles, labeling timepoints at the 25%, 50%, and 75% marks; a subsequent script measured center of gravity (COG) at each of these points (Erker 2010).
To control for effects of variation in vocal tract length, COG values were normalized (Shadle and Mair 1996), according to a technique adapted from Toda (2007), as shown in (1):
in which the speaker-dependent coefficient si was calculated by (2):
where COGi refers to the average COG value of participant i, and COGavg refers to the average COG value across all participants. Henceforth, COG will be used to refer to this normalized center of gravity variable, and Hz to the normalized units used to quantify COG.
COGnorm = si × COG,
si = COGavg/COGi,
3. Results
3.1. COG Statistical Treatment
Out of 7942 tokens, participants produced a total of 4995 instances of vowels exhibiting PFFE, which formed the corpus for subsequent analysis.
Statistical analyses of COG were conducted in the statistical tool R (R Core Team 2017). Using lmer() from the package lmerTest (Kuznetsova et al. 2017), a mixed-effects linear regression model was performed for each timepoint, with COG as the dependent variable; vowel, speaker group, and FVR as independent variables; and participant treated as a random effect. Visualizations were generated using effects data from the package effects (Fox 2003; Fox and Weisberg 2019).
3.2. COG Results
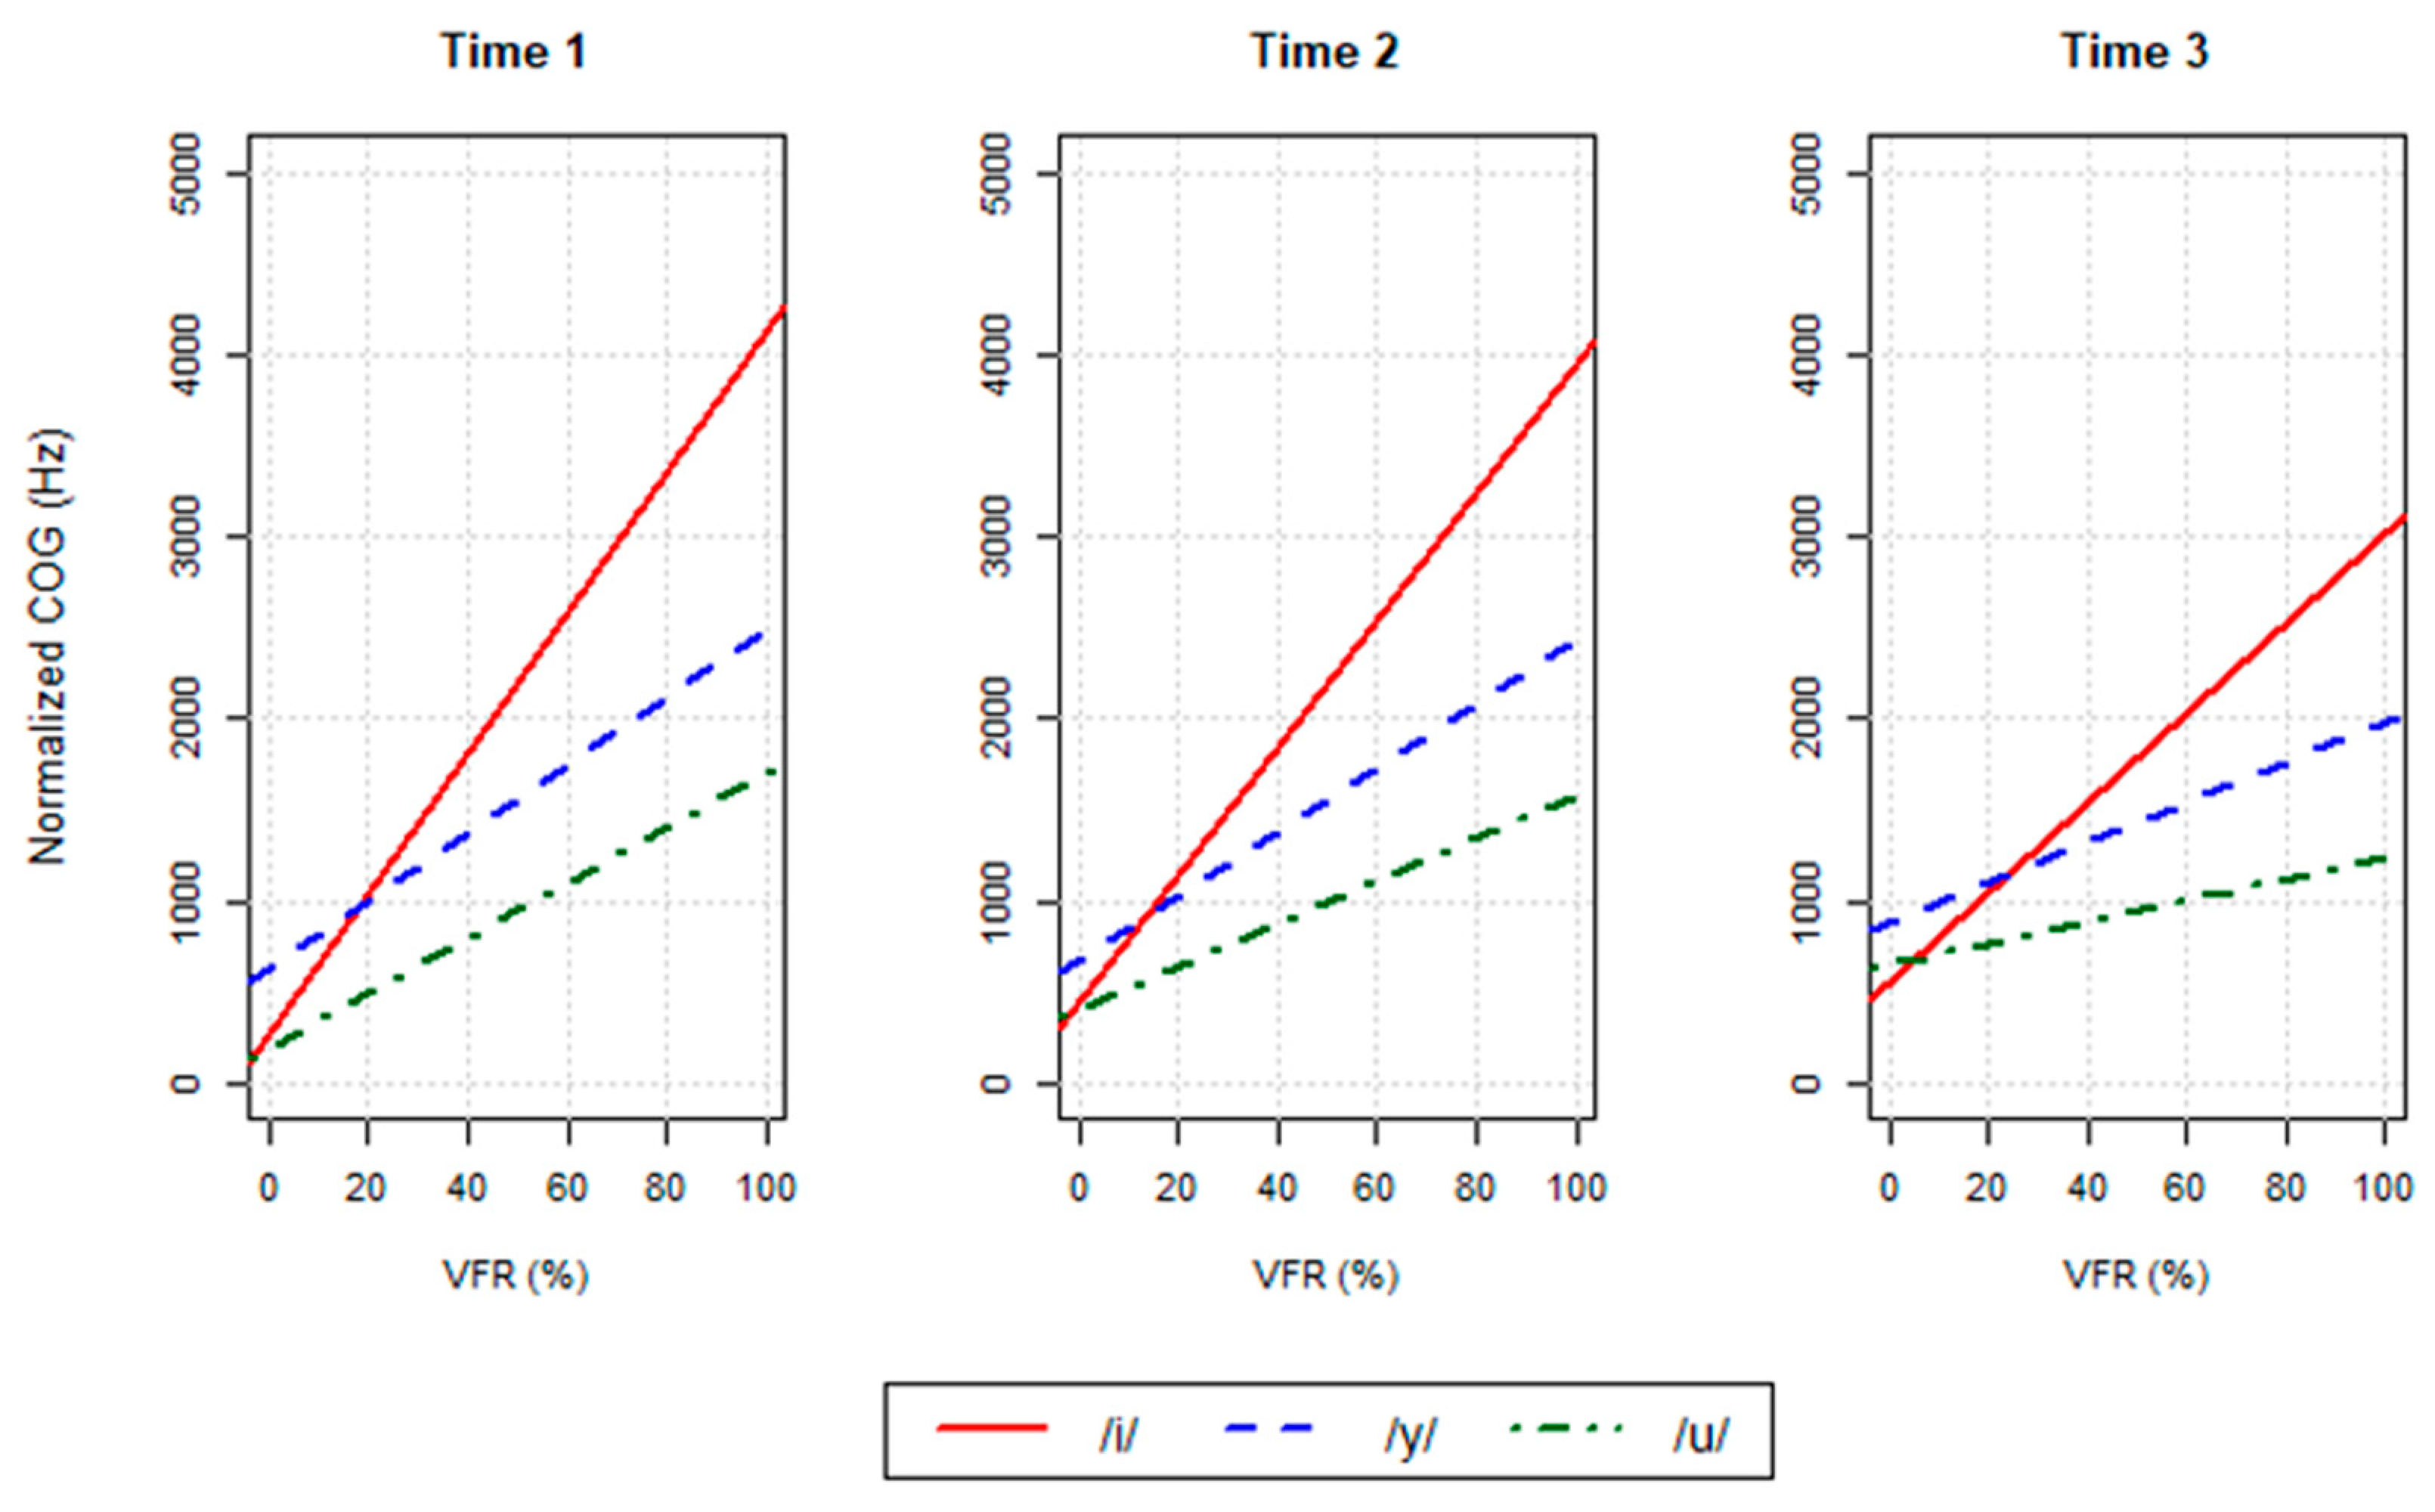
Timepoint 1 (25%). The full model for COG of PFFE at Timepoint 1 is pictured in Table 2. There was an interaction effect between vowel and FVR, such that higher PFFE-to-vowel ratios corresponded to higher COG values, with the identity of the vowel strongly affecting the rate of increase. As shown in Figure 3, the three vowels showed similar COG values as FVR approached 0%, but exhibited strong differences as FVR increased, with /i/ having a stronger rate of increase than /y/ or /u/. /y/ also showed slightly higher COG values than /u/ across all FVRs.
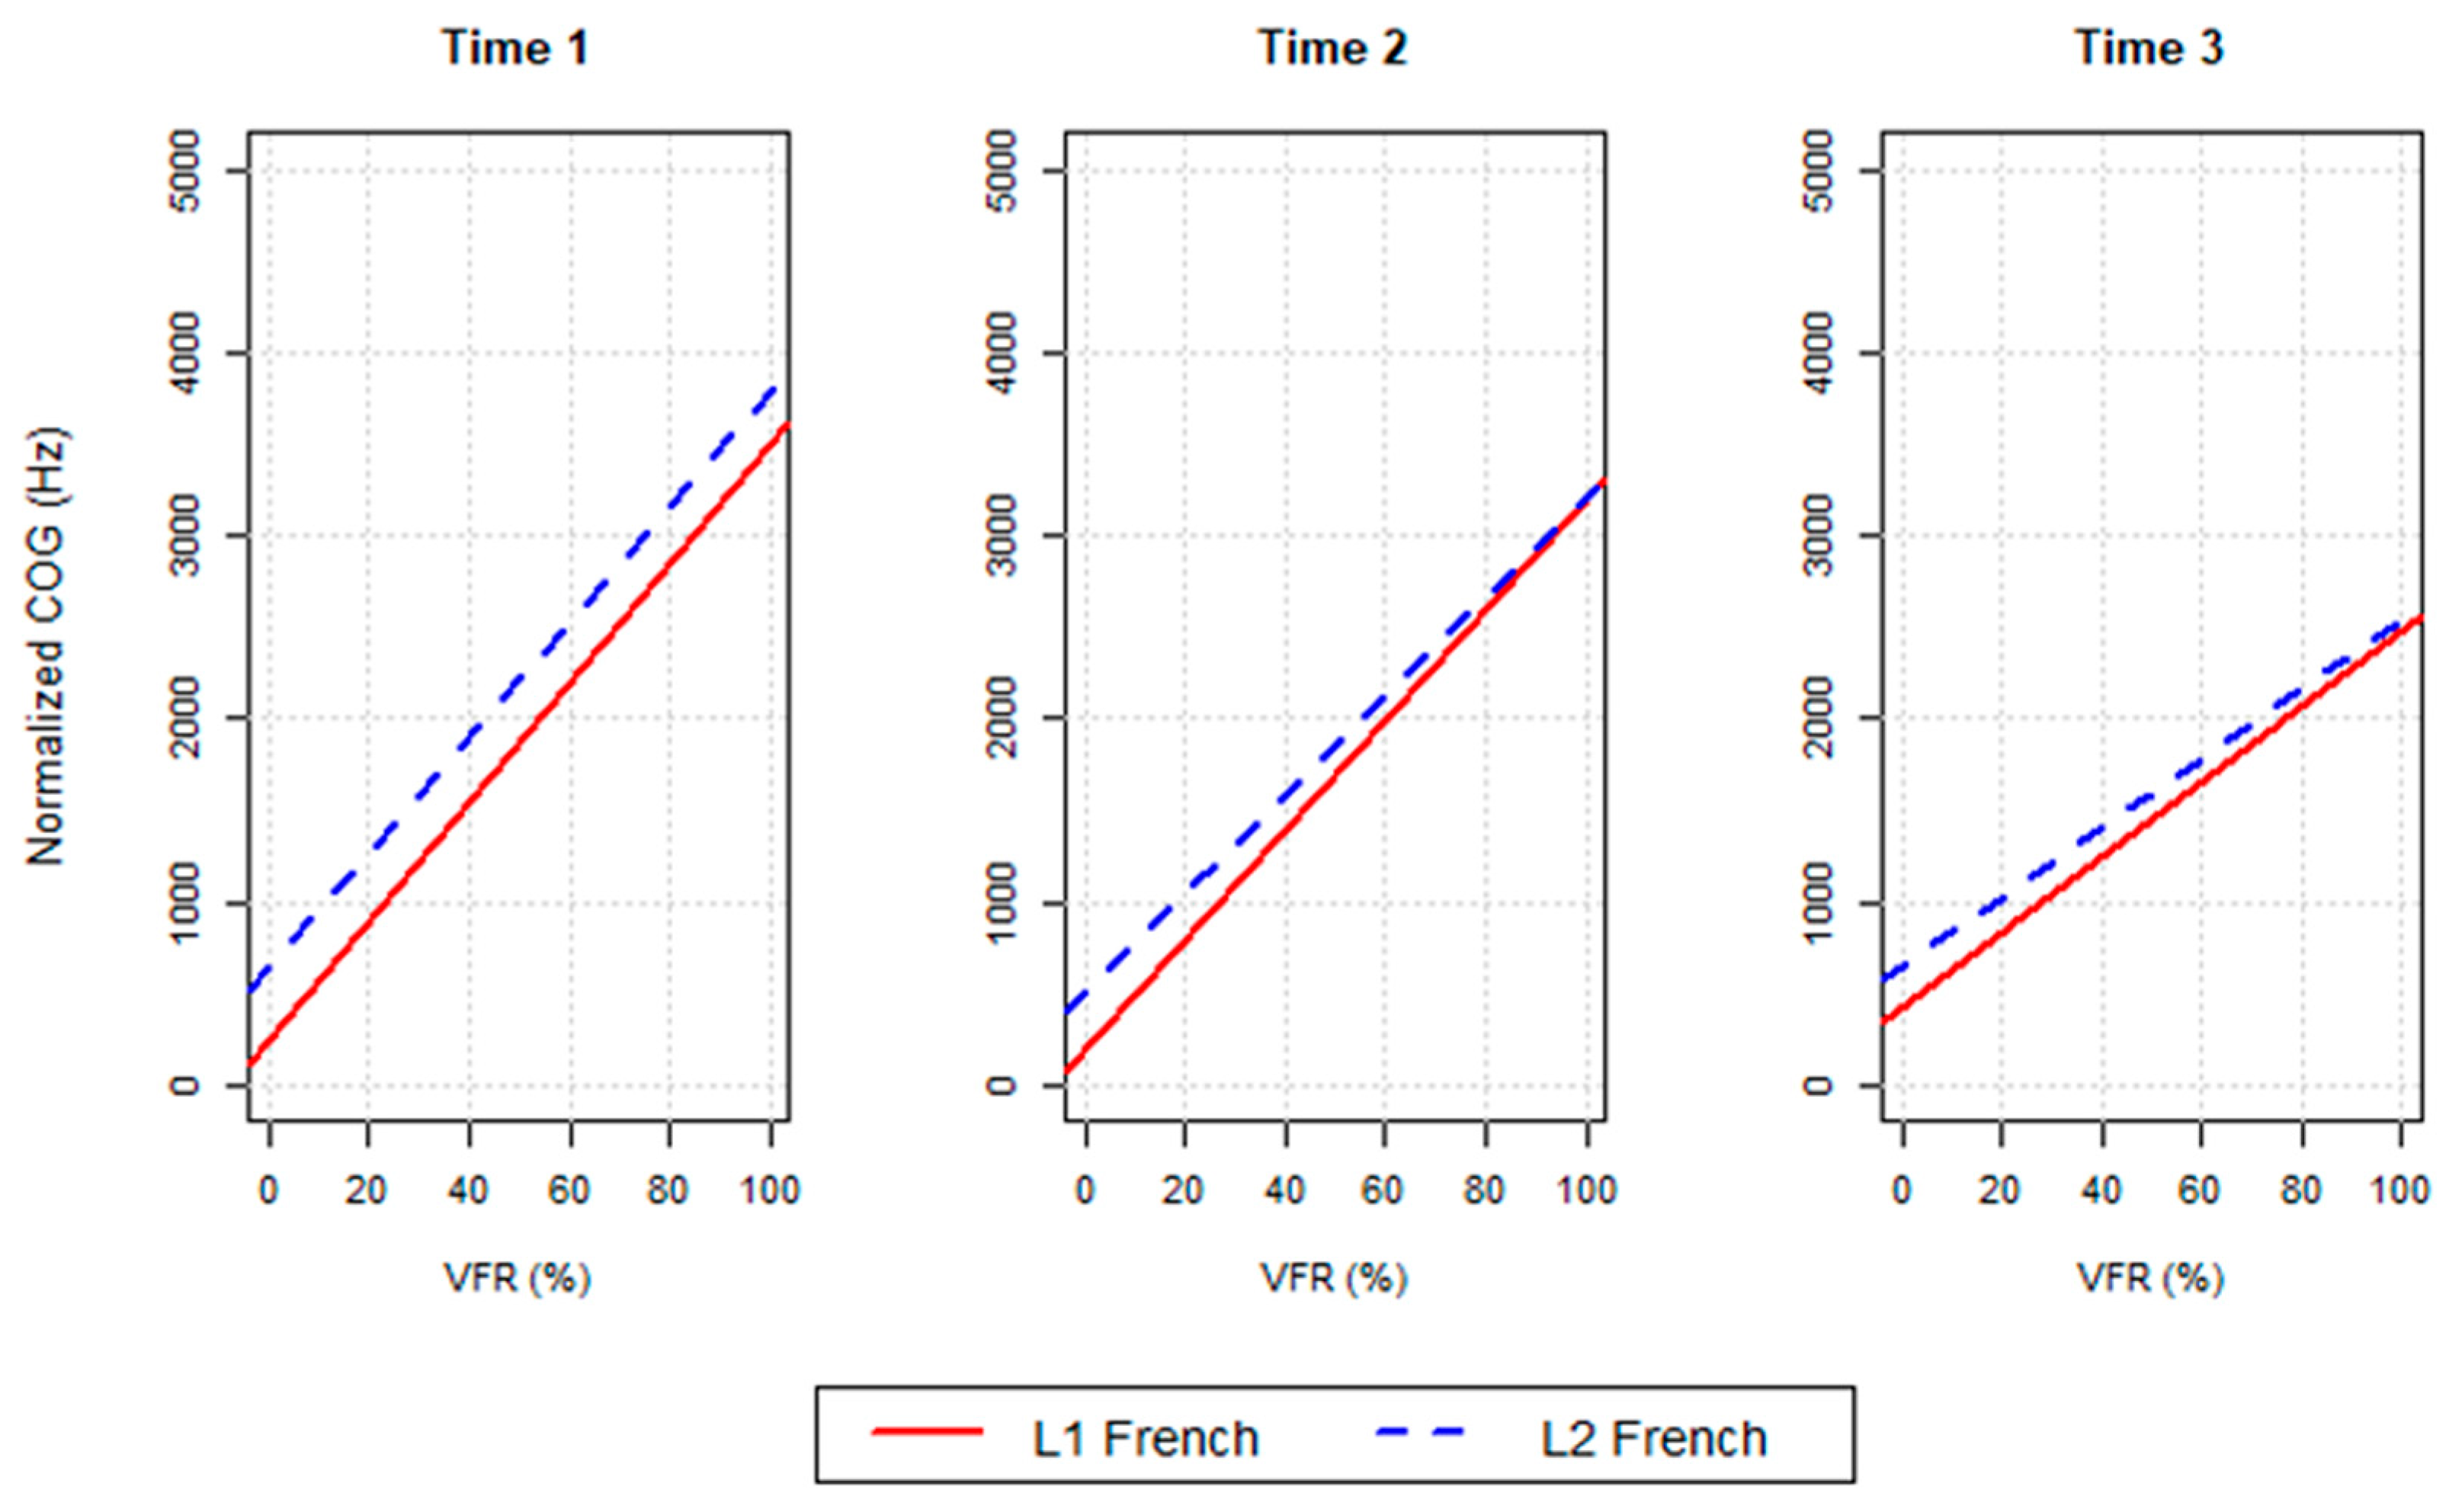
An interaction was also observed between speaker group and FVR, as visualized in Figure 4, such that L2 speakers exhibited higher COG values than L1 speakers at all FVRs, but to a greater extent at lower percentages.
No significant interaction was observed between vowel and speaker group. However, there was a main effect for speaker group, such that L2 speakers produced PFFE 547.06 Hz higher than L1 speakers. There was also a main effect for vowel, such that after all interactions were taken into account, the COG values of /y/ were 402.4 Hz and 424.3 Hz higher than the COG values of /i/ and /u/, respectively (although with respect to the raw data, COG values of /i/ were significantly higher than those of /y/ and /u/). The intraclass correlation coefficient (ICC) of 0.23 suggests low levels of similarity between measurements in the same group, indicating high variability.
Timepoint 2 (50%). A second mixed-effects linear regression model was fit for COG at Timepoint 2, with similar results, as pictured in Table 3. As at Timepoint 1, there was an interaction effect between vowel and FVR, shown in Figure 3, such that higher PFFE-to-vowel ratios corresponded to higher COG values, with more pronounced differences between COG values at 0% and 100% for /i/ than /y/ or /u/.
There was also a similar interaction between speaker group and FVR, such that L2 speakers exhibited higher COG values than L1 speakers at low FVRs (see Figure 4).
No significant interaction was observed between vowel and speaker group. However, there was a main effect for speaker group, such that L2 speakers produced PFFE 619.32 Hz higher than L1 speakers. There was also a trending main effect for vowel, such that after all interactions were taken into account, the PFFE of /y/ was produced 253.95 Hz higher than the PFFE of /i/. The ICC measure of 0.184 suggests low levels of similarity between measurements in the same group, indicating high variability.
Timepoint 3 (75%). A final model was fit for COG at Timepoint 3, with similar results to those at Timepoint 1 and Timepoint 2, as pictured in Table 4. As at the previous two time points, there was an interaction effect between vowel and FVR (see Figure 3), such that higher PFFE-to-vowel ratios corresponded to higher COG values, with more pronounced differences between COG values at 0% and 100% for /i/ than /y/ or /u/.
There was also a similar interaction between speaker group and FVR, such that L2 speakers exhibited higher COG values than L1 speakers at low FVRs (see Figure 4).
A trending interaction was observed between vowel and speaker group for /u/, such that L1 speakers produced higher PFFE than L2 speakers. A main effect for speaker group was also present, such that L2 speakers produced PFFE 467.45 Hz higher than L1 speakers. Finally, there was a main effect for vowel, such that after all interactions were taken into account, the PFFE of /y/ was produced 331.13 Hz higher than the PFFE of /i/. The ICC measure of 0.133 suggests low levels of similarity between measurements in the same group, indicating high variability.
All timepoints. As shown in Figure 3, COG values exhibited a tendency to “level out” over time. At high FVRs, the average COG decreased from Timepoint 1 to Timepoint 3; at low FVRs, the average COG increased slightly over time.
3.3. Profile Creation
While COG values appeared to decrease over time, particularly when PFFE made up a larger proportion of the vowel, this observation was based on aggregate data, not the progression of fricative quality within individual tokens. To investigate this more granularly, a variable combining the three timepoints into a single contour was developed, which will subsequently be referred to as profile.
The variable of profile was operationalized according to the following procedure. Normalized COG values were first categorized by binning the data: since 98.7% of the data fell under 6000 Hz, the range of frequencies was equally split into levels Low (0–2000 Hz), Medium (2000–4000 Hz), and High (4000+ Hz). For each token, the three timepoints were then combined to form a three-letter profile designation describing the COG pitch over the course of the frication (e.g., HML for a token progressing from high, to medium, to low).
The resulting 27 designations (LLL, LLM, LLH, etc.) were subsequently divided into profile types based on the overall shape which they represented: flat, rising, falling, rise–fall, and fall–rise. Since a different type of PFFE (vowel devoicing producing only voicing loss, as opposed to vowel devoicing producing only fricative epithesis) appeared to be represented by LLL, LLL was separated from the other members of the “flat” level and labeled as “flat–low.” The resulting six levels were used in all subsequent analyses. The correspondence between letter designations and profile types is shown below, in Table 5.
3.4. Profile Statistical Treatment
All statistical analyses of profile were conducted in R (R Core Team 2017). Chi-square tests of the relationship between profile and each of the independent variables vowel, speaker group, and FVR were performed using chisq.test(). Using multinom() from the package nnet (Venables and Ripley 2002), a multinomial logistic regression model was also performed, with COG as the dependent variable and vowel, speaker group, and FVR as independent variables. Visualizations were generated using effects data from the package effects (Fox and Hong 2009; Fox and Weisberg 2019).
3.5. Profile Results
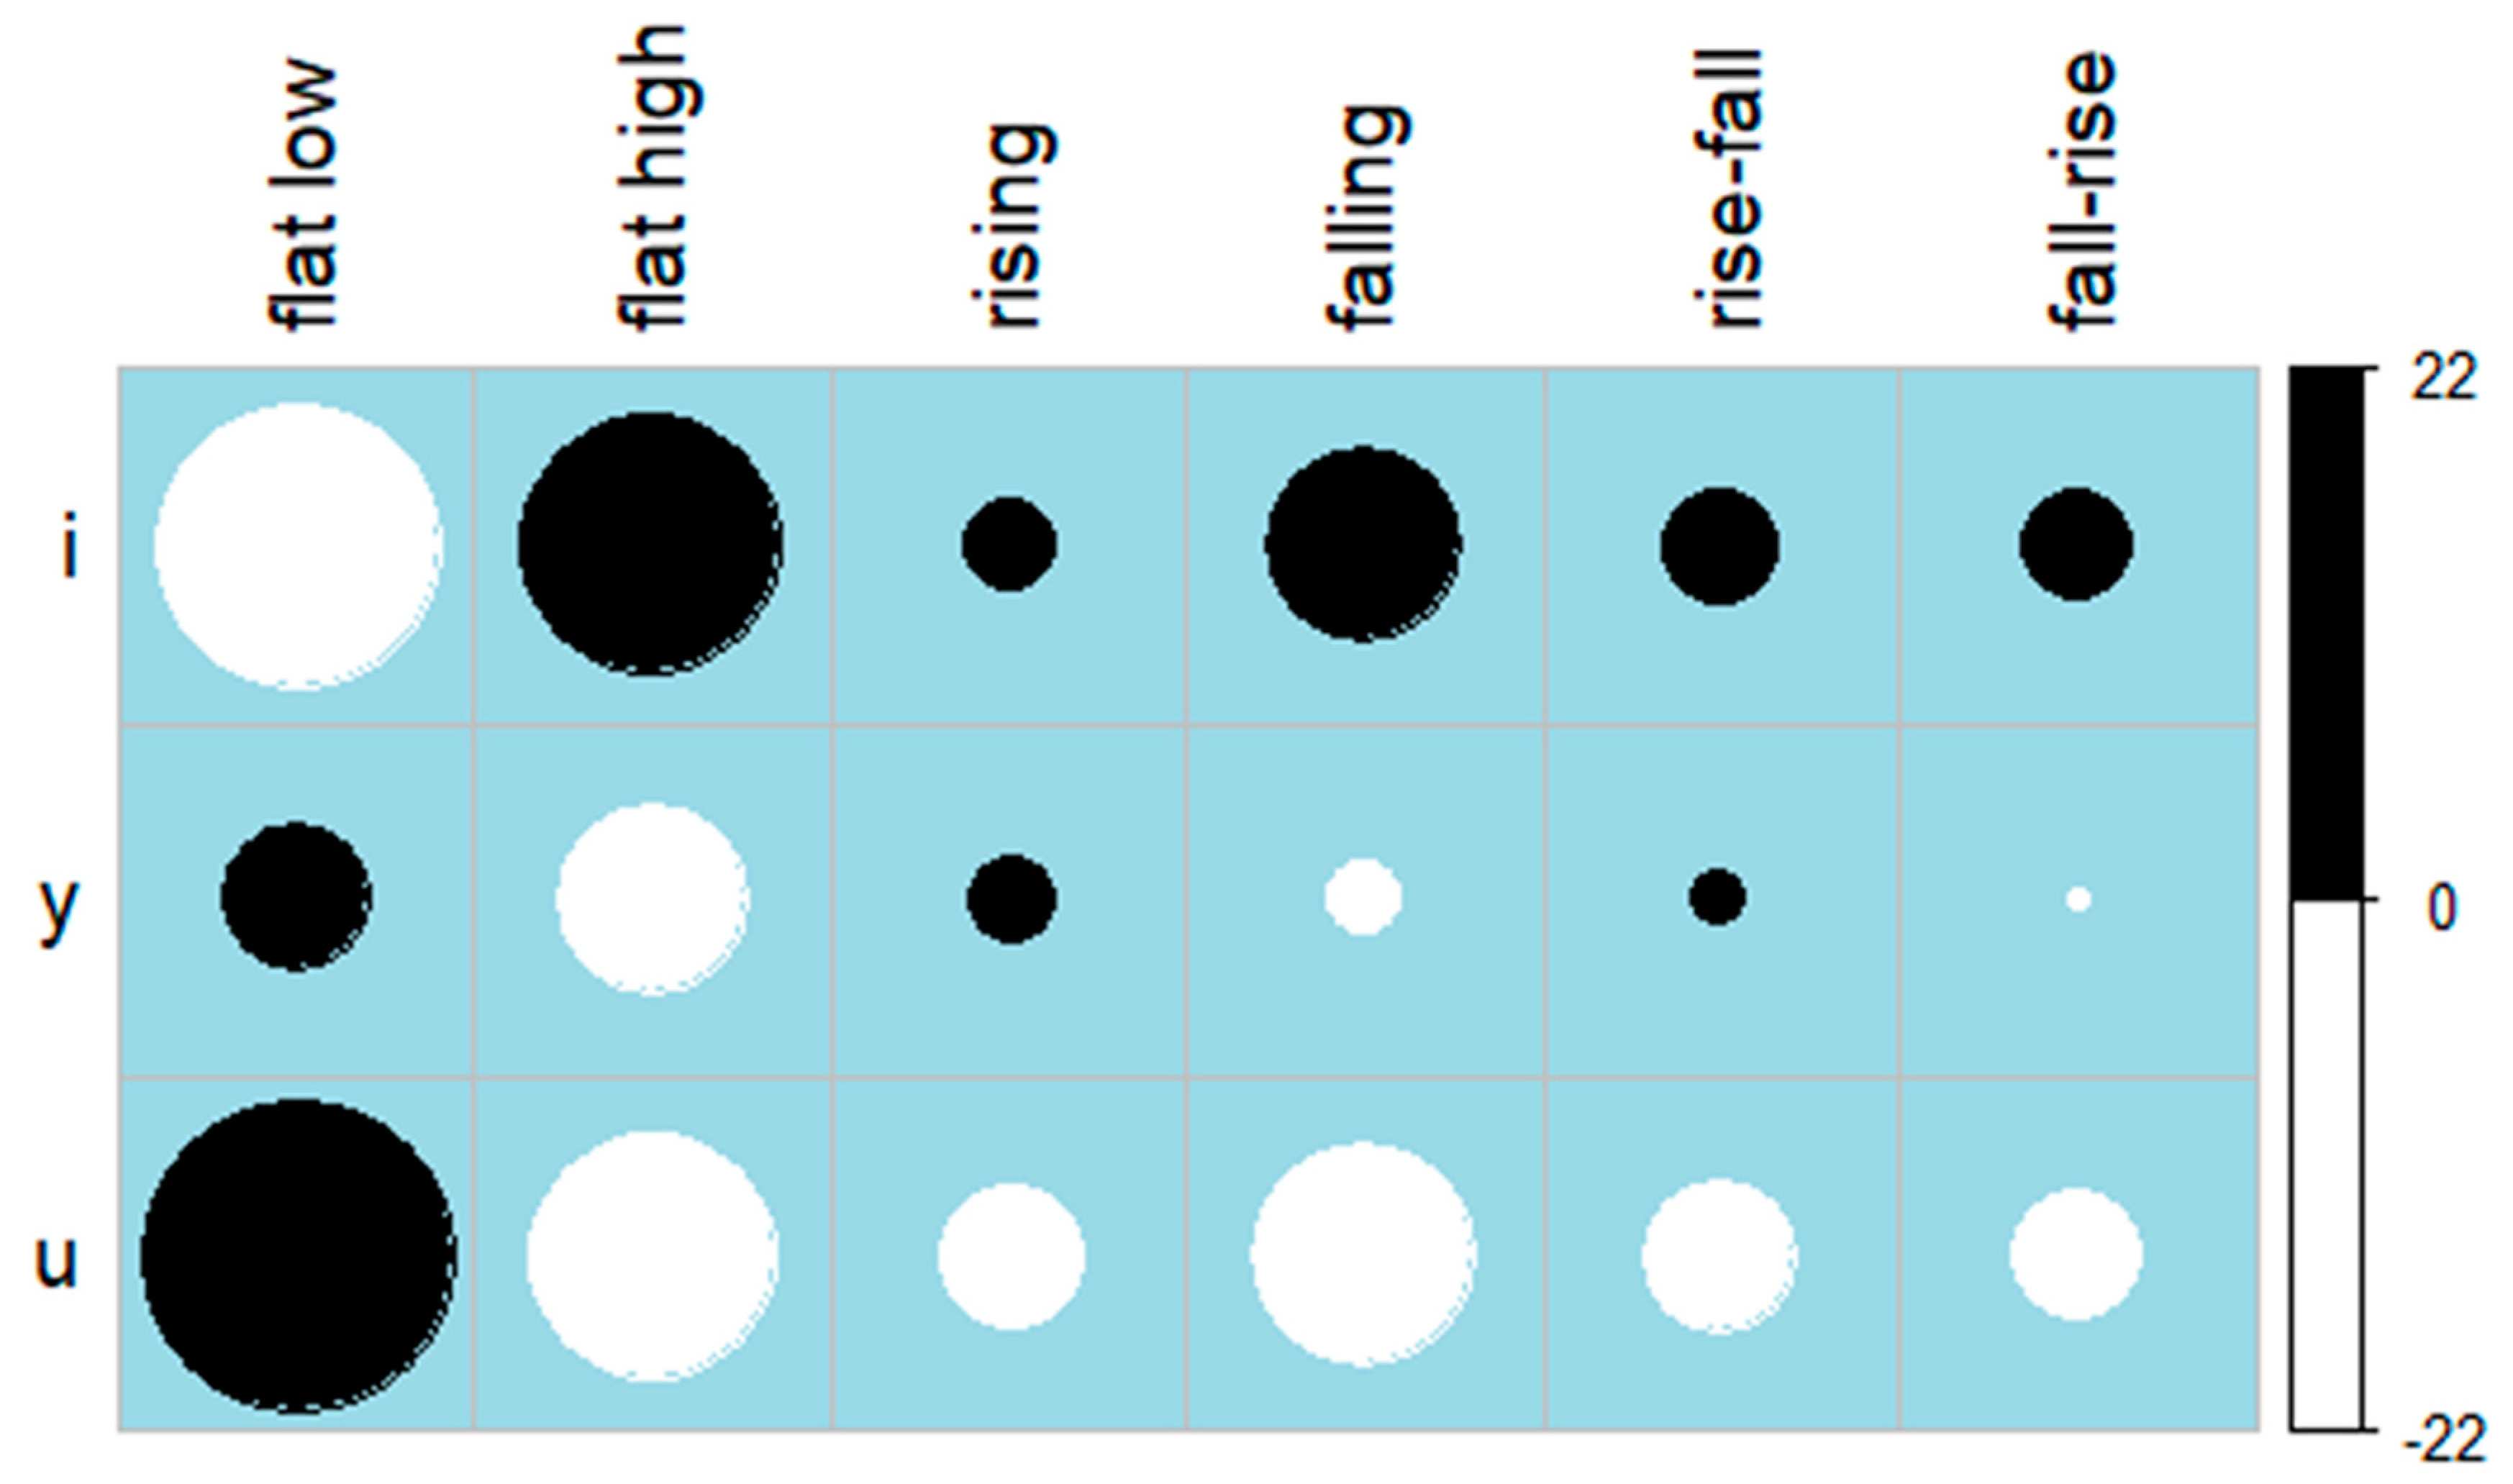
In order to determine whether the different vowels favored different profile types, a chi-square test was conducted on the variables of profile and vowel. This revealed a significant effect for vowel on profile type (χ2(10) = 1555.2, p < 0.0001). As shown in Table 6, the PFFE of /i/ was most frequently realized with a high, flat COG production, or a COG production that began at high values and decreased throughout the course of the vowel. /y/ and /u/, on the other hand, were most often realized with a low, flat PFFE production. This was particularly true for /u/, which was categorized as flat–low 84.8% of the time. The results of the chi-square test are visualized via correlation plot in Figure 5.
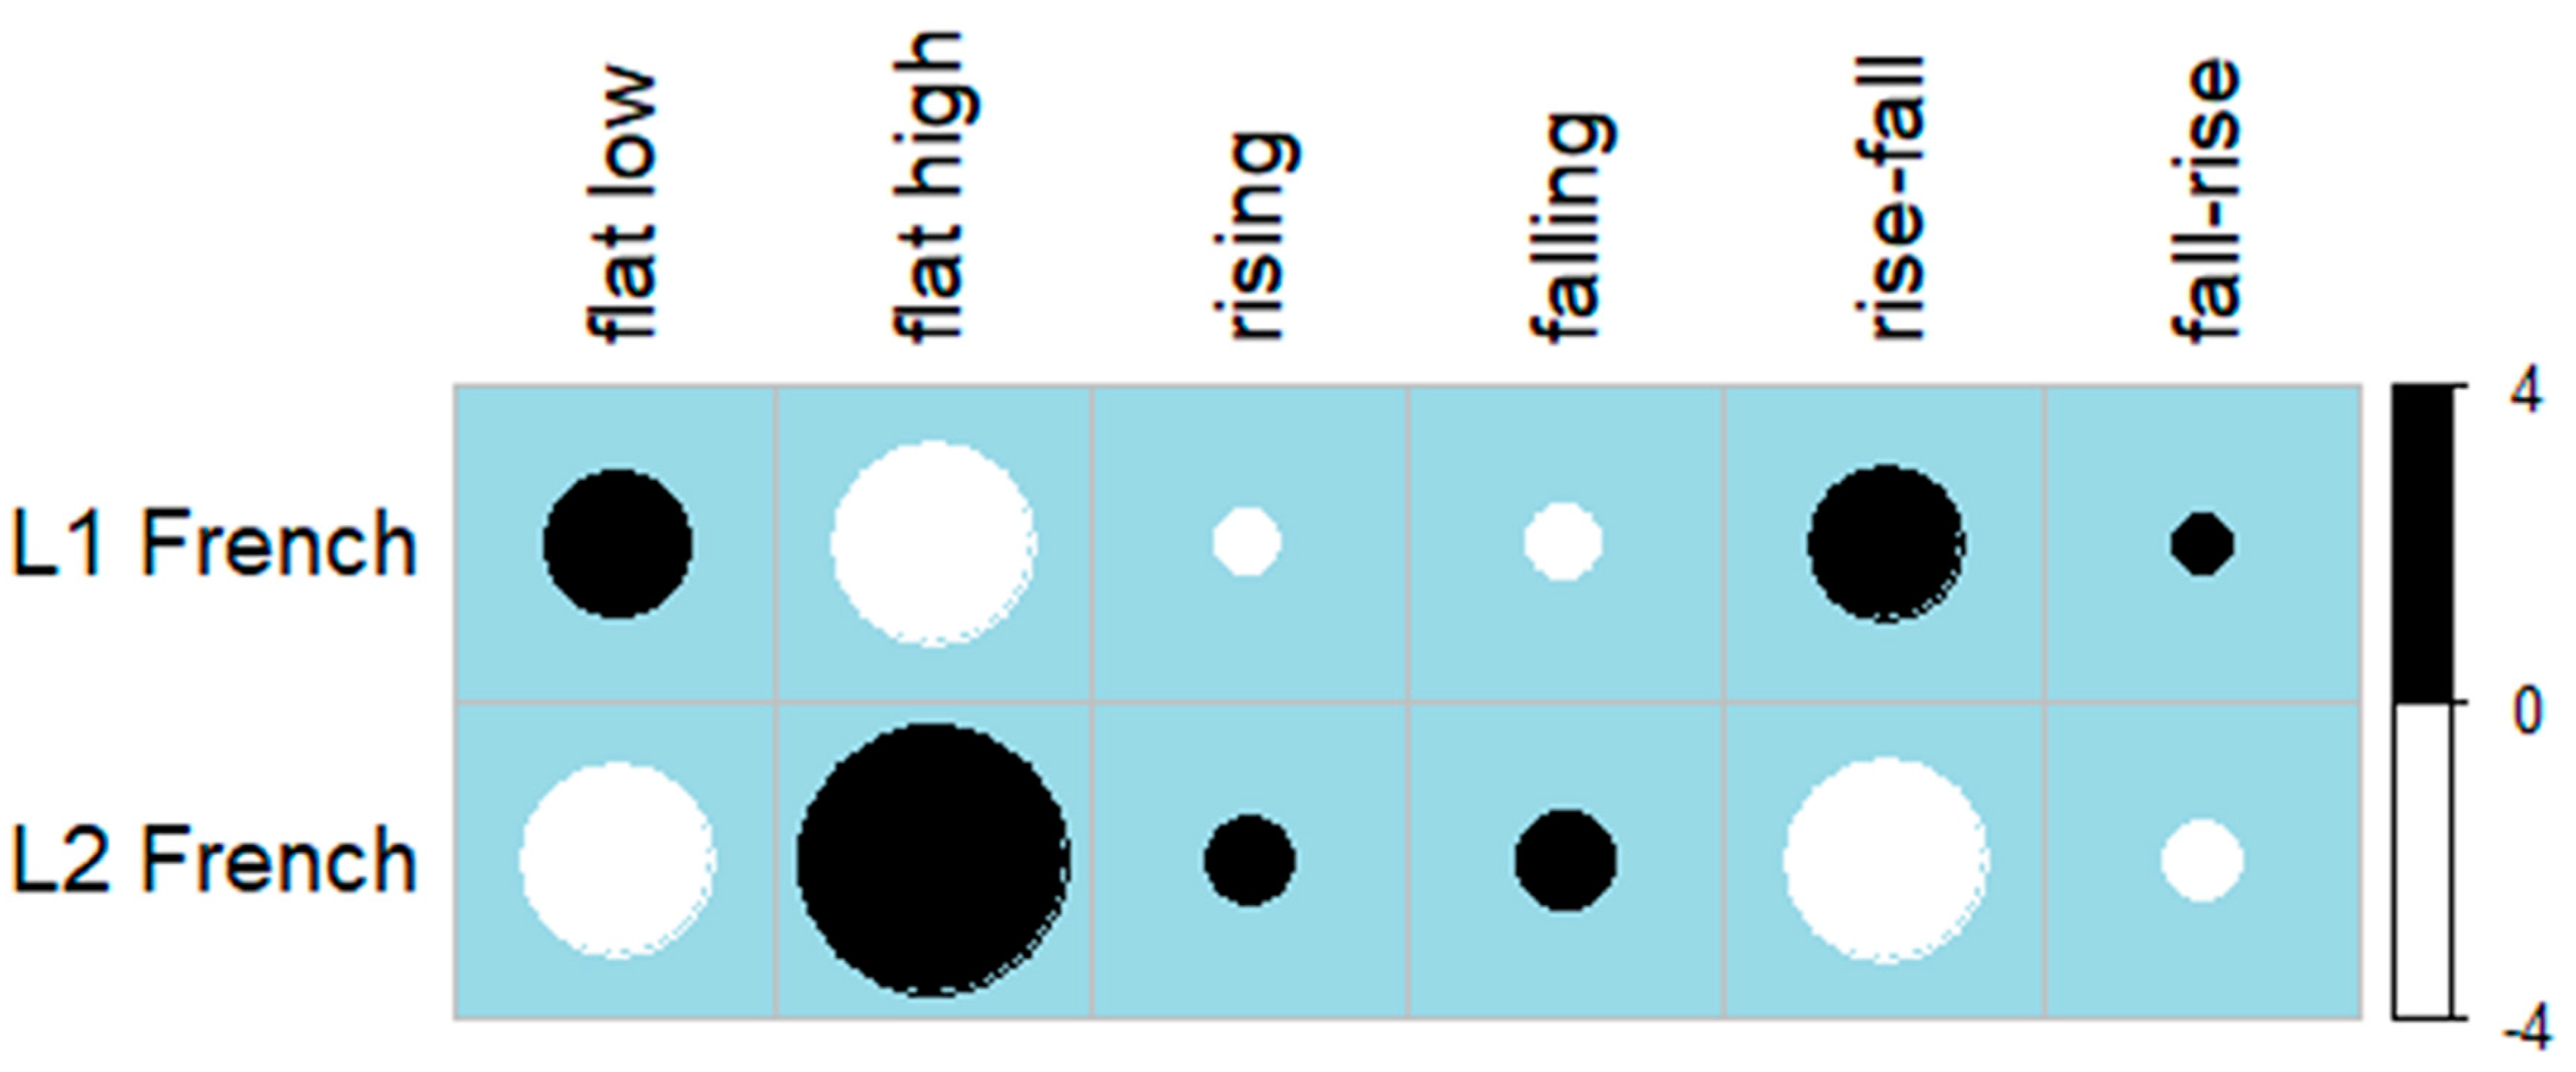
To determine whether L1 and L2 speakers of French favored different profile groups, another chi-square test was conducted on profile and speaker group. This test revealed a significant effect for speaker group (χ2(5) = 29.104, p < 0.0001), such that while both groups used a low, flat frication profile more frequently than any other type, L1 speakers used a flat–low profile more often than L2s, and L2 speakers used a flat–high profile more frequently than L1s (see Table 7). All other profile types appeared to be roughly equal across speaker groups. The results of the chi-square test are visualized in a correlation plot in Figure 6.
In order to conduct a chi-square test on FVR, its values were binned into five categories with a range of 20%, as shown in Table 8. This test revealed a significant effect for FVR (χ2(20) = 665.92, p < 0.0001). When PFFE made up 60% or less of the vowel, flat–low profiles made up the majority of tokens. It was still the most common profile type at 60–80% percent PFFE, but flat–high and falling were also frequent; at 80–100% PFFE, flat–high was the most common profile type. The results of the chi-square test are visualized in a correlation plot in Figure 7.
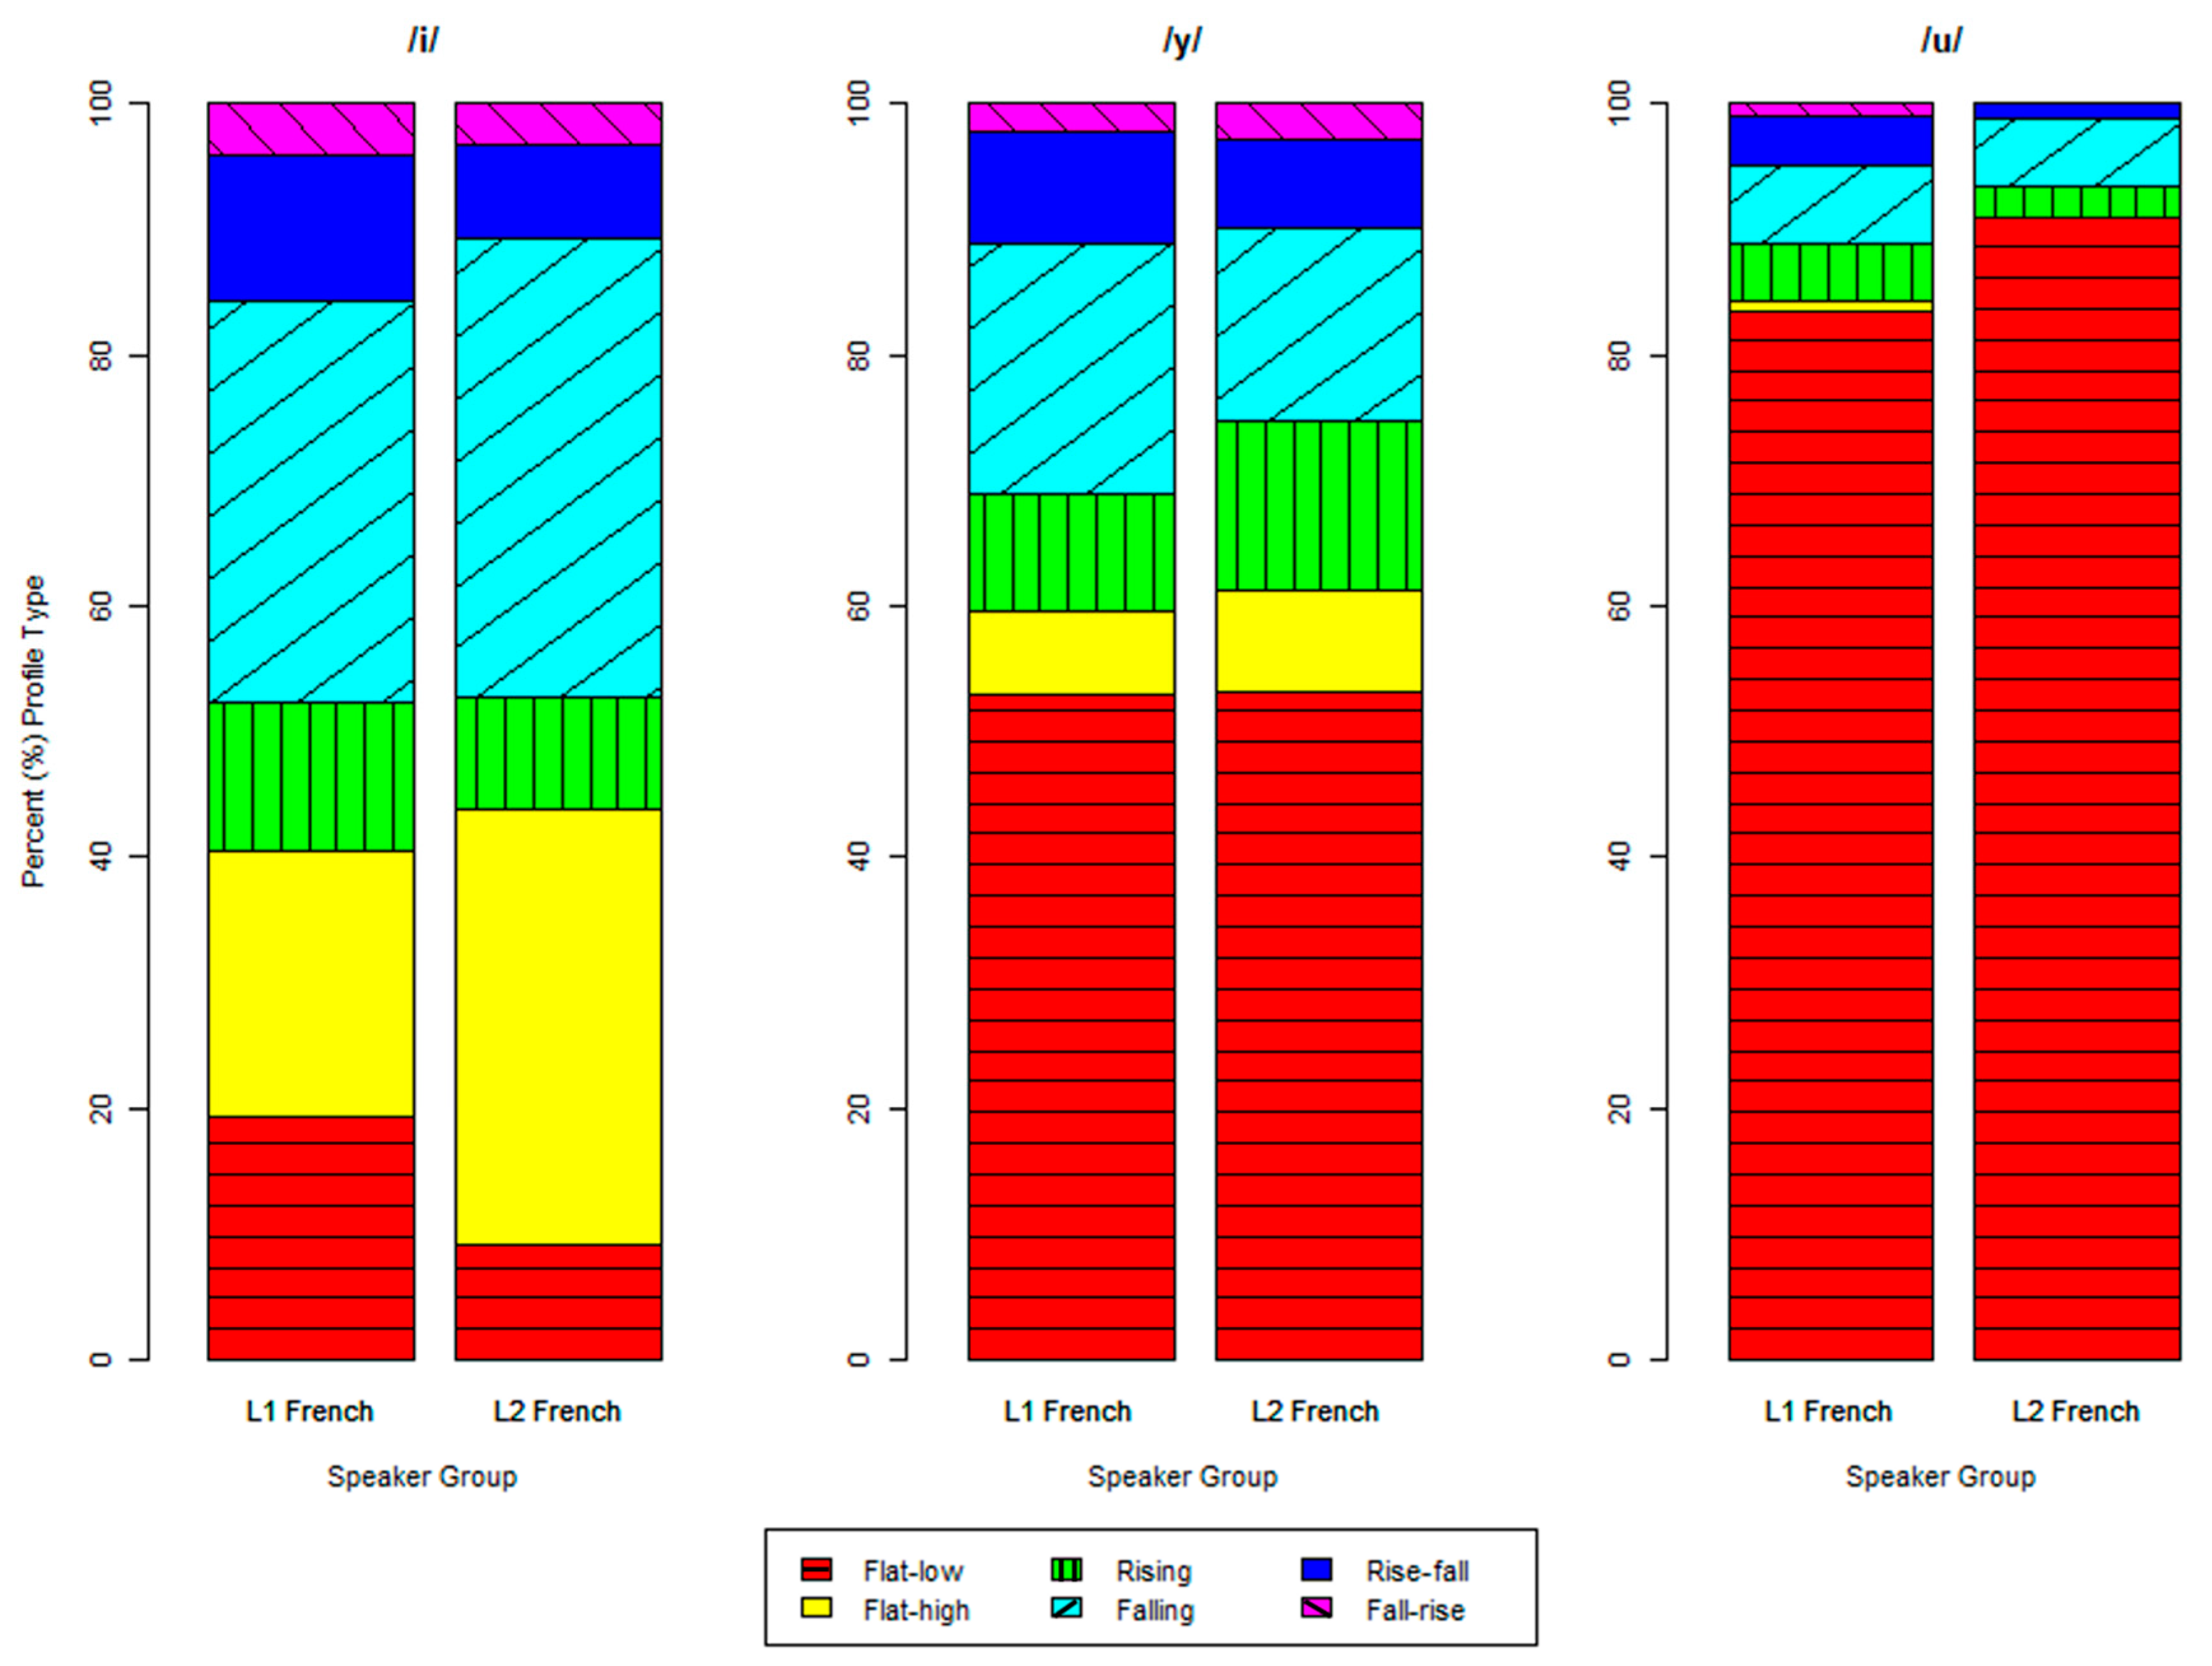
Results from a multinomial logistic regression, shown in Table 9, revealed significant interactions between all three variables. First, an interaction between vowel and speaker group was present, as shown in Figure 8, such that L1 and L2 speakers showed different distributions of profile type for /i/: L2 speakers showed lower rates of flat–low and higher rates of flat–high and falling, two profile types characterized by high initial energy, relative to L1 speakers. Additionally, L2 speakers utilized more rising tokens than L1 speakers for /y/, indicating that they started off at a low frequency but increased the intensity over the course of PFFE to approximate the high-energy fricative.
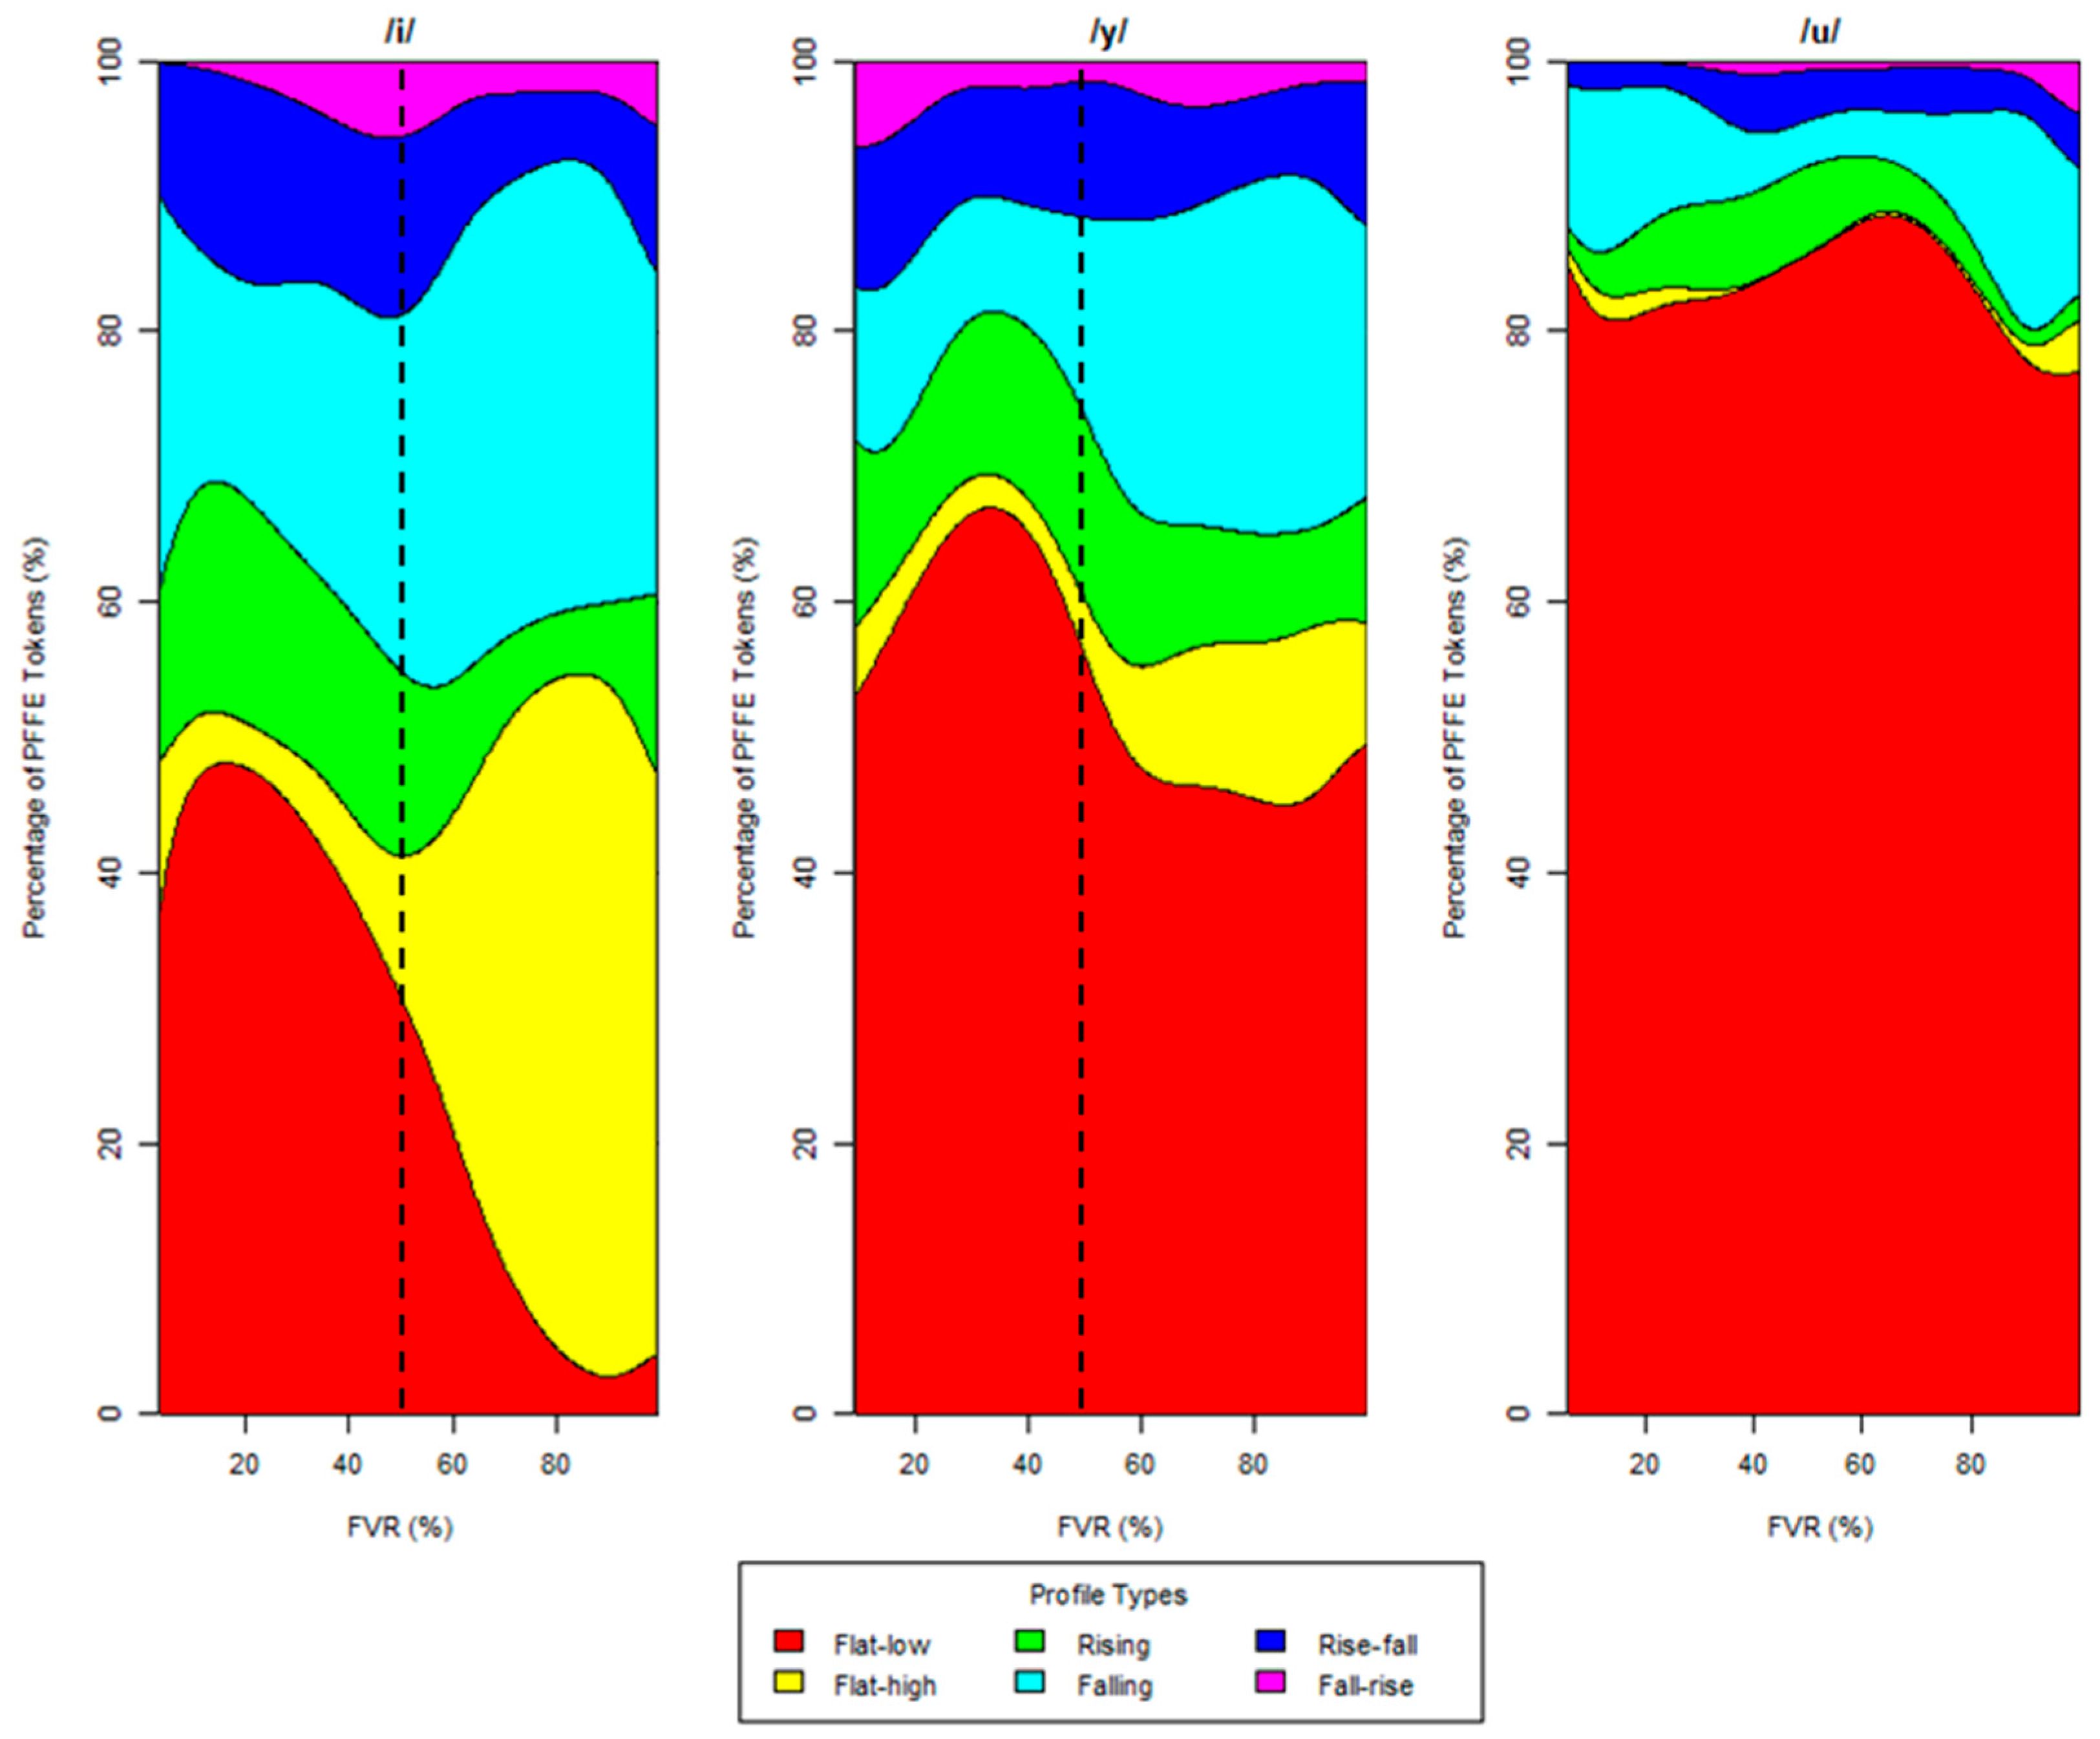
An interaction between vowel and FVR was also present, such that as FVR increased, the distribution of profile types changed for /i/ and /y/, as shown in the conditional density plot in Figure 9. Starting at approximately 50% FVR (indicated in the figure by a dotted line), flat–low tokens greatly decreased and flat–high tokens greatly increased for /i/, and the proportion of flat–high and falling tokens slightly increased for /y/.
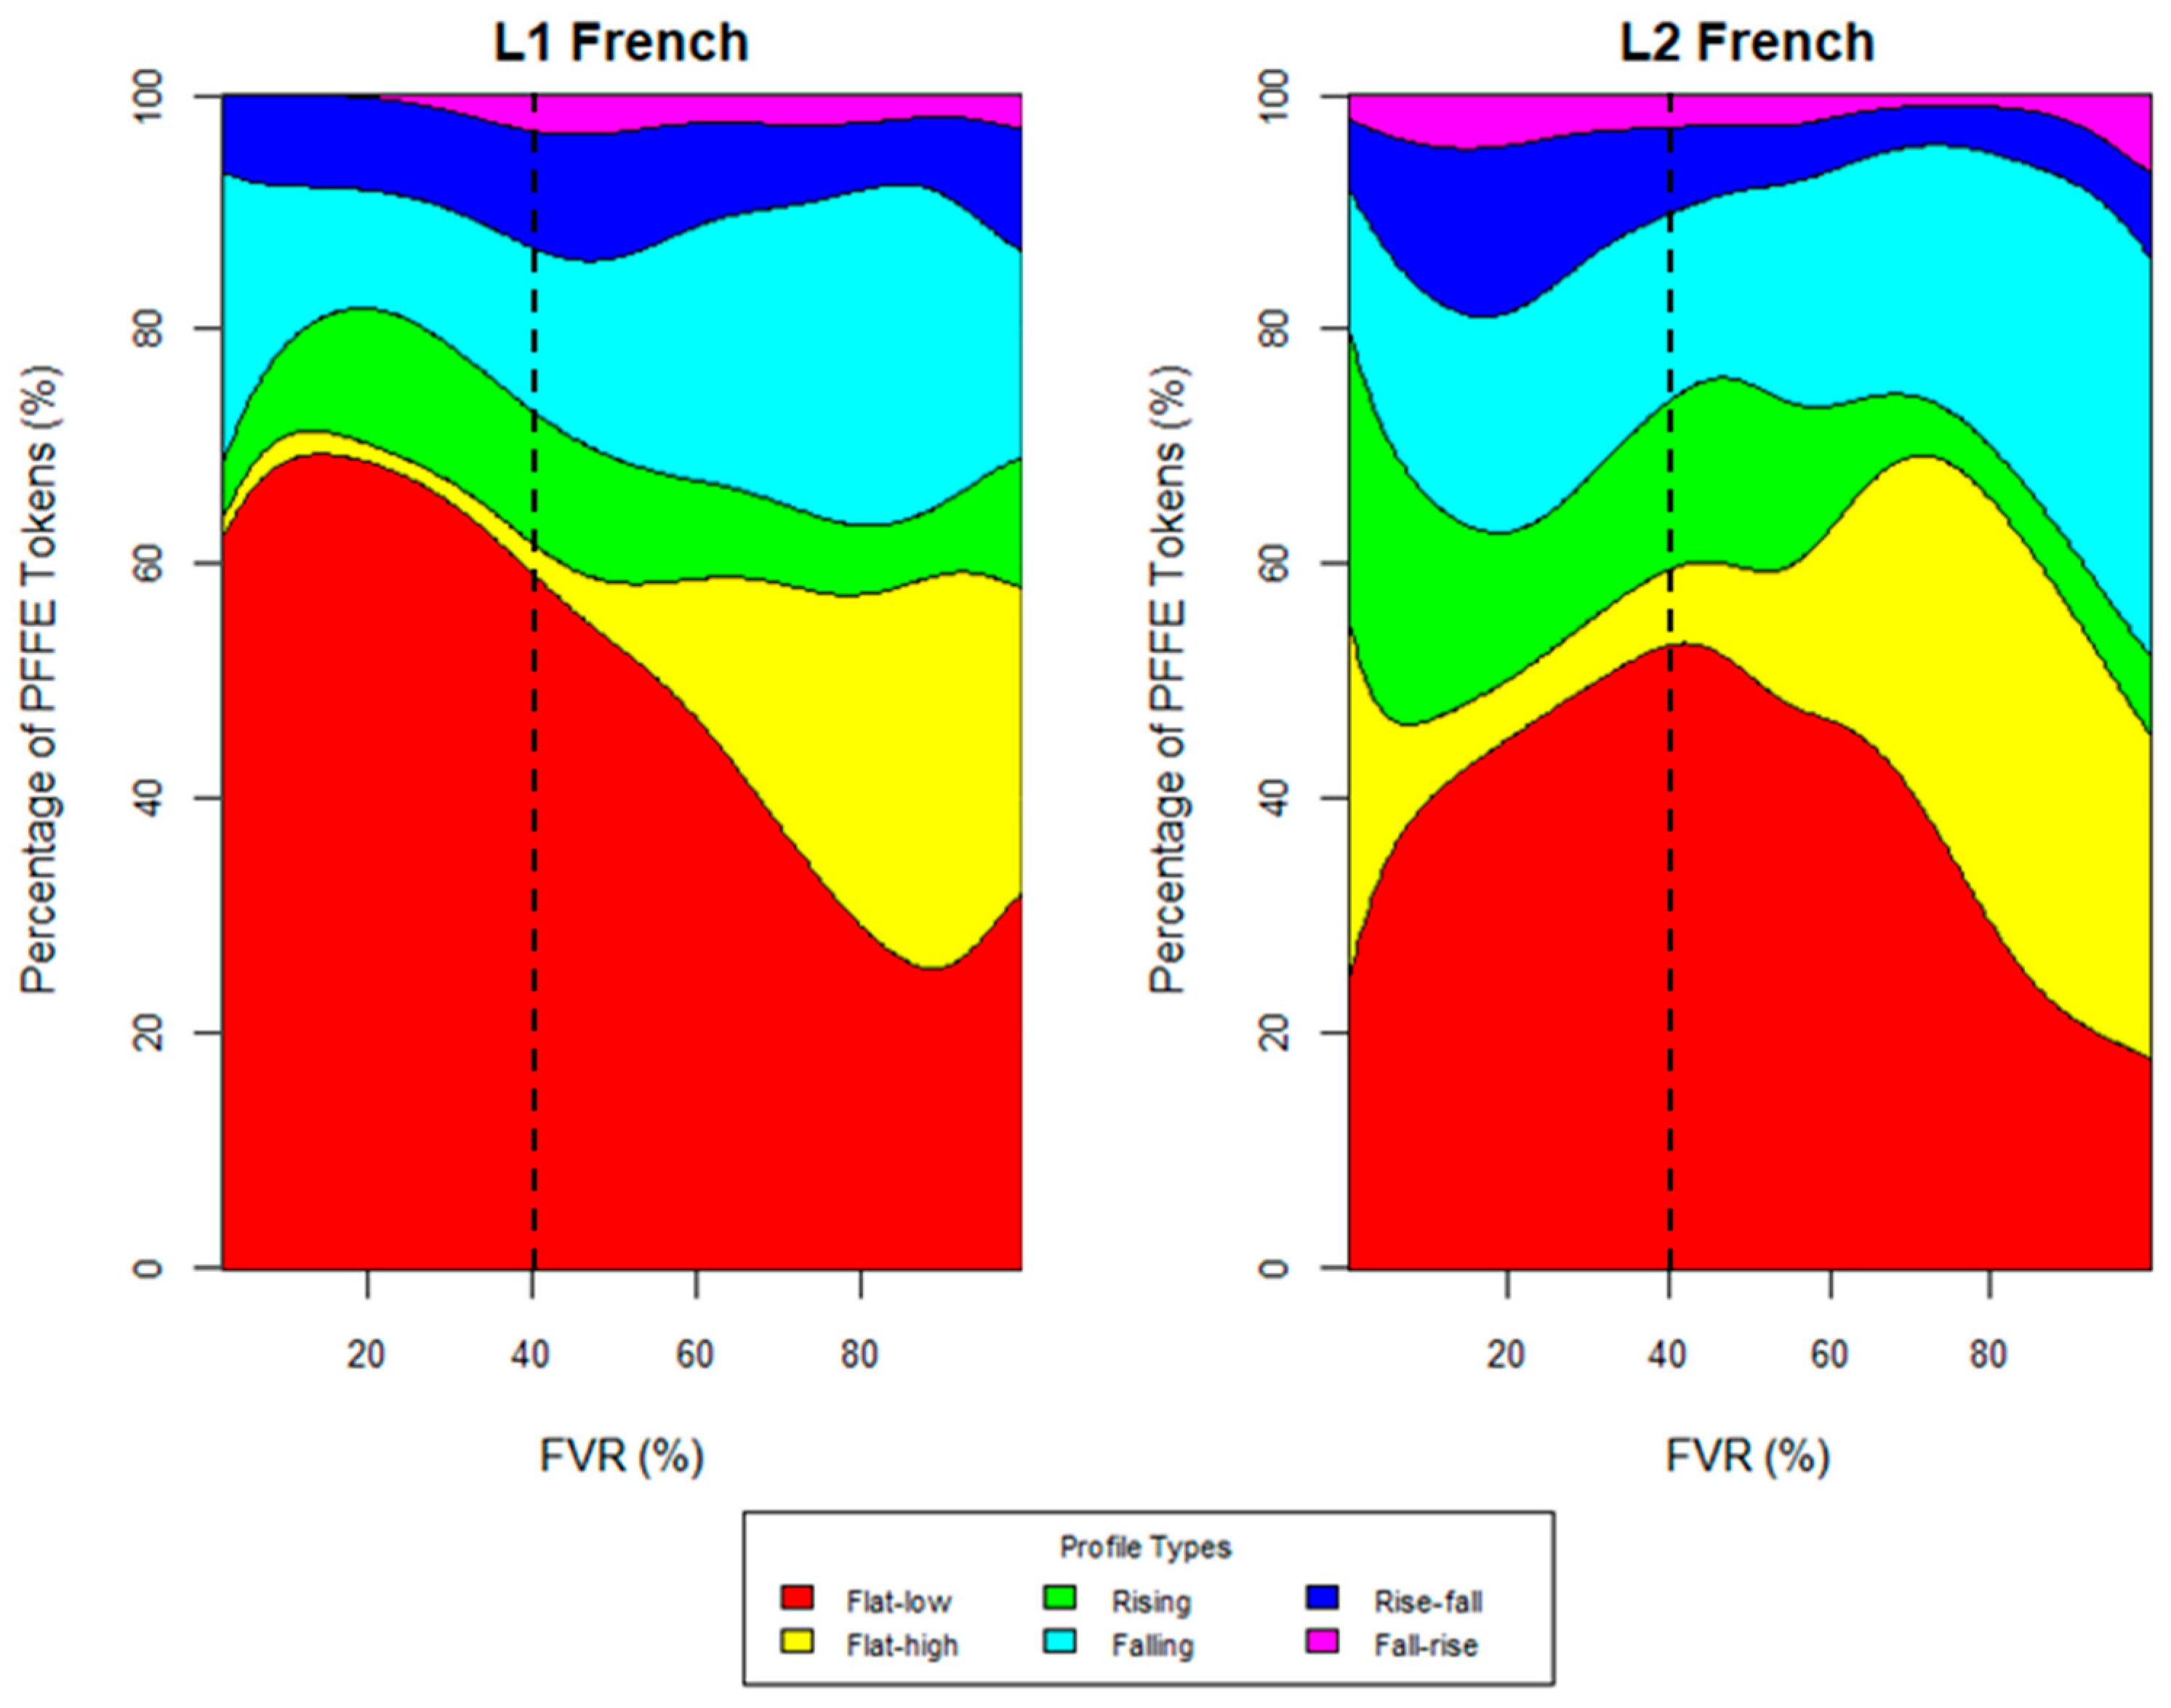
Finally, an interaction was present between speaker group and FVR, as shown in Figure 10. For FVRs ranging from approximately 40 to 100%, L1 and L2 speakers showed similar profile type distributions. From 0 to 40%, however, L1 speakers predominantly used a flat–low profile, while L2 speakers exhibited much greater variation.
4. Discussion
4.1. Vowel Findings
The interaction between vowel and FVR revealed that all high vowels in French do not exhibit PFFE uniformly in terms of its proportion relative to the length of the host vowel. Specifically, the spectral energy in PFFE occurring after vowels /i/ and /y/ showed variable acoustic behavior when the vowel was devoiced to a degree of 50% or more: for /i/, flat–low tokens markedly decreased and flat–high tokens markedly increased, while for /y/, flat–high and falling tokens slightly increased, although flat–low continued to account for a high proportion of tokens. This suggests several acoustic tendencies for PFFE in French. Firstly, the stark decrease in flat–low tokens and increase in flat–high tokens for PFFE in /i/ is indicative of higher-frequency, i.e., more salient, energy being associated with PFFE after /i/ with FVRs between 50 and 100%. When compared to the other lower-frequency, i.e., less salient, COG profiles of other vowels in the high vowel series, the height at which this phenomenon is phonologically most robust, it becomes clear that /i/ devoiced in such a way and to such an extent may be the canonical realization of the PFFE sociophonetic variable for L2 speakers (Dalola and Bridwell 2019). This an important assumption to make when considering L2 speakers’ production and distribution of the variable throughout because it may serve as a sort of underlying representation of the phenomenon, which L2 speakers use as a default following other more marked/phonetically dissimilar vowels across French and English where articulatory differences may arise (Delattre 1964). Additionally, the slight increase in flat–high and falling tokens in PFFE in /y/ with FVRs between 50% and 100% is also indicative of a preference for higher-frequency, i.e., more salient, energy, both throughout the segment, as in the case of flat–high, and at the onset of the segment, in the case of falling, but is less notable given that the overall increase is smaller.
4.2. Speaker Group Findings
The interaction between vowel and speaker group revealed that L1 and L2 French speakers do not realize PFFE uniformly in terms of vowel type. Specifically, the spectral energy in PFFE occurring after vowels /i/ and /y/ showed variable acoustic behavior across speaker group: for /i/, L2 speakers used lower rates of flat–low and higher rates of flat–high and falling, two profile types characterized by high initial energy when compared to L1 realizations, while for /y/, L2 speakers employed more rising tokens than L1s, indicating a build in intensity throughout the course of PFFE to approximate a higher-energy fricative. Both of these findings, when considered in concert with the vowel findings from this study, seem to suggest that L2 speakers may be hyperarticulating PFFE after vowels /i/ and /y/, perhaps as a reflection of how they how understand the phenomenon to sound as a stand-alone segment, i.e., as it does in its most salient form—after vowel /i/ with an FVR between 50 and 100%. Given the relatively lower-energy profiles found in L1 PFFE occurring after these same vowels, the patterning of this phenomenon across speaker groups can be nicely accounted for via Lindblom’s (1990) H & H Theory, in which speakers vary articulatory clarity according to the information needs of their listener. In this account, the L1 speakers, influenced by phonological context and without a need to communicate sociophonetic information to their unknown, imagined L1 listener (Bell 1984), manifest a sort of hypospeech that is underarticulated and focused on rendering the speech just intelligible enough to be recognized, while L2 speakers, wanting to accurately realize the text but also wishing to signal to their L1 listener their awareness of PFFE as a sociophonetic marker of polished French, manifest a sort of hyperspeech that not only renders optimally intelligible phonemic articulations but overemphasizes certain phonetic features at the expense of maximum articulatory effort. This theory is supported by the previous work examining L1 versus L2 perceptions of the variable, in which it was found that L2 speakers construe PFFE as being associated with features of TRUSTWORTHINESS and FORMALITY (Dalola 2016; in progress), the second of which has notable social capital for advanced L2 speakers using the L2 in their daily and/or professional life. Similar sociophonetic behavior has been found in white Southern Americans using hyperarticulated [hw] to index educatedness (Bridwell 2019), a phonetic behavior characterized by increased duration of the fricative portion of the segment.
The interaction between FVR and speaker group revealed that L1 and L2 French speakers do not exhibit PFFE uniformly in terms of its proportion relative to the length of the host vowel. Specifically, the spectral energy in PFFE occurring at different FVRs showed variable acoustic behavior across speaker group: for FVRs ranging from approximately 40 to 100%, L1 and L2 speakers showed similar profile type distributions; for FVRs ranging from 0 to 40%, however, L1 speakers predominantly used a flat–low profile, while L2 speakers exhibited much greater, i.e., higher frequency, more salient, variation. This finding observes another instance of L1 speakers favoring low-energy profiles in the articulation of PFFE, while L2 speakers exhibit more and different higher-energy profiles. This is not only consonant with the H & H Theory (Lindblom 1990) offered above but also highlights the greater degree of variation among the L2 population, which may be suggestive of varied exposure times and degrees of involvement in L1 communities where the use of sociophonetic variables, including PFFE, are robust (Dalola and Bullock 2017).
4.3. Implications for Sociophonetic Competence
In light of the findings from this study, we are now able to add an additional parameter to the definition of “sociophonetic competence,” as laid out by Dalola and Bullock (2017). Previous work on the sociophonetic variable of PFFE in CF has demonstrated that it is not enough for L2 speakers to have awareness of a sociophonetic variable in their L2 for them to use it at similar rates or durations as their L1 counterparts, or even in the same types of pragmatic and phonological contexts. This study has instead identified an additional dimension of L2 mastery, namely that of phonetic quality of use. Such a mastery at the level of production would also imply a heightened sensitivity to the perception of these sound variations, affording speakers the ability to decode an additional layer of meaning in an L2. Previous sociophonetic work examining COG has demonstrated its ability to work in concert with other parameters to index information about the speaker. Zimman (2017) found COG measures to be a marker of masculine voices when considered alongside f0, while Dalola and Bridwell (forthcoming) found COG measures in conjunction with measures of intensity (loudness), to be a marker of L1- or L2-French speaker status. Taken together, it is possible that COG values in French PFFE may not only be indicative of speaker group status, but also constructs of gender.
Whereas the acoustic energy of PFFE realizations seems to vary allophonically for L1 French speakers, that is to say, as predicted purely by phonological context and ease of articulation, it seems to vary sociophonetically and pragmatically for L2 speakers, that is to say, as conditioned by the desire for speakers to signal their sociophonetic awareness to native listeners at structurally and pragmatically acceptable moments.
4.4. Future Directions
Future studies will sample advanced L2 French populations more robustly and subdivide their level of advancedness via quantitative measures, i.e., the Bilingual Language Profile (Birdsong et al. 2012). This study originally benefited from a more balanced sample across speaker groups, but we later elected to filter out individuals from the L2 category because they did not meet our most stringent criteria (they had not lived abroad in a francophone country for a period of 2 or more years). In restricting the L2 group to the most “advanced” of our sample, we hoped to get the clearest picture of whether or not there were any speaker group differences, however, in doing so ended up diminishing some of our predictive power. In addition, we propose that the current findings be tested via a series of perceptual studies that investigate the pragmatic values of PFFE with differing COG measures in both L1- and L2-French populations. In that way, we can isolate what phonetic components of PFFE contribute reliably to perceptual differences and which ones represent mere physiological variation. A subsequent analysis should compare the COG-motivated perceptual differences that exist between L1- and L2-French speakers in order to test the production findings presented in this analysis. Additionally, since COG (a common spectral moment used to diagnose fricatives) was found to be a meaningful descriptor and predictor for fricatives epithesized after phrase-final vowels, it stands to reason that the other spectral moments (standard deviation, skewness and kurtosis) may also be relevant metrics in characterizing the PFFE variable.
5. Conclusions
The present study has investigated spectral production differences in PFFE as produced by L1 and L2 speakers of French. It has suggested that, even at advanced levels of proficiency and similar rates of use, L2 users do not necessarily realize or distribute the subphonemic properties of sociophonetic variables in nativelike or consistent ways. Future research would do well to query the number and nature of these socially-conditioned subphonemic variables even more (Dalola and Bridwell, forthcoming; Dalola, forthcoming), with the goal of ultimately testing the percepts of their variable forms among both speaker populations.
Author Contributions
Conceptualization, A.D.; methodology, A.D.; software, K.B.; validation, A.D. and K.B.; formal analysis, A.D. and K.B.; investigation, A.D.; resources, A.D. and K.B.; data curation, K.B.; writing—original draft preparation, A.D. and K.B.; writing—review and editing, A.D. and K.B.; visualization, K.B.; supervision, A.D.; project administration, A.D.; funding acquisition, NA. All authors have read and agreed to the published version of the manuscript.
Funding
This research received no external funding.
Conflicts of Interest
The authors declare no conflict of interest.
References
- Bell, Allan. 1984. Language style as audience design. Language in Society 13: 145–204. [Google Scholar] [CrossRef]
- Birdsong, David, Libby M. Gertken, and Mark Amengual. 2012. Bilingual Language Profile: An Easy-to-Use Instrument to Assess Bilingualism. Austin: COERLL, University of Texas at Austin. [Google Scholar]
- Bridwell, Keiko. 2019. The Distribution of [ʍ]: An Acoustic Analysis of Sociophonetic Factors Governing the Wine-Whine Merger in Southern American English. Master’s thesis, University of South Carolina, Columbia, SC, USA. [Google Scholar]
- Candea, Maria. 2012. Au journal de RFI-chhh et dans d’autres émissions radiodiffusée-chhhs. Les épithèses consonantiques fricatives. Le Discours et la Langue 2: 136–49. [Google Scholar]
- Candea, Maria, Martine Adda-Decker, and Lori Lamel. 2013. Recent evolution of non-standard consonantal variants in French broadcast news. Interspeech, 412–16. [Google Scholar]
- Dalola, Amanda. 2014. Un drôle de bruit_hhh: A Sociophonetic Examination of the Production and Perception of Final Vowel Devoicing among L1 and L2 Speakers of French. Ph.D. dissertation, University of Texas, Austin, TX, USA. [Google Scholar]
- Dalola, Amanda. 2015a. An acoustic profile of phrase-final devoicing in Continental French. Paper presented at LSRL 45, UNICAMP, Campinas, Brazil, May 6–9. [Google Scholar]
- Dalola, Amanda. 2015b. The role of vowel type, preceding consonant and lexical frequency on final vowel devoicing in Continental French. Paper presented at ICPhS18, Glasgow, UK, August 10–14. [Google Scholar]
- Dalola, Amanda. 2016. When L1 & L2 French speakers perceive phrase-final vowel devoicing. Paper presented at NWAV 2016, Vancouver, BC, Canada, November 3–6. [Google Scholar]
- Dalola, Amanda, and Keiko Bridwell. 2019. The shape of [u]: Towards a typology of Final Vowel Devoicing in Continental French. Paper presented at ICPhS19, Melbourne, Australia, August 5–9. [Google Scholar]
- Dalola, Amanda, and Keiko Bridwell. forthcoming. Revisiting Sociophonetic Competence: Variable spectral moments in phrase-final fricative epithesis for L1 & L2 speakers of French. Submitted to Linguistics Symposium on Romance Languages (LSRL) Proceedings. Under review.
- Dalola, Amanda, and Barbara Bullock. 2017. On Sociophonetic Competence: Phrase-final Vowel Devoicing in Native and Advanced L2 Speakers of French. Studies in Second Language Acquisition 39: 769–99. [Google Scholar] [CrossRef]
- Dalola, Amanda. forthcoming. Bossy is in the ear of the beholder: Phrase-final fricative epithesis among L1 & L2 speakers of French. To be submitted to Journal of French Language Studies. In progress.
- Delattre, Pierre. 1964. Comparing the vocalic features of English, German, Spanish, and French. IRAL 2: 71–97. [Google Scholar] [CrossRef]
- Erker, Daniel G. 2010. A subsegmental approach to coda /s/ weakening in Dominican Spanish. International Journal of the Sociology of Language 203: 9–26. [Google Scholar] [CrossRef]
- Fagyal, Zsuzsanna. 2010. Accents de banlieue: Aspects prosodiques du français populaire en contact avec les langues de l’immigration. Paris: l’Harmattan. [Google Scholar]
- Fagyal, Zsuzsanna, and Christine Moisset. 1999. Sound change and articulatory release: Where and why are high vowels devoiced in Parisian French. ICPhS 14: 309–12. [Google Scholar]
- Flege, J. E. 1985. Production of /t/ and /u/ by monolinguals and French-English bilinguals. The Journal of the Acoustical Society of America 77: S85. [Google Scholar] [CrossRef]
- Flege, James E. 1987. The production of “new” and “similar” phones in a foreign language: Evidence for the effect of equivalence classification. Journal of Phonetics 15: 47–65. [Google Scholar] [CrossRef]
- Flege, James E., and James Hillenbrand. 1984. Limits on phonetic accuracy in foreign language speech production. The Journal of the Acoustical Society of America 76: 708–21. [Google Scholar] [CrossRef]
- Fónagy, Ivan. 1989. Le français change de visage? Revue Romane 24: 225–54. [Google Scholar]
- Fox, John. 2003. Effect Displays in R for Generalised Linear Models. Journal of Statistical Software 8: 1–27. Available online: https://www.jstatsoft.org/article/view/v008i15 (accessed on 12 August 2020). [CrossRef] [Green Version]
- Fox, John, and Jangman Hong. 2009. Effect Displays in R for Multinomial and Proportional-Odds Logit Models: Extensions to the effects Package. Journal of Statistical Software 32: 1–24. Available online: https://www.jstatsoft.org/article/view/v032i01 (accessed on 12 August 2020). [CrossRef] [Green Version]
- Fox, John, and Sanford Weisberg. 2019. An R Companion to Applied Regression, 3rd ed. Thousand Oaks: Sage, Available online: https://socialsciences.mcmaster.ca/jfox/Books/Companion/index.html (accessed on 12 August 2020).
- Kuznetsova, Alexandra, Per B. Brockhoff, and Rune H. B. Christensen. 2017. lmerTest Package: Tests in Linear Mixed Effects Models. Journal of Statistical Software 82: 1–26. [Google Scholar] [CrossRef] [Green Version]
- Lindblom, Björn. 1990. Explaining phonetic variation: A sketch of the H&H theory. In Speech Production and Speech Modelling. Dordrecht: Springer, pp. 403–39. [Google Scholar]
- Martin, Pierre. 2004. Dévoisement vocalique en français. La linguistique 40: 3–22. [Google Scholar] [CrossRef]
- Osborne, Jason W., and Anna B. Costello. 2009. Best practices in exploratory factor analysis: Four recommendations for getting the most from your analysis. Pan-Pacific Management Review 12: 131–46. [Google Scholar]
- Paternostro, Roberto. 2008. Le dévoisement des voyelles finales. Rassegna italiana di Linguistica applicata 3: 129–58. [Google Scholar]
- R Core Team. 2017. R: A Language and Environment for Statistical Computing. Vienna: R Found. Stat. Comput. [Google Scholar]
- Shadle, Christine H., and Sheila J. Mair. 1996. Quantifying spectral characteristics of fricatives. Paper presented at Fourth International Conference on Spoken Language Processing, ICSLP96, Philadelphia, PA, USA, October 3–6; vol. 3, pp. 1521–24. [Google Scholar]
- Smith, Caroline L. 2002. Prosodic Finality and Sentence Type in French. Language and Speech 45: 141–78. [Google Scholar] [CrossRef] [PubMed]
- Smith, Caroline L. 2003. Vowel Devoicing in Contemporary French. Journal of French Language Studies 13: 177–94. [Google Scholar] [CrossRef]
- Smith, Caroline L. 2006. In and Out of the Laboratory: Using a Variety of Data Sources to Study Variation Source in Speech [Poster]. Barcelona: LabPhon06. [Google Scholar]
- Toda, Martine. 2007. Speaker normalization of fricative noise: Considerations on language-specific contrast. Paper presented at ICPhS16, Saarbrücken, Germany, August 6–10; pp. 825–28. [Google Scholar]
- Venables, William N., and Brian D. Ripley. 2002. Modern Applied Statistics with S, 4th ed. New York: Springer. [Google Scholar]
- Zimman, Lal. 2017. Gender as stylistic bricolage: Transmasculine voices and the relationship between fundamental frequency and/s. Language in Society 46: 339–70. [Google Scholar] [CrossRef]
Figure 1.
PFFE on the spectrogram: venu ’came.’ The PFFE corresponds to the final, highlighted segment—characterized by the lack of a voicing band on the spectrogram and aperiodic energy on the waveform—which follows the articulation of the vowel [y], distinguished by its full formant structure on the spectrogram and periodic energy on the waveform.

Figure 2.
The segmentation of mie ‘crumb.’ With a full-vowel length of 287 ms and a fricative length of 171 ms, the FVR of this token is 59.6%.
Figure 2.
The segmentation of mie ‘crumb.’ With a full-vowel length of 287 ms and a fricative length of 171 ms, the FVR of this token is 59.6%.

Figure 3.
COG by vowel and FVR at all timepoints.

Figure 4.
COG by speaker group and FVR at all timepoints.

Figure 5.
Correlation plot showing residuals of profile type and vowel. Black circles represent positive correlation between variable level pairs, white circles represent negative correlation, and circle radius represents correlation strength.
Figure 5.
Correlation plot showing residuals of profile type and vowel. Black circles represent positive correlation between variable level pairs, white circles represent negative correlation, and circle radius represents correlation strength.

Figure 6.
Correlation plot showing residuals of profile type and speaker group.

Figure 7.
Correlation plot showing residuals of profile type and FVR.

Figure 8.
Profile types by vowel and speaker group.

Figure 9.
Profile types by vowel and FVR. Each plot shows the proportion of PFFE tokens belonging to each of the profile types at that combination of vowel and FVR. The dotted line at 50% indicates the approximate point at which the distributions of profile types for /i/ and /y/ shifted.
Figure 9.
Profile types by vowel and FVR. Each plot shows the proportion of PFFE tokens belonging to each of the profile types at that combination of vowel and FVR. The dotted line at 50% indicates the approximate point at which the distributions of profile types for /i/ and /y/ shifted.

Figure 10.
Profile types by speaker group and FVR. The dotted line at 40% indicates the approximate point at which the distribution of profile types shifted.
Figure 10.
Profile types by speaker group and FVR. The dotted line at 40% indicates the approximate point at which the distribution of profile types shifted.


Table 1.
Stimuli consonant onset sequences.
| Tokens per Sequence | Consonant Onset Sequences |
|---|---|
| 3 | /p,t,k,b,d,g,f,s,∫,v,z,ʒ,r,l,m,n,kr,tr,bl,gr,fl/ |
| 2 | /pl,pr,gl,dr,fr,ʒr,∫r/ |
| 1 | /ɥ,j,w,kl,bl,pɥ,tɥ,kɥ,bɥ,dɥ,fɥ,sɥ,nɥ,lɥ,lw,bw,fw,lw,nw,plɥ,trɥ/ |
Table 2.
Mixed-effects linear regression model for COG at Timepoint 1.
| Estimate (Lower, Upper CI) | p-values | ||
|---|---|---|---|
| (Intercept) | 536.48 (290.07, 799.00) | 0.000 | **** |
| Vowel /i/ | −402.40 (−662.95, −142.67) | 0.003 | ** |
| Vowel /u/ | −424.28 (−737.23, −113.54) | 0.008 | ** |
| Speaker group L2 French | 471.38 (77.59, 867.21) | 0.021 | * |
| FVR | 1976.94 (1626.89, 2311.18) | 0.000 | **** |
| Vowel /i/*Speaker group L2 French | 75.68 (−107.00, 258.11) | 0.417 | |
| Vowel /u/*Speaker group L2 French | −66.69 (−291.03, 155.82) | 0.559 | |
| Vowel /i/*FVR | 2014.23 (1630.57, 2398.79) | 0.000 | **** |
| Vowel /u/*FVR | −366.89 (−845.66, 113.37) | 0.134 | |
| Speaker group L2 French*FVR | −624.81 (−1111.46, −151.22) | 0.011 | * |
| ICC | 0.203 |
p-values: p < 0.1(.), p < 0.05 *, p < 0.01 **, p < 0.001 ***, p < 0.0001 ****.
Table 3.
Mixed-effects linear regression model for COG at Timepoint 2.
| Estimate (Lower, Upper CI) | p-values | ||
|---|---|---|---|
| (Intercept) | 563.21 (325.87, 807.26) | 0.000 | **** |
| Vowel /i/ | −253.95 (−510.67, 1.89) | 0.052 | . |
| Vowel /u/ | −237.01 (−545.61, 69.01) | 0.131 | |
| Speaker group L2 French | 578.10 (207.07, 951.79) | 0.003 | ** |
| FVR | 1909.12 (1561.90, 2237.86) | 0.000 | **** |
| Vowel /i/*Speaker group L2 French | 41.21 (−138.82, 220.98) | 0.654 | |
| Vowel /u/*Speaker group L2 French | −108.26 (−329.17, 110.93) | 0.335 | |
| Vowel /i/*FVR | 1745.19 (1367.24, 2124.07) | 0.000 | **** |
| Vowel /u/*FVR | −602.36 (−1074.00, −128.95) | 0.013 | * |
| Speaker group L2 French*FVR | −816.90 (−1289.63, −356.14) | 0.001 | *** |
| ICC | 0.184 |
p-values: p < 0.1(.), p < 0.05 *, p < 0.01 **, p < 0.001 ***, p < 0.0001 ****.
Table 4.
Mixed-effects linear regression model for COG at Timepoint 3.
| Estimate (Lower, Upper CI) | p-values | ||
|---|---|---|---|
| (Intercept) | 779.80 (573.07, 996.62) | 0.000 | **** |
| Vowel /i/ | −331.13 (−565.46, −97.37) | 0.006 | ** |
| Vowel /u/ | −171.56 (−453.86, 107.97) | 0.231 | |
| Speaker group L2 French | 489.36 (185.02, 795.53) | 0.002 | ** |
| FVR | 1381.23 (884.85, 1503.74) | 0.000 | **** |
| Vowel /i/*Speaker group L2 French | −21.91 (−186.36, 142.61) | 0.794 | |
| Vowel /u/*Speaker group L2 French | −200.51 (−402.05, −0.38) | 0.051 | . |
| Vowel /i/*FVR | 1381.23 (1035.80, 1726.98) | 0.000 | **** |
| Vowel /u/*FVR | −534.54 (−965.73, −101.90) | 0.015 | * |
| Speaker group L2 French*FVR | −573.72 (−980.56, −172.09) | 0.006 | ** |
| ICC | 0.133 |
p-values: p < 0.1(.), p < 0.05 *, p < 0.01 **, p < 0.001 ***, p < 0.0001 ****.
Table 5.
Profile categorization.
| Profile Type | Categorical COG Designations | Token Count | Token % |
|---|---|---|---|
| Flat-low | LLL | 2159 | 43.2% |
| Flat-high | MMM, HHH | 840 | 16.% |
| Rising | LLM, LLH, LMM, LMH, LHH, MMH, MHH | 438 | 8.8% |
| Falling | MLL, MML, HLL, HML, HMM, HHL, HHM | 1051 | 21.0% |
| Rise-fall | LML, LHL, LHM, MHL, MHM | 384 | 7.7% |
| Fall-rise | MLM, MLH, HLM, HLH, HMH | 123 | 2.5% |
Table 6.
Profile distribution by vowel, expressed in % of each vowel.
| Flat Low | Flat High | Rising | Falling | Rise-Fall | Fall-Rise | Total | n | |
|---|---|---|---|---|---|---|---|---|
| /i/ | 19.51 | 29.20 | 9.86 | 28.76 | 9.37 | 3.30 | 100.00 | 2436 |
| /y/ | 51.71 | 7.88 | 10.21 | 19.55 | 8.24 | 2.41 | 100.00 | 1371 |
| /u/ | 84.80 | 0.53 | 4.66 | 5.98 | 3.34 | 0.70 | 100.00 | 1138 |
| Overall | 43.22 | 16.82 | 8.77 | 21.04 | 7.69 | 2.46 | 100.00 | 4995 |
Table 7.
Profile distribution by speaker group, expressed in % of each group.
| Flat Low | Flat High | Rising | Falling | Rise-Fall | Fall-Rise | Total | n | |
|---|---|---|---|---|---|---|---|---|
| L1 | 44.39 | 15.39 | 8.66 | 20.82 | 8.23 | 2.51 | 100.00 | 3742 |
| L2 | 39.74 | 21.07 | 9.09 | 21.71 | 6.07 | 2.31 | 100.00 | 1253 |
| Overall | 43.22 | 16.82 | 8.77 | 21.04 | 7.69 | 2.46 | 100.00 | 4995 |
Table 8.
Profile distribution by FVR, expressed in % of each bin.
| Flat Low | Flat High | Rising | Falling | Rise-Fall | Fall-Rise | Total | n | |
|---|---|---|---|---|---|---|---|---|
| 0–20% | 52.56 | 5.13 | 11.54 | 17.95 | 10.26 | 2.56 | 100.00 | 78 |
| 20–40% | 60.58 | 3.42 | 11.66 | 13.56 | 8.87 | 1.90 | 100.00 | 789 |
| 40–60% | 53.16 | 5.14 | 11.46 | 17.07 | 9.74 | 3.43 | 100.00 | 1283 |
| 60–80% | 38.20 | 22.29 | 6.60 | 24.57 | 6.11 | 2.22 | 100.00 | 1848 |
| 80–100% | 25.28 | 33.20 | 6.82 | 25.78 | 6.8 | 2.11 | 100.00 | 997 |
| Overall | 43.22 | 16.82 | 8.77 | 21.04 | 7.69 | 2.46 | 100.00 | 4995 |
Table 9.
Multinomial logistic regression model for profile.
| Flat High | Rising | Falling | Rise-Fall | Fall-Rise | ||||||
|---|---|---|---|---|---|---|---|---|---|---|
| Est. | p | Est. | p | Est. | p | Est. | p | Est. | p | |
| (Intercept) | −5.772 | 00.000 | −2.533 | 0.000 | −2.968 | 0.000 | −2.665 | 0.000 | −4.504 | 0.000 |
| /y/ | 1.489 | 00.003 | 0.502 | 0.195 | 0.499 | 0.139 | 0.363 | 0.384 | 0.741 | 0.303 |
| /u/ | −0.264 | 0.863 | 0.436 | 0.399 | −0.242 | 0.618 | −0.532 | 0.388 | −1.332 | 0.339 |
| L2 French | 2.700 | 0.000 | −2.802 | 0.000 | 1.527 | 0.000 | 1.630 | 0.000 | 1.972 | 0.004 |
| FVR | 9.436 | 0.000 | 1.677 | 0.000 | 5.559 | 0.000 | 3.488 | 0.000 | 4.727 | 0.000 |
| /y/*L2 French | −1.078 | 0.000 | −0.130 | 0.657 | −1.153 | 0.000 | −0.555 | 0.095 | −0.315 | 0.526 |
| /u/*L2 French | −18.534 | 0.000 | −1.150 | 0.006 | −1.116 | 0.001 | −1.627 | 0.006 | −11.374 | 0.932 |
| /y/*FVR | −5.869 | 0.000 | −2.802 | 0.000 | −3.184 | 0.000 | −2.653 | 0.000 | −3.724 | 0.001 |
| /u/*FVR | −7.423 | 0.001 | −4.592 | 0.000 | −4.592 | 0.000 | −3.233 | 0.001 | −2.585 | 0.205 |
| L2 French*FVR | −2.322 | 0.000 | −1.935 | 0.002 | −10.030 | 0.052 | −2.118 | 0.002 | −2.280 | 0.035 |
Publisher’s Note: MDPI stays neutral with regard to jurisdictional claims in published maps and institutional affiliations. |
© 2020 by the authors. Licensee MDPI, Basel, Switzerland. This article is an open access article distributed under the terms and conditions of the Creative Commons Attribution (CC BY) license (http://creativecommons.org/licenses/by/4.0/).
Share and Cite
MDPI and ACS Style
Dalola, A.; Bridwell, K. Redefining Sociophonetic Competence: Mapping COG Differences in Phrase-Final Fricative Epithesis in L1 and L2 Speakers of French. Languages 2020, 5, 59. https://0-doi-org.brum.beds.ac.uk/10.3390/languages5040059
AMA Style
Dalola A, Bridwell K. Redefining Sociophonetic Competence: Mapping COG Differences in Phrase-Final Fricative Epithesis in L1 and L2 Speakers of French. Languages. 2020; 5(4):59. https://0-doi-org.brum.beds.ac.uk/10.3390/languages5040059
Chicago/Turabian StyleDalola, Amanda, and Keiko Bridwell. 2020. "Redefining Sociophonetic Competence: Mapping COG Differences in Phrase-Final Fricative Epithesis in L1 and L2 Speakers of French" Languages 5, no. 4: 59. https://0-doi-org.brum.beds.ac.uk/10.3390/languages5040059