Article

Europe’s Elite Football: Financial Growth, Sporting Success, Transfer Investment, and Private Majority Investors

Institute of Sport Economics and Sport Management, German Sport University Cologne, Am Sportpark Muengersdorf 6, 50933 Cologne, Germany
*
Author to whom correspondence should be addressed.
Int. J. Financial Stud. 2016, 4(2), 12; https://0-doi-org.brum.beds.ac.uk/10.3390/ijfs4020012
Submission received: 9 February 2016 / Revised: 18 May 2016 / Accepted: 19 May 2016 / Published: 2 June 2016

Abstract

:
Europe’s elite football clubs are a small group of about 30 clubs mostly originating from the Big Five leagues in England, Italy, Spain, Germany, and France. These clubs top Deloitte’s Football Money League ranking Europe’s top football clubs by revenues. They also win the vast majority of national and European football competitions, and account for the major share of FIFA World Cup appearances. Nevertheless, empirical analyses studying the antecedents of financial success of this peculiar sample are rare. This paper extends previous research by building an empirical model of financial performance and applying it to a unique, high-quality dataset of the top 30 EU football clubs by club revenues analyzed over ten consecutive seasons from 2004 to 2013. Fixed effects models are performed to account for time trends and club fixed effects. The results show that financial success is driven by national and international sporting success, as well as brand value; sporting success is driven by team investments, and team investments tend to be driven by (foreign) private majority investors.

1. Introduction

After almost two decades of sports economics research into the drivers of financial success in Europe’s professional football, the relationship between financial performance, sporting success, and transfer investments has been well studied in national leagues. Using samples from English football it has been shown that sporting success has a significant positive impact on revenues [1,2], and that national sporting success is mainly driven by team investments [1,3].
However, the last two decades have seen a structural change in club owners, financial incentives, and objectives. First, we have seen an influx of private investors into Europe’s top clubs [4,5]. These investors tend to have superior resources and are gaining in importance to stay competitive in Europe’s elite football [6]. A range of theoretical studies strengthen the argument that private investors drive team investment [7,8]. Also it has been argued that foreign investors may follow different objective functions [9]. Second, the introduction of the UEFA Champions League/UEFA Europa League and the growing price moneys have shifted financial incentives. Thus, few would argue that the role of international sporting success has outgrown the role of national sporting success for the top European teams [4,10,11,12]. Additionally, building brand equity has been shown to be important in driving merchandise and ticketing revenues of professional sports clubs [13,14].
This paper brings together a unique database of Europe’s elite football clubs with existing theories and empirical studies on the antecedents of financial success in national leagues. The purpose of this study is as follows: first, analyze the influence of national and international sporting success as well as brand value on club revenues of Europe’s elite football clubs. Second, investigate the effect of team investment on sporting success of Europe’s top clubs. Third, study the impact of (foreign) private majority owners on transfer investment.
Controlling for key exogenous variables not under the influence of managers, we perform fixed effects regressions of a balanced panel covering the top 30 European football clubs by 2013 revenues over the period from 2004 to 2013. We find that managers can contribute to transfer investments by attracting (foreign) private majority investors. Private majority investors, then, drive the sporting success which in turn drives revenues of the top sports clubs. National league administrators need to balance various interests including the league competitiveness in UEFA competitions on the one hand and the competitive balance within the national league on the other hand.
The rest of this paper is structured as follows: first, we review the financial success and current market trends in Europe’s elite football. Second, we review available literature on the antecedents of financial success and summarize the theoretical model. Afterwards, we present the empirical methodology and show the results. Finally, we summarize managerial implications and highlight limitations of our research and recommendations for further research.

2. Revenues and Financial Growth in Europe’s Elite Football

Europe’s elite football clubs are peculiar due to their superior revenues, but they have also been attributed to be particularly influenced by money-injecting private investors and to benefit from their brands achieving global reach. In 2012/13, Europe’s leading football clubs have generated revenues in excess of €100 m. Real Madrid is leading Deloitte’s Football Money League with revenues of €519 m, followed by FC Barcelona with €483 m and Bayern Munich with €431 m. The 30th club from the European Union by revenues—one Brazilian and two Turkish clubs have been excluded from the analysis due to missing historical data—is Aston Villa FC with €98 m. On average, the top 30 EU football clubs generated revenues of €215 m in 2013 compared to average revenues of only €100 m by the top five league clubs in Europe [15,16].
With respect to financial growth, Europe’s elite football clubs have grown at an average of 6% per year from 2004 to 2013 (Table 1). Paris Saint-Germain has been the fastest growing club with an average annual growth rate of 18.0%, while Manchester City with 16.1% p.a. and FC Barcelona with 14.6% p.a. are the next teams. All but two teams, AS Roma and Newcastle United, have grown over the entire period. Two thirds of the clubs are owned by private majority investors. A bit more than half of the clubs are estimated to have a brand value in excess of €100 m [17]. Only four of the top 30 clubs (VfB Stuttgart, Everton FC, Valencia CF, Benfica), and none of the top 15 clubs by revenues, have neither been owned by private majority investors nor did they have a brand value in excess of €100 m in 2013.
The relationship between revenues and financial growth indicates a growing gap between Europe’s leading football clubs and its followers (Figure 1). Dietl and Franck [18] found growing revenue asymmetries in Europe’s “Big Five” leagues. Our data indicate that this phenomenon has escalated among the top 30 EU football clubs. Revenues in 2012/13 and 10-year growth rates are strongly correlated (r = 0.613). While the top 30 revenue-generating clubs have grown, on average, by 6.0% per year, the top 15 clubs have grown by 7.9% p.a., the top ten clubs have grown by 9.5% p.a., and the top five clubs have grown by 11.7% p.a. This compares to the bottom 15 clubs (4.3% p.a.), the bottom ten clubs (4.0% p.a.), and the bottom five clubs (3.8% p.a.).

3. Relevance of Europe’s Elite Football Clubs from a Sporting Perspective

In addition to superior revenues and growth rates, Europe’s top 30 football clubs also dominate national and European club competitions. This elite sample has won over 90% of total national league titles in the “Big Five” European leagues from 2004 to 2013 (Table 2). In England, Italy, and Spain, the top 30 clubs have won all titles. In Germany, Werder Bremen won the title in 2004, and—although not part of the top 30 clubs anymore—they used to be at the beginning of the 2000s. VfL Wolfsburg, the German champion in the 2008/09 season, does not publish its revenues, but estimates are that it would be part of the top 30 clubs. Thus, the French Ligue 1 is the only one of the “Big Five” leagues with smaller teams winning the championship during the observation period.
In the UEFA Champions League the top 30 clubs account for 88% of all half finalists between 2004 and 2013 (Table 3). The last non-top 30 club to win the Champions League was FC Porto in 2004, and the last non-top 30 team to reach the semi-final was FC Villareal in 2006. Since then, Europe’s top 30 clubs represented all semi-finalists.
In the 2014 FIFA World Cup, the top 30 clubs have provided the majority of players (Figure 2). They account for over 50% of appearances in the elimination round. The further the cup proceeded, the higher was the share of appearances by players from top 30 clubs. They account for about two thirds (66%) of end round appearances by the quarter finalists, around three quarter (73%) of appearances by the half finalists, and over 80% of appearances by the finalists. Germany, the later World Champion, built on players of which more than 90% (93%) originated from top 30 clubs.

4. Strategies in Europe’s Elite Football

4.1. Contests and the Economics of Overinvestment

Before analyzing the strategies in Europe’s elite football, it is worth to review the contest nature of European football and the economics of overinvestment. In his seminal article, Neale [19] was the first to determine the mutual interdependence of sports clubs competing with each other in national leagues. Canes [20] extended this work, and found that improvements in team quality by one team create externalities to all other teams and incentivize those clubs to improve their team quality in turn. Akerlof [21] developed the metaphor of the rat race which refers to an inefficient competition for rewards in which competitors increase their effort levels despite fixed outputs. Following the increasing commercialization in European football through the introduction of the English Premier League in 1992/93 and the new payout system in the Champions League in 2000/01, sports economists increasingly adopt this analogy to explain the unprofitable nature of European professional football despite escalating revenues [8,22]. Dietl et al. [23] develop a contest-theoretical model to study the problem of overinvestment. They determine that clubs compete by investments and that the competitive interaction among clubs leads to overinvestment into teams which, in turn, results in a dissipation of overall league revenues. Having discussed that clubs compete by spending power, we will next summarize two strategies to accumulate financial resources.

4.2. Global Brands: Non-Sport Related Income

The first strategy is based on owning a global brand that is powerful enough to generate sufficient revenues from merchandising, ticketing, and international broadcasting [13,14]. According to the annual Brand Finance [17] report on the world’s most valuable football brands, the market is dominated by a small number of very strong brands (Table 4). Bayern Munich is the most valuable brand valued at €668 m. Manchester United is valued at €650 m and Real Madrid at €483 m. Only 16 teams are valued at a brand value in excess of €100 m including six clubs from England, four from Germany, three clubs from Italy and two from Spain. Ajax Amsterdam is the only team in this elite circle not originating from one of the “Big Five” leagues. The slogan of these teams may sound like “The rich get richer” or “Grow global”. Neale [19] (p. 13) was the first to identify that professional sports leagues are characterized by economies of scale.

4.3. Sugar Daddies: Spending Power Through Financial Resources of Private Majority Owners

The influence of sugar daddies on the financial success of clubs is disputed between supporters of the resource-based view and property rights theory and supporters of the expropriation theory. On the one hand, sugar daddies have been argued to be a successful financing strategy by attracting financial resources from private majority investors [6,7]. This model is the dominating one in England, Italy, France, Spain, Russia, and Eastern Europe. In Germany, the “50+1 rule” generally prevents private majority investors taking over control of a club, although certain exceptions exist. The beneficial effect of money-injecting private investors is rooted on two main pillars: (1) the private financial resources of the owner; and (2) incentives to invest these resources into the team.
First, financial resources have been shown to be a scarce resource in amateur and professional football [24,25]. Building on the resource-based view of a firm [26], Gerrard [24] has shown that the financial performance of teams is significantly affected by their ownership status. The net worth of European football team owners is regularly estimated by Forbes magazine. For example, the foreign majority owners of Manchester City (Sheikh Mansour bin Zayed Al Nahyan, $29.7 bn), Chelsea FC (Roman Abramovich, $10.2 bn), and Manchester United (the Glazer family, $4.4 bn) are all assumed to be billionaire owners. In the absence of any team income, they would be able to pay the club’s bills out of their pockets for numerous seasons. In total, 12 of 20 Premier League teams in the 2014/15 season are owned by billionaire owners highlighting the importance of private wealth by owners. In 2011, Conn [27] found that English football club owners have injected £2.3 bn into their clubs.
Second, private majority investors have been argued to have superior incentives to invest in their team compared to clubs with dispersed ownership or clubs owned by member associations [7]. The incentive structure of team investments is theoretically explained with the help of new institutional economics. According to property rights theory, a company structure is fundamentally determined through the three rights of residual control, residual claim, and transfer right [28,29]. Private majority owners concentrate all of these rights, and can thus minimize transaction costs and the welfare loss due to externalities [30] (pp. 354–355) [31]. In the case of private majority investors, the owners are able to exercise superior control and direct their investments to maximize their personal utility.
Having discussed the positive impact of sugar daddies, majority shareholders may not always exercise their superior power in the best interest of the club. The expropriation theory argues that high ownership concentration may lead to majority shareholders taking advantage of their position and making decisions against the interests of minority shareholders and other related parties [32]. Supporters of the expropriation theory may refer to several cases of fraud and financial mismanagement in European football to support their argument. For example, clubs’ majority owners have played key roles in the match-fixing scandal in Italian football (Calciopoli) in 2006. Similarly, Olympiakos Piraeus owner Evangelos Marinakis has been alleged of directing a criminal organization controlling Greek football in 2015. Furthermore, financial mismanagement of club owners may also lead to clubs going bankrupt or entering insolvency proceedings. Football clubs with private owners have been found to be in worse financial health and be less likely to comply with Financial Fair Play rules compared to publicly traded clubs [9,33].
To sum up, sugar daddies have been argued to successfully increase the club’s spending power and team investments, but their involvement may be associated with agency problems and financial dependence.

5. Theoretical Framework and Literature Review

5.1. Financial Success

Since the end of the 1990s, there is a growing theoretical and empirical research stream analyzing the relationship between financial success and national sporting success. Szymanski and Smith [1] develop a theoretical model of the financial performance of English professional football clubs from 1974 to 1989 subject to demand and production constraints. They show, first, a linear relationship between profit margins and league performance, and, second, that revenue is a function of league performance measured as log odds ratio of league position. Szymanski and Kuypers [3] (p. 165) use regression analysis to show that league position drives revenues (R2 = 0.89) of English Football League Clubs. In a newer dataset, Garcia-del-Barrio and Szymanski [34] analyze the optimizing behavior of Spanish and English professional football clubs from 1994 to 2004. Adopting the theoretical model of Szymanski and Smith [1], they estimate ordinary least squares (OLS) and fixed effects (FE) models and find for both leagues that clubs are closer to win than to profit maximization. Dobson and Goddard [2] apply co-integration and causality tests to 77 Football League clubs with ongoing league membership from 1946 to 1994. In contrast to Szymanski and Smith [1] and Szymanski and Kuypers [3], they find more evidence that causality goes from lagged revenue to performance than from performance to revenues.
While the above literature has concentrated on the relationship between financial success and national sporting performance, the awards of international club competitions have outgrown those from national competitions. Szymanski [12] (p. 204) puts it into a nutshell by stating that “[t]here is no doubt that the big clubs view success in the Champions League as their primary objective.” Particularly, the change in the payout system of the UEFA Champions League has shifted incentives from national to international competitions and generated a small group of elite clubs in Europe [10,12]. Teams participating in UEFA competitions are able to generate direct revenues through success and participation bonuses from UEFA. Additionally, they can generate indirect revenues from gaining new international fans and sponsors [12].
While sports economists tend to agree that sporting success is the primary driver of financial success, researchers and practitioners have also recognized a growing importance of brand investments [3,35]. Gladden and Milne [13] show that brand equity has a significant positive impact on merchandise revenues of American major league clubs. They stress the long-term nature of brand building in contrast to the mostly short-term strategy of win generation which neglects important aspects of the consumer experience. Czarnitzki and Stadtmann [36] analyze clubs from the first German football league, and find through a Tobit model that the reputation of clubs positively influences stadium attendance. Bauer et al. [37] use an online questionnaire (n = 1594 people) and show a positive impact of brand equity on attendance in German football in the 2003/04 season. Pawlowski and Anders [14] extend the model by Czarnitzki and Stadtmann [36] and find evidence of a positive impact of the away team’s brand strength and uncertainty of the championship outcome in the 2005/06 season in the German Bundesliga.
Hypothesis 1: 
Financial success (revenue) of Europe’s elite football clubs is positively impacted by national sporting success (league points per game; cup wins), international sporting success (UEFA coefficients), and commercial success (brand value). 

5.2. National/International Sporting Success

A large research stream has documented a positive impact of team investments on sporting success. Accounting for club-fixed effects, Szymanski and Smith [1] found a positive influence of log relative wages on the log odds of league position in English football. Szymanski and Kuypers [3] extended this model, and showed that both team wage bills and net annual transfer spending positively drive sporting success. Later research has confirmed these insights for European football and American major leagues (e.g., [34,38,39]). In an empirical study of 20 Greek football clubs from the top three divisions, Dimitropoulos and Limperopoulos [40] find evidence that team investments drive sporting success. Additionally, the model has been extended to managerial compensation [41,42,43].
Hypothesis 2 (and 3): 
Controlling for team quality, national (international) sporting success is positively impacted by team investments. 

5.3. Team Investments

Since the beginning of the decade, sports economists have devoted themselves to study the drivers of team investment. Franck [7] develops a comparative institutional analysis of governance structures and their impact on team investments. Building on new institutional economics [29,44], he finds that privately owned football clubs are superior in sourcing private funds and channeling them into the team. This reasoning is adopted by other theoretical studies which find a negative impact of regulatory measures, such as the German “50+1 rule” or the “UEFA Financial Fair Play” on team investments (e.g., [8,45]). Grossmann [46] explains the phenomenon of team investments exceeding profit-maximizing levels through evolutionarily-stable strategies as dominant strategies in the economic competition of football clubs for survival. Rohde and Breuer [5] apply property rights theory to an unbalanced panel from the English Premier League and find that private investors drive team investment and lower profits. They also show that this effect is mostly due to foreign majority investors, and argue that the nationality of owners may be seen as a proxy for the owners’ private wealth. Furthermore, foreign investors may pursue different objective functions. For example, US owners have been argued to be profit maximizers rather than win maximizers [9].
Hypothesis 4: 
If the regulatory regime allows the entry of (foreign) private majority investors, these have on average a positive influence on team investments. 
To sum up, our theoretical model on the antecedents of financial success is as follows. Financial success of Europe’s elite football clubs is driven by national league and cup success, international success in UEFA competitions, and brand equity. Sporting success of Europe’s top clubs is influenced by team investments and team quality. Finally, team investments are driven by the type of investors, while we need to control for the investment setting.

6. Method

6.1. Data Source and Collection

This article is based on a balanced panel of the top 30 EU football clubs by revenues according to the Deloitte Football Money League 2014. One Brazilian and two Turkish clubs have been excluded due to missing historical data. These clubs have been exchanged by the three following European clubs (Olympique Marseille, Everton FC, Aston Villa FC). Data have been gathered over a period of ten seasons from 2003/04 to 2012/13, creating a sample of n = 300 club-year-observations. Club and time scope have been chosen based on a careful trade-off between sample size and data availability.
The sample represents the peculiar group of Europe’s elite football clubs, a sub-group with distinct economics that has received only little attention in previous research. The results are neither generalizable to professional or amateur football nor to elite sports in other disciplines. Revenue data have been sourced from the annual publications of Deloitte’s Football Money League and amended by data from club financial accounts. Transfer data have been collected from a reliable database of transfer fees and market values in European professional football (http://www.transfermarkt.de). National and international performance data have been collected from the Kicker magazine and UEFA, respectively. Brand Finance has published brand values of the top European football clubs since 2004. The annual report is based on a consistent methodology measuring brand value as club value less fixed tangible assets (stadium, training ground), disclosed intangible assets (purchased players), and other non-disclosed intangible assets (developed players, goodwill). Input data for brand values include publicly available information (e.g., from Deloitte, Bloomberg, club annual reports) such as market share, market growth, and company financials. In contrast to other reports (e.g., by Futurebrand and Forbes), Brand Finance is the only source consistently covering the entire period. Information on club ownership has been sourced based on complementary information from English newspaper “The Guardian”, Forbes magazine, business registers and club financial accounts.

6.2. Measures

The measures we use are presented in Table 5. Financial success may be measured by profits or revenues. Since European football clubs are regularly argued to be win maximizers and data availability prevents the use of profits, we will measure financial success as revenues excluding transfer fees (REV). The natural log is used to account for the right-skewed distribution of the variable (LOGREV) [32,47]. National sporting success is operationalized as league points per game (LPPG) to control for the different number of games in the respective first national divisions and changes in the number of league games over time [48]. We also account for national cup success through a dummy variable for cup wins (CUPWIN). We expect these to drive merchandise and ticketing revenues. International sporting success is measured as UEFA coefficients excluding the country coefficient (UCEC) to account for the club-specific performance in the UEFA Champions League and the UEFA Europa League [49]. Clubs not competing in UEFA competitions are assigned a missing value rather than a coefficient of “0” to generate consistent estimates. Brand values (BRA_VAL) are used as presented by Brand Finance. Again the natural log is used to account for right-skewness (LOGBRA_VAL). We control for the broadcasting scheme through a dummy variable (TV_SCH) to account for the decentralized broadcasting in Spain and Italy (until 2009/10) which benefits the top national clubs in these countries. Finally, we also control for time trends and club-specific effects.
In the sporting success models, we use transfer investments rather than team salaries due to the availability of historical data across European leagues. Net team transfer investments (TRA_INV) are defined as transfer expenses less transfer income [3]. Similar to Garcia-del-Barrio and Szymanski [34], team quality is measured as lagged national (LPPG_LAG) and international sporting success (UCEC_LAG). Based on property rights and agency theory, the ownership structure is defined according to the stakes of the major owner in the club. We differentiate between private majority investors (INV_MAJ), private minority investors (INV_MIN), and other governance structures such as clubs fully owned by member associations. Additionally, we distinctively measure foreign majority owners (INV_MAJ_FOR) to account for different objective functions and, as a proxy, for the wealth of owners. In the transfer investment model, we control for the top personal income tax rate (INV_TAX) to reflect regulatory restrictions and incentives. Moreover, we control for takeovers of a club by a new majority owner (TAKEOVER). Baur and McKeating [49] analyzed the short- and long-term effects of initial public offerings on sporting success and found, on average, no significant effect with, or after, an IPO. In contrast to shareholder ownership imposing restrictions on excessive spending, private majority owners are often argued to be sugar daddies or benefactor owners that derive utility from winning and fame [50]. Thus, we hypothesize that new private majority owners also have a positive short-term effect on transfer investments.

6.3. Data Analysis

Our data analysis is divided into three parts. First, we present descriptive statistics of the variables used in the five models. Second, we show the variation of key decision variables in our model. Then, we perform regression analyses to determine the antecedents of financial success and test our hypotheses. Ordinary least squares (OLS) models with cluster-robust standard errors using clubid as a cluster variable are estimated for all five models. However, we assume OLS models to be potentially biased due to the existence of individual heterogeneity. To account for club-specific fixed effects βi, we also estimate fixed effects (FE) models with robust standard errors. Year dummies are added to account for time-fixed effects. Following Garcia-del-Barrio and Szymanski [34], lagged dependent variables are entered as regressors in the OLS and FE model allowing for a white noise error term. This variable can be interpreted as allowing for a short-term adjustment process. The basic regression equation underlying our models can be summarized as follows:
Y i t = α + β i t + t   =   2004 2013 ( y i t )   + ε i t
where Yit = LOGREVit (I), LPPGit (II), UCECit (III), TRA_INVit (IV), i = 1,…,30 indexes club and t = 2004, …, 2013 indexes year (reference variable: y10 = 2013).
All four equations might be argued to be subject to reverse causation. While Hall et al. [39] analyzed potential reverse causality in English football and did not find empirical evidence to support it, Dodson and Goddard [2] argued in favor of reverse causality of revenues and sporting success. Using the lagged dependent variables technique by Garcia-del-Barrio and Szymanski [34], we also perform a two-stage least squares (2sls) fixed effects instrumental variables (FE IV) estimation to control for potential multicollinearity. Thereby, the lagged dependent variables are instrumented. In the revenue equation (I), we use lagged transfer investments and lagged market values instead of lagged wages as instruments. Transfer fees and market values have been found to be highly correlated with and good proxies for wages in previous studies [43,51]. For the national sporting success equation (II), we use the lagged win percentage (WINPCT_LAG) and the minimum league points per game required for UEFA Champions League qualification (LPPG_UCLQUAL_LAG) as instruments for the lagged league points per game. The lagged win percentage has already been shown to be a feasible instrument in previous studies [34]. The number of qualification slots for the UEFA Champions League has been found to increase investment in talent [52]. For the international sporting success equation (III), we instrument the lagged UEFA coefficient with lagged participation in the UEFA Champions League (UCL_LAG) and the number of games played by the club in the competition (UCLGAMES_LAG). Finally, for the transfer investment equation (IV), lagged transfer investments are instrumented using the lagged number of new national players transferred to the club (NEWNTLPLAYERS_LAG). This measure accounts for both the quantity and quality of incoming players in the previous season and is strongly correlated with lagged transfer investments (r = 0.4). While some correlation of the instrument with the error term of the equation cannot be excluded, no better instrument has been available.
We perform tests for endogeneity [53,54,55] and the Stock and Yogo [56] test for weak instruments for all of our FEIV estimations using Stata’s “estat endogenous” and “estat firststage” modules. First, the Durbin and the Wu-Hausman statistics test the null hypothesis whether the endogenous variables should be treated exogenous. Second, following Bound, Jaeger, and Baker [57], we judge the correlation of the instruments and the instrumented variable using the partial R-square statistic. Higher R-square values indicate stronger instruments and the IV estimators are less biased. Third, Stock and Yogo [56] suggest two criteria to judge whether instruments are weak. On the one hand, weak instruments may cause biased estimations. On the other hand, hypothesis tests with IV estimators may suffer from size distortions. The null hypothesis of both tests is that the instruments are weak. If the test statistics exceed a critical value, they can be considered as not weak.

7. Results and Discussion

7.1. Descriptive Statistics

Table 6 provides the descriptive statistics of the key variables. In the period 2004 to 2013, the top 30 clubs generated revenues of €164.5 m. In the national leagues, they scored 1.78 points per game—about 60% of all possible points. About 13% of clubs won the national cup in the respective season. In 75% of observations (n = 225), clubs participated in UEFA competitions which further highlights the dominant role of these clubs in European football. On average, clubs in the sample have spent €14.4 m more on incoming players than they received for outgoing players per season. About three quarters of observations refer to clubs owned by majority investors, and more than 20% of observations refer to clubs owned by foreign majority investors. The average brand value amounts to €158.9 m.

7.2. Variation

The variation of the team ownership is shown in Table 7. The variation from the individual average shows that private majority ownership is characterized by higher between variation (41.2%) than within variation (14.3%). The same applies to minority ownership and foreign majority ownership. This indicates that team ownership is rather stable over time. The decomposition of counts into between and within variation shows that 95% of clubs ever being owned by a private majority investor have always been so. The transition probabilities show that for the 23.7% of observations not referring to clubs owned by private majority investors, 4.48% have been taken over by majority owners in the next period. Furthermore, about 3.7% of clubs have been taken over by foreign majority investors in the next season. All clubs owned by majority investors remained so during the observation period. Due to the low within variation of team ownership, results should be interpreted with caution.

7.3. Panel Regression

The results of the OLS model with cluster-robust standard errors, the FE model, and the 2sls FE IV model for the revenue equation are summarized in Table 8. The FE model shows that national league success, international sporting success, and brand value all have a highly significant and positive influence on revenues. Additionally, national cup success is shown to have a weakly significant and positive impact on revenues. The fit of the FE model (R2 = 0.84) indicates a high explanatory power. The post-estimation tests for the 2sls FE IV model show that the null hypothesis of exogeneity of the lagged dependent variable (logrev_lag) is rejected at the 10% level by the Durban test, while the null hypothesis of the Wu-Hausman test cannot be rejected at the 10% level. Based on the Durban test, we consider the endogenous regressor in fact as endogenous, and use the 2sls FE IV model for inference. Furthermore, the partial R-square of 0.23 indicates a moderate strengths of the instruments [57]. The Stock and Yogo [56] test indicates that our instruments (tra_inv_lag, logmv_lag) are appropriate to the degree of the F-statistic (15.27) exceeding the threshold of the 15%-level Wald test (11.59). Controlling for potential reverse causality, the 2sls FE IV model confirms the positive impact of national league and international sporting success at the 0.1% level, of national cup success at the 1% level, and of brand value at the 10% level. The presented results for the financial success model are in line with findings from previous research [14,34]. That is, we have shown that the standard model of financial success in European professional football also holds true for the sample of Europe’s elite football clubs. However, in addition to the national league success, brand management, national cup success and international sporting success also need to be considered when modelling the managerial influence on revenues in Europe’s elite football clubs. logrev_lag tra_inv_lag tra_inv_lag.
Table 9 summarizes the results of the sporting success models. Controlling for team quality through lagged sporting success, we find that team transfer investments positively influence both league points per game (p < 0.05) and UEFA coefficients (p < 0.1). The explanatory power of the national sporting success model (R2 = 0.13) and the international sporting success model (R2 = 0.16) with fixed effects is moderate. As identified elsewhere, transfer fees do not fit the performance data as closely as wages [43]. However, no other data have been available for the top 30 clubs. Furthermore, team market values which could be a proxy for wages are not available for the entire sample period. As anticipated by previous literature, the post-estimation tests for the FEIV model of the national sporting success equation reveal that the lagged dependent variable (lppg_lag) is subject to some exogeneity. Given the requirement of the FE IV model by the lagged dependent variable approach, the 2sls FE IV model provides a robustness check for the FE model, but results need to be interpreted with caution. On the other hand, the post-estimation tests for the international sporting success model clearly recommend the use of the FE IV model for inference. For both models, the partial R-squares and the Stock and Yogo [56] tests shows that our instruments are appropriate. Given the above considerations, the 2sls FE IV models confirm the results of the FE models for both sporting success equations. Transfer investments are shown to have a strongly significant and positive impact on both league points per game (p < 0.001) and UEFA coefficients (p < 0.05). Our results are in accordance with previous empirical studies on the drivers of national sporting success in European professional football [34,41]. Moreover, our results show that this relationship can be transferred to success in UEFA competitions. This result has been expected given the growing importance of UEFA competitions for Europe’s elite football clubs [10,12].
The results of the team investment models are summarized in Table 10. Controlling for income tax rates, the FE model shows that foreign majority investors have a significant and positive effect on net team transfer investments (p < 0.01). The general majority investor dummy has the expected positive sign, but is insignificant.1 No significant effect can be observed for minority investors. Additionally, the control variables have the expected signs. The higher the tax rate, the lower are team investments (p < 0.01). Takeovers have a weakly significant (p < 0.1) and positive impact on transfer investments. The low model fit (R2 = 0.10) can be attributed to the small sample size and the low variation in ownership structure discussed above. As for the national sporting success model, the post-estimation tests for the 2sls FE IV model again show a certain degree of exogeneity of the endogenous regressor and, thus, require caution with respect to inference. While the partial R-square of 0.12 indicates a low to medium strength of lagged new national players as instrument [57], the Stock and Yogo [56] test confirms the validity of our instruments. The 2sls FE IV model confirms the results of the FE model. Thus, our results provide support for the insights of previous theoretical studies which argued in favor of a positive influence of private owners on team investments [7,46]. However, in line with Rohde and Breuer [5], our results show that the positive impact of private majority owners on team investments can mostly be reduced to foreign majority investors. While our database does not allow controlling for the financial resources of owners over time, our results provide supporting evidence for the relevance of managerial incentives for investments by team owners [7]. We also see support for the expropriation theory. While, on average, clubs with majority owners tend to grow faster than other clubs, we can also find indications supporting financial mismanagement and lost interest by club owners leading to reduced or negative growth. In line with previous findings [9,33], the six teams in our sample with the lowest growth rates are all owned by private investors (see Table 1).

8. Conclusions

8.1. Summary of Study

This study analyzed the antecedents of financial success in Europe’s elite football clubs. These clubs are peculiar due to their superior revenues and growth rates, brands achieving global reach, and dominating performance in national and European club competitions. We found empirical evidence that causal relationships established in the standard literature of European professional football are also applicable to Europe’s elite football clubs. For example, national sporting success has a positive and significant impact on revenues, and national sporting success is primarily driven by team investments. Additionally, however, Europe’s top 30 football clubs also need to pay attention to international sporting success and brand management to drive revenues. Furthermore, we provided empirical evidence for theoretical studies hypothesizing a positive impact of private majority investors on team investments. This impact, however, can mainly be reduced to foreign majority investors. Next to the long-term impact of private majority investors, our results indicate there is also a short-term positive impact of a takeover on team investments.

8.2. Managerial Implications

Controlling for variables not under the direct influence of team management, we found that managers can increase team investments by attracting wealthy private majority investors. This is particularly relevant to clubs which are not (yet) supported by a large global fan base. The strategy is aimed at increasing the team quality and thereby raising the sporting success. However, investor-owned clubs have also been associated with potential fraud and financial mismanagement. These should be considered when attracting majority owners.
Clubs maximizing financial success need to balance sporting success in national and international competitions and maximizing brand values. For example, decisions on player or coach transfers may be determined not only by the playing talent, but also by its contribution to the team’s brand equity. Moreover, the workload of clubs playing in UEFA competitions may require club managers and players to tradeoff their effort in various competitions. In turn, national leagues and the UEFA need to compete with each other, for example, through financial incentives and their payout scheme, to attract the full effort by clubs.
National league administrators may draw conclusions with respect to the top clubs in its league which typically represents the league in UEFA competitions and determine the league competitiveness. Thereby, regulators face a tradeoff between league competitiveness and competitive imbalance within the national league. On the one hand, the top clubs may help the league to increase the number of qualifying slots for the UEFA Champions League and Europa League. Thus, national regulators may facilitate the international sporting success of its clubs by incentivizing transfer investments (as far as allowed within UEFA Financial Fair Play). Additionally, given the long-term trend towards more and more clubs being acquired by private majority investors and the positive effect of takeovers on team investments, regulators and league administrators willing to grow aggregated club revenues and increase the competitiveness of its league, and especially of its top clubs, are well advised to welcome new club owners. This concerns, for example, the German “50+1 rule” which generally prevents the entry of majority investors. On the other hand, national league administrators are generally interested to keep the risk of insolvencies low and maintain a certain degree of competitive balance.

8.3. Limitations and Recommendations for Further Research

This paper was among the first to analyze the antecedents of financial success of Europe’s elite football clubs. However, the study is subject to a few limitations that require a careful interpretation of results and provide opportunities for future research. First, we have not been able to control for the financial resources of owners, since public estimates on the private wealth of international team owners rarely go beyond the selective estimates by Forbes magazine. Future research may focus on cross-sectional analyses on the financial impact of the private wealth of Premier League club owners, which is fairly well documented. Second, the endogenous variables of the national sporting success and the transfer investment equations are subject to some exogeneity and, thus, the model conclusions need to be interpreted carefully. Third, this research has analyzed the impact of owners on team investments. Since owners may pursue different objective functions, the ownership structure may also influence the profitability of Europe’s top clubs. While Dimitropoulos and Tsagkanos [33] pursued a first study on the impact of managerial and institutional ownership on profitability, future empirical studies are encouraged to evaluate the effect of different ownership structures in more depth. Fourth, further research is recommended to analyze the impact of regulatory measures such as the “UEFA Financial Fair Play” rules on team investment. Furthermore, future studies focusing on regulatory implications may use competitive balance measures, such as the Herfindahl-Hirschman Index (HHI), rather than sporting success measures. In that way, future research may study if the historic success of teams matters as well. Furthermore, we relied on the brand values published by Brand Finance. While we are convinced that these figures are the most reliable figures available, the authors of the report only provide limited transparency on the exact calculation. Finally, this paper has focused on the sub-sample of Europe’s elite football clubs. The applicability of insights on international sporting success and team investments to professional or amateur football may be tested by replicating the study with different samples.

Acknowledgments

The authors thank Bernd Frick, Tim Pawlowski, four anonymous reviewers, and the participants of the 2015 conference by the German Sports Economics Association for helpful comments.

Author Contributions

Marc Rohde collected and analyzed the data and wrote the first draft of the paper; Christoph Breuer provided valuable feedback on data estimation and the first paper draft.

Conflicts of Interest

The authors declare no conflict of interest.

Abbreviations

The following abbreviations are used in this manuscript:
FIFA:Fédération Internationale de Football Association
UEFA:Union of European Football Associations
OLS:Ordinary least squares
FE:Fixed effects
2sls:Two-stage least squares
FE IV:Fixed effects instrumental variables
HHI:Herfindahl–Hirschman Index

References

  1. S. Szymanski, and R. Smith. “The English Football Industry: Profit, performance and industrial structure.” Int. Rev. Appl. Econ. 11 (1997): 135–153. [Google Scholar] [CrossRef]
  2. S.M. Dobson, and J.A. Goddard. “Performance and revenue in professional league football: Evidence from Granger causality tests.” Appl. Econ. 30 (1998): 1641–1651. [Google Scholar] [CrossRef]
  3. S. Szymanski, and T. Kuypers. Winners & Losers—The Business Strategy of Football. London, UK: Penguin Books, 1999. [Google Scholar]
  4. N. Scelles, B. Helleu, C. Durand, and L. Bonnal. “Professional sports firm values: Bringing new determinants to the foreground? A study of European soccer, 2005–2013.” J. Sports Econ., 2014. [Google Scholar] [CrossRef]
  5. M. Rohde, and C. Breuer. “The Financial Impact of (Foreign) Private Investors on Team Investments and Profits in Professional Football: Empirical Evidence from the Premier League.” Appl. Econ. Finance 3 (2016): 243–256. [Google Scholar] [CrossRef]
  6. S. Kuper. “How to be an elite club?—and will the losers go bust and disappear? Roundtable: “Perspectives and Economic Challenges for Elite Football Clubs”.” Barcelona, Spain: IESE Business School, 2009. Available online: http://www.iese.edu/en/ad/sp-sp/armandcarabnworkshoponfootballeconomics.asp (accessed on 19 August 2014).
  7. E. Franck. “Private Firm, Public Corporation or Member’s Association Governance Structures in European Football.” Int. J. Sport Finance 5 (2010): 108–127. [Google Scholar]
  8. E. Franck. “„Zombierennen“ und „Patenonkel“—Warum deutsche Fussballklubs in der Champions League den Kürzeren ziehen.” CRSA Working Paper 36 (2010): 1–13. Available online: http://econpapers.repec.org/paper/isowpaper/0124.htm (accessed on 4 February 2014). [Google Scholar]
  9. R. Wilson, D. Plumley, and G. Ramchandani. “The relationship between ownership structure and club performance in the English Premier League.” Sport Bus. Manag. Int. J. 3 (2013): 19–36. [Google Scholar] [CrossRef]
  10. T. Pawlowski, C. Breuer, and A. Hovemann. “Top Clubs’ Performance and the Competitive Situation in European Domestic Football Competitions.” J. Sports Econ. 11 (2010): 186–202. [Google Scholar] [CrossRef]
  11. N. Scelles, B. Helleu, C. Durand, and L. Bonnal. “Determinants of professional sports firm values in the United States and Europe: A comparison between sports over the period 2004–2011.” Int. J. Sport Finance 8 (2013): 280–293. [Google Scholar]
  12. S. Szymanski. “The Future of Football in Europe.” In Sports Economics after Fifty Years: Essays in Honour of Simon Rottenberg. Edited by P. Rodriguez, S. Kesenne and J. Garcia. Oviedo, Spain: University of Oviedo Press, 2007. [Google Scholar]
  13. J.M. Gladden, and G.R. Milne. “Examining the Importance of Brand Equity in Professional Sport.” Sport Mark. Q. 8 (1999): 21–29. [Google Scholar]
  14. T. Pawlowski, and C. Anders. “Stadium attendance in German professional football—The (un)importance of uncertainty of outcome reconsidered.” Appl. Econ. Lett. 19 (2012): 1553–1556. [Google Scholar] [CrossRef]
  15. Deloitte. Annual Review of Football Finance: A Premium Blend. Manchester, UK: Deloitte & Touche, 2014. [Google Scholar]
  16. Deloitte. Football Money League: All to Play for. Manchester, UK: Deloitte & Touche, 2014. [Google Scholar]
  17. Brand Finance. Football 50: The Annual Report on the World’s Most Valuable Football Brands. London, UK: Brand Finance Plc., 2013. [Google Scholar]
  18. H.M. Dietl, and E. Franck. “Warum Investitionswettläufe und wachsende Erlösasymmetrien das Geschäftsmodell des europäischen Profifußballs zunehmend belasten.” Zeitschrift Führung + Organisation 6 (2006): 333–337. [Google Scholar]
  19. W.C. Neale. “The Peculiar Economics of Professional Sports: A Contribution to the Theory of the Firm in Sporting Competition and in Market Competition.” Q. J. Econ. 78 (1964): 1–14. [Google Scholar] [CrossRef]
  20. M.E. Canes. “The social benefits of the restrictions on team quality.” In Government and the Sports Business. Edited by R.G. Noll. Washington, DC, USA: The Brookings Institution, 1974, pp. 77–114. [Google Scholar]
  21. G. Akerlof. “The Economics of Caste and of the Rat Race and Other Woeful Tales.” Q. J. Econ. 90 (1976): 599–617. [Google Scholar] [CrossRef]
  22. J.C. Müller, J. Lammert, and G. Hovemann. “The Financial Fair Play regulations of UEFA: An adequate concept to ensure the long-term viability and sustainability of European club football.” Int. J. Sport Finance 7 (2012): 117–140. [Google Scholar]
  23. H.M. Dietl, E. Franck, and M. Lang. “Overinvestment in Team Sports Leagues: A Contest Theory Model.” Scott. J. Political Econ. 55 (2008): 353–368. [Google Scholar] [CrossRef]
  24. B. Gerrard. “A resource-utilization model of organizational efficiency in professional sports teams.” J. Sport Manag. 19 (2005): 143–169. [Google Scholar]
  25. P. Wicker, and C. Breuer. “Scarcity of resources in German non-profit sport clubs.” Sport Manag. Rev. 14 (2011): 188–201. [Google Scholar] [CrossRef]
  26. B. Wernerfelt. “A resource-based view of the firm.” Strateg. Manag. J. 5 (1984): 171–180. [Google Scholar] [CrossRef]
  27. D. Conn. “Record income but record losses for Premier League.” The Guardian, 19 May 2011. [Google Scholar]
  28. A.A. Alchian. “Some Economics of Property Rights.” In Economic Forces at Work. Edited by A.A. Alchian. Indianapolis, IN, USA: Liberty Press, 1977, pp. 127–149. [Google Scholar]
  29. P. Milgrom, and J. Roberts. Economics, Organization and Management. Englewood Cliffs, NJ, USA: Prentice-Hall, 1992. [Google Scholar]
  30. H. Demsetz. “Toward a Theory of Property Rights.” Am. Econ. Rev. 57 (1967): 347–359. [Google Scholar]
  31. A. Picot, H. Dietl, and E. Franck. Organisation—Eine ökonomische Perspektive, 5th ed. Stuttgart, Germany: Schäffer-Poeschel Verlag, 2008. [Google Scholar]
  32. A. Shleifer, and R. Vishny. “A survey of corporate governance.” J. Finance 52 (1997): 737–783. [Google Scholar] [CrossRef]
  33. P.E. Dimitropoulos, and A. Tsagkanos. “Financial Performance and Corporate Governance in the European Football Industry.” Int. J. Sport Finance 7 (2012): 280–308. [Google Scholar]
  34. P. Garcia-del-Barrio, and S. Szymanski. “Goal! Profit Maximization versus Win Maximization in Soccer.” Rev. Ind. Organ. 34 (2009): 45–68. [Google Scholar] [CrossRef]
  35. A. Baroncelli, and U. Lago. “Italian Football.” J. Sports Econ. 7 (2006): 13–28. [Google Scholar] [CrossRef]
  36. D. Czarnitzki, and G. Stadtmann. “Uncertainty of outcome versus reputation: Empirical evidence for the first German football division.” Empiri. Econ. 27 (2002): 101–112. [Google Scholar] [CrossRef]
  37. H.H. Bauer, N.E. Sauer, and P. Schmitt. “Customer-based brand equity in the team sport industry: Operationalization and impact on the economic success of sport teams.” Eur. J. Mark. 39 (2005): 496–513. [Google Scholar] [CrossRef]
  38. D. Forrest, and R. Simmons. “Team Salaries and Playing Success in Sports: A Comparative Perspective.” In Sportökonomie. Edited by H. Albach and B. Frick. Wiesbaden, Germany: Gabler Verlag, 2002, pp. 221–238. [Google Scholar]
  39. S. Hall, S. Szymanski, and A.S. Zimbalist. “Testing Causality between Team Performance and Payroll: The Cases of Major League Baseball and English Soccer.” J. Sports Econ. 3 (2002): 149–168. [Google Scholar] [CrossRef]
  40. P.E. Dimitropoulos, and V. Limperopoulos. “Player contracts, athletic and financial performance of the Greek football clubs.” Glob. Bus. Econ. Rev. 16 (2014): 123–141. [Google Scholar] [CrossRef]
  41. B. Frick. “Die Voraussetzungen sportlichen und wirtschaftlichen Erfolges in der Fußball-Bundesliga.” In Business-to-Business-Marketing im Profifußball. Edited by M. Bieling, M. Eschweiler and J. Hardenacke. Wiesbaden, Germany: Deutscher Universitätsverlag, 2004, pp. 71–93. [Google Scholar]
  42. B. Frick, and R. Simmons. “The impact of managerial quality on organizational performance: Evidence from German soccer.” Manag. Decis. Econ. 29 (2008): 593–600. [Google Scholar] [CrossRef]
  43. S. Szymanski. “Wages, transfers and the variation of team Performance in the English Premier League.” In Proceedings of the VI Gijon Conference on Sports Economics, Gijon, Spain, 6–7 May 2011.
  44. E.F. Fama, and M.C. Jensen. “Agency Problems and Residual Claims.” J. Law Econ. 26 (1983): 327–349. [Google Scholar] [CrossRef]
  45. M. Sass. “Glory Hunters, Sugar Daddies, and Long-Term Competitive Balance under UEFA Financial Fair Play.” J. Sports Econ. 17 (2016): 148–158. [Google Scholar] [CrossRef]
  46. M. Grossmann. “Evolutionarily Stable Strategies in Sports Contests.” J. Sports Econ. 16 (2015): 108–121. [Google Scholar] [CrossRef]
  47. J. Mincer. Schooling, Experience, and Earnings. New York, NY, USA: Columbia University Press, 1974. [Google Scholar]
  48. D. Coates, B. Frick, and T. Jewell. “Superstar Salaries and Soccer Success: The Impact of Designated Players in Major League Soccer.” J. Sports Econ., 2014. [Google Scholar] [CrossRef]
  49. D.G. Baur, and C. McKeating. “Do Football Clubs Benefit from Initial Public Offerings? ” Int. J. Sport Finance 6 (2011): 40–59. [Google Scholar]
  50. E. Franck, and M. Lang. “A theoretical analysis of the influence of money injections on risk taking in football clubs.” Scott. J. Political Econ. 61 (2014): 430–454. [Google Scholar] [CrossRef]
  51. B. Frick. “Salary determination and the pay-performance relationship in professional soccer: Evidence from Germany.” In Sports Economics after Fifty Years: Essays in Honour of Simon Rottenberg. Edited by S. Rodriguez, S. Kesenne and J. Garcia. Oviedo, Spain: Ediciones de la Universidad de Oviedo, 2006, pp. 125–146. [Google Scholar]
  52. C. Green, F. Lozano, and R. Simmons. “Rank-order tournaments, probability of winning and investing in talent: Evidence from champions’ league qualifying rules.” Natl. Inst. Econ. Rev. 232 (2015): R30–R40. [Google Scholar] [CrossRef] [Green Version]
  53. J. Durbin. “Errors in Variables.” Rev. Int. Stat. Inst. 22 (1954): 23–32. [Google Scholar] [CrossRef]
  54. J.A. Hausman. “Specification tests in econometrics.” Econometrica 46 (1978): 1251–1271. [Google Scholar] [CrossRef]
  55. D.-M. Wu. “Alternative tests of independence between stochastic regressors and disturbances: Finite sample results.” Econometrica 42 (1974): 529–546. [Google Scholar] [CrossRef]
  56. J.H. Stock, and M. Yogo. “Testing for weak instruments in linear IV regression.” In Identification and Inference for Econometric Models: Essays in Honor of Thomas Rothenberg. Edited by D.W.K. Andrews and J.H. Stock. New York, NY, USA: Cambridge University Press, 2005, pp. 80–108. [Google Scholar]
  57. J. Bound, D.A. Jaeger, and R.M. Baker. “Problems with instrumental variables estimation when the correlation between the instruments and the endogenous explanatory variable is weak.” J. Am. Stat. Assoc. 90 (1995): 443–450. [Google Scholar] [CrossRef]
  • 1Without the foreign majority investor dummy, private majority investors are shown to have a positive and significant impact on team investments at the 5% level. Results are available upon request.
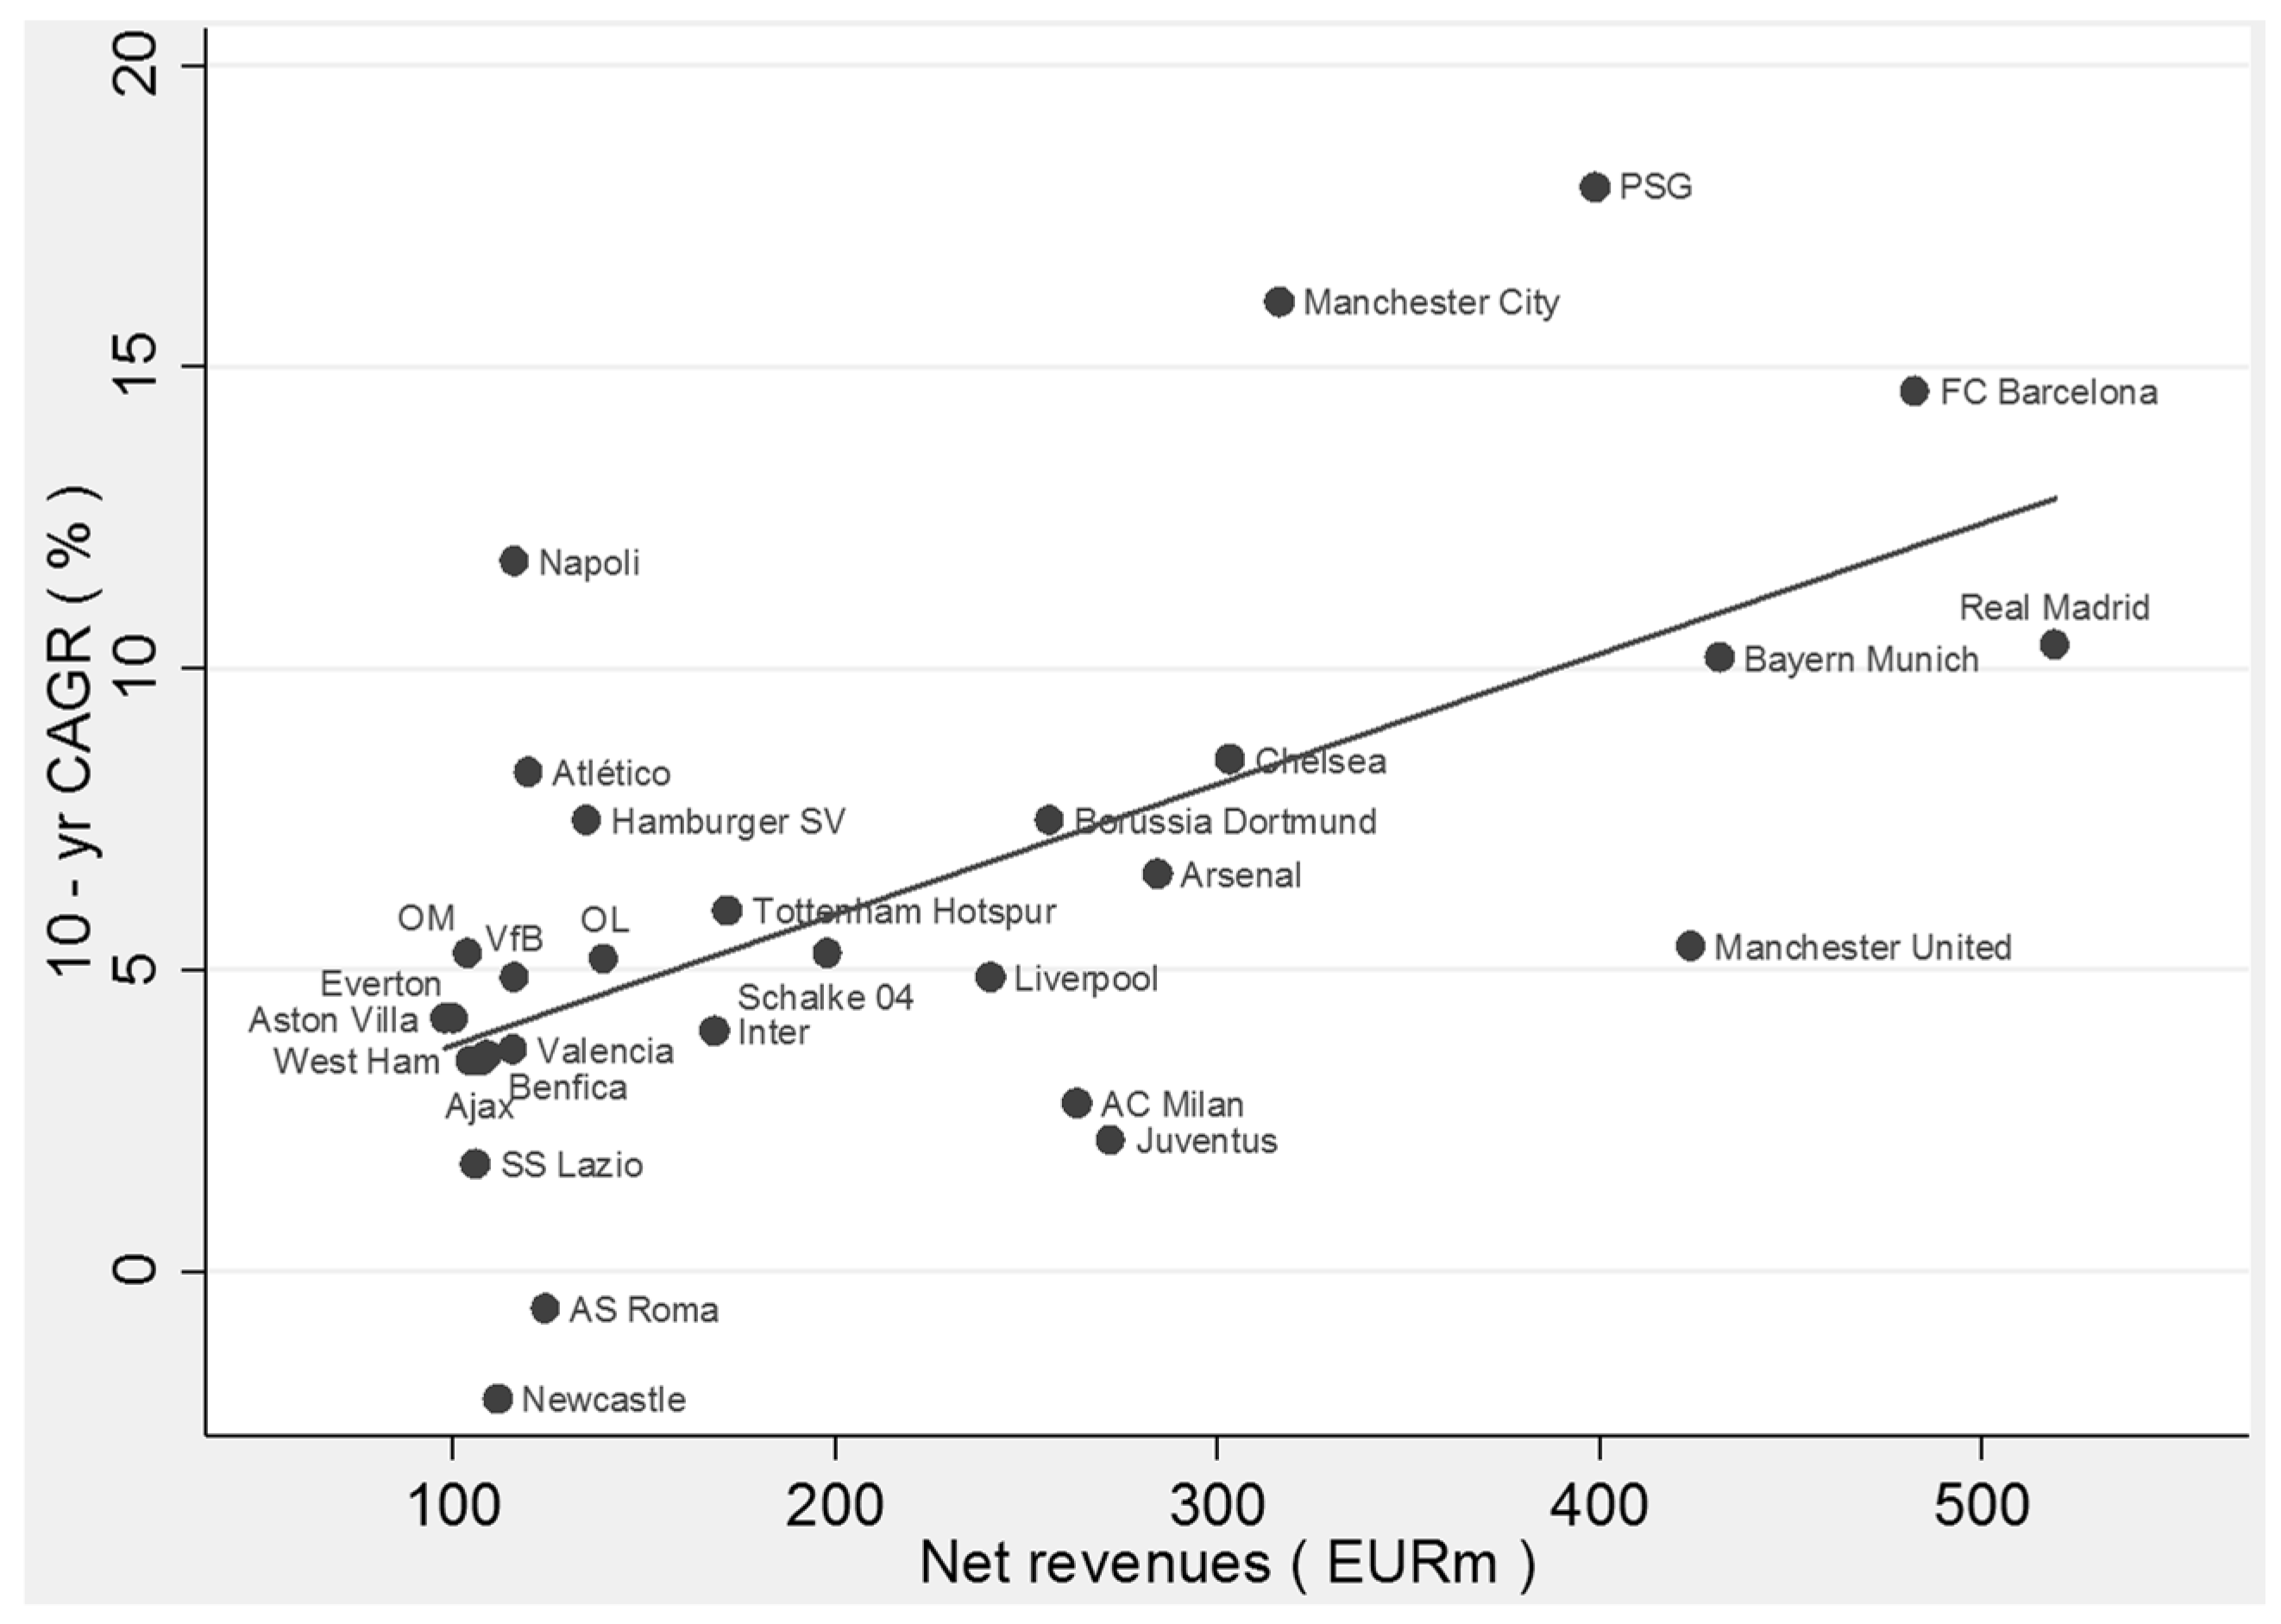
Figure 1. Revenues in 2013 vs. 10-year growth rates of top 30 EU football clubs. Sources: Deloitte Football Money League; Club financial accounts.
Ijfs 04 00012 g001
Figure 2. Relevance of top 30 clubs—Appearances in FIFA World Cup Elimination Round 2014. Notes: World Champion: Germany; Final: […] + Argentina; HF: […] + Brazil + The Netherlands; QF: […] + France + Colombia + Belgium + Costa Rica; EF: […] + Chile + Uruguay + Mexico + Greece + Nigeria + Algeria + Switzerland + USA.
Ijfs 04 00012 g002
Table 1. Financial growth of top 30 EU football clubs from 2003/04 to 2012/13.
#ClubCountryMajority OwnerAvg. Annual Rev. Growth 2004–2013 (% p.a.)
1Paris Saint-GermainFranceQatar Sport Investments18.0%
2Manchester CityEnglandSheikh Mansour16.1%
3FC BarcelonaSpainClub members14.6%
4SSC NapoliItalyFilmauro11.8%
5Real MadridSpainClub members10.4%
6Bayern MunichGermanyClub members10.2%
7Chelsea FCEnglandRoman Abramovich8.5%
8Atlético MadridSpainMiguel Angel Gil8.3%
9Borussia DortmundGermanyDistributed ownership7.5%
10Hamburger SVGermanyClub members7.5%
11Arsenal FCEnglandStan Kroenke6.6%
12Tottenham Hotspur FCEnglandEnic International Limited6.0%
13Manchester UnitedEnglandGlazer family5.4%
14Olympique de MarseilleFranceMargarita Louis-Dreyfus5.3%
15FC Schalke 04GermanyClub members5.3%
16Olympique LyonnaisFranceJean-Michel Aulas5.2%
17VfB StuttgartGermanyClub members4.9%
18Liverpool FCEnglandFenway Sports Group4.9%
19Aston Villa FCEnglandRandy Lerner4.2%
20Everton FCEnglandDistributed ownership4.2%
21Valencia CFSpainClub members3.7%
22BenficaPortugalClub members3.6%
23West Ham UnitedEnglandDavid Sullivan/David Gold3.5%
24Ajax AmsterdamThe NetherlandsClub members3.5%
25AC MilanItalySilvio Berlusconi2.8%
26JuventusItalyAgnelli family2.2%
27SS LazioItalyClaudio Lotito1.8%
28Inter MilanItalyMassimo Moratti0.4%
29AS RomaItalyThomas R. DiBenedetto(0.6%)
30Newcastle UnitedEnglandMike Ashley(2.1%)
Balanced sample of top 30 EU football clubs by revenues in 2013; Corinthians Sao Paulo (Brasil), Fenerbahce and Galatasaray Istanbul (both Turkey) have been excluded due to missing historical data; Sources: Deloitte Football Money League; Club financial accounts.
Table 2. National league titles in “Big Five” leagues (2004–2013).
#EnglandFranceGermanyItalySpain
2004Arsenal FCOl. LyonnaisWerder Bremen 1AC MilanValencia CF
2005Chelsea FCOl. LyonnaisBayern MunichJuventus 3FC Barcelona
2006Chelsea FCOl. LyonnaisBayern MunichInter MilanFC Barcelona
2007Manchester Utd.Ol. LyonnaisVfB StuttgartInter MilanReal Madrid
2008Manchester Utd.Ol. LyonnaisBayern MunichInter MilanReal Madrid
2009Manchester Utd.Bordeaux 1VfL Wolfsburg 2Inter MilanFC Barcelona
2010Chelsea FCOl. MarseilleBayern MunichInter MilanFC Barcelona
2011Manchester Utd.Lille OSCBor. DortmundAC MilanFC Barcelona
2012Manchester CityMontpellierBor. DortmundJuventusReal Madrid
2013Manchester Utd.Paris SGBayern MunichJuventusFC Barcelona
Top 30 (%)100%70%80%100%100%
1 Bordeaux and Werder were part of top 30 clubs at time of title; 2 VfL Wolfsburg does not officially disclose its revenues, but is assumed to be part of top 30 clubs; 3 Serie A title officially withdrawn after season.
Table 3. Top four teams in UEFA Champions League (2004–2013).
#WinnerRunner-UpHalf Finalist 1Half Finalist 2Top 30 (%)
2004FC PortoAS MonacoChelsea FCDep. La Coruna25%
2005Liverpool FCAC MilanChelsea FCPSV Eindhoven75%
2006FC BarcelonaArsenal FCAC MilanFC Villareal75%
2007AC MilanLiverpool FCChelsea FCManchester Utd.100%
2008Manchester Utd.Chelsea FCFC BarcelonaLiverpool FC100%
2009FC BarcelonaManchester Utd.Arsenal FCChelsea FC100%
2010Inter MilanBayern MunichOl. LyonnaisFC Barcelona100%
2011FC BarcelonaManchester Utd.Real MadridFC Schalke 04100%
2012Chelsea FCBayern MunichReal MadridFC Barcelona100%
2013Bayern MunichBorussia DortmundReal MadridFC Barcelona100%
Top 30 (%)90%90%85%n/a88%
Table 4. Top 30 global football clubs by brand value in 2013.
#ClubCountryBrand Value 2013 (€ m)
1Bayern MunichGermany668
2Manchester UnitedEngland650
3Real MadridSpain483
4FC BarcelonaSpain444
5Chelsea FCEngland325
6Arsenal FCEngland319
7Liverpool FCEngland280
8Manchester CityEngland257
9AC MilanItaly204
10Borussia DortmundGermany202
11FC Schalke 04Germany201
12Tottenham Hotspur FCEngland170
13JuventusItaly139
14Ajax AmsterdamThe Netherlands126
15Inter MilanItaly117
16Hamburger SVGermany112
17GalatasarayTurkey90
18Olympique LyonnaisFrance90
19Olympique de MarseilleFrance86
20SC Corinthians PaulistaBrazil80
21SSC NapoliItaly79
22Fenerbahce SKTurkey74
23Bayer 04 LeverkusenGermany70
24Paris Saint-GermainFrance66
25VfB StuttgartGermany65
26Valencia CFSpain64
27VfL WolfsburgGermany64
28AS RomaItaly64
29West Ham United FCEngland64
30Newcastle UnitedEngland63
Figures converted to Euros based on exchange rate of EUR 1.18/GBP. Sources: Brand Finance (2013).
Table 5. Overview of key variables.
VariableDescriptionScale
revRevenues excl. transfer fees (€ m)Metric
lppgLeague points per game (#)Metric
cupwinWin of national cup (e.g., FA Cup) (1 = yes, 0 = no)Dummy
ucecUEFA club coefficient (excl. country part) (#)Metric
tra_invNet team transfer investments (€ m)Metric
inv_majPrivate majority investor (1 = yes, 0 = no)Dummy
inv_minPrivate minority investor (1 = yes, 0 = no)Dummy
inv_maj_forForeign majority investor (1 = yes, 0 = no)Dummy
tra_taxTop personal income tax rate (%)Metric
bra_valBrand value (€ m)Metric
tv_schTV scheme (1 = Decentralized, 0 = Centralized)Dummy
takeoverTakeover by new owner(s) (1 = yes; 0 = no)Dummy
rev_lagLagged revenues excl. transfer fees (€ m)Metric
lppg_lagLagged league points per game (#)Metric
ucec_lagLagged UEFA club coefficient (excl. country part) (#)Metric
tra_inv_lagLagged net team transfer investments (€ m)Metric
y1–y10Year dummies (2004–2013; 2013 is omitted)Dummy
cdum1–cdum30Club dummies (Top 30 clubs by revenue; Real Madrid is omitted)Dummy
Table 6. Summary statistics.
VariableNMeanStd. Dev.MinMax
rev289 1164.597.212.1518.9
lppg291 21.780.400.842.68
cupwin30013.0%-01
ucec225 315.47.36133
tra_inv30014.434.4−80.3171.3
inv_maj30075.7%-01
inv_min3008.7%-01
inv_maj_for30020.7%-01
tra_tax30045.8%4.0%40.0%56.5%
bra_val231 4158.9128.927.3667.9
tv_sch30027.3%-01
takeover3004.7%-01
y1–y1030010.0%-01
cdum1–cdum303003.3%-01
N300
1 Missing values have not been disclosed by clubs; 2 Missing values for league points per game and stadium utilization are due to teams relegated to lower-tier divisions; 3 Missing values due to teams not participating in UEFA club competition in respective season; 4 Missing values have not been determined by Brand Finance.
Table 7. Within variation of team ownership.
Within Variation from Individual Average (“xtsum”)
Variable MeanSdMinMaxCount
inv_majoverall75.7%43.0%01N = 300
between 41.2%01n = 30
within 14.3%–4.3%145.6%T = 10
inv_minoverall8.67%28.2%01N = 300
between 27.1%01n = 30
within 9.0%–51.3%48.7%T = 10
inv_maj_foroverall20.7%40.6%01N = 300
between 34.8%01n = 30
within 21.6%–69.3%100.7%T = 10
Decomposition of Counts into between and within Variation (“xttab”)
Overall between within
Variable Freq.PercentFreq.PercentPercent
inv_maj07324.33930.0081.11
122775.672480.0094.58
Total300100.0033110.0090.91
inv_min027491.332893.3397.86
1268.67310.0086.67
Total300100.0031103.3396.77
inv_maj_for023879.332996.6782.07
16220.67930.0068.89
Total300100.0038126.6778.95
Transition Probabilities (“xttrans”)
Variable 01Total
inv_maj095.524.48100.00
10.00100.00100.00
Total23.7076.30100.00
inv_min099.600.40100.00
10.00100.00100.00
Total91.118.89100.00
inv_maj_for096.313.69100.00
10.00100.00100.00
Total77.4122.59100.00
Table 8. Key regression results: financial success.
DVlogrevlogrevlogrev
ModelOLS with cluster-robust SEsFE modelFE IV model (2sls)
ucec0.0074 ***0.0092 ***0.0087 ***
(0.0016)(0.0013)(0.0013)
lppg0.08670.0993 **0.1196 ***
(0.0541)(0.0293)(0.0333)
cupwin0.01770.0356 (+)0.0578 **
(0.0230)(0.0207)(0.0222)
logbra_val0.1619 *0.2003 ***0.1091 (+)
(0.0754)(0.0442)(0.0669)
tv_sch0.01070.05030.0187
(0.0265)(0.0416)(0.0405)
logrev_lag0.6182 ***0.3294 ***0.5095 **
(0.1073)(0.0604)(0.1525)
Constant0.9423 ***2.2138 ***1.6737 **
(0.2462)(0.2504)(0.5209)
Instrumented--logrev_lag
Instruments--tra_inv_lag, logmv_lag
R-squared0.92260.83710.9709
Observations188188144 1
No. of groups292929
Std. Err. in parentheses: *** p < 0.001; ** p < 0.01; * p < 0.05; (+) p < 0.1; 1 Smaller sample size due to the restricted data availability of market values from 2006 onwards.
Table 9. Key regression results: sporting success.
DVlppglppglppgucecucecucec
ModelOLS with cluster-robust SEsFE modelFE IV model (2sls)OLS with cluster-robust SEsFE modelFE IV model (2sls)
tra_inv0.0017 **0.0014 *0.0020 ***0.0335 *0.0264 (+)0.0295 *
(0.0005)(0.0006)(0.0005)(0.0127)(0.0142)(0.0139)
lppg_lag0.6935 ***0.2956 ***0.6546 ***
(0.0496)(0.0634)(0.0479)
ucec_lag 0.3589 ***0.2920 ***0.5054 ***
(0.0779)(0.0776)(0.1006)
Constant0.5313 ***1.3191 ***0.5952 ***9.7698 ***12.2321 ***8.5046 ***
(0.0886)(0.1261)(0.1001)(1.3407)(2.0751)(2.664)
Instrumented--lppg_lag--ucec_lag
Instruments--winpct_lag, lppg_uclqual_lag--ucl_lag, uclgames_lag
R-squared0.47180.12790.50780.14850.16300.2083
Observations286286286191191191
No. of groups303030292929
Std. Err. in parentheses: *** p < 0.001; ** p < 0.01; * p < 0.05; (+) p < 0.1.
Table 10. Key regression results: team investments.
DVtra_invtra_invtra_inv
ModelOLS with cluster-robust SEsFE modelFE IV model (2sls)
inv_maj_for17.1300 **25.0511 **20.5512 *
(5.5069)(8.9279)(8.6083)
inv_maj−1.602517.22499.8423
(5.0823)(11.1083)(10.9342)
inv_min2.8834−1.6068−0.7108
(7.4699)(18.9601)(17.4554)
inv_tax−0.8375−1.9195 **−1.5317 *
(0.5182)(0.7319)(0.6959)
takeover14.189016.1443 (+)9.5330
(12.2726)(8.6981)(8.3547)
tra_inv_lag0.4089 ***0.1544 *0.3482 *
(0.0659)(0.0636)(0.1706)
Constant43.669286.2301 *74.5595 *
(25.8184)(36.8275)(38.1173)
Instrumented--tra_inv_lag
Instruments--newntlplayers_lag
R-squared0.25260.12210.3741
Observations300300296
No. of groups303030
Std. Err. in parentheses: *** p < 0.001; ** p < 0.01; * p < 0.05; (+) p <0.1.

