1. Introduction
In this paper, we empirically examine the impact of risk-based capital requirements on bank assets portfolio risk using a rich dataset of listed commercial banks of Pakistan.
The first risk-based capital regulation, Basel-I Accord, was published by the Basel Committee on Banking Supervision (BCBS) in 1988. Basel-I mainly focused on bank credit risk and linked minimum capital requirements to the bank assets portfolio risk. The initial risk-based capital regulation has been amended several times. For example, Basel-I Accord was amended in 1996 to incorporate premium for bank market risk into risk-based capital requirements. In 2004, Basel-II Accord was finalized to overcome the shortcomings of Basel-I and make risk-based capital regulation more effective. Basel-II incorporated premium for bank operational risk into risk-based capital calculations in addition to credit and market risks. In addition, Basel-II also introduces supervisory review and market discipline mechanisms. Some countries adopted Basel-II capital standard for their banking sectors, while others were planning to adopt it that the global financial crisis hit in 2007. Basel I and II have been largely criticized on two grounds: first, there is the possibility of regulatory capital arbitrage through financial innovations such as securitization [
1]; and secondly, risk-based capital requirements are pro-cyclical and can increase the intensity of economic cycles [
2].
In the after-crisis debates over how to strengthen banking stability, capital regulation continues to play a key role. In September 2010, the Basel Committee on Banking Supervision announced the Basel-III Accord. In Basel-III, both the quantity and the quality of regulatory capital have been improved.
Since 1997, the State Bank of Pakistan (SBP)
1 has adopted risk-based capital regulation for Pakistani commercial banks, in line with the guidelines of Basel Accords. SBP has revised risk-based capital regulation from time-to-time to update it according to the amendments in the Basel Accords. The primary purpose of adoption of risk-based capital regulation in Pakistan is to contain bank risk-taking and build strong capital base in banks by making bank capital requirements more responsive to assets portfolio risk. However, the extant theoretical literature predicts that the effect of increased risk-based capital requirements on bank assets portfolio risk is mixed. Some studies argue that banks can decrease assets portfolio risk to meet higher risk-based capital requirements, while another strand of studies suggests that banks can increase assets portfolio risk to offset the negative effect of higher capital requirements on bank leverage and profitability (see VanHoose [
3] for a survey of theories of bank behavior under capital regulation). Consistent with the theoretical literature, existing empirical research also reports mixed findings over the relationship between risk-based capital requirements and assets portfolio risk [
4,
5,
6,
7]. Another concern with this empirical literature is that it mostly has been conducted on developed countries’ banking sectors. Further, many troubled banks during the global financial crisis were conforming to minimum capital requirements shortly before and even during the crisis [
8] that also raise questions about the effectiveness of risk-based capital requirements.
Against this backdrop, it is difficult to predict the impact of the risk-based capital regulation on bank risk-taking in Pakistan and it is an open empirical question that deserves attention. Furthermore, due to fewer chances of regulatory arbitrage by financial innovation in underdeveloped capital market environments like Pakistan, the capital regulation is likely to have a more pronounced effect on bank risk-taking. As prior literature in this area has largely focused on developed countries, it is important to study this relation in a developing country context.
We use an unbalanced panel dataset of 21 listed commercial banks over the period from 2005 to 2012 to study the relationship between risk-based capital requirements and bank assets portfolio risk. We use pure regulatory measures of bank capital, capital adequacy ratio, and risk, risk-weighted assets to total assets ratio, to examine the relationship. Overall, our results suggest that commercial banks in Pakistan have reduced assets portfolio risk in response to stringent risk-based capital requirements.
We contribute to the literature in at least two ways: First, previous research that examines capital regulation’s effects on bank risk-taking has mostly focused on developed nations. One possible reason is that most of the developing nations have only recently adopted Basel-based capital regulations and, therefore, data on regulatory capital and risk measures is scarce. We collect a new comprehensive dataset from Pakistan to investigate capital regulation’s effect on commercial banks assets portfolio risk. In this regard, our study complements recent studies that examine the effect of risk-based capital requirements on bank assets portfolio risk in a developing countries context. Second, we use recently developed small
N panel methods to control for panel fixed effects, dynamic dependent variables, and independent endogenous variables. Specifically, we use the bias corrected least squares dummy variable (LSDVC) method suggested by Kiviet [
9] and Bruno [
10], and the system GMM panel method of Blundell and Bond [
11] with the instruments collapse option as suggested by Roodman [
12].
The rest of the paper is organized as follows.
Section 2 presents a brief review of the existing literature.
Section 3 presents details about the implementation of risk-based capital regulation in Pakistan.
Section 4 introduces data and variables.
Section 5 explains the methodology for empirical analyses.
Section 6 presents empirical results. Final section concludes the study.
2. Literature Review
Extant literature that examines the impact of minimum capital requirements on risk-taking behavior of commercial banks is largely divided. Some studies suggest that higher capital requirements encourage banks to take on more risk. In their seminal works, Kahane [
13] and Koehn and Santomero [
14] demonstrated that uncertainty-avert banks constrained by simple leverage ratio adjust their asset portfolios by adding more risky assets, leading to an increased probability of bank default. Similarly, Kim and Santomero [
15] and Rochet [
16] suggested that risk-based capital requirements can encourage banks to choose riskier assets unless and until risk weights are optimally set. Empirical studies, such as Shrieves and Dahl [
7] for U.S. banks and Altunbas et al. [
17] for 15 European countries’ banks, found a positive association between changes in bank capital and risk-taking.
However, a second strand of studies suggests that higher regulatory capital requirements result in lower bank risk-taking. For example, Keeley and Furlong [
18] and Furlong and Keeley [
19] argue that higher regulatory capital requirements, by reducing the moral hazard problem generated by deposit insurance, decrease incentives for banks to take on higher risk. Similarly, empirical studies, such as Jacques and Nigro [
5] for U.S. banks, Ediz, Michael and Perraudin [
4] for U.K. banks, Konishi and Yasuda [
20] for Japanese banks, Ma et al. [
21] for Chinese banks, and Maji and De [
22] for Indian banks, find a negative association between bank capital and risk-taking.
In contrast to the above two types of studies, a third strand of studies shows that banks usually hold capital ratios well above the minimum capital requirements (i.e., capital buffers) and generally risk-based capital requirements have a negligible effect on bank risk-taking behavior [
23,
24,
25]. Due to holding capital ratios well above regulatory limits, banks are not constrained by capital regulation and have their own target capital and risk-taking levels. Consequently, banks adjust their capital and risk-taking to reach their target levels depending on the extent of their capital buffers [
26,
27,
28]. For example, Jokipii and Milne [
2] used a sample of U.S. banks and found a positive association between capital and risk-taking for highly capitalized banks and a negative association between capital and risk-taking for banks with marginal capital adequacy ratios. Camara et al. [
29] used a sample of European banks and found that an increase in equity of highly capitalized, adequately capitalized, and strongly undercapitalized banks positively affects risk, whereas an increase in equity of moderately undercapitalized banks negatively affects risk.
Only recently has the literature started to study the relationship between bank capital and risk in an Asian context [
30,
31]. For example, Lee and Hsieh [
31] examined a sample of 42 Asian countries’ banks and found a strong negative association between bank capital and risk-taking for commercial banks. Specifically, their results showed that equity to total assets ratios are inversely correlated with accounting measures (e.g., loan loss reserves) of bank risk-taking. Contrary, Haq, Faff, Seth, and Mohanty [
30] examine a sample of listed commercial banks in 15 Asia-Pacific countries and find mixed results. Specifically, they observed a negative association between bank capital and bank idiosyncratic and credit risks, and a positive association between bank capital and bank total and systemic risks.
Both of the above studies on Asian banks include commercial banks of Pakistan, but have reported largely mixed results. These mixed findings motivate further investigation into the matter. In addition, although these multi-country studies are helpful in general understanding
2, some recent studies such as Agoraki et al. [
40], Jokipii and Milne [
2] and Delis et al. [
41] show the heterogeneous effects of capital regulation on bank risk-taking, depending upon factors such as the market power of a bank, other prudential regulations that can affect bank risk in addition to capital regulation, and the capital regulation implementation period in a country. Therefore, it is important to study the consequences of implementation of capital regulation in the specific context of Pakistan.
Moreover, since the main focus of risk-based capital requirements is to ensure bank stability by reducing bank assets portfolio risk, while the above studies on Asian banks have either used the equity to total assets ratio to measure bank capitalization [
31] or have not used risk-weighted assets to total assets ratios to measure bank risk-taking [
30]. Thus, both papers do not study the impact of risk-based capital regulation on bank risk-taking in its real essence. In this study, we use purely regulatory measures of bank capital, capital adequacy ratio, and risk-taking, risk-weighted assets to total assets ratio, to examine the impact of risk-based capital regulation on bank risk-taking in its real essence.
3. Risk-Based Capital Regulation in Pakistan
In 1997, the State Bank of Pakistan (SBP) adopted risk-based capital regulation for all commercial banks of Pakistan. Risk-based capital regulation was in line with the guidelines of the Basel-I Accord. This new regulation linked bank capital requirements to bank assets portfolio risk. Commercial banks were required to calculate risk-weighted assets based on the risk level of each bank asset first, and then to maintain a capital adequacy (or regulatory capital) ratio equal to 8% of these risk-weighted assets. Banks had to use four risk categories to calculate risk-weighted assets: 0% for government securities held by the bank that are considered to have no default risk, 20% for assets with low credit risk such as loans guaranteed to the banks of international repute, 50% for assets with moderate risk such as secured residential or commercial mortgages, and 100% for bank assets with high risk such as unsecured loans.
Since 1997, risk-based capital regulation has been revised several times by the SBP: Risk-based capital regulation was amended in 2004 to incorporate bank market risk into regulatory capital and risk-weighted assets calculations. It was further amended in 2006 to incorporate the guidelines of Basel-II. The timeframe for the implementation of the Basel-II guidelines was from 1 January 2008. In addition, SBP further increased minimum capital adequacy ratio requirements in 2008. It was increased to 9% of risk-weighted assets for the year 2008 and to 10% for the year 2009 and onwards. Since SBP instructed all banks to report capital adequacy ratio and risk-weighted assets in annual financial statements from 2005, the data are available from 2005 and we need to restrict our study from 2005 to 2012.
Figure 1 shows the increase in annual average of capital adequacy ratios of all sample banks. As shown, average capital adequacy ratio had an increasing trend before 2008. Although the ratio decreased from 2008 to 2010 due to bad economic conditions caused by the financial crisis, the ratio did not decrease to a large extent due to sufficient capital levels maintained by the banks before crisis. This shows a positive effect of prudential capital regulation on the health of the banking sector, especially when a bad shock hit the economy.
In addition to risk-based capital requirements, SBP has also required all banks to maintain a minimum paid-up capital. Here, paid-up capital represents the common equity of a bank. These minimum paid-up capital requirements are independent of the level of risk in bank assets portfolios. Like capital adequacy ratios, minimum paid-up capital requirements have also been increased by SBP over the sample period of our study. Required minimum paid-up capital net of losses was two billion rupees (Pakistani currency) at the end of 2005, with an annual increment of one billion rupees, reaching nine billion rupees at the end of 2012.
4. Data and Variables
We downloaded balance sheet and regulatory variables data for 22 listed commercial banks over the period 2005–2012 from Bankscope database. To fill in the missing values in the Bankscope data, we hand-collected some data from annual financial statements (available at their websites) of the concerned banks. We checked the data for outliers and excluded Samba bank as having capital adequacy ratios above 50% in some years of the sample period. The final sample is an unbalanced panel dataset consisting of 152 observations for 21 banks.
Measurement of bank risk is difficult and the literature has used many variables as bank risk-taking proxies. Since the main focus of our study is to examine the impact of risk-based capital regulation on bank assets portfolio risk, the most relevant bank risk proxy is risk-weighted assets to total assets ratio (RWA_TA). Jacques and Nigro [
5], Rime [
6], and Jokipii and Milne [
2] also use risk-weighted assets to total assets ratio as the main bank risk proxy for their studies. RWA_TA ratio is an
ex-ante bank risk-taking proxy and represents a bank’s investments in risky assets. For example, government securities are considered the safest among all assets and, with zero risk weight, never enter into risk-weighted assets calculations, while unsecured commercial loans are considered the riskiest among all assets and, with the highest risk weight, have the highest share in risk-weighted assets calculation. We also use the non-performing loans to gross loans (NPL_GL) ratio as an alternative bank risk-taking proxy. NPL_GL ratio represents loans that have been recognized as unrecoverable and is an
ex-post measure of bank portfolio risk and credit quality. The use of alternative bank risk-taking proxies helps to check the accuracy and robustness of our results.
Capital adequacy ratio (Reg_Cap) and a set of two regulatory pressure variables are used as the main independent variables.
Capital adequacy ratio (Reg_Cap) is the main independent variable and is defined as the total regulatory capital as a percentage of risk-weighted assets. Well-capitalized banks either have maintained higher capital ratios by reducing risk-weighted assets or have an increased portfolio of risk-weighted assets due to the support of higher capital. Therefore, we are uncertain about the sign of the Reg_Cap variable.
As alternative independent variables, we use a set of two regulatory pressure variables: high regulatory pressure (HRP_LCAR) and low regulatory pressure (LRP_HCAR) variables.
As explained in
Section 3, SBP has required banks to maintain a minimum capital adequacy (Reg_Cap) ratio equal to 8% of risk-weighted assets from 2005 to 2007, 9% for 2008 and 10% from 2009 onwards. Some banks have Reg_Cap below these limits in some years, while others have Reg_Cap well above these limits. Since banks having capital adequacy ratios above and below the regulatory required limits may respond differently by adjusting risk-weighted assets in their portfolios due to differing pressure from regulators. Therefore, following the procedure of Jacques and Nigro [
5]
3, we generate two variables to measure regulatory pressure depending upon the actual level of regulatory capital of each bank:
where Reg_Cap equals the actual annual capital adequacy ratio of a bank in a year and η equals the minimum capital adequacy ratio required by SBP in that year.
HRP_LCAR measures the high regulatory pressure faced by banks having Reg_Cap lower than the required minimum limits. Because the banks that have a Reg_Cap ratio above the minimum required limits donot face severe regulatory pressure, we set the HRP_LCAR variable equal to zero for all other bank observations. Consequently, HRP_LCAR is zero for all bank observations having Reg_Cap higher than the regulatory required limits; its values increase as Reg_Cap decreases below the regulatory required limits, and its value is highest for the bank observation having the lowest Reg_Cap. Higher values of this variable capture higher regulatory pressure to increase capital adequacy ratios. HRP_LCAR is expected to have a negative effect on bank assets portfolio risk because banks having lower capital adequacy ratios are likely to decrease risk-weighted assets to meet higher risk-based capital requirements.
LRP_HCAR measures low regulatory pressure faced by banks having capital adequacy ratios higher than the required minimum limits. Banks having regulatory capital ratios well above the minimum capital adequacy requirements observe less regulatory oversight and have more freedom in choosing a risk-taking strategy. We set LRP_HCAR equal to zero for all other bank observations (for which HRP_LCAR is calculated). Consequently, LRP_HCAR is zero for all bank observations having Reg_Cap lower than the regulatory required limits; its values increase as Reg_Cap increases above the regulatory required limits, and its value is highest for the bank observation having the highest Reg_Cap. Higher values of this variable capture less regulatory oversight and allow a bank more freedom in choosing a risk-taking strategy. The effect of LRP_HCAR on bank risk-taking is uncertain; because banks having regulatory capital above the required minimum limits are not constrained by regulatory pressure, they can either adjust portfolio risk to higher levels to compensate for the costs associated with expensive equity (i.e., buffer capital theory), or they can build capital buffers by reducing portfolio risk to fight future uncertainties.
As explained in
Section 3, concurrent with the implementation of risk-based capital requirements, SBP has required banks to maintain minimum paid-up capital also. In this regard, Jacques and Nigro [
5] suggest that banks constrained by simple leverage ratio increase total capital independent of risk-based capital requirements. To account for the effect of minimum paid-up capital requirements on bank risk-taking behavior, we create a leverage dummy (Lev_dummy) variable. As explained in
Section 3, the required minimum paid-up capital net of losses was two billion rupees (Pakistani currency) at the end of 2005, three billion at the end of 2006, and so on, reaching nine billion rupees at the end of 2012. Therefore, we set the Lev_dummy variable equal to 1 if a bank’s actual paid-up capital in a year is lower than the required minimum limit in that year, and 0 otherwise.
We include several other variables to control for bank characteristics that can affect portfolio risk in addition to capital requirements. Following recent studies on bank capital and risk, such as Altunbas, Carbo, Gardener, and Molyneux [
17], Lee and Hsieh [
31], and Rahman et al. [
42], we include variables to control for bank size (Log_TA), liquidity (Liquid_TA), and level of deposits (Deposits_TA).
Log_TA equals the log of the annual total assets of a bank. Large banks have different risk-taking incentives than small banks because large banks can operate with less capital, have more investment opportunities, have more internal diversification, and can benefit from many other size advantages. Large banks can shift towards risky non-interest income generating activities to benefit from internal diversification advantages and, hence, rely less on interest income as compared to small banks [
17,
43,
44]. Thus, we expect a negative association between bank size and risk-taking.
Liquid_TA equals annual liquid assets to total assets ratio of each bank. Banks need to hold liquid assets to meet depositors’ withdrawals and other uncertainties. Higher liquidity requirements can impair the ability of banks to invest in loan portfolios. Thus, we expect a negative association between bank liquidity and risk-taking.
Deposits_TA equals deposits to total assets ratio of a bank. Banks having a strong deposits base are expected to invest more in risk-weighted assets. Imran and Nishat [
45]
4 found that domestic deposits are significant determinants of bank credit in Pakistan. We expect a positive association between Deposits_TA and bank risk proxies.
5. Methodology
We have an unbalanced panel of 21 commercial banks for eight years from 2005 to 2012. We used two dependent variables, RWA_TA and NPL_GL, to proxy for bank portfolio risk in alternative models. For empirical analyses, first we used Reg_Cap as the main independent variable and examined its effect on each of the bank risk-taking proxy variables one-by-one, after including other control variables in regressions. Second, we replaced Reg_Cap with a set of two regulatory pressure variables (HRP_LCAR and LRP_HCAR) and examined their effects on each of the bank risk-taking proxies.
Our data has bank fixed effects, dynamic dependent variables, and endogenous independent variable properties. The sample includes almost the entire population of commercial banks of Pakistan, where each bank has different characteristics such as size, boards of directors, CEOs, etc. as fixed-effects. The main dependent variable, RWA_TA, has some persistence because long-term loans and investments enter into the risk-weighted assets calculation more than one year. The main independent variable, Reg_Cap, is an endogenous variable because banks can adjust capital and portfolio risk simultaneously.
For dynamic panel models having fixed-effects and endogenous regressors, the recently developed system GMM panel estimator of Blundell and Bond [
11] is considered best. However, the System GMM estimator is suitable for large
N and short
T panels. Roodman [
12] and Roodman [
46] suggest that system GMM estimation with few panels, such as
N = 20, can be problematic and instruments proliferation problem becomes severe in small
N panels. In a system GMM estimator, instruments proliferation can overfit endogenous variables. In a recent study, Flannery and Hankins [
47] compare seven panel estimation methods under the sort of statistical conditions contained in large corporate finance datasets such as unbalanced and dynamic panels. Their simulation findings suggest that the bias-corrected least squares dummy variable (LSDVC) estimator, as suggested by Kiviet [
9] and Bruno [
10], appears to be superior to all others for unbalanced, dynamic, and fixed-effects panel models. The LSDVC estimator is also considered superior over system GMM estimator for small
N panels. For example, Bruno [
48] compares system GMM and LSDVC estimators for small
N panels and finds that LSDVC estimator outperforms system GMM when
N = 10 or 20.
Therefore, we use the LSDVC estimator for panel estimations. However, one concern of the LSDVC method is its assumption of all exogenous regressors but the Reg_Cap ratio is endogenous in some of our specifications
5. To eliminate this concern, we also use system GMM with the instruments collapse option, as suggested by Roodman [
12], for those specifications where endogeneity could be a serious problem. The collapse option reduces the instruments set and reduces over-fitting of endogenous regressors, even in small samples.
We used the following equations for empirical analysis:
In all equations, ui represents the fixed effect of bank i and εi,t is the residual effect for year t for bank i.
Dependent variables are bank risk-taking proxies represented by RWA_TA in Equations (1) and (2) and by NPL_GL in Equations (3) and (4). To account for dynamic dependent variable, the right-hand side includes one period lag of dependent risk variable in each equation.
Key test variables to examine the effect of regulatory capital requirements on bank risk-taking are Reg_Cap in Equations (1) and (3) and a set of two regulatory pressure variables (LRP_HCAR and HRP_LCAR) in Equations (2) and (4).
The Lev_Dummy variable is included in all equations to control for regulatory pressure due to not meeting the minimum paid-up capital requirements by some banks in some years.
All equations include three bank-level control variables: Log_TA is the natural log of total assets, Liquid_TA is the liquid assets to total assets ratio, and Deposits_TA is the customer deposits to total assets ratio.
6. Empirical Results
6.1. Summary Statistics
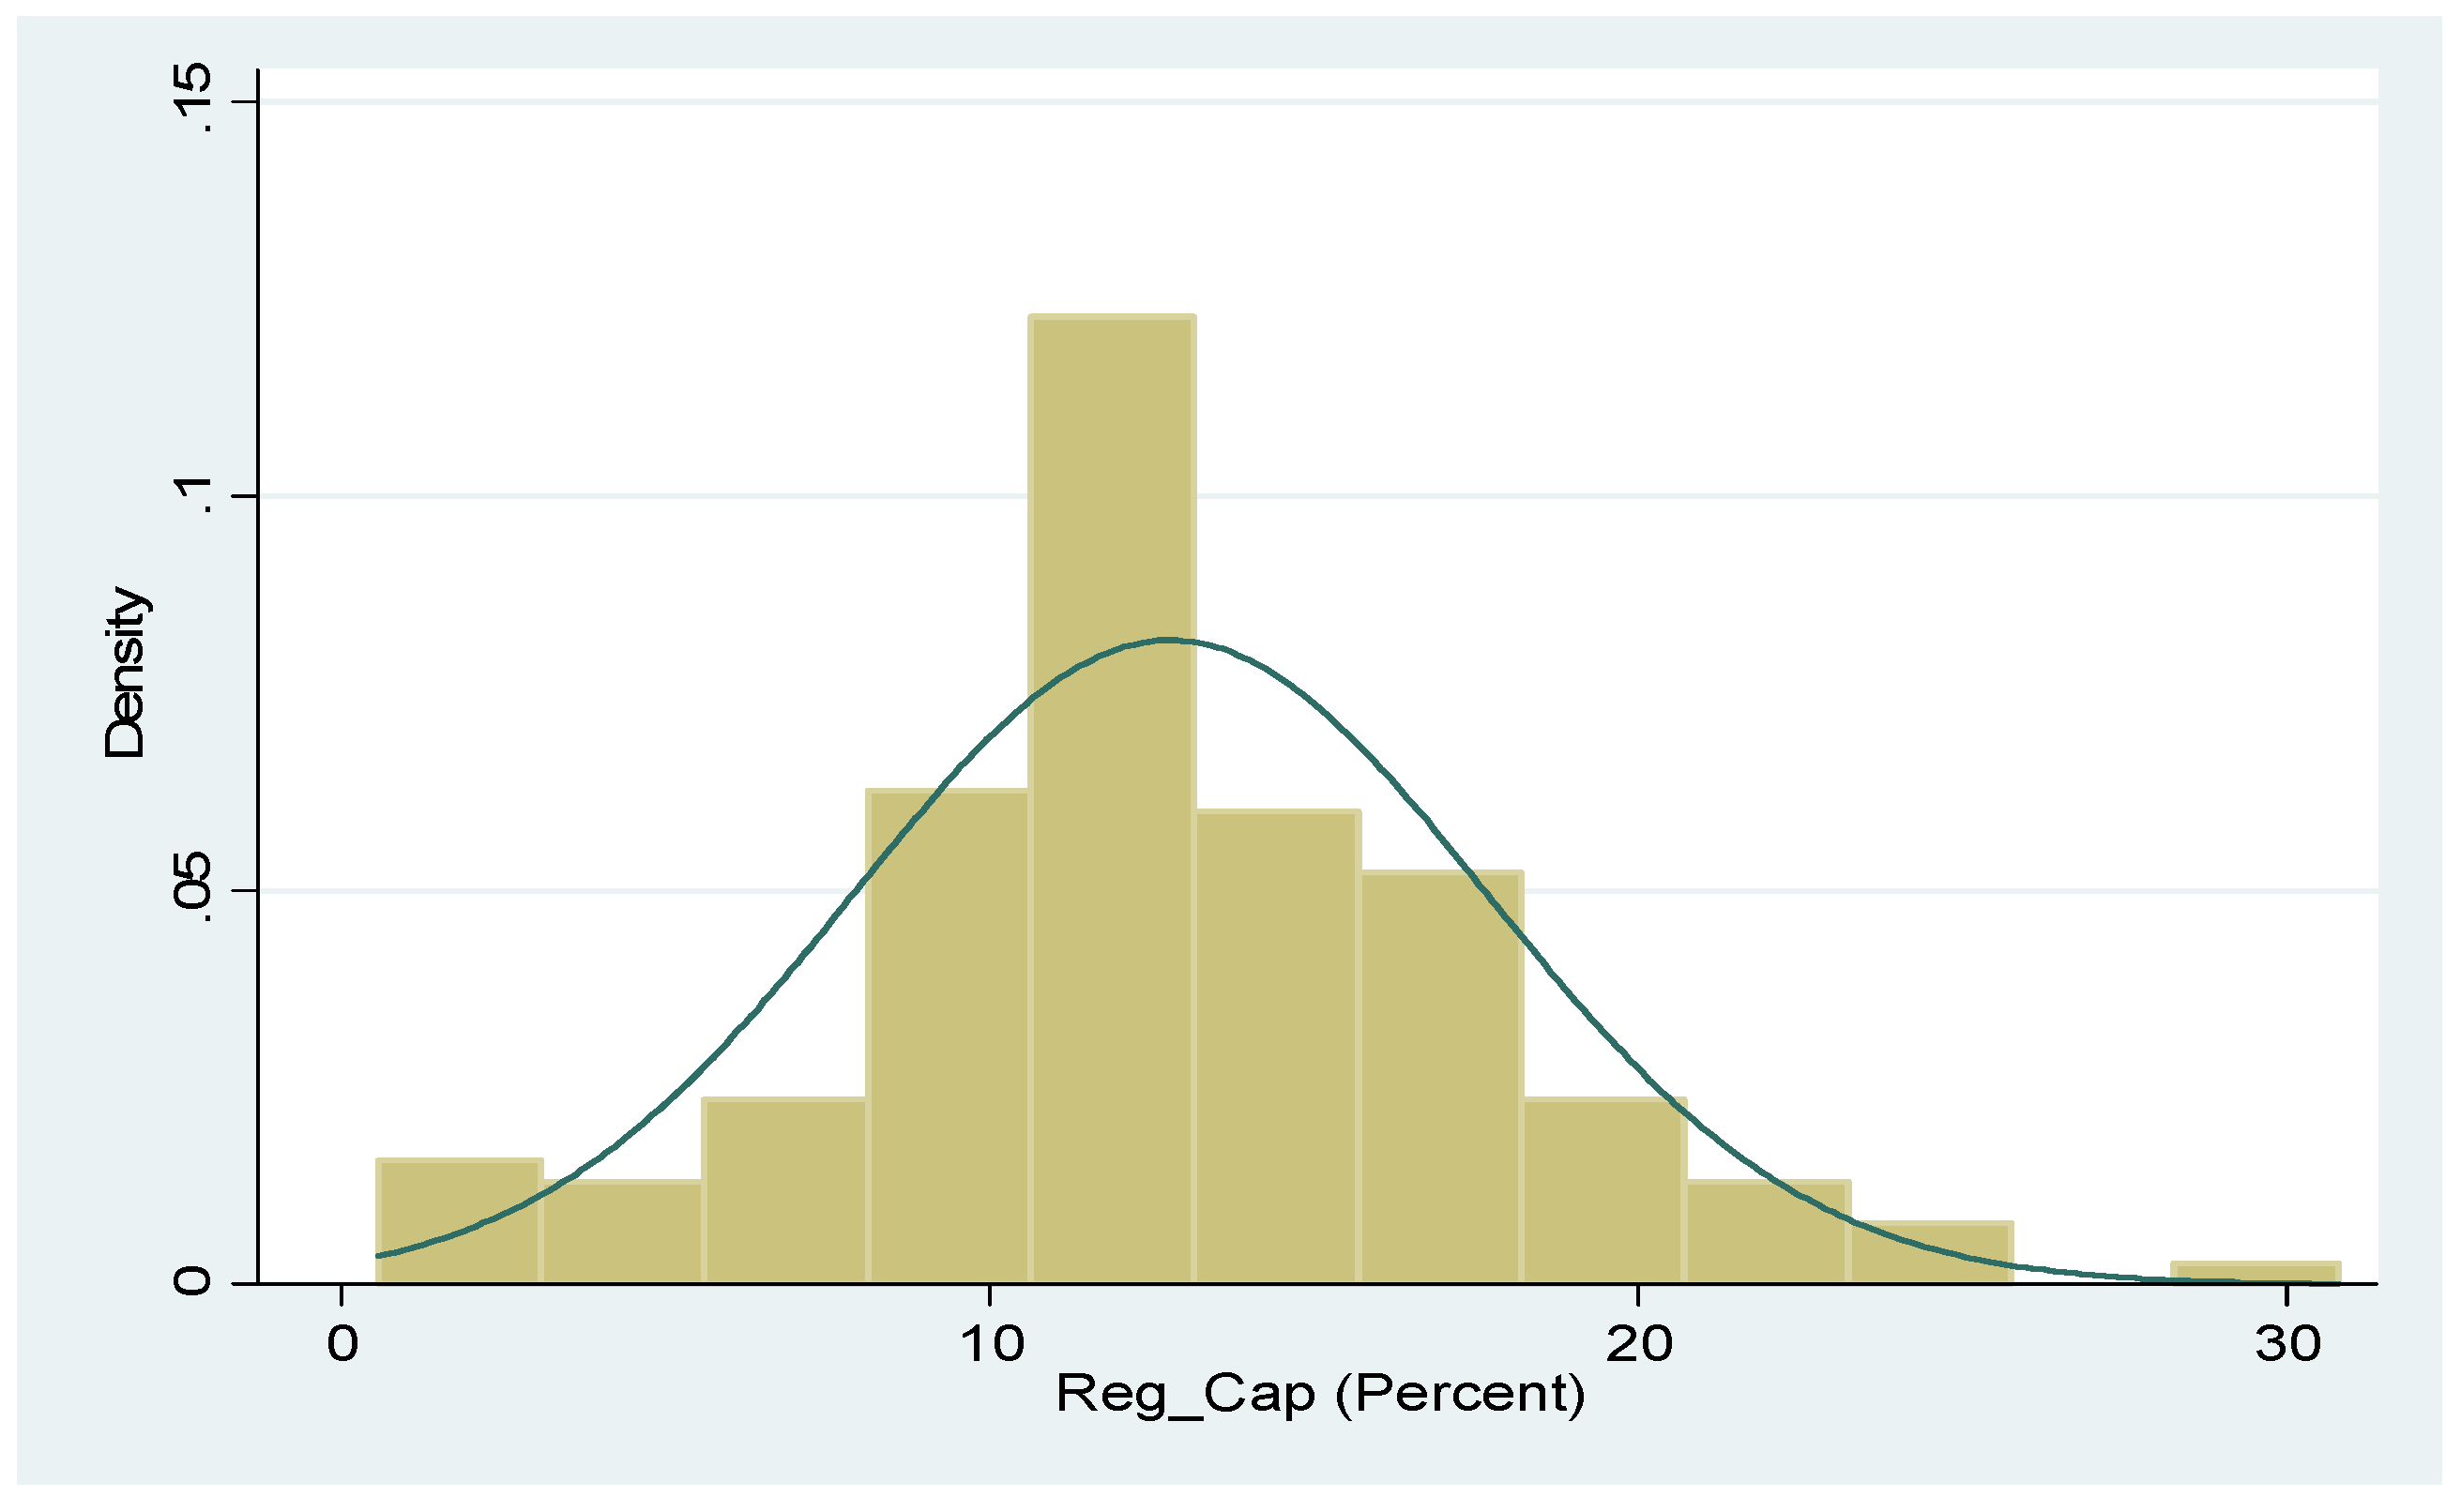
Table 1 reports summary statistics for the main variables. The mean value (65%) of RWA_TA shows that on average commercial banks have allocated 65% of total assets to risk-weighted assets. The standard deviation (12.03) of RWA_TA indicates considerable variation in commercial banks’ investment in risk-weighted assets. The mean value of NPL_GL is 12.32% and its standard deviation (10.58) exhibits almost the same trend as RWA_TA. The mean value of Reg_Cap ratio is 12.78%, which indicates that on average banks maintained regulatory capital ratios higher than the minimum limits of 8% to 10% as required by SBP over the sample period.
Figure 2 shows the sample distribution of Reg_Cap variable. As shown, some banks have a Reg_Cap ratio lower than the minimum limit of 8%. Further, the Reg_Cap ratio is around 12% for most of the sample banks. However, the minimum value of 0.56% indicates that some banks in some years have failed to meet the minimum regulatory capital requirements, and have faced higher regulatory pressure. Regulatory pressure and other control variables also show considerable variation over the sample period.
Table 2 reports pair-wise correlations between variables. The Reg_Cap ratio has strong negative correlations with both bank risk-taking proxies (−0.38 with RWA_TA and −0.28 with NPL_GL), showing an inverse effect of capital adequacy ratios on bank risk-taking behavior.
6.2. Multivariate Regression Analysis
Now we turn to multivariate analysis. We calculated Equations (1) to (4) using the bias-corrected least squares dummy variable method and report the results in Models (1) to (4) in
Table 3. We estimate our models with the user-written Stata procedure, “xtlsdvc” of Bruno [
10], which requires a vector of initial coefficient values. The initial coefficient matrix can be estimated with difference [
49] or system [
11] GMM estimators. Flannery and Hankins [
47] found that LSDVC estimates are robust with any of the initial coefficient matrices, whether estimated with difference GMM or system GMM. For this study, we use a one-step system GMM procedure to get the initial coefficient matrix for the LSDVC results reported in
Table 3. The xtlsdvc command in Stata reports bootstrap standard errors.
All control variables appear significant in expected directions. Negative and significant coefficients of Log_TA in all four models show that large banks invest less in risk-weighted assets (Models 1 and 2) and have lower non-performing loan ratios (Models 3 and 4). These results are consistent with Altunbas, Carbo, Gardener, and Molyneux [
17], who found that large European commercial banks have lower portfolio risk, and Ahmad and Bashir [
50], who found that large Pakistani commercial banks have lower non-performing loans as compared to their small counterparts. Similarly, negative and significant coefficients of Liquid_TA show that banks that maintain higher liquidity ratios invest significantly less in risk-weighted assets as compared to banks that maintain lower liquidity ratios. These results are consistent with expectations and confirm that higher liquidity requirements impede banks’ ability to invest more in risk-weighted assets. Finally, positive and significant coefficients of the Deposits_TA variable show that banks that have higher deposit ratios invest more in risk-weighted assets (Models 1 and 2) and have higher non-performing loan ratios (Models 3 and 4). These results are consistent with Imran and Nishat [
45], who found that domestic deposits are a significant determinant of bank credit in Pakistan. These results of control variables confirm the validity of our model for further analysis. Now, we revert to the results of our main variables.
Coefficients of lags of dependent risk variables (L.RWA_TA and L.NPL_GL) are all positive and significant, confirming considerable persistence in bank risk-taking. Negative and significant coefficients of Reg_Cap variable in Models 1 and 3 show that risk-based capital adequacy requirements are effective
ex-ante in reducing bank risk-taking in high risk assets and
ex-post in lowering non-performing loan ratios of banks, respectively. The economic significance of these results is also noteworthy. One standard deviation change in Reg_Cap (4.88) in Model 1 is associated with a change in RWA_TA of −0.89 (−0.182 × 4.88), where the mean value of RWA_TA is 65.26. This suggests that the risk-weighted assets to total assets ratio will decrease by 1.4% (−0.89/65.26) if the capital adequacy ratio is increased by one standard deviation. Similarly, one standard deviation change in Reg_Cap (4.88) in Model 3 is associated with a change in NPL_GL of −0.41 (−0.084 × 4.88), where the mean value of NPL_GL is 12.32. This suggests that the non-performing loans to gross loans ratio will decrease by 3.3% (−0.41/12.32) if the capital adequacy ratio is increased by one standard deviation. These results are consistent with the findings of Jacques and Nigro [
5] for U.S. banks, Ediz, Michael, and Perraudin [
4] for U.K. banks, and Ma, Dai, and Huang [
21] for Chinese banks. However, our findings contradict those of Shrieves and Dahl [
7] for U.S. banks and Altunbas, Carbo, Gardener, and Molyneux [
17] for 15 European countries’ banks, for which they found a positive association between changes in bank capital and risk-taking.
As discussed in
Section 3, SBP has required all commercial banks to maintain a certain level of minimum paid-up capital in addition to the risk-based capital requirements. In this respect, the positive and significant coefficients of Lev_Dummy variable in all models suggest that the banks having paid-up capital lower than the required minimum limits have significantly higher credit risk. These findings, again, support the idea that less-capitalized banks have higher risk-taking.
The results of regulatory pressure variables LRP_HCAR and HRP_LCAR in Models 2 and 4 are largely the same as the Reg_Cap results and validate the negative relationship between regulatory pressure and bank risk-taking. Specifically, the negative and significant coefficients of both regulatory pressure variables in Model 2 indicate that all banks having actual capital adequacy ratios either below or above the required minimum limits have decreased portfolio risk in response to risk-based capital requirements. The economic significance of these results is also noteworthy. One standard deviation change in LRP_HCAR (0.02) is associated with a change in RWA_TA of −1.83 (−91.57 × 0.02), where the mean value of RWA_TA is 65.26. This suggests that the risk-weighted assets to total assets ratio will decrease by 2.8% (−1.83/65.26) if low regulatory pressure variable is increased by one standard deviation. Similarly, one standard deviation change in HRP_LCAR (0.18) is associated with a change in RWA_TA of −1.63 (−9.11 × 0.18), suggesting that the risk-weighted assets to total assets ratio will decrease by 2.5% (−1.63/65.26) if high regulatory pressure variable is increased by one standard deviation. Possible reasons for well-capitalized banks to decrease risk-weighted assets might be the lower credit demand in the economy and banks’ tendency to signal a better position of the bank to investors or to build capital buffers in advance to face lower regulatory pressure in the future. The implementation of Basel-III based more stringent capital requirements is expected by the SBP in coming years.
Similarly, negative parameter estimates on low regulatory pressure variable (LRP_HCAR) in Model 4 suggest that banks having capital adequacy ratios significantly above the required minimum limits have lower non-performing loans as compared to banks having capital adequacy ratios only marginally above the required minimum limits. On the contrary, positive parameter estimates on high regulatory pressure variable (HRP_LCAR) show that banks having capital adequacy ratios significantly lower than the required minimum limits have higher non-performing loans as compared to banks having capital adequacy ratios only marginally below the required minimum limits.
Negative coefficient estimate of HRP_LCAR with RWA_TA in Model 2 conflicts with its positive coefficient estimate with NPL_GL in Model 4. These are expected results. Higher non-performing loans and excessive booking of provisions can erode bank capital adequacy ratios. If capital adequacy ratios fall below the required minimum limits, banks can immediately reduce risk-weighted assets to increase capital adequacy ratios to meet the regulatory required limits. However, higher non-performing loans not only stay on bank balance sheets but also increase over time because unpaid interest is compounded with the principal amount of non-performing loans [
51]. This together suggests that banks having lower capital adequacy ratios reduce
ex-ante investments in risk-weighted assets but, at the same time, can have
ex-post higher non-performing loans.
In sum, the above results suggest that less-capitalized banks have higher assets portfolio risk in Pakistan. Assets portfolio risk decreases as the capital adequacy ratios of banks increase. In addition, all banks having capital adequacy ratios either above or below the required regulatory minimum limits have reduced assets portfolio risk in response to stringent risk-based capital requirements.
In the specific context of Pakistan, our findings complement Lee and Hsieh [
31], who find that commercial banks in 42 Asian countries (including Pakistan) have a negative association between capital and bank risk-taking. Our findings also support Haq, Faff, Seth, and Mohanty [
30] to the extent that they find a negative association between bank capital and credit risk. Our findings, together with the findings of recent studies, such as Ma, Dai, and Huang [
21] for Chinese banks and Maji and De [
22] for Indian banks, confirm that risk-based capital regulation is effective in reducing bank credit risk in developing countries.
6.3. Endogeneity and System GMM Multivariate Regression Analysis
Although our results in
Table 3 are consistent and robust with both bank risk-taking proxies, one concern about Models 1 and 2 is endogeneity between the dependent variable (RWA_TA) and the main independent variable (Reg_Cap). Endogeneity is expected due to two reasons. First, banks can increase the capital adequacy ratio (Reg_Cap) by decreasing risk-weighted assets, while at the same time any decrease in risk-weighted assets due to other reasons can translate into higher capital adequacy ratios. For example, risk-weighted assets can decrease due to weak economic conditions, which can force banks to allocate a lower amount of assets to risk-weighted assets. Second, banks can decrease the RWA_TA ratio after the announcement of higher capital adequacy requirements but prior to the implementation period. However, this latter concern is not severe for our study. Over the sample period of our study, SBP increased its capital adequacy ratio to 9% for 2008 and to 10% for 2009 onwards. Since this change was only announced in November 2008 (BSD Circular No. 30 of 2008, 25 November 2008) and there was no gap between the announcement and the implementation period, the causal effect is likely to be from capital to risk-weighted assets.
To eliminate these endogeneity concerns, we re-estimated Equations (1) and (2) using one-step GMM system estimator and report the results in
Table 4. Following the advice of Roodman [
12], we use the instruments collapse option to reduce instruments’ proliferation problem in both models. We treat Reg_Cap in Model 1 and the two regulatory pressure variables in Model 2 as endogenous and use their one-period lag values together with the lag of the dependent variable as instruments. We also included year dummies in Equations (1) and (2) for the system GMM. Year dummies serve two purposes. First, Roodman [
12] suggests that the basic assumptions applying to system GMM estimator are more likely to hold in the presence of year dummies. Second, the inclusion of year dummies in regression models controls for economic conditions and reduces the reverse effect of any decrease in risk-weighted assets on capital adequacy ratios.
The results of diagnostic statistics for the one-step system GMM are consistent with the assumptions of this econometric model. In particular, the coefficients for second-order autocorrelation, AR (2) in the first-differenced residuals are insignificant. The Sargan test of over-identifying restrictions, which tests whether the instruments as a group appear exogenous, shows insignificant results, confirming that the instruments are exogenous. The number of instruments (25 in Model 1 and 30 in Model 2) is not too high as compared to the number of banks (21), and therefore we can expect that the issue of instruments proliferation is not undermining the validity of our results.
Even though coefficients for some of the control variables (e.g., Log_TA) weaken, the results for capital adequacy ratio in Model 1 and regulatory pressure variables in Model 2 remain the same as in
Table 3. Reg_Cap as well as both regulatory pressure variables, LRP_HCAR and HRP_LCAR, show negative and significant coefficients. These findings confirm that the results of Models 1 and 2 in
Table 3 are not biased due to endogenous independent variables.
6.4. Further Robustness Tests: Alternative Bank Risk Proxies and Time Periods
We performed several robustness tests to further confirm the main results. First, bank assets portfolio risk might be affected by macro-economic conditions such as GDP growth rates and level of inflation, etc. To eliminate the concern that our results are not biased due to these omitted macro-economic variables, we included year dummy variables in all models of
Table 3 to control for these fixed year effects. We re-estimated all four models of
Table 3 and report the results in
Table 5. As shown, the results remained consistent, confirming that our results are not biased due to omitted macro-economic variables.
Second, we used bank loan loss provisions (LLP_GL) and z-scores (Log_Z_score) as alternative proxies of bank risk-taking. LLP_GL is the annual loan loss provisions to gross loans ratio of each bank. Log_Z_score equals −1× [log [(ROA+Reg_Cap)/σ(ROA)]], where ROA is the annual return on assets before loan loss provisions and taxes, Reg_Cap is annual capital adequacy ratios, and σ(ROA) is the standard deviation of annual values of return on assets before loan loss provisions and taxes over the period 2005–2012. Higher values of LLP_GL represent higher bank credit risk, whereas higher values of Log_Z_score imply higher probability of bank default [
34]. We re-estimated Models 1 and 2 of
Table 3 with these alternative bank risk-taking proxies and report the results in
Table 6. As shown, the results appear consistent qualitatively. Reg_Cap is negative and significant in Models 1 and 3, confirming that higher capital requirements have decreased bank credit risk and the probability of bank default, respectively. Similarly, the low regulatory pressure variable (LRP_HCAR) is negative whereas the high regulatory pressure variable (HRP_LCAR) is positive in Models 2 and 4. These results again confirm that banks having capital adequacy ratios above the regulatory minimum limits have lower credit risk and probability of default, whereas banks having capital adequacy ratios below the regulatory minimum limits have experienced higher credit risk and have a higher probability of default.
Third, we confirmed that our results are not biased due to some outliers included in our main sample. For doing so, we considered those banks that have the highest or lowest values for both main bank risk-taking proxies (NPL_GL and RWA_TA) as outliers. Specifically, first we excluded the two banks having the lowest average NPL_GL ratios and the two banks having the highest average NPL_GL ratios in our sample. We re-estimated all four models of
Table 3, excluding these outlier banks and report results in
Table 7. As shown, the results largely remained the same as in
Table 3. We also excluded two outlier banks based on the lowest and highest average RWA_TA ratios and re-estimated all four models of
Table 3. In the unreported results, we again observed that the main results held.
These robustness tests show that our main results are robust and consistent. In sum, our results confirm that the assets portfolio risk of commercial banks in Pakistan has decreased in response to more stringent risk-based capital adequacy requirements.
7. Conclusions
In response to the financial crisis of 2007–2009, the Basel Committee on Banking Supervision has finalized the Basel-III Accord, in which both the quantity and the quality of risk-based capital requirements have been improved significantly. However, existing research reports mixed results for the association between risk-based capital requirements and bank risk-taking behavior. In this paper, we examine the effects of risk-based capital requirements on bank assets portfolio risk. For analysis, we used an unbalanced panel dataset of 21 listed commercial banks of Pakistan over the period from 2005 to 2012. We used the capital adequacy ratio to measure bank capital and risk-weighted assets to total assets ratio to measure bank assets portfolio risk for main analysis. The results show that stringent risk-based capital requirements have caused a reduction in the assets portfolio risk of commercial banks in Pakistan. We also generated two regulatory pressure variables to examine the response of banks having actual risk-based capital ratios either lower or higher than the regulatory required minimum limits. Our results confirm that all banks having risk-based capital ratios either higher or lower than the regulatory required limits have decreased assets portfolio risk in response to higher risk-based capital requirements. These results hold when we use alternative proxies of bank risk-taking, alternative estimation methods, and alternative samples.
Our findings have important implications for the ongoing debate about higher capital requirements to ensure banking sector stability. Specifically, our findings favor the recent/after financial crisis literature [
52], which proposes that bank owners should have higher skin in banks in the form of higher capital levels to ensure banking sector stability.
Another implication is that risk-based capital regulation is effective in reducing bank assets portfolio risk in developing countries. Although the previous literature reports contradicting evidence on the impact of risk-based capital regulation on bank assets portfolio risk for developed countries, our findings together with the findings of recent studies, such as Ma, Dai, and Huang [
21] for Chinese banks and Maji and De [
22] for Indian banks, confirm that risk-based capital regulation is effective in reducing bank assets portfolio risk in a developing countries context. One possible reason is that capital regulation has a more pronounced effect on bank assets portfolio risk due to the heavy reliance of commercial banks on loan portfolio income in developing countries. Another possibility is that due to underdeveloped financial systems in developing countries, banks have fewer opportunities for regulatory arbitrage through financial innovations to increase assets portfolio risk.
Recent debate suggests that higher capital requirements increase the overall cost of capital for banks due to a higher proportion of costly equity in capital structures. Future research may focus on the question “what is the impact of higher capital requirements on the cost of capital of commercial banks, not only for Pakistan but also for other countries’ banking sectors?” To recover the higher cost of capital and maintain sufficient return on capital, banks can increase the interest rates charged on loans. Higher interest rates on loans can increase the cost of funds in a country and might have an adverse impact on investments and economic growth. Another potential question for future research is the impact of higher capital requirements on lending rates of banks.


