1. Introduction
The “One Belt and One Road” (OBOR) project was initiated by Chinese President Xi Jinping as a regional development strategy and focuses on the economic development and cooperation of China with other countries. The main purpose of this project is to promote the development of China, especially simultaneously in central and western regions, along with promoting economic development in Central Asia. The five key priorities of this project include (i) increasing trade flow, (ii) encouraging policy coordination, (iii) improving connectivity, (iv) obtaining financial integration, and (v) fortifying closeness between people (
Latief and Lefen 2018). The countries along the OBOR have the potential to open new markets for China to improve trade and investment activities (
Ding et al. 2017). As a result of this project, trade and investment activities in participating countries will be accelerated. However, these activities are associated with the variations in the exchange rate of those countries.
The relationship between exchange rate volatility and international trade is the central part of the discussion of alternative exchange rate regimes. Supporters of fixed exchange rates claim that exchange rate volatility acts as a weak factor for attaining prospective international trade flows. It is based on the view that exchange rates are majorly determined by fundamentals, where the volatility of an exchange rate may be dependent on changes in parity. The flexible exchange rate is based on the view of facilitating the adjustments of the balance of payments from external sources. Exchange rate volatility carries direct and indirect effects on trade flows through transmission mechanisms on the structure of employment, investment, and output. There is an old view that exchange rate volatility is an inborn risk factor. This depends on the assumption that the profitability of firms and variations in exchange rates have a fixed relationship with each other (
Hwang and Lee 2005).
The relationship of exchange rate volatility with international trade has been extensively studied in the literature but there is no unanimity about this relationship. Literature can be divided into two groups: One group argues in favor of a positive relationship of exchange rate volatility with trade, while the other group is on the opposite side (
Cheong et al. 2005). Theoretically, the negative and positive relationship between exchange rate volatility and international trade can be described in the subsequent ways. If the risk-averse traders face a higher transaction risk and higher cost due to exchange rate volatility, they will decrease the volume of trade. On the other side, if the anticipated cost of import expenditure decreases or the anticipated utility of export revenue increases, this leads to a rise in exchange rate volatility, which can ultimately increase the trading volume. There are also some studies which have highlighted the insignificant effect of exchange rate volatility on international trade (
Kim 2017).
Imports and exports are part of the current account of the balance of payment (BOP), in the same way as FDI is part of the capital account. The formation of capital plays an important role in achieving sustainable economic development. Developing economies rely on foreign capital and construct policies to attract FDI (
Comes et al. 2018). FDI has spillover effects on host economies through human capital, knowledge transfer and competitions in markets (
Wang and Liu 2017;
Wang et al. 2016) and ultimately increases capital stock and stimulates economic growth (
Peng et al. 2016). FDI can also cause negative effects in spillovers in worse situations (
Chou et al. 2014). FDI generally comprises two items: Equity and debt held by firms in association with foreign entities. The basic feature of FDI is corporate control, which is different from foreign portfolio investment. FDI is different from trade because of its different features. The inference from these observations is that FDI flows are sensitive to exchange rate considerations. In principle, the relationship of the exchange rate with FDI should be more parallel as compared to the relationship of the exchange rate with trade. FDI yields a return, which may translate into the flow of profit or loss (
Crowley and Lee 2003).
In general, countries compete with each other to attract FDI. Multinational firms select a location for investment based on different factors (
Wu et al. 2018). The exchange rate volatility can affect the investment decisions of multinational firms by creating unexpected profit in trade and non-trade sectors and also by the ambiguous cost of imported goods. In some previous decades, the exchange rate volatility badly affected the investment decisions and profits of firms. Exchange rate volatility can affect the FDI in different forms, subject to the place where goods are produced. If the investor desires to invest in a local market, trade and FDI could be used as substitutes. In that scenario, FDI inflow can be increased due to the appreciation of the domestic currency, which helps to increase the buying capacity of domestic consumers, while the devaluation in the exchange rate of the host economy helps to increase FDI by decreasing the cost of capital (
Chowdhury and Wheeler 2008).
The OBOR initiative of the Chinese government can play an important role to promote trading and investment activities in the participating countries of this project. As a result of this project, the overall economies of these countries could be improved. Most of the countries along the OBOR have poor infrastructure and lack the latest technology. The Chinese government considers these countries as the effective outlets for promoting investment and trading activities. Before 2013, these countries were not the major destination of Chinese investment. After 2013, the Chinese government changed their investment policies and these countries became the hot destination of Chinese investment (
Liu et al. 2017).
The empirical and theoretical literature shows conflicting opinions about the relationship of exchange rate volatility with international trade and FDI. This paper aims to reexamine the relationship between these variables in the context of developing countries along the “One Belt and One Road” project, which include Bangladesh, Bhutan, India, Maldives, Nepal, Pakistan, and Sri Lanka. We used the annual panel data for the period 1995 to 2016 and measured the exchange rate volatility by applying GARCH (1,1) and TGARCH (1,1) models. We estimated the effect of exchange rate volatility on international trade and FDI by applying a fixed effect model based on Hausman test results.
The rest of the paper is organized as follows. The next section reviews work completed by other authors on the relationship of exchange rate volatility with international trade and FDI. The third section details the sample selection, data collection, variables measurement, and econometric model. The fourth section provides results and discussion about the study. The last section gives the concluding remarks and policy implications.
2. Review of the Literature
2.1. Exchange Rate Volatility and International Trade
There are many factors that play important roles in the relationship of exchange rate volatility with international trade, which include culture and language, income, trade agreements, prices, and geographic proximity. The exchange rate volatility can arise from three different factors: Variations in basic issues (e.g., buying power of consumers), variations in the basic characteristics of foreign exchange market (e.g., noise traders, portfolio changes, excess rumors, and cause effects), and the noisy signal of expected fluctuations in future policy (e.g., interest rate, money supply, inflation rate and output growth) (
Tadesse 2009).
It is well established in the literature that exchange rate volatility affects economic activity in the country. There are conflicting arguments in previous studies about the relationship of exchange rate volatility with international trade. Previous studies can be divided into three categories: (1) Studies which reported positive results, (2) studies which reported negative results, and (3) studies which reported diverse results. The empirical studies that relate to the first category by showing the positive relationship between exchange rate volatility and international trade include
Cheong et al. (
2005);
Kim (
2017);
Hwang and Lee (
2005);
Vieira and Macdonald (
2016). For instance,
Cheong et al. (
2005) investigated the dynamic interrelationship between trading volume, price competitiveness, and exchange rate uncertainty by focusing on the manufacturing industry of the U.K. and found that exchange rate volatility positively affects export trade and ultimately affected the economic performance of the country.
2.2. Exchange Rate Volatility and Foreign Direct Investment (FDI)
The literature about the relationship between exchange rate volatility and FDI is insufficient and relatively inconclusive. There are a number of studies which explored the effect of exchange rate volatility on aggregate investment, but theoretically, results are uncertain while empirical results are divided. In general, the literature highlights that investment has a negative relationship with exchange rate volatility and with the appreciation of the domestic currency, although industry and firm-specific features are significant determinants as well (
Kyereboah-Coleman and Agyire-Tettey 2008). The empirical and theoretical studies about the relationship between exchange rate volatility and FDI can be divided into two categories: (1) Studies which showed negative results, and (2) studies which showed mixed results. The studies that fall in the first category by showing a negative relationship between exchange rate volatility and foreign direct investment (FDI) include
Durairaj and Nirmala (
2012);
Al-Abri and Baghestani (
2015);
Sharifi-Renani and Mirfatah (
2012);
Susan Pozo (
2001). For instance,
Durairaj and Nirmala (
2012) investigated the relationship between exchange rate volatility and FDI by considering India as a sample. They used quarterly data for the time period 1996 to 2010. They applied the Autoregressive Distributed Lag (ARDL) bounds technique to analyze the short and long-run relationship between these variables. They also studied the factors which inspire the investors to make investment decisions. The findings revealed that exchange rate volatility and FDI have an inverse relationship with each other and suggested that a stable flexible exchange system is better for attracting FDI in India.
The other study,
Al-Abri and Baghestani (
2015), studied eight emerging Asian economies, Thailand, Philippines, Indonesia, Malaysia, South Korea, China, and India, for the period of 1980–2011. They found that a greater stock of foreign liability decreased the exchange rate volatility for South Korea, India, China and Singapore, but an opposite trend of exchange rate volatility was seen for Thailand, Philippines, and Indonesia.
Sharifi-Renani and Mirfatah (
2012) used the Johansen cointegration technique to find out the determinants of FDI in Iran for the time period 1980 to 2006. They found that exchange rate, trade openness, and GDP have a direct relationship with FDI, but on the other side, exchange rate volatility and oil prices have an inverse relationship with FDI.
Susan Pozo (
2001) concluded that exchange rate volatility negatively affects FDI by applying GARCH.
The studies that fall in the second category by showing mixed evidence about the relationship between exchange rate volatility and FDI include
Chowdhury and Wheeler (
2015);
Crowley and Lee (
2003);
Kosteletou and Liargovas (
2000). For instance,
Chowdhury and Wheeler (
2015) analyzed the relationship between exchange rate volatility and foreign investment in Canada, the United Kingdom (U.K.), the United States of America (U.S.A.), and Germany. They used vector autoregressive models and indicated that exchange rate volatility did not significantly affect foreign investment in the case of any country.
Crowley and Lee (
2003) applied the GARCH (1,1) model to measure stochastic volatility in exchange rates. They studied 18 OECD countries for the period of 1980–1998 and found weak empirical evidence of a relationship between exchange rate volatility and FDI across countries. Countries which had comparatively stable exchange rates tended to be slightly affected.
Kosteletou and Liargovas (
2000) suggested that there is also an ambiguous relationship between exchange rate volatility and FDI in theory.
2.3. Measures for Exchange Rate Volatility
The approaches to measuring exchange rate volatility have been transformed with the passage of time to present new econometric techniques. However, there is no consensus in the literature on a single measure for volatility. The most common measures of variance are used for it, but these vary with studies. The volatility can be measured by taking the standard deviation or rate of change within period one, a moving standard deviation of the real or nominal exchange rate (
Bahmani-Oskooee and Hegerty 2007).
There is a mixed trend of using exchange rate measures, and neither rate dominates the other in the literature. Previous studies have used both the real and nominal rate as a measure of the exchange rate. The real exchange rate measures the actual price of imported and exported goods. The real exchange rate integrates the price levels of the exporting and importing countries; it also measures the volatility in the price level. Therefore, the volatility of the nominal exchange rate is usually desired at first (
Bahmani-Oskooee and Hegerty 2007).
Akhtar and Hilton (
1984) conducted a pioneer study to examine the exchange rate volatility. They measured the exchange rate volatility by using the standard deviation of daily observations for the period of three months. Further,
Aghion et al. (
2009) also computed exchange rate volatility as the annual standard deviation of the growth rate of the effective real exchange rate. Moreover,
Grossmann et al. (
2014) also used the annual standard deviation of daily US spot exchange rates to compute exchange rate volatility.
Kenen and Rodrik (
1986) introduced moving standard deviation to measure month-wise variations in exchange rate. This method has the benefit of being stationary. This method was prominently used before co-integration analysis was invented.
Bleaney (
1992) also used the same method by using the level instead of measuring the change in exchange rate.
Engle and Granger (
1987) introduced the new time series method, namely “Autoregressive Conditional Heteroskedasticity (ARCH)”, to measure volatility. In the literature, it is more commonly used to measure exchange rate volatility. This method calculates the variance of the disturbance term for each period as a part of errors in prior periods. This model can be extended by adding more lags; the further extension is commonly known as the GARCH model, which includes the moving average method. Moreover,
Aftab et al. (
2017) also measured exchange rate volatility by using the GARCH process.
3. Materials and Methods
3.1. Sampling and Data Collection
We selected the sample of seven developing countries along “One Belt and One Road”, namely Bangladesh, Bhutan, India, Maldives, Nepal, Pakistan and Sri Lanka based on the availability of data to investigate the relationship between exchange rate volatility and international trade and FDI. We used annual data on FDI, international trade, exchange rate, economic freedom, inflation, GDP, interest rate, and industrial growth for the period 1995 to 2016. The data for economic freedom was collected from the U.S. Heritage Foundation and other variables from International Financial Statistics (IFS) (a database developed by IMF) and World Development Indicators (WDI) (a database developed by the World Bank).
3.2. Variables Measurement
The “One Belt and One Road” project is the major input for sustainable economic development in the host countries. As a result of this project, trade and investment activities could be promoted in the host countries. However, these activities can be affected by many factors. The most important factor is the fluctuations in the exchange rates of the host countries. Therefore, we selected international trade and FDI as our dependent variables. We used FDI net inflows as a ratio of GDP, and international trade was measured by total trade as a ratio of GDP. We used fluctuations in exchange rates as our explanatory variable, measured by applying GARCH (1,1) and TGARCH (1,1) models on data of the real effective exchange rate
1.
Political financial factors can play an important role in the OBOR project because it is a kind of government-led cooperation project, particularly considered so by the Silk Road Fund (SRF) and Asian Infrastructure Investment Bank (AIIB). The economic freedom index is a weighted index that can measure the economic freedom of a country comprehensively by calculating degrees of trade restriction, government regulations, economic policy, property rights, and other indicators. Thus, we used the economic freedom index in this paper as a political–financial indicator to measure the degree of financial market development and economic openness.
We also included some important macroeconomic variables as control variables, such as inflation measured by consumer price index (CPI), real interest rate, real gross domestic product (GDP) growth, and industrial growth measured by value-added growth. The description of variables and sources of data are shown in
Table 1.
3.3. Econometric Model
We measured the exchange rate volatility by applying the symmetric GARCH model and asymmetric threshold-GARCH model following the process described by
Hull and Basu (
2016) and
Asteriou and Hall (
2006). The simplest forms of the GARCH model and TGARCH model are GARCH (1,1) and TGARCH (1,1), which can be shown as follows:
where
is constant.
α,
β, and
are coefficients.
is the mean square of the previous time period.
is the variance of the previous time period.
dn takes the value of 1 for 𝜇
t < 0, and 0 otherwise.
According to this paper, Equation (1) is the mean equation, which represents the relationship between returns with its lag returns, while Equations (2) and (3) are the variance equations which explain the volatility.
To investigate the effect of exchange rate volatility on international trade and FDI, we estimated the Equations (4) and (5); in line with a prior study (
Bleaney and Greenaway 2001), we used the fixed effect model with the country and year dummies based on Hausman test results
2.
In Equations (4) and (5), for country i and time period t, and represent international trade and foreign direct investment, respectively. is exchange rate volatility, is economic freedom, is inflation rate, is real GDP growth, is interest rate, is industrial growth. and denote error terms in both equations.
4. Results and Discussion
Considering that China is in a developing phase, it requires sustainable economic development, because facing most of the hitches which are presently confronted by China rely on economic growth being solved (
Yue et al. 2016). The Chinese government is looking for its capital abroad after heavy investment in many domestic industries such as cement, coal and solar panels. The objective of the Chinese government is to decrease undue industrial capacity at home and to increase financial returns. One of the favorite projects of the Chinese government, namely “One Belt and One Road” (OBOR), aims to restructure the famous Silk Road. This project has many financial benefits for China and its participating countries. This project was initiated in February 2014 with
$40 billion investment by using Beijing’s plentiful foreign exchange reserves. Since then, this project has started to attract other foreign investors such as international pension funds, sovereign wealth funds, insurance companies, and private equity funds (
Wilson 2016). According to a report issued by the International Trade Institute
3, China, 65 countries will participate in the “One Belt and One Road” (OBOR) project. Most of the participating countries are the developing countries from different regions. As mentioned in the introductory section, the objective of this paper is to analyze the effect of exchange rate volatility on international trade and FDI by focusing on developing countries that are part of “One Belt and One Road” project, which comprises Bangladesh, Bhutan, India, Maldives, Nepal, Pakistan and Sri Lanka. Many of these countries have different exchange rate regimes, as shown in
Table 2.
4.1. Descriptive Analysis
Table 3 describes the descriptive statistics of each variable. The average value of the international trade is 67.364, with a standard deviation of 43.501. The mean value of FDI is 1.7140 with a standard deviation of 2.4912. The values of both international trade and FDI show that international trade contributes more to the overall economic growth of OBOR-related countries as compared to FDI. The mean values of exchange rate volatility measured with GARCH and TGARCH models are 1.6330 and 1.6935, respectively, while the standard deviation which represents the variations of exchange rate volatility measured with GARCH and TGARCH models are 0.6312 and 0.6669, respectively. More specifically, we tested the pre and post 2014 variations of exchange rate volatility by employing Levene’s test for equality of variances (
Carroll and Schneider 1985) with monthly data for four years, results are shown in
Table A3 (
Appendix A). The total number of observations for this paper is 154.
4.2. Trends of Exchange Rate Volatility against International Trade and FDI
Figure 1,
Figure 2,
Figure 3,
Figure 4,
Figure 5,
Figure 6 and
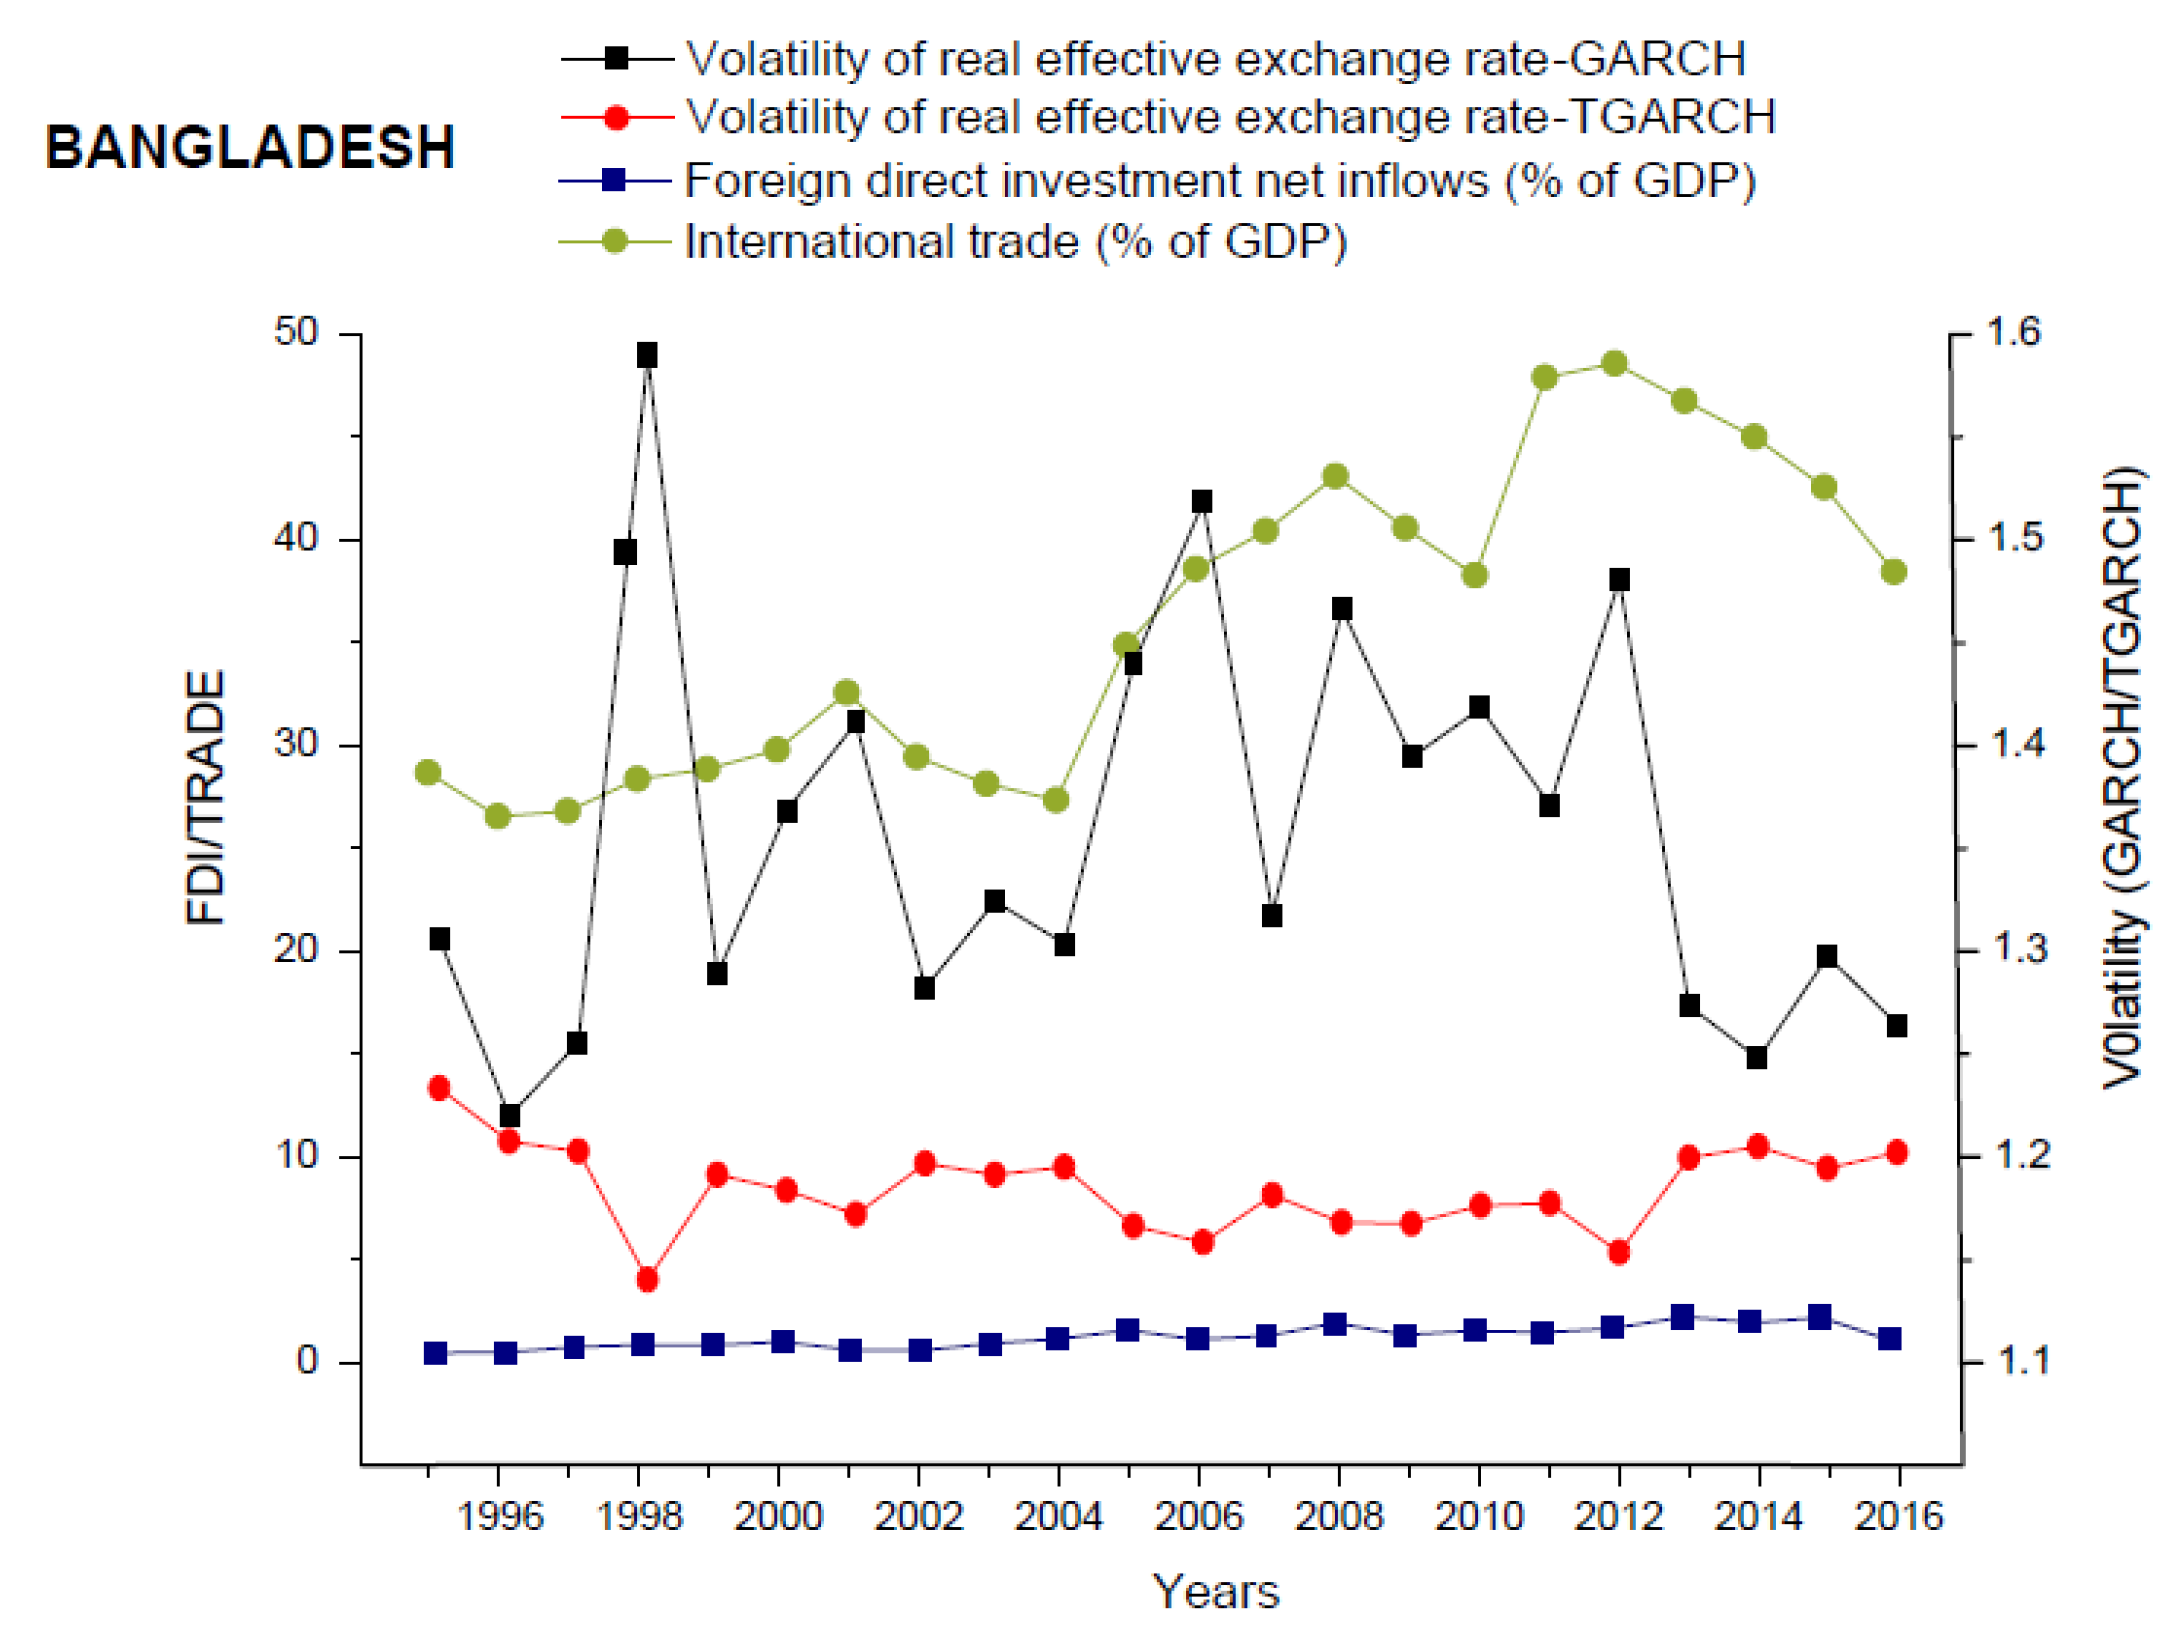
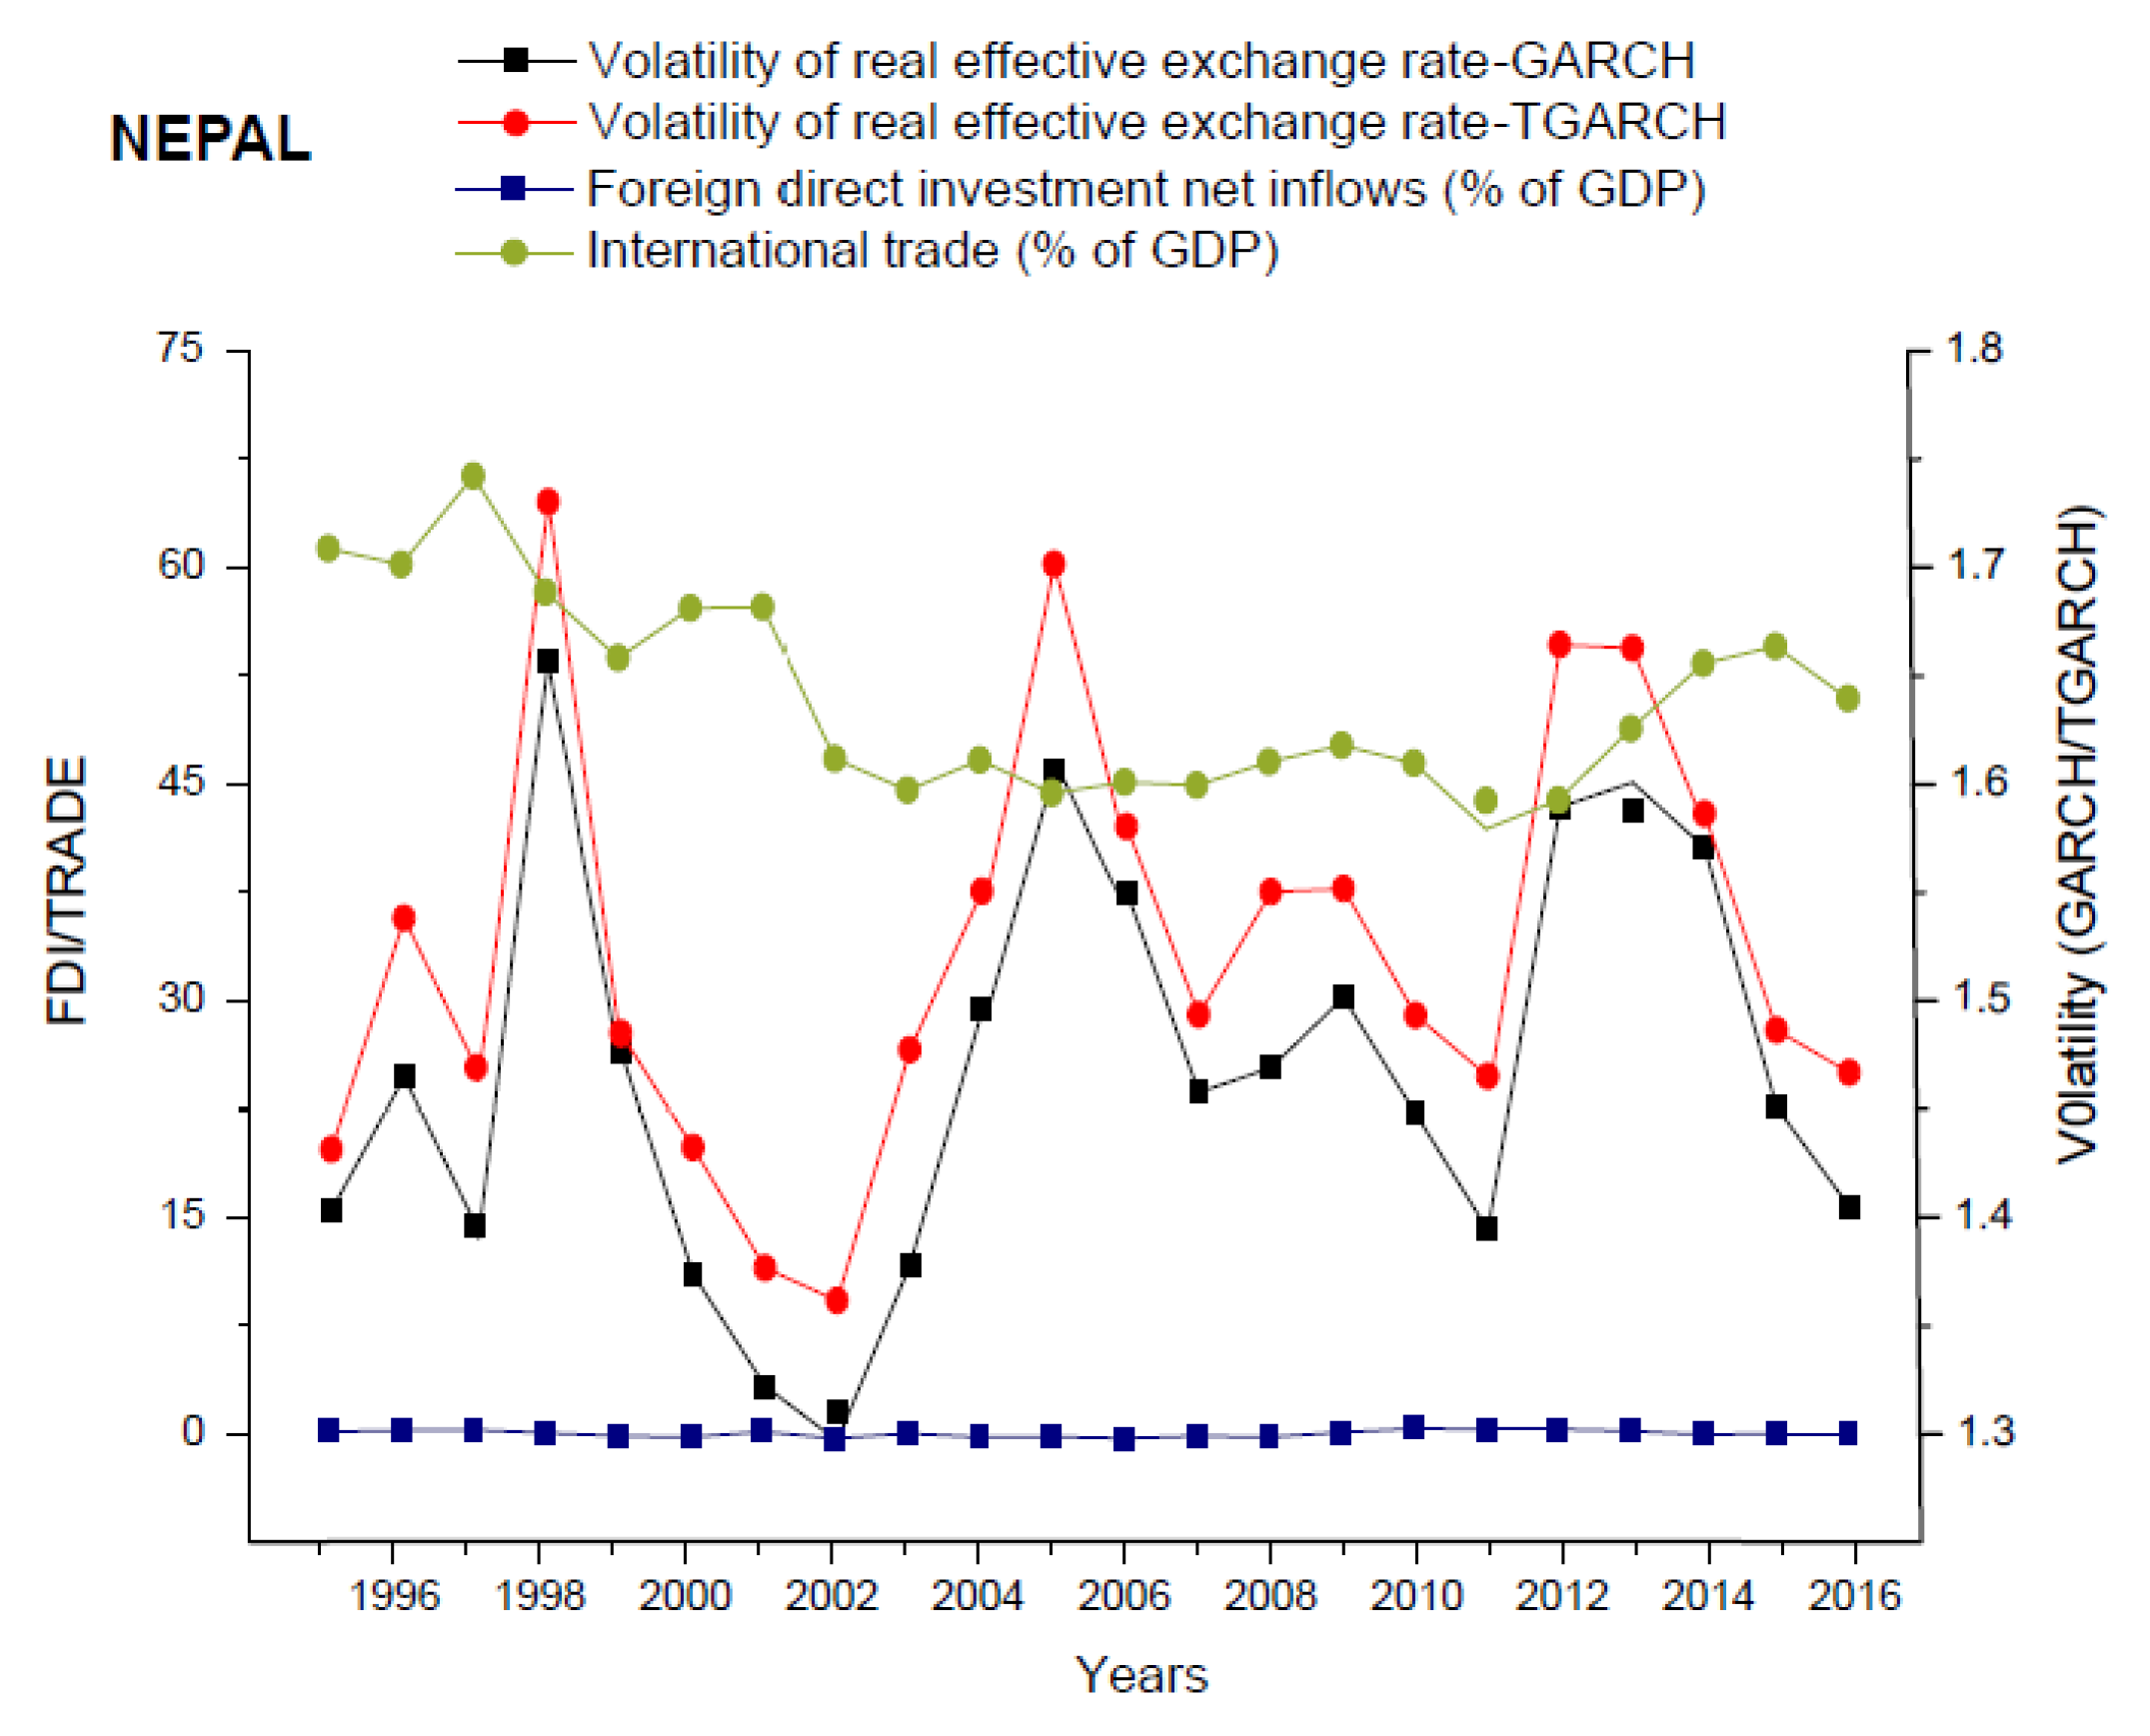
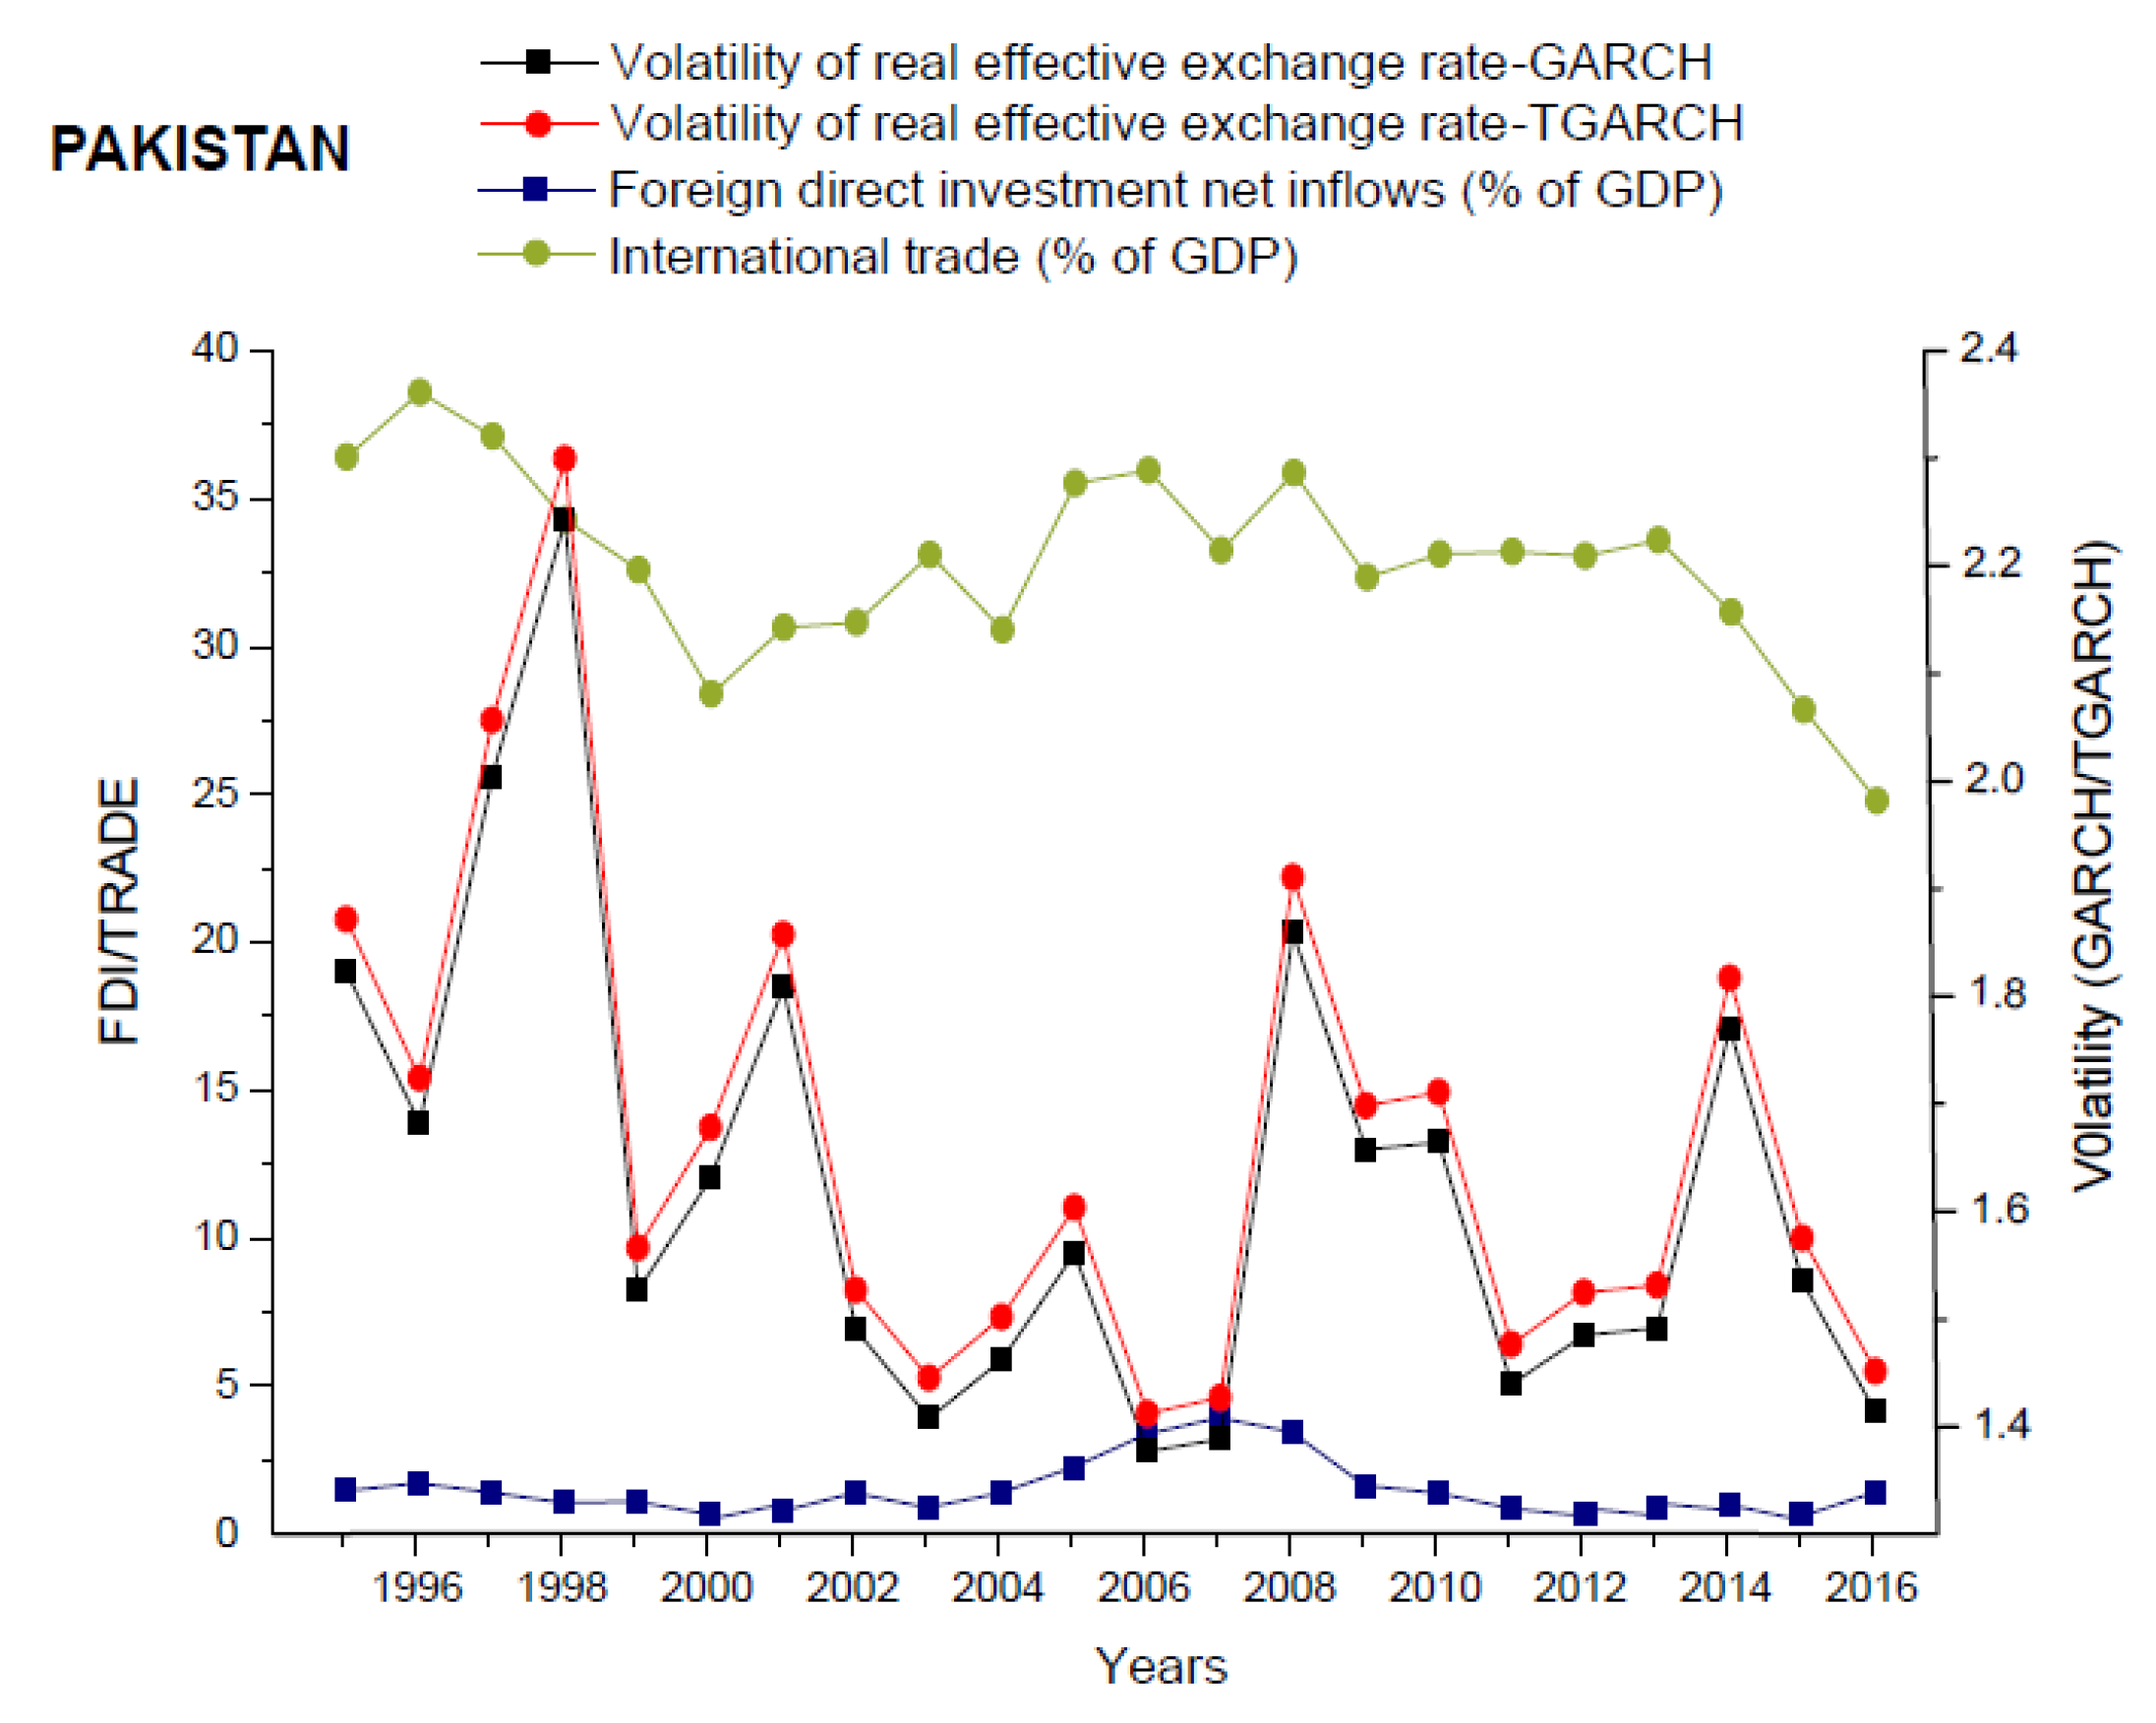
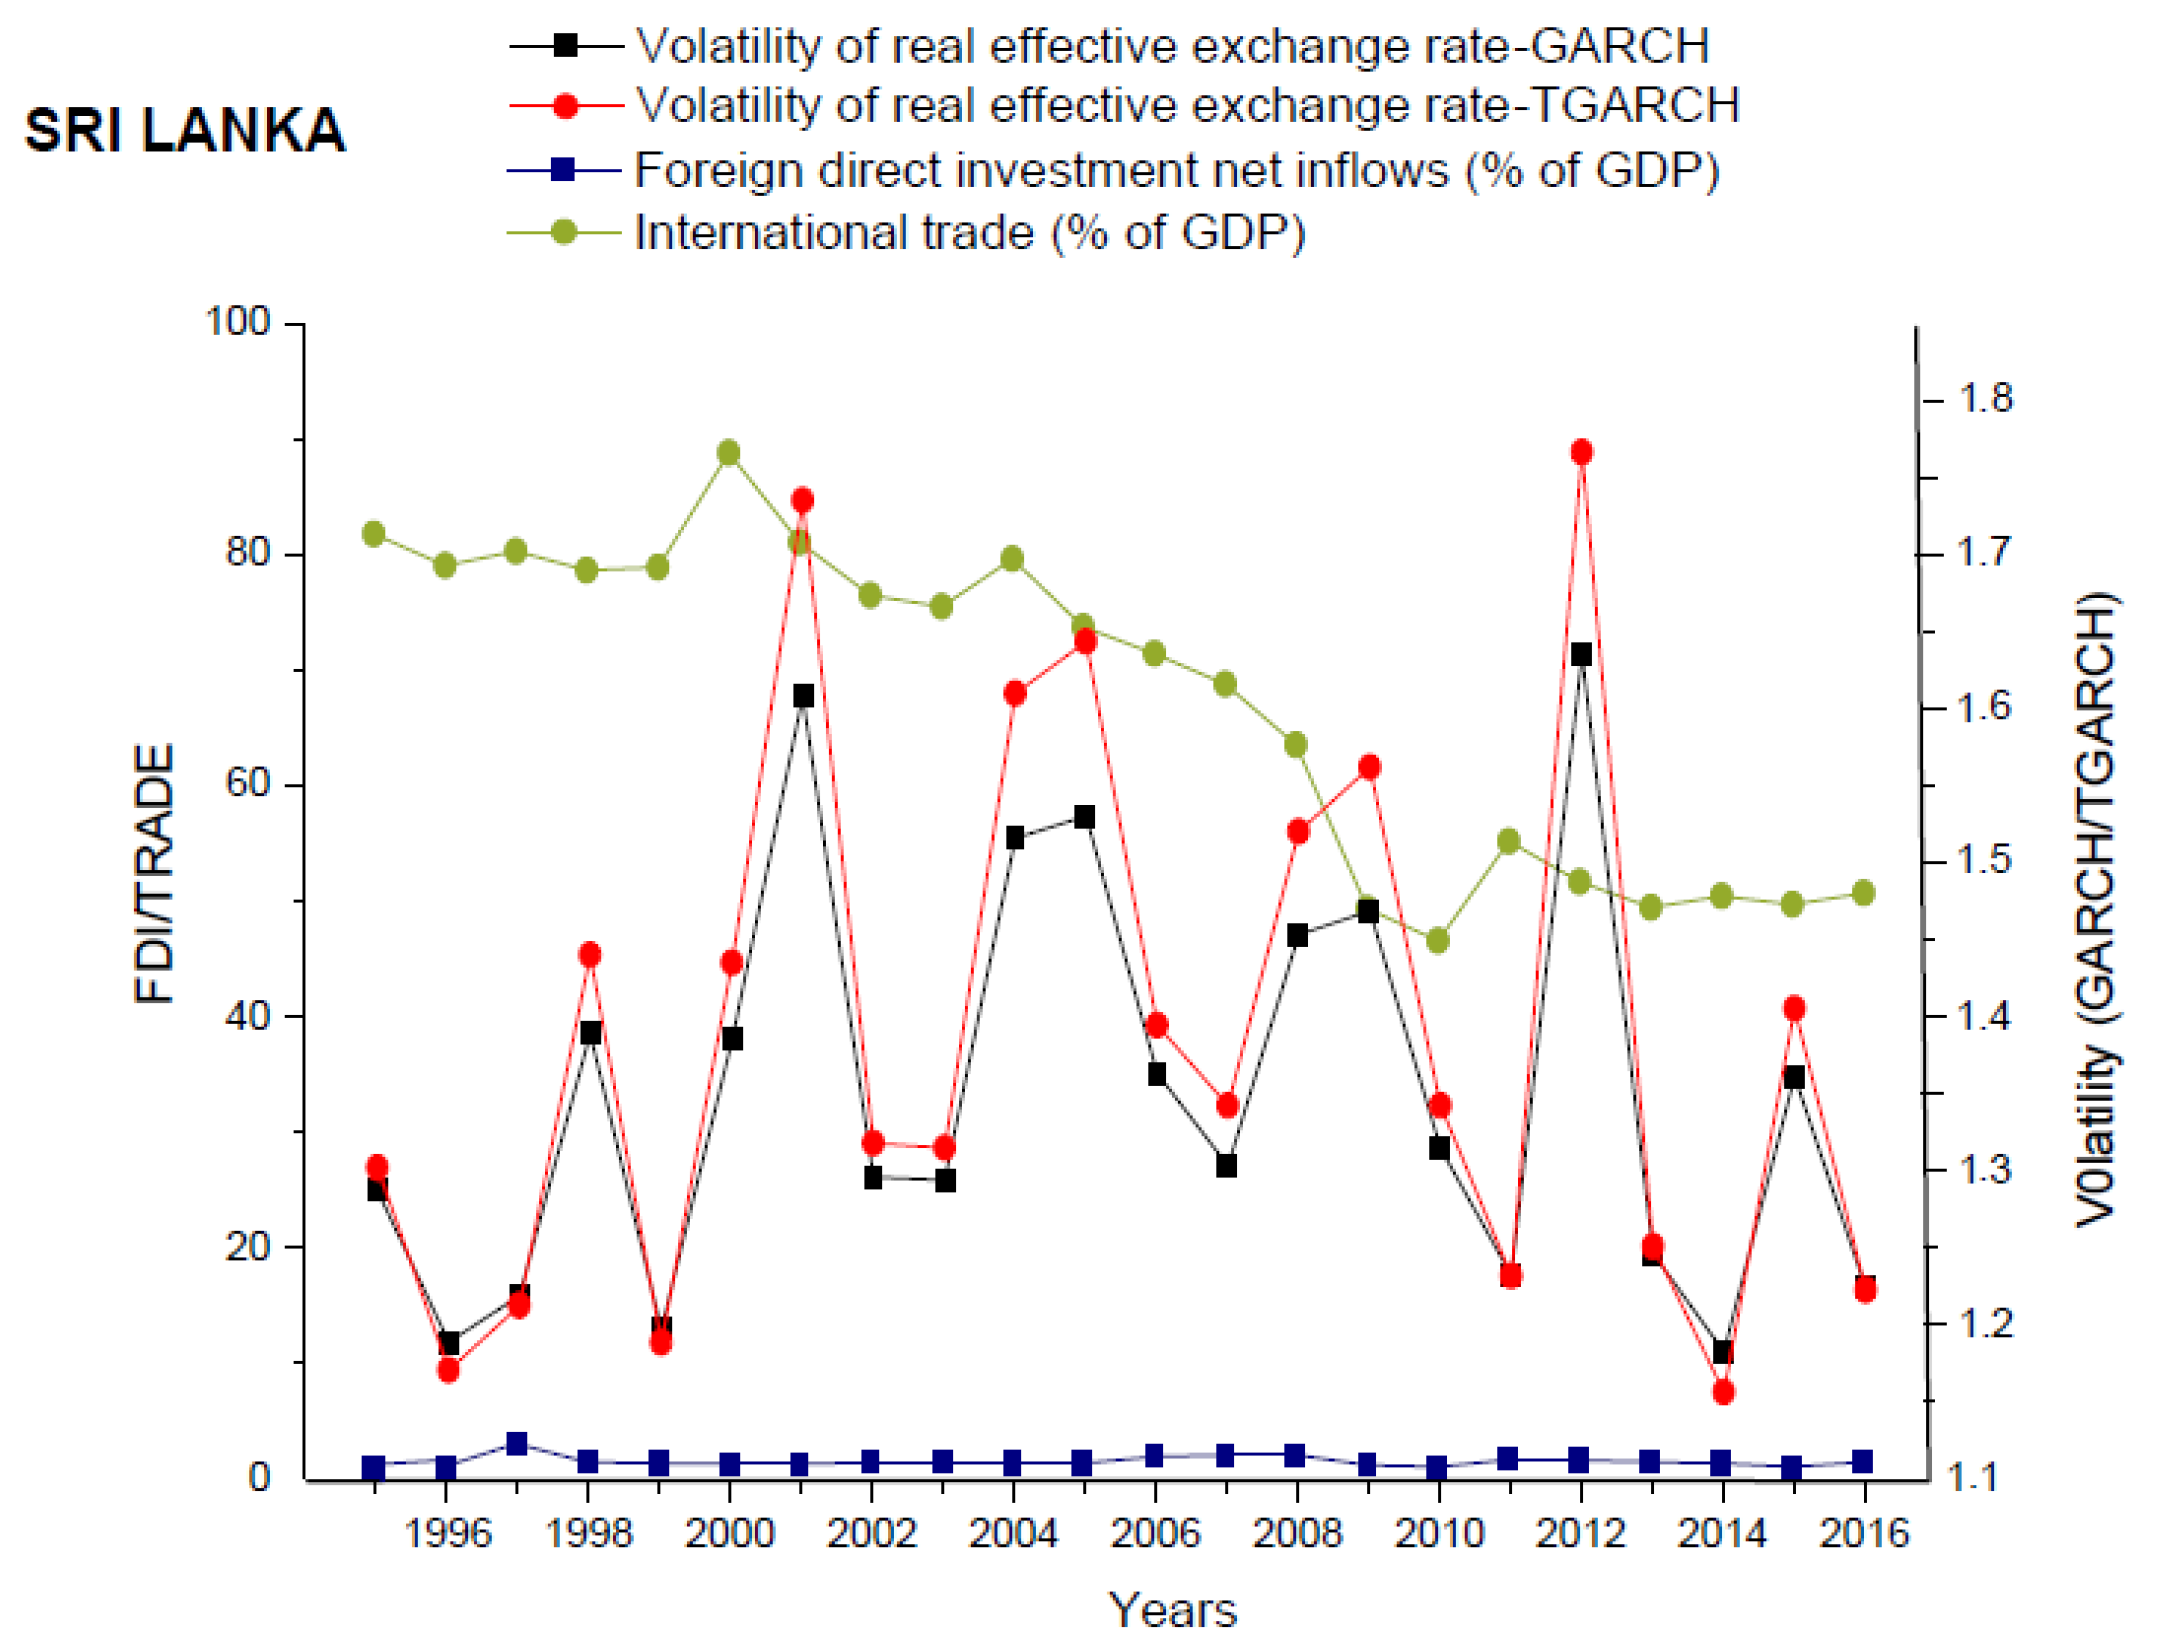
Figure 7 depict mixed trends of exchange rate volatility measured with GARCH and TGARCH models against the contribution of international trade and FDI inflows into the economic growth of the respective sample countries over the sample period. The figures of all countries highlight a wide gap between the contribution of FDI and international trade to economic growth. It shows that OBOR-related countries have received a very small amount of FDI inflows in the previous years; as a result, this contributed less to the economic growth as compared to international trade. The “One Belt and One Road (OBOR)” project was at the initial stage during the studied period; therefore, it did not show any significant influence on the growth of FDI inflows in these countries.
Figure 1 shows that Bangladesh had experienced with the high exchange rate volatility during the years of 1999, 2007, and 2013, and low volatility during the years of 1996, 1997, 2014, and 2016, measured with GARCH model. The other measure of volatility-TGARCH highlights that Bangladesh had experienced with high volatility during 1995, 1999, 2014, and 2016, and low volatility during the years of 1998 and 2012. The years of 2004 and 2012 are taken as the switch points for Bangladesh.
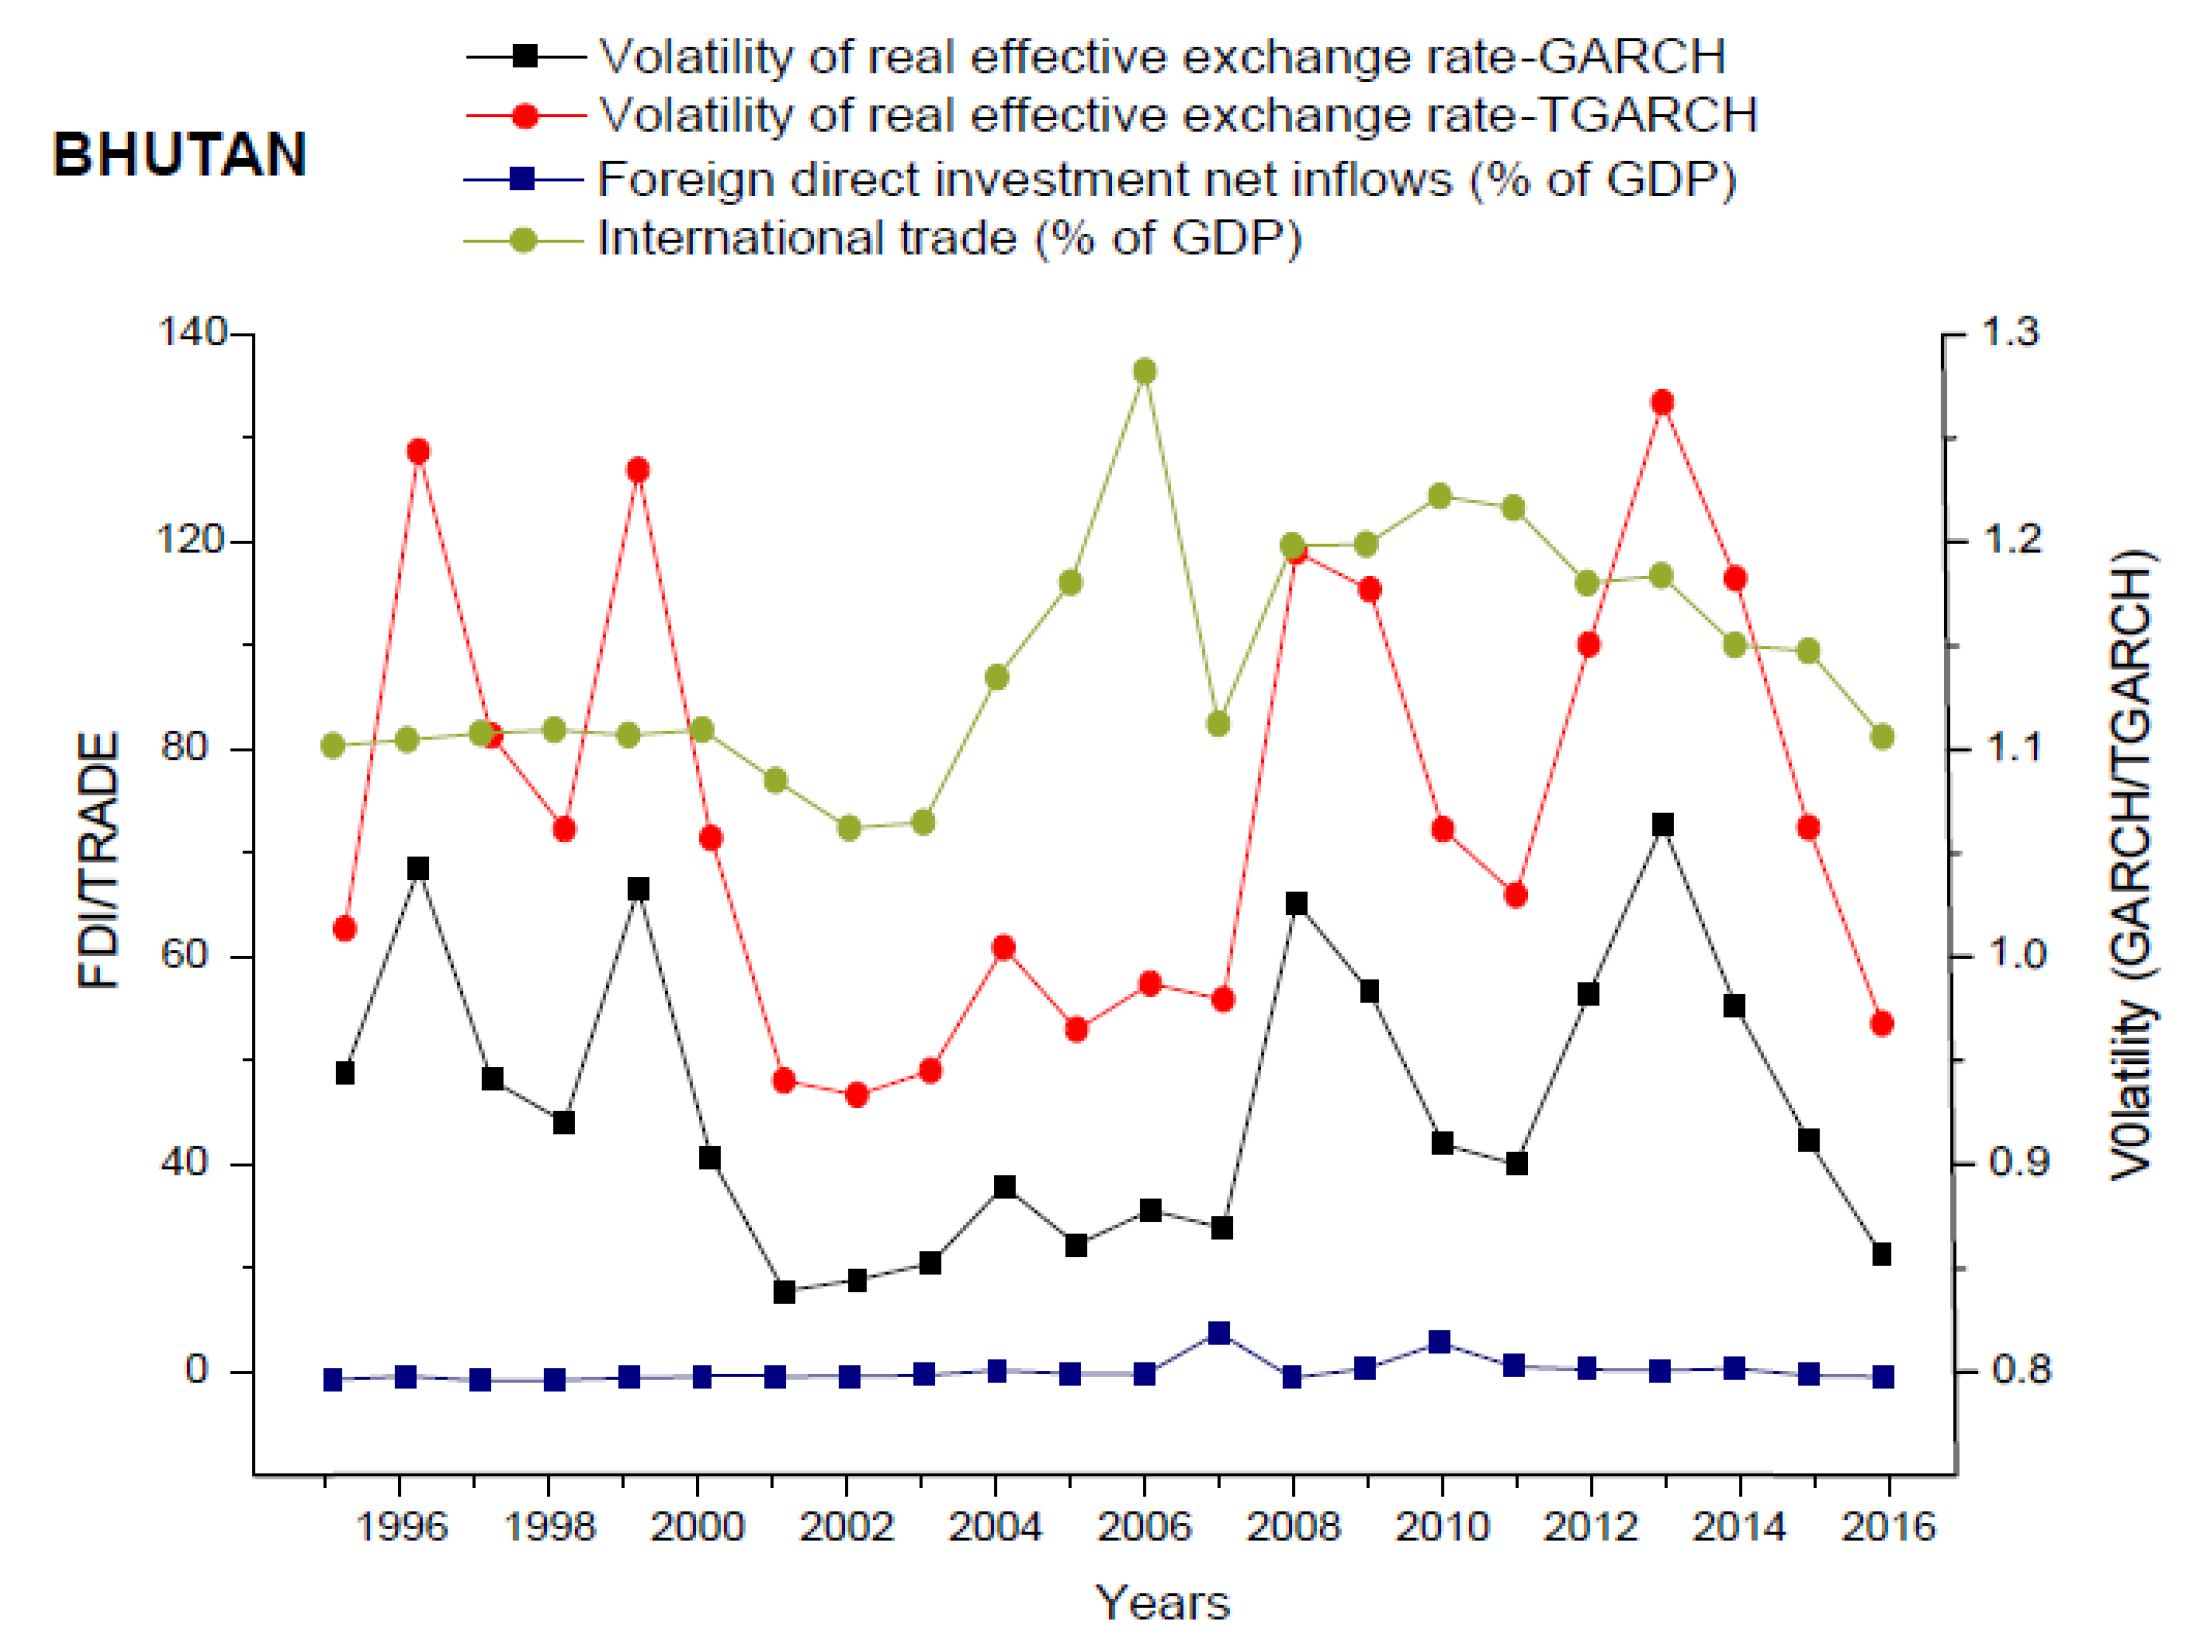
Figure 2 demonstrates that Bhutan had faced the high exchange rate volatility during 1996, 1999, 2008, and 2013, and low volatility during the period from 2001 to 2003, measured with both GARCH and TGARCH models. The switching years for Bhutan are 2000 and 2008.
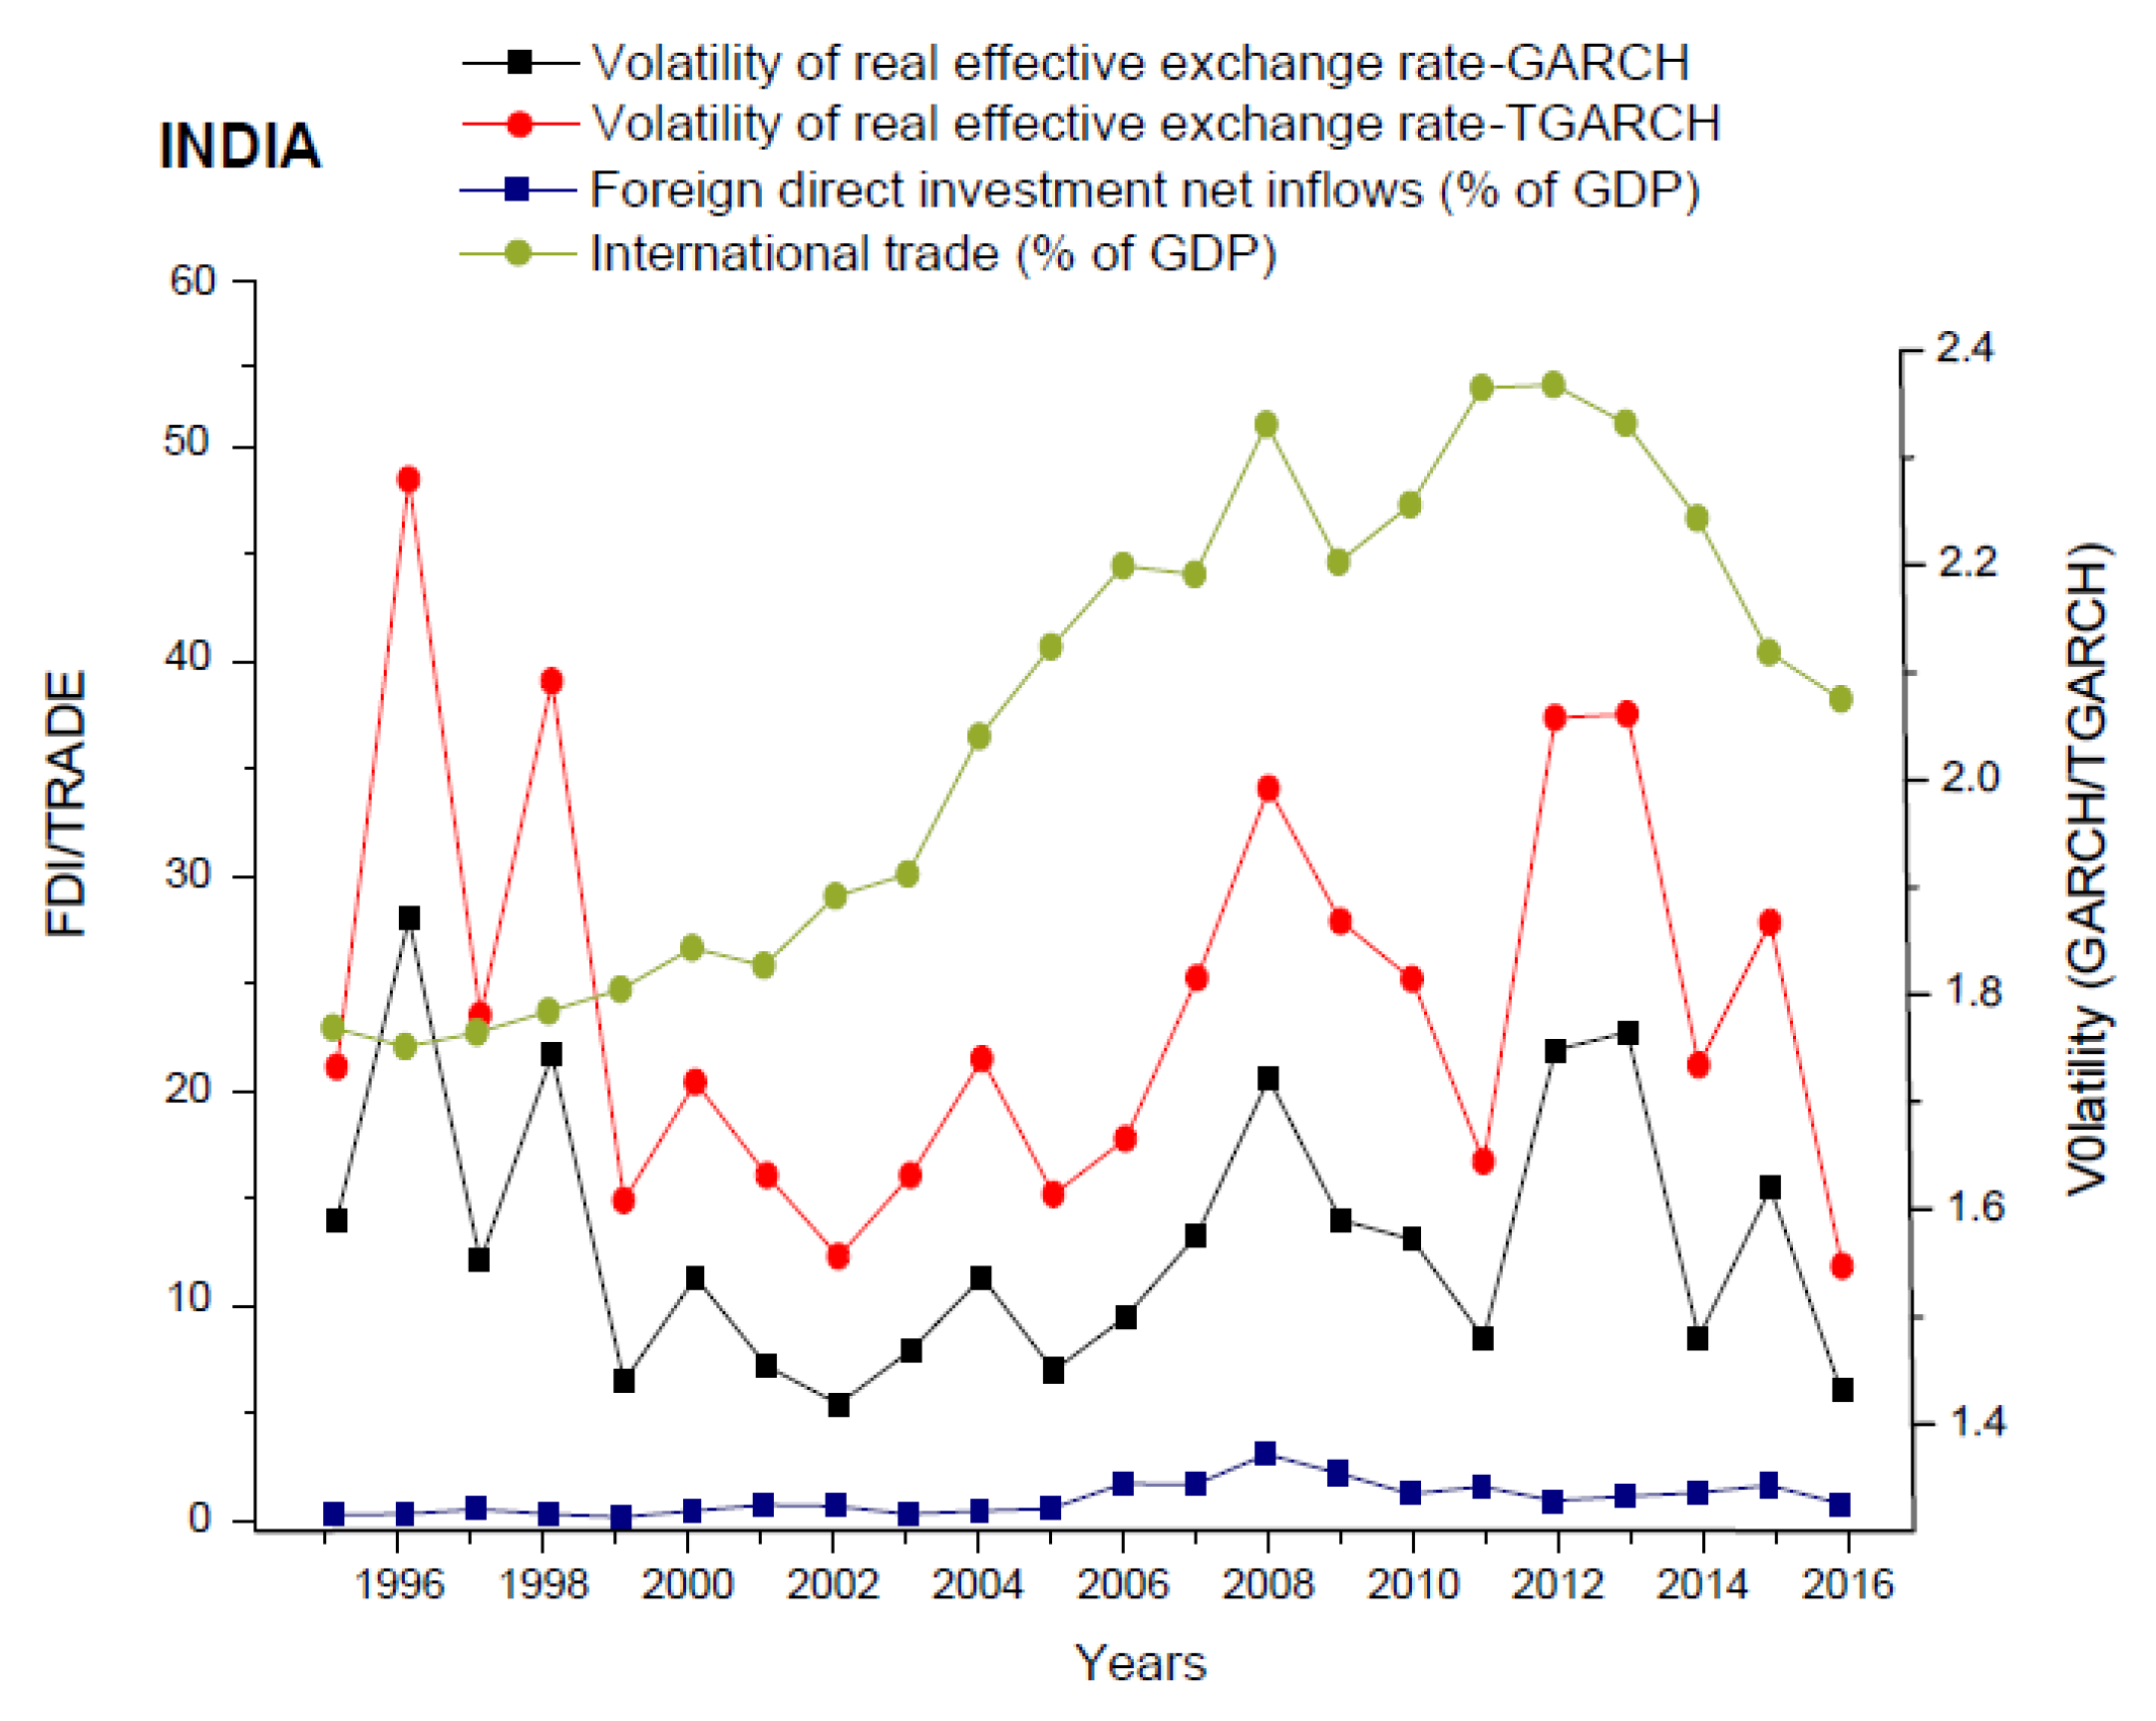
Figure 3 reflects the higher volatile years for India are 1996, 1998, 2008, and 2013, and less volatile years are 1999 and 2016 in terms of exchange rate volatility measured with both GARCH and TGARCH models. For India, the years of 1998 and 2007 are reflected at the switch points.
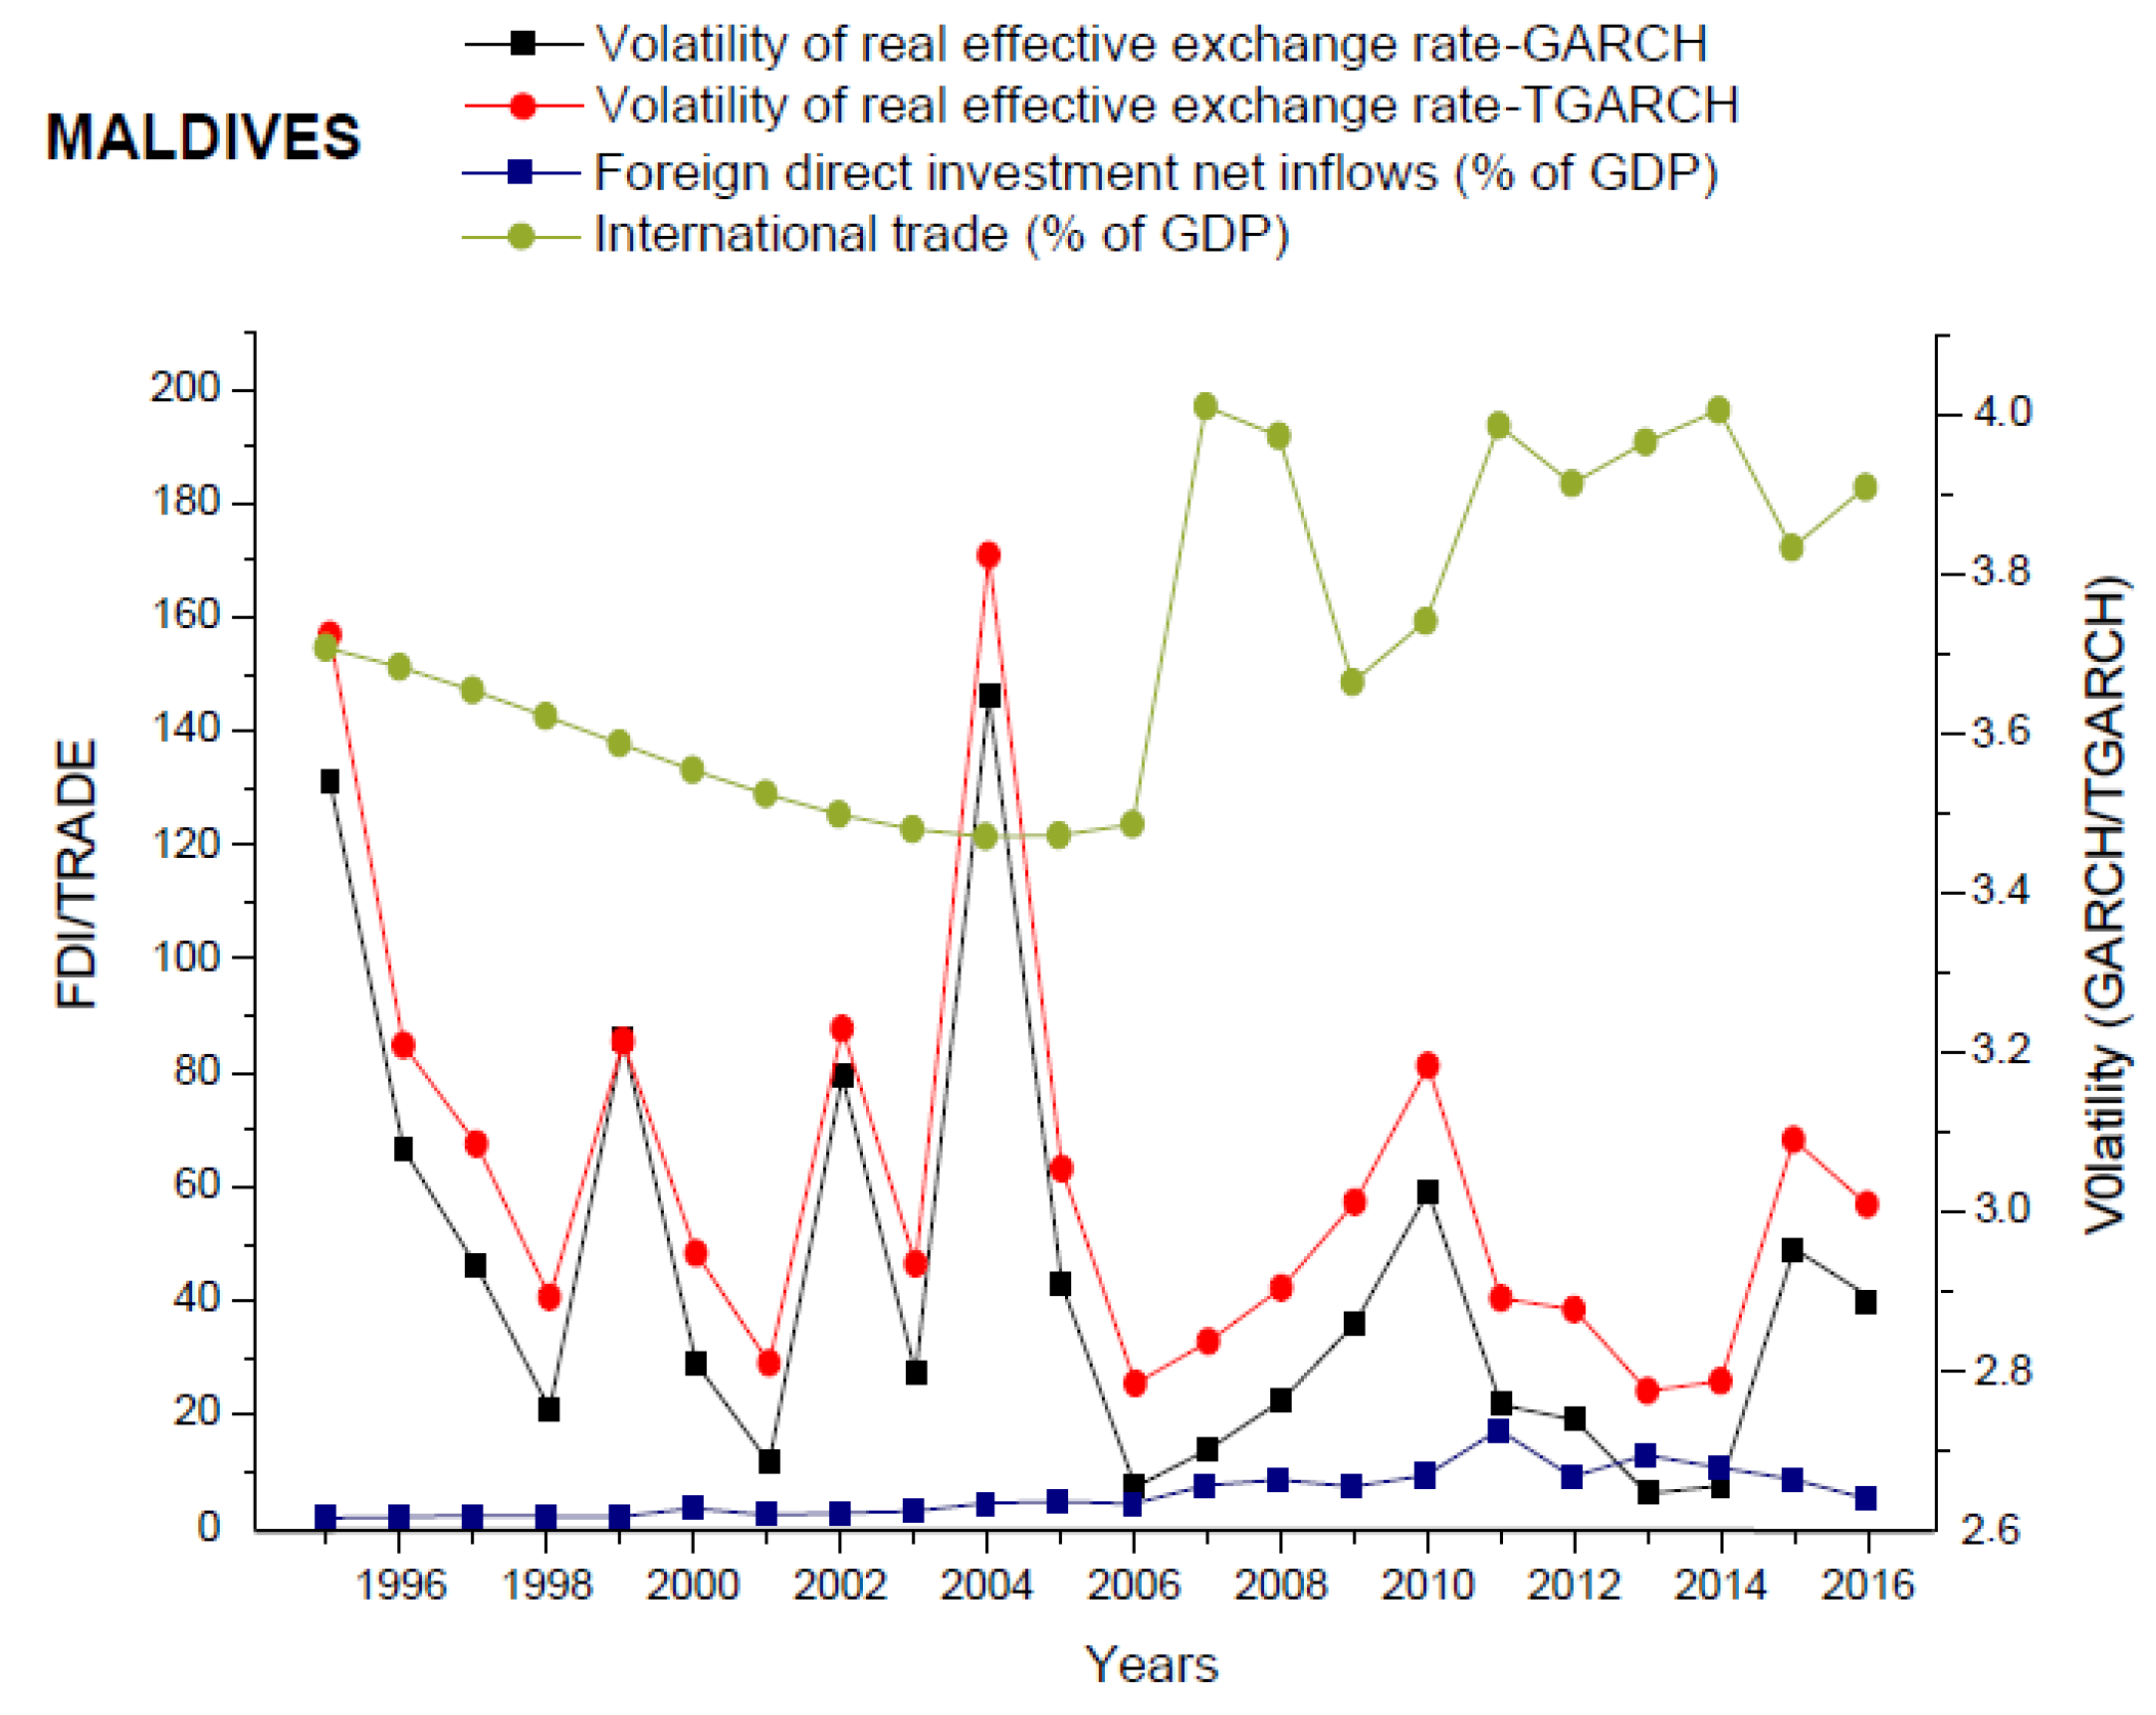
Figure 4 depicts that the Maldives had experienced with high exchange rate volatility during the years of 1995 and 2004, and less volatility during the years of 2001, 2006, and 2014 measured with both GARCH and TGARCH models. For the Maldives, the year 2005 is taken as the switch point.
Figure 5 portrays that Nepal had experienced with high exchange rate volatility during the years of 1998 and 2005, and less volatility during the years of 1997 and 2002, measured with both GARCH and TGARCH models. For Nepal, the years of 1999 and 2003 are considered as the switch points.
Figure 6 exhibits that the years of higher volatility for Pakistan are 1998 and 2008, while less volatile years are 2006 and 2008, in terms of exchange rate volatility, measured with both GARCH and TGARCH models. For Pakistan, the year 1998 is taken as the switch point.
Figure 7 reveals that the higher volatile years for Sri Lanka are 2001 and 2012, and less volatile years are 1996, 1999, and 2014, with both measures of exchange rate volatility. For Sri Lanka, the years of 2000 and 2012 are taken as the switch points.
4.3. Long-Run Exchange Rate Volatility for the Individual Countries
Table 4 presents the estimations of the long-run exchange rate volatility for the individual OBOR-related countries with both GARCH (1,1) and TGARCH (1,1) models. Results reveal that Maldives had experienced with high long-run exchange rate volatility, as compared to other countries, with 10.75% estimated with GARCH model, and 10.11% estimated with TGARCH model during the previous years from 1995 to 2016. According to the results obtained through the GARCH model, India ranks second with 5.86%, as compared to other countries, in terms of the high long-run exchange rate volatility. On the other hand, Bangladesh ranks second with 5.74%, as compared to other countries, in terms of high long-run exchange rate volatility estimated with TGARCH model.
4.4. Fixed Effects Models’ Estimations and Findings
Table 5 and
Table 6 demonstrate the estimations of both model Equations (4) and (5) by using a Fixed Effect model based on Hausman Test (
p < 0.05) to examine the relationship of exchange rate volatility with international trade and FDI. Some control variables, such as economic freedom, inflation, GDP, interest rate, and industrial growth, are also estimated in both models of international trade and FDI. To estimate the parameters of Equations (4) and (5) for international trade and FDI, four models are formulated. Model (1) and Model (3) examine the effect of exchange rate volatility measured with GARCH on international trade and FDI, respectively. In the same manner, Model (2) and Model (4) analyze the effect of exchange rate volatility measured with TGARCH on international trade and FDI, respectively.
Let us first focus on the estimates of international trade Model (1) and Model (2), for which estimated coefficients are reported in
Table 5. The results demonstrate that exchange rate volatility significantly but negatively affects international trade at a 5% significance level in both models. This means that the exchange rate volatility could adversely affect the trade flows of OBOR-related countries. Since the fixed exchange rate shifted to a floating exchange rate in 1973, this started the debate among economists who were against and in favor of it. At that time, there were arguments against the floating exchange rate. Economic theories suggest diverse results about the relationship between exchange rate volatility and international trade. It could either hurt or boost the trade flows in countries. The traders who cannot bear loss may decrease their trade volume to evade any loss due to exchange rate volatility (
Bahmani-Oskooee et al. 2016).
On the other side, traders who have the ability to cover future loss may increase their volume of trade with exchange rate volatility. As time passed, the results of different studies showed mixed results in different countries. As the results of this paper show that there is a negative effect of exchange rate volatility on international trade, it is concluded that traders who want to trade with OBOR-related countries, they should be careful to devise their trading plans by considering the fact of exchange rate volatility.
Mukherjee and Pozo (
2011);
Spronk et al. (
2013);
Vieira and MacDonald (
2016);
Cheong et al. (
2005) derived the same significant negative results about the relationship between exchange rate volatility and international trade.
Let us turn towards the estimates of foreign direct investment (FDI) Model (3) and Model (4), for which estimated coefficients are reported in
Table 6. The coefficients of exchange rate volatility show significant negative results in both models with different significance levels. Theoretically, when the investments are irreversible, firm value is increased by call option value, which represents the investment opportunity for firms (
Pindyck 1991). This may lead to an inverse relationship between uncertainty and investment. The empirical literature about irreversible investment highlights that increasing trend of uncertainty impedes the investment by risk-neutral firms if (1) the imperfect market competitions exist (2) if the cost of sinking the capital stock is greater than the adjustment cost (
Caballero 1991). Under these circumstances, the firms avoid having too much capital in the result of an increase in uncertainty. The firms react to this situation by investing less amount of capital (
Chowdhury and Wheeler 2015).
The firms which do not show the willingness to take risks to avoid making investment decisions in uncertain or volatile situations. On the other side, the firms which want to avail the opportunity to get higher returns in uncertain or volatile situations to make investment decisions. The investors should devise their investment plans to invest in the OBOR-related countries by considering the fact of exchange rate volatility. The literature also supports these results with strong evidence from other countries. For instance,
Kyereboah-Coleman and Agyire-Tettey (
2008);
Durairaj and Nirmala (
2012);
Susan Pozo (
2001) found a significant negative effect of exchange rate volatility on FDI.
Some control variables are also used in this paper, such as economic freedom, inflation, GDP, interest rate, interest rate and industrial growth. Coefficients of these variables are reported in
Table 5 and
Table 6. Economic freedom is measured by using the economic freedom index. It is used to analyze the political and financial situation in a country. Economic freedom is based on economic policy, trade restriction, government regulations, property rights, and other indicators. Coefficients of economic freedom in Model (1) and Model (2) explain that economic freedom significantly and positively affects international trade with a 1% significance level.
On the other hand, the coefficients of economic freedom show a significant but negative relationship with FDI in Model (3) and Model (4). It is the results from a strong effect from a country “Maldives”, identified by using Leave-one-out (LOO) analysis
4. It is consistent with the results of long-run exchange rate volatility, as shown in
Table 4. This country had experienced with the high long-run exchange rate volatility, as compared to other countries, during the sample period. According to the US Heritage Foundation, there is a strict business environment in the Maldives. Many reforms and strong efforts are needed in the public finance against the corruption. Government openness to foreign investment ratio into the Maldives is also below the average
5.
In other control variables, inflation shows the significant positive effect on international trade at 5% significance levels in both Model (1) and Model (2). International trade as the explanatory variable shows the significant positive effect on FDI at 1% significance levels in both Model (3) and Model (4), while the estimated coefficients of GDP, interest rate and industrial growth are not significant in any model.
4.5. Effects of Exchange Rate Volatility on International Trade and FDI for the Individual Countries
In view making the comparison between the countries about the effect of exchange rate volatility on international trade, we estimated the country dummies into the models, the results are shown in
Table 7. According to the results of the Model (1), the exchange rate volatility shows the significant positive impact on international trade for the countries such as Bhutan, Maldives, and Nepal at different significance levels. On the contrary, it shows the significant negative impact on international trade for Pakistan. According to the results of the Model (2), the exchange rate volatility shows the significant positive impact on international trade for the countries such as Bhutan, Maldives, and Nepal.
According to the
Table 8, we notice that results obtained for the estimated coefficients for many OBOR-related countries are significant. The results of Model (3) demonstrates that the exchange rate volatility has the significant positive impact on FDI for India and Pakistan at different significance levels. On the contrary, it shows the significant negative impact on FDI for Bhutan and Nepal. The results of Model (4) highlights that the exchange rate volatility has the significant positive impact on FDI for India and Pakistan at different significance levels. While it shows the significant negative impact on FDI for Bhutan.
5. Conclusions and Policy Implications
The economic literature does not give a clear direction about the relationship of exchange rate volatility with international trade and FDI. There is also no consensus in the literature about measuring the exchange rate volatility and the appropriate methodology to find its relationship with trade and FDI flows. One of the important empirical contributions of this paper is to apply both symmetric GARCH (1,1) and asymmetric threshold GARCH (1,1) models to measure the exchange rate volatility. Another contribution of this paper is to employ a fixed effect model to analyze the relationship of exchange rate volatility with international trade and FDI for the panel dataset of seven OBOR-related countries for the period 1995–2016.
Our analysis of comparing the relationship of international trade and FDI with two measures of exchange rate volatility reveals that exchange rate volatility measured with GARCH significantly negatively affected both international trade and FDI with the same level of significance. In the same manner, the coefficients of exchange rate volatility measured with TGARCH also showed significant negative results in both cases of international trade and FDI. This highlights that high exchange rate volatility can adversely affect the international trade and FDI flows in OBOR-related countries.
Furthermore, our other analysis of comparing the effects of exchange rate volatility on international trade and FDI for the individual countries highlights that the exchange rate volatility measured with GARCH significantly positively affected international trade for the countries such as Bhutan, Maldives, and Nepal. On the contrary, it showed the significant negative impact on international trade for Pakistan. While, the exchange rate volatility measured with TGARCH showed the significant positive impact on international trade for the countries such as Bhutan, Maldives, and Nepal.
In line with the above view, exchange rate volatility measured with GARCH showed the significant positive impact on FDI for India and Pakistan. On the contrary, it showed the significant negative impact on FDI for Bhutan and Nepal. While the exchange rate volatility measured with TGARCH has the significant positive impact on FDI for India and Pakistan. While it showed the significant negative impact on FDI for Bhutan.
Moreover, empirical results also reveal that economic freedom has a significant impact on both international trade and FDI with both measures of exchange rate volatility. This shows a positive direction in the international trade models, while it shows the opposite trend in the FDI models. We also find that inflation has a significant positive effect on international trade. Moreover, international trade also shows a significant positive effect on FDI as the explanatory variable with both measures of exchange rate volatility.
It is suggested that policymakers should formulate the economic policies with a goal of achieving a minimum level of exchange rate volatility in the developing countries which are participating in OBOR. The minimum level of exchange rate volatility could be beneficial to foster international trade and FDI inflows, as a result, OBOR-related countries can obtain knowledge and skills, better infrastructure and latest technology. Eventually, the overall economies of these countries could be increased. Furthermore, the participating traders and investors in this project should devise their plans by considering the fact of exchange rate volatility in OBOR related countries.
In general, this study was restricted to highlight the importance of “One Belt and One Road” (OBOR) project in the perspective of international trade and FDI for the developing countries and more specifically to empirically analyze the effect of exchange rate volatility on international trade and FDI in OBOR-related countries. Future studies can be conducted by developing one belt and one road exchange rate (OBORR) index and analyzing its relationship with exchange rate volatility of Chinese RMB or other local currencies of participating countries in OBOR project. Another possible path for future research could be to analyze the relationship between OBORR index with macroeconomic, social and political factors in developed and developing countries along OBOR, which might lead to more useful policy implications.


