The Assessment of Financial Literacy: New Evidence from Europe


1
Department of Management and Law, University of Rome Tor Vergata, 00133 Rome, Italy
2
Faculty of Social Work, Health and Care, Hochschule Ravensburg-Weingarten, 88250 Weingarten, Germany
*
Author to whom correspondence should be addressed.
Int. J. Financial Stud. 2019, 7(3), 54; https://0-doi-org.brum.beds.ac.uk/10.3390/ijfs7030054
Submission received: 17 June 2019
/
Revised: 13 August 2019
/
Accepted: 6 September 2019
/
Published: 19 September 2019
(This article belongs to the Special Issue Personal Finance)
Abstract
:The hypothesis that people with more financial literacy make better financial decisions and show positive financial behaviors is crucial for more than one stakeholder. A weak connection between financial literacy and financial behaviors jeopardizes the opportunity to invest in financial education and to develop a consumer protection framework based on the chance to develop aware and responsible financial consumers. This study uses data from different countries (Germany, France, Italy, Sweden, the UK), using surveys devised and fielded specifically to measure financial literacy and in order to assess if the availability of a broad set of items on financial literacy allows to develop new measures of financial literacy to better understand the relationship between financial literacy and financial behaviors. The well-established Lusardi–Mitchell questions are compared with measures that differ in terms of number of items (the “50-items” index), range of topics (the “5-specific” index), or selection process of the items (the “unbiased” index). Results support the hypothesis that the Lusardi–Mitchell questions remain a good measure in a first-step analysis, but a deeper understanding of the connection between financial literacy and financial behaviors benefits from the measures proposed in the study, that should be considered as additional assessment tools in financial literacy research.
1. Introduction
Financial literacy—as “the ability to use knowledge and skills to manage financial resources effectively for a lifetime of financial well-being” (US FLEC 2009)1—is a research interest that has dramatically grown in the last 15 years. The evolution of financial systems generated a growing number of products and services, and increased the complexity of the decision making process of financial consumers in different areas (e.g., borrowing, investments, money management, etc.). In the meantime the number of financial decisions that individuals have to make and the relevance of the potential consequences of those decisions increased too, due to the changes in the welfare systems of several countries and the shift of responsibility to individuals regarding critical issues such as saving for retirement, contributions to private healthcare plans, etc. The growing need to make financial decisions highlighted the need for greater knowledge of financial consumers, and stimulated the need to assess how much individuals are able to make sound financial decisions and be aware of the short- and long-term effects of such decisions. The risks of a financial system with financially illiterate consumers (e.g., over indebtedness, financial frauds, low saving rates, etc.) represented an additional motivation to assess the degree of financial knowledge of individuals, and to assess how the financial literacy of individuals affects the quality of the consumer financial decisions.
The focus of this paper is on the explanatory power of financial literacy on financial behaviors. A review of the literature will show how the measures of financial literacy developed in the early stage of financial literacy research remained almost unchanged until recent times, becoming well established reference points for academia. Several financial literacy studies assess financial literacy by measures based on several items that analyze general financial principles. Possible explanations to this approach include the availability of measures that are ready-to-use, the chance to compare new evidence with results from previous studies, and the circumstance that an extension of previous surveys in order to include a financial literacy module is easy when just few items are needed.
The aim of this study is to test if the availability of a broader set of items and the use of data from surveys specifically devised and fielded to measure financial literacy and financial behaviors results in the development of additional measures of financial literacy. We assume that these could be useful to better explain the relationship between the financial literacy and the financial behaviors of individuals. In addition, a large number of items offers an opportunity to test the interaction between different areas of knowledge and helps to deal with the so called reverse causality dilemma. Here, reverse causality is the doubt that not the level of financial literacy of individuals explains their financial behavior, but that the financial behaviors explain the financial literacy level of the individuals, thanks to the knowledge gained by the use of financial products and services. The use of data from different countries (Germany, France, Italy, Sweden, and the UK) provides an opportunity to highlight similarities and to analyze differences due to country specific bias (e.g., regulation, currencies, etc.).
The rest of the paper is organized as follows. A review of the literature will show the evolution of financial literacy studies, where we specifically focus on different measures of financial literacy and how they highlight the connection between financial literacy and financial behaviors. The next section is about the data and the methodology applied to develop new measures of financial literacy, while the results of the study will be analyzed in a different paragraph. The final section is about the conclusions of the study, its contribution, and its implications for different stakeholders (researchers, policy makers, and developers of financial education curricula).
2. Literature Review
There is an enormous amount of literature written on financial literacy, illustrating the myriad of issues within the field and the growing research interest in the last 15 years (Aprea et al. 2016; Huston 2010; Nicolini 2019). Nonetheless, an analysis of previous studies underlines a number of trends in financial literacy research and the assessment of financial literacy.
If the measurement of financial literacy would take benefit from (1) a single standard definition of financial literacy and (2) a common view about its components, both of them are not available yet. Huston (2010) reviewed more than 70 studies, noting that nearly three-quarters of the studies did not provide a definition of financial literacy nor of financial knowledge. The author arrived at the conclusion that “financial literacy consists of both knowledge and application of human capital specific to personal finance” (Huston 2010, p. 309) and recommended to include at least three to five items per content areas. In the same study the author stressed how “initial instruments consisting of as few as three items would appear to be deficient to capture the breadth of human capital specifically related to personal finance” (Huston 2010, p. 309). Remund (2010) takes into account both the short-term and the long-term perspective of a decision making process. In his study financial literacy is “a measure of the degree to which one understand key financial concepts [knowledge] and possesses the ability and confidence to manage personal finances through appropriate, short-term decision-making and sound, long-range financial planning, while mindful of life events and changing economic conditions” (Remund 2010, p. 284). If a there is not a single definition of financial literacy, there is a consensus about the need to account both financial knowledge and the financial skills in its measurement. In the meantime, if we refer to financial skills as the ability to apply financial knowledge, a hierarchy between these two dimensions is quite clear, with financial knowledge playing a leading role: a lack of financial knowledge implies a lack of financial skills (because people cannot apply knowledge they do not have), while a lack of financial skills does not involve a lack of financial knowledge by definition. Hence, even if an ideal measure of financial literacy should include a measurement of financial skills, a measure of financial literacy focused on financial knowledge can be quite informative too. Several studies proposed financial literacy measures based on financial knowledge. Knoll and Houts (2012) contributes to the existing literature developing a financial knowledge scale applying psychometric techniques2 with the aim to allow for “the comparison of financial knowledge across studies, populations, and programs.” In their study, the authors justify their will to focus on financial knowledge in the measurement of financial literacy with the lack of available data on financial skills. The authors also deemed questions regarding skills and behaviors to be difficult to include in a comprehensive financial literacy measure because they would likely require a large number of questions (necessary to investigate the details of different domains). Additional attempts to apply statistical dimensionality reduction techniques (e.g., factor analysis) include the study of Despard and Chowa (2014) that used data with more than 5000 observations about survey responses from youth ages 12–18 in Ghana to develop a 12 items scale.
Summarizing the main trends in the assessment of financial literacy, we can say that (first) measuring and fostering financial literacy is generally carried out by using just a few items. The so-called “big three” or “big five” financial literacy questions created by Lusardi and Mitchell have been used to test consumers’ knowledge about inflation, compound interest, diversification, and stock and bond ownership in more than 20 countries making it easier to compare results across countries (Lusardi and Mitchell 2011). Second, the same items were used to explain different financial behaviors, since they were frequently available from survey data that was not originally collected in relation to financial literacy research but was simply supplemented by a few questions. Thirdly, the role of financial literacy in explaining different financial behaviors was not always very clear. It was often the case that socio-demographic variables seemed to be more relevant for an adequate financial behavior than financial literacy.
Fourthly, the terms ‘financial literacy’ and ‘financial knowledge’ are often used interchangeably in the literature, since measuring financial literacy is a major challenge. In previous literature, the construct of financial literacy is often defined as a combination of different aspect (e.g., knowledge, skills, behavior, etc.) not limited to financial knowledge. Due to the fact financial knowledge indicators are rather easy to collect, they often serve as a proxy for financial literacy. However, recent research shows that financial knowledge is an integral dimension of, but not equivalent to, financial literacy (Huston 2010; Nicolini et al. 2013). Financial knowledge refers only to one dimension of financial literacy. However, taking into account that a person cannot develop skills without knowledge we assume that an individual lacking financial knowledge cannot be financially literate, while individuals with a high level of financial knowledge can of course fail to apply their knowledge.
Therefore, we use financial knowledge as a proxy of financial literacy with the awareness that a low level of financial knowledge results in a low level of financial literacy whilst a high level of financial knowledge can result in both low and high levels of financial literacy, depending on how well a person applies that knowledge. This limitation of different outcome patterns should not be an issue for the aim of the study if the main task is to analyze the lack of knowledge and the risk of sub-optimal behavior.
In the rest of the study, we will utilize a large dataset specifically designed to assess financial literacy. Therefore, we are able to use a number of variables on financial literacy and financial behavior to test different measurements of financial literacy and its impact on different financial behaviors. Using data from different countries, we are even able to avoid country biases.
3. Data and Methodology
The data used in this study was provided by the Consumer Finance Research Center (CFRC). The CFRC is a research network of academics and other researchers that studies consumer finance issues. Since 2014, the CFRC supported a research project on financial literacy in Europe with the aim to assess the financial literacy of European households. A questionnaire organized in three different sections was developed with the purpose to be applicable in different countries and to replicate different national surveys. The first section of the questionnaire hosts 15 items related to the socio-demographic characteristics of the respondents (e.g., age, sex, education, income, etc.). The second section covers financial literacy. It is made up of 50 items organized in 10 groups of five questions each, where each of the five questions differ in terms of difficulty. The 10 areas of knowledge are interest rates, inflation, mortgages, bonds, investment diversification, loans and debt, stocks, bank accounts, payments tools, retirement, and insurance. The well-known and widely used “Lusardi–Mitchell questions” on inflation, compound interest, mortgages, bond pricing, and diversification were included to guarantee the comparability with previous studies. Each of the Lusardi–Mitchell questions was included in a different area of knowledge, and then completed with additional four questions. If the first five areas of knowledge are related with the Lusardi–Mitchell questions (interest rates, inflation, mortgages, bonds, investment diversification), the remaining five areas were selected referring to the literature3 and with the will to cover all the main areas of contents in consumer finance (e.g., payment tools, bank accounts, insurance, etc.). The selection of the items in each group of questions is the result of a validation process of the questionnaire where too simple questions and too difficult questions were replaced with the aim to increase the informative power of each item4.
Each of the 50 items on financial literacy investigates financial knowledge and has the same structure: three options are available5, one (and only one) of these options is right while the other options are wrong (no “partially right” or “partially wrong” options are included). In every case, two additional options were available. The “Do not know” option (DK) was included to minimize the risk of guessing behaviors, where the respondent who does not know the right answer tries to answer following a random process. The risk that a respondent will choose one of the three options even when they do not know the answer remains even with a DK option available. Without that option, the risk of counting it as knowledge is definitely higher. The “Prefer not to say” option was always available too. In this case, the intention is to avoid a blank answer when the respondent intentionally does not want to answer. It could be that a topic reminds the respondent of a negative experience, for example, a question on mortgage when the respondent defaulted on a mortgage or a question on diversification when an investor has recently suffered a severe loss due to the lack of diversification. If a blank answer could be offered due to a lack of attention (e.g., the respondent unintentionally skipped the question), the “Prefer not to say” leaves the respondent ample freedom to answer or not. Forcing the respondent to offer a response to all questions by choosing one of the three possible options risks, once more, increases “the noise in the data”, reading a random answer like a right answer based on knowledge.
The third section of the questionnaire is about financial behaviors. Around 40 items investigated several financial behaviors, such as the use of payment tools, investment preferences, borrowing experiences, etc.
The questionnaire was used in different national surveys that collected data between 2014 and 2017. A fine-tuning of the questionnaire was necessary in some cases to make it fit with local regulations and practices, but the changes required were not so big as to jeopardize the comparability of the countries’ data. This study used data from France, Germany, Italy, the UK, and Sweden. Around 500 observations for each country were available. The target of recipients was the adult population6 and data was collected by panel survey companies7.
The large quantity of items on financial literacy allowed to address the research question of the study and to test how different measures of financial literacy explain consumer financial behaviors. The presence of the Lusardi–Mitchell questions allows the replication of the standard measure used in several previous studies, based on the sum of correct answers to the five questions. To test the hypothesis that the small number of items could not be enough to disentangle the relationship between financial literacy and financial behaviors, the sum of correct answers to all the 50 questions on financial literacy was used as a measure of financial literacy. That measure, which natural range of values is from zero to 50, was rescaled to a zero-to-five scale in order to facilitate the comparability of results with other indices. A more rich set of information should be more powerful in explaining the role of financial literacy on financial behaviors. An alternative measure of financial literacy takes into account only the five questions that test the knowledge related to a specific financial behavior used to test the relationship. Therefore, when the preferences for investment portfolios that applies a diversification approach were used to test the investors’ behavior, the sub-set of the financial literacy questions that investigate knowledge on investment was used to assess the investor’s financial literacy, and the sum of correct answers to the five investment questions represented the financial literacy measures. When a different behavior (e.g., retirement planning) was taken into account a different sub-set of financial literacy questions was used (e.g., questions on retirement planning). This selection criterion of the items is based on the assumption that the reason financial literacy could explain a financial behavior is that a better understanding of a certain financial product or service should positively affect the use of those products or services (e.g., knowledge about the functioning of a retirement system affects the decision to save for retirement). It follows that a financial literacy measure that includes knowledge on quite different areas (e.g., knowledge on borrowing) risks underestimating the real effect of financial literacy. This is due to the lack of explanatory power of all the items that are part of the index but that are not logically connected with the behavior (e.g., no reason why knowledge on borrowing could affect the decision to save for retirement). Under these circumstances, the hypothesis is that a set of items that are logically related with a financial behavior should be more effective than a set of items on different topics in explaining the connection between financial literacy and the financial behavior.
The authors are aware that the use of knowledge on a topic to explain a financial behavior related to the same topic is potentially affected by a reverse causality issue, because people who use investment products could be more skilled than others because they have learnt from using such products. Hence, the dilemma as to whether it is the knowledge of investment products that stimulates investment behaviors or the investment decision that involves a learning by doing process that increases the level of knowledge on a specific product’s risks remains unsolved. The use of financial literacy measures that mix different areas of knowledge smoothens the relevance of the issue by reducing the number of items potentially affected by reverse causality. At the same time, the use of a broad set of items related to different topics (e.g., some on investment knowledge, others on borrowing knowledge, etc.) will reveal that a logical connection between an item and the analyzed financial behavior is not clear in all cases (e.g., the reason why an item that addresses the investment knowledge should explain an investment decision is more clear than the reason why an item on borrowing should do). The first case is when—for instance—an investment decision is related to five financial knowledge questions when only one is about investing. The reverse causality is limited to one of the five items. At the same time, it is not clear why the other four items (e.g., borrowing, money management, etc.) should affect the investment behavior of an individual. To address the potential reverse causality between financial literacy and financial behaviors an analysis of all the available information in the dataset was carried out. For each respondent the authors selected the financial literacy items on topics that were not related with any financial product or service ever used by the respondent and used the sum of correct answers to this sub-set of items to assess a financial literacy measure that cannot be affected by reverse causality (“people cannot learn from products they do not use”). Of course, there is the hypothesis that whoever is trying to satisfy a financial need (e.g., to borrow) will learn about different products (e.g., loans, mortgages, etc.) even if only one of them will be finally purchased. However, the chance that this “accidental learning process” will fully replicate the reverse causality dilemma is not likely because only few areas of knowledge show similarities in their application that could generate the above-mentioned accidental learning scenario. For instance, whoever is looking for a loan can extend the research beyond standard loans and learn about mortgages too (even if the individual will never apply for a mortgage), but there is no reason to learn about stocks or bonds because those products are not borrowing tools. In the meantime, whoever is interested in opening a bank account will probably even learn about payments tools (e.g., credit cards), but there is no reason to be interested in learning about retirement or pension plans. Hence, the strategy to select financial knowledge items that are not related with any direct use of a financial product does not represent a final solution for the reverse causality dilemma, but it will limit the reverse causality hypothesis to the above-mentioned “accidental learning process”.
That measure was standardized on a zero-to-five scale in order to guarantee the same range of values regardless of the number of items in the scale. The items not included in the measure, because they related to financial products of services used by the respondents, were used to assess another financial literacy measure. If the latter can be affected by a learning by doing effect (“people learn from the use of their products”) it follows that that measure should be on average higher than the former, that is, by definition, unbiased by any previous financial experience. The correlation between the two financial literacy indices (the “experience biased” and the “experience unbiased”) can be used to understand if the financial literacy of an individual is segmented in different and independent areas of knowledge or if a common degree of financial literacy, regardless of the use of a specific product or service, exists. A positive correlation between the two indices could help to disentangle the reverse causality dilemma by using the unbiased measure that avoids the reverse causality issues without losing the logical connection with the financial behavior, thanks to the positive correlation with the biased index. Results from the use of the unbiased measure risks underestimating the real explanatory power of financial literacy on financial behavior, because they ignore the possibility that financial behaviors (e.g., the use of a certain products) could be driven by the knowledge of that product, and limit the assessment of financial literacy regarding products that are not used. However, the comparison of that measure with results based on the other measures proposed in this study (sum of correct answer to 50 items, sum of five topic-specific items) can help to complete the understanding of the connection between financial literacy and financial behaviors.
The analysis of the explanatory power of financial literacy on financial behaviors considered five different behaviors, used as five different dependent variables in different regression models.
Those financial behaviors were selected referring to the existing literature8 and with the will to consider different application of financial knowledge. The analysis of investment decisions (e.g., use of stocks), attention to retirement planning, existence of precautionary savings, and money management behaviors (e.g., use of payment cards) can shed light on the relationship between financial literacy and financial behaviors testing the hypothesis that the explanatory power of financial literacy can differ when it is measured by a different measure, but even when a measure is tested on a different behavior. To test different combinations of behaviors Vs measures contribute to test the robustness of the results.
The details of those variables are summarized in the following table (Table 1).
All the dependent variables are dummy variables, so a logistic regression model was used in every case.
The independent variables include a measure of financial literacy and a set of control variables representing the socio-demographic profile of the respondent (age, sex, education, income, marital status). For each dependent variable, four different model specifications were used. Each of them differs for the financial literacy measure: (1) the Lusardi–Mitchell, (2) the 50 items score, (3) the 5-specific score, (4) the unbiased score. The four model specifications for each of the five financial behaviors, replicated in five countries (France, Germany, Italy, Sweden, and the UK) plus the whole sample that merges the national data in a single one, generated 120 different outputs. The rotation of financial behaviors and countries should guarantee the robustness of the results.
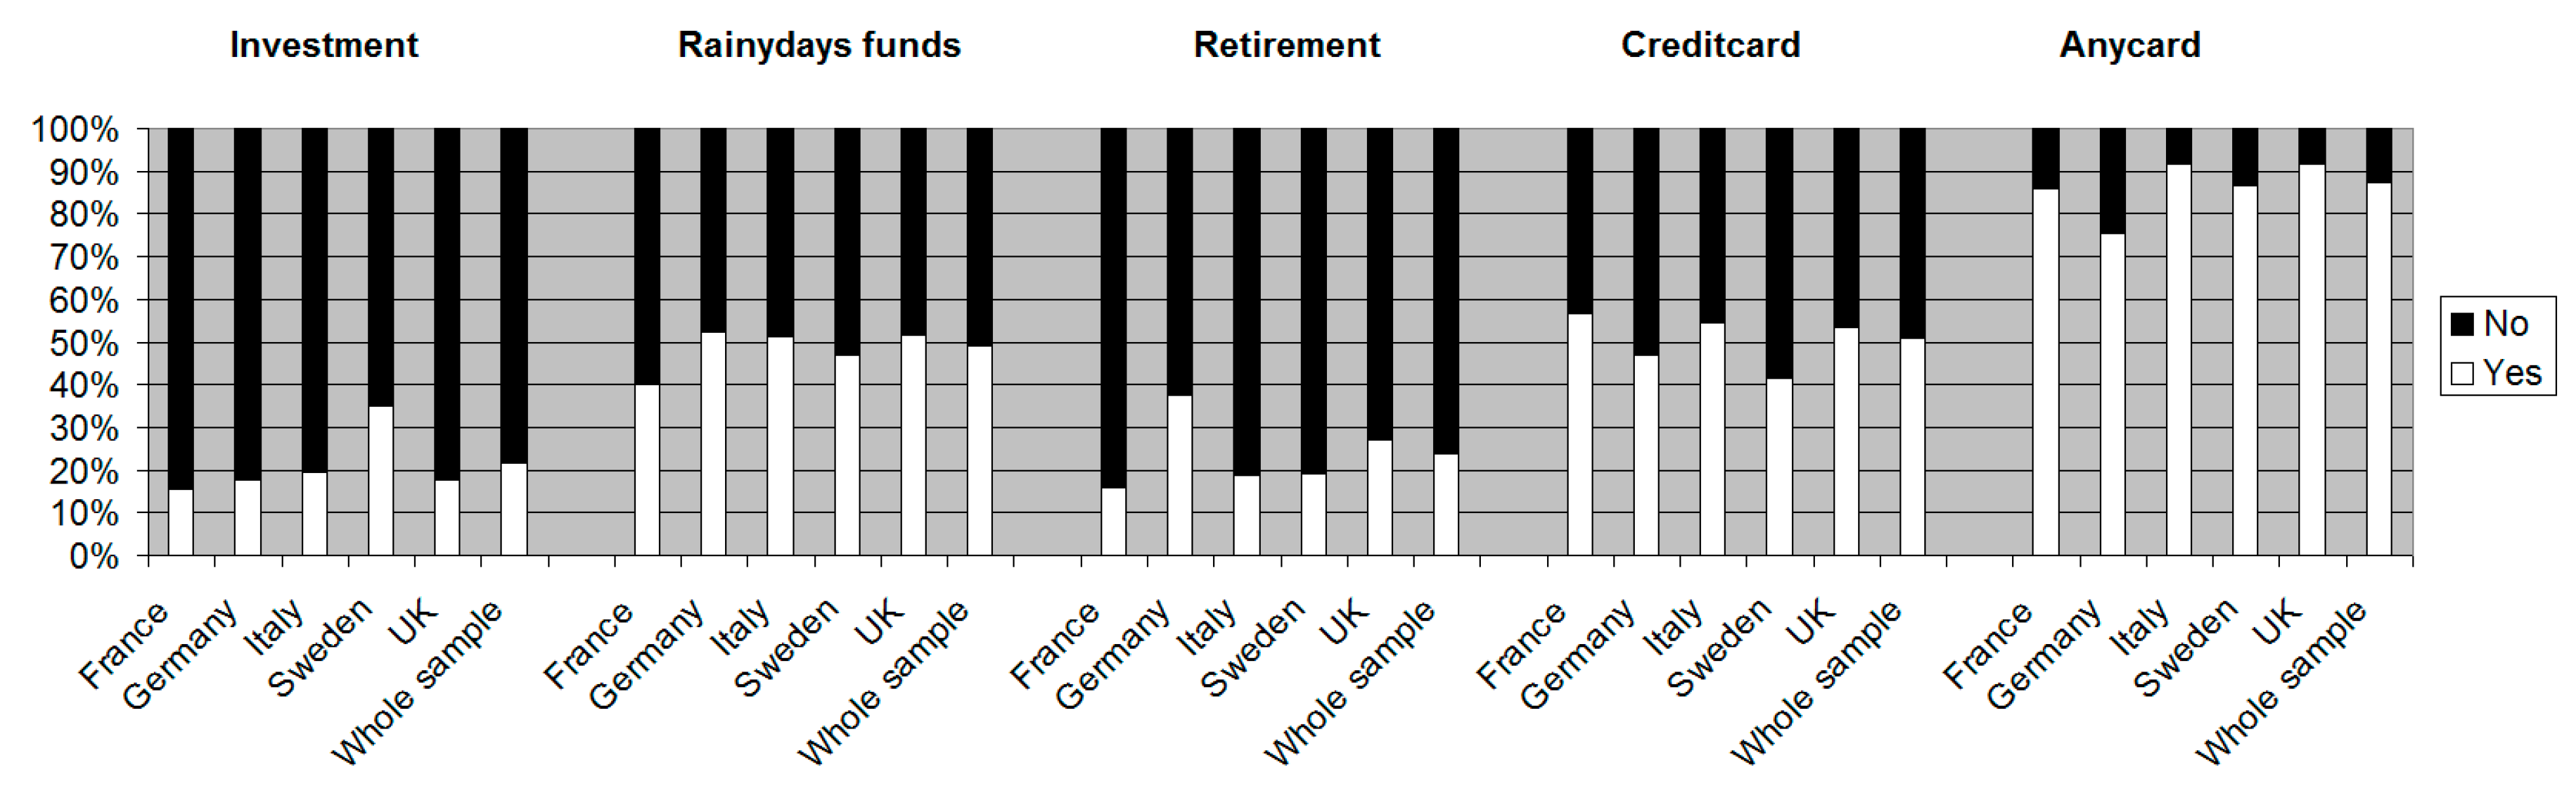
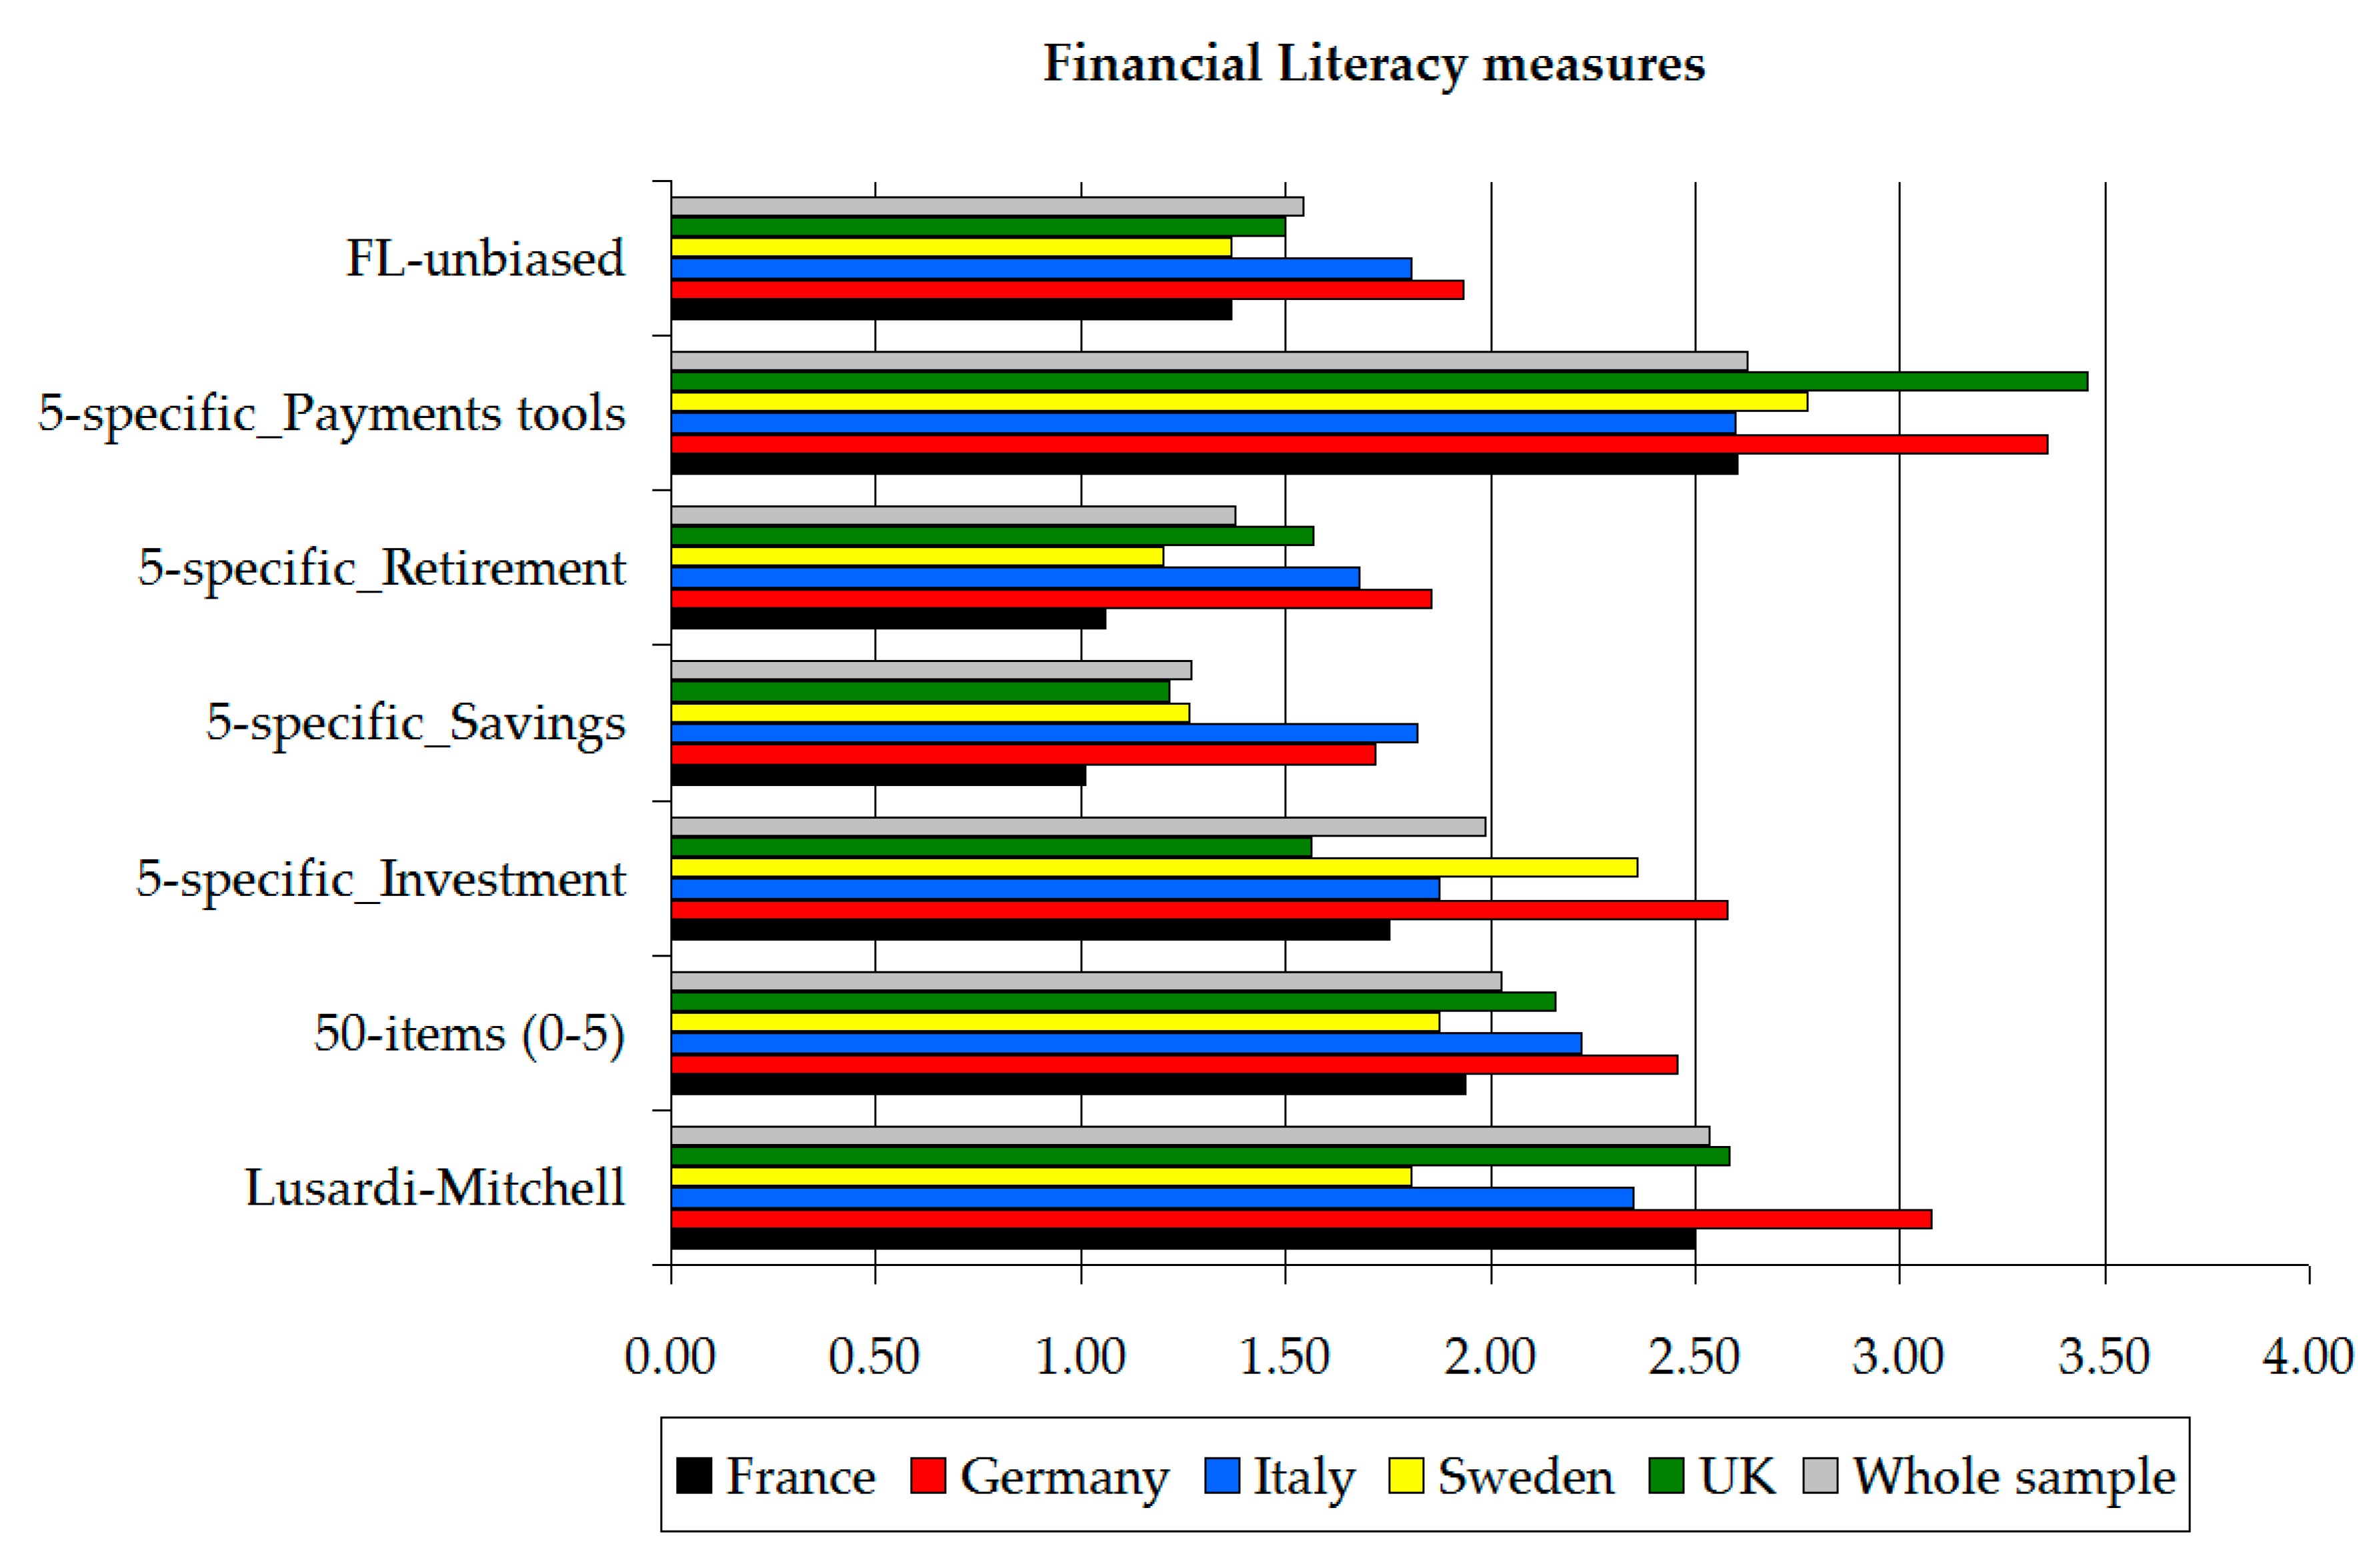
The descriptive characteristics of the variables are listed in the Appendix A (Table A2 and Table A3). Figure 1 and Figure 2 compare values of dependent variables (financial behaviors) and financial literacy measures across countries.
Before the presentation of results a comparison between the FL-unbiased—the zero-to-five scale based on financial literacy items that address topics not related to any financial product ever used by the respondent (so not biased by the learning by doing effect or any reverse causality issue)—and the FL-biased—based on items that address topics related to previous direct financial experiences of the respondent—is required to support the hypothesis that the use of FL-unbiased can help to deal with the reverse causality issues that typically affect studies on financial literacy.
The following Table 2 shows—for each country and the whole sample—the values of the two financial literacy measures, results regarding a t-test to check if any difference between the measures exist, and the correlation index between the biased and unbiased measures.
Results support the hypothesis that there is a correlation between the use of financial products and services and financial literacy, with an average score on financial knowledge questions related to past-used products that is statistically higher than the financial knowledge score for topics related with products that have never been tried before. At the same time, the positive correlation between the two measures allows the use of the FL-unbiased as a financial literacy measure that is able, at the same time, to deal with the reverse causality issue and to maintain a connection with experienced financial behaviors.
4. Results
The empirical analysis tested the explanatory power of four financial literacy measures, on five financial behaviors, for each of the five countries and the pooled sample of all five countries. With 120 generated outputs available (four measures × five behaviors × [5 + 1] countries) a selection of the results was necessary to make it fit with the size of the paper and to focus on the aim of the study. Table 3 shows the values of the coefficients and the statistical significance (p-values) for each of the financial literacy measures (Lusardi–Mitchell; 5-specific items; unbiased index; 50-items). In every cell of the table—crossing a financial behavior and a country—the coefficient and the p-value or a financial literacy variable (used as independent variable in a logistic regression model) are listed. Results related to the other independent variables, used as control variables and described in the previous parts of this study (e.g., age, gender, income, etc.), are not included for the above-mentioned length constraints of the paper9.
All the five financial literacy measures have a range from zero to five, making a comparison of the results easy. Measures that originally did not have a zero-to-five range values (e.g., the 50 items measures) were rescaled to make them fit with that standard.
The big picture of the results shows several interesting things. In more than 100 statistical analyses, financial literacy only failed to help explain financial behaviors with a statistical significance 17 times. This result confirms the connection between financial literacy and people’s financial behaviors. Six of these 17 cases concern the financial literacy measures based on the number of right answers to the “big-5” Lusardi–Mitchell questions. That result supports the hypothesis that sometimes the limited number of items and the broad areas of contents investigated by the Lusardi–Mitchell questions could fail in capturing a connection between financial literacy and financial behaviors that exist and that are detected by alternative measures. If it is not a criticism to the well adopted measure, this result can be read as the need (in some cases) not to limit the analysis of the significance of financial literacy in explaining one or more financial behaviors to the “big-5”, especially when that measure does not find any connection.
A second interesting result is that a comparison between the financial literacy measures with a zero-to-five range shows that the “unbiased” financial literacy index—that counts the number of correct answers to questions which analyze topics not related with financial products and services ever used/owned by the respondent, and that standardize the value in a zero-to-five scale—outperforms the Lusardi–Mitchell index and the 5-specific index10 14 times in 30. In the remaining 16 cases, it is the 5-specific index that shows the biggest coefficient values 10 times, and only six times in 30 the Lusardi–Mitchell index highlights the connection between financial literacy and financial behaviors better than others. From these results the hypothesis that the Lusardi–Mitchell questions—due to the fact that they are based on the knowledge of basic financial principles (e.g., compound interest, inflation, etc.) and are limited in terms of the number of items—could not work perfectly in the assessment of the role of financial literacy in the explanation of financial behaviors when the financial behavior concerns a specific area of contents (e.g., savings, retirement planning, use of credit cards, etc.) seems to be confirmed.
In such scenarios, where the analysis is focused on specific financial decisions, the “unbiased” index seems to be the most sensitive measure, and to be able to highlight the connection between financial literacy and financial behaviors better than other measures. Of course, the 50 items measure can seem to be more powerful but we have to keep in mind (1) the learning by doing effect related with the reverse causality dilemma and (2) the fact that the 50 items include the subset of items used to assess the FL-unbiased measure.
The reason behind the performance of the unbiased index could be the larger number of items used, compared to the measures based on five items (e.g., Lusardi–Mitchell, 5-specific indices), plus the chance that the five questions used in the Lusardi–Mitchell and/or in the 5-specific index could be included in the set of items used for the “unbiased” index is another possible explanation11. Hence, the good performance of the index could be rooted in the more rich set of information used to build the index. The good performance of the “unbiased” index is interesting even because the selection criteria of the underlying items of the index should extremely mitigate the reverse causality issue that typically affects the reliability of the financial literacy studies and the implication of their conclusions. Limiting the chance that the correlation between financial literacy and the use of a financial product could be driven by a learning by doing process to the chance that people learn about a product they did not use during their market screening for other financial products they used, and keeping in mind that this estimating error affects only a few of the items used to assess the unbiased index, we can conclude that results are robust against the reverse causality hypothesis—where the financial literacy is the consequence of the use and not the opposite—presenting a scenario that suggests a relationship where it is knowledge that affects behaviors and not the opposite. That result is pivotal for policy makers whose decisions could be affected by doubt concerning the hypothesis that people with more financial literacy could make different financial decisions compared with less financially literate individuals.
The reading of results by financial behaviors provides additional elements of interest. When the dependent variable was linked to the fact that the respondent tried to figure out his/her retirement needs or not, the “unbiased” index is the financial literacy measure with the highest coefficient values in four of the five countries. The positive sign of the coefficient suggests that people with more financial knowledge tend to be more prone to think about their retirement age. This result confirms results from previous studies, but the relevance of financial literacy compared with the index based on the Lusardi–Mitchell (LM) is almost double in the case of Sweden (LM coef. 0.33 vs. unbiased coef. 0.63) and the UK (LM coef. 0.22 vs. unbiased coef. 0.46), with even more strong evidence in Italy (LM coef. 0.25 vs. unbiased coef. 0.61). The preference for the unbiased measure of financial literacy is clear even when the financial behavior is about saving for rainy days. The unbiased index outperforms the other indices three times out of five (plus the case of the whole sample). In this case the LM index is never the best measure, while the 5-specific questions index shows the value of coefficients just above the unbiased index ones for the remaining two cases (Germany 5-specific coef. 0.34 vs. unbiased 0.30; Sweden 5-specific 0.54 vs. unbiased 0.50). The preference for the unbiased index is clear even for the investment behaviors—measured by the preference for stocks and/or mutual funds in the composition of the investment portfolios). The unbiased index shows the highest values of coefficients for France, Italy, and the UK, while the 5-specific measure works better in Sweden, and the Lusardi–Mitchell in Germany.
Results change when the ownership of at least one credit card (or not) is used as the dependent variable. The unbiased measure remains the best financial literacy measure in Italy (unbiased index 0.49; 5-specific 0.30; LM 0.34), and it is the only statistically significant measure in France, even if the French case is the only one where financial literacy has a negative sign of the coefficient, suggesting an opposite relationship between financial literacy and the use of credit cards. In Germany, Sweden, and the UK the 5-specific index better explains the relationship between financial knowledge and the use of credit cards. The last financial behavior—concerning the ownership of any type of plastic card—is the only one where the unbiased index does not perform well as a financial literacy measure. It is never the measure with the largest coefficients, but in three countries, it is not even a statistically relevant variable (France, Germany, and Italy).
An additional source of interest is the reading of results by country (Table 4). If the general result about the connection between financial literacy and financial education confirms the explanatory power of financial literacy on financial behaviors in all the countries, which of the financial literacy measures considered is the one that best fit in a country is not clear. The unbiased measure is the most explicative measure in four cases (financial behaviors) out of five in France and Italy, where in both cases the use of plastic cards is the fifth case where that index is not significant.
A more balanced scenario is the UK. In three cases the unbiased measure outperforms the others (Investment, Saving for rainy days, Retirement planning), while in the other two cases (Credit cards and Plastic Cards) it is the 5-specific measure that better explains the relationship between financial literacy and financial behaviors.
The 5-specific measures are the most appropriate to explain the Swedish case, where it represents the index with the largest values of coefficients in four of the five behaviors. The only exception is the retirement planning behavior, where the unbiased measure seems to be more powerful. However, the dominance of the unbiased financial literacy measure on the other options in the case of retirement planning exists in all the countries, with the only exception being Germany. The German case seems to be unique. Germany is the only country where the unbiased measure is never the best financial literacy measure. In the meantime, it is even the country where three times out of five the Lusardi–Mitchell questions outperform the other measures, even if the difference between the coefficients of the 5-specific index are not very big12.
A final comment concerns the 50-items index. The fact that that measure includes all the items used to assess other measures (e.g., the five items of Lusardi and Mitchell, the 5-specific, the “unbiased”, etc.) gives to the 50 items index an advantage in terms of amount of information used to assess the financial literacy. It follows that any direct and (supposed to be) equal comparison with other indices tends to be unfair. However, the comparison with other measures can be interesting to assess the gap between a measure that is quite large, because it is based on 50 items, and potentially affected by reverse causality, and other measures based on a limited number of items but that address the relationship between financial literacy and financial behavior more carefully. The analysis of the 30 results (five behaviors × [5 + 1] countries) shows how the variables related to the 50-items financial literacy index are statistically significant 27 times. The sign and the values of the coefficients are consistent and support the hypothesis that any correct answer to one of the 50 questions on financial knowledge increase the likelihood to show one of the five financial behaviors of the study (e.g., saving for rainy days, plan for retirement, mutual fund investments, etc.). The fact that the three cases where the index fails to explain financial behaviors are all about France stresses the need to take into account country based characteristics in the measurement of financial literacy, and highlight the pros to have different measures available.
5. Conclusions
The aim of the study was to test how alternative methodologies in the assessment of financial literacy can improve the explanation of the connection between consumer financial literacy and consumer financial behaviors. The analysis of the study used data from several European countries (France, Germany, Italy, Sweden, and the UK) to compare the explanatory power of the items developed by Lusardi and Mitchell more than a decade ago (and became an international standard and referred as the “big-5”) with different alternative measures that take benefit from the availability of a broad set of items on financial literacy.
The Lusardi and Mitchell questions were used as a standard reference point in order to test the reliability of the results from previous studies. The generous number of items on financial literacy in the data (50 items organized in 10 groups of five questions each, where each group analyzes a different topic) allowed to test three alternative measures. The first measure is called the “5-specific” index, made by the sum of correct answers to a single subset of questions, chosen to match with topic of the financial behavior taken into account (e.g., the five questions on investment were chosen when the financial behavior was investment portfolio composition). The second measure was the “50-items” index, equal to the sum of correct answers to all the 50 financial literacy questions of the survey (rescaled to a 0–5 range). The third measure summed the correct answers to the subset of questions that remained after taking out all the questions on topics potentially affected by reverse causality issues. These questions are the ones that assess knowledge on financial products and services ever used by the respondent (that could have developed knowledge thanks to the use of financial products). The fact that the remaining items cannot be biased by that learning by doing effect (due to the lack of use) suggested to refer to that financial literacy measure as the “unbiased” index.
These alternative measures of financial literacy could improve the tools available to investigate financial literacy issues thanks to the larger number of items available and the different item selection criteria. If one of the pros of the “big-5” is the ease of being added to existing questionnaires and then being used in a new wave of a survey, the limited number of items, the analysis of general financial principles, and the inability to test different levels of difficulty in a single question suggest to not limit these items to the assessment methodology tools in financial literacy. The “big-5”, originally developed to start the analysis of financial literacy, financial behaviors, and financial education, should be used any time the lack of previous study in a specific framework (e.g., new country, new target of recipients, etc.) requires the beginning of a new investigation. In case a deeper understanding of the relationship between financial literacy and financial behavior is required, additional measures could be used.
With the aim to improve the understanding of the role of financial literacy on the explanation of financial behavior, this study provides three main contributions: it tests how the use of items that are logically related with a financial behavior affects the result about the role of financial literacy in the explanation of financial behaviors; it tests how a broad set of items could increase (thanks to the more rich set of information) the quality of the assessment of financial literacy; it gives a contribution to the reverse causality dilemma developing an item selection criteria able to “protect” the results from the reverse causality issue.
The results of the paper show that additional measures of financial literacy are useful to better understand the relationships between financial literacy and financial behaviors. The differences between the Lusardi–Mitchell question based indices and the measures proposed suggest to consider the new measures as new financial literacy assessment tools that do not want to replace the previous ones. The fact that the Lusardi–Mitchell (1) analyze basic fundamental financial principles, (2) are easily added to existing surveys, and (3) guarantee the comparability with previous studies suggest to use them when the aim of a study is to do a first investigation of the financial literacy in a certain group. Once results from this first level analysis stress the need to a deeper analysis, the measures proposed in this study have shown their reliability as a second-level investigation tool.
Thanks to the “unbiased” index, this study contributed to solve the reverse causality dilemma that involves financial literacy and financial behaviors. The explanatory power of the “unbiased” financial literacy index supports the hypothesis that the financial literacy of the individuals affects their financial behaviors, even controlling for other possible explanations. If a learning-by-doing effect is a natural process in finance and the chance that people improve their financial literacy by the use of financial products and services is reasonable, results of this paper support the hypothesis that financial literacy matters to start a “virtuous loop”. There, knowledge affects the financial decisions, leading to positive financial behaviors, by which new knowledge and skills are developed.
The chance to deal with data from different countries allowed showing that results are consistent between countries, even if some differences exist. France, Italy, and the UK are countries that show several similarities. In these countries, the “unbiased” index is the one that works better than others do, when investments, saving for rainy days, and retirement planning are taken into account. When the financial behaviors concern payment options, (e.g., use of credit cards, debit cards, etc.) Sweden, the UK, and Italy show more similarities with the “5-specific” index that outperforms other financial literacy measures. Results from Germany tell a different story, with the Lusardi–Mitchell questions still performing well, even if the reliability of the new measures is confirmed.
Looking at the implications of these results, academics, policy makers, and officials who are involved in financial education are probably those who can benefit the most from this study. The availability of new measures of financial literacy—that work as a second-stage analysis tool after a preliminary study based on other measures—provides additional assessment tools for academia that can be useful in further studies or to reevaluate results from previous studies. Policy makers can be more confident in relying on financial literacy as a policy tool in consumer protection, thanks to the analysis of the reverse causality dilemma. At the same time, evidence that differences between countries exist remind us of the need to take into account the peculiarities of countries when they are part of international comparisons.
About the financial education, the reliability of financial literacy as a driver of financial behaviors is fundamental for any financial education program. Moreover, new measures of financial literacy can improve the quality of the assessment of financial education curricula.
Author Contributions
The paper is a joint work of the authors. However, Introduction (Section 1) and Literature review (Section 2) can be attributed to Marlene Haupt, while Data and Methodology (Section 3), Conclusions (Section 4) and the Appendix A to Gianni Nicolini.
Funding
This research received no external funding.
Acknowledgments
The authors acknowledge the CFRC—Consumer Finance Research Center—and all its members for the unique database used in this study.
Conflicts of Interest
The authors declare no conflict of interest.
Appendix A

Table A1.
Distribution of the number of products “do NOT use”, necessary to assess the “Unbiased” financial literacy measure.
Table A1.
Distribution of the number of products “do NOT use”, necessary to assess the “Unbiased” financial literacy measure.
| Distribution of the Number of Products “Do NOT Use”, Necessary to Assess the “Unbiased” Financial Literacy Measure | ||||||
|---|---|---|---|---|---|---|
| #Items | #Products | FRA % | GER % | ITA % | SWE % | UK % |
| # obs. | # obs. | # obs. | # obs. | # obs. | ||
| 0 | 0 | 0.2% | 0.6% | 0.6% | 1.1% | 2.0% |
| 1 | 3 | 3 | 7 | 12 | ||
| 5 | 1 | 2.9% | 4.5% | 4.8% | 5.5% | 6.6% |
| 15 | 24 | 24 | 35 | 40 | ||
| 10 | 2 | 6.0% | 8.4% | 10.5% | 13.7% | 12.5% |
| 31 | 45 | 53 | 87 | 76 | ||
| 15 | 3 | 14.3% | 18.0% | 15.5% | 17.0% | 18.0% |
| 74 | 96 | 78 | 108 | 109 | ||
| 20 | 4 | 22.2% | 19.7% | 24.1% | 20.4% | 19.3% |
| 115 | 105 | 121 | 130 | 117 | ||
| 25 | 5 | 27.0% | 22.3% | 25.8% | 19.2% | 23.7% |
| 140 | 119 | 130 | 122 | 144 | ||
| 30 | 6 | 16.2% | 18.9% | 13.5% | 11.5% | 12.0% |
| 84 | 101 | 68 | 73 | 73 | ||
| 35 | 7 | 6.7% | 6.0% | 5.0% | 4.4% | 3.5% |
| 35 | 32 | 25 | 28 | 21 | ||
| 40 | 8 | 4.6% | 1.5% | 0.2% | 7.2% | 2.5% |
| 24 | 8 | 1 | 46 | 15 | ||
| Total | 100% | 100% | 100% | 100% | 100% | |
| Average number of products | 5.52 | 5.35 | 4.80 | 4.73 | 4.52 | |
| Average number of Items | 23.12 | 21.68 | 20.77 | 20.95 | 19.87 | |
| List of financial products and behaviors. - Investment (A)—Stocks or Mutual funds as main asset class in the portfolio (Yes | No) - Investment (B)—Saving for rainy days (at least 3 months salary as saving) (Yes | No) - Retirement (C)—“Have you ever tried to figure out how much you need to save for retirement?” (Yes | No) - Payment tools (E)—Ownership of at least one between Credit | Debit | Pre-paid card (Yes | No) - Mortgage—“Did you ever have a mortgage?” (Yes | No) - Bond—“When you invest your money, do you consider the chance to use following investment options?” (Yes | No) - Bank account—“Do you have a bank account?” (Yes | No) - Loan and Debt—“How much is the total amount of your debts (not considering the mortgages on houses)”? (1 if > 0) | ||||||
Table A2.
Descriptive statistics of the dependent and independent variables.
| France | Germany | Italy | Sweden | UK | ||||||
|---|---|---|---|---|---|---|---|---|---|---|
| # | % | # | % | # | % | # | % | # | % | |
| Investment | ||||||||||
| 1 | 81 | 15.6% | 94 | 17.6% | 98 | 19.5% | 222 | 34.9% | 108 | 17.8% |
| 0 | 438 | 84.4% | 439 | 82.4% | 405 | 80.5% | 414 | 65.1% | 499 | 82.2% |
| TOT | 519 | 100% | 533 | 100% | 503 | 100% | 636 | 100% | 607 | 100% |
| Rainydays | ||||||||||
| 1 | 207 | 39.9% | 279 | 52.3% | 258 | 51.3% | 298 | 46.9% | 314 | 51.7% |
| 0 | 312 | 60.1% | 254 | 47.7% | 245 | 48.7% | 338 | 53.1% | 293 | 48.3% |
| TOT | 519 | 100% | 533 | 100% | 503 | 100% | 636 | 100% | 607 | 100% |
| Retirement | ||||||||||
| 1 | 82 | 15.8% | 201 | 37.7% | 94 | 18.7% | 121 | 19.0% | 165 | 27.2% |
| 0 | 437 | 84.2% | 332 | 62.3% | 409 | 81.3% | 515 | 81.0% | 442 | 72.8% |
| TOT | 519 | 100% | 533 | 100% | 503 | 100% | 636 | 100% | 607 | 100% |
| Creditcard | ||||||||||
| 1 | 295 | 56.8% | 251 | 47.1% | 274 | 54.5% | 263 | 41.4% | 325 | 53.5% |
| 0 | 224 | 43.2% | 282 | 52.9% | 229 | 45.5% | 373 | 58.6% | 282 | 46.5% |
| TOT | 519 | 100% | 533 | 100% | 503 | 100% | 636 | 100% | 607 | 100% |
| Anycard | ||||||||||
| 1 | 447 | 86.1% | 402 | 75.4% | 462 | 91.8% | 551 | 86.6% | 557 | 91.8% |
| 0 | 72 | 13.9% | 131 | 24.6% | 41 | 8.2% | 85 | 13.4% | 50 | 8.2% |
| TOT | 519 | 100% | 533 | 100% | 503 | 100% | 636 | 100% | 607 | 100% |
| Age | ||||||||||
| 1 = “18–24” | 67 | 12.9% | 48 | 9.0% | 49 | 9.7% | 90 | 14.2% | 107 | 17.6% |
| 2 = “25–30” | 64 | 12.3% | 74 | 13.9% | 45 | 8.9% | 85 | 13.4% | 90 | 14.8% |
| 3 = “31–35” | 43 | 8.3% | 64 | 12.0% | 43 | 8.5% | 71 | 11.2% | 71 | 11.7% |
| 4 = “36–40” | 53 | 10.2% | 46 | 8.6% | 49 | 9.7% | 59 | 9.3% | 60 | 9.9% |
| 5 = “41–45” | 50 | 9.6% | 30 | 5.6% | 55 | 10.9% | 72 | 11.3% | 42 | 6.9% |
| 6 = “46–50” | 33 | 6.4% | 35 | 6.6% | 56 | 11.1% | 68 | 10.7% | 48 | 7.9% |
| 7 = “51–55” | 44 | 8.5% | 47 | 8.8% | 50 | 9.9% | 71 | 11.2% | 55 | 9.1% |
| 8 = “56–60” | 33 | 6.4% | 31 | 5.8% | 50 | 9.9% | 43 | 6.8% | 42 | 6.9% |
| 9 = “61–65” | 46 | 8.9% | 44 | 8.3% | 41 | 8.2% | 45 | 7.1% | 32 | 5.3% |
| 10 = “Over 65” | 84 | 16.2% | 110 | 20.6% | 64 | 12.7% | 4 | 0.6% | 58 | 9.6% |
| n.a. | 2 | 0.4% | 4 | 0.8% | 1 | 0.2% | 28 | 4.4% | 2 | 0.3% |
| TOT | 519 | 100% | 533 | 100% | 503 | 100% | 636 | 100% | 607 | 100% |
| Male | ||||||||||
| 1 | 243 | 46.8% | 244 | 45.8% | 247 | 49.1% | 296 | 46.5% | 280 | 46.1% |
| 0 | 263 | 50.7% | 275 | 51.6% | 255 | 50.7% | 305 | 48.0% | 316 | 52.1% |
| n.a. | 13 | 2.5% | 14 | 2.6% | 1 | 0.2% | 35 | 5.5% | 11 | 1.8% |
| TOT | 519 | 100% | 533 | 100% | 503 | 100% | 636 | 100% | 607 | 100% |
| Income | ||||||||||
| <500€ | 48 | 9.2% | 47 | 8.8% | 65 | 12.9% | 89 | 14.0% | 94 | 15.5% |
| 500€–749€ | 45 | 8.7% | 29 | 5.4% | 25 | 5.0% | 68 | 10.7% | 64 | 10.5% |
| 750€–999€ | 67 | 12.9% | 84 | 15.8% | 42 | 8.3% | 42 | 6.6% | 57 | 9.4% |
| 1000€–1499€ | 126 | 24.3% | 104 | 19.5% | 108 | 21.5% | 83 | 13.1% | 103 | 17.0% |
| 1500€–1999€ | 86 | 16.6% | 70 | 13.1% | 84 | 16.7% | 131 | 20.6% | 74 | 12.2% |
| 2000€–2999€ | 74 | 14.3% | 28 | 5.3% | 65 | 12.9% | 84 | 13.2% | 86 | 14.2% |
| 3000€–4000€ | 44 | 8.5% | 118 | 22.1% | 1 | 0.2% | 19 | 3.0% | 35 | 5.8% |
| 4000€+ | 18 | 3.5% | 24 | 4.5% | 39 | 7.8% | 15 | 2.4% | 28 | 4.6% |
| Prefer not to say | 11 | 2.1% | 29 | 5.4% | 74 | 14.7% | 10 | 1.6% | 66 | 10.9% |
| Do not Know | 0 | 0.0% | 0.0% | 0.0% | 95 | 14.9% | 0.0% | |||
| TOT | 519 | 100% | 533 | 100% | 503 | 100% | 636 | 100% | 607 | 100% |
| Marital status | ||||||||||
| Single | 168 | 32.4% | 137 | 25.7% | 124 | 24.7% | 212 | 33.3% | 208 | 34.3% |
| Cohabiting partner | 87 | 16.8% | 106 | 19.9% | 56 | 11.1% | 165 | 25.9% | 68 | 11.2% |
| Married | 177 | 34.1% | 193 | 36.2% | 284 | 56.5% | 179 | 28.1% | 275 | 45.3% |
| Separated | 13 | 2.5% | 10 | 1.9% | 10 | 2.0% | 20 | 3.1% | 7 | 1.2% |
| Divorced | 49 | 9.4% | 62 | 11.6% | 16 | 3.2% | 16 | 2.5% | 31 | 5.1% |
| Widow | 20 | 3.9% | 15 | 2.8% | 6 | 1.2% | 3 | 0.5% | 10 | 1.6% |
| Prefer not to say | 5 | 1.0% | 10 | 1.9% | 7 | 1.4% | 41 | 6.4% | 8 | 1.3% |
| TOT | 519 | 100% | 533 | 100% | 503 | 100% | 636 | 100% | 607 | 100% |
| Education | ||||||||||
| 1 = “Primary school or less” | 37 | 7.1% | 5 | 0.9% | 2 | 0.4% | 3 | 0.5% | 2 | 0.3% |
| 2 = “Middle school” | 112 | 21.6% | 66 | 12.4% | 58 | 11.5% | 60 | 9.4% | 136 | 22.4% |
| 3 = “High school” | 188 | 36.2% | 184 | 34.5% | 211 | 41.9% | 276 | 43.4% | 143 | 23.6% |
| 4 = “Some college” | 89 | 17.1% | 178 | 33.4% | 80 | 15.9% | 85 | 13.4% | 147 | 24.2% |
| 5 = “University degree” | 71 | 13.7% | 90 | 16.9% | 112 | 22.3% | 116.7 | 18.3% | 83 | 13.7% |
| 6 = “Post-graduate degree” | 16 | 3.1% | 4 | 0.8% | 38 | 7.6% | 58.3 | 9.2% | 88 | 14.5% |
| n.a. | 6 | 1.2% | 6 | 1.1% | 2 | 0.4% | 37 | 5.8% | 8 | 1.3% |
| TOT | 519 | 100% | 533 | 100% | 503 | 100% | 636 | 100% | 607 | 100% |
Table A3.
Descriptive statistics of the financial literacy measures.
| France | Germany | Italy | Sweden | UK | Whole Sample | |
|---|---|---|---|---|---|---|
| Lusardi–Mitchell | ||||||
| (0 | 1 | 2 | 3 | 4 | 5) | ||||||
| Min | 0 | 0 | 0 | 0 | 0 | 0 |
| Max | 5 | 5 | 5 | 5 | 5 | 5 |
| Mean | 2.499 | 3.077 | 2.351 | 1.808 | 2.583 | 2.533 |
| St. Dev. | 1.26 | 1.222 | 1.087 | 1.271 | 1.358 | 1.308 |
| # Obs. | 519 | 533 | 503 | 636 | 607 | 2769 |
| 50-items (0–5) | ||||||
| (0–5) | ||||||
| Min | 0 | 0 | 0 | 0 | 0 | 0 |
| Max | 4.2 | 4.5 | 4.3 | 4.2 | 4.3 | 4.5 |
| Mean | 1.939 | 2.45591 | 2.223 | 1.8758 | 2.16 | 2.026 |
| St. Dev. | 0.749 | 0.871471 | 0.816 | 1.0561 | 0.977 | 0.902 |
| # Obs. | 519 | 533 | 503 | 636 | 607 | 2769 |
| 5-specific_Investment | ||||||
| (0 | 1 | 2 | 3 | 4 | 5) | ||||||
| Min | 0 | 0 | 0 | 0 | 0 | 0 |
| Max | 5 | 5 | 5 | 5 | 5 | 5 |
| Mean | 1.753 | 2.58 | 1.876 | 2.36 | 1.562 | 1.989 |
| St. Dev. | 1.503 | 1.557 | 1.148 | 1.906 | 1.49 | 1.609 |
| # Obs. | 519 | 533 | 503 | 636 | 607 | 2769 |
| 5-specific_Savings | ||||||
| (“Rainydays”) | ||||||
| (0 | 1 | 2 | 3 | 4 | 5) | ||||||
| Min | 0 | 0 | 0 | 0 | 0 | 0 |
| Max | 4 | 5 | 5 | 5 | 5 | 5 |
| Mean | 1.013 | 1.717 | 1.823 | 1.264 | 1.214 | 1.270 |
| St. Dev. | 1.07 | 1.229 | 1.371 | 1.276 | 1.224 | 1.193 |
| # Obs. | 519 | 533 | 503 | 636 | 607 | 2769 |
| 5-specific_Retirement | ||||||
| (0 | 1 | 2 | 3 | 4 | 5) | ||||||
| Min | 0 | 0 | 0 | 0 | 0 | 0 |
| Max | 4 | 5 | 5 | 4 | 5 | 5 |
| Mean | 1.062 | 1.856 | 1.679 | 1.2 | 1.568 | 1.376 |
| St. Dev. | 1.019 | 1.292 | 1.21 | 1.151 | 1.13 | 1.157 |
| # Obs. | 519 | 533 | 503 | 636 | 607 | 2769 |
| 5-specific_Payments tools | ||||||
| (“Credit card”, “Anycard”) | ||||||
| (0 | 1 | 2 | 3 | 4 | 5) | ||||||
| Min | 0 | 0 | 0 | 0 | 0 | 0 |
| Max | 5 | 5 | 5 | 5 | 5 | 5 |
| Mean | 2.605 | 3.362 | 2.598 | 2.772 | 3.46 | 2.625 |
| St. Dev. | 1.211 | 1.239 | 1.179 | 1.481 | 1.588 | 1.655 |
| # Obs. | 519 | 533 | 503 | 636 | 607 | 2769 |
| FL-unbiased | ||||||
| (0 | 1 | 2 | 3 | 4 | 5) | ||||||
| Min | 0 | 0 | 0 | 0 | 0 | 0 |
| Max | 5 | 5 | 5 | 5 | 5 | 5 |
| Mean | 1.369 | 1.933 | 1.805 | 1.368 | 1.497 | 1.541 |
| St. Dev. | 0.877 | 0.992 | 0.915 | 1.083 | 1.073 | 0.986 |
| # Obs. | 519 | 533 | 503 | 636 | 607 | 2746 |
References
- Agnew, Julie R., Hazel Bateman, and Susan Thorp. 2013. Financial Literacy and Retirement Planning in Australia. Numeracy Advancing Education in Quantitative Literacy 6: 7. [Google Scholar] [CrossRef] [Green Version]
- Allgood, Sam, and William Walstad. 2013. Financial Literacy and Credit Card Behaviors: A Cross-Sectional Analysis by Age. Numeracy Advancing Education in Quantitative Literacy 6: 3. [Google Scholar] [CrossRef] [Green Version]
- Aprea, Carmela, Eveline Wuttke, Klaus Breuer, Noi Keng Koh, Peter Davies, Bettina Greimel-Fuhrmann, and Jane S. Lopus, eds. 2016. International Handbook of Financial Literacy. Berlin and Heidelberg: Springer. [Google Scholar]
- Despard, Mathieu R., and Gina A. Chowa. 2014. Testing a measurement model of financial capability among youth in Ghana. The Journal of Consumer Affairs 48: 301–22. [Google Scholar] [CrossRef]
- Honekamp, Ivonne. 2012. Financial Literacy and Retirement Savings in Germany. Networks Financial Institute at Indiana State University Working Paper, 2012-Wp-03. Available online: https://www.indstate.edu/business/NFI/papers (accessed on 19 September 2019).[Green Version]
- Hung, Angela, Andrew M. Parker, and Joanne Yoong. 2009. Defining and Measuring Financial Literacy. RAND Working Paper WR-708. Santa Monica, CA, USA: RAND. [Google Scholar]
- Huston, Sandra J. 2010. Measuring Financial Literacy. The Journal of Consumer Affairs 44: 296–316. [Google Scholar] [CrossRef]
- Knoll, Melissa, and Carrie R. Houts. 2012. The Financial Knowledge Scale: An Application of Item Response Theory to the Assessment of Financial Literacy. The Journal of Consumer Affairs 46: 381–410. [Google Scholar] [CrossRef]
- Lusardi, Annamaria, and Olivia S. Mitchell. 2011. Financial literacy around the world: An overview. Journal of Pension Economics and Finance 10: 497–508. [Google Scholar] [CrossRef] [PubMed]
- Mottola, Gary. 2013. In Our Best Interest: Women, Financial Literacy, and Credit Card Behavior. Numeracy Advancing Education in Quantitative Literacy 6: 4. [Google Scholar] [CrossRef] [Green Version]
- Murphy, John. 2013. Psychosocial Factors and Financial Literacy. Social Security Bulletin 73: 73–81. [Google Scholar] [PubMed]
- Nicolini, Gianni. 2019. Financial Literacy in Europe: Assessment Methodologies and Evidence from European Countries. Abington: Routledge. [Google Scholar]
- Nicolini, Gianni, Brenda J. Cude, and Swarn Chatterjee. 2013. Financial literacy: A comparative study across four countries. International Journal of Consumer Studies 37: 689–705. [Google Scholar] [CrossRef]
- Remund, David L. 2010. Financial Literacy Explication: The Case for a Clearer Definition in an Increasingly Complex Economy. The Journal of Consumer Affairs 44: 276–95. [Google Scholar] [CrossRef]
- US FLEC (Financial Literacy and Education Commission). 2009. 2008 Annual Report to the President Executive Summary. Available online: https://www.treasury.gov/about/organizational-structure/offices/Domestic-Finance/Documents/exec_sum.pdf (accessed on 19 September 2019).
- Van Rooij, Maarten, Annamaria Lusardi, and Rob Alessie. 2011. Financial Literacy and Stock market Participation. Journal of Financial Economics 101: 449–72. [Google Scholar] [CrossRef]
- Yoong, Joanne. 2010. Financial Illiteracy and Stock Market Participation: Evidence from the RAND American Life Panel. Wharton School-University of Pennsylvania-Pension Research Council Working Paper, PRC WP2010-29. Available online: https://pensionresearchcouncil.wharton.upenn.edu/ (accessed on 19 September 2019).[Green Version]
| 1 | US Financial Literacy and Education Commission. The same definition was used two years later by Hung et al. (2009) and Murphy (2013). |
| 2 | The authors use the Items Response Theory (IRT) to identify the optimal set of items to assess financial knowledge by a single standard measure. |
| 3 | Huston (2010) reports that the main areas of knowledge addressed in financial literacy studies were basic concepts (Interest rate, Inflation, etc.), Borrowing, Saving and Investments, Retirement and Pension planning, Insurance. Nicolini (2019) identifies the main areas of knowledge with Money management, Saving and Investment, Borrowing and Debt, Insurance, and Retirement and Planning. |
| 4 | Questions with a correct response rate beyond 90% or below 10% where considered not useful for the purpose of the study because it was not possible to differentiate between different degree of financial literacy of the respondents. Moreover, where different financial products were available, the preference was for more basic products. It follows that, for instance—during the validation of the questionnaire—not outstanding performance on questions about Stocks and very few correct answers on Mutual Funds, suggested to include only questions on stocks in the questionnaire and not even questions on more complex products like mutual funds, ETF, or ETC. |
| 5 | The only exception is for one of the Lusardi–Mitchell questions based on a True/False scheme. The will to guarantee the comparability of the data with previous studies recommended leaving this question unchanged. |
| 6 | The minimum threshold to be considered an adult was fixed at 18 years old. |
| 7 | The companies provided a sample of respondents according with the criteria received by the CFRC. |
| 8 | The relationship between financial literacy and the use of stocks was studied by Van Rooij et al. (2011) and Yoong (2010). The connection between Credit cards and financial literacy was analyzed by Allgood and Walstad (2013) and Mottola (2013). Regarding financial literacy and retirement planning see Agnew et al. (2013) and Honekamp (2012). |
| 9 | The full set of results is available from the authors under request. No interesting differences were found compared to previous studies. |
| 10 | This index is the one that counts the number of correct answer to five questions concerning the area of knowledge connected with the financial behavior measured by the dependent variable of the analysis (e.g., number of correct answers to five questions on payments tools when the financial behavior is the use of credit cards). |
| 11 | Details about the number of items included in the un-biased index of financial literacy in every country are reported in the Appendix A (Table A1). |
| 12 | The use of the same questionnaire, the same data collection time frame, and the use of the same data collection methods exclude the hypothesis that differences between Germany and other countries could be driven by biases on the raw data. Several hypotheses to explain the reason why results from Germany are so different from the other countries can be done. The analysis of differences between countries about financial literacy and financial behavior is an interesting topic (but not central to this paper) that deserves to be addressed by a specific study. |
Figure 1.
Financial behaviors (dependent variables).

Figure 2.
Financial literacy measures (scale 0–5).

Table 1.
The dependent variables: financial behaviors.
| Question | Variable | Coding |
|---|---|---|
| Referring to the following investment options, which one is the most relevant/valuable in your portfolio? ○ I have none of them ○ Stocks ○ Bonds ○ Mutual funds ○ Certificate of deposits ○ Deposit accounts ○ Jewelry and precious ○ Do not know ○ Prefer not to say | Investment | Variable equal to 1 if “Stocks” or “Mutual funds” represent the main investment vehicle (and 0 otherwise) |
| Have you set aside emergency or rainy day funds that would cover your expenses for 3 months, in case of sickness, job loss, economic downturn, or other emergencies? ○ Yes ○ No (○ Do not know ○ Prefer not to say) | Rainydays | Variable equal to 1 if “Yes” (and 0 otherwise) |
| Have you ever tried to figure out how much you need to save for retirement? ○ Yes ○ No (○ Do not know ○ Prefer not to say) | Retirement | Variable equal to 1 if “Yes” (and 0 otherwise) |
| Which of the following payment instruments do you have? □ Credit card □ Debit card □ Prepaid card … | Creditcard | Variable equal to 1 if “Credit card” is checked (and 0 otherwise) |
| Anycard | Variable equal to 1 if at least one between “Credit card”, “Debit card”, and “Prepaid card” is checked (and 0 otherwise) |
Table 2.
Biased- and unbiased-financial literacy measures.
| France | ||||||
| Obs. | Mean | St. Dev. | Pr (FL-Unbiased < FL-Biased) | Pr (FL-Unbiased = FL-Biased) | Correlation | |
| FL-unbiased | 494 | 1.39 | 0.878 | 1.000 | 0.000 | 0.2572 |
| FL-biased | 2.42 | 0.903 | ||||
| Germany | ||||||
| Obs. | Mean | St. Dev. | Pr (FL-Unbiased < FL-Biased) | Pr (FL-Unbiased = FL-Biased) | Correlation | |
| FL-unbiased | 522 | 1.95 | 0.99 | 1.000 | 0.000 | 0.4369 |
| FL-biased | 2.87 | 1.025 | ||||
| Italy | ||||||
| Obs. | Mean | St. Dev. | Pr (FL-Unbiased < FL-Biased) | Pr (FL-Unbiased = FL-Biased) | Correlation | |
| FL-unbiased | 498 | 1.81 | 0.915 | 1.000 | 0.000 | 0.4777 |
| FL-biased | 2.57 | 1.057 | ||||
| Sweden | ||||||
| Obs. | Mean | St. Dev. | Pr (FL-Unbiased < FL-Biased) | Pr (FL-Unbiased = FL-Biased) | Correlation | |
| FL-unbiased | 583 | 1.47 | 1.055 | 1.000 | 0.000 | 0.4676 |
| FL-biased | 2.58 | 1.089 | ||||
| UK | ||||||
| Obs. | Mean | St. Dev. | Pr (FL-Unbiased < FL-Biased) | Pr (FL-Unbiased = FL-Biased) | Correlation | |
| FL-unbiased | 580 | 1.53 | 1.067 | 1.000 | 0.000 | 0.4054 |
| FL-biased | 2.67 | 1.093 | ||||
| Whole sample | ||||||
| Obs. | Mean | St. Dev. | Pr (FL-Unbiased < FL-Biased) | Pr (FL-Unbiased = FL-Biased) | Correlation | |
| FL-unbiased | 2769 | 1.57 | 0.0220 | 1.000 | 0.000 | 0.3584 |
| FL-biased | 2.37 | 0.0189 | ||||
Table 3.
The explanatory power of different financial literacy measures on financial behaviors: empirical results.
Table 3.
The explanatory power of different financial literacy measures on financial behaviors: empirical results.
| France | Germany | Italy | Sweden | UK | Whole Sample | ||||||||||||||
|---|---|---|---|---|---|---|---|---|---|---|---|---|---|---|---|---|---|---|---|
| Coef. | p-Value | Coef. | p-Value | Coef. | p-Value | Coef. | p-Value | Coef. | p-Value | Coef. | p-Value | ||||||||
| Investment (Stocks or Mutual Funds as main assets in portfolio) | Lusardi–Mitchell | 0.10 | 0.370 | LM | 0.28 | 0.024 | 0.07 | 0.558 | 0.35 | 0.000 | 0.13 | 0.212 | 0.07 | 0.102 | |||||
| 5-specific-Investment | 0.26 | 0.008 | 0.25 | 0.012 | 0.31 | 0.013 | 5S | 0.39 | 0.000 | 0.18 | 0.045 | 5S | 0.34 | 0.000 | |||||
| FL-unbiased | U | 0.32 | 0.045 | 0.17 | 0.230 | U | 0.32 | 0.044 | 0.09 | 0.400 | U | 0.38 | 0.004 | 0.25 | 0.000 | ||||
| 50 items (0–5) | 0.27 | 0.125 | 0.50 | 0.003 | 0.40 | 0.038 | 0.70 | 0.000 | 0.30 | 0.022 | 0.44 | 0.000 | |||||||
| Rainydays (Saving for rainy days) | Lusardi–Mitchell | 0.49 | 0.000 | 0.24 | 0.008 | 0.30 | 0.004 | 0.46 | 0.000 | 0.21 | 0.008 | 0.29 | 0.000 | ||||||
| 5-specific-Savings | 0.30 | 0.003 | 5S | 0.34 | 0.000 | 0.46 | 0.000 | 5S | 0.54 | 0.000 | 0.32 | 0.000 | 0.35 | 0.000 | |||||
| FL-unbiased | U | 0.50 | 0.000 | 0.30 | 0.008 | U | 0.65 | 0.000 | 0.50 | 0.000 | U | 0.41 | 0.000 | U | 0.45 | 0.000 | |||
| 50 items (0–5) | 0.93 | 0.000 | 0.60 | 0.000 | 0.70 | 0.000 | 0.80 | 0.000 | 0.40 | 0.000 | 0.59 | 0.000 | |||||||
| Retirement (Figure out retirement needs) | Lusardi–Mitchell | 0.04 | 0.722 | LM | 0.28 | 0.003 | 0.25 | 0.044 | 0.33 | 0.003 | 0.22 | 0.017 | 0.28 | 0.000 | |||||
| 5-specific-Retirement | 0.17 | 0.190 | 0.24 | 0.003 | 0.26 | 0.026 | 0.56 | 0.000 | 0.25 | 0.015 | 0.37 | 0.000 | |||||||
| FL-unbiased | U | 0.57 | 0.001 | 0.26 | 0.017 | U | 0.61 | 0.000 | U | 0.63 | 0.000 | U | 0.46 | 0.000 | U | 0.55 | 0.000 | ||
| 50 items (0–5) | 0.17 | 0.125 | 0.37 | 0.007 | 0.54 | 0.009 | 0.70 | 0.000 | 0.40 | 0.000 | 0.56 | 0.000 | |||||||
| Creditcard (At least one credit card) | Lusardi–Mitchell | 0.09 | 0.266 | 0.53 | 0.000 | 0.34 | 0.001 | 0.28 | 0.003 | 0.42 | 0.000 | LM | 0.26 | 0.000 | |||||
| 5-specific-Payments | 0.11 | 0.165 | 5S | 0.68 | 0.000 | 0.30 | 0.003 | 5S | 0.56 | 0.000 | 5S | 0.48 | 0.000 | 0.17 | 0.000 | ||||
| FL-unbiased | U | −0.21 | 0.074 | 0.35 | 0.002 | U | 0.49 | 0.001 | 0.31 | 0.004 | 0.34 | 0.002 | 0.15 | 0.001 | |||||
| 50 items (0–5) | 0.17 | 0.125 | 0.90 | 0.000 | 0.81 | 0.000 | 0.60 | 0.000 | 0.72 | 0.000 | 0.44 | 0.000 | |||||||
| Anycard (At least one card between credit/debit/pre-paid) | Lusardi–Mitchell | LM | 0.63 | 0.000 | LM | 0.27 | 0.009 | 0.39 | 0.058 | 0.75 | 0.000 | 0.67 | 0.000 | LM | 0.28 | 0.000 | |||
| 5-specific-Payments | 0.57 | 0.000 | 0.23 | 0.018 | 5S | 0.47 | 0.018 | 5S | 1.04 | 0.000 | 5S | 0.83 | 0.000 | 0.20 | 0.000 | ||||
| FL-unbiased | 0.08 | 0.670 | 0.29 | 0.818 | 0.18 | 0.535 | 0.75 | 0.001 | 0.43 | 0.073 | 0.06 | 0.426 | |||||||
| 50 items (0–5) | 1.29 | 0.125 | 0.60 | 0.000 | 0.90 | 0.006 | 1.60 | 0.000 | 1.10 | 0.000 | 0.59 | 0.000 | |||||||
Legend: The coefficient with the highest value exceeding the second one by more than 0.05 is highlighted. Red: The Lusardi–Mitchell outperforms other measures; Blue: The 5-specific outperforms the other measures; Green: The FL-unbiased outperforms the other measures.
Table 4.
Summary of results: best performing financial literacy measures for each country-and-behavior combination.
Table 4.
Summary of results: best performing financial literacy measures for each country-and-behavior combination.
| France | Germany | Italy | Sweden | UK | Whole Sample | |
|---|---|---|---|---|---|---|
| Investment (Stocks or Mutual Funds as main assets in portfolio) | FL-unbiased | Lusardi–Mitchell | FL-unbiased | 5-specific-Investment | FL-unbiased | 5-specific-Investment |
| Rainydays (Saving for rainy days) | FL-unbiased | 5-specific-Savings | FL-unbiased | 5-specific-Savings | FL-unbiased | FL-unbiased |
| Retirement (Figure out retirement needs) | FL-unbiased | Lusardi–Mitchell | FL-unbiased | FL-unbiased | FL-unbiased | FL-unbiased |
| Creditcard (At least one credit card) | FL-unbiased | 5-specific-Payments | FL-unbiased | 5-specific-Payments | 5-specific-Payments | Lusardi–Mitchell |
| Anycard (At least one card between credit/debit/pre-paid) | Lusardi–Mitchell | Lusardi–Mitchell | 5-specific-Payments | 5-specific-Payments | 5-specific-Payments | Lusardi–Mitchell |
Legend: Green background = FL-unbiased index over-performed other measures. Red background = The Lusardi-Mitchell financial literacy score over-performed other measures. Blue background = The financial literacy measure based on the five items with a logical connection with the analyzed financial behavior over-performed other measures.
© 2019 by the authors. Licensee MDPI, Basel, Switzerland. This article is an open access article distributed under the terms and conditions of the Creative Commons Attribution (CC BY) license (http://creativecommons.org/licenses/by/4.0/).
Share and Cite
MDPI and ACS Style
Nicolini, G.; Haupt, M. The Assessment of Financial Literacy: New Evidence from Europe. Int. J. Financial Stud. 2019, 7, 54. https://0-doi-org.brum.beds.ac.uk/10.3390/ijfs7030054
AMA Style
Nicolini G, Haupt M. The Assessment of Financial Literacy: New Evidence from Europe. International Journal of Financial Studies. 2019; 7(3):54. https://0-doi-org.brum.beds.ac.uk/10.3390/ijfs7030054
Chicago/Turabian StyleNicolini, Gianni, and Marlene Haupt. 2019. "The Assessment of Financial Literacy: New Evidence from Europe" International Journal of Financial Studies 7, no. 3: 54. https://0-doi-org.brum.beds.ac.uk/10.3390/ijfs7030054
Note that from the first issue of 2016, this journal uses article numbers instead of page numbers. See further details here.