Article

The Effects of Extreme Weather Conditions on Hong Kong and Shenzhen Stock Market Returns

1
Division of Chinese Foreign Affairs and Commerce, Hankuk University of Foreign Studies, Seoul 02450, Korea
2
School of Business Administration, Pusan National University, Busan 46241, Korea
3
College of Basic Studies, Yeungnam University, Daegu 38451, Korea
4
Department of Economics, Pusan National University, Busan 46241, Korea
*
Author to whom correspondence should be addressed.
Int. J. Financial Stud. 2019, 7(4), 70; https://0-doi-org.brum.beds.ac.uk/10.3390/ijfs7040070
Submission received: 2 October 2019 / Revised: 4 December 2019 / Accepted: 4 December 2019 / Published: 9 December 2019
(This article belongs to the Special Issue Advances in Behavioural Finance and Economics)

Abstract

:
We investigate the impact of extreme weather conditions on the stock market returns of the Hong Kong Stock Exchange and Shenzhen Exchange. For the weather conditions, we apply dummy variables generated by applying a moving average and moving standard deviation. Our study provides two interesting results. First, extreme weather conditions have a significant impact on the stock returns of the Shenzhen Exchange, indicating that the Shenzhen market is inefficient. Second, during the pre-QFII period, extreme weather conditions have a strong impact on the returns of the Shenzhen stock market, but the impact is significantly weaker in the period after QFII. This means that the efficiency of the Shenzhen stock market has significantly increased since the QFII program due to the market openness to foreign institutional investors. We emphasize the role of foreign investors not affected by local weather conditions by observing how market opening affects extreme weather impacts on stock market returns.

1. Introduction

A psychological state, such as mood, feelings, emotion and sentiment, is known to play an important role in people’s decision making and judgment (Wright and Bower 1992; Bagozzi et al. 1999; Nofsinger 2002). It is also known that the weather has a significant influence on the people’s mood and sentiment, and in turn, people’s decision and behavior, called the weather effect (Rind 1996; Bassi et al. 2013).
If so, do weather conditions really affect stock market returns? The literature of market anomaly has suggested that weather conditions initially affect individuals’ emotional mood and sentiment and in turn influence investors’ rational decision makings. In this case, if investors’ decisions have significant weather effects, a variety of extreme weather conditions can affect stock returns.
The efficient market hypothesis (EMH) entails that stock prices are determined by firms’ fundamental values. If this theory is right, then it is not expected that any weather conditions can affect firms’ value. However, the literature of behavioral finance suggests that, to a certain extent, anomalies in stock markets can be occurred from various weather factors.1 This view challenges the validity of the EMH.
With regard to behavioral finance, Chinese stock markets are interested in examining weather effect on stock returns. There are two main stock indices in China: One is the domestic board (A-shares) and the other is the foreign board (B-shares). At the beginning, foreign investors were restricted to hold A-shares,2 and domestic investors were restricted for holding B-shares. However, since 9 July 2003, foreign investors have been allowed to trade A-shares on a limited basis.
In case of domestic investors, investment decisions can be affected by local weather conditions in China and, thus, the effect of weather conditions may be existed in Chinese stock markets. However, in recent years, the expansion of market opening and globalization has increased the level of participation of foreign stocks in the local stock market, which may have weakened the weather effects of the stock market. Using electronic trading systems and modern communication technologies, arbitrageurs can establish international portfolio strategies based on program transactions. This development can reduce the weather impact on stock returns and increase the efficiency of the Chinese stock market. This unique market nature allows us to investigate the impact of stock returns on foreign investors before and after the opening of the stock market.
In this paper, we examine the effect of weather conditions on stock returns using two typical stock market indices of the Hong Kong Stock Exchange and the Shenzhen Stock Exchange: Hang Seng Index (HSI) and Shenzhen Component Index (SZI). For this, we consider the daily index of the weather index (temperature, humidity and sunshine period) from January 1999 to June 2016 with three weather proxies: Temperature, humidity, and sunshine duration. Additionally, we also investigate whether the activity of foreign investors in the state of Shenzhen A has reduced the degree of market impact since 9 July 2003. To analyze the possible impact of A-share openness on foreign investors, we divide the SZI index series into two sub-periods and compare the meteorological effects between the two sub-periods.
The rest of the paper is organized as follows. Section 2 discusses previous research on the impact of weather on the stock market. Section 3 outlines Hong Kong and Shenzhen stock market and statistical characteristics. Section 4 describes the measurement of extreme weather conditions and dummy variables based on 11 (31 days) moving averages and standard deviations. Section 5 examines the relationship between weather conditions and stock returns and compares the results for the two sub-periods, before and after 9 July 2003. Finally, Section 6 presents conclusions.

2. Literature Review

Psychologists have long been interested in the effects of sunshine on human behavior (see Allen and Fischer 1978; Bell and Baron 1976; Cunningham 1979; Howarth and Hoffman 1984). They argue that sunshine affects people’s moods and emotions and can, in turn, affect their own attitudes toward certain behaviors. For example, Cunningham (1979) finds that mild sunshine has a positive effect on consumer behavior and encourages people to interview.
Such finding indicates that weather can affect individuals’ emotional state or mood, which in turn interferes in their rational or optimal decision-makings. If this is the case, the weather effect on people’s behavior may have a substantial impact on the decision-makings of stock investors.
Some research on weather impacts focuses on the impact of sunshine on stock returns. Saunders (1993) and Hirshleifer and Shumway (2003) report that cloud cover negatively affects daily stock returns. Recently, some studies consider various weather conditions. For example, Keef and Roush (2002, 2005) investigate the impact of weather conditions such as cloud cover, temperature, and wind on the returns of New Zealand securities. Dowling and Lucey (2005, 2008) also investigate the relationship between weather and stock returns using multi-weather proxy variables. Cao and Wei (2005) and Keef and Roush (2007) find a negative correlation between the returns and temperature of Australian stock market. Chang et al. (2006) report that cloud volumes and temperature had a negative impact on Taiwanese stock market returns. Similar results can be found in Yoon and Kang’s (2009) study of the effects of weather on Korea’s stock returns using humidity, temperature and cloud cover.
More recently, Novy-Marx (2014) finds that, the weather conditions of global warming and the El Niño phenomenon have a significant power in forecasting the performance of popular anomalies in stock markets, implying that these factors have predictability for the asset pricing.
Kaplanski et al. (2015) survey investors’ subjective emotional factors, returns and risk expectations. They are non-economic factors that influence the systematic risk and return expectations and investment plans of people who suffer from seasonal affective disorder it is found that the winter blues while supporting the hypothesis that the expected return is lower in autumn than any other season.
Schmittmann et al. (2015) explore the impact of weather on investors’ trading in German stock market and find strong evidence for the relationship between weather and overall trading volume. Kaustia and Rantapuska (2016) identify the weather effects in Finland and link stock returns with weather. They find that some weather-related mood variables are individually significant. Pizzutilo and Roncone (2017) use intraday stock data to examine the weather effects of the Italian stock market and conclude that there is no systematic relationship between weather and stock returns. Shim et al. (2017) uses a daily data to explore the meteorological effects of returns and volatility in the Korean stock and derivatives markets. Dong and Tremblay (2018) finds pervasive and systematic patterns of weather effects by examining weather (sunshine, rain, snow, wind, and temperature) and the stock index returns of 49 countries for the period from 1973 to 2012.
There are several empirical studies on the Chinese stock market. For example, Yi and Wang (2005) provide evidence of the weather effects (humidity and wind) on the Shanghai Composite Index. Han and Wang (2005) and Han (2005, 2006) find significant impacts of weather on the Shanghai and Shenzhen stock markets. Kang et al. (2010) consider the openness effect of Shanghai B-stock market to domestic investors and the effect of comparing the weather effects between two periods before and after the opening. They find a strong effect of weather on B-share returns only during the period after the opening, possibly indicating that the weather effect seems to be caused by the participation of domestic investors. Cao and Han (2015) also test the weather effects using DCCA cross-correlation coefficient and find that some weather variables affect the returns and volatilities of the Shanghai and Shenzhen stock markets.
All the above findings generally cast doubt on the validity of the EMH in Chinese stock markets. However, no study has analyzed the efficiency of the mainland Chinese stock market (Shenzhen stock market) by comparing it with the Greater Chinese stock market (Hong Kong stock market) from the perspective of behavioral finance. We think the two stock markets, Shenzhen and Hong Kong stock markets, are the best object of empirical study for exploring the weather effect and the origin and nature of market efficiency from the perspective of behavioral finance, because the two markets are very closely located to each other and in the same weather conditions, but different from the investor composition.

3. Hong Kong and Shenzhen Stock Markets

3.1. Overviews of Hong Kong and Shenzhen Stock Markets

This study considers Hong Kong and Shenzhen stock markets. There are two reasons why we focus on these two markets. First, because Shenzhen is the most important commerce gateway between the mainland China and Hong Kong, many blue chips in the southern part of China are listed in this market. To our knowledge, however, there is little study that investigates this market. Second, both stock markets are geographically very close to each other with the same climate zone, but the proportion of local investors (or that of foreign investors) is very different between the two markets. This is the main reason why we choose these two stock markets to investigate the effect of weather conditions on stock returns.
Table 1 briefly summarizes the key statistics of Hong Kong and Shenzhen stock markets. The Hong Kong Exchange is one of international financial centers, and its exchanges and clearing houses provide a wide range of financial service to private companies, investors, and financial intermediaries. Since the takeover from the UK, the Hong Kong Exchange has reinforced its financial transactions with mainland stock markets. As shown in Table 1, the Hong Kong Exchange has two major markets: the Main Board and the Growth Enterprise Market (GEM).3 As of 31 December 2016, the Hong Kong Stock Exchange has 1713 listed companies with a combined market capitalization of HK$24,450 billion in Main Board market.
The Shenzhen stock exchange, which is a relatively immature market, was launched on July 1991. Many companies on the Shenzhen stock market are subsidiaries of the state companies controlled by the Chinese government. As shown in Table 1, the market is segmented with two types of shares. One is consisted of A-shares that are the ordinary shares issued by the mainland Chinese companies. The shares intended for domestic investors are denominated and traded in RMB Yuan. The other is made up of the B-shares also issued by the mainland Chinese companies. However, the shares are denominated with RMB Yuan and traded with foreign currencies in buying and selling. In 2002, the Chinese government allowed foreign investors to buy and sell Yuan-denominated A-shares by the implementation of the Qualified Foreign Institutional Investor (QFII) program.
Chinese companies can be listed on H-Shares in the Hong Kong market and on A-Shares in the mainland market through IPOs. Meanwhile, investors in both regions can trade in both markets. Hong Kong is the gateway to mainland China and has close business relationships with other Asian economies. Therefore, the Hong Kong stock market is strategically positioned as a regional financial center to finance many Asian and multinational corporations.

3.2. Investors in Hong Kong and Shenzhen Stock Markets

In the Hong Kong Exchange (Table 2), foreign investors represent about more than 40% of total investors. In the Shenzhen stock market (Table 3), local individual investors dominate more than 80% of the market. The number of foreign investors is relatively very small, although it has been increased after the launch of the QFII program in 2003.
This study raises the following three hypotheses on the effect of weather on returns in these markets:
(1) Since the proportion of local individual investors in the Shenzhen stock market is high, the market is expected to be sensitive to local weather conditions;
(2) Since the QFII program, the Shenzhen stock market increasingly has a number of foreign investors who are less affected by local weather conditions, it is expected that the program mitigates the existence of weather effects on the Shenzhen stock market;
(3) Since the proportion of foreign investors is high in the Hong Kong Exchange, no weather effect on stock returns is expected in this market.

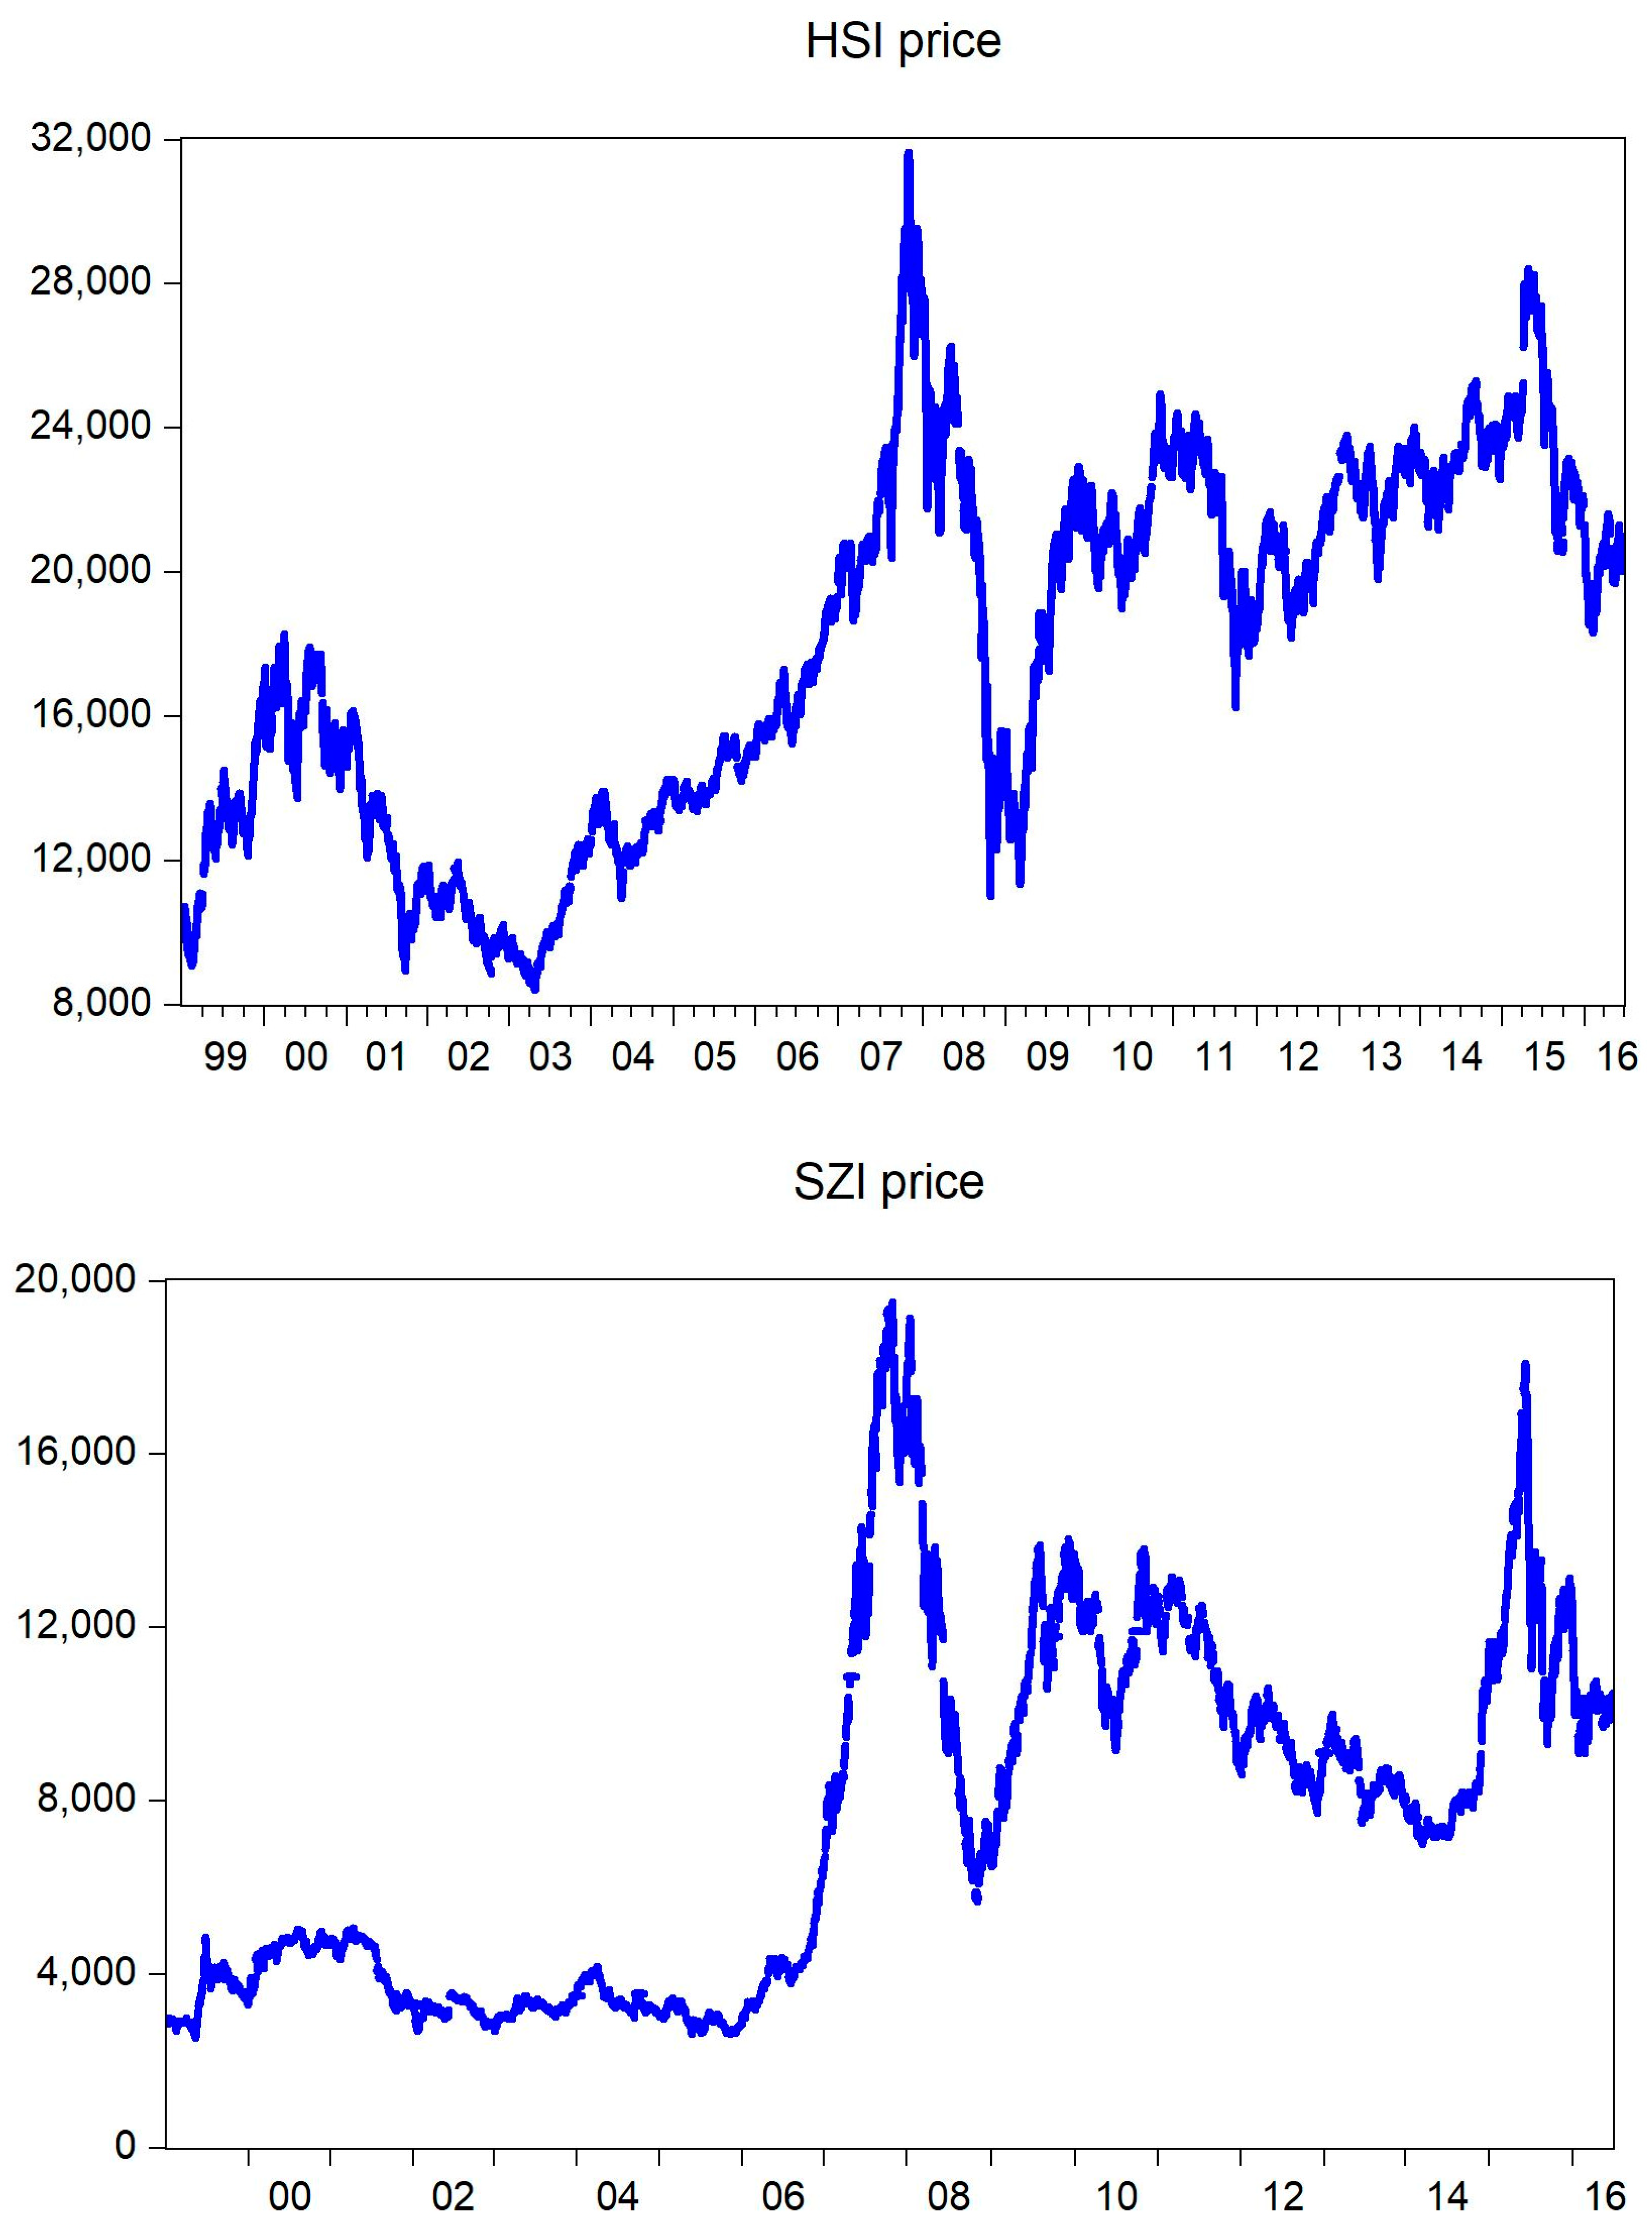
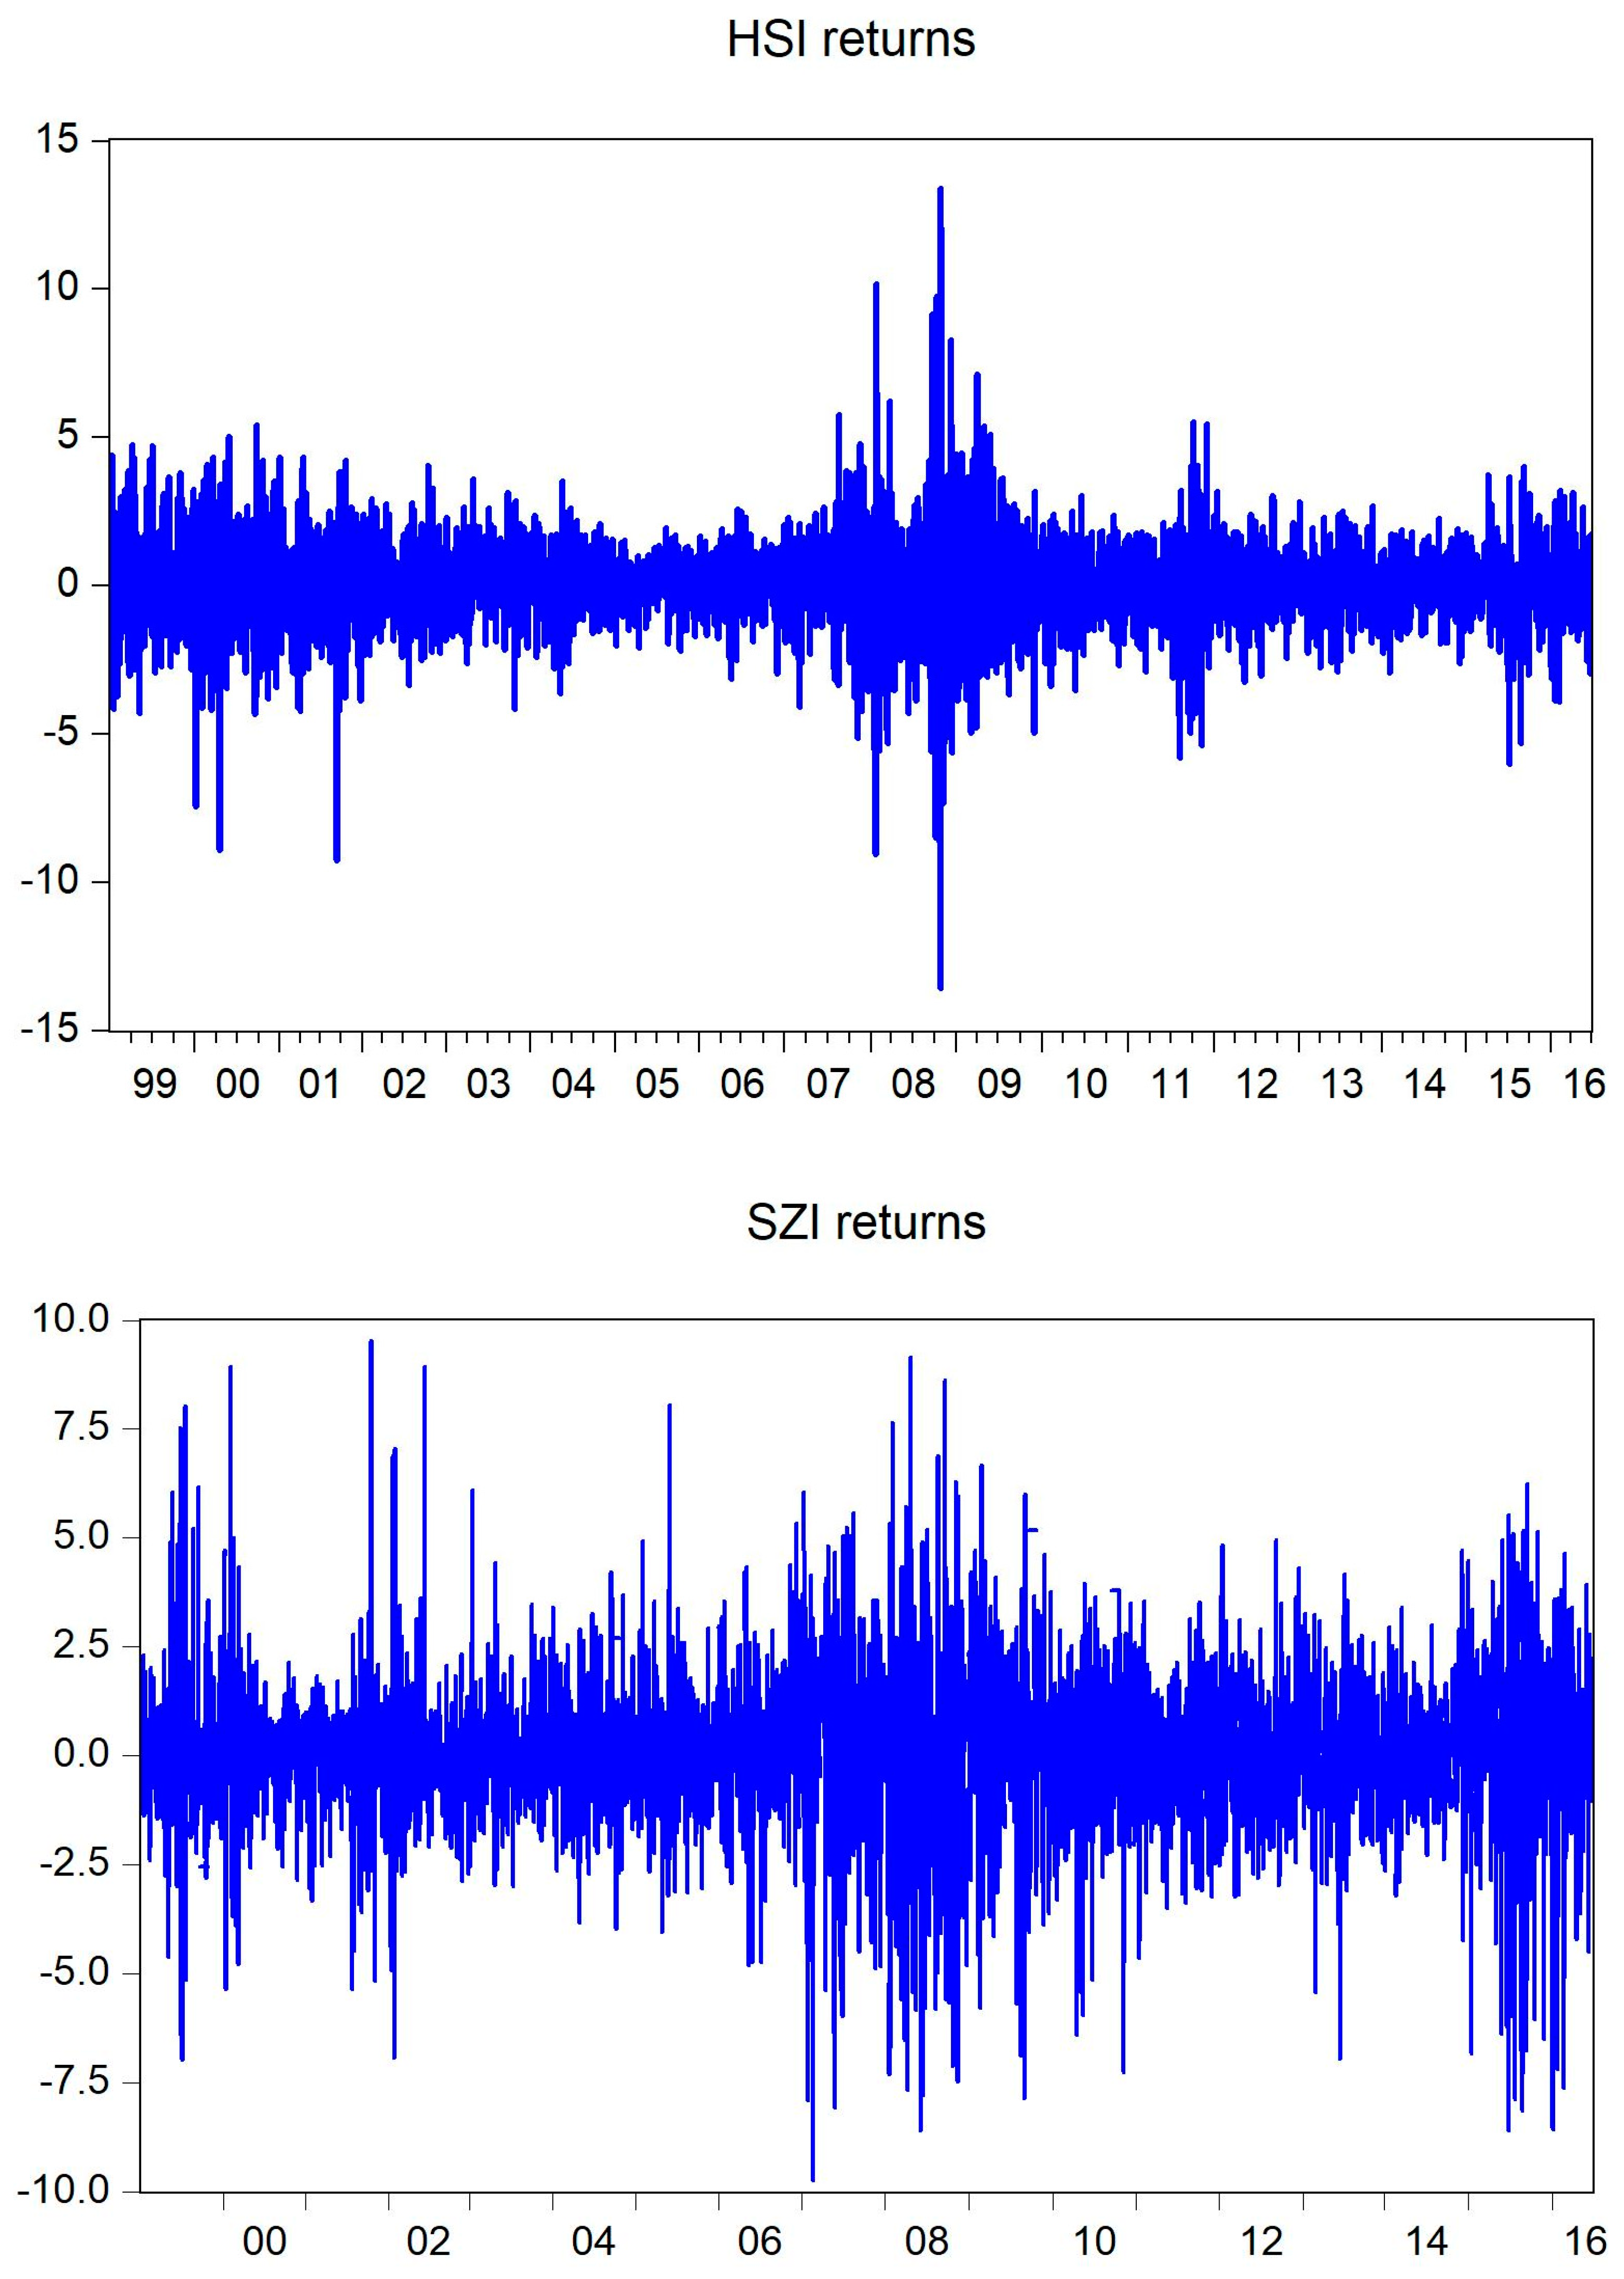
3.3. Descriptive Statistics of Stock Returns

This study uses two daily stock indices for the period from January 1999 to June 2016: The Hang Seng Index (HSI) of Hong Kong Exchange and the SZSE Component Index (SZI) of Shenzhen Exchange.4 A-shares on the Shenzhen Exchange were initially launched for domestic investors and B-shares for foreign investors. However, since 9 July 2003, A-shares are available to foreign investors on a limited basis. To examine the openness of the A-share market to foreign investors, the data were divided into two sub-samples using 9 July 2003, as a cut-off date.
Daily returns were calculated as r t = 100 × ln ( P t / P t 1 ) , where P t is the current index and P t 1 is the previous day’s index. Figure 1 and Figure 2 show dynamics of daily price and return series of HSI and SZI, respectively. Both return series show variability clustering. The dynamics of SZI are more volatile than HSI during that period and indicate that the Shenzhen Stock Exchange is less stable than the Hong Kong Stock Exchange.
Table 4 summarizes the descriptive statistics of stock returns. As shown in the table, the results of the Jarque-Bera test to check normality show that none of the sample returns is normally distributed.
Daily weather data were used from January 1999 to June 2016: Sunshine (SUNSH), temperature (TEMP), and humidity (HUMI).5 The data series were obtained from the Hong Kong Observatory.6 Sunshine is measured in terms of the number of hours of sunshine duration; temperature in terms of Celsius degrees; humidity in terms of relative humidity (the percentage of moisture contained in the air). Table 5 summarizes the descriptive statistics of the sample data used. As shown in this table, the weather conditions in Hong Kong and Shenzhen are very similar, because the two regions are in fact the same area. In this region, it is very hot, humid and rainy in summer, but relative mild and humid in winter.

4. Methodology

4.1. Weather Variables

To examine the effect of weather on stock returns, the three weather variables we used in this study were converted into dummy variables because they are subject to seasonal factors. For example, in Hong Kong and SHENZHEN, 15 °C in winter is considered to be relatively warm, but the same weather in summer is felt relatively cold. Thus, directly using raw weather data may result in seasonal bias in the measurement of the effect of weather on stock market returns. For this reason, following Yoon and Kang (2009), we recalculated weather variables using moving averages (MA) and moving standard deviations (MSD). Specifically, we used the following 11-day MA and MSD:7
M A t = 1 11 i = 5 5 x t + i
M S D t = 1 10 i = 5 5 { x t + i M A t } 2
where x t is the daily values of three weather variables—SUNSH, TEMP, and HUMI—at day t . Since extreme weather conditions are expected to be more likely to substantially augment the weather effects on stock returns than normal conditions, two dummy variables were generated as follows:
If   x t < ( M A t M S D t ) ,   then W L = 1 ;   otherwise ,   W L = 0 , If   x t > ( M A t M S D t ) ,   then   W H = 1 ;   otherwise ,   W H = 0 ,
where W L represents a dummy variable for extremely below-average weather and W H is a dummy variable for extremely above-average weather. The weather dummies used in the study are summarized in Table 6.

4.2. Model Framework

Using the weather dummy variables generated in the above section, we estimated the following model for analyzing the effect of weather on stock returns:
R t = μ + θ J a n + φ M o n + γ 1 t m L + γ 2 t m H + γ 3 h m L + γ 4 h m H + γ 5 s n L + γ 6 s n H + λ 1 t m L h m L + λ 2 t m L h m H + λ 3 t m L s n L + λ 4 t m L s n H + λ 5 t m H h m L + λ 6 t m H h m H + λ 7 t m H s n L + λ 8 t m H s n H + λ 9 h m L s n L + λ 10 h m L s n H + λ 11 h m H s n L + λ 12 h m H s n H + ε t .
In this equation, R t denotes the daily returns of the Hong Kong Stock Exchange and the Shenzhen Stock Exchange; J a n and M o n denote the dummies for January and Monday effects, respectively; γ i denotes the coefficients of weather dummies; and λ i denotes the interaction effect of the three weather dummies used. Additionally, we considered the nonlinear problem of time varying heteroskedasticity in the model using the following GARCH (1,1) model:8
h t = ω + α ε t 1 2 + β h t 1 ,   ε t = z t σ t ,   z t ~ N ( 0 , 1 ) ,
where ε t is normally distributed but heteroskedastic and h t denotes the conditional variance. All parameters ( ω ,   α , and β ) are expected to be positive, and the sum of ( α + β ) indicates the persistence of shocks to volatility.

5. Empirical Results

5.1. Effects of Weather on Hong Kong and Shenzhen Stock Returns

Table 7 shows the effects of extreme weather condition on the returns of the HSI and the SZI using 11-day MA-MSD method. As shown in the table, the estimated values of parameters ( ω , α and β ) in the GARCH model are positive and ( α + β ) < 1 . These results indicate that the non-negativity constraint and stationarity in the conditional variances are satisfied, respectively. Additionally, there is no seasonal effect such as January effect ( J a n ) on the HSI and SZI returns, indicating the absence of a market anomaly in these two markets.
As shown in Table 7, the significance of two weather variables ( s n L   and   s n H ) provide statistical evidence for the effect of weather on the HSI returns. This implies that sunshine duration is very important weather factor in Hong Kong investors. The dummy for extremely short sunshine duration ( s n L ) shows positive signs in Hong Kong stock markets. Usually, as the temperature and humidity are very high in Hong Kong, short sunshine duration can make investors feel pleasant and active. This evidence is coincided with the findings of Saunders (1993) and Hirshleifer and Shumway (2003), who interpret the positive association as a result that investors’ mood is optimistic on less cloudy days and consequently raises stock market returns. On the other hand, extremely long sunshine duration ( s n H ) shows negative impacts on stock returns, as expected.
In case of SZI returns, the significance of two other weather variables ( t m L   and   t m H h m H ) provide statistical evidence for the weather effect on the SZI returns. This means that in these two extreme weather conditions Shenzhen market shows positive returns with a statistical significance. Howarth and Hoffman (1984) argue that high humidity can increase aggression with discomfort and apathy with reduced attention and alertness. Extremely low temperature can also increase aggression. In a study related to anomaly in stock market returns, Cao and Wei (2005) maintain that, since aggression can result in more risk taking and apathy can impede risk taking, high humidity may involve higher or lower stock returns, depending on the trade-off between the two competing effects. In this context, our evidence could be interpreted as a result of aggression associated with an aggressively risk-taking behavior.
Table 8 shows the effects of extreme weather condition on the stock returns of the HSI and the SZI using 31-day MA-MSD method. As shown in this table, the estimated values of parameters in the GARCH model are positive and ( α + β ) < 1 . These results satisfy the non-negativity constraint and stationarity in the conditional variances in both markets. As well, there is no January effect ( J a n ) in both markets.
As shown in Table 8, there is no weather effects in Hong Kong stock market, as all the weather variables are not statistically significant. However, in Shenzhen stock market, weather effect is identified in t m H s n H weather condition.

5.2. Market Openness and Effects of Weather on the Shenzhen Stock Returns

We investigated whether the Shenzhen A stock market reduced the weather effects on stock returns based on whether they were open to foreign investors who were less affected by local weather than domestic investors. For this, we divided the SZI series into two sub-periods: the pre-QFII period (i.e., the period prior to the implementation of the QFII plan on 9 July 2003, during which the shares were traded only by domestic investors) and the post-QFII period (i.e., the period during which the shares were traded by both foreign and domestic investors).
The right part of Table 7 reports the test results for the effect of weather on the SZI returns over two sub-periods (pre-QFII and post-QFII periods) using 11-day MA-MSD method. In the pre-QFII period, two weather conditions have significant effects on the returns. For example, the estimated values of t m L weather condition is significant and positive, but that of t m L s n H is statistically significant and negative. These results show that the domestic investors are affected in their investment decision by extreme local weather conditions before the market openness to foreign investors.
In the post-QFII period, however, we cannot find any significant evidence for the effect of weather on the stock market. This changed evidence supports our hypothesis that the weather effect in the SZI market has been weakened, due to the market entry of foreign investors. This finding suggests that the investment market is more efficient, as the foreign investors are generally less sensitive to local weather conditions and have been largely increased in the Shenzhen market.
As shown in the right part of Table 8, the test results using 31-day MA-MSD method are similar to the results using 11-day MA-MSD method. The test results of Table 7 and Table 8 are summarized in Table 9. From this table, we can conclude that there is weather effect in Hong Kong and Shenzhen stock markets, and that the efficiency of the Shenzhen stock market has been considerably increased since the QFII plan as a result of the participation of foreign institutional investors.

6. Conclusions

The literature of anomaly suggests that weather conditions can affect people’s emotional state or mood and prevent them from making reasonable decisions. The impact of weather on the investor’s decision-making process can be reflected in the movement of stock returns.
In this regard, this study investigates the effects of meteorological conditions on the Hong Kong Stock Exchange and the Shenzhen Securities Exchange on the 11-day (and 31-day) MA-MSD method. We also explore the impact of the QFII plan on foreign investors to enable them to participate in the Shenzhen A-stock market and assess the weather effects on stock returns. Thus, this study explores the origin and nature of efficiency in Chinese stock markets and analyzes the change of the efficiency due to stock market openness policy from the perspective of behavioral finance.
Our empirical analysis, under the assumption that domestic investors would be more sensitive than foreign investors to the local weather conditions in Shenzhen, provides three key findings. First, there is a weak evidence for the effect of weather on the returns of the Hong Kong Exchange, but a relatively strong effect of weather on the returns of the Shenzhen Exchange. This result may indicate that the Shenzhen Exchange is less efficient than the Hong Kong Exchange. Second, there are some significant effects of weather on the returns of Shenzhen market during the pre-QFII period, but the effects have been considerably weakened during the post-QFII period. This finding suggests that the efficiency of the Shenzhen stock market has been largely improved after the QFII plan as a result of foreign institutional investors’ participation. The evidence is consistent with the finding of Kang et al. (2010) who show the effect of weather on the Shanghai B-share market after domestic investors are allowed to participate in that market. Third, although foreign investors are consisted of a small proportion of the total capitalization in the Chinese stock markets, the QFII reform has generally led to enhance the informational efficiency of the markets.
These findings suggest that the existence of a meteorological effect on stock returns raises questions about the efficiency of the Chinese stock market and that incorporating weather factors into the asset pricing model can be useful in analyzing the dynamics of the Chinese stock market.

Author Contributions

All authors contributed to the entire process of writing this paper. Z.J. and S.-M.Y. conceived the idea and designed the structure of the paper; Z.J. and S.H.K. collected and analyzed the data and provided the technical details; C.C. wrote the draft of Section 1 and Section 2, and S.H.K. wrote Section 3, while Z.J. and S.-M.Y. and S.H.K. wrote Section 4, Section 5 and Section 6; S.-M.Y. made a final revision of the entire paper.

Funding

This work was supported by the Ministry of Education of the Republic of Korea and the National Research Foundation of Korea (NRF-2017S1A5B8057488).

Conflicts of Interest

The authors declare no conflict of interest.

References

  1. Allen, Margaret A., and Gloria J. Fischer. 1978. Ambient temperature effects on paired associate learning. Ergonomics 21: 95–101. [Google Scholar] [CrossRef]
  2. Bagozzi, Richard P., Mahesh Gopinath, and Prashanth U. Nyer. 1999. The role of emotions in marketing. Journal of the Academy of Marketing Science 27: 184–206. [Google Scholar] [CrossRef]
  3. Bassi, Anna, Riccardo Colacito, and Paolo Fulghieri. 2013. O Sole Mio: An experimental analysis of weather and risk attitudes in financial decisions. Review of Financial Studies 26: 1824–52. [Google Scholar] [CrossRef]
  4. Bell, Paul A., and Robert A. Baron. 1976. Aggression and heat: The mediating role of negative affect. Journal of Applied Social Psychology 6: 18–30. [Google Scholar] [CrossRef]
  5. Bollerslev, Tim. 1986. Generalized autoregressive conditional heteroskedasticity. Journal of Econometrics 31: 307–27. [Google Scholar] [CrossRef] [Green Version]
  6. Cao, Guangxi, and Yan Han. 2015. Does the weather affect the Chinese stock markets? Evidence from the analysis of DCCA cross-correlation coefficient. International Journal of Modern Physics B 29: 1450236. [Google Scholar] [CrossRef]
  7. Cao, Melanie, and Jason Wei. 2005. Stock market returns: A note on temperature anomaly. Journal of Banking & Finance 29: 1559–73. [Google Scholar]
  8. Chang, Tsangyao, Chien-Chung Nieh, Ming Jing Yang, and Tse-Yu Yang. 2006. Are stock market returns related to the weather effects? Empirical evidence from Taiwan. Physica A 364: 343–54. [Google Scholar] [CrossRef]
  9. Cunningham, Michael R. 1979. Weather, mood, and helping behavior: Quasi-experiments with the sunshine Samaritan. Journal of Personality and Social Psychology 37: 1947–56. [Google Scholar] [CrossRef]
  10. Dong, Ming, and Andreanne Tremblay. 2018. Does the Weather Influence Global Stock Returns? Available online: https://ssrn.com/abstract=2444035 (accessed on 6 December 2019).
  11. Dowling, Michael, and Brian M. Lucey. 2005. Weather, biorhythms, beliefs and stock returns-some preliminary Irish evidence. International Review of Financial Analysis 14: 337–55. [Google Scholar] [CrossRef]
  12. Dowling, Michael, and Brian M. Lucey. 2008. Robust global mood influences in equity pricing. Journal of Multinational Financial Management 18: 145–64. [Google Scholar] [CrossRef]
  13. Engle, Robert F. 1982. Autoregressive conditional heteroscedasticity with estimates of the variance of United Kingdom inflation. Econometrica 50: 987–1007. [Google Scholar] [CrossRef]
  14. Garrett, Ian, Mark J. Kamstra, and Lisa A. Kramer. 2005. Winter blues and time variation in the price of risk. Journal of Empirical Finance 12: 291–316. [Google Scholar] [CrossRef] [Green Version]
  15. Glosten, Lawrence R., Ravi Jagannathan, and David E. Runkle. 1993. On the relation between the expected value and the volatility of the nominal excess return on stocks. Journal of Finance 48: 1779–801. [Google Scholar] [CrossRef]
  16. Han, Ze-Xian. 2005. Study on weather effect of China’s stock index returns. Journal of Beijing University of Aeronautics and Astronautics (Social Science Edition) 18: 10–14. [Google Scholar]
  17. Han, Ze-Xian. 2006. A study on sunshine effect of Chinese stock index returns. Journal of Harbin Institute of Technology 38: 260–3. [Google Scholar]
  18. Han, Ze-Xian, and Yue-sen Wang. 2005. A study for SAD effect on Chinese market indices return. Journal of Huazhong University of Science and Technology (Social Science Edition) 19: 88–92. [Google Scholar]
  19. Hirshleifer, David, and Tyler Shumway. 2003. Good day sunshine: Stock returns and the weather. Journal of Finance 58: 1009–32. [Google Scholar] [CrossRef]
  20. Howarth, Edgar, and Michael S. Hoffman. 1984. A multidimensional approach to the relationship between mood and weather. British Journal of Psychology 75: 15–23. [Google Scholar] [CrossRef]
  21. Kamstra, Mark J., Lisa A. Kramer, and Maurice D. Levi. 2000. Losing sleep at the market: The daylight saving anomaly. American Economic Review 90: 1005–11. [Google Scholar] [CrossRef] [Green Version]
  22. Kamstra, Mark J., Lisa A. Kramer, and Maurice D. Levi. 2003. Winter blues: A SAD stock market cycle. American Economic Review 93: 324–43. [Google Scholar] [CrossRef] [Green Version]
  23. Kang, Sang Hoon, Zhuhua Jiang, Yeonjeong Lee, and Seong-Min Yoon. 2010. Weather effects on the returns and volatility of the Shanghai Stock Market. Physica A 389: 91–99. [Google Scholar] [CrossRef]
  24. Kaplanski, Guy, Haim Levy, Chris Veld, and Yulia Veld-Merkoulova. 2015. Do happy people make optimistic investors? Journal of Financial and Quantitative Analysis 50: 145–68. [Google Scholar] [CrossRef] [Green Version]
  25. Kaustia, Markku, and Elias Rantapuska. 2016. Does mood affect trading behavior? Journal of Financial Markets 29: 1–26. [Google Scholar] [CrossRef]
  26. Keef, Stephen P., and Melvin L. Roush. 2002. The weather and stock returns in New Zealand. Quarterly Journal of Business & Economics 41: 61–79. [Google Scholar]
  27. Keef, Stephen P., and Melvin L. Roush. 2005. Influence of weather on New Zealand financial securities. Accounting & Finance 45: 415–37. [Google Scholar]
  28. Keef, Stephen P., and Melvin L. Roush. 2007. Daily weather effects on the returns of Australian stock indices. Applied Financial Economics 17: 173–84. [Google Scholar] [CrossRef]
  29. Nelson, Daniel B. 1991. Conditional heteroskedasticity in asset returns: A new approach. Econometrica 59: 347–70. [Google Scholar] [CrossRef]
  30. Nofsinger, John R. 2002. Do optimists make the best investors? Corporate Finance Review 6: 11–17. [Google Scholar]
  31. Novy-Marx, Robert. 2014. Predicting anomaly performance with politics, the weather, global warming, sunspots, and the stars. Journal of Financial Economics 112: 137–46. [Google Scholar] [CrossRef]
  32. Pizzutilo, Fabio, and Valeria Roncone. 2017. Red sky at night or in the morning, to the equity market neither a delight nor a warning: The weather effect re-examined using intraday stock data. European Journal of Finance 23: 1280–310. [Google Scholar] [CrossRef]
  33. Rind, Bruce. 1996. Effect of beliefs about weather conditions on tipping. Journal of Applied Social Psychology 26: 137–47. [Google Scholar] [CrossRef]
  34. Saunders, Edward M., Jr. 1993. Stock prices and the Wall Street weather. American Economic Review 83: 1337–45. [Google Scholar]
  35. Schmittmann, Jochen M., Jenny Pirschel, Steffen Meyer, and Andreas Hackethal. 2015. The impact of weather on German retail investors. Review of Finance 19: 1143–83. [Google Scholar] [CrossRef]
  36. Shenzhen Stock Exchange Fact Book. 2016. Available online: http://english.sse.com.cn/indices/publications/factbook/ (accessed on 6 December 2019).
  37. Shim, Hyein, Maria H. Kim, and Doojin Ryu. 2017. Effects of intraday weather changes on asset returns and volatilities. Zbornik Radova Ekonomskog Fakulteta u Rijeci (Proceedings of Rijeka School of Economics) 35: 301–30. [Google Scholar] [CrossRef]
  38. Wright, William F., and Gordon H. Bower. 1992. Mood effects on subjective probability assessment. Organizational Behavior and Human Decision Processes 52: 276–91. [Google Scholar] [CrossRef]
  39. Yi, C., and J. Wang. 2005. Weather, seasonal mood disorder and stock returns. Statistics and Decision-Making 6: 79–82. [Google Scholar]
  40. Yoon, Seong-Min, and Sang Hoon Kang. 2009. Weather effects on returns: Evidence from the Korean stock market. Physica A 388: 682–90. [Google Scholar] [CrossRef]
1
2
Since July 2003, foreign investors have started to trade A-shares on a limited basis as a part of the Qualified Foreign Institutional Investor (QFII) plan.
3
The Growth Enterprise Market (GEM) caters to companies which cannot satisfy some profit track records necessary to be listed on the Main Board of the Stock Exchange.
4
All of the data were obtained from the RESSET Financial Research Database.
5
We also analyzed using cloud cover instead of sunshine duration and found similar results. As the two variables are very highly correlated each other, both variables should not be included in the regression equation due to multicollinearity problem.
6
7
The 31-day MA and MSD method can be similarly formalized to the case of 31-day. See Yoon and Kang (2009) for the case of 21-day.
8
The GARCH (generalized autoregressive conditional heteroscedasticity) model proposed by Bollerslev (1986) is a generalization of ARCH model of Engle (1982) to consider a volatility clustering. The standard GARCH model has been extended to the GJR-GARCH model (Glosten et al. 1993) and EGARCH model (Nelson 1991) to capture an asymmetry of volatility and FIGARCH model to capture a long memory feature of volatility. In the empirical study, we apply the standard and popular GARCH model to focus on the conditional mean equation of Equation (4).
Figure 1. Dynamics of daily price: HSI and SZI prices.
Ijfs 07 00070 g001
Figure 2. Dynamics of daily returns: HSI and SZI returns.
Ijfs 07 00070 g002
Table 1. Overview of the statistics for Hong Kong and Shenzhen Exchanges (December 2016).
Hong Kong ExchangeShenzhen Stock Exchange
Main BoardGEMA-ShareB-Share
No. of listed companies1713260185949
No. of listed H-shares21823n.a.n.a.
No. of listed red-chips stocks1476n.a.n.a.
No. of listed securities8330261n.a.n.a.
Market capitalization (Billion)HK$24,450HK$311RMB 22,222RMB 86
Average P/E ratio (Times)10.5371.3141.6211.15
Turnover volume (average daily) (Million shares)129,733141913,08517
Turnover value (average daily) (Million)HK$54,775HK$582RMB 193,984RMB 131
Source: Website of Hong Kong Exchange (http://www.hkex.com.hk), and Shenzhen Stock Exchange (http://www.szse.cn/main/en).
Table 2. Composition of investors in the Hong Kong market (Year-end, %).
YearLocal Individual InvestorsLocal Institutional InvestorsForeign Institutional InvestorsForeign Individual InvestorsThe Exchange
200628253944
200925243848
2012172142415
2015191931822
Source: HKEX Fact Book (http://www.hkex.com.hk).
Table 3. Composition of investors in the Shenzhen market (Year-end, 10,000).
YearNo. of PersonalInvestorsNo. of Company InvestorsTotal
20098542.6028.158570.75
201210,537.8235.4810,573.30
201620,841.0056.1220,897.13
Table 4. Descriptive statistics of sample returns.
VariablesObs.MeanMax.Min.Std. Dev.Skew.Kurt.Jarque-Bera
HSI43500.0213.41−13.581.54−0.0610.199378.8 ***
SZI42280.039.53−9.751.86−0.256.191841.2 ***
Notes: The Std. Dev., Skew., and Kurt. denote the standard deviation, skewness, and kurtosis of sample returns, respectively. The Jarque-Bera test statistics are to check the normality of sample returns. *** indicates the rejection of the null hypothesis of normality at the 1% significance level.
Table 5. Descriptive statistics of weather variables for Hong Kong and Shenzhen.
VariablesObs.MeanMax.Min.Std. Dev.Skew.Kurt.Jarque-Bera
Panel A: Hong Kong
TEMP435023.531.87.45.12−0.532.27304.3 ***
HUMI435078.299.027.010.29−0.994.891350.8 ***
SUNSH43505.012.40.03.890.041.52398.7 ***
Panel B: Shenzhen
TEMP422823.631.87.45.09−0.522.25291.8 ***
HUMI422878.399.027.010.28−1.004.951380.1 ***
SUNSH42285.112.40.03.890.031.52387.4 ***
Note: See the note of Table 4.
Table 6. Description of extreme weather condition dummies.
Weather DummiesDescription
t m L Extremely low temperature
t m H Extremely high temperature
h m L Extremely low humidity
h m H Extremely high humidity
s n L Extremely short sunshine duration
s n H Extremely long sunshine duration
Table 7. Effects of weather conditions on returns using 11-day MA-MSD method.
HSI SZI
Whole PeriodPre-QFII PeriodPost-QFII Period
Coeff.t-ValueCoeff.t-ValueCoeff.t-ValueCoeff.t-Value
μ 0.04991.830.17012.130.19631.940.17481.34
  J a n −0.0265−0.440.01580.200.22942.19−0.2384−1.84
  M o n 0.01560.38−0.0024−2.31−0.0029−2.14−0.0024−1.42
t m L 0.02740.350.19041.880.31612.460.04790.30
t m H −0.0610−0.86−0.0652−0.750.09400.82−0.1925−1.41
h m L −0.0670−0.89−0.1067−1.12−0.1045−0.79−0.0907−0.62
h m H 0.06700.810.08750.880.00730.060.20021.27
s n L 0.11001.880.09520.900.02670.210.16170.84
s n H −0.1802−1.98−0.0035−0.040.02360.17−0.0722−0.58
t m L * h m L −0.0259−0.160.10250.56−0.1060−0.450.30271.03
t m L * h m H −0.1837−1.28−0.2119−1.18−0.1502−0.68−0.3050−1.04
t m L * s n L −0.1304−0.52−0.2328−1.44−0.3022−1.60−0.1277−0.45
h m L * s n H 0.20641.39−0.3651−1.37−0.5177−1.420.06590.14
t m H * h m L 0.15881.160.26011.390.24611.060.17500.57
t m H * h m H −0.2212−1.270.37311.680.36001.170.28120.82
t m H * s n L −0.1362−1.00−0.3089−0.87−0.3930−0.78−0.3076−0.61
t m H * s n H 0.05660.21−0.1740−0.97−0.5476−2.300.28541.04
h m L * s n L −0.0589−0.50−0.3764−1.31−0.3622−1.19−0.0322−0.04
h m L * s n H 0.37641.17−0.0593−0.40−0.1708−0.780.07580.34
h m H * s n L 0.44960.940.13390.840.12220.590.16560.63
h m H * s n H 0.12300.92−0.5671−1.26−0.1634−0.27−1.1766−1.41
ω 0.01525.070.03976.230.07224.950.02663.47
α 0.062712.680.077914.530.115910.880.05049.54
β 0.9307164.290.9125173.80.857469.130.9438173.9
log L −7285.2039−8123.7431−3275.7723−4815.9844
A I C 14,618.407716,295.48626599.54469679.9687
Notes: The bold indicates the rejection of the null hypothesis of no weather effect at the 10% significance level. log L denotes the calculated value of logarithmic likelihood in the maximum likelihood estimation. A I C denotes the calculated value of the Akaike information criterion.
Table 8. Effects of weather conditions on returns using 31-day MA-MSD method.
HSI SZI
Whole PeriodPre−QFII PeriodPost−QFII Period
Coeff.t-ValueCoeff.t-ValueCoeff.t-ValueCoeff.t-Value
μ 0.15182.280.11141.210.09140.770.15711.04
J a n −0.0421−0.690.00860.110.21212.00−0.2426−1.86
M o n −0.0016−1.75−0.0014−1.16−0.0012−0.79−0.0017−0.88
t m L 0.07110.840.04970.510.32862.36−0.2075−1.33
t m H −0.0606−0.87−0.1004−1.19−0.1467−1.28−0.0310−0.24
h m L −0.0273−0.340.05710.560.17101.35−0.0760−0.46
h m H 0.07480.880.05310.46−0.1020−0.750.22051.11
s n L −0.0725−0.97−0.0045−0.05−0.0406−0.33−0.0366−0.25
s n H 0.04600.740.00730.09−0.0630−0.520.03730.30
t m L * h m L −0.0089−0.060.06280.33−0.5710−2.350.82062.66
t m L * h m H −0.1001−0.74−0.2393−1.37−0.1956−0.91−0.3042−1.06
t m L * s n L 0.05510.430.05430.33−0.1816−0.860.27741.04
h m L * s n H −0.0351−0.16−0.1315−0.610.06770.22−0.2426−0.72
t m H * h m L −0.0824−0.59−0.2522−1.55−0.3138−1.54−0.3357−1.24
t m H * h m H 0.06760.360.22640.790.27490.810.37650.60
t m H * s n L −0.0159−0.06−0.1791−0.590.02090.05−0.3067−0.60
t m H * s n H 0.10960.850.34032.320.53662.880.16590.66
h m L * s n L 0.04970.21−0.3724−0.930.18670.32−0.5358−0.88
h m L * s n H −0.0976−0.84−0.1349−1.00−0.1336−0.76−0.0873−0.39
h m H * s n L 0.06230.510.06730.430.10270.540.09700.38
h m H * s n H −0.2786−0.390.01190.010.38700.02−0.3814−0.30
ω 0.01524.950.04076.430.08035.120.02593.53
α 0.061612.740.076314.540.114010.470.04879.73
β 0.9318166.60.9136177.10.855264.670.9456186.4
log L −7287.6306−8129.1059−3282.2657−4813.8673
A I C 14623.261216306.21176612.53139675.7345
Note: See the note of Table 7.
Table 9. Number of significant weather dummy variable.
HSI SZI
WholePre-QFII PeriodPost-QFII Period
11-day MA-MSD2220
31-day MA-MSD0131
Note: Numbers in this table indicate the significance of weather dummy variable at least 10% level.

