Investor Sentiment and Herding Behavior in the Korean Stock Market


1
Institute of Economics and International Trade, Pusan National University, Busan 46241, Korea
2
Department of Economics, Pusan National University, Busan 46241, Korea
*
Author to whom correspondence should be addressed.
Int. J. Financial Stud. 2020, 8(2), 34; https://0-doi-org.brum.beds.ac.uk/10.3390/ijfs8020034
Submission received: 5 April 2020
/
Revised: 22 May 2020
/
Accepted: 26 May 2020
/
Published: 1 June 2020
(This article belongs to the Special Issue Advances in Behavioural Finance and Economics)
Abstract
:This paper investigates herding behavior and the connection between herding behavior and investor sentiment. We apply a Cross-Sectional Absolute Deviation (CSAD) approach and the quantile regression method to capture herding behavior in the KOSPI and KOSDAQ stock markets. The analysis results are outlined as follows. First, we find that herding behavior is exhibited during down-market periods in the KOSPI and KOSDAQ stock markets. However, we show that adverse herding behavior occurs in low-trading volume and low-volatility periods. Second, according to the results of the quantile regression, herding behavior is found in the low and high quantiles of the KOSPI and KOSDAQ stock markets. However, adverse herding behavior is also found, which means that investors herd in extreme market conditions. Third, the relationship between investor sentiment and herding behavior is analyzed through regression and quantile regression, and investor sentiment is confirmed to be one of the important factors that can cause herding behavior in the Korean stock market.
JEL Classification:
G12; G14; G411. Introduction
Understanding the decision-making process of market participants in the stock market and how investor behavior patterns affect stock prices is important for both business and academia. Market participants’ investment behavior is linked to many factors, such as trading strategies, market volatility, other market participants’ behavior, corporate value changes, and economic fluctuations. It is also known that there are various cognitive biases and flaws, such as human error, in the trading process in financial markets. Sometimes investors fail to act on their own information or ignore their beliefs. Investors follow market sentiment or rely heavily on other investment actions and act to sell or buy. This is called “herding behavior,” which means that people are imitating each other. This phenomenon was also seen during the 2000–2002 IT bubble and the 2007–2008 global financial crisis.
Bikhchandani and Sharma (2001) observed that herding behavior can be either rational or irrational investor behavior. Rational behavior occurs when an investor utilizes information about other people’s behavior. That is, rational herding behavior theory asserts that information cascades (Banerjee 1992; Bikhchandani et al. 1992), compensation structures (Scharfstein and Stein 1990; Roll 1992; Admati and Pfleiderer 1997), and reputation maintenance actions lead to herding behavior (Prendergast and Stole 1996; Trueman 1994).
On the other hand, the theory of irrational herding behavior asserts that some irrational market participants’ investment behavior may result in herding behavior. That is, it is argued that investors sometimes make investment decisions in a way that simply follows the flow of the market without assessing the fundamental value of financial instruments (De Long et al. 1990; Froot et al. 1992).
Some theoretical studies of irrational herding behavior suggest that it is intentional behavior caused by investor sentiment. This explains that investors remember from experience that rising prices will continue to rise, and this memory will prompt them to buy stocks when stocks rise, which will continue to drive stock prices up. This type of herding behavior is driven by psychological factors, such as investor confidence that stock prices will rise, wishful thinking, consideration of other’s judgments, and pressure to conform (Bikhchandani and Sharma 2001).
In investigations of whether herding behavior exists in financial markets, many scholars have reported empirical results (Christie and Huang 1995; Chang et al. 2000; Economou et al. 2015; Hwang and Salmon 2004; Galariotis et al. 2015). Although studies have applied various methods, they do not provide identical empirical results or consensus regarding the presence or absence of herding behavior. There are also several empirical studies that have reported on the relationship between herding behavior and investor sentiment (Lakonishok et al. 1992; Liao et al. 2011; Vieira and Pereira 2015; Economou et al. 2018). Hwang and Salmon (2009) showed that when investor sentiment is positive (optimistic), individual asset returns are expected to rise, regardless of systematic risk. They also found an increase in herding behavior. Lakonishok et al. (1992) and Liao et al. (2011) also concluded that investor sentiment is a major factor in herding behavior.
Thus, there is some relationship between investor sentiment and herd behavior. This study analyzes whether there is herding behavior in the Korean stock market (KOSPI and KOSDAQ) and whether investor sentiment can be a major factor in the occurrence of herding behavior.
This paper analyzes the Korean stock market, including KOSPI and KOSDAQ, and new evidence into developing stock markets. We find evidence of herding behavior during down-market periods. Additionally, our results suggest that herding behavior in the Korean stock market is influenced by investor sentiment. This study contributes to the existing literature by conducting a thorough analysis of herding in the Korean stock markets under different market conditions, and also introducing the investor sentiment into the herding behavior model. Our results provide useful information for investors and regulators, especially during down-market and high-trading volume periods, and can be helpful in hedging.
2. Literature Review
There are more empirical studies than theoretical studies of herding behavior, which is because it is difficult to measure the extent of herding behavior in the real market. Therefore, many measurement methods have been used in empirical studies, such as the Lakonishock, Shleifer, and Vishny (LSV) model, Portfolio Change Measure (PCM), Cross-Sectional Standard Deviation (CSSD), and Cross-Sectional Absolute Deviation (CSAD) (Lakonishok et al. 1992; Grinblatt et al. 1995; Christie and Huang 1995; Chang et al. 2000). Until recently, however, the most popular approach has been the CSAD, since other measurement methods require investor’s holding information and use low-frequency data.
In their major empirical studies, Christie and Huang (1995) used the CSSD to analyze herding behavior among investors during market stress in the US stock market. Their results showed that there was no herding behavior in a period of high price volatility. Chang et al. (2000) used the CSAD instead of the CSSD. They found that there was no herding behavior in the US, Hong Kong, or Japan, but that there was herding behavior in Korea and Taiwan. Tan et al. (2008) and Chiang et al. (2010) found that there was herding behavior in the Shanghai and Shenzhen A stock markets. Yao et al. (2014) reported that there was a stronger presence of herding behavior in the Chinese B stock market than in the Chinese A stock market. Lao and Singh (2011) found that herding behavior exists in the Chinese stock market. When the market is a down-market and trading volumes are high, herding behavior is stronger. Chiang and Zheng (2010) analyzed whether there were acts of violence in 18 countries and found that there were in 13, including Australia, France, Germany, Hong Kong, and Japan, excluding the US and Latin American markets. Lam and Qiao (2015) confirmed that there was herding behavior in Hong Kong’s stock market and in periods of a bull market, high-trading volume, and high and low volatility. Galariotis et al. (2015) analyzed US and UK stock markets for herding behavior. They reported that the UK exhibited herding behavior during the dot-com bubble and that the US exhibited herding behavior during the financial crisis.
Analyzing the markets of Belgium, France, the Netherlands, and Portugal, Economou et al. (2015) found that before the Euronext merger, there was herding behavior only in the Portuguese market but that all four countries exhibited herding behavior after the merger. Gavriilidis et al. (2016) reported that during Ramadan, there was herding behavior in Muslim stock markets (Bangladesh, Egypt, Indonesia, Malaysia, Morocco, Pakistan, and Turkey). However, Yousaf et al. (2018) asserted that there was no herding behavior in the Pakistani stock market during Ramadan. Pochea et al. (2017) reported that there has been herding behavior in seven countries, including Bulgaria, Croatia, the Czech Republic, and Hungary.
However, several recent empirical studies found evidence of reverse herding behavior (Clements et al. 2017; Gębka and Wohar 2013). Reverse herding means that market participants act on their own information rather than market movement, which leads to a high level of CSAD. Gębka and Wohar (2013) explained that reverse herding increases return dispersion above the level of national price. This implies that investors readjust their portfolios to secure riskless assets amidst high fear and uncertainty.
Studies have also analyzed the relationship between herding behavior and investor sentiment. Liao et al. (2011) found that investor sentiment plays an important role in explaining fund investors’ herding behavior. Blasco et al. (2012) analyzed whether investor behavior can be explained by emotional factors. They analyzed the Spanish stock market using the Granger causal test, and found that herding behavior was explained by past returns and investor sentiment and reported that investor sentiment is an important factor explaining herding behavior. Lakonishok et al. (1992), Liao et al. (2011), Vieira and Pereira (2015), and Economou et al. (2018) also concluded that market sentiment is a major factor in herding behavior.
This study differs as follows from the previous studies discussed above. First, Chang et al. (2000), Chiang and Zheng (2010), and Laih and Liau (2013) analyzed the KOSPI market, but there is a lack of empirical research that only analyzes the Korean stock markets (KOSPI and KOSDAQ). Therefore, this study analyzes whether there is herding behavior in the KOSPI and KOSDAQ markets. Second, this study analyzes whether herding behavior exists in various market situations (changes in volume and volatility). Third, this study analyzes the relationship between herding behavior and investor sentiment. Theoretically, many studies have argued that investor sentiment is an important factor that can lead to herding behavior, but few empirical studies have actually proven this assertion. Therefore, this study is important in that it is the first to analyze the relationship between herding behavior and investor sentiment on the Korean stock market.
3. Data and Methodology
3.1. Data
This study analyzes the KOSPI and KOSDAQ stock markets to confirm the existence of herding behavior in the Korean stock market. The KOSPI market is a benchmark stock market of Korea and is a market where mainly blue-chip companies with listing requirements are traded. The KOSDAQ market is for the purpose of providing funds for startup companies as well as small to mid-size enterprise (SME) in such tech-savvy areas as IT (information technology), BT (bio technology), and CT (culture technology), and is a market where stocks of startup companies and SMEs are traded. Additionally, we analyze the relationship between herding behavior and investor sentiment. We use daily data for KOSPI and KOSDAQ constituent securities from between January 2003 and December 2018. This corresponds to 3958 daily closing prices. These data were obtained from Informax.
Many previous studies have used various investor sentiment proxies to measure investor sentiment. In the study, Korean investor sentiment is proxied through the VKOSPI. VKOSPI is Korea’s representative implied volatility index based on the KOSPI200 option. This volatility index is generally known as a fear index and is used as a proxy for investor’s sentiment (Smales 2017; Economou et al. 2018). When the volatility index is lower, the investor is the more optimistic, while when the volatility index is higher, the investor is the more pessimistic.
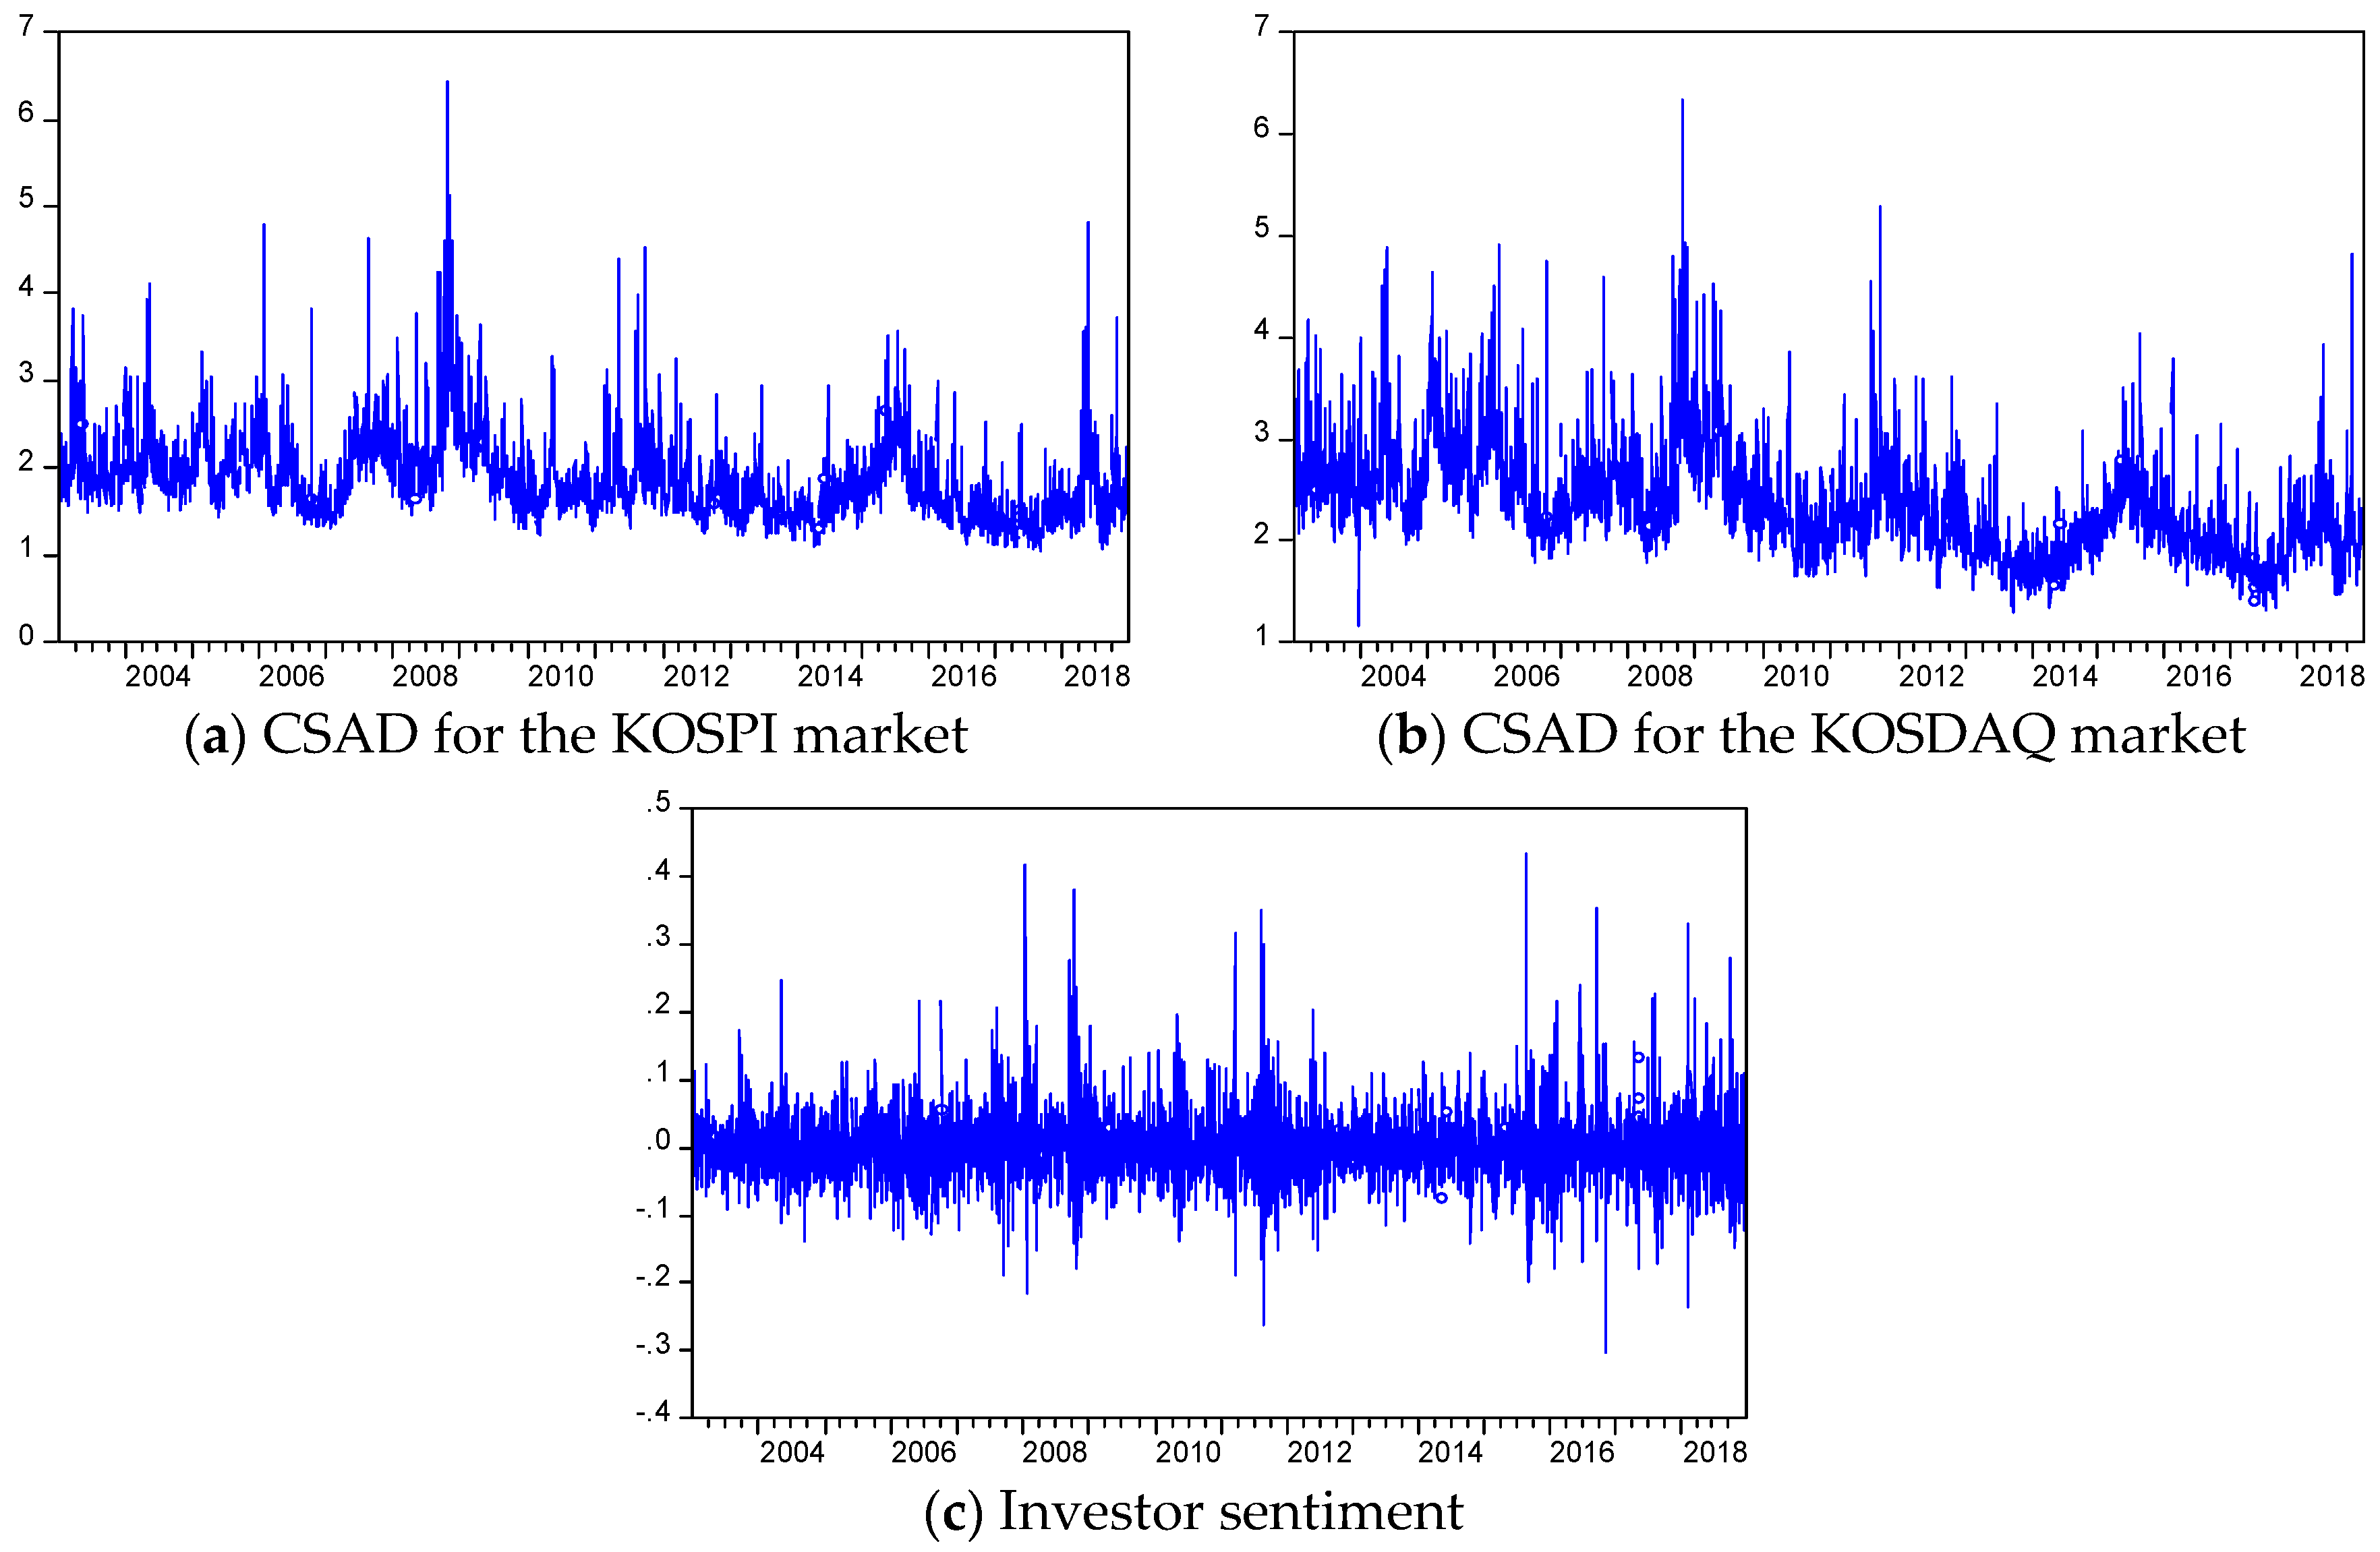
Table 1 presents the descriptive statistics and unit root test for each market’s CSAD and investor sentiment (Sent). Looking at the CSAD, the average value in the KOSPI market is found to be lower than in the KOSDAQ market. However, the CSAD standard deviation in the KOSDAQ market is larger than in the KOSPI market, which means that the KOSDAQ market is more volatile than the KOSPI market. To test the stability of the time series, the Augmented Dickey–Fuller (ADF) test and the Philips–Perron (PP) unit root test were used. Panel B presents the unit root test results for each market’s CSAD and Sent. The results show that each market’s CSAD and Sent are identified as stationary time series. Figure 1 shows the time series for the two markets’ CSAD and Sent. The markets’ CSADs were relatively high during the financial crisis.
3.2. Methodology
3.2.1. Herding Behavior
In this study, the cross-sectional absolute deviation (CSAD) proposed by Chang et al. (2000) is used to measure herding behavior. This model assumes that if herding behavior exists, individual stock returns will converge to the market returns. Thus, herding causes a small difference in individual returns versus market returns. CSAD is the average value reached by taking an absolute value for the difference between individual stock returns and market returns, which can be obtained as follows:
where is the total number of securities on a day, is the return of the company at time , and is the average market return of a cross section (all the company at time ). We adopt the model proposed by Chang et al. (2000) to test herding behavior. Chang et al. (2000) argued that market returns and the CSAD should have a positive linear relationship in the capital asset pricing model (CAPM), but that these linear relationships are no longer maintained when herd behavior occurs. The CSAD can identify the presence of herding behavior for the entire period, including high-market volatility and stable periods, but it has a nonlinear relationship due to herding behavior during periods in which market conditions are extreme.
where is a measure of cross-sectional return dispersion. is the average market return of a cross section of all firms’ stocks at time , and is the absolute term. is a nonlinear term that captures investors’ herding behavior. If is negative and significant, this suggests that herding behavior exists in the stock market. However, if is positive and significant, reverse herding behavior exists in the stock market. This means that investors ignore the information that has been delivered in line with market sentiment and price movement. Gębka and Wohar (2013) explained that investors tend to partially trade in extreme or abnormal ways. This behavior implies specific stock price increases, and hence an increase of the CSAD above the rational level.
However, Equation (2) has the same value for the up- and down-market periods. This has the limitation that it cannot reflect the effect of the market state. Investor behavior can differ in up- and down-market periods. Therefore, to test whether investors’ behavior differs in different market periods, we investigate the following Equation (3):
where is a dummy variable to represent the market state (if the market return is negative, it has a , otherwise it has a ). In Equation (3), if has a significant negative value, it means that herding behavior occurs when the market goes down (when the market goes up). Additionally, investors can differ in their response to changes in trading volume and volatility. Lam and Qiao (2015) and Gavriilidis et al. (2016) explained that changes in trading volume and volatility can cause irrational behavior. When investors create a gap between the stock’s fundamental value and its price in the market, there is tremendous trading volume and fluctuation in the stock market. Thus, herding behavior will be associated with changes in trading volume and volatility. The effect of trading volume on herding behavior has been studied by Economou et al. (2015), Lam and Qiao (2015), and Gavriilidis et al. (2016). In other words, high-trading volume is a sign that information-providing investors have entered the market. Based on this explanation, to explain the effect of trading volume and volatility on herding behavior, we divide trading and volume into low and high periods. These are low (high) if they are less (greater) at time than the previous 30-day moving average. Hence, the dummy variable when periods are classified as low in trading volume and volatility. We analyze the effect of changes in trading volume and volatility on herding behavior using the following equation:
where the superscripts and denote that models are estimated for days of low-trading volume and volatility.
3.2.2. Quantile Regression of Herding Behavior
We find it necessary to identify whether the independent variable effect differs at the various quantile intervals for different markets, trading volumes, and volatility conditions. For this purpose, we use quantile regression, which can analyze various conditional distributions of dependent variables.
If the distribution of dependent variables is not normal and there are outliers, then the Ordinary Least Squares method (OLS) fails to consider information about outliers. OLS focuses on mean values, making them less efficient for regression of outliers (Koenker and Bassett 1978; Barnes and Hughes 2002). In this case, the quantile estimates may be more efficient than the OLS estimates (Buchinsky 1998). Extreme outliers are frequently found in financial time series, which can have a significant impact on OLS estimates and consequently distort the estimated results. Thus, quantile regression can yield more robust and efficient estimates. In this study, the following quantile regression model is used:
where τ is quantiles. To confirm the analysis results in various quantiles, this study estimates quantiles with 20% intervals ranging from 10% to 90%.
3.2.3. Herding Behavior and Investor Sentiment
We analyze how investor sentiment affects herding behavior by estimating the following regression equation:
where is an investor sentiment variable in the KOSPI and KOSDAQ markets and VKOSPI is used as a proxy variable. The estimated may have a positive value and a negative value. A negative value means that when investor sentiment rises, investors are likely to follow-the decisions of other investors. This means that if investors change from a pessimistic view of the future, they exhibit herding behavior. On the other hand, when investor sentiment is low, investors do not feel the need to imitate other investors’ decisions. If is positive, the opposite occurs. This means that reverse herding behavior exists in the stock market. In addition, we analyze the influence of investor sentiment on various quantiles using the quantile regression used in the above analysis.
4. Empirical Results
4.1. Empirical Results Regarding Herding Behaviour
Table 2 shows the empirical results from Equation (2) on herding behavior in the Korean stock market. In the KOSPI and KOSDAQ markets, is negative but not significant. This indicates that there is no evidence of herding behavior in the KOSPI and KOSDAQ markets. However, based on these results, it is difficult to conclude that there is no herding behavior in the Korean stock market.
Table 3 reports the results of the estimates of herding behavior in up- and down-market periods based on Equation (3). The results show that investors react asymmetrically during up- and down-market periods. According to the results, there is evidence of herding behavior during down-market periods in the KOSPI and KOSDAQ stock markets, since coefficient displays a significant result. This indicates that when market returns are falling, as investors’ fear rises, investors exhibit herding behavior. However, since the coefficient does not have a statistically significant result, there is no herding behavior during the up-market period in each market. In addition, the herding behavior of investors may be related to changes in trading volume and volatility.
Table 4 and Table 5 present the results of the analysis of trading volume and volatility based on Equations (4) and (5). Table 4 explores whether herding behavior occurs when the change in trading volume differs, and Panel B explores whether herding behavior occurs when the change in volatility differs. Panel A shows that coefficients (, ) in the KOSPI and KOSPI stock markets are statistically significant during high- and low-trading volume periods. However, is negative, which suggests that there is herding behavior during high-trading volume periods in the KOSPI and KOSDAQ stock markets. However, there is reverse herding behavior during low-trading volume periods since is positive.
As shown in Table 5, is significant and positive, but is not significant. This means that there is inverse herding behavior during low volatility in the two markets.
Table 6 and Table 7 present the estimated results of quantile regression for up- and down-market periods (Panel A), low- and high-trading volume periods (Panel B), and low and high volatility (Panel C) based on Equation (6). The estimation using the quantile regression method presents robust results for the characteristics of herding behavior in extreme market situations (i.e., lower and upper quantiles).
In Panel A in Table 6, is negative and statistically significant for the 10% and 90% quantiles, but is only positive and statistically significant for the 90% quantile. We find that the herding behavior for the KOSPI stock market is stronger in the down-market than in the up-market. Panel B presents strong evidence of adverse herding over quantiles during the low-trading volume period. However, in the high-trading volume period, the magnitude of impact of on the CSAD increases from the 10% quantile to the 90% quantile. This suggests that there is herding behavior during the high-trading volume period. Panel C reports the herding behavior results under asymmetrical volatility conditions. is positive and statistically significant for the 10%, 30%, 50%, and 70% quantiles, but is only positive and statistically significant for the 50% quantile, where we find less significance in the high-volatility period. This suggests that adverse herding tends to occur under the 70% quantile.
The results in Table 7 are similar to those in Table 6. In Panel A, is negative and statistically significant for the 10%, 30%, 50%, and 90% quantiles. We find the herding behavior for the KOSDAQ stock market to be stronger in the down-market than in the up-market. However, is positive and statistically significant for the 30% and 50% quantiles. This shows evidence of reverse herding behaviour in the KOSDAQ stock market. In Panel B, is positive and statistically significant at lower quantiles, but is negative and significant above the 50% quantile. This suggests that there is herding behaviour during the high-trading volume period. This is the same result as in the KOSPI stock market. Panel C reports the herding behavior results for low- and high-volatility conditions. is significantly positive for the 10% quantiles, and is only significantly positive for the 90% quantile, where we find less significance in Table 6. This suggests that adverse herding tends to be displayed at the lower and upper quantiles but that there is no herding in low- and high-volatility conditions.
The combined results from Table 6 and Table 7 suggest that herding behavior is highly sensitive to returns and trading volume fluctuation in extreme market conditions (lower and upper quantiles). However, reverse herding behavior occurs in periods of low-trading volume, up-markets, and low volatility in the extreme lower and upper quantiles. In conclusion, investors who participate in the KOSPI and KOSDAQ markets tend to herd due to changes in market conditions.
4.2. Empirical Results of Herding Behaviour and Investor Sentiment
Table 8 presents the results from Equation (7) exploring the relationship between herding behavior and investor sentiment. In Table 8, this estimation shows that investor sentiment affects the CSAD in the KOSDAQ stock market. The estimated coefficient () is positive, which means that reverse herding behavior occurs when investors are pessimistic about the future in the KOSDAQ stock market. However, in the KOSPI stock market, is found to be insignificant. This means that investor sentiment does not explain herding behavior in the KOSPI stock market.
Table 9 presents the estimated results of quantile regression for the KOSPI stock market (Panel A) and the KOSDAQ stock market (Panel B). In Panel A, is positive and significant at the 10% level in the lower () and upper quantiles ().
According to Panel B, the coefficient on is positive and significant at the 5% level from the lower to the upper quantiles ( ~ ). This is a similar result to that for the KOSPI stock market. These results show that reverse herding behavior is observed in the extreme low and high quantiles, indicating that when investor sentiment is high, it can lead to reverse herding behavior, meaning that rather than imitating others, investors make their own decisions. In other words, when investor sentiment is low, it can lead to herding behavior. These findings are consistent with the results of Gębka and Wohar (2013) that reverse herding may occur in high and low quantiles. They explain that reverse herding behavior is the result of noisy traders in low and high quantiles. Noisy traders and irrational traders tend not to trade based on accurate information and fundamental values, so the CSAD increases while trading assets are in the wrong direction.
5. Conclusions
This study analyzed the existence of herding behavior and the relationship between herding behavior and investor sentiment in the KOSPI and KOSDAQ stock markets.
The results of the empirical analysis are as follows. First, the analysis of up- and down-markets shows that herding behavior occurs during down-market periods in the KOSDAQ and KOSPI stock markets. Second, according to the results of the quantile regression method, herding behavior is found in the low and high quantiles in the KOSPI and KOSDAQ stock markets. This means that herding behavior occurs in extreme market conditions (low and high quantiles). Therefore, the CSAD depends on signs of extreme market conditions. In extreme periods, investors ignore their own information and beliefs, follow market movements, and imitate other investors.
Third, the analysis of the relationship between investor sentiment and herding behavior showed that investor sentiment has a positive effect in the KOSDAQ stock market but is not significant in the KOSPI stock market. In the KOSDAQ market, there is herding behavior when investors are optimistic about the future. In addition, through quantile regression analysis, the KOSPI and KOSDAQ stock markets show that investor sentiment has a significant positive effect at lower and upper quantiles. This shows that low investor sentiment can lead to herding behavior in the KOSPI and KOSDAQ stock markets. Therefore, investor sentiment has a stronger influence on herding behavior in lower and upper quantiles (extreme market conditions).
In conclusion, herd behavior occurs in periods of down-markets or in extreme market conditions. Investors herd based on market conditions and other investors’ decisions rather than using their information due to heightened anxiety and fear. We also identified that investor sentiment is one important factor that could lead to herding behavior. In particular, greater global financial liberalization and the development of IT heighten information and emotion sharing, so there is a possibility of more herding behavior.
Therefore, investors should be more careful to make investment decisions rationally when market returns fall and in extreme market conditions. Furthermore, it is desirable for the government to devise measures to reduce the impact of investor sentiment by making the market more stable.
This study contributes to the existing literature by conducting a thorough analysis of herding in the Korean stock markets under different market conditions, and also introducing the investor sentiment into the herding behavior model. Our results provide useful information for investors and regulators, especially during down-market and high-trading volume periods, and can be helpful in hedging.
Future research can analyze different investor sentiment indexes and study whether herding behavior is affected by different factors (macro information) apart from sentiment. Because herding behavior occurs in extreme events (financial crisis, recession), if the copula model considering extreme events is applied, new evidence may be presented in the stock market.
Author Contributions
All the authors contributed to the entire process of writing this paper. K.-H.C. and S.-M.Y. conceived the idea and designed the structure of this paper, K.-H.C. collected and examined the data and devised the methodology, K.-H.C. wrote the draft of Section 1, Section 2 and Section 3, S.-M.Y. wrote Section 4 and Section 5, and S.-M.Y. performed a final revision of the entire paper. All authors have read and agreed to the published version of the manuscript.
Funding
This work was supported by the Ministry of Education of the Republic of Korea and the National Research Foundation of Korea (NRF-2017S1A5B8057488).
Conflicts of Interest
The authors declare that they have no conflicts of interest.
References
- Admati, Anat R., and Paul Pfleiderer. 1997. Does it all add up? Benchmarks and the compensation of active portfolio managers. Journal of Business 70: 323–50. [Google Scholar] [CrossRef] [Green Version]
- Banerjee, Abhijit V. 1992. A simple model of herd behavior. Quarterly Journal of Economics 107: 797–817. [Google Scholar] [CrossRef] [Green Version]
- Barnes, Michelle L., and Anthony W. Hughes. 2002. A Quantile Regression Analysis of the cross Section of Stock Market Returns. Working Paper. Federal Reserve Bank of Boston. Available online: https://ssrn.com/abstract=458522 (accessed on 18 December 2019).
- Bikhchandani, Sushil, and Sunil Sharma. 2001. Herd behavior in financial markets. IMF Staff Papers 47: 279–310. [Google Scholar]
- Bikhchandani, Sushil, David Hirshleifer, and Ivo Welch. 1992. A theory of fads, fashion, custom, and cultural change as informational cascades. Journal of Political Economy 100: 992–1026. [Google Scholar] [CrossRef]
- Blasco, Natividad, Pilar Corredor, and Sandra Ferreruela. 2012. Market sentiment: A key factor of investors’ imitative behavior. Accounting & Finance 52: 663–89. [Google Scholar]
- Buchinsky, Moshe. 1998. Recent advances in quantile regression models: A practical guideline for empirical research. Journal of Human Resources 33: 88–126. [Google Scholar] [CrossRef]
- Chang, Eric C., Joseph. W. Cheng, and Ajay Khorana. 2000. An examination of herd behavior in equity markets: An international perspective. Journal of Banking & Finance 24: 1651–79. [Google Scholar]
- Chiang, Thomas C., and Dazhi Zheng. 2010. An empirical analysis of herd behavior in global stock markets. Journal of Banking & Finance 34: 1911–21. [Google Scholar]
- Chiang, Thomas C., Jiandong Li, and Lim Tan. 2010. Empirical investigation of herding behavior in Chinese stock markets: Evidence from quantile regression analysis. Global Finance Journal 21: 111–24. [Google Scholar] [CrossRef]
- Christie, William G., and Roger D. Huang. 1995. Following the pied piper: Do individual returns herd around the market? Financial Analysts Journal 51: 31–37. [Google Scholar] [CrossRef]
- Clements, Adam, Stan Hurn, and Shuping Shi. 2017. An empirical investigation of herding in the US stock market. Economic Modelling 67: 184–92. [Google Scholar] [CrossRef] [Green Version]
- De Long, Bradford J., Andrei Shleifer, Lawrence H. Summers, and Robert J. Waldmann. 1990. Positive feedback investment strategies and destabilizing rational speculation. Journal of Finance 45: 374–97. [Google Scholar] [CrossRef] [Green Version]
- Economou, Fotini, Christis Hassapis, and Nikolaos Philippas. 2018. Investors’ fear and herding in the stock market. Applied Economics 50: 3654–63. [Google Scholar] [CrossRef]
- Economou, Fotini, Konstantinos Gavriilidis, Abhinav Goyal, and Vasileios Kallinterakis. 2015. Herding dynamics in exchange groups: Evidence from Euronext. Journal of International Financial Markets, Institutions and Money 34: 228–44. [Google Scholar] [CrossRef]
- Froot, Kenneth A., David S. Scharfstein, and Jeremy C. Stein. 1992. Herd on the street: Informational inefficiencies in a market with short-term speculation. Journal of Finance 47: 1461–84. [Google Scholar] [CrossRef]
- Galariotis, Emilios C., Wu Rong, and Spyros I. Spyrou. 2015. Herding on fundamental information: A comparative study. Journal of Banking & Finance 50: 589–98. [Google Scholar]
- Gavriilidis, Konstantinos, Vasileios Kallinterakis, and Ioannis Tsalavoutas. 2016. Investor mood, herding and the Ramadan effect. Journal of Economic Behavior & Organization 132: 23–38. [Google Scholar]
- Gębka, Bartosz, and Mark E. Wohar. 2013. International herding: Does it differ across sectors? Journal of International Financial Markets, Institutions and Money 23: 55–84. [Google Scholar] [CrossRef]
- Grinblatt, Mark, Sheridan Titman, and Russ Wermers. 1995. Momentum investment strategies, portfolio performance, and herding: A study of mutual fund behavior. The American Economic Review 85: 1088–105. [Google Scholar]
- Hwang, Soosung, and Mark Salmon. 2004. Market stress and herding. Journal of Empirical Finance 11: 585–616. [Google Scholar] [CrossRef] [Green Version]
- Hwang, Soosung, and Mark Salmon. 2009. Sentiment and Beta Herding; Working Paper. SSRN. Available online: http://ssrn.com/abstract,299919 (accessed on 20 December 2019).
- Koenker, Roger, and Gilbert Bassett Jr. 1978. Regression quantiles. Econometrica 46: 33–50. [Google Scholar] [CrossRef]
- Laih, Yih-Wenn, and Yung-Shi Liau. 2013. Herding behavior during the subprime mortgage crisis: Evidence from six Asia-Pacific stock markets. International Journal of Economics and Finance 5: 71–84. [Google Scholar] [CrossRef] [Green Version]
- Lakonishok, Josef, Andrei Shleifer, and Robert W. Vishny. 1992. The impact of institutional trading on stock prices. Journal of Financial Economics 32: 23–43. [Google Scholar] [CrossRef] [Green Version]
- Lam, Keith. S. K., and Zhuo Qiao. 2015. Herding and fundamental factors: The Hong Kong experience. Pacific-Basin Finance Journal 32: 160–88. [Google Scholar] [CrossRef]
- Lao, Paulo, and Harminder Singh. 2011. Herding behaviour in the Chinese and Indian stock markets. Journal of Asian Economics 22: 495–506. [Google Scholar] [CrossRef]
- Liao, Tsai-Ling, Chih-Jen Huang, and Chieh-Yuan Wu. 2011. Do fund managers herd to counter investor sentiment? Journal of Business Research 64: 207–12. [Google Scholar] [CrossRef]
- Pochea, Maria-Miruna, Angela-Maria Filip, and Andreea-Maria Pece. 2017. Herding behavior in CEE stock markets under asymmetric conditions: A quantile regression analysis. Journal of Behavioral Finance 18: 400–16. [Google Scholar] [CrossRef]
- Prendergast, Canice, and Lars Stole. 1996. Impetuous Youngsters and Jaded Old-Timers: Acquiring a reputation for learning. Journal of Political Economy 104: 1105–34. [Google Scholar] [CrossRef]
- Roll, Richard. 1992. A mean/variance analysis of tracking error. Journal of Portfolio Management 18: 13–23. [Google Scholar] [CrossRef]
- Scharfstein, David. S., and Jeremy. C. Stein. 1990. Herd behavior and investment. American Economic Review 80: 465–79. [Google Scholar]
- Smales, Lee A. 2017. The importance of fear: Investor sentiment and stock market returns. Applied Economics 49: 3395–421. [Google Scholar] [CrossRef]
- Tan, Lin, Thomas C. Chiang, Joseph R. Mason, and Edward Nelling. 2008. Herding behavior in Chinese stock markets: An examination of A and B shares. Pacific-Basin Finance Journal 16: 61–77. [Google Scholar] [CrossRef]
- Trueman, Brett. 1994. Analyst forecasts and herding behavior. Review of Financial Studies 7: 97–124. [Google Scholar] [CrossRef]
- Vieira, Elisabete F. Simoes, and Marcia S. Valente Pereira. 2015. Herding behaviour and sentiment: Evidence in a small European market. Revista de Contabilidad 18: 78–86. [Google Scholar] [CrossRef] [Green Version]
- Yao, Juan, Chuanchan Ma, and William Peng He. 2014. Investor herding behaviour of Chinese stock market. International Review of Economics & Finance 29: 12–29. [Google Scholar]
- Yousaf, Imran, Shoaib Ali, and Syed Zulfiqar Ali Shah. 2018. Herding behavior in Ramadan and financial crises: The case of the Pakistani stock market. Financial Innovation 4: 1–16. [Google Scholar] [CrossRef]
Figure 1.
Dynamics of Cross-Sectional Absolute Deviation (CSAD) and Sent series: (a) CSAD for the KOSPI market; (b) CSAD for the KOSDAQ market; (c) Investor sentiment.
Figure 1.
Dynamics of Cross-Sectional Absolute Deviation (CSAD) and Sent series: (a) CSAD for the KOSPI market; (b) CSAD for the KOSDAQ market; (c) Investor sentiment.


Table 1.
Descriptive statistics and unit root test of CSAD and Sent.
| Panel A: Descriptive Statistics | ||||||||
| Mean | Max | Min | Std. D. | Ske. | Kur. | J-B | N | |
| KOSPI | 1.8688 | 6.4392 | 1.0418 | 0.4817 | 2.0591 | 11.7608 | 15454.6 *** | 3958 |
| KOSDAQ | 2.3479 | 6.3245 | 1.1678 | 0.5364 | 1.3677 | 6.8118 | 3630.1 *** | 3958 |
| Sent | −0.0002 | 0.4344 | −0.3027 | 0.0536 | 1.1027 | 9.7720 | 8239.4 *** | 3958 |
| Panel B: Unit Root Test | ||||||||
| ADF (1) | ADF (2) | PP (1) | PP (2) | |||||
| KOSPI | −7.3493 *** | −9.6390 *** | −43.8588 *** | −47.0165 *** | ||||
| KOSDAQ | −7.0294 *** | −8.9427 *** | −38.7360 *** | −45.5168 *** | ||||
| Sent | −30.4317 *** | −30.4316 *** | −71.8796 *** | −71.9138 *** | ||||
Notes: The Std. D., Ske., Kur., and J-B denote the standard deviation, skewness, kurtosis, and Jarque–Bera test, respectively. *** indicates statistical significance at the 1% level. ADF (1) and ADF (2) denote the Augmented Dickey–Fuller (ADF) tests that include a constant and a constant and a linear time trend in the test regression, respectively. Additionally, PP (1) and PP (2) denote the Philips–Perron (PP) tests that include a constant and a constant and a linear time trend in the test regression, respectively.
Table 2.
Estimates of herding behavior without market conditions.
| KOSPI | KOSDAQ | |
|---|---|---|
| 1.5864 (0.0090) *** | 2.0744 (0.0112) *** | |
| 0.3960 (0.0126) *** | 0.3155 (0.0134) *** | |
| −0.0028 (0.0021) | −0.0017 (0.0020) | |
| 0.4404 | 0.3357 |
Notes: Numbers in parentheses are standard errors. *** represents significance at the 1% level.
Table 3.
Estimates of herding behavior in up- and down-market periods.
| KOSPI | KOSDAQ | |
|---|---|---|
| 0.1598 (0.0091) *** | 2.0811 (0.0113) *** | |
| 0.4160 (0.0142) *** | 0.3585 (0.0150) *** | |
| 0.3702 (0.0164) *** | 0.2665 (0.0184) *** | |
| −0.0053 (0.0024) ** | −0.0065 (0.0022) *** | |
| −0.0009 (0.0039) | 0.0001 (0.0044) | |
| 0.4417 | 0.3424 |
Note: Numbers in parentheses are standard errors. *** and ** represent significance at the 1% and 5% levels, respectively.
Table 4.
Estimates of herding behavior in high- and low-trading volume periods.
| KOSPI | KOSDAQ | |
|---|---|---|
| 1.5962 (0.0092) *** | 2.0756 (0.0111) *** | |
| 0.3060 (0.0186) *** | 0.2451 (0.0157) *** | |
| 0.4497 (0.0143) *** | 0.3884 (0.0159) *** | |
| 0.0147 (0.0054) *** | 0.0080 (0.0026) *** | |
| −0.0100 (0.0023) *** | −0.0124 (0.0026) *** | |
| 0.4501 | 0.3478 |
Note: See the note of Table 2.
Table 5.
Estimates of herding behavior in high- and low-volatility periods.
| KOSPI | KOSDAQ | |
|---|---|---|
| 1.5741 (0.0097) *** | 2.0647 (0.0139) *** | |
| 0.4343 (0.0210) *** | 0.3185 (0.0356) *** | |
| 0.3544 (0.0128) *** | 0.2837 (0.0141) *** | |
| 0.0327 (0.0065) *** | 0.0494 (0.0166) *** | |
| 0.0003 (0.0022) | 0.0022 (0.0021) | |
| 0.4633 | 0.3461 |
Note: See the note of Table 2.
Table 6.
Quantile regressions on estimates of herding behavior in market conditions in KOSPI.
| Panel A: Returns up and down | ||||||
| Quantile () | 1.2322 *** (0.0131) | 0.3494 *** (0.0205) | 0.3000 *** (0.0268) | −0.0028* (0.0016) | −0.0039 (0.0024) | 0.1465 |
| Quantile () | 1.4071 *** (0.0198) | 0.3668 *** (0.0198) | 0.3344 *** (0.0268) | 0.0009 (0.0037) | −0.0001 (0.0090) | 0.1735 |
| Quantile () | 1.5587 *** (0.0144) | 0.3776 *** (0.0256) | 0.3337 *** (0.0483) | 0.0013 (0.0049) | 0.0120 (0.0207) | 0.1987 |
| Quantile () | 1.7406 *** (0.0255) | 0.4158 *** (0.0335) | 0.2937 ** (0.1225) | −0.0049 (0.0048) | 0.0273 (0.0699) | 0.2300 |
| Quantile () | 2.0347 *** (0.0239) | 0.4827 *** (0.0411) | 0.2035 *** (0.0787) | −0.0105* (0.0061) | 0.1110 *** (0.0337) | 0.2999 |
| Panel B: Trading volume high and low | ||||||
| Quantile () | 1.2400 *** (0.0116) | 0.2575 *** (0.0218) | 0.3456 *** (0.0187) | 0.0246 *** (0.0030) | −0.0084 *** (0.0018) | 0.1485 |
| Quantile () | 1.4115 *** (0.0095) | 0.2821 *** (0.0167) | 0.3896 *** (0.0201) | 0.0183 *** (0.0027) | −0.0051* (0.0029) | 0.1775 |
| Quantile () | 1.5637 *** (0.0116) | 0.2835 *** (0.0272) | 0.4148 *** (0.0242) | 0.0232 ** (0.0094) | −0.0059 (0.0048) | 0.2036 |
| Quantile () | 1.7345 *** (0.0135) | 0.2841 *** (0.0325) | 0.4618 *** (0.0270) | 0.0218* (0.0124) | −0.0106 ** (0.0053) | 0.2348 |
| Quantile () | 2.0150 *** (0.0185) | 0.3031 *** (0.0434) | 0.5523 *** (0.0408) | 0.0275 ** (0.0128) | −0.0192 *** (0.0063) | 0.3006 |
| Panel C: Volatility high and low | ||||||
| Quantile () | 1.2254 *** (0.0127) | 0.3388 *** (0.0257) | 0.3111 *** (0.0191) | 0.0230 *** (0.0038) | 0.0004 (0.0015) | 0.1496 |
| Quantile () | 1.3990 *** (0.0151) | 0.3660 *** (0.0313) | 0.3146 *** (0.0541) | 0.0479 *** (0.0044) | 0.0059 (0.0203) | 0.1839 |
| Quantile () | 1.5342 *** (0.0110) | 0.4317 *** (0.0230) | 0.3237 *** (0.0176) | 0.0360 *** (0.0038) | 0.0093 *** (0.0034) | 0.2150 |
| Quantile () | 1.7190 *** (0.0196) | 0.3919 *** (0.0550) | 0.3062 *** (0.0582) | 0.0683 *** (0.0234) | 0.0135 (0.0194) | 0.2465 |
| Quantile () | 2.0095 *** (0.0392) | 0.4319 * (0.2284) | 0.3173 *** (0.0638) | 0.0641 (0.1510) | 0.0154 (0.0145) | 0.3090 |
Note: Numbers in parentheses are standard errors. ***, **, and * represent significance at the 1%, 5%, and 10% levels, respectively.
Table 7.
Quantile regressions on estimates of herding behavior in market conditions in KOSDAQ.
| Panel A: Returns up and down | ||||||
| Quantile () | 1.5987 *** (0.0149) | 0.3178 *** (0.0198) | 0.2234 *** (0.0232) | −0.0040 ** (0.0020) | −0.0032 (0.0020) | 0.1142 |
| Quantile () | 1.8756 *** (0.0413) | 0.3137 *** (0.0171) | 0.1662 *** (0.0267) | −0.0027* (0.0016) | 0.0203 *** (0.0064) | 0.1273 |
| Quantile () | 2.0527 *** (0.0136) | 0.3629 *** (0.0217) | 0.2323 *** (0.0287) | −0.0086 *** (0.0020) | 0.0076 *** (0.0078) | 0.1542 |
| Quantile () | 2.2577 *** (0.0284) | 0.3829 *** (0.0336) | 0.2401 ** (0.1200) | −0.0079 (0.0052) | 0.0131 (0.0624) | 0.1828 |
| Quantile () | 2.6006 *** (0.0318) | 0.4184 *** (0.0349) | 0.2664 ** (0.1200) | −0.0137 *** (0.0047) | 0.0317 (0.0541) | 0.2475 |
| Panel B: Volume high and low | ||||||
| Quantile () | 1.5890 *** (0.0197) | 0.2224 *** (0.0247) | 0.3319 *** (0.0574) | 0.0073 *** (0.0020) | −0.0114 (0.0207) | 0.1126 |
| Quantile () | 1.8657 *** (0.0133) | 0.2078 *** (0.0196) | 0.3085 *** (0.0183) | 0.0105 *** (0.0027) | −0.0021 (0.0027) | 0.1229 |
| Quantile () | 2.0434 *** (0.0210) | 0.2535 *** (0.0711) | 0.3612 *** (0.0303) | 0.0060 (0.0249) | −0.0091 ** (0.0037) | 0.1516 |
| Quantile () | 2.2470 *** (0.0193) | 0.2554 *** (0.0514) | 0.4032 *** (0.0281) | 0.0089 (0.0184) | −0.0102 ** (0.0041) | 0.1858 |
| Quantile () | 2.5931 *** (0.0221) | 0.2330 *** (0.0578) | 0.4910 *** (0.0317) | 0.0190 (0.0173) | −0.0245 *** (0.0047) | 0.2584 |
| Panel C: Market volatility high and low | ||||||
| Quantile () | 1.5887 *** (0.0192) | 0.2481 *** (0.0520) | 0.2330 *** (0.0202) | 0.0366 (0.0247) | 0.0060 *** (0.0016) | 0.1090 |
| Quantile () | 1.8575 *** (0.0200) | 0.2695 *** (0.0621) | 0.2502 *** (0.0230) | 0.0256 (0.0344) | 0.0054 (0.0039) | 0.1201 |
| Quantile () | 2.0383 *** (0.0169) | 0.2931 *** (0.0468) | 0.2758 *** (0.0296) | 0.0402 (0.0254) | 0.0031 (0.0073) | 0.1503 |
| Quantile () | 2.2214 *** (0.0218) | 0.3734 *** (0.0748) | 0.3069 *** (0.0240) | 0.0418 (0.0459) | 0.0022 (0.0035) | 0.1844 |
| Quantile () | 2.5680 *** (0.0294) | 0.3862 *** (0.0717) | 0.2956 *** (0.0866) | 0.1060 *** (0.0179) | 0.0119 (0.0248) | 0.2571 |
Note: See the note of Table 6.
Table 8.
Regressions on estimates of herding behavior incorporating investor sentiment.
| KOSPI | KOSDAQ | |
|---|---|---|
| 1.5866 (0.0193) *** | 2.0766 (0.0212) *** | |
| 0.3958 (0.0308) *** | 0.3147 (0.0226) *** | |
| −0.0029 (0.0045) | −0.0025 (0.0029) | |
| 0.0255 (0.1246) | 0.4568 (0.1333) *** | |
| 0.4404 | 0.3377 |
Note: See the note of Table 2.
Table 9.
Estimates of herding behavior incorporating investor sentiment.
| Panel A: KOSPI | |||||
| Quantile () | 1.2338 *** (0.0119) | 0.3221 *** (0.0183) | -0.0007 (0.0014) | 0.2520 ** (0.1170) | 0.1443 |
| Quantile () | 1.4063 *** (0.0102) | 0.3479 *** (0.0179) | 0.0023 (0.0040) | 0.1534 (0.1329) | 0.1729 |
| Quantile () | 1.5557 *** (0.0107) | 0.3596 *** (0.0187) | 0.0039 (0.0041) | -0.0393 (0.1638) | 0.1982 |
| Quantile () | 1.7286 *** (0.0225) | 0.3740 *** (0.0624) | 0.0040 (0.0236) | 0.3318* (0.1846) | 0.2279 |
| Quantile () | 2.0105 *** (0.0296) | 0.4302 *** (0.0900) | 0.0025 (0.0327) | -0.3558 (0.3888) | 0.2910 |
| Panel B: KOSDAQ | |||||
| Quantile () | 1.5906 *** (0.0141) | 0.2633 *** (0.0177) | 0.0029* (0.0015) | 0.5309 *** (0.1443) | 0.1081 |
| Quantile () | 1.8640 *** (0.0129) | 0.2612 *** (0.0148) | 0.0011 (0.0014) | 0.7259 *** (0.1376) | 0.1221 |
| Quantile () | 2.0463 *** (0.0116) | 0.3036 *** (0.0136) | -0.0035 ** (0.0016) | 0.4598 *** (0.1684) | 0.1488 |
| Quantile () | 2.2449 *** (0.0165) | 0.3362 *** (0.0259) | -0.0021 (0.0051) | 0.5547 ** (0.2641) | 0.1794 |
| Quantile () | 2.5863 *** (0.0295) | 0.3736 *** (0.0655) | -0.0051 (0.0181) | 0.3007 (0.2607) | 0.2453 |
Note: See the note of Table 6.
© 2020 by the authors. Licensee MDPI, Basel, Switzerland. This article is an open access article distributed under the terms and conditions of the Creative Commons Attribution (CC BY) license (http://creativecommons.org/licenses/by/4.0/).
Share and Cite
MDPI and ACS Style
Choi, K.-H.; Yoon, S.-M. Investor Sentiment and Herding Behavior in the Korean Stock Market. Int. J. Financial Stud. 2020, 8, 34. https://0-doi-org.brum.beds.ac.uk/10.3390/ijfs8020034
AMA Style
Choi K-H, Yoon S-M. Investor Sentiment and Herding Behavior in the Korean Stock Market. International Journal of Financial Studies. 2020; 8(2):34. https://0-doi-org.brum.beds.ac.uk/10.3390/ijfs8020034
Chicago/Turabian StyleChoi, Ki-Hong, and Seong-Min Yoon. 2020. "Investor Sentiment and Herding Behavior in the Korean Stock Market" International Journal of Financial Studies 8, no. 2: 34. https://0-doi-org.brum.beds.ac.uk/10.3390/ijfs8020034
Note that from the first issue of 2016, this journal uses article numbers instead of page numbers. See further details here.