Article

Financial Risk and Financial Performance: Evidence and Insights from Commercial and Services Listed Companies in Nairobi Securities Exchange, Kenya

by
Susan Kerubo Onsongo
1,*,
Stephen M. A. Muathe
2 and
Lucy Wamugo Mwangi
1
1
Department of Accounting and Finance, School of Business, Kenyatta University, Nairobi P.O. Box 43844-00100, Kenya
2
Department of Business Administration, School of Business, Kenyatta University, P.O. Box 43844-00100 Nairobi, Kenya
*
Author to whom correspondence should be addressed.
Int. J. Financial Stud. 2020, 8(3), 51; https://0-doi-org.brum.beds.ac.uk/10.3390/ijfs8030051
Submission received: 15 May 2020 / Revised: 31 July 2020 / Accepted: 3 August 2020 / Published: 11 August 2020

Abstract

:
In Kenya, the last few years has seen the performance of companies listed under the commercial and services segment on the Nairobi Securities Exchange (NSE), experience mixed fortunes. The study sought to assess the implications of financial risk on the performance of these companies. The study applied explanatory research design. The target population were the 14 companies listed under this segment of NSE. Secondary panel data contained in published annual reports for the period 2013–2017 was collected. Panel regression model was applied with the random effect model being used based on the Hausman specification test. Findings showed that credit risk had an insignificant positive effect on return on equity (ROE) while liquidity risk had a significantly negative effect on ROE and operational risk had a positive insignificant effect on ROE. The positive coefficients from the data analysis indicated that commercial and service companies at NSE were able to take in more credit to boost performance of these companies however the negative coefficients shows that within the period of study these companies experienced high liquidity problems in that the current liabilities exceeded the current assets. Thus, concluding that these companies were unable to pay all their obligation when they were due.

1. Introduction

The performance of the global economy has been affected by crises like the unforeseen Covid-19 pandemic that hit the world in 2019 and led to economic slowdown. The previous global economic crisis was financial crisis of 2008–2009 that was attributed to excessive risk appetites by financial institutions (Agarwal 2011). The crisis led to erosion of the investor trust in the ability of public firms to manage risks effectively (Capgemini and Merrill Lynch Global Wealth Management 2009). However, a study by Wani and Ahmad (2013) in the United Kingdom on nonfinancial firms indicated that “the 2008–2009 financial crisis did not significantly affect established risk management practices and firms’ commitment to financial risk”.
Bansal et al. (1992) and Holton (2004) described risk as the unexpected change or unpredictability of returns. Arif and Showket (2015) and Fali et al. (2020) enriched the description of risk by stating that financial risk is the probability of a firm collapsing when the company uses debt to satisfy financial commitments when the cash balance is inadequate. This risk is normally influenced by causes beyond the firm’s control (Oliver 2001; Harvey 2008).
Risk can yield the possibility of both pleasant surprises as well as adverse business results with a general hypothesis that the amount of risk taken has a direct impact on the potential return (Gentry and Pike 1970; Stulz 1996; Woods and Dowd 2008; Kinyua et al. 2015; Were 2015). How well or poorly a firm performs has been linked to risks taken by management of the firms (Muriithi 2016).
According to Agustina and Baroroh (2016), performance has been defined historically as a gauge over a time on the health of a company or organization. This gauge when standardized is then used for comparison across companies in similar trades (Erasmus 2008). Performance gauges how well a business uses its assets to maximize returns on investments by its stakeholders (Mwangi et al. 2014).
Dey et al. (2018) investigated how financial risk disclosure affected performance of manufacturing companies in Bangladesh, Asia. They developed financial risk disclosure indices through content analysis of the firms’ annual reports. The study employed regression analysis to examine the association between financial risk disclosure and the firm’s attributes. Their study found no common practice in companies disclosing their financial risks into their reporting process.
Isiaka (2018) assessed how liquidity risk affected insurance companies’ performance listed in Nigeria. Liquidity risk was the independent variable with the measure being claim loss ratio, premium growth and leverage. For firm performance, return on assets (ROA) was used as the proxy. The study adopted panel multiple regression techniques. The findings revealed that leverage had a significant negative effect on return on assets. This study instead used Return on Equity (ROE) as a measure of performance and current ratio as the measure of liquidity risk.
Financial risk and its relation to financial performance by different theoretical and empirical researchers give contradictory explanations, making it hard to make definite conclusion. Risks therefore remain a significant factor that affects a firm’s performance that needs to be studied. This article sought to answer the research question: What is the effect of financial risk on the performance of commercial and services listed companies on Nairobi Securities Exchange, Kenya. In the study, financial risk was assessed from three perspectives, namely: credit risk, liquidity risk and operational risk.
Commercial and services companies consist of companies that buy and sell products and services in their area of competence. Unique characteristics of companies listed in this segment include fulfilling an intermediary function. Another quality of the companies listed in this segment is that they do not engage in synthesizing of raw of materials to completion, as do the manufacturing companies that are engaged in transformation of raw materials (Armstrong 2017). Instead, their activities are only commercial, connecting the producer with the end consumers. In playing the intermediary role, these companies offer storage, transfer, distribute and sale of the products and services.
Global trends indicate that successful commercial and services companies are becoming obsessed about client experience (KPMG 2018). Digital platforms are taking precedence in customer relationships management among other revenue generation processes for example, purchase of air tickets is being done online, retail consumer purchases are being done through e-commerce websites of such as Amazon and Alibaba (Yan and Wei 2017). Other global trends affecting performances of commercial companies include increased competition, changes in management structures, customer services management and even rising fuel prices that are reducing the revenues posted by businesses in the airline sector (Agarwal 2011; KPMG 2018).
In Kenya, the last few years has seen the performance of companies listed under the commercial and services segment on the NSE experience mixed fortunes in terms of financial performance. The national airline carrier, Kenya Airways (KQ), which is listed under the commercial and services segment reported the country’s worst ever corporate results in history of $258 million US Dollars for the year 2015–2016 (Kenya Airways 2016; Okoth and Achuka 2016). Whereas Longhorn Publishers which is also listed under commercial and services segment has been reporting good results in terms of profits (NSE 2013, 2014, 2015, 2016, 2017; Longhorn Publishers 2018).
According to the Capital Markets Authority, there has been a declining trend in financial performance results posted by companies in the NSE, with eighteen companies out of the sixty-seven registered companies issuing profit warnings in the financial year of 2016 alone (CMA 2016). Most of those firms that reported dismal performances and on the verge of collapsing in the period between 2013 to 2017 were from the commercial and services sector of Nairobi Securities Exchange, Kenya as shown in Table 1. Companies under this sector included Uchumi supermarkets, Kenya Airways, Deacons, Hutchings Biemer, Atlas Development (ADSS), Eveready and logistics firm Express Limited which have been on the spotlight (Bwire 2015; Kangethe 2015; Aglionby 2016; Munda 2017).
As shown on Table 1, the most affected sector was the commercial and services segment with more companies issuing profit warnings. Profit warnings are statements issued by listed firms to the public and its investors to signal dismal performances due to challenging incidents which may be internal to the company or emanating from the external business environment (Mwangi et al. 2014; Mutegi 2017). Some of the factors that have been cited as affecting the sector are the financial risks and competition (Mutegi 2017). Based on these trends the researcher sought to investigate whether companies listed under the commercial and services segment of the NSE were more prone to financial risks. The scope of study covered the performance of these companies from years 2013–2017. The researcher focused on studying only listed commercial and services companies because among the companies that issued profit warnings in the study period at least 25 per cent were from this sector (NSE 2017). The question arises as to whether the dismal performance of these commercial and services companies was due to the varied risk exposures they face or due to the varied businesses in which they participate, and this is what the researcher sought to determine. A longitudinal model was applied because of the time factor and cross-sectional dimensions of the study variables (Aiken et al. 1991; Wooldridge 2010; Park 2011).
In this study, the risk factor was broken down into credit risk, liquidity risk and operational risk. Credit risk was proxied by debt to income ratio (Elder 2016); liquidity risk was proxied by current ratio (Kamau and Njeru 2016); while cost to income ratio was the proxy for operational risk (Mathuva 2009; Muriithi 2016; Wangalwa and Muturi 2018). The study was guided by the following specific objectives
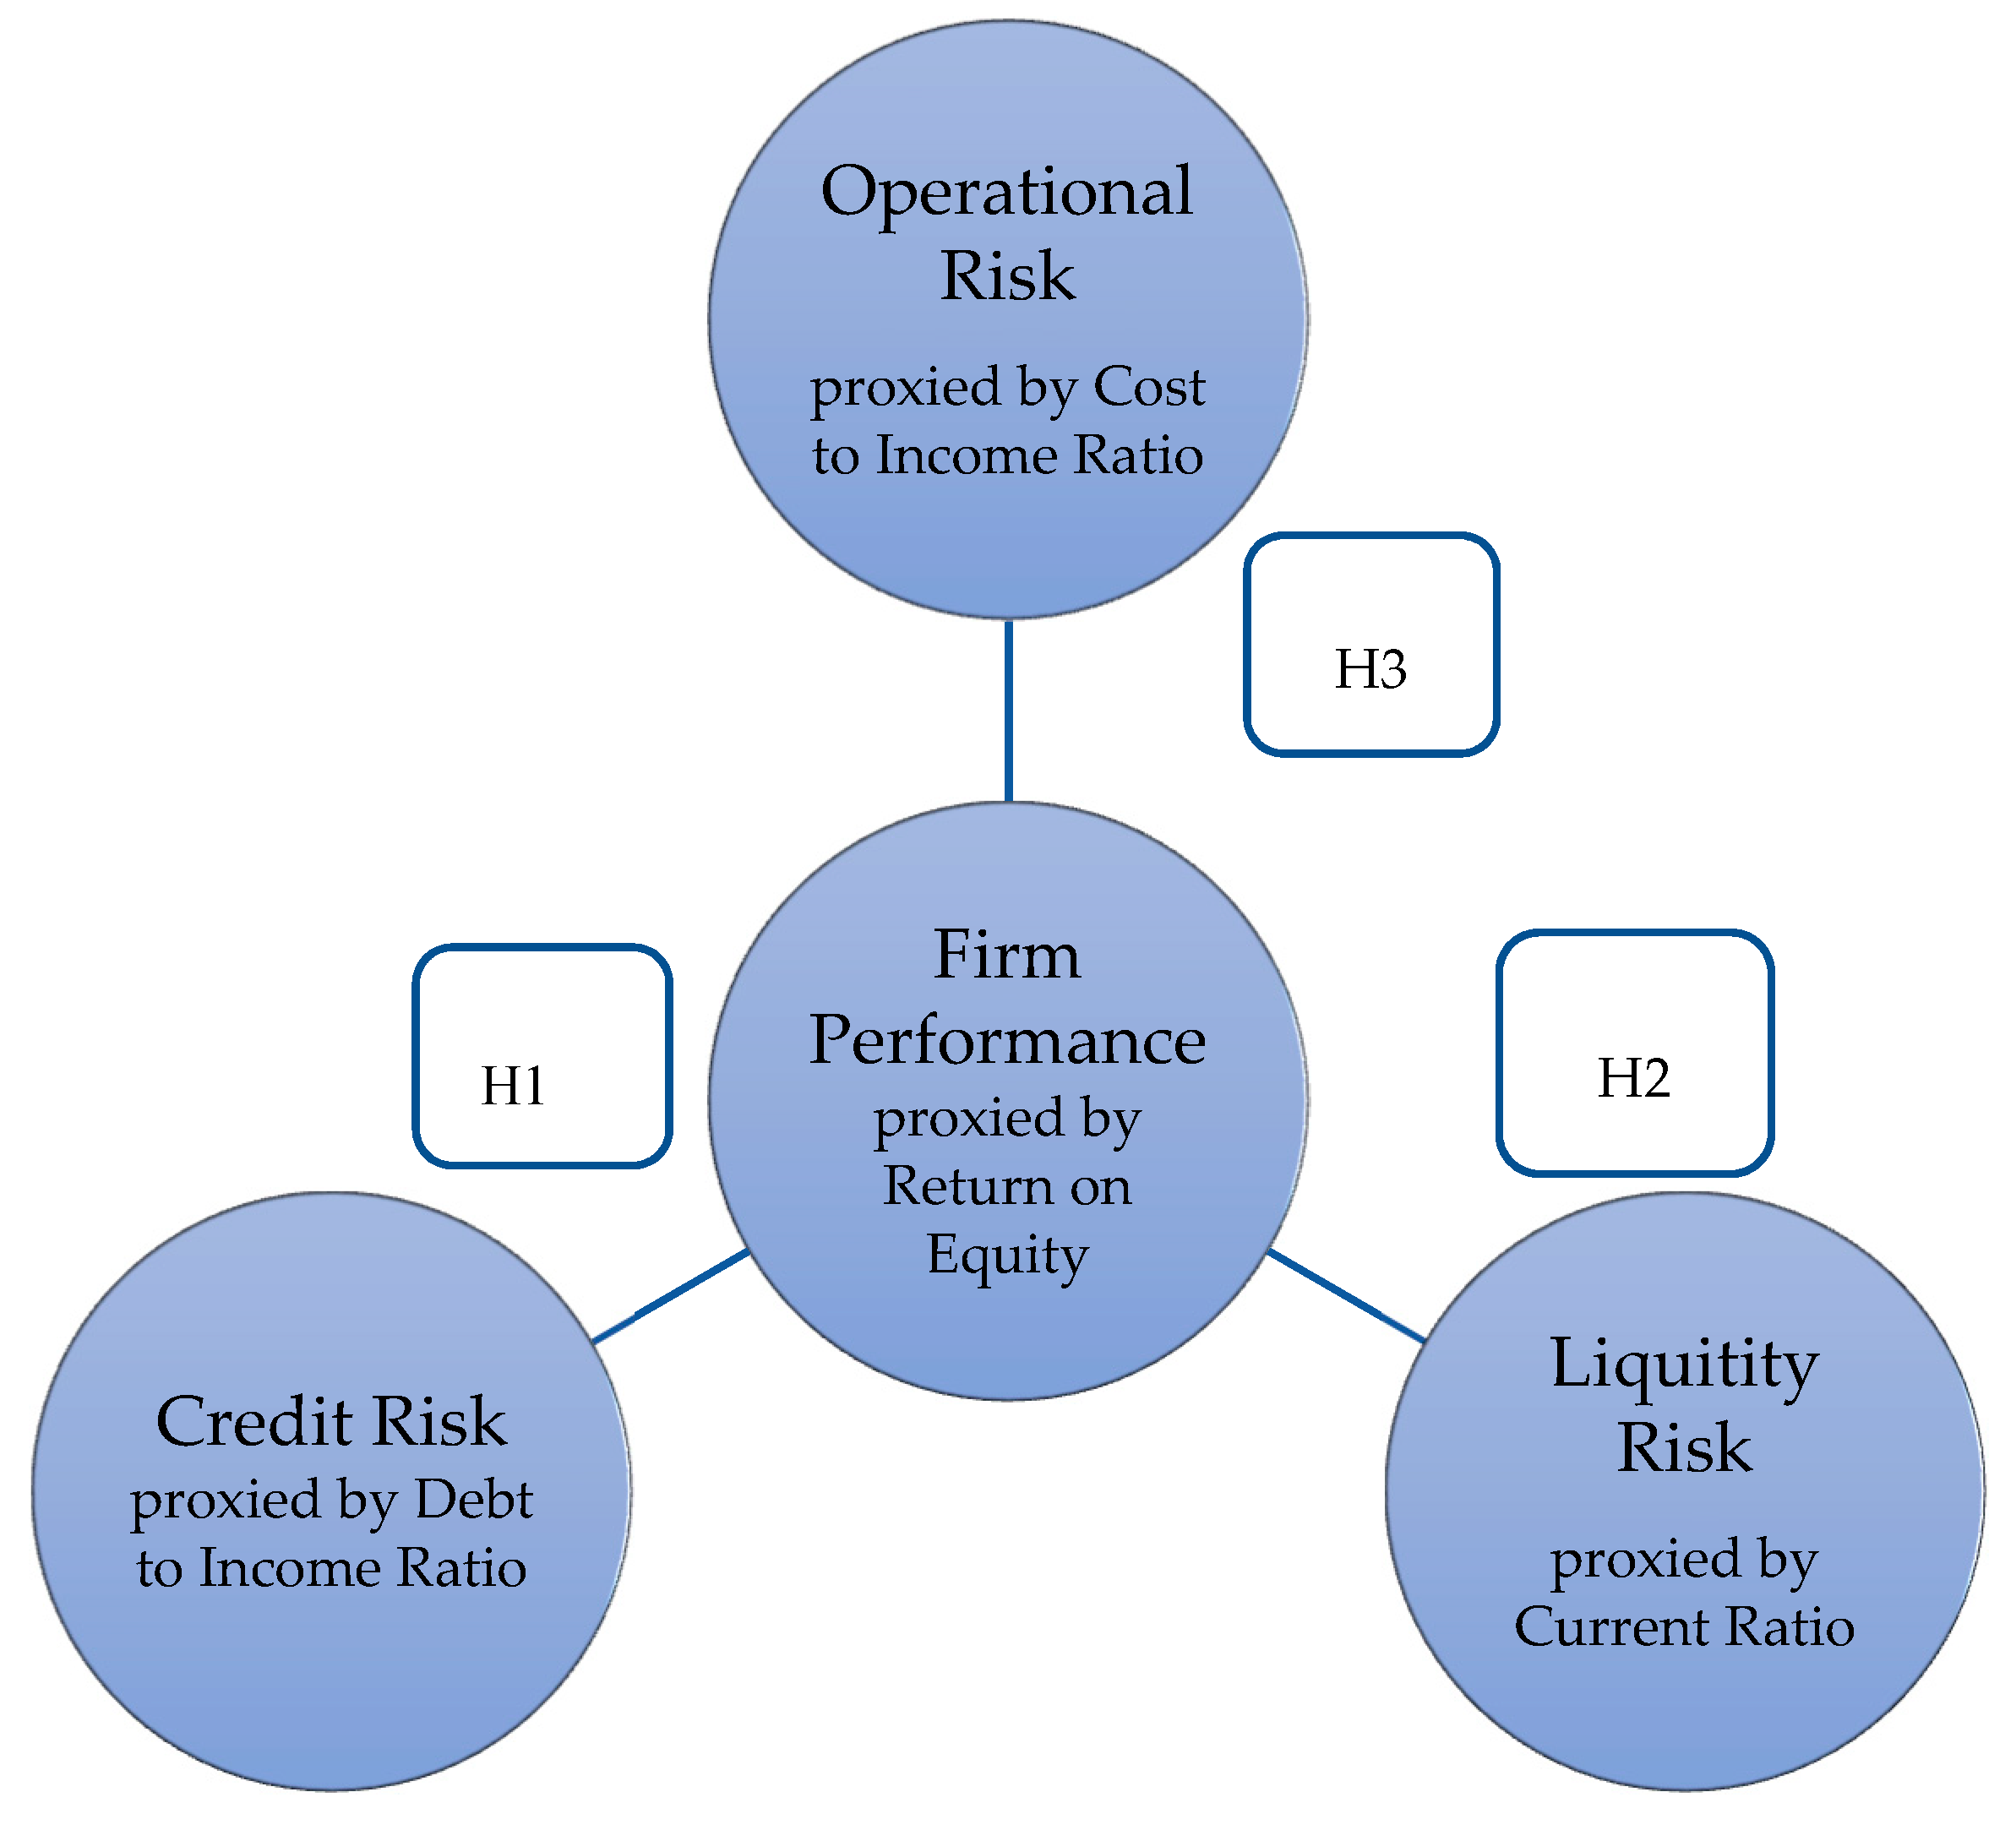
  • To determine the effect of credit risks on the performance of commercial and services companies on NSE, Kenya;
  • To establish the effect of liquidity risks on the performance of commercial and services companies on NSE, Kenya;
  • To examine the effect of operational risks on the performance of commercial and services companies on NSE, Kenya.
The next section is organized as follows: Section 2 begins with an introduction of the key theories that underpinned the study, along with the concepts. This is followed by an analysis of previous empirical literatures on financial risks and firm performance; this section also has the conceptual framework that illustrates the connection between the study variables. Section 3 provides research methodology, the population that was targeted, the sampling size, how data were collected, analyzed, the diagnostic tests and finally the ethical considerations. Section 4 presents the results. Section 5 discusses the key findings. Finally, Section 6 provides the conclusions, recommendations and areas of further study.

2. Literature Review

The study was supported by three theories. These were the agency theory, information asymmetry theory and signaling theory. Agency theory was linked to firm performance while information asymmetry and signaling theories were linked to the risks undertaken by the managers of these firms and the expected impact on firms’ performances (Akerlof 1970; Spence 2002; Auronen 2003).
According to Omasete (2014), shareholders task the firms’ managers and the executive board with the role of managing risks. Risks affect the organizational performance. These risks if managed well can help achieve the goal of maximizing investment returns and earnings of firms (Jensen and Meckling 1976; Fama 1980; Collier and Agyei-Ampomah 2006).
This study applied signaling theory to demonstrate the use of information contained in the financial statements as signals to the wellbeing of the firms in terms of financial performance. In practice, shareholders are not aware of all information available to the firm’s managers that influence the risky ventures taken by them on behalf of the shareholders of the firm (Wruck 1990; Kaplan and Stein 1993; Andrade and Kaplan 1997; Whitaker 1999; Pearson 2002). As a result, the effects on ownership and governance, and the indirect costs to a firm’s performance which include administrative, operational and even reputation costs emerge much later when dismal performances are reported at the end of a financial year (Kihooto et al. 2016). Thus, information asymmetry came into play when investigating the risks taken by the managers and the overall effects on the firm performance.
Wangalwa and Muturi (2018) sought to investigate operational risk and performance of Supermarkets in Nairobi County. Cost to income ratio was utilized as an indicator to operational risk while ROA as representation of financial performance. Descriptive research design was employed with quantitative data. The study was supported by extreme value theory, financial distress theory and firm value maximization theory. Multiple regression to ascertain the effect between operational risk on return on asset of supermarkets in Nairobi County was used. From their findings, operational risk negatively affected ROA. This study added value by shifting focus from supermarkets in Nairobi County and instead broadened the scope by reviewing the whole commercial and services sector of the securities exchange and added two more financial risk indicators, namely credit risk and liquidity risk.
Sisay (2017) reviewed how financial risk affected financial performance of insurance firms in Ethiopia. The thesis used panel survey methods and unstructured in-depth interviews. The study used six independent variables which included credit risk, liquidity risk and solvency risk. The dependent variable for performance was return on assets (ROA). The outcome of regression indicated that credit risk, liquidity risk, solvency risk had a negative and important impact on the profitability of insurance firms in Ethiopia. This study bridged the contextual gap by assessing noninsurance firms and used return on equity as the proxy of performance.
Nyasaka (2017) reviewed management of credit risk and non-performing loans in the banks. In his study, credit risk was measured by the characteristic of the borrower which was used to determine the credit score. The study established that non-performing loans negatively affected a bank’s lending ability. This created a negative signaling effect on credit risk. This study added value by shifting focus from banks and instead focusing on a non-financial sector.
Kamau and Njeru (2016) investigated how liquidity risk affected performance of insurance companies listed on the NSE, Kenya. They looked at credit risk, operational risk and liquidity risk as the explanatory variable of the study while ROE was used to gauge performance. They used descriptive research design. For the methodology, multiple regression model was employed. The extreme value theory, credit risk theory and capital Structure theory supported their research. Market risk and operational risks had significant negative effects on ROE of the insurance companies listed NSE. This research sought to add value by reviewing liquidity risk on a non-insurance sector of the NSE thus filling the contextual gap.
Muriithi (2016) had a research on financial risk and financial performance of commercials banks in Kenya. A sample of 43 commercial banks licensed by central Bank of Kenya for the years from 2005 to 2014 were studied. The findings of the study indicated that credit and liquidity risks have significant negative effect on return on equity. The study deduced that there was an inverse effect between financial risk and financial performance of banks in Kenyan. The study focused on all listed banks, but the current study is on listed commercial and Service firms.
Wani and Ahmad (2013) conducted a research on liquidity risk and performance of Indian insurance industry. Current ratio was utilized as a measure to liquidity risk while ROA was employed as representation of financial performance. Secondary data extracted from the financial statements and multiple regression were used in the study. From the findings liquidity risk had a positive statistically significant relationship on return on asset of insurance industry in India. The study was conducted in Asia and on the insurance industry whose findings may not be relevant to Kenyan contexts. The current study therefore contextualized the gap.
Mathuva (2009) sought to conduct a study on the effect of operational risk on performance of commercial banks in Kenya. The researcher used cost to income to gauge operational risk. ROA and ROE were used as proxies to performance. Panel regression was employed as the model for the study Minitab software was used to ascertain the significance levels of the research constructs. The research findings showed that operational risk is inversely related with both performance indicators. Whereas Mathuva (2009) study was conducted in a financial sector, the findings cannot be extrapolated to the commercial and services sector which is non-financial. This study added value by increasing two additional risk categories, namely credit risk and liquidity risk to the independent variable.
Based on the research objectives and the research gaps identified from the literature review, the study instituted the following hypotheses:
Hypothesis 1 (H1).
Credit risks have no significant effect on the performance of commercial and services companies on NSE, Kenya;
Hypothesis 2 (H2).
Liquidity risks have no significant effect on the performance of commercial and services companies on NSE, Kenya;
Hypothesis 3 (H3).
Operational risks have no significant effect on the performance of commercial and services companies on NSE, Kenya.
The study’s conceptual model is depicted in Figure 1. The order of the hypotheses between independent and dependent variables is illustrated as well.

3. Materials and Methods.

In this study, the risk factor was broken down to credit risk, liquidity risk and operational risk. Credit risk was proxied by debt to income ratio (Elder 2016); liquidity risk was proxied by current ratio (Kamau and Njeru 2016); while cost to income ratio was the proxy for operational risk (Mathuva 2009; Muriithi 2016; Wangalwa and Muturi 2018). A multiple panel regression model was suitable for this research because of the independent variables, time factor and cross-sectional dimensions (Aiken et al. 1991; Wooldridge 2010).
The researcher adopted an explanatory research design. According to Maigua and Mouni (2016), the main advantage of explanatory designs is, it allows connection of thoughts to apprehend reason and effect. The researcher was able to explain what was going on as it exists, and the researcher had no control over the variables. The researcher explored and explained the effects of financial risks on the performance of companies in the commercial and services segment at NSE.

3.1. Target Population

The study target population consisted of the fourteen companies (14) listed in Table 2 under the commercial and services segment of the Nairobi Securities Exchange for the period covering 2013 to 2017. These firms are geographically based in Nairobi, the capital city of Kenya.

3.2. Sampling Design

The population size was small and manageable, the study therefore did not sample the companies. However, when retrieving the data, only ten out of the fourteen firms’ independent audit financial statements were available. The missing four was suspended during the period of study hence ten companies became the target population (NSE 2017).

3.3. Research Data and Variable Construction

The researcher extracted data from published companies’ annual financial reports and NSE handbooks for the years 2013 to 2017. This was secondary data that was readily available from the firms’ website as well as from the Nairobi Securities Exchange handbooks. The key advantage of using secondary data were that it may already were used in previous research, making it easier to use to carry out further research (Mugenda and Mugenda 2003; Grant and Osanloo 2014). The researcher developed a document review guide. The use of the document review guide as a research instrument to collect secondary data have was used and validated by other researchers (Saunders et al. 2009; Bandalos 2018). According to Mwangi et al. (2014) when a census approach of study is taken, the validity of the collected data are improved because the collected information is specific rich to the population and thus legitimate. The benefit of this instrument was that it provided the researcher with a systematic approach of categorizing the data, examining and assessing it and finally developing valuable data. Furthermore, this instrument of research was applied in previous studies (Witkin and Altschuld [1995] 1996; Mugenda and Mugenda 2003; Muathe 2010; Mwangi et al. 2014; Musau 2018). Data extracted for the period 2013 to 2017 was used with the financial years of the companies ending in different months. To increase the scope of data collected, the researcher focused on longitudinal data of same sample over the study period (Gujarati 2003).
The study used the following equations to calculate the study variables and the date can be found in Table 3.
Performance indicator return on equity = Net income
                    Total assets
Credit risk (CR) = Debt
           income
Liquidity risk (LR) = Current assets
            Current liabilities
Operational risk (OR) = Total costs
            Total income

3.4. Data Analysis Method

The researcher used multiple panel regression analysis and descriptive statistics. Under descriptive statistics, the mean, standard deviation, minimum and maximum descriptions were analyzed (Mugenda and Mugenda 2003; Saunders et al. 2009). Multiple panel regression was employed to assess how financial risk affected firm performance over the study period.
To analyze the effect of financial risks on the performance of commercial and services listed companies on Nairobi Stock Exchange, Kenya, the research employed a multiple linear panel regression model.
The general model of the study was defined as follows:
ROEi,t = β0 + β1 CRi,t + β2 LRi,t + β3 ORi,t + εi,t
where:
ROE is the dependent variable measuring performance
i is the company under observation with i = 1…14.
t is the time with t = 2013…2017;
CRi,t is credit risk proxied by debt to income ratio of business i at time t;
LRi,t is liquidity risk proxied by current ratio of company i at time t;
ORi,t is operational risk proxied by cost to income ratio of company i at time t;
βo represents the constant term;
β1 β2 β3 represent the coefficients of the independent variables.
ε represents is the error term.
The study target population was fourteen companies (14) in the commercial and services market segment of the NSE for the period of study covering 2013 to 2017 (NSE 2017). The commercial and services market segment has only 14 companies under it, hence the study took a census methodology due the small number of companies.
The researcher extracted data from published companies’ annual financial reports and NSE handbooks for the years 2013 to 2017. This was secondary data that was readily available from the firms’ website as well as from the Nairobi Securities Exchange handbooks. The key advantage of using secondary data were that it may have been used in previous research, making it easier to use to carry out further research (Mugenda and Mugenda 2003; Grant and Osanloo 2014). The researcher developed a document review guide. The research used this tool to collect secondary data.
The use of the document review guide as a research instrument to collect secondary data have been used and validated by other researchers (Saunders et al. 2009; Bandalos 2018). According to Mwangi et al. (2014) when a census approach of study is taken, the validity of the collected data are improved because the collected information is specific and rich to the population and thus legitimate. The benefit of this instrument was that it provided the researcher with a systematic approach of categorizing the data, examining and assessing it, and finally developing valuable data. Furthermore, this instrument of research has been applied in previous studies (Witkin and Altschuld [1995] 1996; Mugenda and Mugenda 2003; Muathe 2010; Mwangi et al. 2014; Musau 2018).
The researcher used multiple panel regression analysis and descriptive statistics. Under descriptive statistics, the mean, standard deviation, minimum and maximum descriptions were analyzed (Mugenda and Mugenda 2003; Saunders et al. 2009). Multiple panel regression was employed to assess how financial risk affected firm performance over the study period (Park 2011).
The researcher extracted information from the source documents then used Excel sheets to arrange and compute the data mined from the financial statements. The data were then imported from excel to STATA version 13.0 for analysis. For longitudinal data to be well interpreted, it needs to be well arranged and analyzed for both times series and cross-sectional variables hence the need for diagnostic tests that were run.

Diagnostic Tests

The following diagnostic tests were conducted; normality test, multicollinearity test, autocorrelation test, heteroscedasticity test, panel unit root test and Hausman test. Correlation analysis detected presence of multicollinearity between the dependent and independent variables. According to Muriithi (2016), the Jarque–Bera test is necessary prior to estimating the model because it tests the skewness of the data. If the level of skewness of the sampled data were zero, then the dataset was assumed to have a normal distribution. These tests assessed and ensured that the collected data did not violate key assumptions of linear regression model (Wang 2013).

4. Results

The section is structured as follows: descriptive statistics, results of the hypotheses testing and discussion of results.

4.1. Descriptive Statistics

As indicated in Table 4, the mean value for ROE was 0.0254313 with a standard deviation of 0.2514351 and minimum and maximum values of −0.5670951 and 1.156945, respectively. The negative minimum value observation for ROE reflects that some companies were operating at a loss.

4.2. Hypotheses Testing Results

The three hypotheses were analyzed using panel multiple regression to establish the statistical significance at 95 percent confidence level (α = 0.05).
The outcome in Table 5 showed that F statistics value was 78.57 with a p-value of 0.0000 which is less than 0.05. This indicated that financial risks indicators had significant effects on return on equity of commercial and services listed companies in Nairobi Securities Exchange in Kenya.
Theorem 1.
Credit risks have no significant effect on the performance of commercial and services companies on NSE, Kenya.
Proof of Theorem 1.
In Table 5 the coefficient of credit risk is 0.5807289 and is statistically insignificant with p-value of 0.123 which is greater than 0.05. This shows a positive statistically insignificant effect between credit risk and return on equity. The null hypothesis that credit risk had no significant effect on return on equity of commercial and services companies on NSE in Kenya was not rejected at 5% level of significance. □
Theorem 2.
Liquidity risks have no significant effect on the performance of commercial and services companies on NSE, Kenya.
Proof of Theorem 2.
Table 5 indicates that coefficient of liquidity risk is −0.112057 and is statistically significant with p-value of 0.000 which is less than 0.05. The findings showed that there was a significant negative effect of liquidity risk on return on equity of commercial and service companies listed on NSE in Kenya. Therefore, the null hypothesis that liquidity risk has no significant effect on return on asset of commercial and services companies on NSE in Kenya was rejected at 5% level of significance. □
Theorem 3.
Operational risks have no significant effect on the performance of commercial and services companies on NSE, Kenya.
Proof of Theorem 3.
From Table 5, the coefficient of operational risk was (β = 0.5542459, p = 0.251 > 0.05). The results showed that there was a positive statistically in-significant effect of operational risk on return on equity of commercial and services companies on NSE in Kenya. Therefore, the null hypothesis that operational risk had no significant effect on return on equity of commercial and services companies on NSE in Kenya. It was not rejected at five per cent level of significance. The finding on operational risk implied that an increase in operational risk lead to an increase in the performance of the firms’ as per ROE measure. □

5. Discussion

The declining trend of performance in commercial and services listed companies between the years 2013 and 2017 triggered the desire for the researcher to undertake this study. The study aimed to investigate the effects of financial risks specifically operational, liquidity and credit risks on performance of commercial and services companies listed on the Nairobi Securities Exchange.
First, the study sought to evaluate the influence of credit risk on the performance of commercial and ser-vices companies on NSE, Kenya. The study findings showed that credit risk had a positive insignificant effect on ROE. The null hypothesis that credit risk had no significant effect on return on equity of commercial and services companies on NSE was not rejected at 5% level of significance. The results were consistent with Mutua (2016) who investigated effect of credit risk management on Savings and credit cooperatives in Kenya and found that credit risk had a positive correlation between financial performance as measured by ROE.
The study’s second objective sought to establish the influence of liquidity risks on the performance of commercial and services companies on NSE, Kenya. The study findings showed that liquidity risk had a negative and significant effect on ROE. The negative coefficient shows that commercial and service companies at NSE within the period under study experienced high liquidity problems in that the current liabilities at several levels within the years exceeded the current assets, thus being unable to pay all their obligation when they were due. This may have resulted in the reduction in return on equity of the companies. The negative coefficient shows that CAS firms at NSE within the period under study experienced high liquidity problems in that the current liabilities at several levels within the years exceeded the current assets, thus being unable to pay all their obligation when they were due. This may have resulted in the reduction in return on equity of the companies. Therefore, sub null hypothesis that liquidity risk did not significantly affect return on asset of commercial and services firms on NSE in Kenya was rejected at 5% level of significance. The results are in line with (Wani and Ahmad 2013; Kamau and Njeru 2016) who found that liquidity risk had significantly negative effects on return on asset and return on equity.
The third objective of the study was to determine the influence of operational risks on the performance of commercial and services companies on NSE, Kenya. Operational risk had a positive insignificant effect on performance indicators, namely return on equity. Meaning any changes to the cost-to-income ratios affecting the generated revenues of the companies. The null hypothesis assumed operational risk did not significantly affect return on equity of commercial and services companies on NSE in Kenya. The results concluded that at five per cent level of significance, the null hypothesis was not rejected. This further implied that an increase in operational risk had a positive effect on the performance of the firms’ as per ROE measure. However, the findings are inconsistent with Mathuva (2009) whose study found out that operational risk is inversely related with return on equity

6. Conclusions

The study concluded that, for companies to generate more revenues, they needed to manage their financial risks as proxied by ratios. Operational risk that was proxied by cost to income ratio indicated that higher cost-to-income ratios implied that companies were not efficient in controlling costs. They therefore needed to implement cost cutting initiatives to manage expenses. Increased cost-to-income ratios should be an immediate indicator to firms of emerging problems in the cash flow. The study noticed that liquidity proxied by current ratio negatively influenced performance of commercial and services listed companies on NSE in Kenya. The negative coefficients of liquidity risk showed these companies experienced high liquidity problems in that their current liabilities exceeded the current assets. Thus, concluding that these companies were unable to pay all their obligation when they were due. This would adversely affect the company’s performance.
Based on the research results, credit risk, liquidity and operational risks are critical, and companies need to pay attention to them. Companies engaging in risk projects can either lose or gain. Informed decisions need to be adhered to in such scenarios. Consequently, managers of companies need to come up with strategies capable of managing these by taking into consideration return on shareholder’s equity when dealing with firms’ performance of the company. The study also recommends that policy makers and regulators review the external effects of systematic risk on firms’ performance.
For future research studies, further considerations can be made on how financial risk affects other non-financial performance metrics when evaluating the effectiveness of a company’s performance, management and operations.

Author Contributions

Conceptualization, S.K.O., S.M.A.M. and L.W.M.; methodology, S.K.O. and S.M.A.M.; software, S.K.O.; validation, S.K.O., S.M.A.M. and L.W.M.; formal analysis, S.K.O., S.M.A.M. and L.W.M.; investigation, S.K.O.; resources, S.K.O.; data curation, S.K.O.; writing—original draft preparation, S.O writing—review and editing, S.K.O., S.M.A.M. and L.W.M.; visualization, S.K.O.; supervision, S.M.A.M. and L.W.M.; project administration, S.K.O.; funding acquisition, S.K.O. All authors have read and agreed to the published version of the manuscript.

Funding

This research received no external funding.

Acknowledgments

My sincere gratitude goes to my husband David, our children Jesse, Jonathan and Mwajuma, my parents Christopher and Lucybella and siblings Walter and Nancy Onsongo; your support in kind has contributed to the success of this study.

Conflicts of Interest

The authors declare no conflicts of interest.

References

  1. Agarwal, Anuj. 2011. Credit risk Management: Trends and Opportunities. Available online: http://www.capgemini.com/resources/credit-risk-management-trends-and-opportunities/ (accessed on 26 May 2017).
  2. Aglionby, John. 2016. Kenya Airways records country’s worst ever loss. The Financial Times. Available online: https://www.ft.com (accessed on 26 May 2017).
  3. Agustina, Linda, and Niswah Baroroh. 2016. The Relationship Between Enterprise Risk Management (ERM) and Firm Value Mediated Through the Financial Performance. Integrative Business and Economics Research 5: 128–38. [Google Scholar]
  4. Aiken, Leona S., Stephen G. West, and Raymond R. Reno. 1991. Multiple Regression: Testing and Interpreting Interactions. Newbury Park: Sage. [Google Scholar]
  5. Akerlof, George. 1970. The Market for “lemons”: Quality Uncertainty and the Market Mechanism. The Quarterly Journal of Economics 84: 488–500. [Google Scholar] [CrossRef]
  6. Andrade, Galdino, and Steven N. Kaplan. 1997. How Costly is Financial (Not Economic) Distress? Evidence from Highly Leveraged Transactions that Became Distressed. The Journal of Finance 53: 33–43. [Google Scholar]
  7. Arif, Ahmad, and Ahmad Showket. 2015. Relationship between financial risk and financial performance: An Insight of Indian Insurance Industry. International Journal of Science and Research 4: 1424–33. [Google Scholar]
  8. Armstrong, John. 2017. What Is a Commercial Company? Main Characteristics. Available online: https://www.lifepersona.com/what-is-a-commercial-company-main-characteristics (accessed on 20 January 2018).
  9. Auronen, Lauri. 2003. Asymmetric Information: Theory and Applications. Seminar of Strategy and International Business 116: 45–56. [Google Scholar]
  10. Bandalos, Deborah L. 2018. Measurement Theory and Applications for the Social Sciences. New York: The Guilford Press. [Google Scholar]
  11. Bansal, Arun, Robert Kaufmann, Robert Mark, and Edward Peters. 1992. Financial Risk and Financial Risk Management Technology: Issues and Advantages. Working Papers Series; New York: New York University. [Google Scholar]
  12. Bwire, E. 2015. Why Uchumi Collapsed and What Lessons We Can Learn from It. Available online: https://www.linkedin.com/pulse/why-uchumi-collapsed-what-les-sons-we-can-learn-from-egesa-bwire/ (accessed on 29 January 2017).
  13. Capgemini and Merrill Lynch Global Wealth Management. 2009. Firms Can Act to Rebuild Shaken Investor Confidence Through more Holistic Risk Management. World Wealth Report 1: 27–29. [Google Scholar]
  14. CMA (Capital Markets Authority). 2016. Capital Markets Soundness Report (Kenya): Mar-ket Resilience in a Persistent Bear Run. Available online: https://www.cma.or.ke (accessed on 12 May 2017).
  15. Collier, Paul M., and Sam Agyei-Ampomah. 2006. Management Accounting: Risk and Control Strategy. Oxford: Elsevier. [Google Scholar]
  16. Dey, Ripon Kumar, Syed Zabid Hossain, and Zabihollah Rezaee. 2018. Financial Risk Disclosure and Financial Attributes among Publicly Traded Manufacturing Companies: Evidence from Bangladesh. Journal of Risk and Financial Management 11: 50. [Google Scholar] [CrossRef] [Green Version]
  17. Elder, Jim. 2016. Emerging Credit Risks in 2016. Available online: https://www.spglobal.com/marketintelligence/en/news-insights/blog/emerging-credit-risks-in-2016 (accessed on 21 June 2017).
  18. Erasmus, Petrus Daniel. 2008. Evaluating Value Based Financial Performance Measures. Journal of Finance 6: 93–117. [Google Scholar]
  19. Fali, Ibrahim, Terzungwe Nyor, and Olumide Lateef Mustapha. 2020. Financial Risk and Financial Performance of listed Insurance Companies in Nigeria. European Journal of Business and Management 12: 143–53. [Google Scholar]
  20. Fama, Eugene. 1980. Agency Problems and the Theory of the Firm. Journal of Political Economy 88: 288–307. [Google Scholar] [CrossRef]
  21. Gentry, James, and John Pike. 1970. An Empirical Study of the Risk-Return Hypothesis Using Common Stock Portfolios of Life Insurance Companies. The Journal of Financial and Quantitative Analysis 5: 179–85. [Google Scholar] [CrossRef]
  22. Grant, Cynthia, and Azadeh Osanloo. 2014. Understanding, selecting, and integrating a theoretical framework in dissertation research: Creating the blueprint for your “house”. Administrative Issues Journal 4: 12–26. [Google Scholar] [CrossRef] [Green Version]
  23. Gujarati, Damodar. 2003. Basic Econometrics, 4th ed. New York: McGraw Hill. [Google Scholar]
  24. Harvey, Jasmin. 2008. Financial Risk Management, 47th ed. London: The Chartered Institute of Management Accountants. [Google Scholar]
  25. Holton, Glyn A. 2004. Defining risk. Financial Analysts Journal 60: 19–25. [Google Scholar] [CrossRef] [Green Version]
  26. Isiaka, Lasisi Olalekan. 2018. Effect of Liquidity Risk, Premium Growth on the Performance of Quoted Insurance Firms in Nigeria: A Panel Data Analysis. American Finance & Banking Review 2: 40–89. [Google Scholar]
  27. Jensen, Michael C., and William H. Meckling. 1976. Theory of the Firm: Managerial Behavior, Agency Costs and Ownership Structure. Journal of Financial Economics 3: 305–60. [Google Scholar] [CrossRef]
  28. Kamau, Faith, and Agnes Njeru. 2016. Effect of Liquidity Risk on Financial Performance of liquidity risk has no significant effect on return on asset. International Journal of Science and Research 5: 867–72. [Google Scholar]
  29. Kangethe, Kennedy. 2015. Atlas Development Closes its Kenyan Subsidiaries. Available online: https://www.capitalfm.co.ke/business (accessed on 26 November 2018).
  30. Kaplan, Steven N., and Jeremy C. Stein. 1993. The Evolution of Buyout Pricing and Financial Structure in the 1980s. Quarterly Journal of Economics 108: 313–57. [Google Scholar] [CrossRef]
  31. Kenya Airways. 2016. Annual Report & Financial Statements. Available online: https://www.kenya-airways.com (accessed on 26 November 2018).
  32. Kihooto, Elijah, Job Omagwa, Muturi Wachira, and Ronald Emojong. 2016. Financial Distress in Commercial and Services Companies Listed at Nairobi Securities Exchange, Kenya. European Journal of Business and Management 8: 27–48. [Google Scholar]
  33. Kinyua, John K., Roselyn Gakure, Mouni Gekara, and George Orwa. 2015. Effect of Risk Management on The Financial Performance Of Companies Quoted In The Nairobi Securities Exchange. International Journal of Business & Law Research 3: 26–42. [Google Scholar]
  34. KPMG. 2018. Retail Trends. Available online: https://home.kpmg.com/xx/en/home/insights/2018/03/2018-retail-trends.html (accessed on 3 January 2019).
  35. Longhorn Publishers. 2018. Investors Segment. Available online: https://longhornpublishers.com/ke/ (accessed on 28 December 2018).
  36. Maigua, Cecilia, and Gekara Mouni. 2016. Influence of Interest Rates Determinants on the Performance of Commercial Banks in Kenya. International Journal of Academic Research in Accounting, Finance and Management Sciences 6: 121–33. [Google Scholar] [CrossRef]
  37. Mathuva, David. M. 2009. Capital adequacy, cost income ratio and the performance of commercial banks: The Kenyan Scenario. The International Journal of Applied Economics and Finance 3: 35–47. [Google Scholar] [CrossRef] [Green Version]
  38. Muathe, Stephen. M. A. 2010. The Determinants of Adoption of Information and Com-munication Technology by Small and Medium Enterprises within the Health Sector in Nairobi, Kenya. Ph.D. dissertation, Kenyatta University, Nairobi, Kenya. [Google Scholar]
  39. Mugenda, Olive M., and Abel G. Mugenda. 2003. Research Methods: Quantitative and Qualitative Approaches. Nairobi: Acts Press. [Google Scholar]
  40. Munda, Constant. 2017. Hutchings Biemer and A. Baumann delisted from Nairobi bourse. Business Daily. Available online: https://www.businessdailyafrica.com (accessed on 28 November 2018).
  41. Muriithi, Jane Gathiga. 2016. The Effect of Financial Risk on Financial Performance of Commercial Banks in Kenya. Ph.D. dissertation, Jomo Kenyatta University of Agriculture and Technology, Juja, Kenya. [Google Scholar]
  42. Musau, Salome Mwongeli. 2018. Financial Inclusion and Stability of Commercial Banks In Kenya. Ph.D. dissertation, Kenyatta University, Nairobi, Kenya. [Google Scholar]
  43. Mutegi, Mugambi. 2017. Seven NSE-listed firms issue profit warnings on politicking. Business Daily. Available online: https://www.businessdailyafrica.com (accessed on 28 December 2018).
  44. Mutua, Rosemary Kasyoka. 2016. Impact of Credit risk Management on Financial Performance of Savings and Credit Co-Operative Societies in Kitui County. Master’s thesis, South Eastern Kenya University, Kitui, Kenya. [Google Scholar]
  45. Mwangi, Lucy Wamugo, Muathe Stephen Makau, and George Kosimbei. 2014. Relationship between Capital Structure and Performance of Nonfinancial Companies Listed in the Nairobi Securities Exchange, Kenya. Global Journal of Contemporary Research in Accounting, Auditing and Business Ethics 1: 72–90. [Google Scholar]
  46. NSE. 2013. Nairobi Securities Exchange Handbook 2012–2013. Available online: https://www.nse.co.ke (accessed on 13 July 2018).
  47. NSE. 2014. Nairobi Securities Exchange Handbook 2013–2014. Available online: https://www.nse.co.ke (accessed on 13 July 2018).
  48. NSE. 2015. Nairobi Securities Exchange Handbook 2014–2015. Available online: https://www.nse.co.ke (accessed on 14 July 2018).
  49. NSE. 2016. Nairobi Securities Exchange Handbook 2015–2016. Available online: https://www.nse.co.ke (accessed on 17 July 2018).
  50. NSE. 2017. Listed Companies. Available online: https://www.nse.co.ke/listed-companies/list.html (accessed on 18 July 2018).
  51. Nyasaka, Fredrick. 2017. The Relationship between Credit Risk Management Practices and Non- Performing Loans in Kenyan Commercial Banks: A Case Study of KCB Group Limited. Master’s thesis, United States International University—Africa, Nairobi, Kenya. Unpublished. [Google Scholar]
  52. Okoth, Edwin, and Vincent Achuka. 2016. Concerns raised about overall health of Kenya’s economy. Daily Nation. Available online: https://www.nation.co.ke/ (accessed on 3 June 2017).
  53. Oliver, Barry Rose. 2001. Issues in Financial Risk Management in Australia. Ph.D. thesis, Australian National University, Canberra, Australia. [Google Scholar]
  54. Omasete, Catherine. 2014. The Effect of Risk Management on Financial Performance of Insurance Companies in Kenya. Master’s thesis, University of Nairobi, Nairobi, Kenya. Unpublished. [Google Scholar]
  55. Park, Hun Myoung. 2011. Practical Guides to Panel Data Modeling: A Step-by-step Analysis Using Stata. Tutorial Working Paper. Niigata: Graduate School of International Relations, International University of Japan. [Google Scholar]
  56. Pearson, Robin. 2002. Moral Hazard and the Assessment of the Insurance Risk in the Eighteenth and Early—Nineteenth-century Britain. Business History Review 76: 1–35. [Google Scholar] [CrossRef]
  57. Saunders, Mark, Philip Lewis, and Adrian Thornhill. 2009. Research Methods for Business Students. New York: Pearson. [Google Scholar]
  58. Sisay, Daniel. 2017. The Effect of Financial Risk on Performance of Insurance Companies in Ethiopia. Ph.D. thesis, Addis Ababa University, Addis Ababa, Ethiopia. Unpublished. [Google Scholar]
  59. Spence, Michael. 2002. Signaling in retrospect and the informational structure of markets. American Economic Review 92: 434–59. [Google Scholar] [CrossRef]
  60. Stulz, Rene. 1996. Rethinking Risk Management. Journal of Applied Corporate Finance 9: 8–24. [Google Scholar] [CrossRef]
  61. Wang, Baolian. 2013. The cash conversion cycle spread. Journal of Financial Economics 133: 472–97. [Google Scholar] [CrossRef]
  62. Wangalwa, Matayo, and Willy Muturi. 2018. Effect of Financial Risk on Financial Performance of Large-Scale Supermarkets in Nairobi County, Kenya. International Journal of Social Science and Technology 4: 574–91. [Google Scholar]
  63. Wani, Ahmad, and Showket Ahmad. 2013. The Effect of Hedging on Firm Value and Performance: Evidence from the Nonfinancial UK Firms. Hull: Hull University Business School. [Google Scholar]
  64. Were, Simon. 2015. The Effect of Foreign Exchange Rate Risk Management Practices on Financial Performance of Multinational Corporations in Kenya. Master’s thesis, University of Nairobi, Nairobi, Kenya. [Google Scholar]
  65. Whitaker, Richard. B. 1999. The Early Stages of Financial Distress. Journal of Economics and Finance 23: 123–33. [Google Scholar] [CrossRef]
  66. Witkin, Belle Ruth, and James W. Altschuld. 1996. Planning and Conducting Need Assessments: A Practical Guide. New York: Sage Publications, Inc., 302p, ISBN 0-8039-5809-9. First published 1995. [Google Scholar] [CrossRef]
  67. Woods, Margaret, and Kevin Dowd. 2008. Financial Risk Management for Management Accountants. Oxford: Elsevier. [Google Scholar]
  68. Wooldridge, Jeffrey M. 2010. Econometric Analysis of Cross Section and Panel Data. Cambridge: MIT Press. [Google Scholar]
  69. Wruck, Karen Hopper. 1990. Financial distress, reorganization, and organizational efficiency. Journal of Financial Economics 27: 419–44. [Google Scholar] [CrossRef]
  70. Yan, Qicheng, and Chen Wei. 2017. Jack Ma & Alibaba: A Business and Life Biography. Shanghai: LID Publishing. [Google Scholar]
Figure 1. Conceptual framework.
Ijfs 08 00051 g001
Table 1. Listed sectors that issued profit warnings from 2013 to 2017.
Sector\Year20132014201520162017
Agricultural 18% 27%
Automobiles & accessories 9%6%
Banking14% 6%9%25%
Commercial & services43%55%39%18%25%
Construction & allied 9%17% 8%
Energy & petroleum14%
Insurance 17%18%8%
Investment 6%9%
Investment services 9%
Manufacturing & allied29%9%11%9%33%
Telecommunication & technology
Real estate investment trust
Exchange traded fund
Total firms issuing profit warnings per year711181112
Source: Nairobi Securities handbooks covering the financial years 2013 to 2018. Various companies have different financial year-ends, i.e., March, June, September and December.
Table 2. Distribution of target population.
CompanyBusiness
1Atlas Development and Support servicesLogistics
2Deacons (East Africa) PlcConsumer goods
3Eveready East Africa LimitedPower solutions
4Express LimitedLogistics
5Hutchings Biemer LimitedFurniture
6Kenya Airways LimitedTransport
7Longhorn Publishers LimitedPublishing
8Nairobi Business Ventures LimitedConsumer goods
9Nation Media GroupMedia
10Sameer Africa LimitedTires
11Standard Group LimitedMedia
12TPS Eastern Africa (Serena) LimitedHospitality
13Uchumi Supermarket LimitedConsumer goods
14WPP Scangroup LimitedMarketing
Source: NSE (2017).
Table 3. Study data.
CompanyYearROECredit RiskLiquidity RiskOperational Risk
120130.4023424280.7304409150.36903612653.78240048
120140.3692220290.6575541190.5207873740.31125172
120150.3857710920.6644354840.50503701848.03727018
120160.3184077540.5576627680.7931984350.60535204
120170.424811220.6188335640.615943377449.4766839
220130.1482354280.4903339861.0394262462.52400779
220140.1476796420.5383174350.8576400012.753707269
220150.2108045870.4310696491.3198107342.418759701
220160.1297990360.4713113551.1217396711.152987134
220170.0176730870.4623887781.1626822420.430164698
320130.4351481180.7203124730.388286387234.4509804
320140.4133164540.7340823660.362244956312.4137931
320150.3153109890.7051989890.41803947340.1445783
320160.2826643990.7148700930.3988555541171.428571
320170.2453794570.7826597660.3394065971169
420130.1258413790.6372199590.56931682151.80165619
420140.1067911050.6430716740.55503661639.26812156
420150.1017253080.6900809630.44910532743.72856715
420160.0824105740.6531498630.53104219662.86697844
420170.0776800070.6515896020.534708344400.9291883
520130.0882181440.6793325050.4720331995.485090315
520140.0751392870.7469945320.3386978854.731330467
520150.0569408380.6123845140.6329609531.549113074
520160.1028307520.5632430210.7754325625.342617537
520170.0284514830.6175550190.6192891381.890005146
620130.3757962610.5632924050.77527691911.9937107
620140.3389804750.5771241860.732844446189.7242268
620150.2547886580.5518162830.81219734111.53349994
620160.1469838020.5075497710.9702501255.570634349
620170.1894320220.5087903920.9654459213.409141944
72013−0.3468871160.254360372.931430036−5.676979549
72014−0.1721988030.1903643964.263629601−2.005363036
720154.982726815−0.032752399−31.53211471−6.276299113
720160.731740825−0.225149134−5.441500547−3.703561799
720170.227140154−0.307333862−4.431904709−1.380140693
820130.1518836110.4203825241.378785851.432592169
82014−1.135263180.2348920553.257274687−4.390931785
82015−0.2364946540.5116895770.954309886−3.210953508
82016−0.4500039050.4493676611.225349276−3.025674331
820170.4534903620.7110186730.40643282325.58987264
92013−0.0085408810.4131231581.420585681−0.211573149
92014−0.4241513730.4078037951.452159623−5.398431139
92015−0.6304888850.2513362292.978733997−4.503713639
92016−4.7898885280.06128507615.3171862−6.639507143
9201710.80163809−0.009244429−109.173254−5.280334827
1020130.1660969460.5248756940.90521300930.25164986
1020140.134854530.4876377171.0507027347.00416151
102015−4.7515253160.1173161127.523978332−10.46009278
1020161.273732381−0.419289571−3.384986581−41.3288521
1020170.491537747−0.782171992−2.426215729−4.953631638
Source: Study Data (2018).
Table 4. Descriptive statistics for the data used in the analysis.
VariableMeanStd. Deviation.MinMax
ROE0.02543130.251435−0.5670951.156945
Credit risk0.04348440.330613−0.7821720.782659
Liquidity risk−1.82756916.39814−109.173315.31719
Operational risk0.54757280.2477730.06837611.48148
Source: Study Data (2018).
Table 5. Regression results with return on equity (ROE).
ROECoefficientStandard Errorzp > |z|
Credit risk0.58072890.36953231.570.123
Liquidity risk−0.1120570.0074164−15.110.000
Operational risk0.55424590.47654941.160.251
_cons−0.5034490.3168256−1.590.119
F statistics = 78.57
Prob > chi2 = 0.0000
Source: Study Data (2018).

