Stock-Market Behavior on Ex-Dates: New Insights from German Stocks with Tax-Free Dividend

Finance and Banking, Friedrich-Alexander-Universität Erlangen-Nürnberg, 90403 Nürnberg, Germany
Int. J. Financial Stud. 2020, 8(3), 58; https://0-doi-org.brum.beds.ac.uk/10.3390/ijfs8030058
Submission received: 7 September 2020
/
Accepted: 16 September 2020
/
Published: 21 September 2020
Abstract
:We examine stock prices and the number of stocks traded around ex-dividend dates of German stocks with tax-free dividend. Tax-free dividends are temporarily tax-exempt, as they reduce the initial purchasing price of a stock. With our analysis of this particular group of German stocks, we can make clear predictions regarding ex-date prices and analyze the number of stocks traded around ex-dates, doing so without the systematic bias of cum-ex trades over time. For XETRA, our empirical results indicate that ex-date prices decline, on average, by the amount of the dividend. We do not find a significant relationship between a stock’s price-drop ratio and dividend yield. Further, the empirical analysis suggests that there is no significant correlation between an abnormal number of a stock being traded and its dividend yield. These results are most consistent with tax-motivated reasoning. However, our volume analysis reveals no consistency regarding the abnormal number of stocks traded for multilateral trading facilities.
Keywords:
dividend; ex-dividend date; price-drop ratio; abnormal return; abnormal volume; dividend taxation; payout policyJEL Classification:
G12; G14; G351. Introduction
The analysis of stock prices and trading volume on ex-dividend dates (hereafter ex-dates) is the subject of numerous articles in financial economics. Most studies provide evidence for positive abnormal returns. This means that stock prices on ex dates decline by less than the dividend payment. There are several theories on how to explain this discrepancy.
Tax clientele theories state that abnormal returns on ex-dates result from tax-motivated trading by investors. This would mean that the ex-date prices of stocks reflect tax-induced heterogeneity among long-term investors (Elton and Gruber 1970) or short-term traders (Michaely and Vila 1995). Elton and Gruber (1970) argue that the analysis of ex-date prices provides information about the marginal investor. They find that stockholders in higher tax brackets appear to prefer capital gains over dividend income compared to those in lower tax brackets. Michaely and Vila (1995) show that a stock’s drop in price—the fall from closing cum price to closing ex price—is a function of tax heterogeneity across traders and risk. They conclude that ex-date prices do not reflect the preference of a particular group of investors but rather result from the interaction between different investor groups trading around the ex-date. In short, tax clientele theories suggest that on average, the drop in stock prices should be less than the dividend payment if dividends are taxed more heavily than capital gains, and vice versa.
Kalay (1982, 1984) argues that short-term arbitrageurs eliminate dividend-related abnormal returns on ex-dates. A remaining discrepancy between ex-date price drop and dividend payment can be explained by transaction costs. However, this theory lacks an explanation for the fact that most studies provide evidence of price drops that are less than the dividend payment (Elton et al. 1984).
Another strand of literature links abnormal returns on ex-dates to market microstructure arguments. They seriously challenge the tax-motivated reasoning, since market microstructure arguments also hold in the absence of a discrepancy between dividend taxation and capital gains taxation. A price drop of less than the dividend payment may occur due to limit-order adjustments (Dubofsky 1992), discreteness in stock prices (Bali and Hite 1998) or due to bid ask bounces in stock prices (Frank and Jagannathan 1998).
In Germany, the behavior of the stock market around ex-dates of stocks with taxable dividend is most consistent with tax-motivated reasoning (e.g., (McDonald 2001; Lasfer 2008; Haesner and Schanz 2013)). But, analyses of the trading volume of German stocks may be considerably biased. Buettner et al. (2020) provide evidence that cum-ex trades, a specific type of transaction around ex-dates that caused substantial tax-revenue losses due to illegitimate tax refunds in Germany, led to abnormal trading volume in the two days prior to the ex-date. Since cum-ex trades are only profitable with taxable-dividend stocks, volume analyses of German stocks with taxable dividend are most likely biased if they include the years before 2012.
In our paper, we use German stocks with tax-free dividend payment between the years 2002 and 2019 as our empirical data sample. With our analysis, we shed light on a specific group of stocks often excluded in German dividend-related research (e.g., (Andres et al. 2013; Haesner and Schanz 2013)). Further, tax-free dividend payments allow us (i) to make clear predictions for ex-date stock prices and (ii) to analyze various explanations on abnormal trading volume around ex-dates without a systematic impact from cum-ex trades over time. A tax-free dividend is equivalent to a capital reduction. It reduces the initial purchasing price, thereby increasing the investor’s capital gains at the time of the stock sale. For all groups of German investors, tax-free dividends are thus temporarily tax-exempt and are eventually taxed with the capital gains tax rate. This makes cum-ex trades unprofitable (Buettner et al. 2020). Finally, since there are no tax clienteles in association with tax-free dividends, this study contributes to the ongoing discussion of alternative explanations for the behavior of stock markets around ex-dates.
Our empirical results show that on average, ex-date prices of German stocks with tax-free dividend decline by the amount of the dividend payment. This implies a price-drop ratio, i.e., the fall from closing cum price to closing ex price in relation to the dividend, of one. Our finding contrasts with the negative ex-date excess returns of US stocks with tax-free dividend found by Eades et al. (1984). However, our empirical results are consistent with our theoretical expectations. Further, we find no significant relationship between a stock’s price-drop ratio and dividend yield. Transaction costs appear to economically affect ex-date prices but cannot significantly explain the variation in the price-drop ratios. Our results are as expected. There are no tax clienteles and since there is no systematic discrepancy between ex-date prices and dividend payments, we find economic, but not statistically significant, indications for short-term trading around ex-dates. Hence, our findings strengthen tax-motivated reasoning.
Further, we argue that market microstructure arguments do not affect ex-date prices in Germany. Tick sizes of German stocks are sufficiently small and XETRA closing prices are determined by auctions, ruling out a systematic bias due to potential bid-ask bounces. Our additional analyses of bid and ask prices provide economically identical results. A systematic bid-ask bounce, as on the tax-free Hong Kong stock market (Frank and Jagannathan 1998), thus does not affect price-drop ratios in Germany.
We provide a comprehensive volume analysis across different trading venues. Our analysis covers XETRA, local exchanges, multilateral trading facilities as well as over-the-counter trading. Our results indicate an increased number of stocks traded around ex-dates at all trading venues in our sample. As we expect no tax-induced trading of German tax-free dividend stocks, we argue that there is no abnormal number of stocks traded due to tax clienteles. We see the annual general meeting as a valid explanation for the increased number of stocks traded for day t − 1 prior to the ex-date.
For XETRA, the most relevant trading venue in the sample, our results show no significant relationship between abnormal numbers of stocks traded and dividend yield or risk of a stock. This is in line with our predictions and indicates that there is no systematic trading around ex-dates supporting the tax clientele theory. However, we find evidence that investors appear to route their orders differently around ex-dates, since our volume analysis indicates heterogeneous findings regarding the abnormal number of stocks traded across trading venues.
Our paper proceeds as follows. Section 2 describes the tax and accounting background of tax-free dividend payments in Germany. Section 3 gives a short overview of the relevant literature and presents the theoretical predictions. Section 4 describes the data. The methodology and the empirical results for the price and volume analyses are discussed in Section 5 and Section 6. Finally, Section 7 concludes.
2. Tax and Accounting Background of Tax-Free Dividend Payments
In Germany, dividends are subject to a 26.375% withholding tax1 since 2009 (in the following FT-system). The shareholder receives the net dividend, which is the gross dividend less withholding tax.2 Capital gains are identically taxed. Between 2002 and 2008, the half-income system (hereafter HI-system) was applied, whereby 50% of dividend income and capital gains were taxed at personal tax rate. Nevertheless, for holding periods shorter than one year, capital gains and dividend payments faced equal taxation.
In general, a corporation’s dividend policy depends on decisions of the executive board. The proposal for the dividend payment is based on the annual financial statement that is in accordance with the German Commercial Code (HGB). The annual general meeting follows § 174 of the Companies Act (AktG) and decides on the appropriation of the accumulated profits, including the distributable profit for the dividend payment. The accumulated profits are based on the corporation’s net income and are calculated in accordance with § 158 (1) AktG.
Based on § 27 (1) of the Corporation Tax Act (KStG), every corporation with unlimited tax liability must disclose yearly all contributions not made to the nominal capital, in a tax contribution account. The tax contribution account is adjusted for contributions and disposals during the current fiscal year. As stated in § 27 (1) of the KStG, the distributable profit is the equity, according to the tax balance sheet, less the nominal capital and the balance of the tax contribution account (PNHR 2015).
In the case of a tax-free dividend, the distributable profit is not sufficient (zero) and funds are partially (fully) used from the tax contribution account. This is stated in the corporation’s official dividend announcement. Note, that the tax treatment of a dividend payment is a tax-specific evaluation. If the distributable profit is zero, even a dividend payment of a corporation with positive net income in the respective year can be tax free. Tax-free dividends are equivalent to capital reductions. They reduce the initial purchasing price of a stock, thereby increasing the investor’s capital gains at the time of the stock sale. Tax-free dividends are thus temporarily tax-exempt and are eventually taxed with the capital gains tax rate.3 Depending on the time of purchase and holding period, the investor either pays taxes on capital gains immediately, later or not at all. A fully taxable private German investor with a stock purchase before 1 January 2009 and a holding period longer than one year realizes capital gains without withholding tax. In this particular case, a tax-free dividend payment comes without later taxation. Different tax rules may apply for taxable German corporate and other (fully taxable) institutional investors, i.e., commercial and industrial firms, financial institutions and insurers. However, to our best knowledge, we are not aware of a relevant discrepancy in the consideration of a tax-free dividend payment in Germany.
3. Returns and Trading Volume on Ex-Dates—Taxes and Alternative Explanations
3.1. Taxes
The tax clientele theory (Elton and Gruber 1970) states that ex-date prices of stocks reflect tax-induced heterogeneity among long-term investors. Investors, facing higher taxation on dividends than on capital gains, try to maximize their after-tax wealth by trading around the ex-date. Elton and Gruber (1970) argue that the marginal investor can be derived by analyzing the behavior of stock prices on ex-dates. They indicate that stockholders in higher tax brackets seem to prefer capital gains over dividend income, as compared to those in lower tax brackets. The tax clientele theory suggests that a discrepancy between dividend taxation and capital gains taxation should be reflected in the prices on ex-dates. Thus the drop in stock prices should be less than the dividend payment if dividends are taxed more heavily than capital gains, and vice versa.
With the dynamic trading clientele theory, Michaely and Vila (1995) support the notion of tax effects on ex-date stock prices. They show that from a short-term perspective, a stock’s drop from closing cum price to closing ex price is a function of tax heterogeneity across traders and risk. They conclude that ex-date prices do not reflect the preference of a particular group of investors, as suggested by Elton and Gruber (1970), but rather result from the interaction between different investor groups trading around the ex-date. Further, they provide evidence that trading volume on the ex-date is positively related to tax heterogeneity across traders and dividend yield and negatively correlated to transaction costs4 and risk5.
Various studies about Germany provide evidence that the stock-market behavior around ex-dates of stocks with taxable dividend is most consistent with tax-motivated reasoning (McDonald 2001; Lasfer 2008; Haesner and Schanz 2013). Since 2002, there is no discrepancy between capital gains taxation and dividend taxation in Germany. However, Haesner and Schanz (2013) find increased trading activity around ex-dates after 2002. They conclude that their volume analysis might be affected by dividend stripping, when foreign investors sell a stock before the ex-date to domestic investors and purchase it after the ex-date to maximize their after-tax wealth. In fact, Buettner et al. (2020) provide evidence that cum-ex trades, a specific type of transaction around ex-dates, caused considerable tax-revenue losses due to illegitimate tax refunds in Germany, led to abnormal trading volume in the two days prior the ex-date between the years 2009 and 2011. As cum-ex trades are only profitable with taxable-dividend stocks, volume analyses of German stocks with taxable dividend are most likely biased if they include the years before 2012.6
German stocks with tax-free dividend are not suitable for cum-ex trades (Buettner et al. 2020). This rules out cum-ex trades having a systematic impact before 2012. Further, as outlined in Section 2 above, there is no discrepancy between dividend taxation and capital gains taxation, as tax-free dividends increase an investor’s capital gains at the time of the stock sale. Thus, taxation on dividend income equals taxation on capital gains for all different groups of investors.7 This allows us (i) to make clear predictions on ex-date stock prices and (ii) to analyze various explanations on abnormal trading volume around ex-dates without a systematic impact due to cum-ex trades over time.
Assuming the presence of tax effects on ex-date prices, Elton and Gruber (1970) show the following for the price-drop ratio (PDR):8
The PDR, i.e., the fall from closing cum price, , to closing ex price, , in relation to the dividend of a stock, , is equivalent to the relation between the tax rates on dividend income, , and capital gains, . Given , Equation (1) can be stated as
Thus, we expect a PDR of unity for German stocks with a tax-free dividend that is not affected by tax clienteles. Note, Equation (2) also holds for a fully taxable private German investor facing .
As we expect no tax-induced trading around ex-dates of German tax-free dividend stocks, we argue that there is no abnormal volume due to tax clienteles.
3.2. Alternative Explanations
Besides tax clienteles, there are other theories explaining abnormal returns and abnormal volume around ex-dates.
Kalay (1982, 1984) argues that short-term arbitrageurs eliminate dividend-related abnormal returns on ex-dates. He concludes that a remaining discrepancy between the ex-date price drop and the dividend payment can be explained by transaction costs eliminating potential arbitrage gains. For sufficiently large dividend payments, transaction costs would lead to price drops being randomly larger or smaller than the dividend payments. Hence, this theory fails to explain why most of the literature provides evidence for price drops of less than the dividend payment (Elton et al. 1984). Kalay (1982) further finds a positive correlation between a stock’s PDR and dividend yield, since higher dividends generally favor potential gains by short-term arbitrageurs. The trading activity of short-term arbitrageurs implies an increased trading volume around ex-dates.
In terms of German stocks with tax-free dividend, the presence of short-term arbitrage causes abnormal volume prior to and on the ex-date. There is no relevant discrepancy between ex-date prices and dividend payments, but transaction costs may differ across different investor groups. The various arbitrage prospects thus potentially lead to trading activity. A positive relationship between a stock’s abnormal volume and dividend yield indicates that short-term arbitrageurs have a potential impact on German stocks with tax-free dividend. Transaction costs lead to symmetrical boundaries of around one for ex-date PDRs. The random distribution of the price drop around the dividend payment results, on average, in a PDR of one.
Hartzmark and Solomon (2013) argue that abnormal returns and abnormal volume between announcement-date and ex-date of a stock’s dividend are most consistent with the price pressure of dividend-seeking investors. This may be due to catering reasons (e.g., (Baker and Wurgler 2004)) or because investors suffer from the free dividend fallacy (Hartzmark and Solomon 2019). Another reason could be dividend-juicing activities of mutual funds (Harris et al. 2015). Henry and Koski (2017) indicate that dividend-capture activities by institutional investors lead to abnormal volume around ex-dates. They show that institutional investors with trade execution skill can exploit positive abnormal returns on ex-dates. Further, Kreidl and Scholz (2020) provide evidence for significant abnormal returns of German stocks between their dividend announcement-date and ex-date during the years 2003 to 2017.
The existence of price pressure of dividend-seeking investors leads to positive abnormal returns and abnormal volume prior to ex-dates of stocks with tax-free dividend. In line with Hartzmark and Solomon (2013), we expect negative abnormal returns and abnormal volume after ex-dates. Their results also indicate a positive correlation between abnormal returns or abnormal volume and dividend yield.
Another strand of literature links abnormal returns on ex-dates to market microstructure arguments. Potential explanations are limit-order adjustments (Dubofsky 1992) or discreteness in stock prices (Bali and Hite 1998), when stock-price adjustments on the ex-date do not represent the full dividend payment. Another reason may be bid-ask bounces in stock prices, where the closing cum price is close to the bid price and the closing price on the ex-date is closer to the ask price (Frank and Jagannathan 1998). Market microstructure arguments seriously challenge tax-motivated reasoning, since they also hold in the absence of a discrepancy between dividend taxation and capital gains taxation.
We expect market microstructure arguments to have no impact on German stock prices on ex-dates. Closing prices on XETRA are, among others, determined by auctions9. Thus our closing prices are most likely not systematically biased toward bid or ask prices. Further, discreteness in stock prices is ruled out, since tick sizes of German stocks are smaller than the minimal dividend payment of 0.01 euros.
4. Data and Summary Statistics
We analyze prices and number of stocks traded around ex-dates of tax-free dividend stocks of the German CDAX index between January 2002 and September 2019. The CDAX is a composite index of all German stocks of the Prime Standard as well as General Standard market segments. Refinitiv EIKON is used as data provider. We obtain information on unadjusted dividend payments (in the following shortened to “dividend payments”), ex-dates and the tax status of the dividend payment.
We base stock prices on XETRA, which is the primary and most liquid trading platform in Germany, and gather total returns, unadjusted closing prices, unadjusted bid prices, unadjusted ask prices and free-float market capitalizations (in the following market capitalizations) for all individual stocks. Further, we obtain the total returns for the CDAX index.
We use the number of stocks traded for our volume analysis obtaining this from XETRA and from the local exchanges Frankfurt, Stuttgart, Munich, Hamburg, Hannover, Düsseldorf, Berlin, as well as Tradegate. Besides XETRA and the local exchanges, there are other liquid trading venues for German stocks. The Markets in Financial Instruments Directive (MiFID) defines, among others, multilateral trading facilities (MTFs) as trading venues.10 Following Gomber et al. (2016), the largest MTFs are CHI-X, BATS and Turquoise.11 We consider these three MTFs in our analysis for the years 2008 to 2019. Moreover, we take the number of stocks traded from over-the-counter (OTC) trading in Stuttgart and XETRA for the years 2014 to 2018.12
The initial data sample consists of 767 tax-free dividend payments. We exclude dividend payments without a valid ex-date. We further exclude special payments, except for those coinciding with the common dividend payments, in which case, we focus our analysis on events with tax-free payments of both the common dividend and the special payment. We trim13 our sample of dividend payments at the 1% as well as 99% level. In addition, we drop ex-dates with total returns of zero.
Table 1 provides summary statistics of our data sample. It comprises 128 individual stocks with a total of 456 tax-free dividend payments. The mean dividend per stock is 0.46 euros, implying a mean dividend yield, defined as the dividend payment in relation to the closing cum price, of 1.26%. We include risk as a control variable and follow Haesner and Schanz (2013) in defining risk as the volatility of a stock’s daily return divided by the volatility of the daily CDAX return. We use the days [−65, 65] relative to the ex-date as the basis for our estimation, omitting the days [−5, 5] to avoid biases due to potentially increased event-induced volatility. Further control variables in our sample are bid-ask spreads as well as market capitalization, used as a proxy for transaction costs. The mean bid-ask spread (spread) on ex-dates, specified as the difference between the closing ask price and closing bid price over the closing ask price, is 1.54%. The mean market capitalization is 2551 million euros.
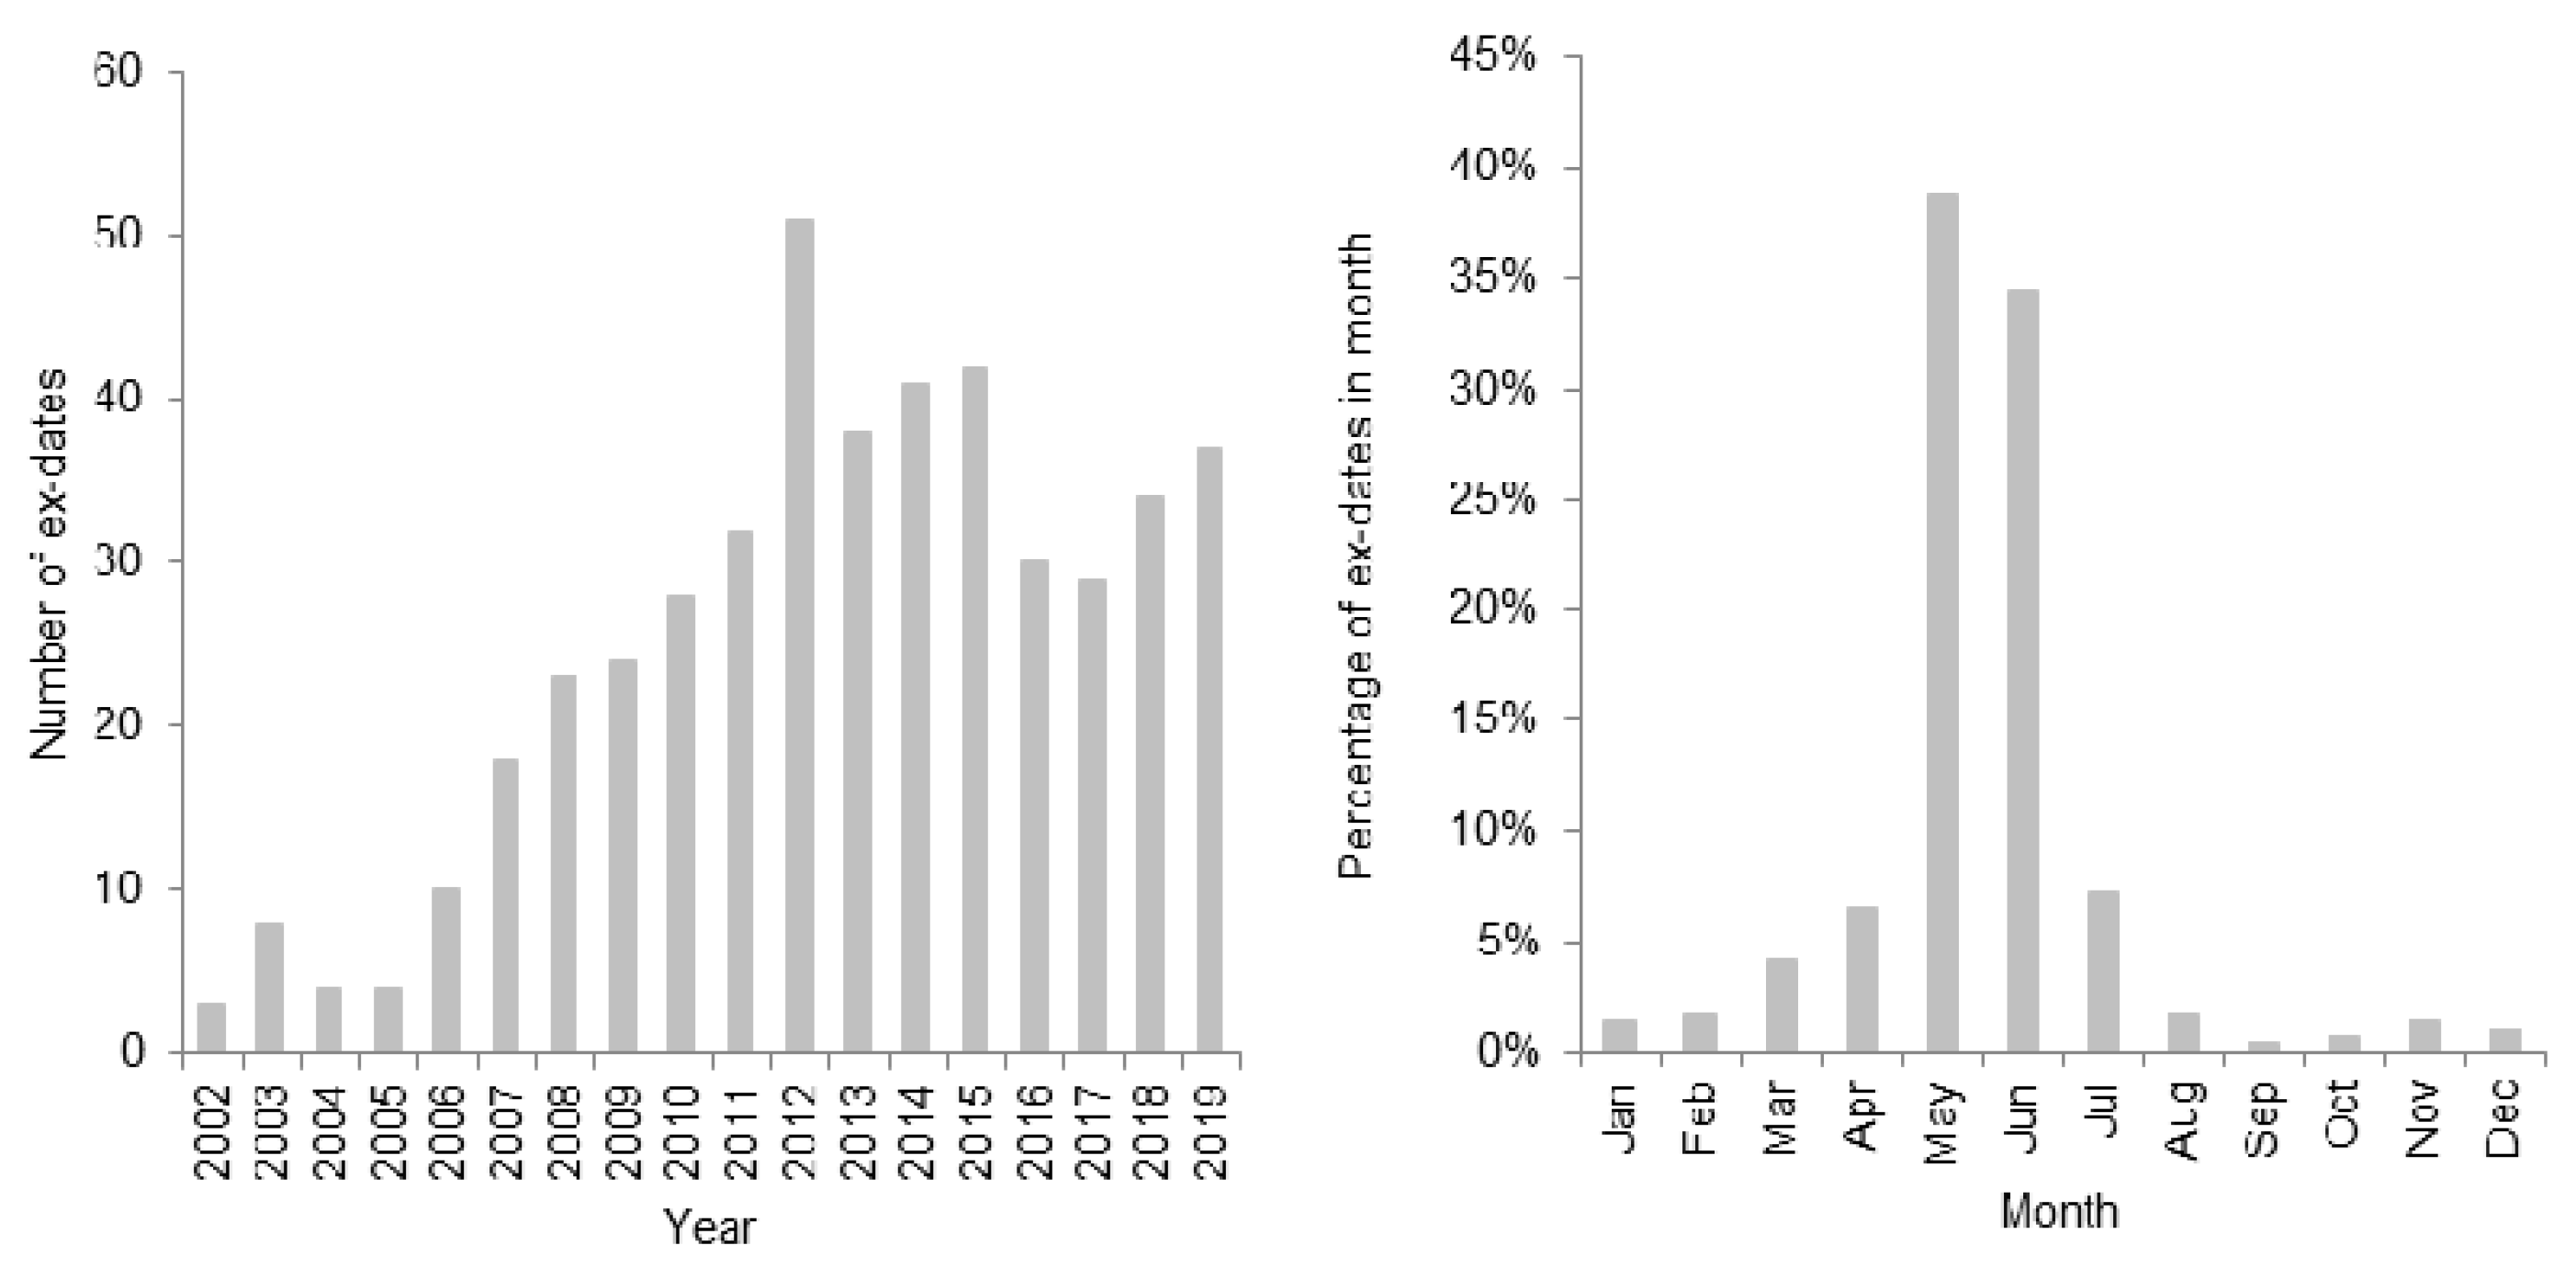
German corporations usually pay dividends once a year. Figure 1 illustrates the distribution of ex-dates with tax-free dividend payments between January 2002 and September 2019. The left graph shows the number of ex-dates over time, the right graph reports the average distribution of ex-dates within a year. The number of ex-dates increases over time, with three in 2002 and 37 in 2019. Within a year, the ex-dates of German stocks with tax-free dividend are especially clustered in the months of May and June.
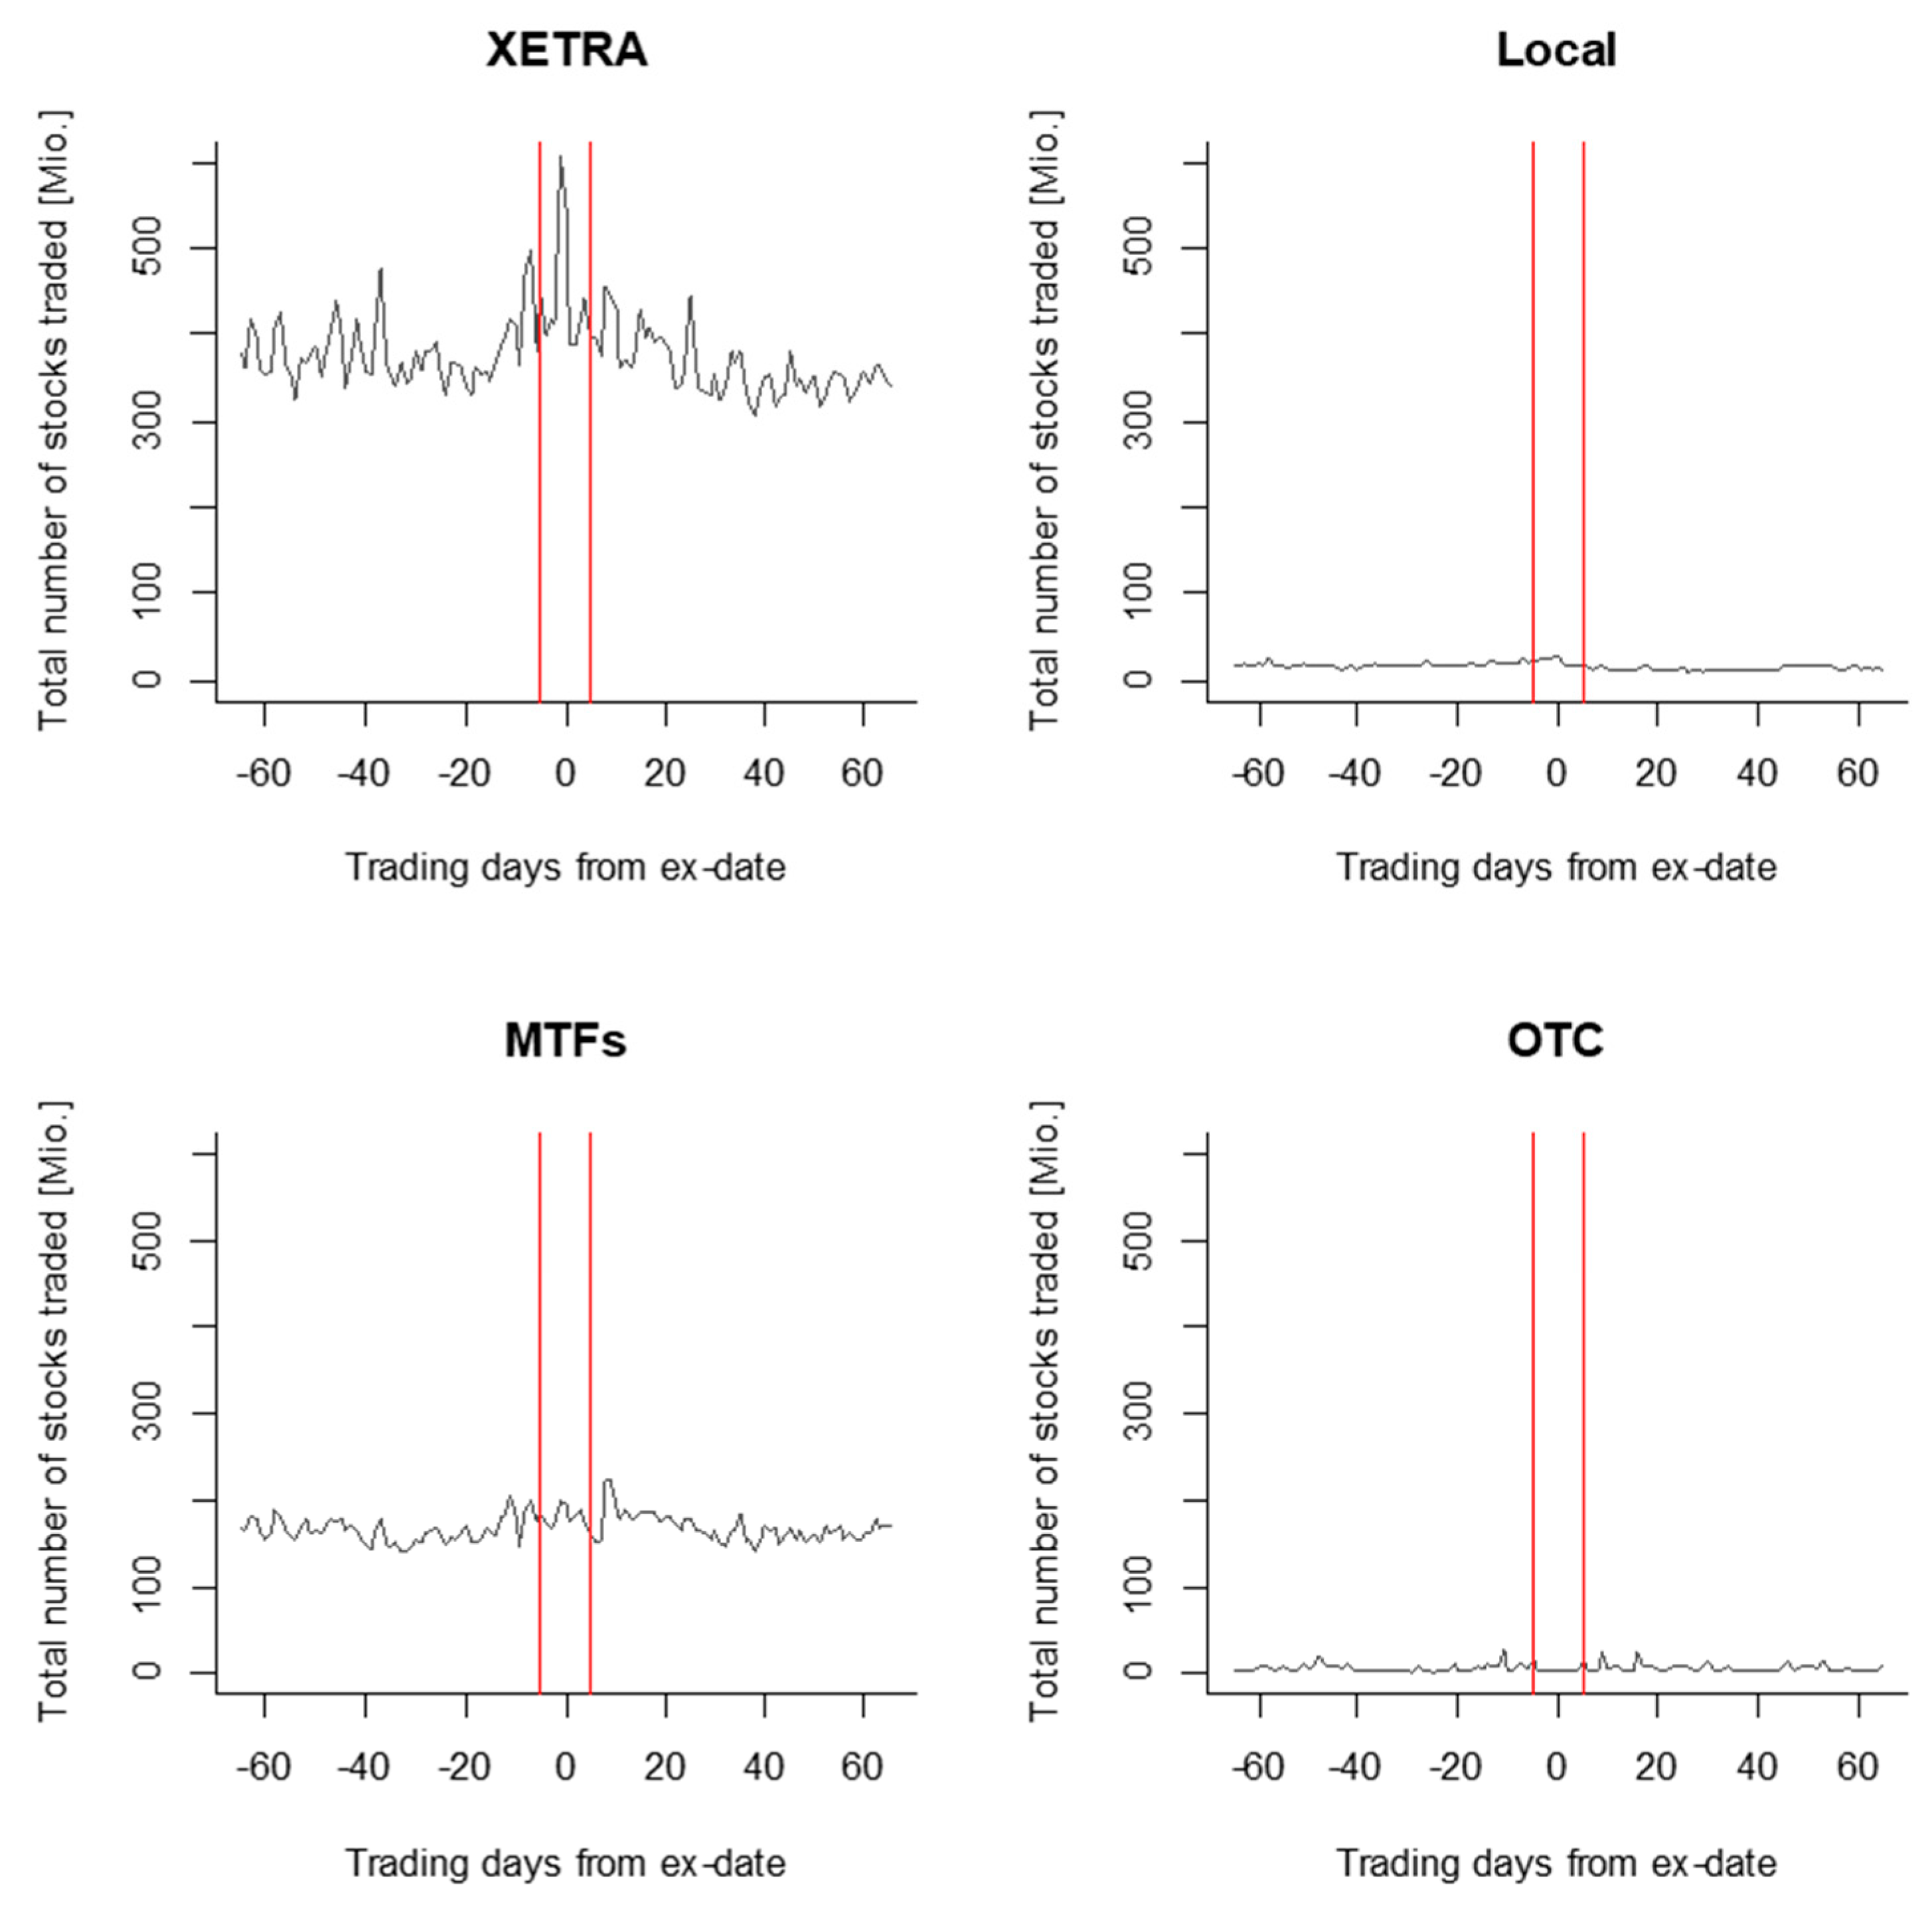
Figure 2 shows the total number of stocks traded for the days [−65, 65] relative to the ex-date. It shows the results for the venues XETRA (upper left), the sum over all local exchanges (Local) Frankfurt, Stuttgart, Munich, Hamburg, Hannover, Düsseldorf, Berlin and Tradegate (upper right), the sum over the multilateral trading facilities (MTFs) CHI-X, BATS and Turquoise (lower left) and the aggregated total number of stocks in the over-the-counter (OTC) trading in Stuttgart and XETRA (lower right). This figure illustrates the relevance of XETRA and the MTFs as trading venues for German stocks with tax-free dividend. Since MiFID became effective, MTFs gained a significant market share. Only a small fraction of the overall trading activity in our sample is executed via the eight local exchanges and OTC trading. Gomber (2016) provides comparable ratios for German DAX 30 stocks.
5. Price Analysis
5.1. Methodology
We analyze the PDR on the ex-date and daily abnormal returns for the days [−5, 5] relative to the ex-date to get a more holistic view. As common in the literature, we use closing prices for every event i, and adjust a stock’s price drop on the ex-date by its expected return. The applied methodology follows Elton et al. (2005). The PDR is estimated following Boyd and Jagannathan (1994) and McDonald (2001), as stated in the following:
In an OLS analysis, we regress the adjusted drop from closing cum price, , to closing ex price, , on the dividend, , of a stock. The slope coefficient states the PDR. We follow MacKinlay (1997) and use a market model specification with a 120-day window to estimate the expected return of a stock for the ex-date t, . To estimate and , we regress a stock’s daily total returns on daily CDAX total returns over the days [−65, −6] and [6, 65] relative to the ex-date. is based on three market betas (lagged, matching and leading) and is eventually aggregated to arrive at a consistent for each stock (Dimson 1979). is calculated as follows:
where is the realized market return for the ex-date t.
We set an 11-day event window around ex-dates, which represents the date itself plus five days before and five after an ex-date. We use Equation (5) to estimate the abnormal return of a stock for day t in the event window, , defined as the return for day t, , minus the respective expected return.
We calculate the mean over all N stocks to get the average abnormal return, .
For the , we apply t-statistics by Kolari and Pynnönen (2010) to account for possible event-induced volatility and cross-sectional correlation. These are two-sided tests with expected value of zero.
To obtain a deeper understanding of the price behavior on ex-dates, we analyze the PDR in an additional regression analysis as shown in the following:
We regress the , defined as the adjusted14 price drop from closing cum price to closing ex price over the dividend payment, on the following explanatory variables. We take dividend yield, , as the dividend payment over the closing cum price, and use , as the volatility of a stock’s daily return divided by the volatility of the CDAX daily return over the estimation period. Further we take the ex-date bid-ask spread, , as well as the natural logarithm of the market capitalization, , of a stock. Pooled OLS and panel regression with random effects are applied to estimate Equation (7).
5.2. Results
This section presents the results of our price analysis. As outlined in Section 3.1, we expect a PDR of unity for German stocks with tax-free dividend over the whole sample period. Table 2 presents the PDR estimates following Equation (3). The slope coefficient of the dividend payment, D, states the PDR on ex-dates. We find significant point estimates of 0.8698 for the full sample between 2002 and September 2019. Further, we find significant point estimates of 0.7937 between 2002 and 2008 (HI-system) and 0.9166 between 2009 and September 2019 (FT-system). The small number of observations over the years 2002 to 2008 reduces the validity of the result for the HI-system. However, the t-statistics at the bottom of Table 2 make clear that none of the three point estimates is significantly different to one.
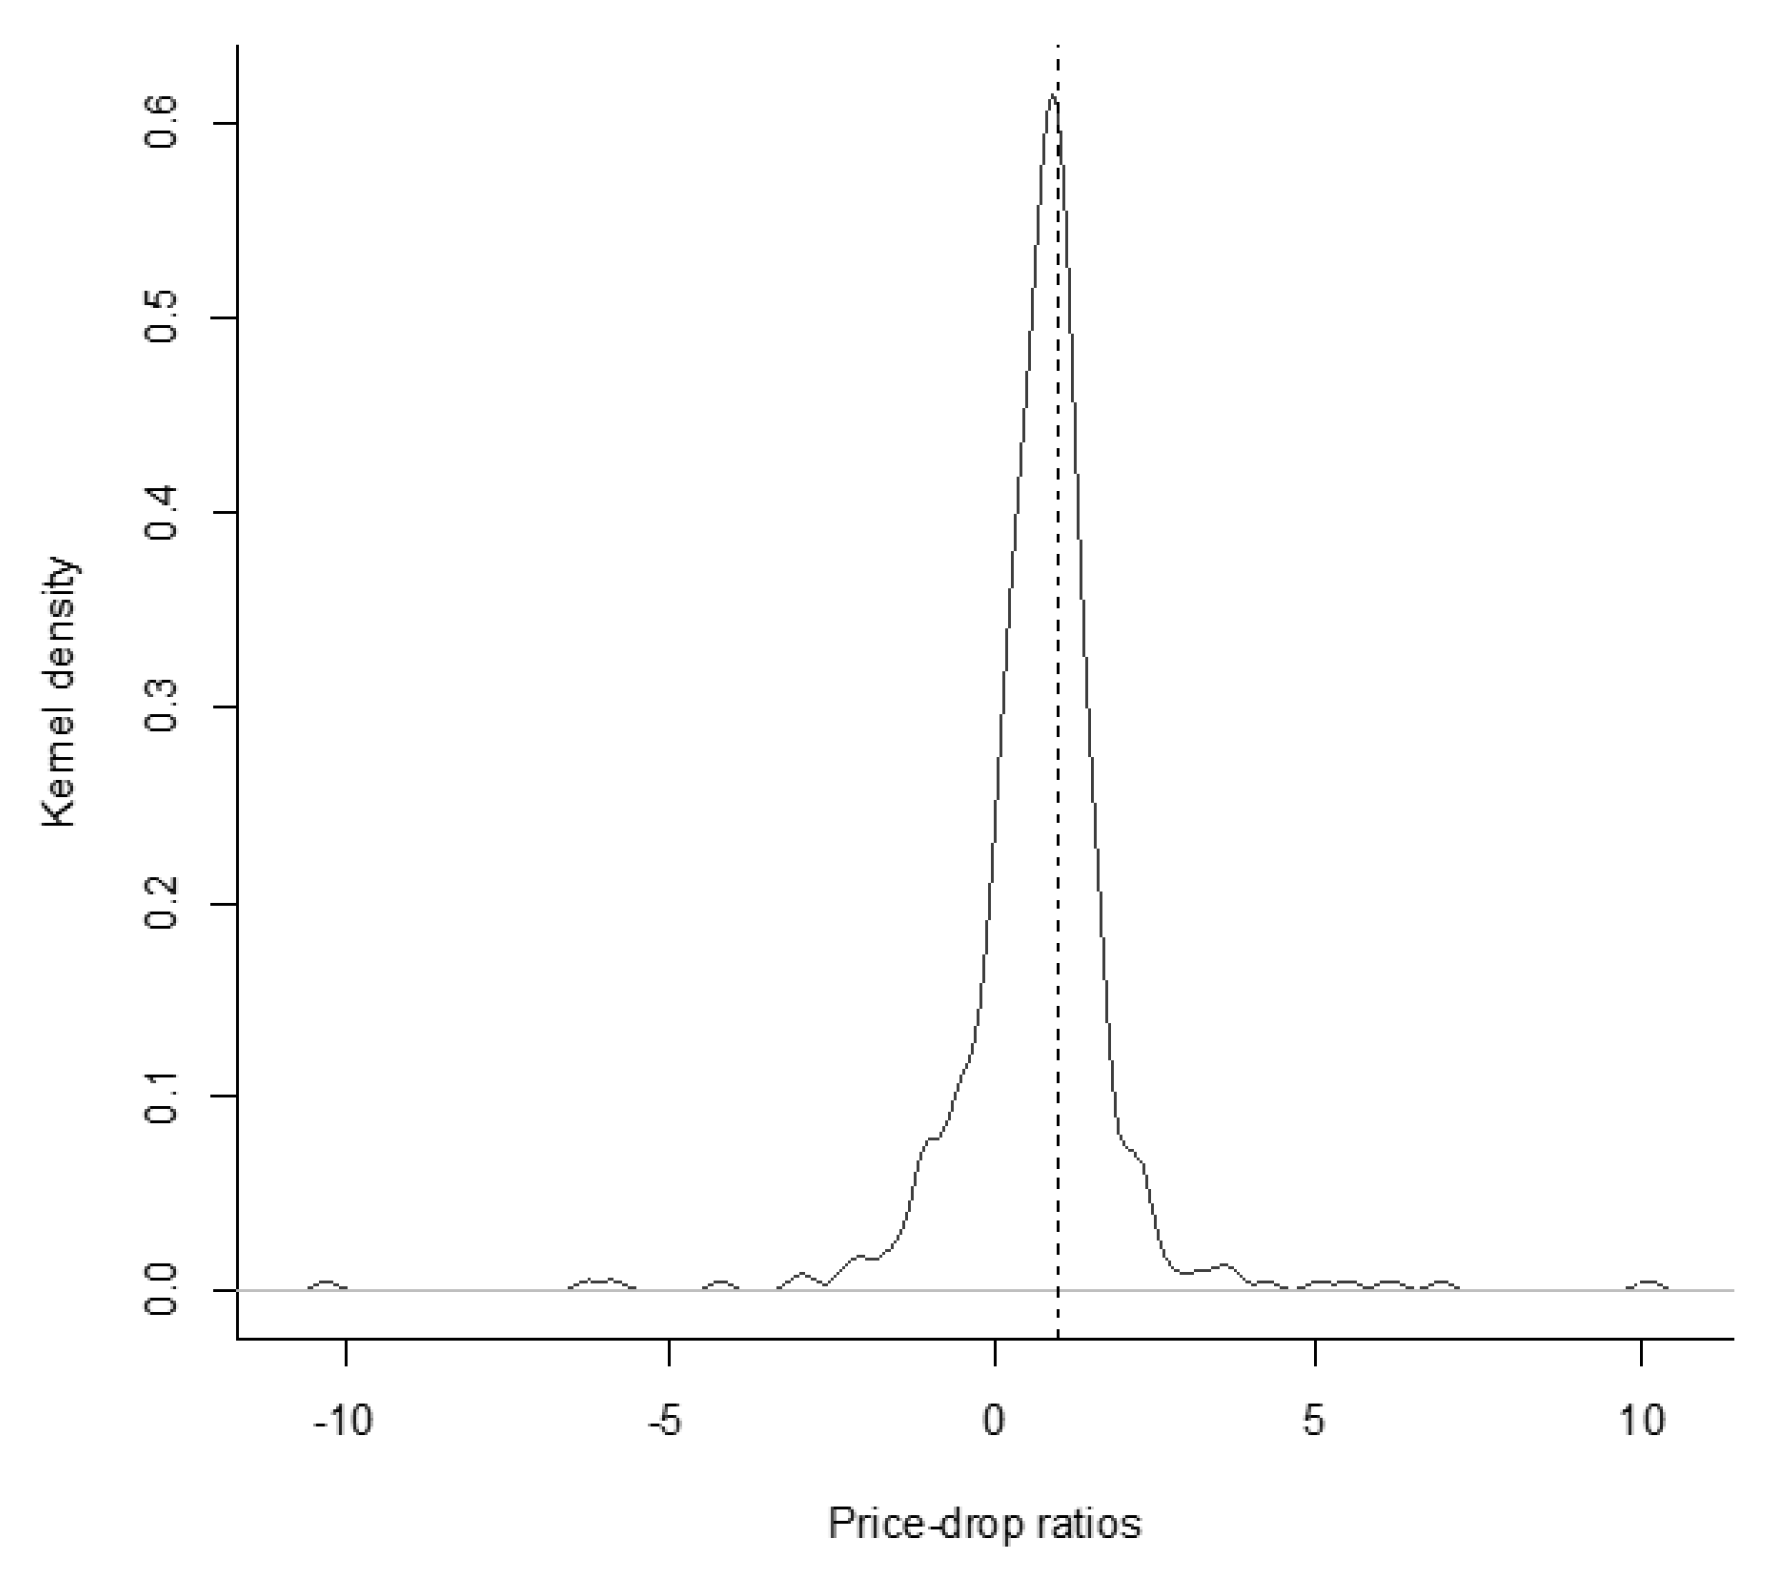
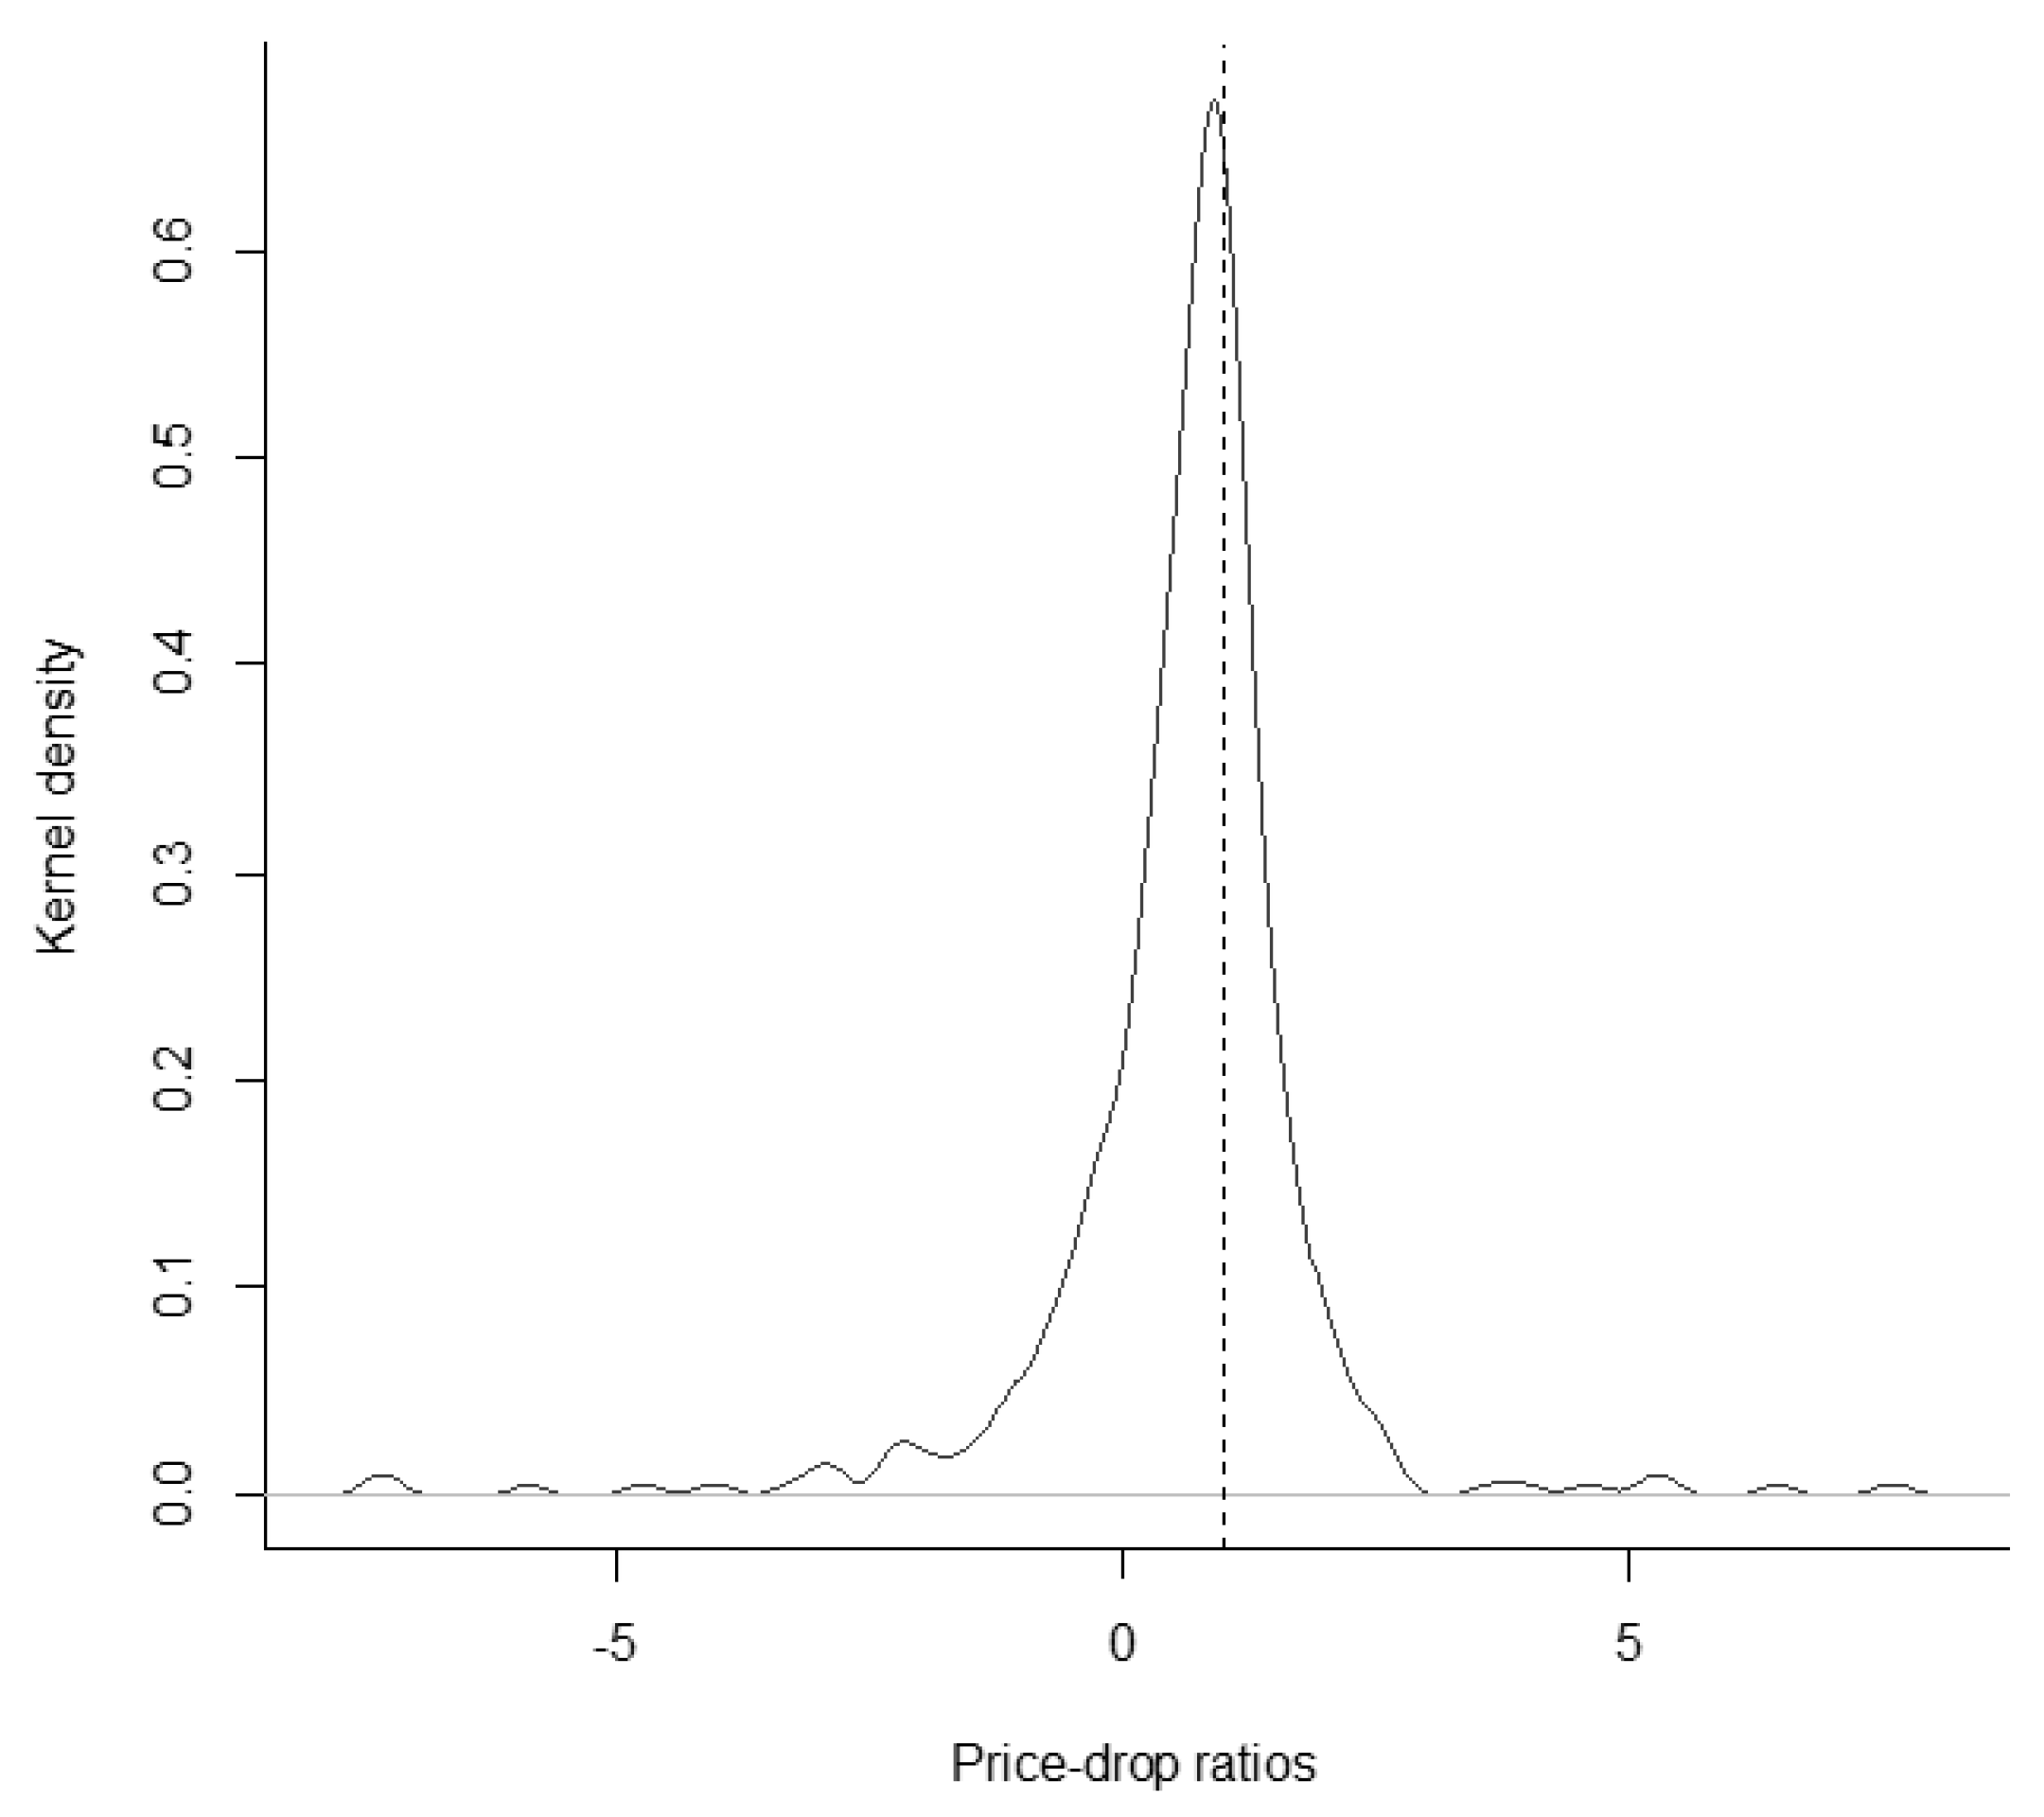
Figure 3 depicts a kernel-density plot of the PDRs for the full sample between 2002 and September 2019. The plot shows a slightly higher mass of density for PDRs smaller than one, with its expected value of almost one.
Our results of the PDRs are in line with the theory as we expect a PDR of one, but the variation in the results is somewhat surprising. There are several potential reasons for this variation that we discuss in the following.
To adjust for price movements during the ex-date, we consider the expected return of a stock. To this end, we estimate three market betas (lagged, matching and leading) following Dimson (1979), to account for infrequent trading. We calculate the expected return again, but based on only one matching market beta. The results for Equation (3) are almost identical (see Table A1 in the Appendix A) to the results in Table 2. Thus infrequent trading and the price adjustment do not affect the point estimates.
Market microstructure arguments seriously challenge tax-motivated reasoning, since they also hold in our case, in the absence of a discrepancy between dividend taxation and capital gains taxation. A reason for PDRs lower than one can be a bid-ask bounce in stock prices, where the closing cum price is close to the bid price and the closing price on the ex-date is closer to the ask price (Frank and Jagannathan 1998). Analyses with bid and ask prices provide economically identical estimates to our results in Table 2.15 Our estimates of the PDRs are thus not systematically biased by bid-ask bounces.
Both tax related literature as well as short-term arbitrage literature find a positive correlation between the price drop on ex-dates and the dividend yield of a stock (e.g., (Elton and Gruber 1970; Kalay 1982)). Moreover, the noise in the PDR estimation is higher with stocks showing a relatively low dividend yield. To increase the granularity of our analysis, we split our sample into dividend-yield tertiles and estimate the PDRs. Table 3 provides our results. For all three tertiles, the estimated PDRs are approximately one. The medium tertile even shows a PDR larger than one with a point estimate of 1.0409 and a significant and negative . The other tertiles also show negative, but insignificant, estimates. Our results indicate no correlation between the price drop on ex-dates and the dividend yield of German stocks with tax-free dividend. This is in line with our expectations. Due to tax equivalence, there are no tax clienteles systematically affecting ex-date prices. The results also suggest that short-term arbitrageurs exercise no systematic impact. The estimates show, as expected, an inverse trend with increasing dividend-yield. Following Kalay (1982) and McDonald (2001), can be interpreted as twice the proportional transaction costs in a costly arbitrage model for sufficiently large dividends. If dividends are small compared to transaction costs, arbitrage can become unprofitable, because costs exceed potential gains. Hence, the varying in Table 3 provides evidence that transaction costs may affect ex-date prices.
In the following, we deepen our analysis and regress the PDRs, as stated in Equation (7), on the variables DY, Risk, as well as Spread and Cap as proxies for transaction costs. Table 4 shows the results for two models. In model (1), we use pooled OLS estimators with adjusted standard errors following Newey and West (1987). Model (2) is a panel regression with random effects16 and cluster-robust standard errors (clustered at firm level). Our results in model (1) prove to be robust, as the estimators for model (2) are similar. We do not find a significant relationship between the PDR on ex-dates and dividend yield, DY, nor between PDR on ex-dates and Risk. This result also supports tax-motivated reasoning. The insignificant coefficients for DY and Risk are consistent with our results in Table 3. The coefficients of Spread and Cap are also insignificant. This is somewhat surprising as we expect larger, liquid traded stocks to be more efficiently priced with PDRs closer to one. However, transaction costs do not explain the variation in the PDRs either. Our results show no statistically significant evidence for short-term arbitrageurs trading on ex-dates.
In the end, we can conclude that ex-date prices of German stocks with tax-free dividend show an expected pattern. Our results are most consistent with the tax clientele theory. Further, we find no systematic impact from short-term arbitrageurs, nor do technical market microstructure arguments cause PDRs to significantly deviate from one. However, the variation in the PDRs remains partially unexplained.
Finally, the analysis of abnormal returns around ex-dates gives further insights. In Table 5, we see almost no significant average abnormal returns (AARt) in the five days prior to the ex-date and insignificant or significant and negative AARt after the ex-date. On the ex-date itself, we find significant and positive AARt since 2009. This result stands in contrast to the PDR estimation of one. There is no obvious reason from a tax point of view. The literature on the German stock market by Lasfer (2008) and Haesner and Schanz (2013) among others, reports comparable outcomes for the ex-date. Stale prices, as suggested by McDonald (2001), are not a valid explanation, as we control for this. Our analysis based on bid or ask prices reveals economically identical results for the ex-date. However, the estimation of the AAR differs from the methodology of the PDR estimation, because we implicitly consider transaction costs with the in Equation (3).
Another potential, not technical, explanation may be a bias in investors’ behavior. Hartzmark and Solomon (2019) show that investors suffer a free dividend fallacy, when investors do not (fully) link an ex-dates price decline to the dividend payment. Investors may be attracted by a reduced price trying to optimally time their purchases. But, in the light of a PDR estimation of one, the technical reasoning outlined above appears to be more likely.
Since there is no tax-related trading, the insignificant AARt prior to the ex-date indicate that short-term arbitrage does not significantly affect prices of German stocks with tax-free dividend either. The significant and negative AARt after the ex-date are consistent with the declining price pressure of dividend-seeking investors. Dividend-seeking investors can purchase stocks before our event window, so we do not necessarily expect positive AARt over the five days in advance of the ex-date (Kreidl and Scholz 2020). However, the AARt on the ex-date do contrast with the otherwise consistent outcomes of our price analysis.
6. Volume Analysis
6.1. Methodology
As a proxy for trading volume, we use the number of stocks traded. Our analysis of the daily number of stocks traded provides further insights into how investors time their trades around ex-dates. We therefore calculate the daily abnormal number of stocks traded, , for the days [−5, 5] relative to the ex-date in the event window.
For every event i, is the number of a particular stock traded for day t in the event window and is the average number of that stock traded in the estimation period [−65, −6] and [6, 65] relative to the ex-date.
The daily average abnormal number of stocks traded, , is calculated following Equation (9). Further, we calculate a stock’s cumulative abnormal number of stocks traded, , over the event window and eventually determine the average cumulative abnormal number of stocks traded, ACAV. Equation (10) specifies the equation.
For both and , we apply a nonparametric generalized sign test following Bartholdy et al. (2007) to test for significance.17 This allows us to dispense with a distribution assumption. These tests are two-sided with expected value of zero.
To analyze the variation in the , we use the following model:
We regress the on the variable dividend yield, , defined as the dividend payment over the closing cum price, and on the variable , as the volatility of a stock’s daily return divided by the volatility of the daily CDAX return over the estimation period. Further, we use the ex-date bid-ask spread, , as well as the natural logarithm of the market capitalization, , of a stock as explanatory variables. We also apply pooled OLS and panel regression with random effects to estimate the model in Equation (11).
6.2. Results
This section presents the results of our volume analysis. Since we expect no tax-induced trading around ex-dates of German stocks with tax-free dividend, we argue that there is no abnormal number of stocks traded due to tax clienteles. However, short-term arbitrage or price pressure of dividend-seeking investors may cause an abnormal number of stocks traded around ex-dates.
Table 6 shows the abnormal number of stocks traded for the days [−5, 5] relative to the ex-date for XETRA, local exchanges (Local), MTFs, and OTC trading. As described in Section 4, XETRA and the MTFs are the most relevant trading venues in our analysis. XETRA shows an increased number of stocks traded on the days prior to the ex-date, however, only day t − 1 and the ex-date are significantly different to zero. The local exchanges as well as the MTFs also show a significant and positive average abnormal number of stocks traded (AAVt) for the days t − 2 and t − 5, respectively. The figures for OTC reveal an opposite result indicating that OTC trading is more prevalent on regular trading days without ex-dates. During the days after the ex-date, the MTFs show significant AAVt on days t + 2 and t + 3 compared to insignificant results for XETRA and the local exchanges. OTC trading is significantly increased on days t + 1 and t + 5 and significantly decreased on day t + 4. All venues show significant and positive average cumulative abnormal number of stocks traded (ACAV) over the event window. The ACAV varies between 0.3556 for the MTFs and 2.9314 for the local exchanges. Local shows the highest relative increase, but note that the level of daily number of stocks traded in the estimation period is considerably lower for Local and OTC. An additional analysis of XETRA and Local, where we neglect the years before 2008 to align the underlying data sets, produces almost identical results.18 This indicates a stable behavior of the AAV around the ex-date over time.
The significant and positive AAVt in advance of the ex-date and on the ex-date itself may indicate short-term arbitrage. However, considering the insignificant AARt−1 makes systematic short-term trading implausible. Our results after the ex-date do not indicate significant and negative abnormal numbers of stocks traded either.
In Germany, the annual general meeting is generally scheduled one trading day prior to the ex-date. Thus on day t − 1, new information becomes public and the annual general meeting is a valid explanation for the increased number of stocks traded for day t − 1. On average, we would expect positive news and negative news to offset each other, so we should not see significant and positive AARt−1. We are not going into further detail with this particular issue. Nevertheless, it seems to be a plausible explanation considering the fact that our analysis covers 456 dividend events of 128 individual stocks over almost 18 years.
Our results for XETRA, the most relevant trading venue in the sample, are consistent with our price analysis. We do not find significant AARt on day t − 1, which makes the annual general meeting the most likely explanation for the significant and positive AAVt on this day.
The differences across the venues may be due to investors differently routing their orders around ex-dates. We will return to this point again later. The small number of observations covered by OTC reduces the validity of the OTC results. Hence, we omit this subset in our next analysis.
The following analysis gives further insights. We regress the CAV, as stated in Equation (11), on the variables DY, Risk, as well as Spread and Cap. Table 7 shows the results for two models. In model (1), we use pooled OLS estimators with adjusted standard errors following Newey and West (1987). Model (2) is a panel regression with random effects19 and cluster-robust standard errors (clustered at firm level). We omit the XETRA-based Spread for the analysis of Local and the MTFs. With the exception of Cap, the results are similar for XETRA and Local. The significant and negative coefficient of Cap, for XETRA, becomes insignificant with model specification (2). The results indicate that our control variables cannot explain the variation in the CAVi. In contrast, the MTFs show significant and positive coefficients for DY and Cap. Thus, all else being equal, stocks with a higher dividend yield show a higher cumulative abnormal number of stocks traded, and stocks with a higher market capitalization, indicating lower transaction costs, show a higher cumulative abnormal number of stocks traded. The estimates are not significantly different from zero.
The results for the MTFs are in line with the literature. Short-term arbitrage and price pressure are linked to increased trading activity for high-dividend-yield stocks. Higher transaction costs are found ceteris paribus to reduce trading activity. A stock’s transaction costs generally decrease with increasing market capitalization. Interestingly, XETRA and Local show insignificant coefficients for all control variables.
Considering that XETRA is the most relevant trading venue in our sample, the results are in line with our expectation that there is no tax-induced trading around ex-dates for tax-free dividend stocks in Germany. The insignificant coefficients further provide evidence that short-term arbitrage as well as price pressure appear to have no impact on the cumulative abnormal number of stocks traded. The discrepancy between XETRA and the MTFs20 may motivate researchers to further study, since order routing appears to be a valid explanation for our different results. MTFs became an attractive alternative to XETRA and local exchanges. Gomber et al. (2011) mention that the competition between regulated markets, like XETRA, and MTFs significantly reduced trading fees as well as bid-ask spreads. Investors try to keep trading costs low and accordingly route their orders. Up to this point, however, XETRA still shows a relatively and absolutely larger ACAV compared to the MTFs.21
7. Conclusions
Stock prices and trading volumes around ex-dates are frequently discussed topics in financial economics. In Germany, the behavior of the stock market around ex-dates of stocks with taxable dividend is most consistent with tax-motivated reasoning. However, analyses of German stock trading volume before 2012 may be considerably biased due to cum-ex trades. Cum-ex trades can only be of advantage to investors on the basis of taxable-dividend stocks (Buettner et al. 2020).
With our analysis of German stocks with tax-free dividend payment, we can make clear predictions on ex-date prices and analyze the abnormal trading volume around ex-dates without the systematic impact of cum-ex trades over time. Tax-free dividends are equivalent to capital reductions. They reduce the initial purchasing price, thereby increasing the investor’s capital gains at the time of the stock sale. For all groups of German investors, tax-free dividends are temporarily tax-exempt, being eventually taxed with the capital gains tax rate.
Our results are most consistent with the tax clientele theory. In line with the theoretical predictions, our empirical results show that ex-date prices of German stocks with tax-free dividend decline, on average, by the amount of the dividend payment. This implies a price-drop ratio of one and stands in contrast to the negative ex-date excess returns of US stocks with tax-free dividend found by Eades et al. (1984). As expected, we find no significant relationship between a stock’s price-drop ratio and dividend yield. Further, transaction costs cannot significantly explain the variation in the price-drop ratios. Since there is no systematic discrepancy between ex-date prices and dividend payments, we find economic, but not statistically significant, indications for short-term trading around ex-dates. Additional analyses with bid and ask prices provide economically identical results. Thus a systematic bid-ask bounce does not significantly affect price-drop ratios in Germany. The variation in the price-drop ratios remains partially unexplained.
We further provide a comprehensive volume analysis across different trading venues. We find an increased number of stocks traded around ex-dates at all trading venues in our sample. As we expect no tax-induced trading around ex-dates of German tax-free dividend stocks, we argue that there is no abnormal number of stocks traded due to tax clienteles. The annual general meeting, on the other hand, is a valid explanation for the increased number of stocks traded for day t − 1 prior to the ex-date. However, further research on this particular issue is required to understand investor behavior in greater detail.
For XETRA, the most relevant trading venue in the sample, our results show no significant relationship between abnormal number of stocks traded and dividend yield or risk of a stock. This is in line with our predictions and indicates that there is no systematic trading around ex-dates. Our volume analysis reveals heterogeneous findings regarding the abnormal number of stocks traded for multilateral trading facilities. This also motivates to further research, since order routing is a possible explanation for the different results and multilateral trading facilities have become a serious alternative to XETRA trading.
Funding
This research received financial support by the Open Access Publikationsfonds.
Acknowledgments
I am grateful for helpful comments and suggestions from the editor, two anonymous referees, Matthias Blank, Christine Crozier, Hannah Lea Huehn and Hendrik Scholz. Further, I thank Markus Bruns, Alexander Singer and Nicolas Webersinke for their support and research assistance.
Conflicts of Interest
The author declares no conflict of interest.
Appendix A. Additional Tables and Figures

Table A1.
Price-drop ratio on the ex-date (expected return adjustment).
| Full Sample | HI-System | FT-System | |
|---|---|---|---|
| 2002–2019 | 2002–2008 | 2009–2019 | |
| D | 0.8719 | 0.8035 | 0.9158 |
| t-statistic | 7.68 | 3.34 | 14.00 |
| −0.0398 | 0.0284 | −0.0616 | |
| t-statistic | −0.93 | 0.34 | −2.28 |
| t-statistic (D ≠ 1) | −1.13 | −0.82 | −1.29 |
| N | 456 | 70 | 386 |
Note: This table provides the results for the analysis following Equation (3). The dependent variable is the adjusted drop in the stock price from closing cum price to closing ex price in euros as reported in the XETRA data. D is the respective dividend payment. The slope coefficient of D states the price-drop ratio. The applied methodology for the adjustment is based on the approach by Elton et al. (2005). We use a market model specification with a 120-day estimation window to estimate the expected return of a stock for the ex-date. We regress a stock’s daily total returns on daily CDAX total returns over the days [−65, −6] and [6, 65] relative to the ex-date to estimate and . We estimate one matching market beta. The sample includes all constituents with tax-free dividends of the German CDAX index between January 2002 and September 2019. The t-statistic (D ≠ 1) provides t-statistics for testing whether the slope coefficient for the dividend payment, D, is not equal to one. The table shows the results for the full sample, 2002 to 2019, for the HI-system between 2002 and 2008 and for the FT-system since 2009. We apply OLS estimators. All standard errors are adjusted following Newey and West (1987). Data source: Refinitiv EIKON.
Table A2.
Price-drop ratio on the ex-date (bid and ask prices).
| Full Sample | HI-System | FT-System | |
|---|---|---|---|
| 2002–2019 | 2002–2008 | 2009–2019 | |
| Panel A: Closing prices—bid | |||
| D | 0.9392 | 0.8744 | 0.9770 |
| t-statistic | 9.97 | 4.29 | 18.01 |
| −0.0689 | 0.0103 | −0.0898 | |
| t-statistic | −1.75 | 0.12 | −3.31 |
| t-statistic (D ≠ 1) | −0.64 | −0.62 | −0.42 |
| N | 450 | 65 | 385 |
| Panel B: Closing prices—ask | |||
| D | 0.8795 | 0.8237 | 0.9206 |
| t-statistic | 9.01 | 4.10 | 14.73 |
| −0.0425 | −0.0081 | −0.0584 | |
| t-statistic | −1.21 | −0.11 | −2.47 |
| t-statistic (D ≠ 1) | −1.23 | −0.88 | −1.27 |
| N | 447 | 67 | 380 |
Note: This table provides the results for the analysis following Equation (3). The dependent variable is the adjusted drop in the stock price from closing cum price to closing ex price in euros. Panel A shows the results for closing bid prices and Panel B provides the results for closing ask prices. D is the respective dividend payment. The slope coefficient of D represents the price-drop ratio. The sample includes all constituents with tax-free dividends of the German CDAX index between January 2002 and September 2019. Due to missing bid and ask prices, not all 456 dividend events in the data are included. The t-statistic (D ≠ 1) provides t-statistics for testing whether the slope coefficient for the dividend payment, D, is not equal to one. The table shows the results for the full sample, 2002 to 2019, for the HI-system between 2002 and 2008 and for the FT-system since 2009. We apply OLS estimators. All standard errors are adjusted following Newey and West (1987). Data source: Refinitiv EIKON.
Figure A1.
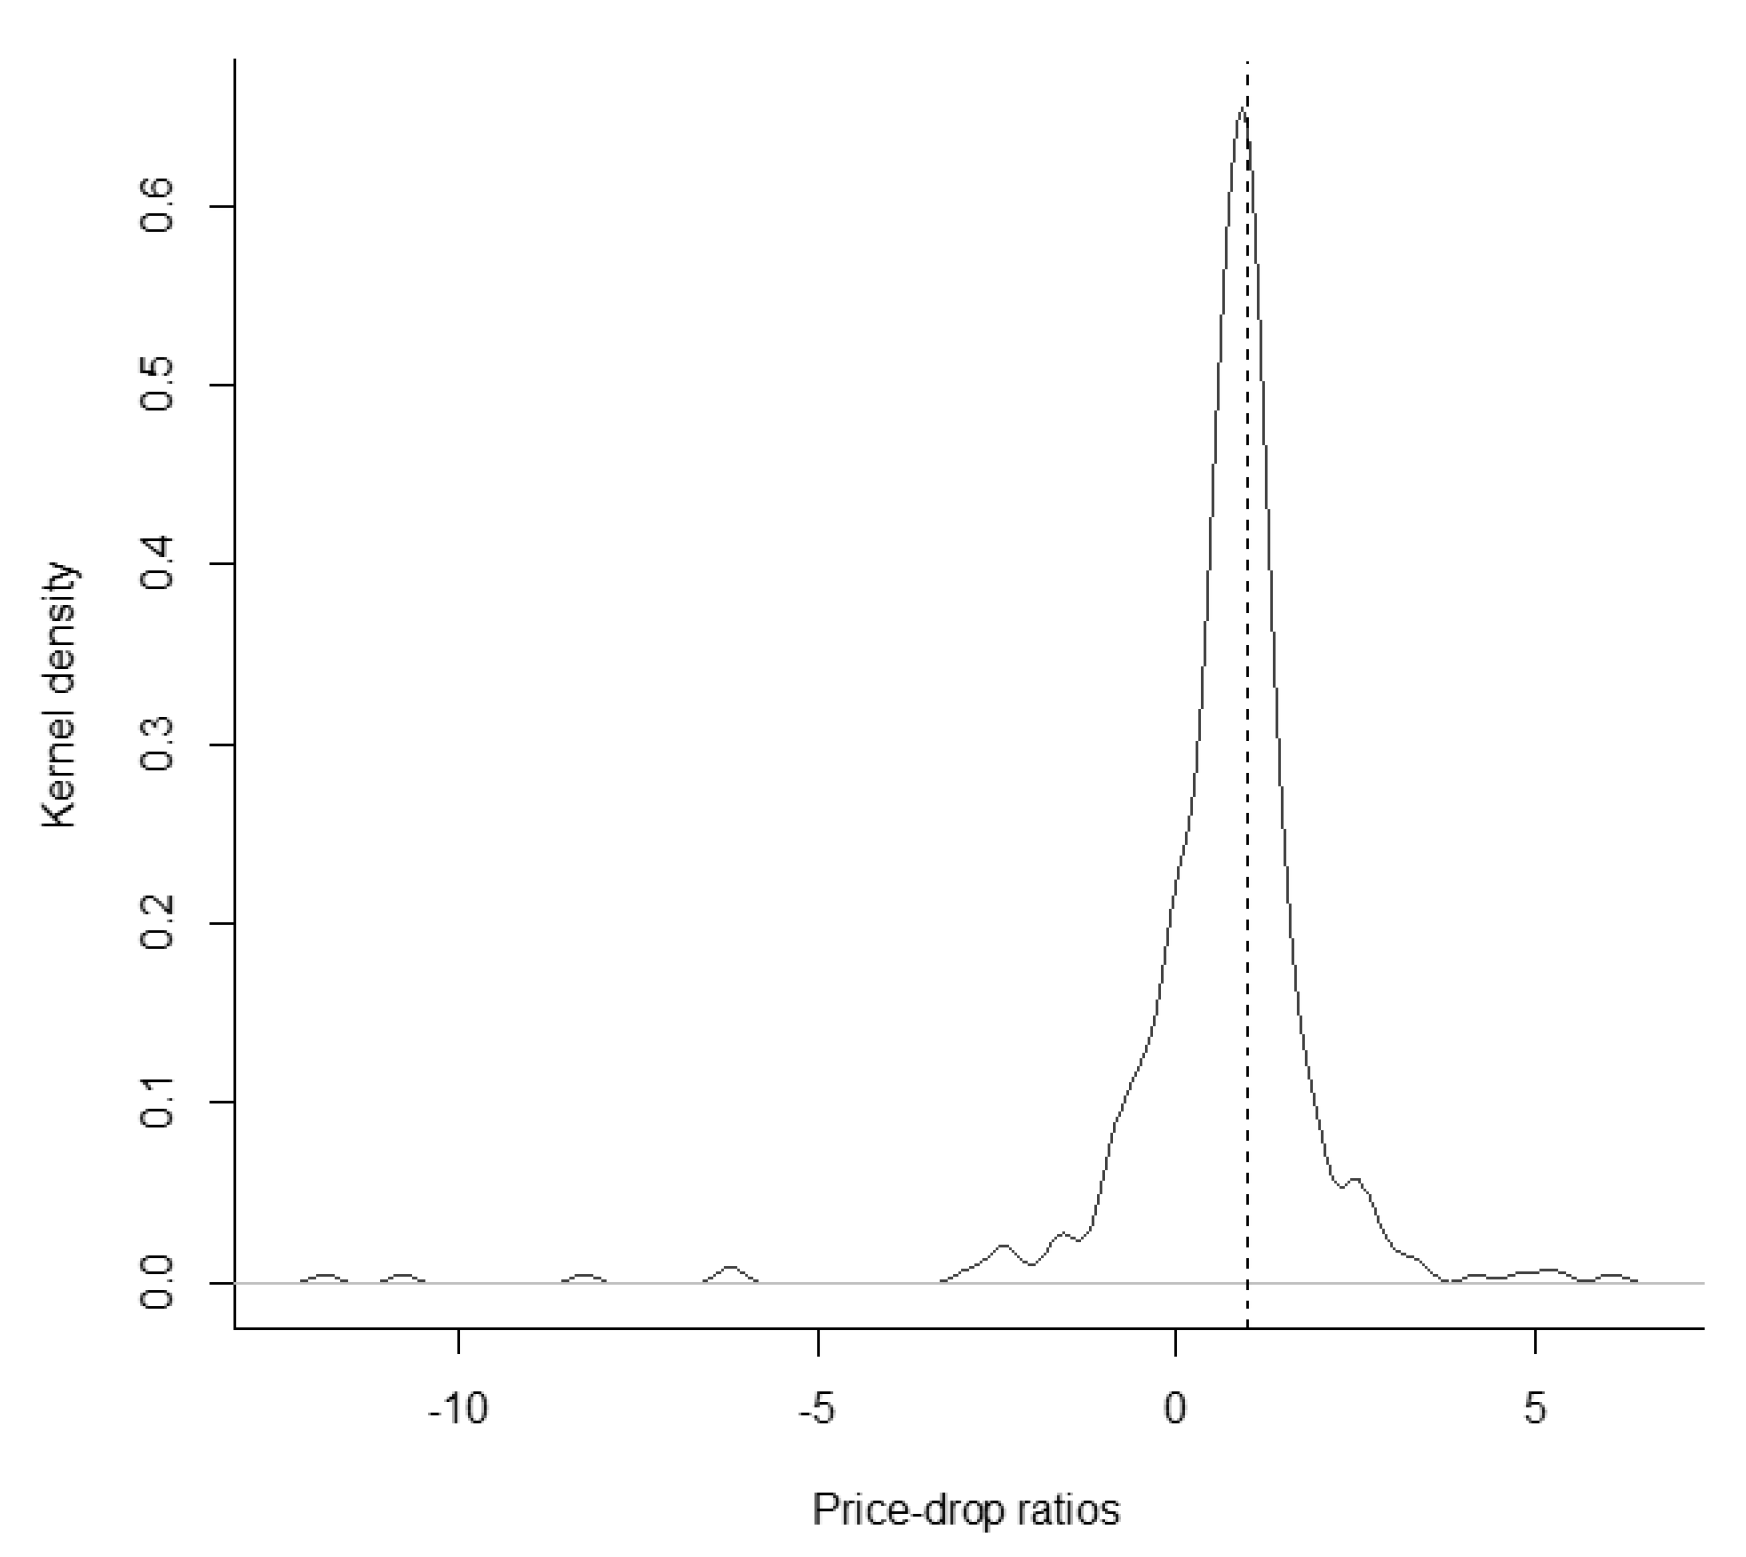
Kernel-density estimate of price-drop-ratio distribution (bid). This figure depicts a kernel-based estimate of the distribution of price-drop ratios (PDRs) based on closing bid prices. The PDR is defined as the adjusted drop from the closing bid price on the dividend date to the closing bid price on the ex-date over the dividend payment of a stock. The sample includes all constituents with tax-free dividends of the German CDAX index between January 2002 and September 2019. Due to missing bid prices, only 450 of all 456 dividend events in the data are included. Epanechnikov kernel density. Data source: Refinitiv EIKON.
Figure A1.
Kernel-density estimate of price-drop-ratio distribution (bid). This figure depicts a kernel-based estimate of the distribution of price-drop ratios (PDRs) based on closing bid prices. The PDR is defined as the adjusted drop from the closing bid price on the dividend date to the closing bid price on the ex-date over the dividend payment of a stock. The sample includes all constituents with tax-free dividends of the German CDAX index between January 2002 and September 2019. Due to missing bid prices, only 450 of all 456 dividend events in the data are included. Epanechnikov kernel density. Data source: Refinitiv EIKON.

Figure A2.
Kernel-density estimate of price-drop-ratio distribution (ask). This figure depicts a kernel-based estimate of the distribution of price-drop ratios (PDRs) based on closing ask prices. The PDR is defined as the adjusted drop from the closing ask price on the dividend date to the closing ask price on the ex-date over the dividend payment of a stock. The sample includes all constituentswith tax-free dividends of the German CDAX index between January 2002 and September 2019. Due to missing ask prices, only 447 of all 456 dividend events in the data are included. Epanechnikov kernel density. Data source: Refinitiv EIKON.

References
- Andres, Christian, Andrè Betzer, Inga Van den Bongard, Christian Haesner, and Erik Theissen. 2013. The information content of dividend surprises: Evidence from Germany. Journal of Business Finance & Accounting 40: 620–45. [Google Scholar]
- Baker, Malcolm, and Jeffrey Wurgler. 2004. A catering theory of dividends. Journal of Finance 59: 1125–65. [Google Scholar] [CrossRef]
- Bali, Rakesh, and Gailen L. Hite. 1998. Ex dividend day stock price behavior: Discreteness or tax-induced clienteles? Journal of Financial Economics 47: 127–59. [Google Scholar] [CrossRef]
- Bartholdy, Jan, Dennis Olson, and Paula Peare. 2007. Conducting event studies on a small stock exchange. European Journal of Finance 13: 227–52. [Google Scholar] [CrossRef]
- Boyd, John H., and Ravi Jagannathan. 1994. Ex-dividend price behavior of common stocks. Review of Financial Studies 7: 711–41. [Google Scholar] [CrossRef] [Green Version]
- Buettner, Thiess, Carolin Holzmann, Felix Kreidl, and Hendrik Scholz. 2020. Withholding-tax non-compliance: The case of cum-ex stock-market transactions. International Tax and Public Finance, 1–28. [Google Scholar]
- Dimson, Elroy. 1979. Risk measurement when shares are subject to infrequent trading. Journal of Financial Economics 7: 197–226. [Google Scholar] [CrossRef]
- Dubofsky, David A. 1992. A market microstructure explanation of ex-day abnormal returns. Financial Management 21: 32–43. [Google Scholar] [CrossRef]
- Eades, Kenneth M., Patrick J. Hess, and E. Han Kim. 1984. On interpreting security returns during the ex-dividend period. Journal of Financial Economics 13: 3–34. [Google Scholar] [CrossRef] [Green Version]
- Elton, Edwin J., and Martin J. Gruber. 1970. Marginal stockholder tax rates and the clientele effect. Review of Economics and Statistics 52: 68–74. [Google Scholar] [CrossRef]
- Elton, Edwin J., Martin J. Gruber, and Christopher R. Blake. 2005. Marginal stockholder tax effects and ex-dividend-day price behavior: Evidence from taxable versus nontaxable closed-end funds. Review of Economics and Statistics 87: 579–86. [Google Scholar] [CrossRef]
- Elton, Edwin J., Martin J. Gruber, and Joel Rentzler. 1984. The ex-dividend day behavior of stock prices; A re-examination of the clientele effect: A comment. Journal of Finance 39: 551–56. [Google Scholar] [CrossRef]
- Frank, Murray, and Ravi Jagannathan. 1998. Why do stock prices drop by less than the value of the dividend? Evidence from a country without taxes. Journal of Financial Economics 47: 161–88. [Google Scholar] [CrossRef]
- Gomber, Peter, Marco Lutat, Axel Pierron, and Moritz C. Weber. 2011. Shedding light on the dark: OTC equities trading in Europe. Journal of Trading 6: 74–86. [Google Scholar] [CrossRef]
- Gomber, Peter, Satchit Sagade, Erik Theissen, Moritz C. Weber, and Christian Westheide. 2016. Spoilt for Choice: Order Routing Decisions in Fragmented Equity Markets. SAFE working paper No. 143. Frankfurt: Goethe Universität Frankfurt am Main. [Google Scholar]
- Gomber, Peter. 2016. The German Equity Trading Landscape. SAFE Working Paper No. 43. Frankfurt: Goethe Universität Frankfurt am Main. [Google Scholar]
- Haesner, Christian, and Deborah Schanz. 2013. Payout policy tax clienteles, ex-dividend day stock prices and trading behavior in Germany: The case of the 2001 tax reform. Journal of Business Finance & Accounting 40: 527–63. [Google Scholar]
- Harris, Lawrence E., Samuel M. Hartzmark, and David H. Solomon. 2015. Juicing the dividend yield: Mutual funds and the demand for dividends. Journal of Financial Economics 116: 433–51. [Google Scholar] [CrossRef]
- Hartzmark, Samuel M., and David H. Solomon. 2013. The dividend month premium. Journal of Financial Economics 109: 640–60. [Google Scholar] [CrossRef]
- Hartzmark, Samuel M., and David H. Solomon. 2019. The dividend disconnect. Journal of Finance 74: 2153–99. [Google Scholar] [CrossRef]
- Henry, Tyler R., and Jennifer L. Koski. 2017. Ex-dividend profitability and institutional trading skill. Journal of Finance 72: 461–94. [Google Scholar] [CrossRef]
- Kalay, Avner. 1982. The ex-dividend day behavior of stock prices: A re-examination of the clientele effect. Journal of Finance 37: 1059–70. [Google Scholar] [CrossRef]
- Kalay, Avner. 1984. The ex-dividend day behavior of stock prices; A re-examination of the clientele effect: A reply. Journal of Finance 39: 557–61. [Google Scholar] [CrossRef]
- Kolari, James W., and Seppo Pynnönen. 2010. Event study testing with cross-sectional correlation of abnormal returns. Review of Financial Studies 23: 3996–4025. [Google Scholar] [CrossRef]
- Kreidl, Felix, and Hendrik Scholz. 2020. Exploiting the Dividend Month Premium: Evidence from Germany. Working Paper. Nürnberg: Friedrich-Alexander-Universität Erlangen-Nürnberg. [Google Scholar]
- Lakonishok, Josef, and Theo Vermaelen. 1986. Tax-induced trading around ex-dividend days. Journal of Financial Economics 16: 287–319. [Google Scholar] [CrossRef]
- Lasfer, Meziane. 2008. Taxes and ex-day returns: Evidence from Germany and the U.K. National Tax Journal 61: 721–42. [Google Scholar] [CrossRef] [Green Version]
- MacKinlay, A. Craig. 1997. Event studies in economics and finance. Journal of Economic Literature 35: 13–39. [Google Scholar]
- McDonald, Robert L. 2001. Cross-border investing with tax arbitrage: The case of German dividend tax credits. Review of Financial Studies 14: 617–57. [Google Scholar] [CrossRef]
- Michaely, Roni, and Jean-Luc Vila. 1995. Investors’ heterogeneity, prices, and volume around the ex-dividend day. Journal of Financial and Quantitative Analysis 30: 171–98. [Google Scholar] [CrossRef]
- Michaely, Roni, and Jean-Luc Vila. 1996. Trading volume with private valuation: Evidence from the ex-dividend day. Review of Financial Studies 9: 471–509. [Google Scholar] [CrossRef]
- Newey, Whitney K., and Kenneth D. West. 1987. A simple, positive semi-definite, heteroskedasticity and autocorrelation consistent covariance matrix. Econometrica 55: 703–8. [Google Scholar] [CrossRef]
- PNHR Dr. Pelka und Sozien GmbH. 2015. Steuerliche Behandlung von Leistungen der Gesellschaft an die Gesellschafter—Gewinnausschüttung oder Einlagenrückgewähr? (Fallstricke des Steuerlichen Einlagekontos gem. § 27 KStG). Available online: https://www.pnhr.de/aktuelle-themen-specials/steuerliche-behandlung-von-leistungen-der-gesellschaft-an-die-gesellschafter-gewinnausschuettung-oder-einlagenrueckgewaehr (accessed on 1 February 2017).
- Spengel, Christoph. 2016. Sachverständigengutachten Nach § 28 PUAG für den 4. Untersuchungsausschuss der 18. Wahlperiode. Available online: https://www.bundestag.de/blob/438666/15d27facf097da2d56213e8a09e27008/sv2_spengel-data.pdf (accessed on 2 August 2018).
| 1 | The withholding tax burden of 26.375% consists of a 25% dividend tax plus 5.5% solidarity surcharge. |
| 2 | The gross dividend is the distribution to the shareholders after corporate taxes. |
| 3 | |
| 4 | See, among others, Lakonishok and Vermaelen (1986) and Michaely and Vila (1996) showing a significantly negative relationship between transaction costs and trading volume around ex-dates. |
| 5 | Michaely and Vila (1996) document that both market risk and idiosyncratic risk reduce trading volume. |
| 6 | See Buettner et al. (2020) for a detailed discussion. In Germany, cum-ex trades were possible in the years from 1999 to 2011 (Spengel 2016). |
| 7 | Investors may benefit from a tax deferral. However, this advantage is negligible and will not be considered in the following. |
| 8 | Elton and Gruber (1970) derive Equation (1) in an equilibrium model, where risk-neutral investors, with no restriction on short sales, are indifferent between selling or buying the stock before the ex-date or after the stock is traded ex-dividend if the after-tax wealth is identical. |
| 9 | See, for instance, “XETRA Release 15.0—Marktmodell Aktien” or previous releases. |
| 10 | See “https://eur-lex.europa.eu/legalcontent/EN/TXT/PDF/?uri=CELEX:32004L0039&qid=1575473833940&from=EN” for a detailed definition. |
| 11 | BATS and CHI-X merged in November 2011. In the following analysis, we aggregate the number of stocks traded over all MTFs in the sample. |
| 12 | There is no data available for number of stocks traded OTC in Stuttgart and XETRA prior to 2014 and after 2018. |
| 13 | We apply the methodology of trimming as winsorizing would bias the price analysis on ex-dates. |
| 14 | For event i, we adjust the stock’s closing cum price by the respective expected return. See Equations (3) and (4) for the methodology. |
| 15 | Panel A of Table A2 in Appendix A provides the results for bid prices and Panel B shows the results for ask prices. All point estimates for D are larger compared to the results in Table 2. Especially the results for the bid prices in Panel A are clearly closer to one. The PDRs estimated on the basis of bid or ask prices are also not significantly different from one. Hence, the results are as expected and the PDRs are not statistically different from our results in Table 2. The Figure A1 and Figure A2 in Appendix A provide kernel-density estimates of the PDR distribution based on bid or ask prices. |
| 16 | A Hausman test (p-value of 0.3728) cannot reject the null, thus the random-effects estimator is consistent and efficient. |
| 17 | Results available for t-statistics following a Student’s t-distribution are upon request. |
| 18 | Results available are upon request. |
| 19 | Hausman tests cannot reject the null, thus the random-effects estimators are consistent and efficient. The respective p-values are 0.399 (XETRA), 0.854 (Local) and 0.189 (MTFs). |
| 20 | An additional price analysis would provide further insights. To our best knowledge, there is no information available for daily MTF closing prices of German stocks with tax-free dividend. |
| 21 | We do not suppose a significant shift to OTC trading, as reasoned by Gomber et al. (2016), because we do not expect systematic large-in-scale trades around ex-dates for our sample. |
Figure 1.
Distribution of ex-dates with tax-free dividends. This figure illustrates the distribution of ex-dates with tax-free dividend payments between January 2002 and September 2019. The left graph reports the ex-dates over time, the right graph shows the average distribution of ex-dates within a year. The data sample includes 456 ex-dates with tax-free dividend payments. Data source: Refinitiv EIKON.

Figure 2.
Total number of stocks traded around ex-dates. This figure shows the total number of stocks traded for the days [−65, 65] relative to the ex-date. It reports XETRA (upper left), the sum over all local exchanges (Local) Frankfurt, Stuttgart, Munich, Hamburg, Hannover, Düsseldorf, Berlin and Tradegate (upper right), the sum over the multilateral trading facilities (MTFs) CHI-X, BATS and Turquoise (lower left) and the aggregated total number of stocks traded of the over-the-counter (OTC) trading in Stuttgart and XETRA (lower right). XETRA and Local include the years 2002 to 2019, the MTFs cover the years 2008 to 2019 and OTC is available between 2014 and 2018. Data source: Refinitiv EIKON.

Figure 3.
Kernel-density estimate of price-drop-ratio distribution. This figure depicts a kernel-based estimate of the distribution of price-drop ratios (PDRs) based on XETRA closing prices. The PDR is defined as the adjusted drop from closing cum price to closing ex price over the dividend payment of a stock. The sample includes all constituents with tax-free dividends of the German CDAX index between January 2002 and September 2019. Epanechnikov kernel density. Data source: Refinitiv EIKON.

Table 1.
Summary statistics.
| Tax-Free Dividend Stocks in CDAX | ||||
| Years | 18 | |||
| Constituents | 128 | |||
| Ex-dates | 456 | |||
| Min. | Mean | Median | Max. | |
| Dividend per stock (EUR) | 0.03 | 0.46 | 0.25 | 6.00 |
| Dividend yield (%) | 0.07 | 1.26 | 0.86 | 10.36 |
| Risk | 0.56 | 1.95 | 1.76 | 8.17 |
| Spread (%) | 0.00 | 1.54 | 1.12 | 11.26 |
| Market Capitalization (Mio. EUR) | 2 | 2,551 | 114 | 55,970 |
Note: This table provides summary statistics of our data sample. The sample covers all constituents with tax-free dividend payments of the German CDAX index between January 2002 and September 2019. Special dividends and capital bonuses are generally excluded, except for special payments coinciding with the yearly common dividend payment. The dividend per stock is the dividend payment in euros and the dividend yield is defined as the dividend payment in relation to the closing cum price. We define risk as the volatility of a stock’s return divided by the volatility of the CDAX return. We use the days [−65, 65] relative to the ex-date as basis for the estimation. We omit the days [−5, 5] to avoid biases due to potentially increased event-induced volatility. Spread represents the bid-ask spread on ex-dates, specified as the difference between the closing ask price and closing bid price over the closing ask price. Market capitalization is stated in million euros. Data source: Refinitiv EIKON.
Table 2.
Price-drop ratio on the ex-date.
| Full Sample | HI-System | FT-System | |
|---|---|---|---|
| 2002–2019 | 2002–2008 | 2009–2019 | |
| D | 0.8698 | 0.7937 | 0.9166 |
| t-statistic | 7.29 | 3.11 | 14.57 |
| −0.0380 | 0.0469 | −0.0630 | |
| t-statistic | −0.86 | 0.52 | −2.39 |
| t-statistic (D ≠ 1) | −1.09 | −0.81 | −1.33 |
| N | 456 | 70 | 386 |
Note: This table provides the results for the analysis following Equation (3). The dependent variable is the adjusted drop in the stock price from closing cum price to closing ex price in euros as reported in the XETRA data. D is the respective dividend payment. The slope coefficient of D states the price-drop ratio. The sample includes all constituents with tax-free dividends of the German CDAX index between January 2002 and September 2019. The t-statistic (D ≠ 1) provides t-statistics for testing whether the slope coefficient for the dividend payment, D, is not equal to one. The table shows the results for the full sample, 2002 to 2019, for the HI-system between 2002 and 2008 and for the FT-system since 2009. We apply OLS estimators. All standard errors are adjusted following Newey and West (1987). Data source: Refinitiv EIKON.
Table 3.
Price-drop ratio on the ex-date (dividend-yield (DY) tertiles).
| Low DY | Medium DY | High DY | |
|---|---|---|---|
| 2002–2019 | 2002–2019 | 2002–2019 | |
| D | 0.9854 | 1.0409 | 0.9678 |
| t-statistic | 6.99 | 28.28 | 3.65 |
| −0.1660 | −0.0988 | −0.0217 | |
| t-statistic | −1.25 | −3.55 | −0.65 |
| t-statistic (D ≠ 1) | −0.10 | 1.11 | −0.12 |
Note: This table provides the results for the analysis following Equation (3) for different dividend-yield tertiles (low, medium and high). The dependent variable is the adjusted drop in the stock price from closing cum price to closing ex price in euros as reported in the XETRA data. D is the respective dividend payment. The slope coefficient of D represents the price-drop ratio. The sample includes all constituents with tax-free dividends of the German CDAX index between January 2002 and September 2019. The t-statistic (D ≠ 1) provides t-statistics for testing whether the slope coefficient for the dividend payment, D, is not equal to one. The table shows the results for the full sample between 2002 and 2019. We apply OLS estimators. All standard errors are adjusted following Newey and West (1987). Data source: Refinitiv EIKON.
Table 4.
Regression of PDR on control variables.
| Full Sample 2002–2019 | ||
|---|---|---|
| (1) | (2) | |
| 0.6008 | 0.9304 | |
| t-statistic | 2.05 | 2.73 |
| DY | −2.8005 | −4.675 |
| t-statistic | −0.48 | −0.72 |
| Risk | −0.0459 | −0.0381 |
| t-statistic | −0.46 | −0.36 |
| Spread | 2.8976 | 3.1018 |
| t-statistic | 0.63 | 0.71 |
| Cap | 0.0318 | −0.0293 |
| t-statistic | 1.03 | −0.78 |
| N | 436 | 436 |
| Adj. R2 | 0.005 | 0.014 |
Note: This table provides the results for the analysis following Equation (7). The dependent variable is a stock’s price-drop ratio, PDR, defined as the adjusted drop from closing cum price to closing ex price over the dividend payment. We regress the PDR on the variables dividend yield, DY, as the dividend payment over the closing cum price, and on Risk, as the volatility of a stock’s return divided by the volatility of the CDAX return over the days [−65, −6] and [6, 65] relative to the ex-date. Further, we use the ex-dates bid-ask spread, , as well as the natural logarithm of the market capitalization, , of a stock as explanatory variables. The sample includes all constituents with tax-free dividends of the German CDAX index between January 2002 and September 2019. Due to missing values, not all 456 dividend events in the data are included. Regression coefficients result from pooled OLS regressions with adjusted standard errors following Newey and West (1987) (1) or panel regressions with random effects and cluster-robust standard errors (clustered at firm level) (2). Data source: Refinitiv EIKON.
Table 5.
Average abnormal returns around ex-dates.
| Full Sample 2002–2019 | HI-System 2002–2008 | FT-System 2009–2019 | ||||
|---|---|---|---|---|---|---|
| AARt | t-Statistic | AARt | t-Statistic | AARt | t-Statistic | |
| t − 5 | 0.0012 | 0.84 | 0.0033 | 0.88 | 0.0008 | 0.56 |
| t − 4 | −0.0004 | −0.30 | −0.0041 | −0.07 | 0.0003 | 0.36 |
| t − 3 | −0.0011 | −1.28 | 0.0016 | 0.41 | −0.0016 | −1.61 |
| t − 2 | 0.0012 | 0.94 | −0.0037 | −0.97 | 0.0021 | 1.45 |
| t − 1 | −0.0007 | −0.18 | 0.0068 | 1.93 | −0.0020 | −1.02 |
| t0 | 0.0064 | 5.02 | 0.0013 | 0.88 | 0.0073 | 5.22 |
| t + 1 | −0.0049 | −3.37 | −0.0102 | −2.44 | −0.0040 | −2.73 |
| t + 2 | −0.0050 | −2.61 | −0.0020 | −0.66 | −0.0055 | −2.62 |
| t + 3 | 0.0005 | 0.06 | 0.0030 | 0.79 | 0.0001 | −0.40 |
| t + 4 | −0.0022 | −1.49 | −0.0015 | −0.24 | −0.0023 | −1.56 |
| t + 5 | −0.0030 | −1.71 | −0.0015 | −0.17 | −0.0033 | −1.83 |
| N | 456 | 70 | 386 | |||
Note: This table provides daily average abnormal returns, AARt, for the days [−5, 5] relative to the ex-date in the event window. A stock’s daily abnormal return for the days [−5, 5] is defined as the daily excess return minus the stock’s daily expected return. The daily expected return for the days [−5, 5] is estimated using a market-model specification with estimation period [−65, −6] and [6, 65]. The daily CDAX return is used as market-portfolio return. The table shows the results for the full sample, 2002 to 2019, for the HI-system between 2002 and 2008 and for the FT-system since 2009. The sample includes all constituents with tax-free dividends of the German CDAX index between January 2002 and September 2019. We apply t-statistics by Kolari and Pynnönen (2010). Data source: Refinitiv EIKON.
Table 6.
Average abnormal number of stocks traded around ex-dates.
| XETRA 2002–2019 | Local 2002–2019 | MTFs 2008–2019 | OTC 2014–2018 | |||||
|---|---|---|---|---|---|---|---|---|
| AAVt | t-Statistic | AAVt | t-Statistic | AAVt | t-Statistic | AAVt | t-Statistic | |
| t − 5 | 0.1303 | 0.40 | 0.2317 | 0.43 | 0.0851 | 2.33 | 1.0553 | −0.28 |
| t − 4 | 0.0768 | 1.08 | 0.3127 | 0.96 | 0.0321 | 0.86 | −0.2499 | −1.95 |
| t − 3 | 0.2160 | 1.20 | 0.5525 | 1.59 | 0.0729 | 0.69 | 0.1594 | −0.56 |
| t − 2 | 0.3285 | 1.51 | 0.6388 | 1.69 | 0.1305 | 2.84 | −0.1013 | −6.70 |
| t − 1 | 0.4040 | 3.24 | 0.5421 | 1.92 | 0.1796 | 6.89 | −0.1435 | −7.82 |
| t0 | 0.3490 | 2.45 | 0.5860 | 1.93 | 0.1968 | 5.94 | −0.0408 | −10.05 |
| t + 1 | 0.1214 | 0.92 | 0.1908 | 0.56 | −0.0222 | −0.09 | 5.6195 | 2.51 |
| t + 2 | 0.1126 | 0.96 | 0.0896 | 0.69 | 0.0725 | 2.24 | 0.2667 | 0.84 |
| t + 3 | −0.0468 | 0.31 | 0.0043 | 0.13 | 0.0571 | 4.14 | 0.1491 | 0.28 |
| t + 4 | −0.0244 | 0.13 | −0.0711 | 0.06 | 0.0005 | 0.95 | −0.2765 | −1.68 |
| t + 5 | 0.0119 | 0.08 | 0.0098 | −0.02 | 0.0041 | 0.43 | 1.1061 | 2.51 |
| ACAV | 1.6684 | 3.71 | 2.9314 | 2.99 | 0.3556 | 8.21 | 1.1642 | 9.09 |
Note: This table provides daily average abnormal number of stocks traded, AAVt, for the days [−5, 5] relative to the ex-date in the event window. A stock’s daily abnormal number of stocks traded is defined as the daily number of stocks traded for the days [−5, 5] minus the average number of stocks traded in the estimation period [−65, −6] and [6, 65] relative to the ex-date over the average number of stocks traded. ACAV represents the average cumulative abnormal number of stocks traded over the days [−5, 5] relative to the ex-date. This table provides results for the trading venues XETRA, the sum over all local exchanges (Local) Frankfurt, Stuttgart, Munich, Hamburg, Hannover, Düsseldorf, Berlin, and Tradegate, the sum over the multilateral trading facilities (MTFs) CHI-X, BATS and Turquoise and the sum over the over-the-counter (OTC) trading in Stuttgart and XETRA. XETRA and Local include the years 2002 to 2019, the MTFs cover the years 2008 to 2019 and OTC is available between 2014 and 2018. The sample includes all constituents with tax-free dividends of the German CDAX index between January 2002 and September 2019. The t-statistics are based on a nonparametric generalized sign test following Bartholdy et al. (2007). Data source: Refinitiv EIKON.
Table 7.
Regression of CAV on control variables.
| XETRA | Local | MTFs | ||||
|---|---|---|---|---|---|---|
| (1) | (2) | (1) | (2) | (1) | (2) | |
| 5.3155 | 4.9868 | 3.5429 | 3.3132 | 0.0256 | −0.6745 | |
| t-statistic | 2.88 | 2.14 | 1.94 | 1.68 | 0.02 | −0.48 |
| DY | −12.1346 | −28.3522 | 7.7671 | 1.4437 | 39.9210 | 57.0001 |
| t-statistic | −0.37 | −1.02 | 0.23 | 0.04 | 1.66 | 2.19 |
| Risk | −0.5944 | −0.4877 | −0.7187 | −0.6094 | −0.6269 | −0.5403 |
| t-statistic | −1.12 | −0.81 | −1.50 | −1.47 | −1.67 | −1.27 |
| Spread | −31.2998 | −22.7293 | - | - | - | - |
| t-statistic | −1.38 | −1.35 | - | - | - | - |
| Cap | −0.3321 | −0.3334 | 0.1313 | 0.0960 | 0.2001 | 0.2740 |
| t-statistic | −1.84 | −1.53 | 0.58 | −0.38 | 1.68 | 1.85 |
| N | 436 | 436 | 436 | 436 | 246 | 246 |
| Adj. R2 | 0.012 | 0.007 | 0.004 | 0.000 | 0.004 | 0.000 |
Note: This table provides the results for the analysis following Equation (11). The dependent variable is a stock’s cumulative abnormal number of stocks traded, CAV, defined as the sum of the daily abnormal number of stocks traded over the days [−5, 5] relative to the ex-date of a stock. The daily abnormal number of stocks traded is defined as the daily number of stocks traded for the days [−5, 5] minus the average number of stocks traded in the estimation period [−65, −6] and [6, 65] relative to the ex-date over the average number of stocks traded. We regress the CAV on the variables dividend yield, DY, as the dividend payment over the closing cum price, and on Risk, as the volatility of a stock’s return divided by the volatility of the CDAX return over the days [−65, −6] and [6, 65]. Further we use the ex-dates bid-ask spread, Spread, as well as the natural logarithm of the market capitalization, Cap, of a stock as explanatory variables. The sample includes all constituents with tax-free dividends of the German CDAX index between January 2002 and September 2019. Due to missing values, not all 456 dividend events in the data are included. The table provides results for cumulative abnormal number of stocks traded based on XETRA, the sum over all local exchanges (Local) Frankfurt, Stuttgart, Munich, Hamburg, Hannover, Düsseldorf, Berlin, Tradegate and the sum over the multilateral trading facilities (MTFs) CHI-X, BATS and Turquoise. XETRA and Local include the years 2002 to 2019, the MTFs cover the years 2008 to 2019. Regression coefficients result from pooled OLS regressions with adjusted standard errors following Newey and West (1987) (1) or panel regressions with random effects and cluster-robust standard errors (clustered at firm level) (2). Data source: Refinitiv EIKON.
© 2020 by the author. Licensee MDPI, Basel, Switzerland. This article is an open access article distributed under the terms and conditions of the Creative Commons Attribution (CC BY) license (http://creativecommons.org/licenses/by/4.0/).
Share and Cite
MDPI and ACS Style
Kreidl, F. Stock-Market Behavior on Ex-Dates: New Insights from German Stocks with Tax-Free Dividend. Int. J. Financial Stud. 2020, 8, 58. https://0-doi-org.brum.beds.ac.uk/10.3390/ijfs8030058
AMA Style
Kreidl F. Stock-Market Behavior on Ex-Dates: New Insights from German Stocks with Tax-Free Dividend. International Journal of Financial Studies. 2020; 8(3):58. https://0-doi-org.brum.beds.ac.uk/10.3390/ijfs8030058
Chicago/Turabian StyleKreidl, Felix. 2020. "Stock-Market Behavior on Ex-Dates: New Insights from German Stocks with Tax-Free Dividend" International Journal of Financial Studies 8, no. 3: 58. https://0-doi-org.brum.beds.ac.uk/10.3390/ijfs8030058
Note that from the first issue of 2016, this journal uses article numbers instead of page numbers. See further details here.