#Bitcoin, #COVID-19: Twitter-Based Uncertainty and Bitcoin Before and during the Pandemic


Department of Finance, Monfort College of Business, University of Northern Colorado, Greeley, CO 80639, USA
Int. J. Financial Stud. 2021, 9(2), 28; https://0-doi-org.brum.beds.ac.uk/10.3390/ijfs9020028
Submission received: 5 May 2021
/
Revised: 17 May 2021
/
Accepted: 24 May 2021
/
Published: 29 May 2021
Abstract
:We investigated the differential impacts of a new Twitter-based Market Uncertainty index (TMU) and variables for Bitcoin before and during the COVID-19 pandemic. Results showed that TMU is a leading indicator of Bitcoin returns only during the pandemic, and the effect of the TMU on Bitcoin’s conditional volatility is significantly greater during the pandemic. Furthermore, during the pandemic, the uncertainty content of people’s tweets is impacted by the highly salient Bitcoin market. Taken together, our results suggest that the information contained in virtual communities such as Twitter have a much larger impact on cryptocurrency markets following COVID-19.
JEL Classification:
G00; G19; G40; G41“In retrospect, it was inevitable”: tweet from @elonmusk in response to adding #bitcoin to his Twitter bio.
1. Introduction
COVID-19 is changing the way people communicate and obtain information. The number of ‘monetizable’ daily users on Twitter increased by 34% at the onset of the COVID-19 pandemic, which was the fastest growth rate in this metric in company history (Hutchinson 2020). Twitter has become one of the avenues through which world leaders, financial market professionals, and average citizens express their opinions and share knowledge. Social media enables people to create, share, and respond to information. Such a combination of reactions is a valuable source of data about opinions and emotions shared by a social media audience. Evidence from behavioral economics demonstrates that individual and group psychology is correlated or even predictive of financial market performance (Bukovina 2016).
In this research, we used the new Twitter-based Market Uncertainty index (TMU). The index includes all tweets sent on Twitter that contain keywords related to “Uncertainty” as well as keywords related to “Equity Markets”. We then examined the differential effects of the TMU on the returns and conditional volatility of Bitcoin before and during the COVID-19 pandemic. We found that prior to the pandemic, TMU had a small impact on Bitcoin’s return and conditional volatility. However, following the onset of the pandemic, the returns and conditional volatility of Bitcoin have become more sensitive to the uncertainty content of tweets that strengthen the TMU’s ability to predict them. People locked out of their typical routines are filling by time trading Bitcoin. The social aspect of trading appears to have become more important during the pandemic. Indeed, our results also show that the amount that people tweet about market uncertainty is being impacted by Bitcoin to a much greater degree during the pandemic compared to the pre-pandemic period.
This paper is related to the literature on the effects of social media on financial markets. For example, results in Bollen et al. (2011) indicated that the ‘mood’ of Twitter predicts the level of Dow Jones Industrial Average (DJIA). Similarly, Sprenger et al. (2014) derived good and bad news from tweets related to the S&P 500 and found that this news has an impact on the market. Agrawal et al. (2018) showed that extreme sentiment corresponds to higher demand for and lower supply of liquidity. Furthermore, they showed that negative sentiment has a larger effect on the demand and supply of liquidity than positive sentiment. More closely related to the current work, Demir et al. (2018) investigated the forecasting power of economic policy uncertainty (EPU) on Bitcoin prices and found some evidence of predictability of Bitcoin from EPU. Ahn and Kim (2020) showed that attention and sentiment disagreement induced volatility in Bitcoin prices. Goczek and Skliarov (2019) found that the main factor driving Bitcoin price is popularity, and Kapar and Olmo (2021) showed that Bitcoin prices are positively impacted by Google searches.
This research is also related to the rapidly growing literature on the impacts of COVID-19 on financial markets. For example, Zhang et al. (2020) showed that COVID-19 increased the volatility of global financial markets and that policy responses may have increased this uncertainty. Ramelli and Wagner (2020) showed that the anticipated real effects of COVID-19 were amplified by financial markets in the early stages of the pandemic. Çepni et al. (2020) showed that ‘fake news’ and media coverage during COVID-19 had a negative impact on some countries’ stock market returns. However, to the best of our knowledge, the extant literature has not explored the impact of uncertainty measured through tweets on Bitcoin during the pandemic.
2. Data and Variables
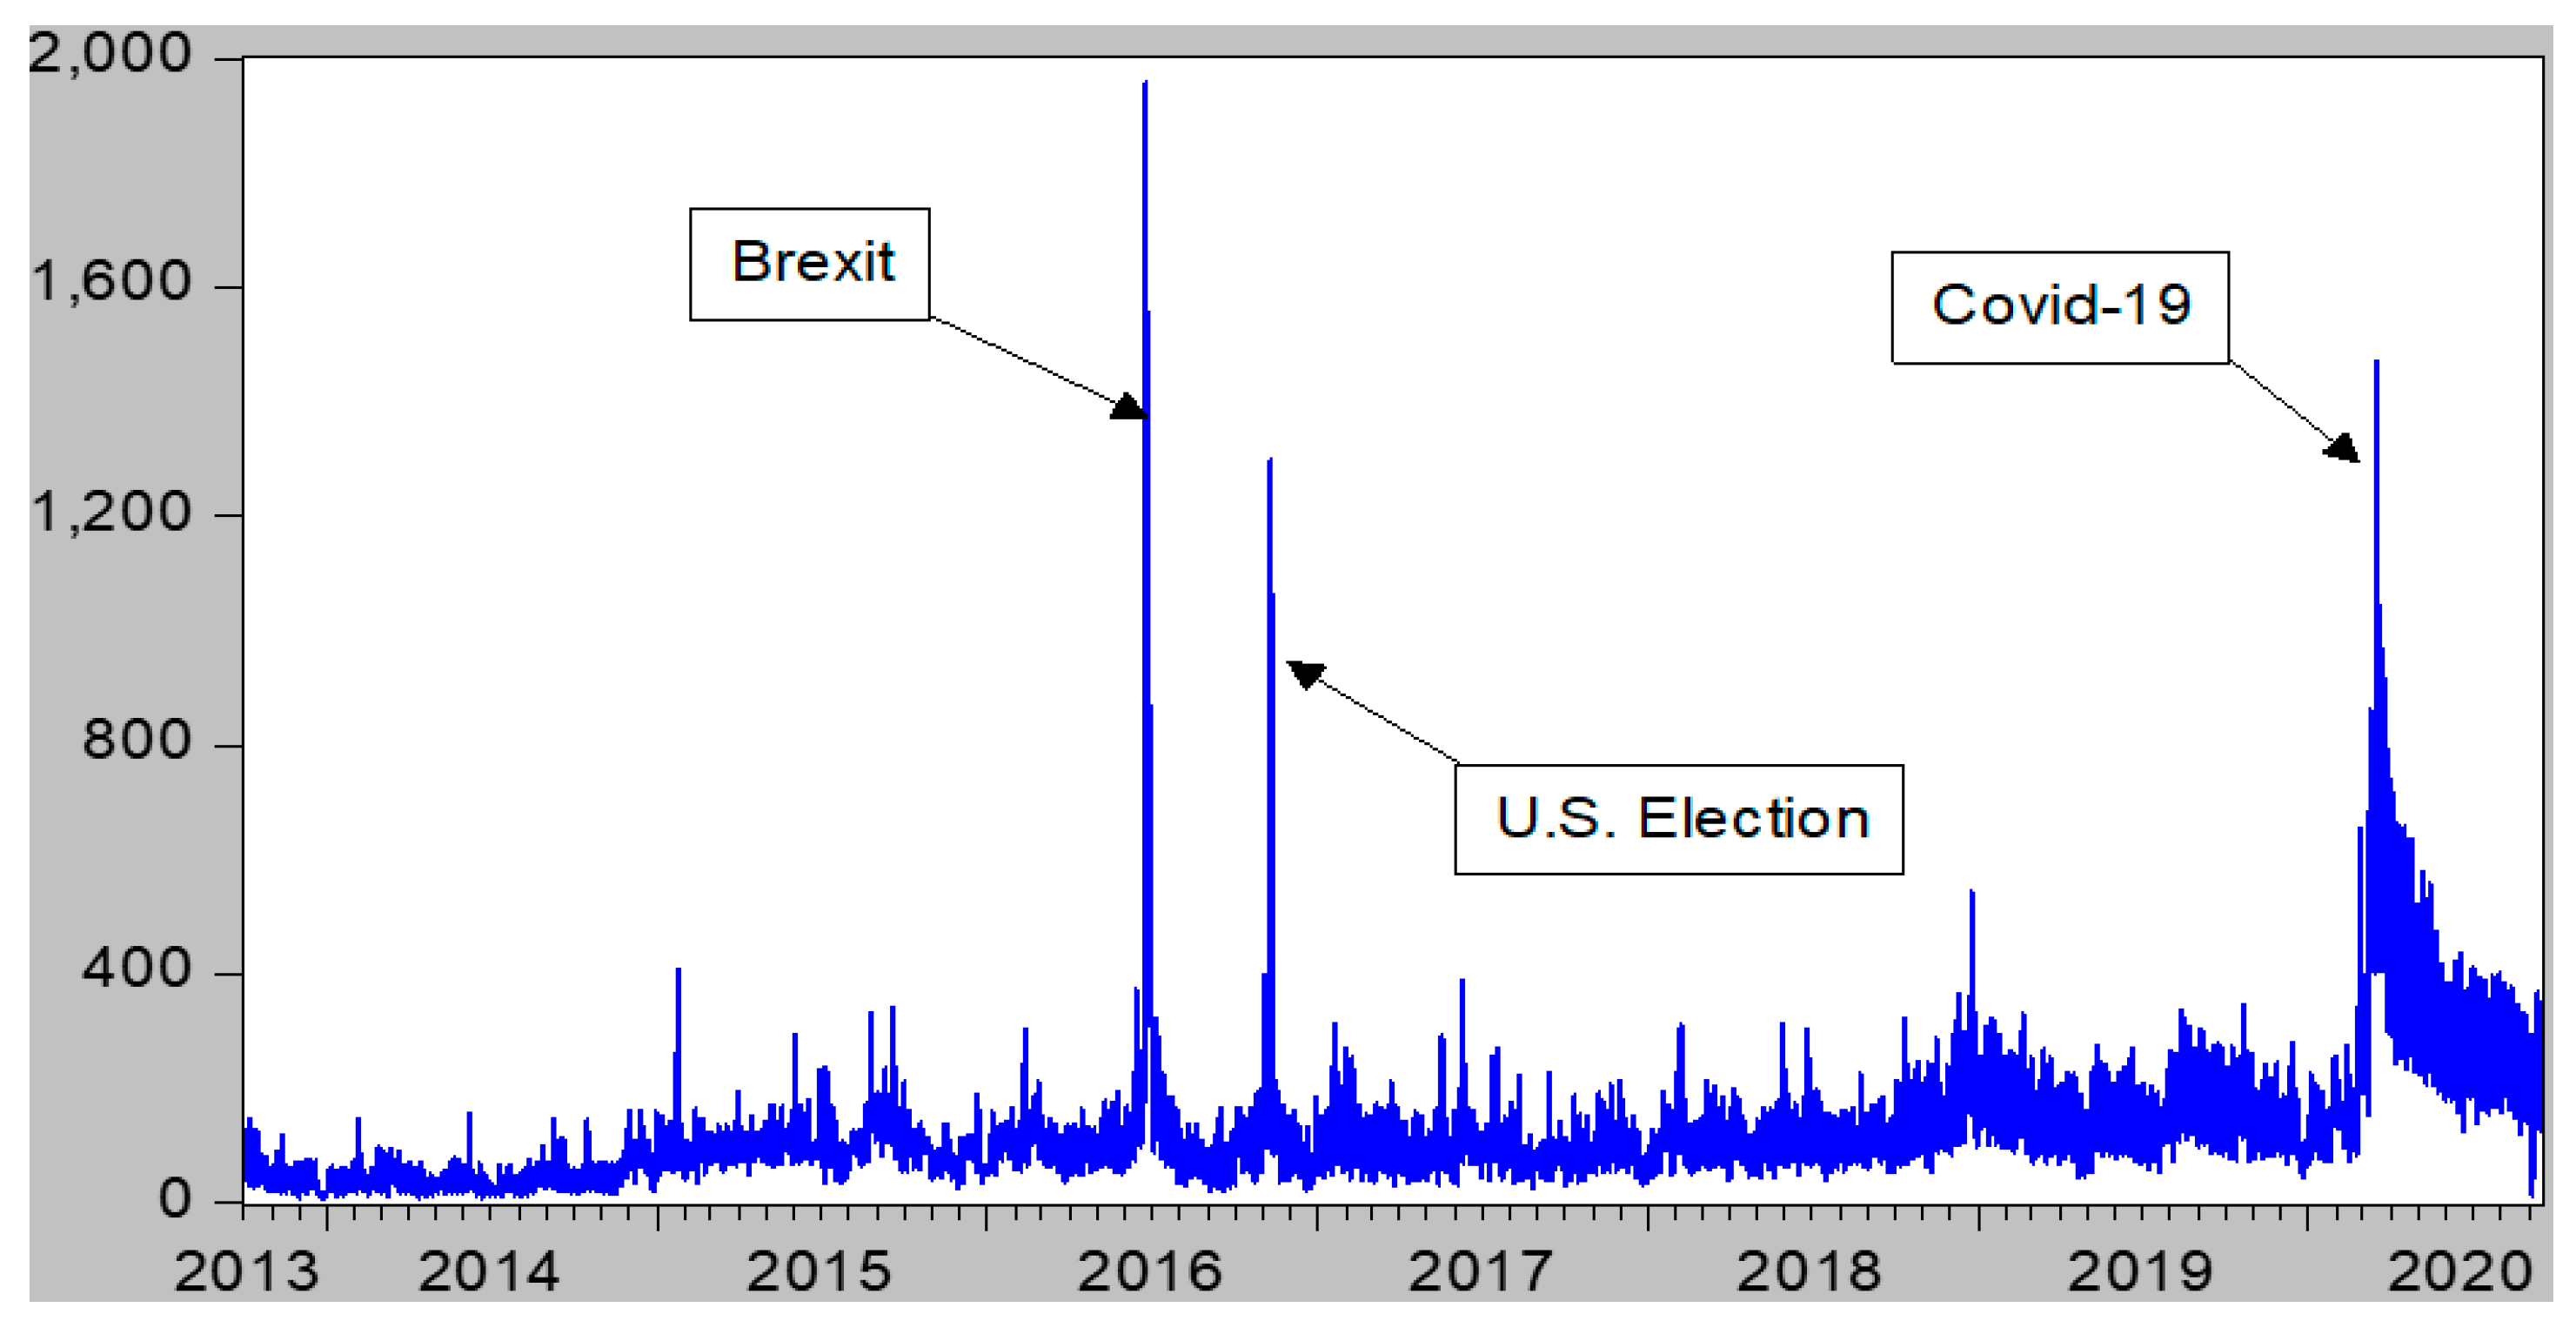
TMU data were collected at a daily frequency from the policy uncertainty website (https://www.policyuncertainty.com (accessed on 15 October 2020).1 Figure 1 plots the evolution of the TMU over the sample period of 1 October 2013 until 15 September 2020.
During uncertain events, the TMU increases considerably. For example, spikes in the TMU can be observed during the Brexit referendum and the 2016 U.S presidential election. To understand the relationships between the TMU and Bitcoin before and during the COVID-19 pandemic, a breakpoint is required. We employed the Quandt–Andrews breakpoint test to check for one or more unknown structural breakpoints in the TMU time series. Unreported results suggested 24 February 2020 as a structural breakpoint.2 On this date, the TMU rose from 149 to 345, and remained elevated throughout the remainder of the sample. TMU in the logarithmic return form was paired with Bitcoin price data obtained from www.coindesk.com/price/ (accessed on 12 October 2020) following Katsiampa (2017). We calculated the daily logarithmic returns of Bitcoin prices (rBTC) and the conditional variance of those returns (GARCH). Following Bollerslev et al. (1992), we estimated a GARCH (p = 1, q = 1) model, which they argue is preferable for modeling volatilities over longer sample periods. Instead of using unconditional variance, which is a long-run forecast of variance, we used generalized autoregressive conditional heteroskedastic variance because conditional variance provides variance over the holding period by incorporating information from the immediate past, and because it is heteroskedastic in nature, it varies over time.
3. Empirical Results
3.1. Univariate Results
Contemporaneous correlations were estimated for the pre-pandemic and COVID-19 periods separately. We found a slight negative correlation between rBTC and TMU before the pandemic of −4%. During the pandemic, we found that rBTC and TMU were positively correlated at 5.3%. Furthermore, GARCH and TMU were negatively correlated at 10% in the pre-pandemic period, and positively correlated at 5% during COVID-19. Although the contemporaneous correlations of these variables are not strong, we suspect there may be a relationship among lagged values of rBTC, GARCH, and TMU. To investigate these potential impacts, we estimated pairwise Granger causality tests. We selected an optimal lag of seven based on the Schwarz information criterion (SIC).3 Table 1 contains the results for the pre-COVID-19 period and the COVID-19 period separately. Interestingly, in the pre-COVID-19 period, TMU was not a leading indicator of the rBTC or GARCH; however, in the highly uncertain COVID-19 period, the amount people tweeted about uncertainty was a leading indicator of both Bitcoin returns and conditional volatility. Additionally, results show that Bitcoin’s conditional volatility contains leading information about the amount that people tweet about market uncertainty in the pandemic period.
Given the unique circumstances created by COVID-19-induced lockdowns and restrictions on social interactions, people appeared to be seeking community through social media platforms such as Twitter. Our initial results indicate that during the pandemic, interactions on social media had an impact on Bitcoin price formation. Although pairwise Granger causality does not capture the underlying complex information exchanges between the TMU and Bitcoin, the above analysis is informative in that it shows the endogenous relationship among the variables.
3.2. Bayesian Vector Auto-Regression Analysis (BVAR)
We used vector autoregression (VAR) as the tool to analyze the dynamic relationships among our endogenous variables. One attractive feature of VAR analysis is that it allows each variable in the system to be treated symmetrically. For example, in a bivariate VAR consisting of Bitcoin returns and TMU, the time path of returns can be affected by current and past realizations of the return sequence; the time path of the return sequence can also be affected by current and past realizations of the TMU sequence. Similarly, the time path of the TMU sequence is affected by current and past realizations of both the return and TMU sequences. Another attractive feature of VAR is that the structure of the system incorporates feedback because the variables in the system can affect each other (Enders 2004). We employed a BVAR with a “Minnesota prior” method. Koop and Korobilis (2010) suggest that Bayesian methods are a superior technique of dealing with the problem of over-parameterization when the length of a time-series is limited. We estimated a BVAR for the pre-COVID-19 period and the COVID-19 period separately. All variables were found to be stationary using standard augmented Dickey–Fuller tests. Seven lags were selected based on the SIC conditions, and the endogenous variables were rBTC, GARCH, and TMU. We investigated generalized impulse responses functions (IRFs) where the ordering of the BVAR variables is unimportant (Pesaran and Shin 1998).
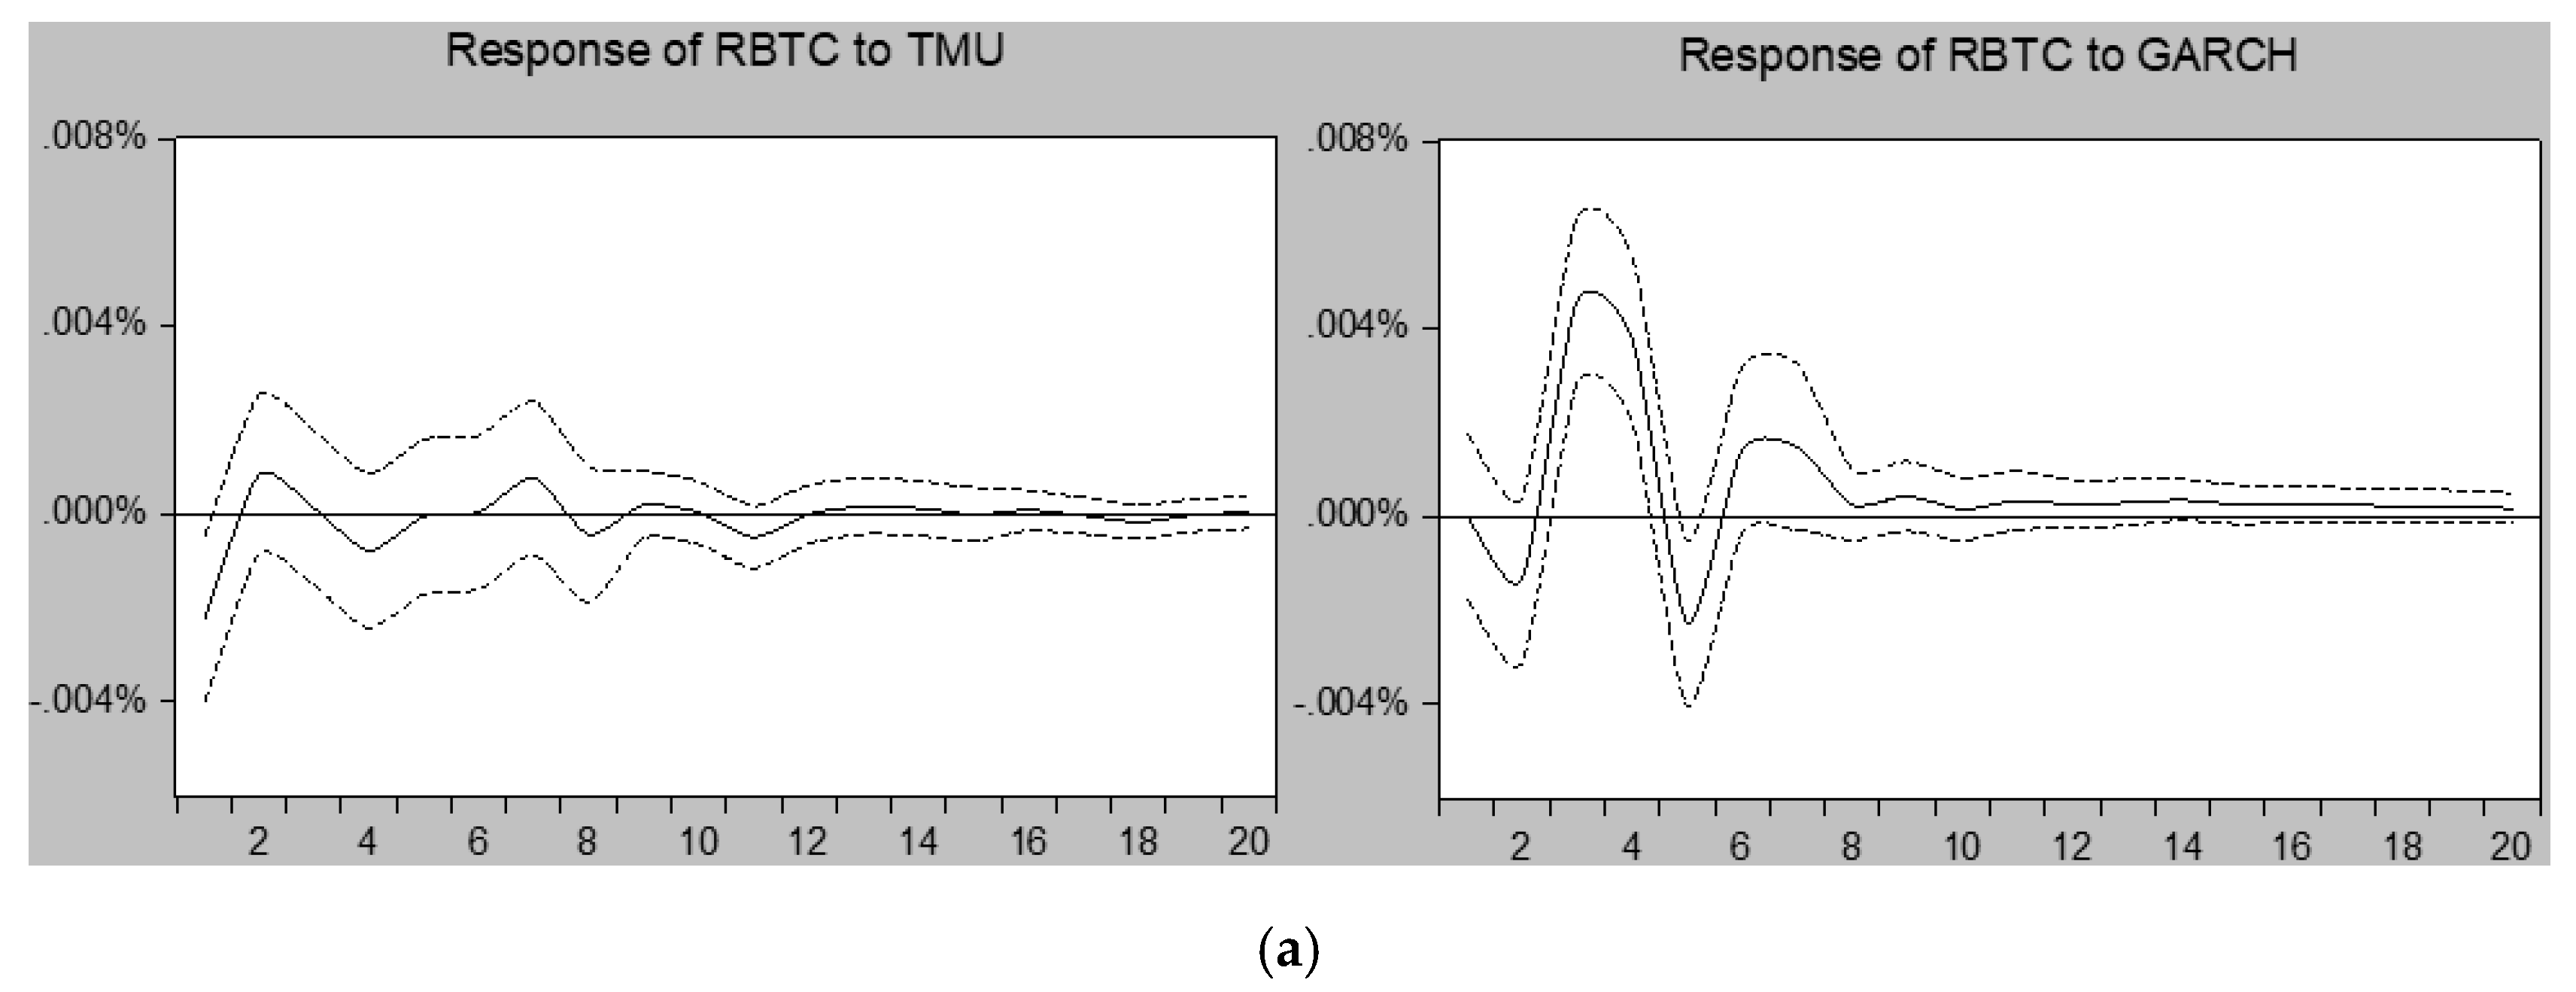
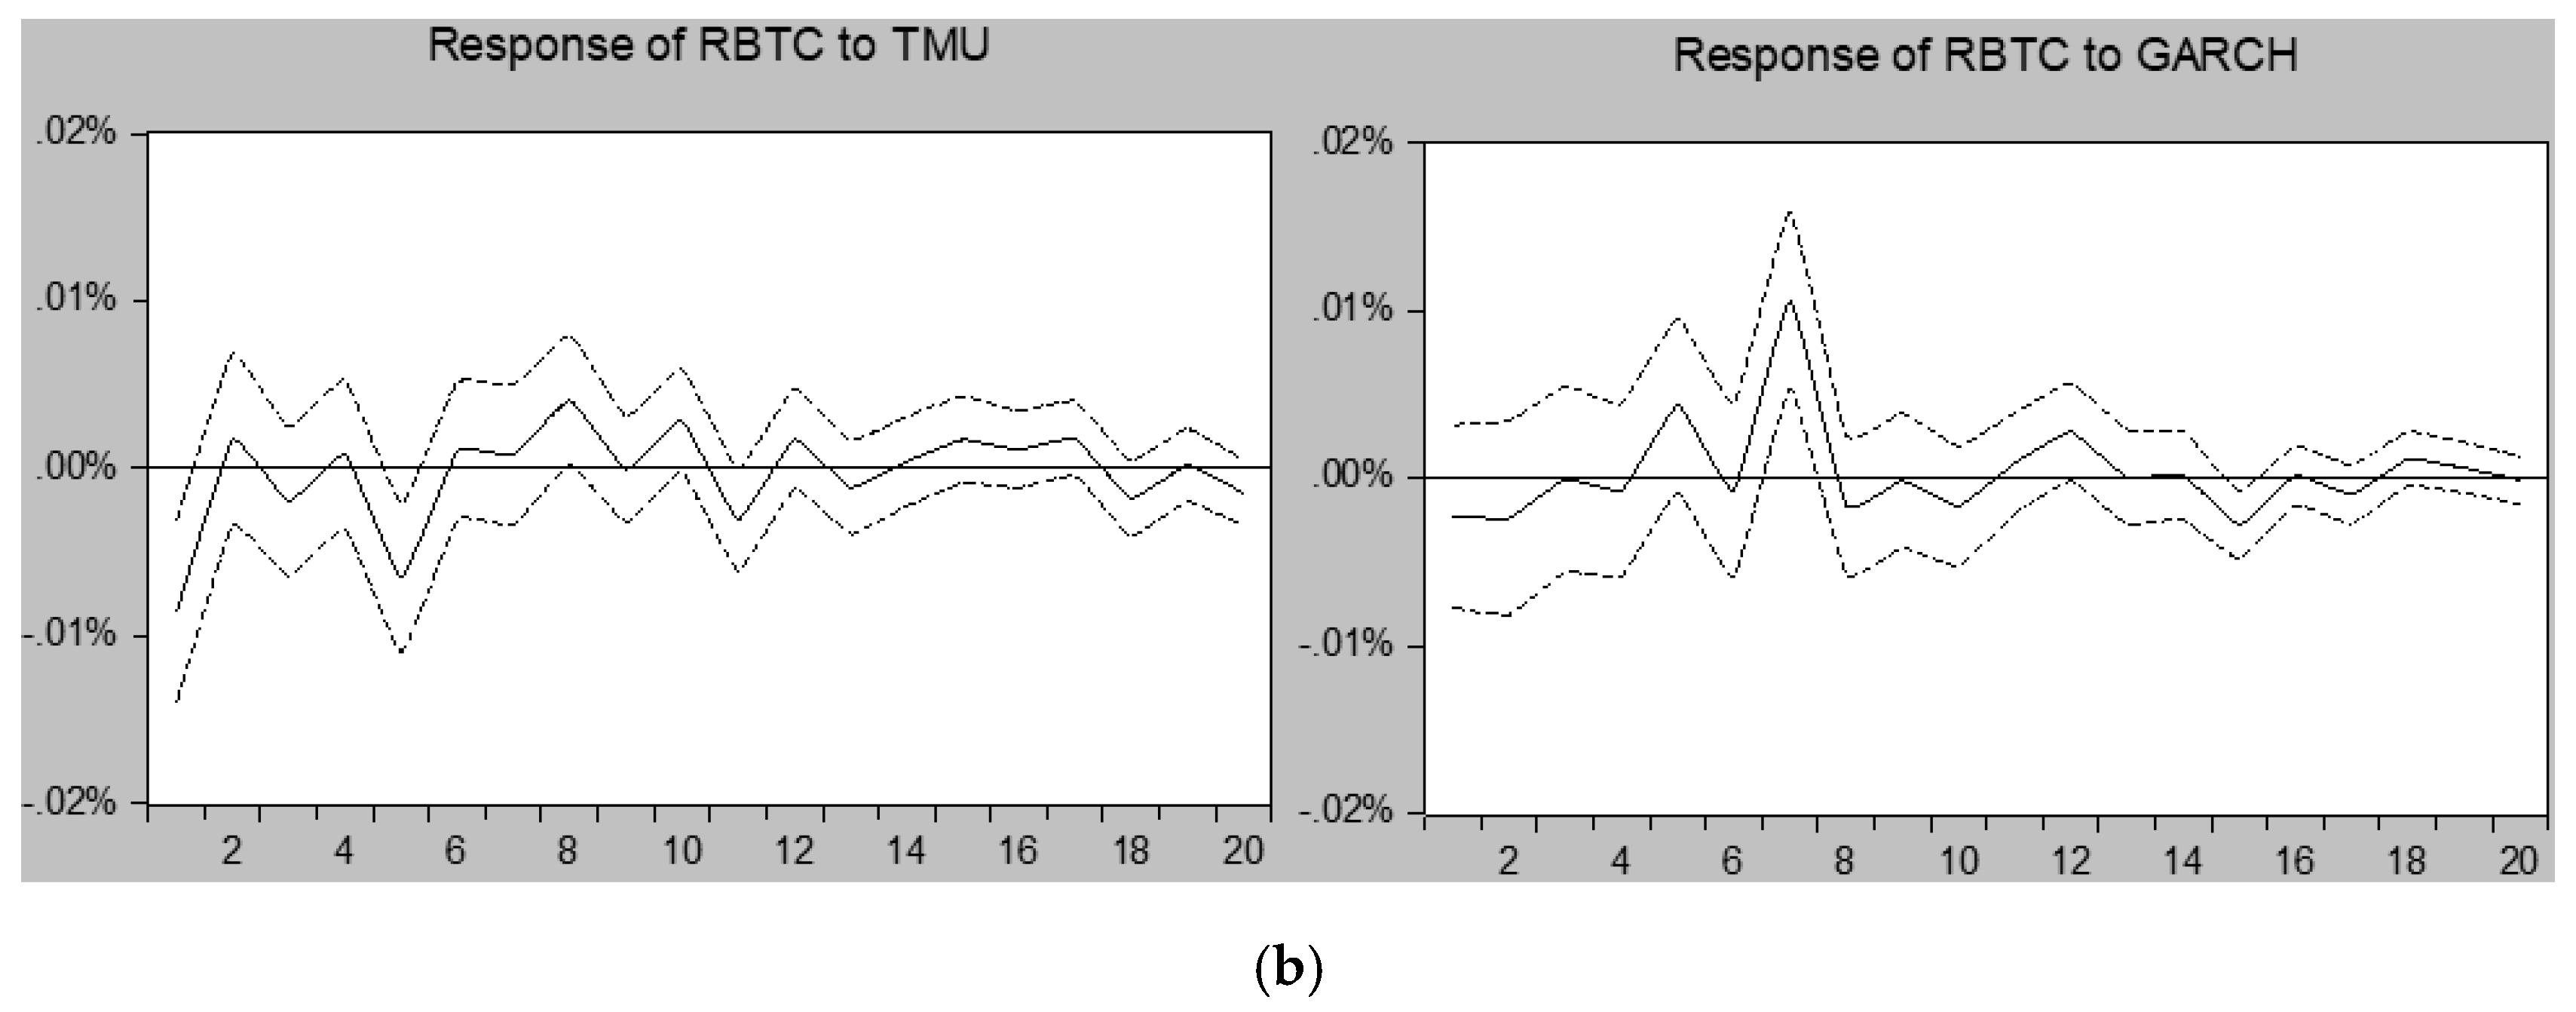
Panels A and B of Figure 2, Figure 3 and Figure 4 show the IRFs for the pre-COVID-19 and COVID-19 periods, respectively. The impact of shocks was analyzed over a 20-day period. Figure 2 plots the IRF for the rBTC. A comparison shows that, in general, rBTC was more responsive to all shocks during the COVID-19 period. In the pre-COVID-19 period, the TMU had an impact on rBTC of about −0.23% in the first day following a shock, and this impact dissipated quickly. This is expected because news is typically impounded into prices quickly. In contrast, in the COVID-19 period, TMU impacted the rBTC by approximately −0.68% in the first day following a shock, and the impact continued to affect returns for about one week following the shock. The stronger impact of TMU on rBTC may be due to the COVID-19-induced lockdowns resulting in more people following Twitter and trading Bitcoin. Figure 3 reports the IRFs for the conditional volatility of Bitcoin returns. An unexpected shock to TMU had a larger and more persistent impact on the GARCH in the COVID-19 period compared to the pre-COVID-19 period, similar to the results for the rBTC sequence.
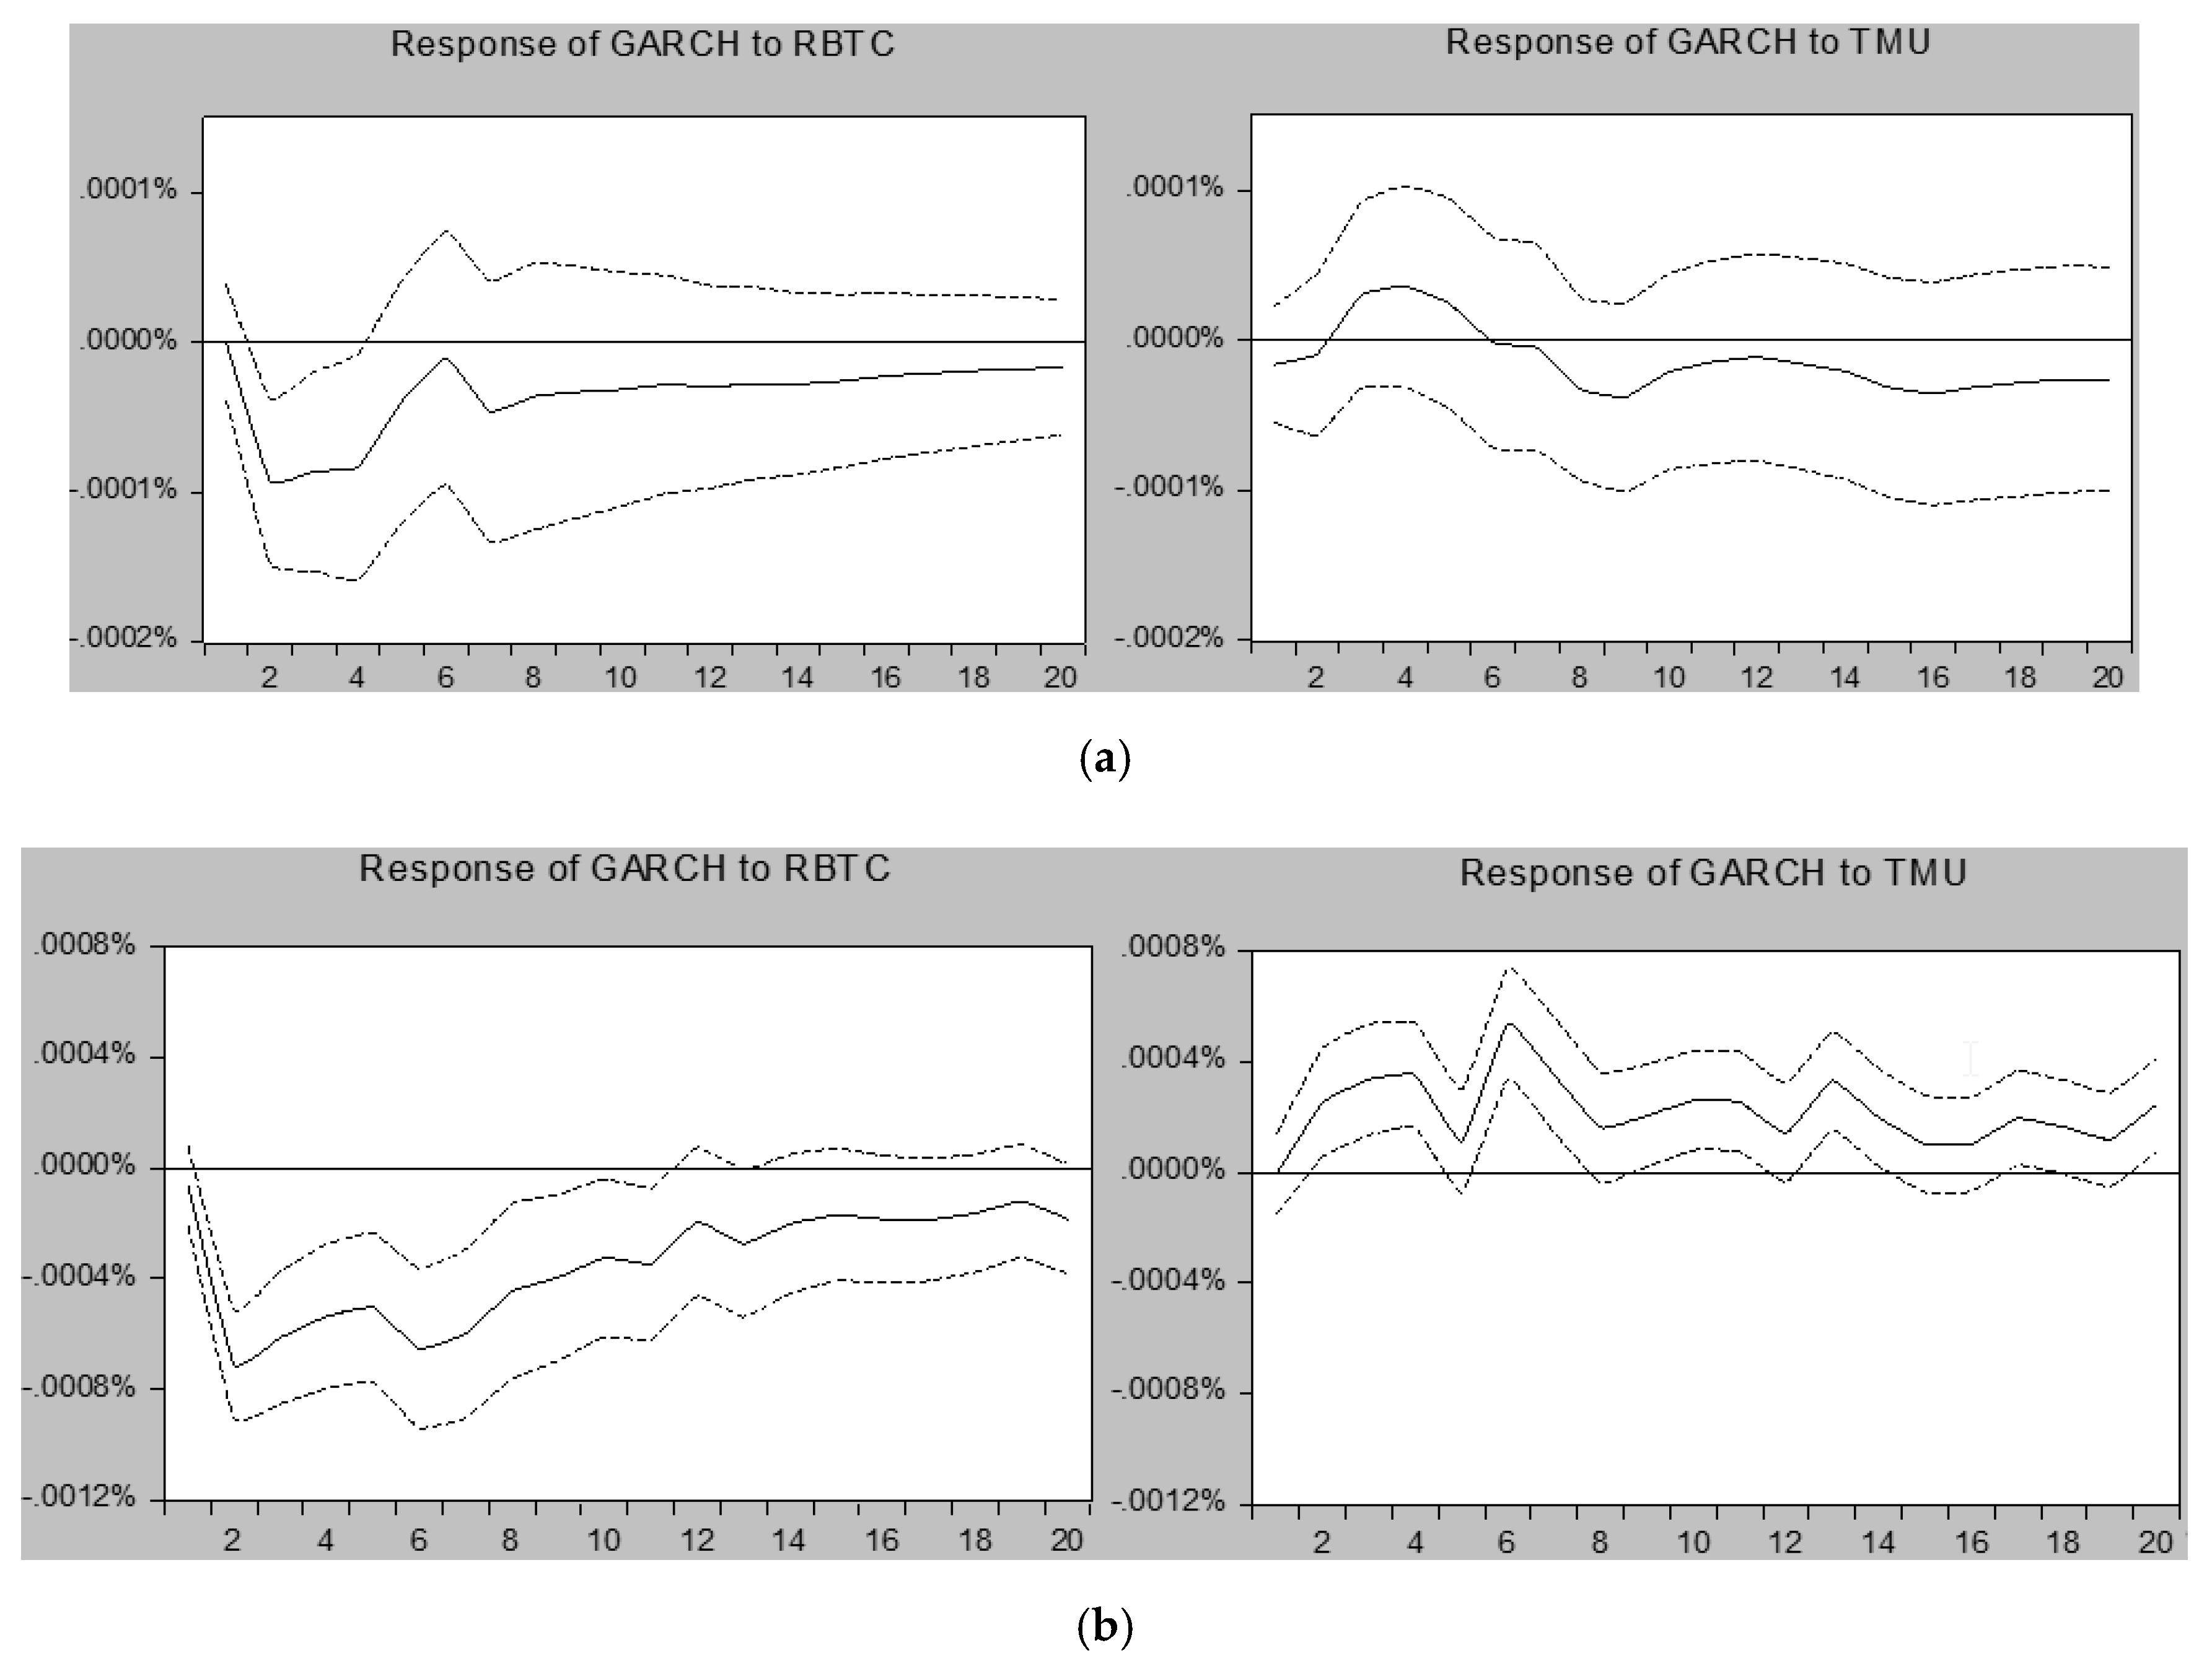
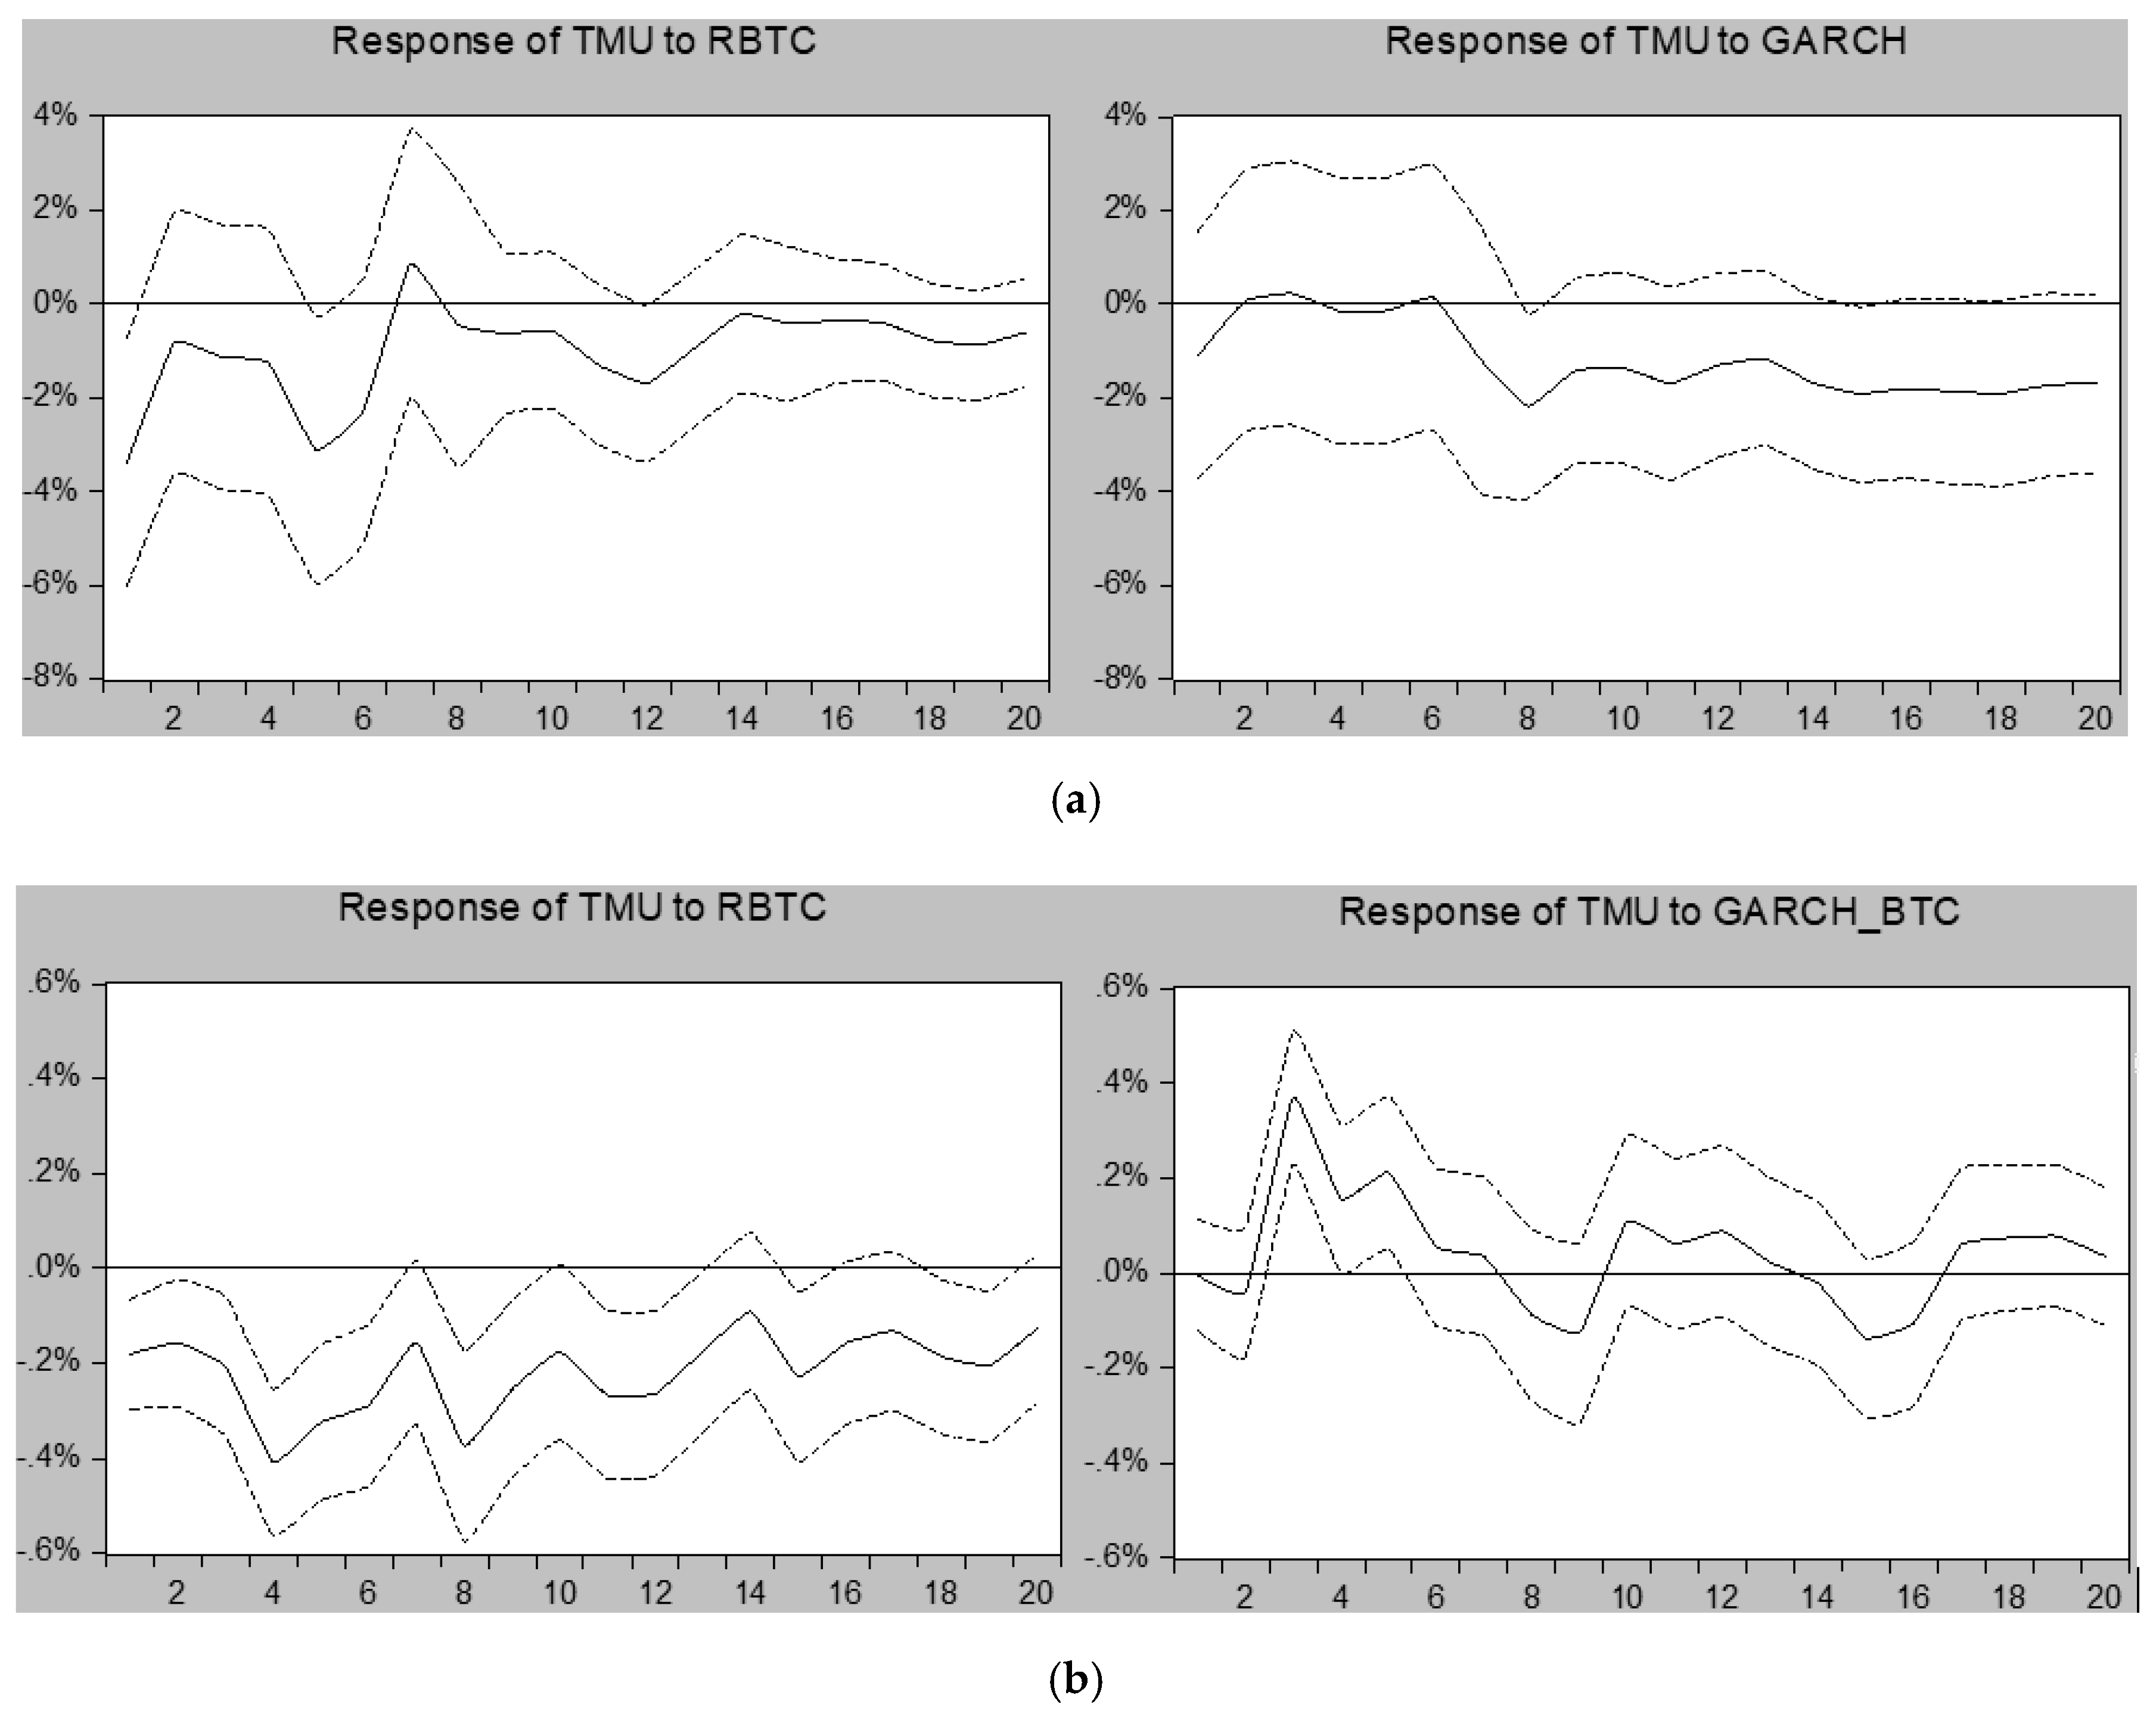
Figure 4 reports the IRFs for TMU. Although Bitcoin variables tended to impact the TMU in all periods, the IRF shows that the impacts were much more prominent in the COVID-19 period. In the pre-COVID-19 period, a positive shock to the rBTC decreased TMU by about 1.3%, whereas during the COVID-19 period, a positive shock to the rBTC decreased the TMU by over 4%. Again, we suspect that the increased userbase of Twitter combined with the enforced mobility restrictions led to more people following Bitcoin and tweeting about its price movement. We also observed that TMU was much more sensitive to the conditional volatility of Bitcoin in the COVID-19 period. During the pandemic, the uncertainty content of people’s tweets was impacted by the highly salient cryptocurrency market.
4. Discussion
Amidst increased uncertainty, fear, and disruptions in leisure time, people seek community. Social media platforms such as Twitter provide this community virtually. Increased reliance and the use of social media for information has led to an increase in the predictability of Bitcoin returns and conditional volatility from the information provided by this virtual society. Furthermore, the unique COVID-19-induced lockdowns have led to a greater number of people following and tweeting about Bitcoin. Our results indicate that Bitcoin prices and conditional volatility significantly impact the amount that people tweet about market uncertainty.
Funding
This research received no external funding.
Conflicts of Interest
The author declares no conflict of interest.
References
- Agrawal, Shreyash, Pablo D. Azar, Andrew W. Lo, and Taranjit Singh. 2018. Momentum, mean-reversion, and social media: Evidence from stocktwits and twitter. The Journal of Portfolio Management 44: 85–95. [Google Scholar] [CrossRef]
- Ahn, Yongkil, and Dongyeon Kim. 2020. Sentiment disagreement and bitcoin price fluctuations: A psycholinguistic approach. Applied Economics Letters 27: 412–16. [Google Scholar] [CrossRef]
- Bollen, Johan, Huina Mao, and Xiao-Jun Zeng. 2011. Twitter mood predicts the stock market. Journal of Computational Science 2: 1–8. [Google Scholar] [CrossRef] [Green Version]
- Bollerslev, Tim, Ray Y. Chou, and Kenneth F. Kroner. 1992. ARCH Modeling in Finance: A Review of the Theory and Empirical Evidence. Journal of Econometrics 52: 5–59. [Google Scholar] [CrossRef]
- Bukovina, Jaroslav. 2016. Social media big data and capital markets-an overview. Journal of Behavioral and Experimental Finance 11: 18–26. [Google Scholar] [CrossRef]
- Çepni, Oğuzhan, I. Ethem Guney, Rangan Gupta, and Mark E. Wohar. 2020. The role of an aligned investor sentiment index in predicting bond risk premia of the US. Journal of Financial Markets 51: 100541. [Google Scholar] [CrossRef]
- Demir, Ender, Gozgor Giray, Chi Keung Marco Lau, and Samuel A. Vigne. 2018. Does economic policy uncertainty predict the Bitcoin returns? An empirical investigation. Finance Research Letters 26: 145–49. [Google Scholar] [CrossRef] [Green Version]
- Enders, Walter. 2004. Applied Econometric Time-Series. New York: John Wiley and Sons. [Google Scholar]
- Goczek, Łukasz, and Ivan Skliarov. 2019. What drives the Bitcoin price? A factor augmented error correction mechanism investigation. Applied Economics 51: 6393–410. [Google Scholar] [CrossRef]
- Hutchinson, Andrew. 2020. Twitter Adds More Users in Q2, but Sees Revenue Decline 19%. Available online: https://www.socialmediatoday.com/news/twitter-adds-more-users-in-q2-but-sees-revenue-decline-19/582222/ (accessed on 30 January 2021).
- Kapar, Burcu, and Jose Olmo. 2021. Analysis of Bitcoin prices using market and sentiment variables. World Economy 44: 45–63. [Google Scholar] [CrossRef]
- Katsiampa, Paraskevi. 2017. Volatility estimation for Bitcoin: A comparison of GARCH models. Economics Letters 158: 3–6. [Google Scholar] [CrossRef] [Green Version]
- Koop, Gary, and Dimitris Korobilis. 2010. Bayesian multivariate time series methods for empirical macroeconomics. Foundations and Trends in Econometrics 3: 267–358. [Google Scholar] [CrossRef]
- Pesaran, H. Hashem, and Yongcheol Shin. 1998. Generalized impulse response analysis in linear multivariate models. Economics Letters 58: 17–29. [Google Scholar] [CrossRef]
- Ramelli, Stefano, and Alexander F. Wagner. 2020. Feverish stock price reactions to covid-19. The Review of Corporate Finance Studies 9: 622–55. [Google Scholar] [CrossRef]
- Sprenger, Timm O., Philipp G. Sandner, Andranik Tumasjan, and Isabell M. Welpe. 2014. News or noise? Using twitter to identify and understand company-specific news flows. Journal of Business Finance & Accounting 41: 791–830. [Google Scholar]
- Zhang, Dayong, Min Hu, and Qiang Ji. 2020. Financial markets under the global pandemic of COVID-19. Finance Research Letters 36: 101528. [Google Scholar] [CrossRef] [PubMed]
| 1 | The authors first extracted all tweets sent on Twitter that contained keywords related to uncertainty, as well as keywords related to equity markets (TMU). To construct the TMU index, the authors rescaled the series to a mean of 100 from 2010 to 2015. A complete description of the construction of these data is also available upon request. We thank the authors for making the data available. |
| 2 | Results are available upon request. |
| 3 | Results are available upon request. |
Figure 1.
Tweets about equity market uncertainty. Notes: Figure 1 plots the daily time series of the TMU index from 1 October 2013 to 15 September 2020.
Figure 1.
Tweets about equity market uncertainty. Notes: Figure 1 plots the daily time series of the TMU index from 1 October 2013 to 15 September 2020.

Figure 2.
(a) Pre-COVID-19 (b) During COVID-19. Notes: VAR. The endogenous variables were rBTC, TMU, and GARCH. Generalized impulse responses are shown along with 90% confidence bands. (a) shows the 20-day responses of rBTC to one standard deviation (S.D) positive shock to other variables for the period from 9 October 2013 to 23 February 2020 (pre-COVID). (b) shows the 20-day responses of rBTC to one S.D. positive shock to other variables for the period from 24 February to 15 September 2020 (COVID).


Figure 3.
(a) Pre-COVID-19, (b): During COVID-19. Notes: This figure shows impulse responses of GARCH to other variables in the endogenous Bayesian VAR. The endogenous variables were rBTC, TMU, and GARCH. Generalized impulse responses are shown along with 90% confidence bands. (a) shows the 20-day responses of GARCH to one S.D. positive shock to other variables for the period from 9 October 2013 to 23 February 2020 (pre-COVID). (b) shows the 20-day responses of TMU to one S.D. positive shock to other variables for the period from 24 February to 15 September 2020 (COVID).

Figure 4.
(a): Pre-COVID-19, (b) During COVID-19. This figure shows impulse responses of TMU to other variables in the endogenous Bayesian VAR. The endogenous variables were rBTC, TMU, and GARCH. Generalized impulse responses are shown along with 90% confidence bands. (a) shows the 20-day responses of TMU to one S.D. positive shock to other variables for the period from 9 October 2013 to 23 February 2020 (pre-COVID). (b) shows the 20-day responses of TMU to one S.D. positive shock to other variables for the period from 24 February to 15 September 2020 (COVID).


Table 1.
Pairwise Granger causality tests.
| Null Hypothesis: | Pre-COVID | COVID |
|---|---|---|
| GARCH does not Granger-cause rBTC | 0.00 *** | 0.00 *** |
| TMU does not Granger-cause rBTC | 0.67 | 0.00 *** |
| rBTC does not Granger-cause GARCH | 0.00 *** | 0.00 *** |
| TMU does not Granger-cause GARCH | 0.39 | 0.00 *** |
| rBTC does not Granger-cause TMU | 0.29 | 0.55 |
| GARCH does not Granger-cause TMU | 0.71 | 0.00 *** |
Notes: Table 1 presents the results for the pairwise Granger causality test for the pre-pandemic period (1 October 2013–23 February 2020) and the pandemic period (24 February 2020–15 September 2020) separately. p-values are reported for each test. The *** represents significance at the 1% level.
Publisher’s Note: MDPI stays neutral with regard to jurisdictional claims in published maps and institutional affiliations. |
© 2021 by the author. Licensee MDPI, Basel, Switzerland. This article is an open access article distributed under the terms and conditions of the Creative Commons Attribution (CC BY) license (https://creativecommons.org/licenses/by/4.0/).
Share and Cite
MDPI and ACS Style
French, J.J. #Bitcoin, #COVID-19: Twitter-Based Uncertainty and Bitcoin Before and during the Pandemic. Int. J. Financial Stud. 2021, 9, 28. https://0-doi-org.brum.beds.ac.uk/10.3390/ijfs9020028
AMA Style
French JJ. #Bitcoin, #COVID-19: Twitter-Based Uncertainty and Bitcoin Before and during the Pandemic. International Journal of Financial Studies. 2021; 9(2):28. https://0-doi-org.brum.beds.ac.uk/10.3390/ijfs9020028
Chicago/Turabian StyleFrench, Joseph J. 2021. "#Bitcoin, #COVID-19: Twitter-Based Uncertainty and Bitcoin Before and during the Pandemic" International Journal of Financial Studies 9, no. 2: 28. https://0-doi-org.brum.beds.ac.uk/10.3390/ijfs9020028
Note that from the first issue of 2016, this journal uses article numbers instead of page numbers. See further details here.