
The Impact of Higher Education Expansion on the Educational Wage Premium in Taiwan: 1985 to 2015

1
Department of Economics, National Chi Nan University, Nantoui 545, Taiwan
2
Strategy and Development of Emerging Industries, National Chi Nan University, Nantoui 545, Taiwan
*
Author to whom correspondence should be addressed.
Int. J. Financial Stud. 2021, 9(3), 38; https://0-doi-org.brum.beds.ac.uk/10.3390/ijfs9030038
Submission received: 15 June 2021
/
Revised: 9 July 2021
/
Accepted: 13 July 2021
/
Published: 26 July 2021
(This article belongs to the Special Issue Financial Issues of Emerging Industry)
Abstract
:This research investigates the impact of higher education expansion on the educational wage premium from a long-term perspective in Taiwan. By using 1985 to 2015 Manpower Utilization Survey (MUS) data with the difference-in-difference-in-differences model (DDD), this study analyzes the change of the wage premium of university educated versus lower-than-university educated counterparts across the expansion of higher education since 1995. The number of universities in Taiwan tripled between 1995 and 2005, from 50 to more than 150, with upgrading of about 100 technology colleges and vocational schools additionally. Dramatic expansion of universities as well as the number of university graduates will shrink the university wage premium for the young generation who entered into the labor market after year 2000, but the older generation will be less affected. The empirical results show that the wages premium of university graduates of the younger generation is 12% to 21% lower than their older generation counterparts due to the higher-education expansion.
1. Introduction
Human capital cultivated and accumulated through higher education features the key competency of the workforce. Higher education is recognized as one of the most important accelerators for economic development and industrial advancement. According to Oppedisano (2014), the proportion of university graduates aged 25–64 in OECD countries increased by 40% to 60% between 1997 and 2008. Obviously, the expansion of higher education is a global trend.
The Taiwan Government has adopted a regulatory policy on higher education for several decades. To avoid overinvesting and diluting resources that affect educational quality, the numbers of universities and students were highly controlled. The Government changed its higher education policies from highly regulated to widely open in the mid-1990s. From 1995 to 2005, the number of universities and science-and-technology universities in Taiwan tripled from 50 to more than 150 by mostly upgrading technology colleges and vocational schools. This means that about two-thirds of the “upgrading universities” are of about the same condition in terms of teachers and facilities, but with totally different titles. Furthermore, some of the 5-year colleges were upgraded to be 4-year poly-techs. Universities’ curricula were forced to be more focused on academic knowledge and less on applied skills training.
In consequence, the supply of undergraduate students increased rapidly and the variation of skilled labor (defined by attainment of a higher education diploma) enlarged remarkably. As a result, some of the university graduates are not of the same quality as their predecessors and this would supposedly reflect a devaluation of the university diploma, equivalent to the shrinkage of the college wage premium. This study focuses on the phenomenon of credential inflation by using the Manpower Utilization Survey from 1985 to 2015 (MUS 1985–2015) to compare the college premium of the older generation (control group) to that of the younger generation (treatment group) across the higher-education expansion period. It is natural to use a difference-in-difference-in-differences model to capture the change of the college premium between different generations (older versus younger) across time. Contributions of this study are as follows. First, we explore the wage premium changes over 30 years from 1985–2015. Second, we show the statistical evidence that the wages of university graduates are declining, and the educational premium is gradually deteriorating.
After the introduction and Section 1, the rest of this study is as follows: Section 2 is a literature review to discuss the relevant studies on college premiums; Section 3 lists data sources and the empirical model specifications; Section 4 is the empirical estimates and the conclusion is in Section 5.
2. Literature Review
Diploma devaluation is usually driven by the supply side of the labor market instead of demand side. Becker (1964) emphasizes that investment in education can improve the quality of manpower, increase productivity, and contribute to economic development and growth. Education and working experience represent productivity, which in turn determine the wages. When the productivity of higher-educated workers is greater than that of middle- and lower-educated ones, wages will be higher as well. The accumulation of human capital by increasing labor productivity through education is also a determinant of an individual’s social status. Given the demand for higher-educated skilled labor, increase in the supply of higher-educated workers will lower the wages offered (Collins 2011). The economic literature discusses the reasons for the wage gap from the supply and demand sides of labor (Berger 1983) and then discusses wage inequality resulting from the factors affecting the supply and demand sides. Gindling and Sun (2002) used 1978–1995 Manpower Utilization Survey data in Taiwan to examine the wage premium of college graduates; they concluded that the wage differentials between college-educated and non-college-educated workers have increased with the expansion of higher-education policies. The results suggest that the college premium was expanding prior to mid-1990. Following similar reasoning, if older and younger labor is not perfectly substituted in production, it is expected that changes in the labor supply of the higher-educated younger generation will have a greater impact on the wages of fresh university graduates than on the wages of older counterparts.
The abovementioned concept is fairly intuitive to illustrate by using a two-sector model. Assume the labor market is composed of two sectors, an older generation and a younger generation. Different generations are not perfect substitutes for each other. Each sector can be further divided into two educational levels: higher educated and lower educated. For the older generation, the supply and demand of different educational levels will not change for the few older aged people pursuing schooling, neither will the relative wages. In contrast, for the younger generation, if the supply of higher-educated skilled labor increases dramatically due to the expansion of higher education, it would imply decrease of the supply of lower-educated unskilled labor. Given these factors, wages of young skilled laborers will decrease and those of unskilled workers will increase. Wage gaps between higher/lower and skilled/unskilled laborers will reduce in the young generation. The rewards of higher education decline across the years with wages of young workers receiving higher education increasing less than those of older ones. The expansion of higher education increases competition among high-skilled workers and reduces educational rewards, but at the same time allows low-skilled workers to become a relatively scarce labor force and mitigate the downward pressure on wages (Chang 2017).
Truong and Nguyen (2021) used Mincer’s adjusted wage model and the instrumental variables (IV) model to examine the individual rates of return from higher education in Vietnam from 2002 to 2014. They found that the wages of higher-education graduates were higher than those of non-higher-educated ones. Yang and Gao (2018) explored the structural education source distribution and the rate of return to education of higher-education expansion to explain how the expansion of education affects income inequality with survey data from China. They decomposed the impact of educational expansion on the wage gap into price effects and structural effects. The structure effect and price effect of educational expansion have signification impacts on low-income, middle-income, and high-income workers. It was found that the structural effect reduces the wage gap and the price effect increases the wage gap. Therefore, the current expansion of education in China has not alleviated income inequality because the demand is higher than supply of high-skilled labor in the labor market.
Green and Henseke (2021) analyzed higher-education expansion trends of 26 European countries in which a greater participation rate was documented during years 2005 to 2015. Due to the global financial crises in 2008 and 2012, the slow economy led to a supply–demand imbalance in the labor market and the growth of wages showed a significant downward trend. Allen and Belfi (2020) investigated the impact of higher-education expansion on university graduates from 1996 to 2017 in the Netherlands. Results suggested that the expansion of higher education has rapidly increased the level of job skills required of graduates. The availability of graduate job vacancies has also increased over time to accommodate the ever-increasing supply of skilled labor. In consequence, the wages of graduates have stagnated and the wage premium of those with a university degree in comparison to high school counterparts was gradually narrowing. Despite the relatively low unemployment rate, a higher-education diploma in the labor market became less valuable and the labor market of college and university graduates was increasingly becoming a buyer’s market.
Ma (2019) analyzed the impact of higher-education policy expansion on the wages of university graduates in China from 1997–2011 using the difference-in-differences (DD) and difference-in-difference-in-differences (DDD) models. The treatment groups were set as a group aged 21–25 of university graduates and another treatment group aged 31–40. The statistical parameters estimated by DD were negative, but not significant. The DDD model also showed that the statistical parameters were insignificant. In general, the higher-education expansion has not affected the average wage level of young college graduates. The difference of the effect between different wage centiles is small.
In sum, higher-education expansion is a common phenomenon of primary countries but the impacts on wages of various educational levels are ambiguous, due to various magnitudes and time frames of education policy. Extraordinarily increasing the supply of higher-educated labor will lead to a crowding-out effect so that university graduates tend to compete for jobs that used to be filled by non-university graduates. Increasing higher-educated labor will also create ripple effects so that higher-educated workers gradually move into jobs done by the low-educated, and because of the competition for job opportunities, university graduates may suffer from over-education and an educational mismatch. Over-education has negative impacts on the wages of high-educated labor after the expansion of higher education and has caused a significant reduction in the wage premium (Hsu 2021).
3. Data and Model Specification
3.1. Data Sources and Variables
This research employed raw data from the Manpower Utilization Survey 1985–2015 and excludes employers, the self-employed, and home-employed. Only public and private sector employees are included in the analysis.
3.2. Definition of Variables and General Statistics
(1) Gender: 1 for male, 0 for female; (2) age: 20 to 65 years old; (3) junior group: aged 20–35 years old; (4) senior group: aged 45–65 years old; (5) higher education: university graduates; (6) non-higher education: college/high school/vocation graduates; (7) potential working experience: age—schooling year—6 (Mincer 1974); (8) experience squared: square of work experience divided by 100; (9) tenure: working year spent on the current job; (10) tenure squared: square of tenure year divided by 100; (11) marital status: 1 for married, 0 for otherwise; (11) employment status: public sector employee = 1, private sector employee = 0; (12) real wage: primary job wage level in real terms, year 2000 as base year.
General statistics of these variables in the two groups over the three decades are shown in Table 1. It is obvious that senior hourly wage rates were higher than those of juniors and the wage rates peaked in the second decade. Within the four categories of the tertiary education, vocational school counts the largest proportion at the beginning as 50% and 29% for junior and senior groups, respectively. The composition reshuffled across the three decades. For the junior group, university graduates were the minority (12.3%) in the first decade but became the majority (44.3%) in the third decade. For the senior group, ratios of university graduates remained stable at 22% to 24%. The different patterns of educational composition evolution between junior and senior groups facilitated a natural experiment on the relationship between expansion of higher education and diploma devaluation.
3.3. Real Wages of Junior Group vs. Senior Group
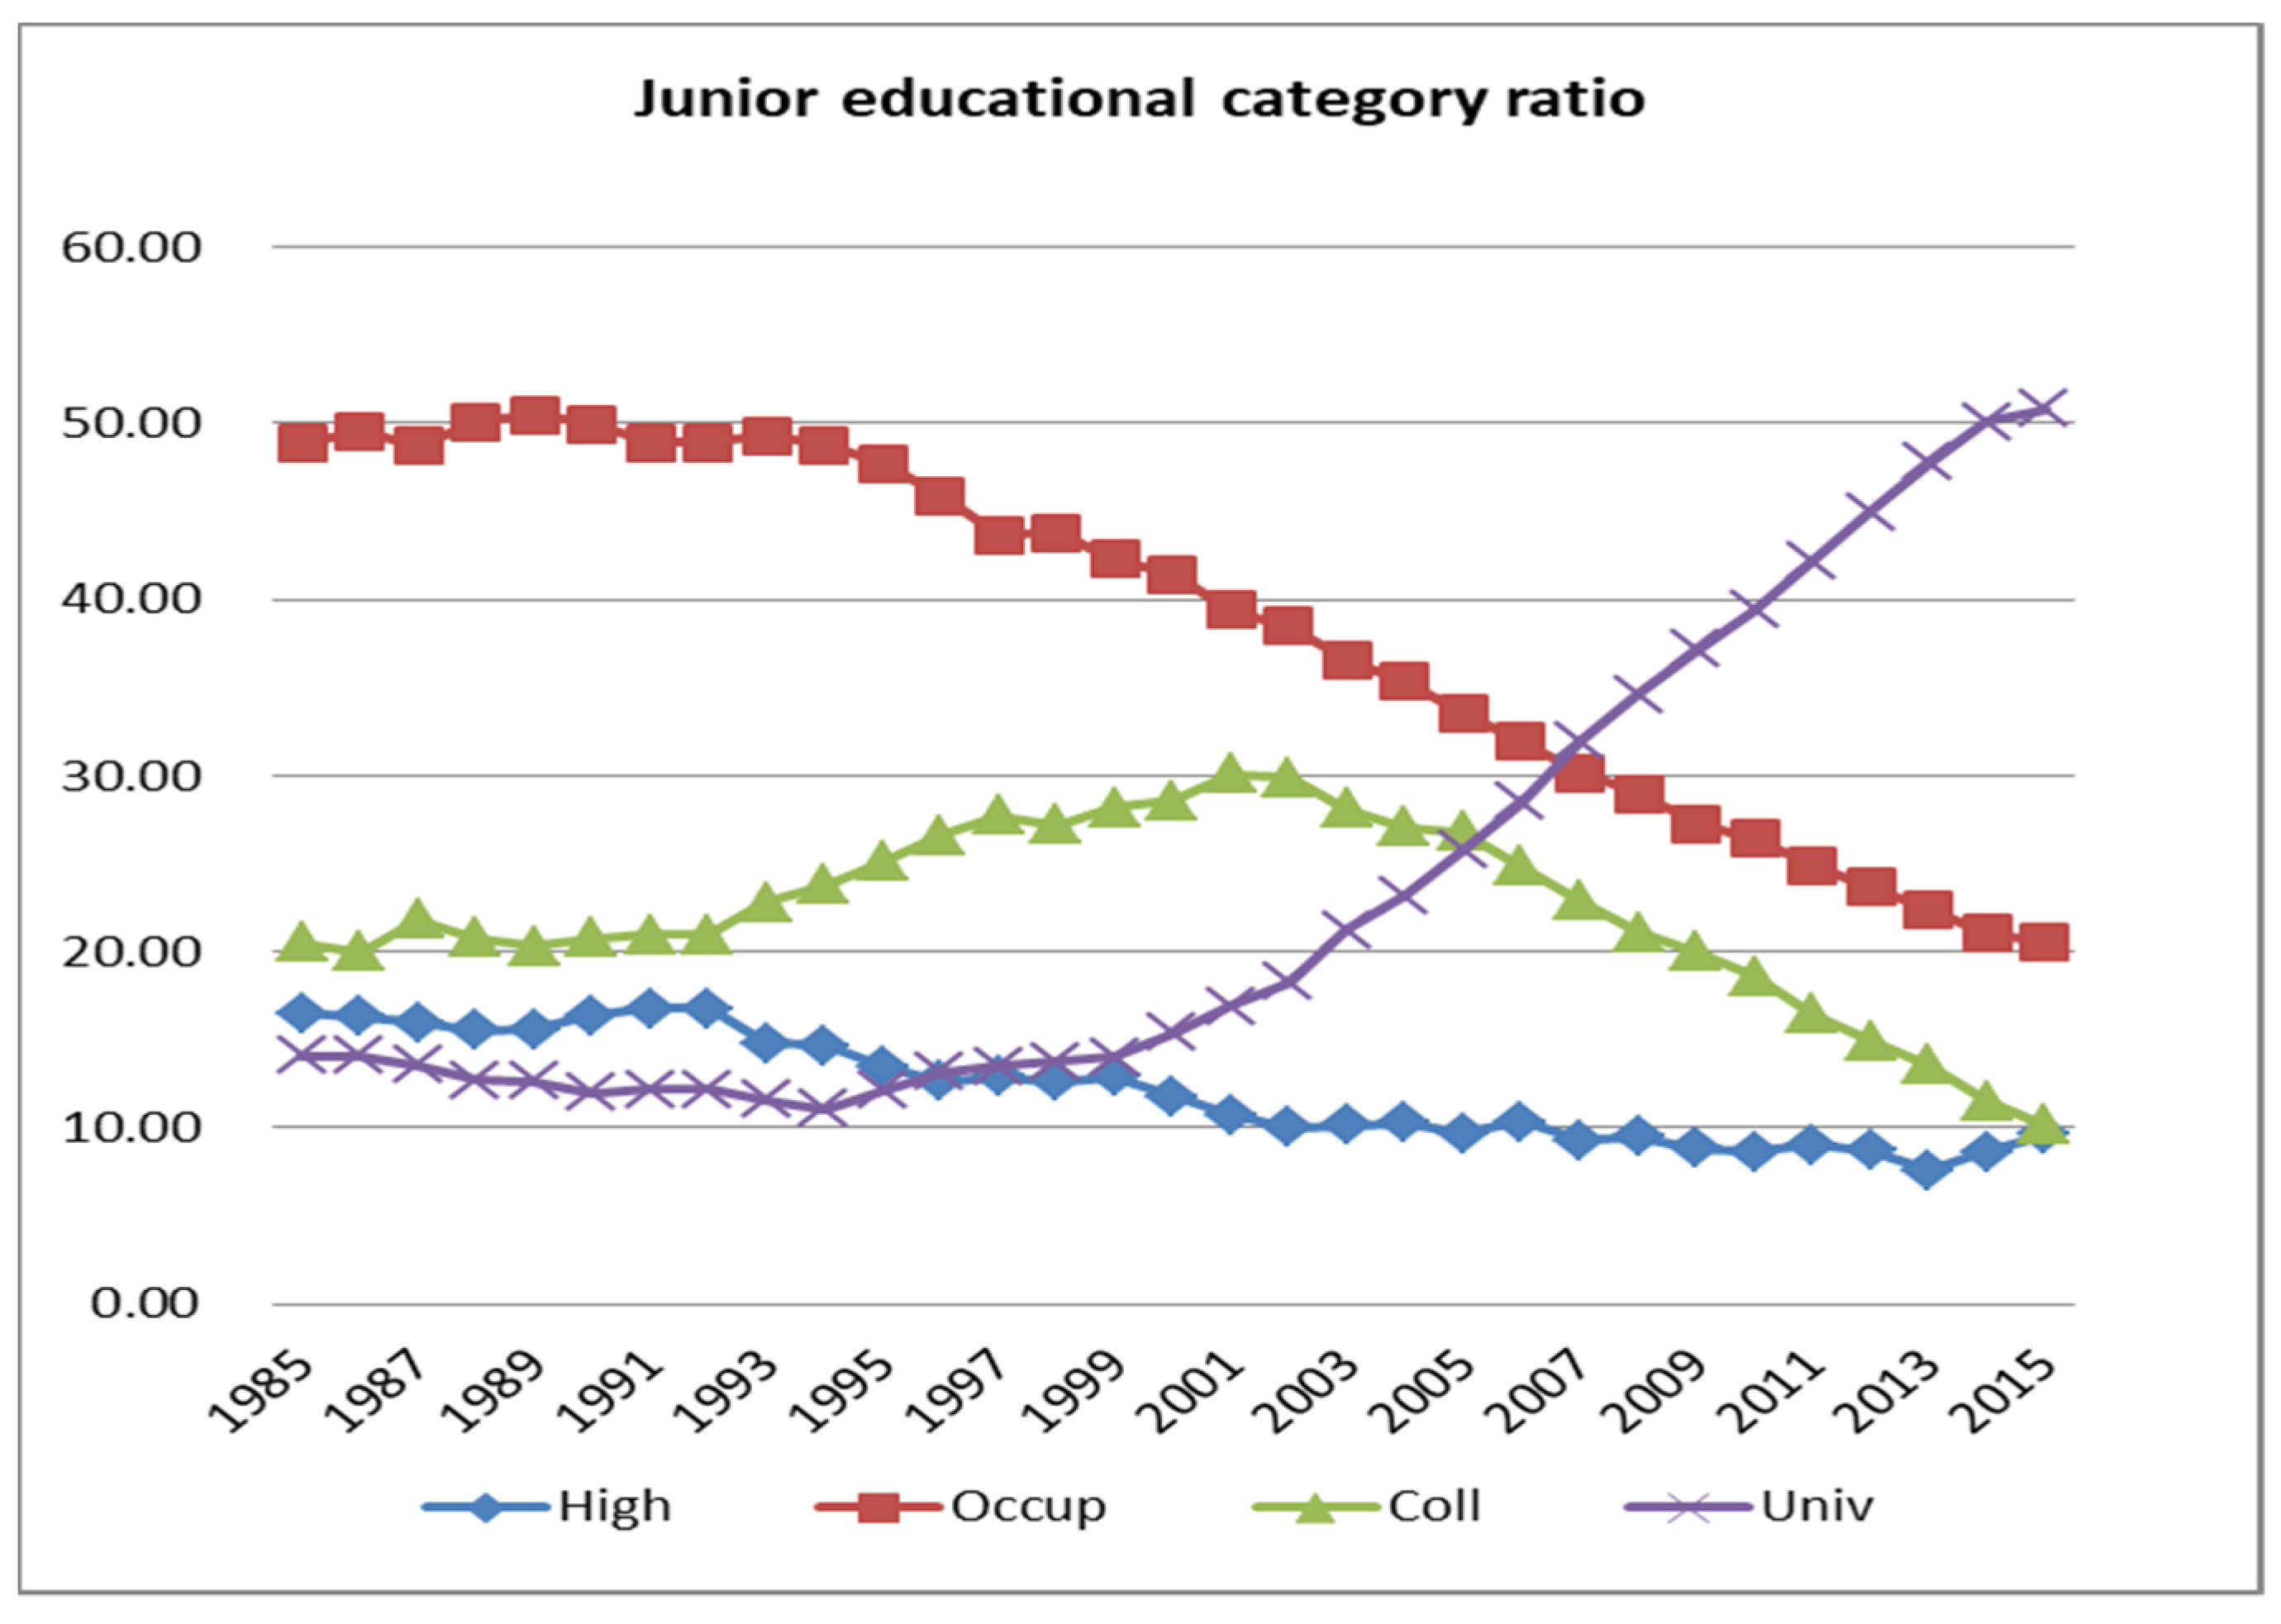
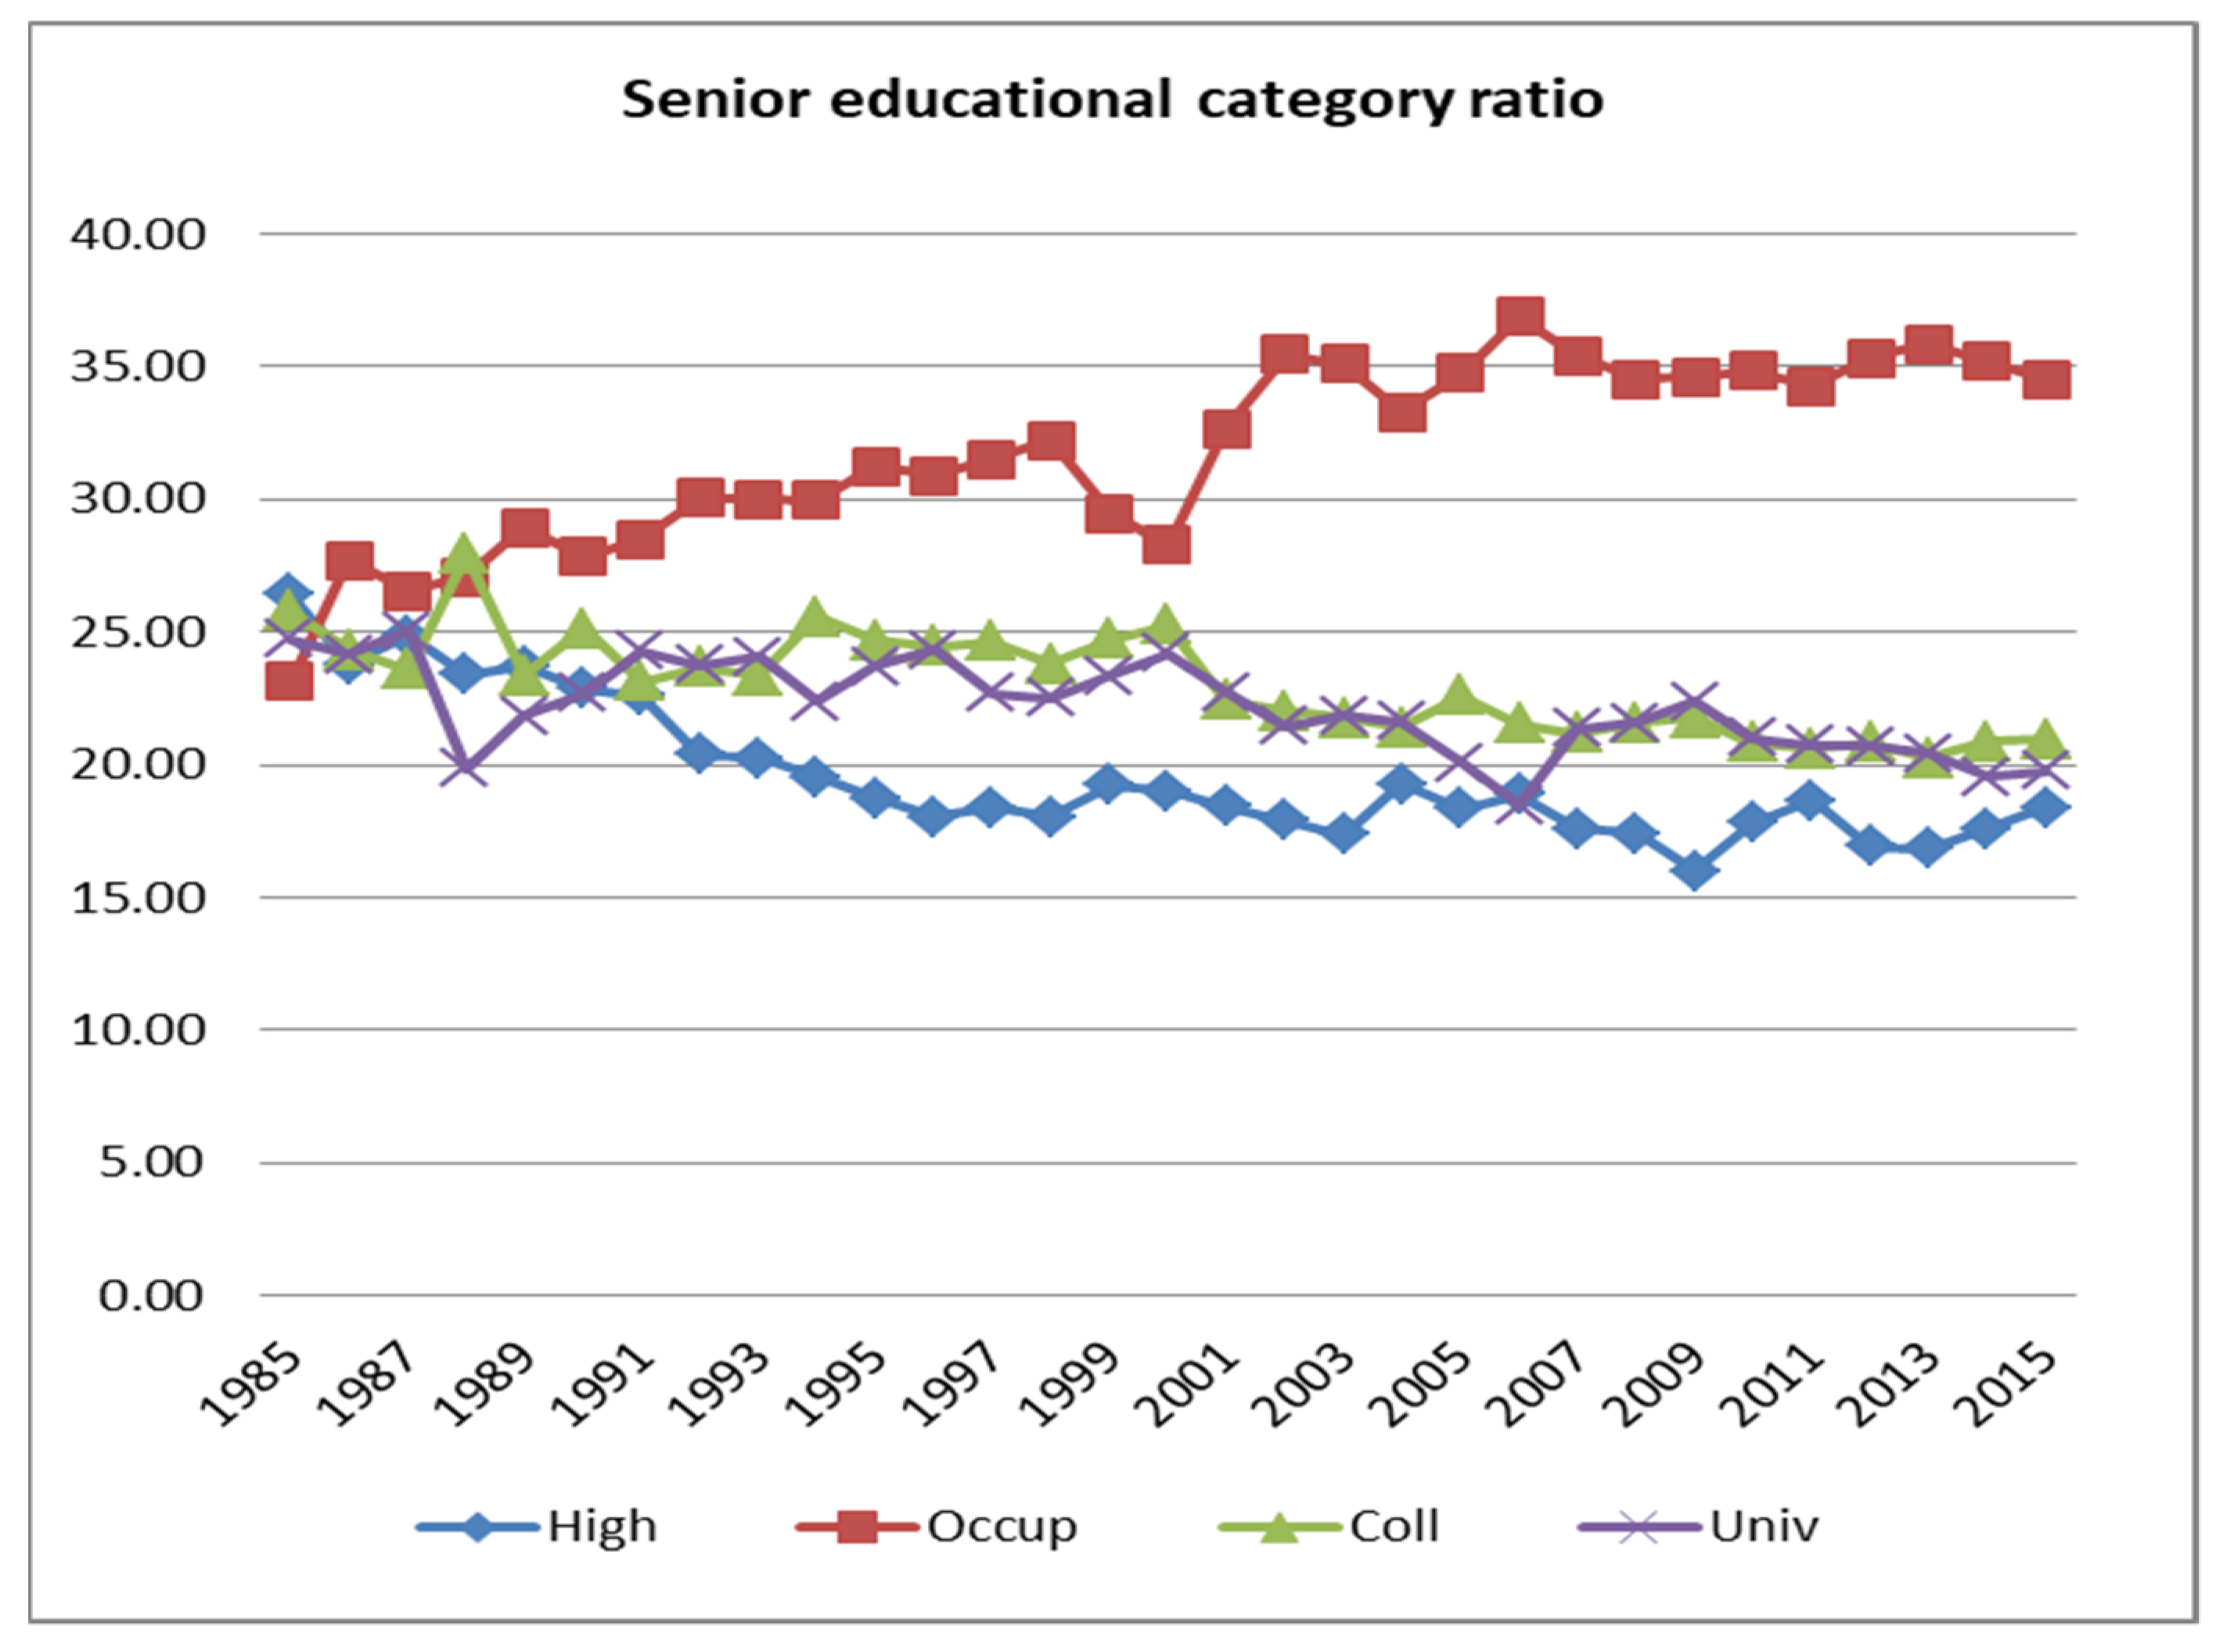
Figure 1 and Figure 2 show the trend of different educational categories over time of junior and senior groups. Figure 1 clearly indicates the reshuffle of university graduates and tertiary education; the ratio of university graduates was less than 15% up to year 1999. Then the ratio surged from 15% to more than 50% between years 2000 and 2015. The other sectors, including high school, college and vocational schools, all declined accordingly. It demonstrates the fast path of open policies on higher education in Taiwan. In contrast, the educational category compositions of the senior group were about the same and showed a moderate decline, from 25% to 20%, except that the ratio of those finishing occupational school increased from 25% to 35%. Changes of the composition of different educational categories of the labor force will presumably lead to changes of relative wages in between these educational categories.
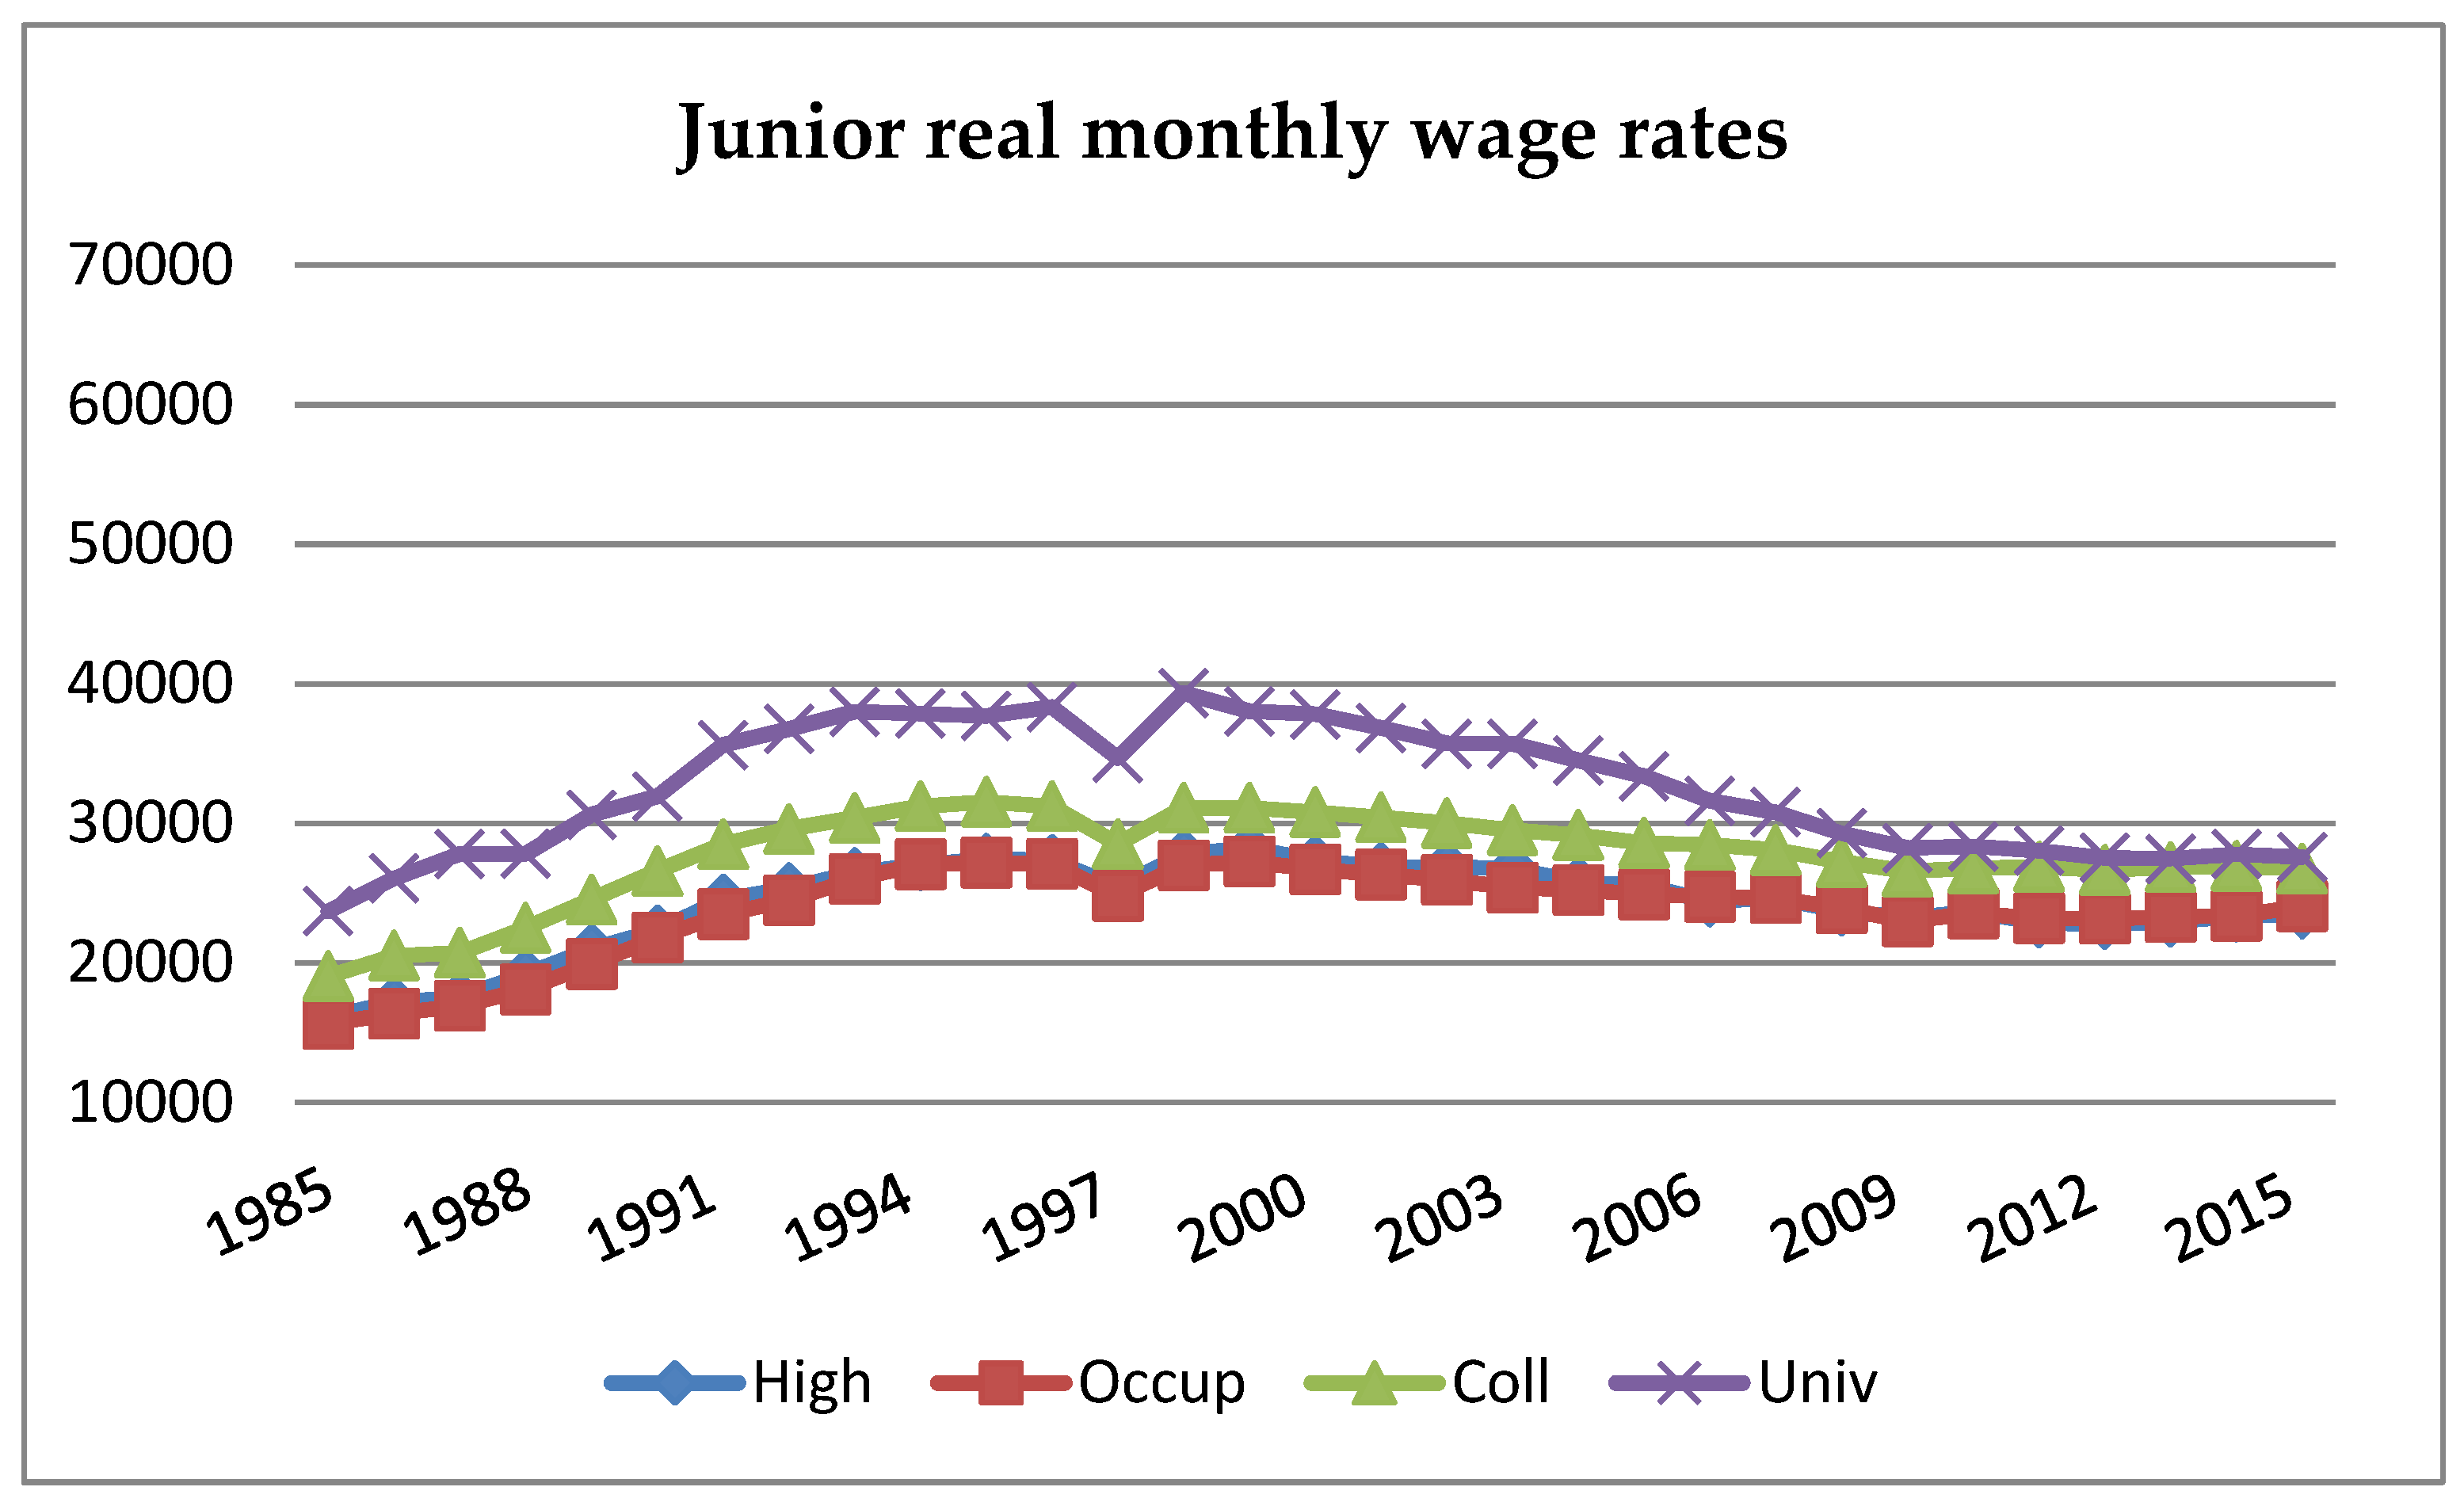
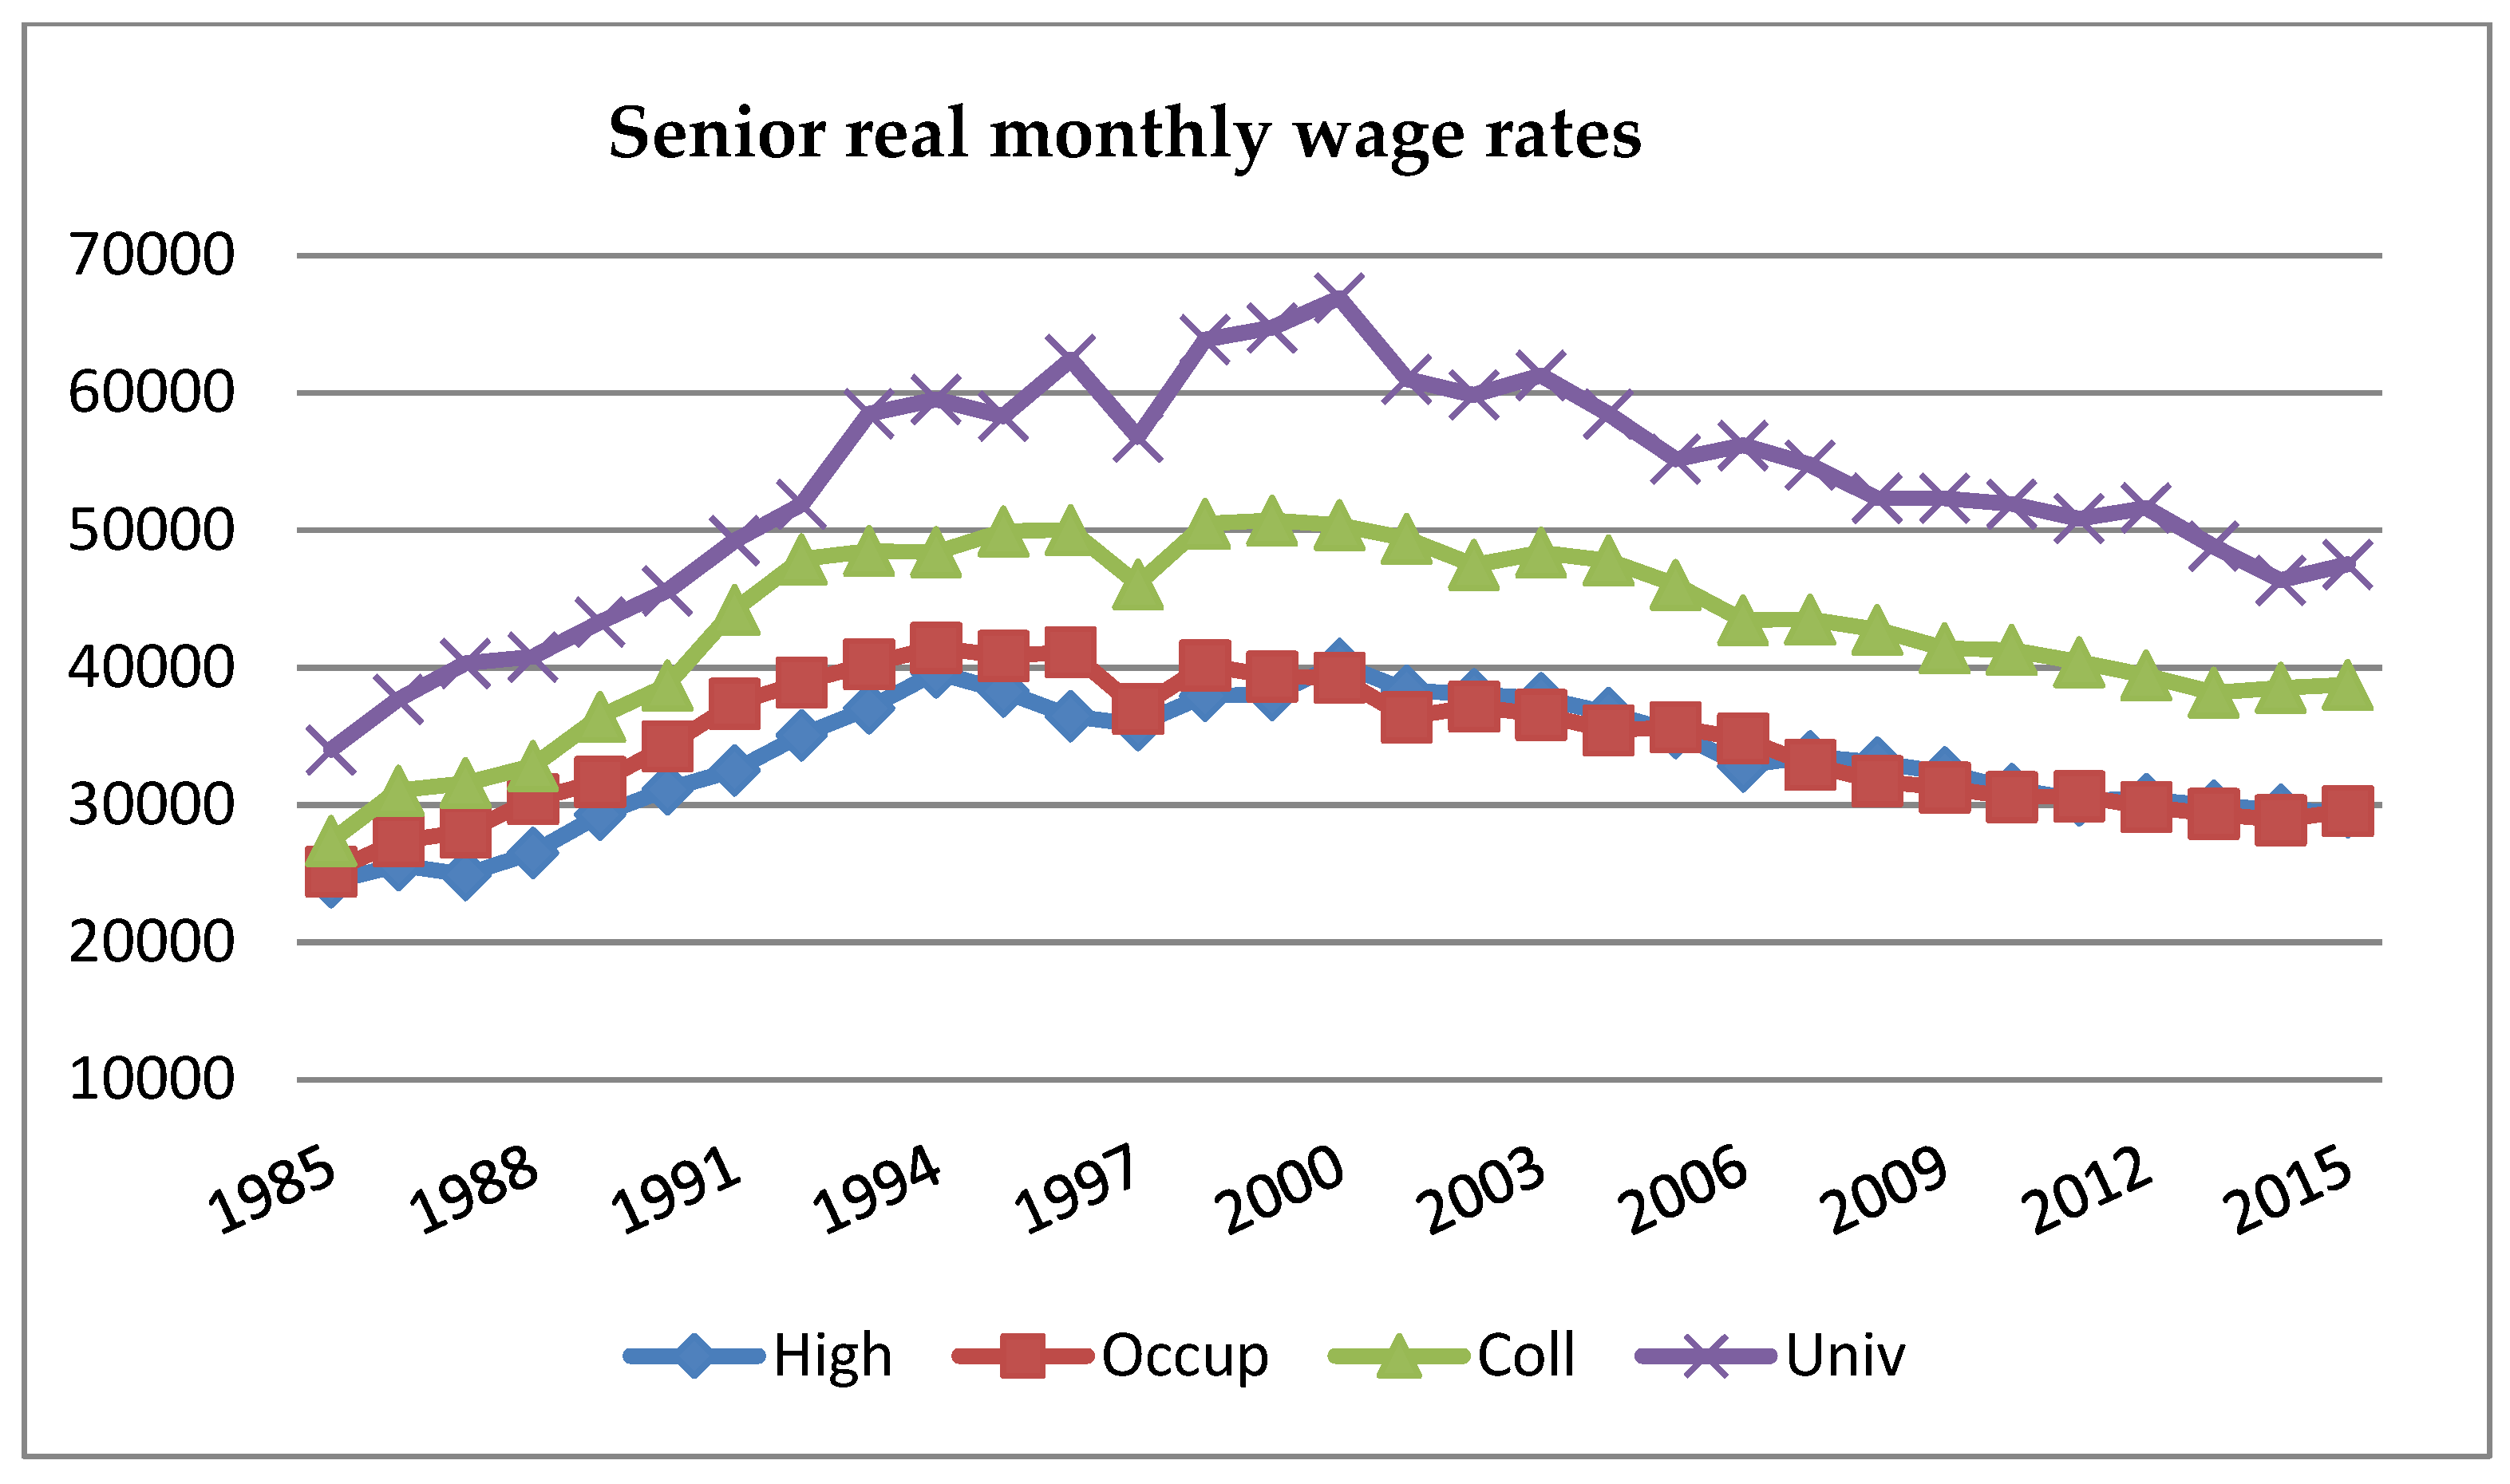
Figure 3 and Figure 4 feature the pattern of real wage rates of the two groups over time. There is a clear structural change of the wage pattern of both groups in around year 2000. Prior to year 2000, the real wage rates were rising but the reverse was true after year 2000. Furthermore, the wage structure of the junior group was diverging before year 2000 then converging towards the year 2015, while the wage structure of the senior group kept diverging for the first 10 years, then wage gaps between educational categories stayed constant till 2015. The sharp difference between junior versus senior wage structures may reflect the different compositional changes of educational categories in the two age groups.
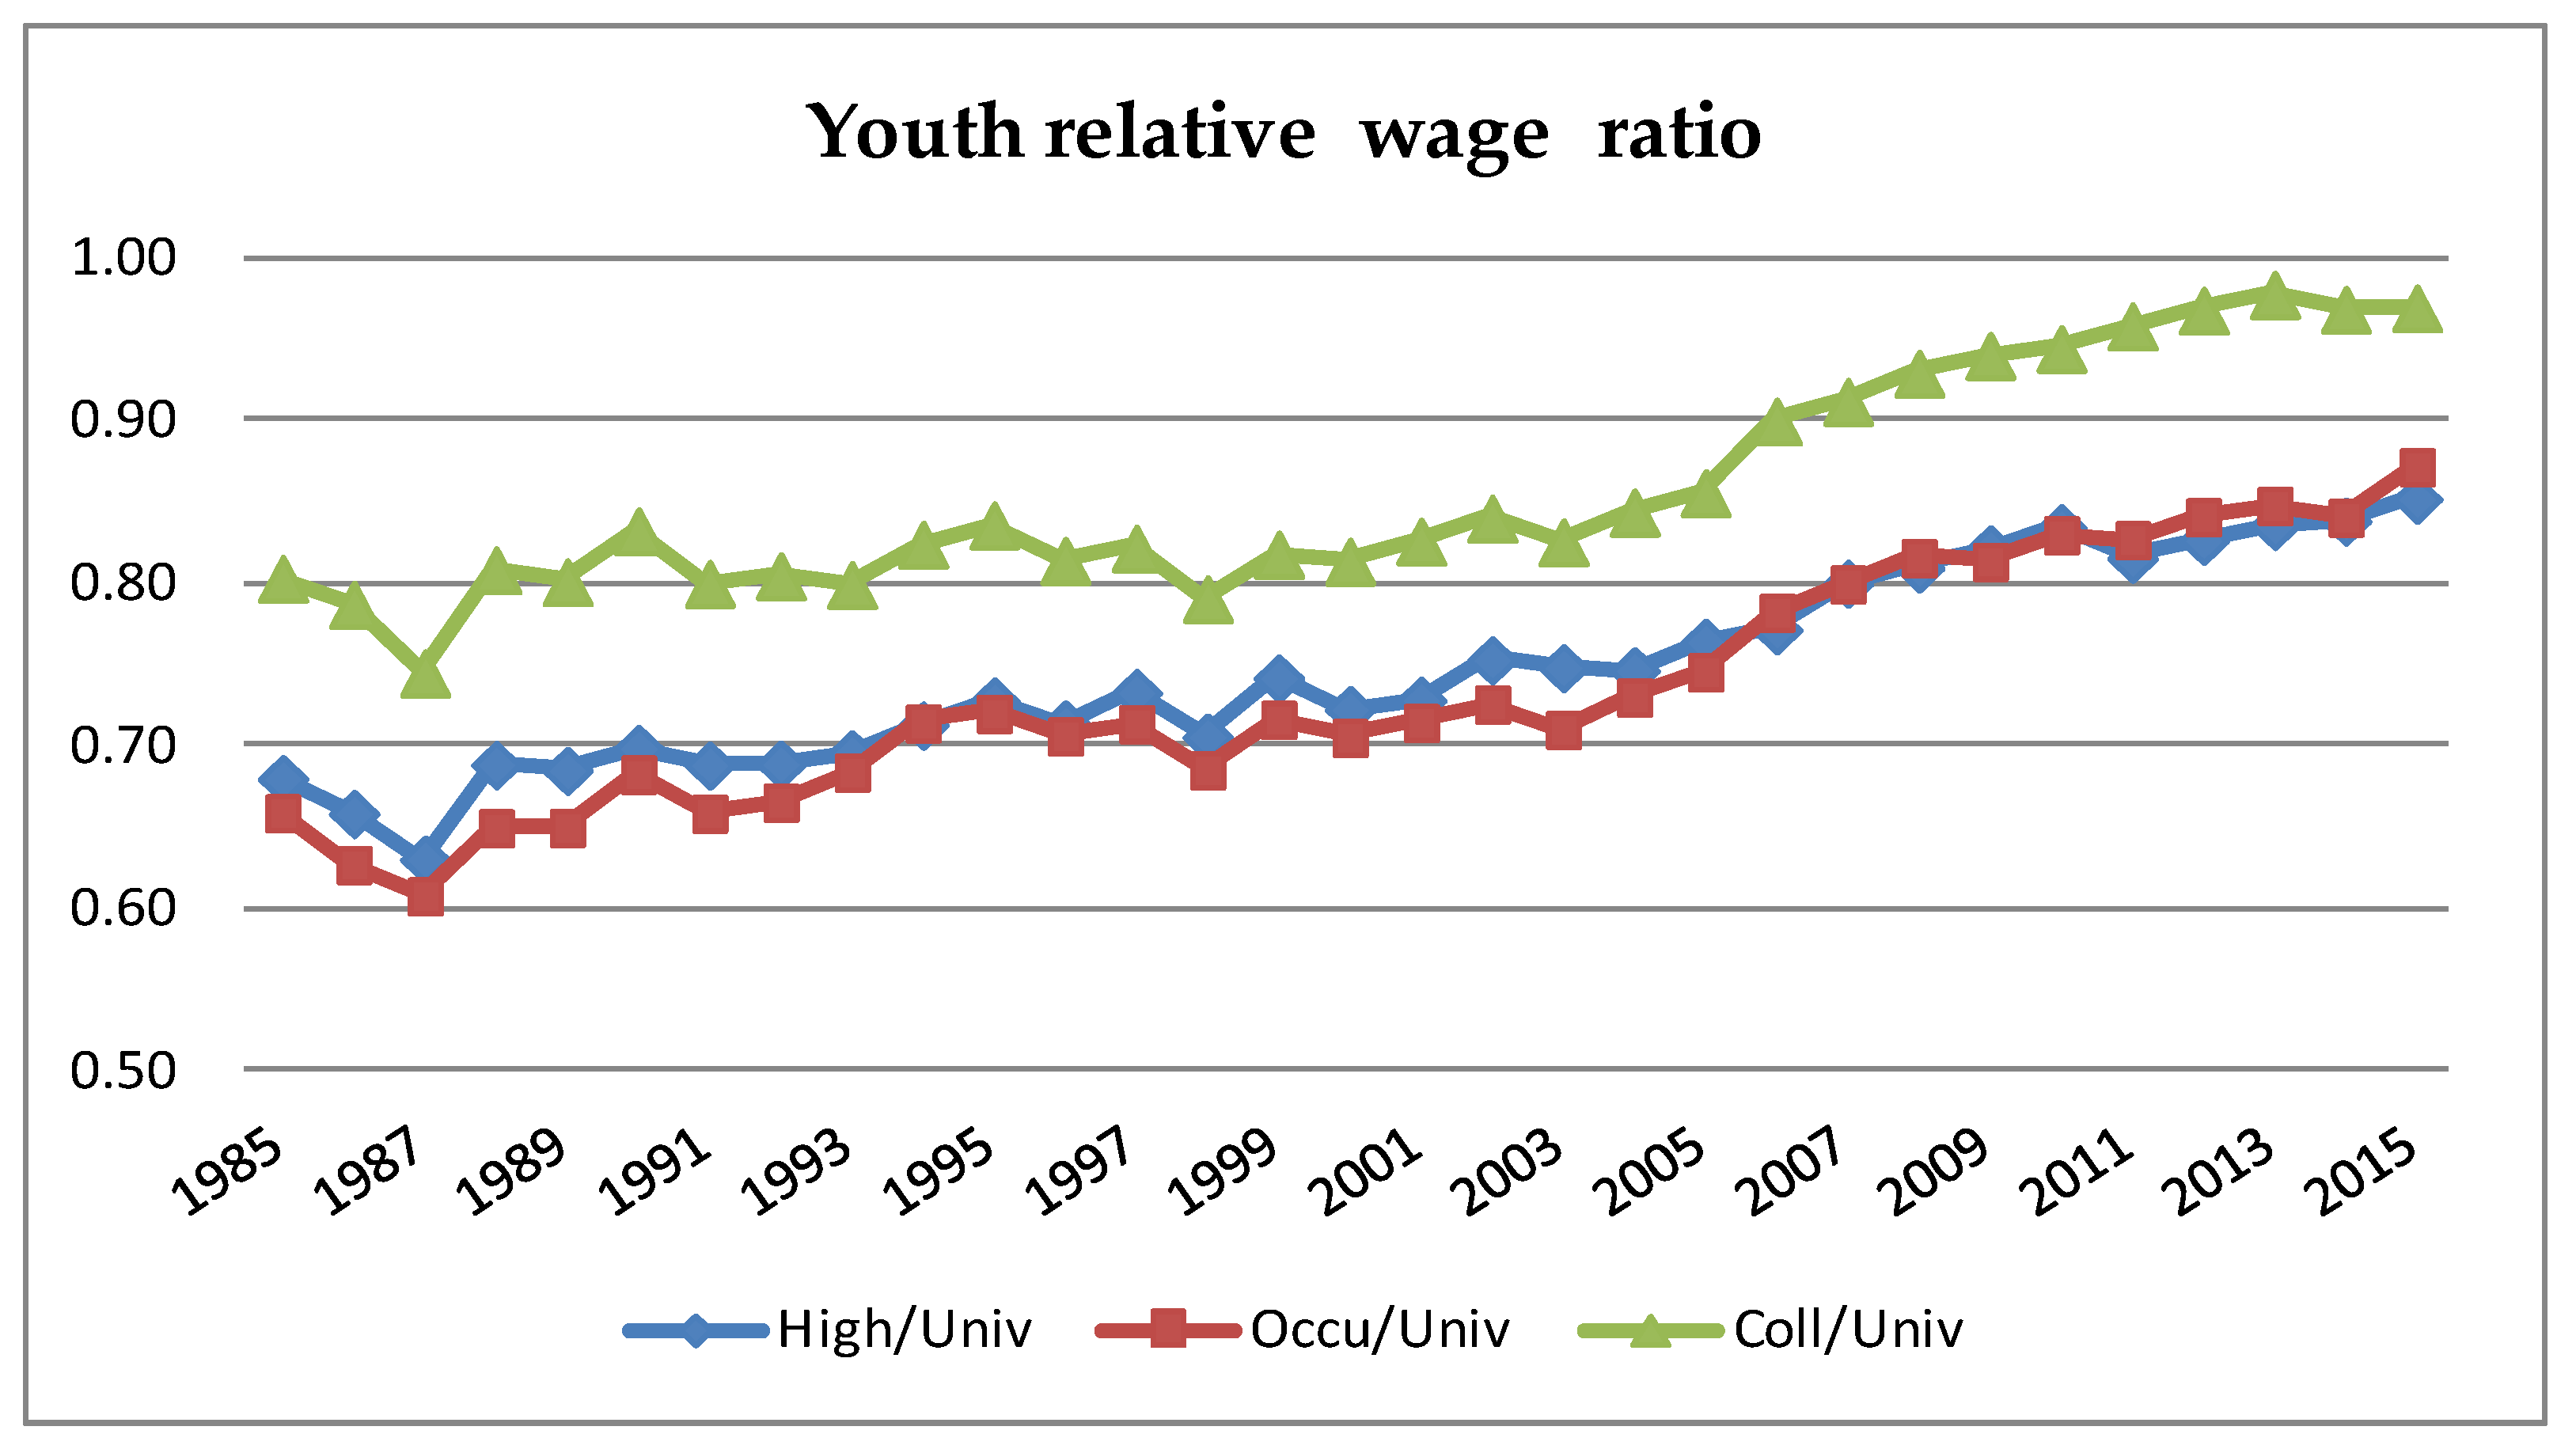
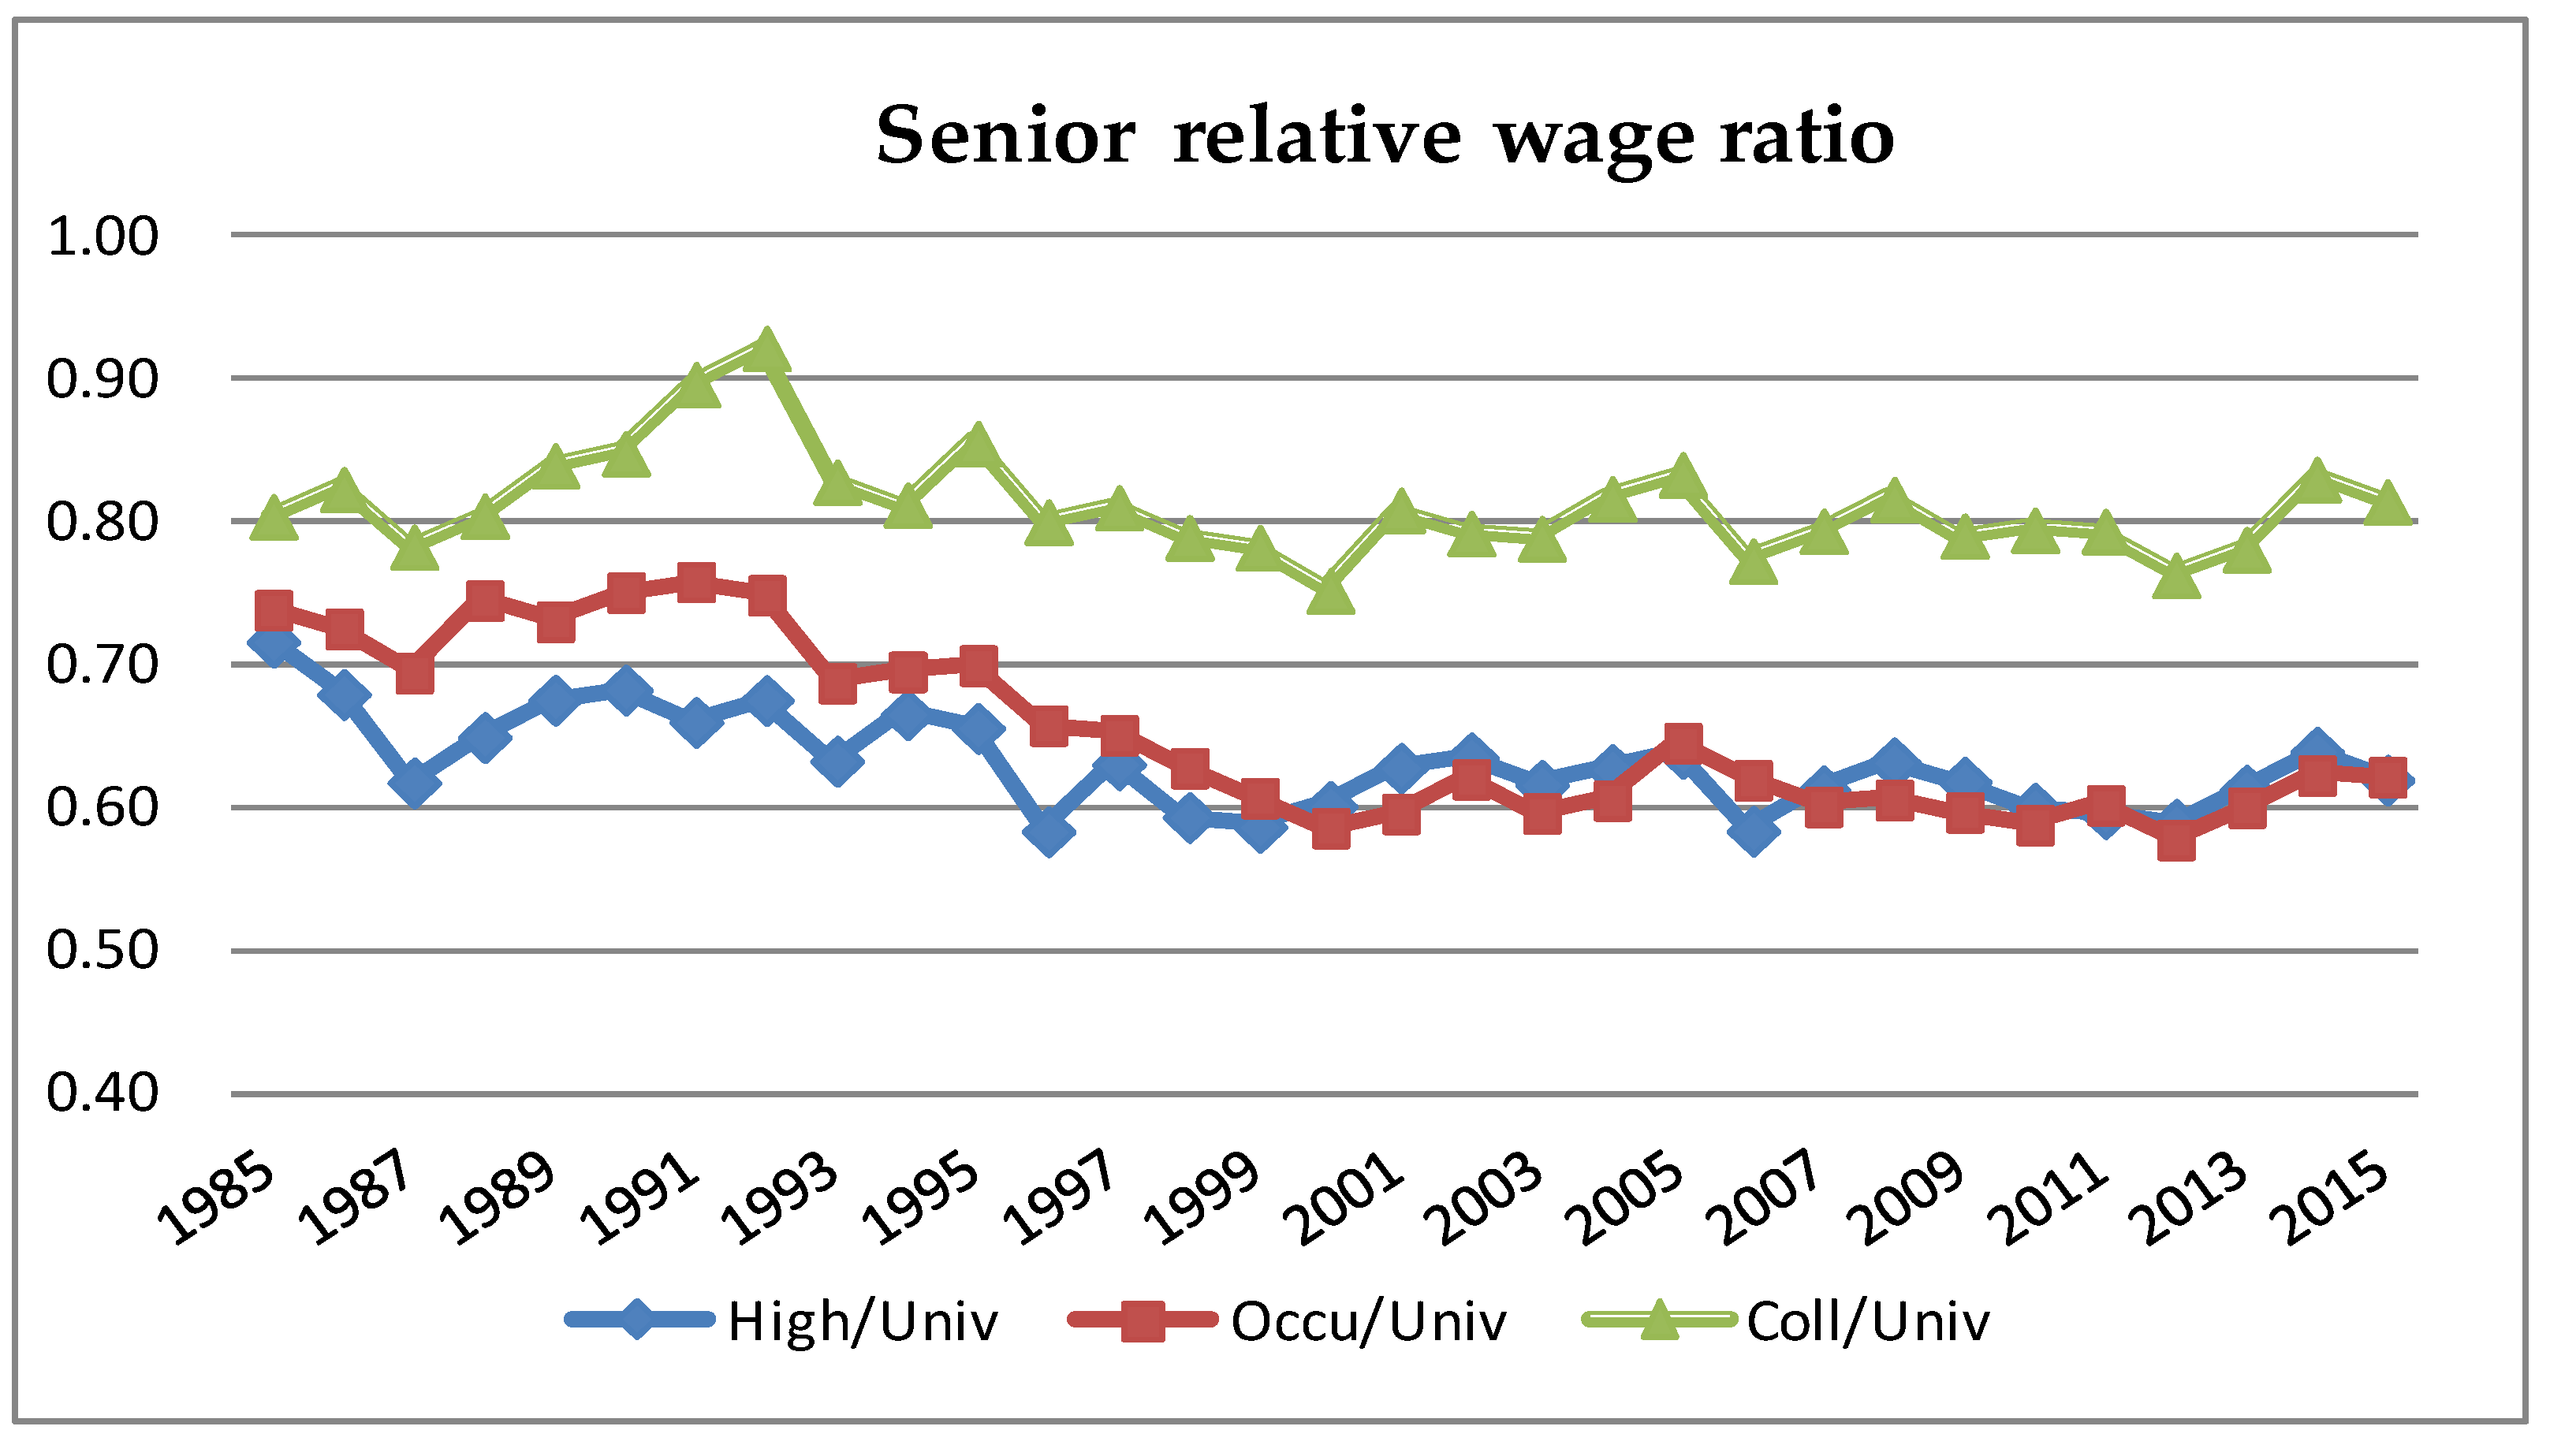
Figure 5 and Figure 6 depict the stylized relative wages across different educational groups by setting ‘university educated’ as the base; the two figures show much differentiated patterns. For the junior group, college/university wage rates were less than 80% of the base and vocational college/university and high school/university wages, 60% of the base, in the early 1980s, then the relative wages apparently increased from year 2000. By year 2015, college wage rates were much closer to those of university graduates while vocational college/high school wages reached 85% of base group wage rates. For the senior group, the relativity of university and college wage rates remained stable with the latter around 80% of the former, while wages of high school and vocational school graduates were about 70% of those of university graduate in 1985 and the ratio declined to 60% by 2015. Patterns of the two figures exemplify the devaluation of higher-educational diplomas when there is spiky increase of higher-educated workers in the junior group.
3.4. Methodology and Model Specification
3.4.1. Methodology
Olden and Moen (2020) argued the difference-in-difference-in-differences (DDD) estimator can be computed as the difference between two difference-in-difference estimators. This shows that the DDD estimator does not require two parallel trend assumptions to have a causal interpretation. The intuition is that the difference between two biased difference-in-difference estimators will be unbiased as long as the bias is the same in both estimators. Hence, DDD has become a widely used estimator in empirical work. A DDD model can be expressed as:
Ysit = β0 + β1T + β2B + β3Post + β4T × B + β5T × Post + β6B × Post + β7T × B × Post + εsit
Equation (1) is a basic triple differences specification. All variables in this basic setup are dummy variables. The conditional mean function of Equation (1) is E[Ysit|T, C, P ost], which can take on eight values and eight coefficients. Under standard OLS assumptions and an additive effect, we can use E[εsit|T, C, Post] = 0 to show the eight expected values as follows:
| E[Y|T = 0, B = 0, Post = 0] = β0 | |
| E[Y|T = 1, B = 0, Post = 0] = β0 + β1 | |
| E[Y|T = 0, B = 1, Post = 0] = β0 + β2 | |
| E[Y|T = 0, B = 0, Post = 1] = β0 + β3 | |
| E[Y|T = 1, B = 1, Post = 0] = β0 + β1 + β2 + β4 | |
| E[Y|T = 1, B = 0, Post = 1] = β0 + β1 + β3 + β5 | |
| E[Y|T = 0, B = 1, Post = 1] = β0 + β2 + β3 + β6 | |
| E[Y|T = 1, B = 1, Post = 1] = β0 + β1 + β2 + β3 + β4 + β5 + β6 + β7 | |
Beginning at the top of Equation (2).
| β0 = E[Y|T = 0, B = 0, Post = 0] |
| β1 = E[Y|T = 1, B = 0, Post = 0] − E[Y |T = 0, B = 0, Post = 0] |
| β2 = E[Y|T = 0, B = 1, Post = 0] − E[Y |T = 0, B = 0, Post = 0] |
| β3 = E[Y|T = 0, B = 0, Post = 1] − E[Y |T = 0, B = 0, Post = 0] |
| β4 = E[Y|T = 1, B = 1, Post = 0] + E[Y |T = 0, B = 0, Post = 0]− |
| E[Y|T = 1, B = 0, Post = 0] − E[Y |T = 0, B = 1, Post = 0] |
| β5 = E[Y|T = 1, B = 0, Post = 1] + E[Y |T = 0, B = 0, Post = 0]− |
| E[Y|T = 1, B = 0, Post = 0] − E[Y |T = 0, B = 0, Post = 1] |
| β6 = E[Y|T = 0, B = 1, Post = 1] + E[Y |T = 0, B = 0, Post = 0]− |
| E[Y|T = 0, B = 1, Post = 0] − E[Y |T = 0, B = 0, Post = 1] |
| β7 = E[Y|T = 1, B = 1, Post = 1] − E[Y |T = 1, B = 1, Post = 0]− |
| E[Y|T = 1, B = 0, Post = 1] − E[Y |T = 1, B = 0, Post = 0]− |
| E[Y |T = 0, B = 1, Post = 1] − E[Y |T = 0, B = 1, Post = 0]+ |
| E[Y |T = 0, B = 0, Post = 1] − E[Y |T = 0, B = 0, Post = 0] |
By rearranging the expression of Equation (3) for β7 and substituting the expected values with their sample equivalents (the mean values), we can derive Equation (4). This is the triple difference estimator for the effect of the treatment.
3.4.2. Model Specifications
This study assumes a parallel trend for both the senior (control) and junior (treatment) groups by using the difference-in-difference-in-differences (DDD) model (Zheng 2010) to examine the negative effect of higher-education expansion policy on the university wage premium. In the following analysis, university graduates are regarded as higher educated (high); college, high school, and vocational school graduates are regarded as non-higher-educated (low). The junior group aged 20–35 are the treatment group because they suffered from the higher-education expansion. Their counterparts aged 45–65 are the control group of those who were little affected by higher-education expansion. The educational policy was enacted in 1995, thus prior to 1995 is “before” the policy and after 1995, “after”. The 30-year-long data are separated into three segments, 1985–1995, 1996–2005, and 2006–2015. Within these groups, 1985–1995 is the “before period”, 1996–2005 is the first “after period”, and 2006–2015 the second “after period”.
The concept of the DDD model framework is straightforward. There are three levels of differences to be calculated. As Equation (1) shows, the first bracket/level is the wage differential between high- and low-educational groups before and after the policy implementation. It captures changes of credential value in response to higher-education expansion of the treatment (junior) group. The changes are attributed to two possible effects: environment and policy. Analogously, the second bracket/level is the wage differential between different educational groups before and after the policy implementation of the control (senior) group. Changes of control groups’ credential value are attributed to environment only because there is little effect of educational policy on the senior workforce. The difference between the two brackets is the third level difference to capture the “net” effect of higher-education expansion policy on the university wage premium.
| DDD | = [(Treat-high-after − Treat-low-after) − (Treat-high-before − Treat- low- before)] |
| − [(Control-high-after − Control-low-after) − (Control-high-before – | |
| Control-low-before)] |
To implement the DDD model concept into an econometric specification, we set Y = 1 as the junior group and Y = 0 as otherwise; T = 1 was the after period while T = 0 was the before period; H = 1 was the higher-educated group and H = 0 was the non-higher-educated one. The regression model can be expressed as:
where Ln w is the log wage, αs and β are parameters, X is the vector of employee’s humcan capital characteristics, and e is the error term. Along with the specifications, we implemented the relevant group/educational category/time period into Equation (5) and each status is as follows:
Ln w = α0 + α1 × Y + α2 × T + α3 × H + α4 × Y × T + α5 × Y × H + α6 × T × H + α7
× Y × T × H + β’ X + e
× Y × T × H + β’ X + e
Treat-high-after = α0 + α1 × Y + α2 × T + α3 × H + α4 × Y × T + α5 × Y × H +
α6 × T × H + α7 × Y × T × H + β’ X + e
α6 × T × H + α7 × Y × T × H + β’ X + e
Treat-low-after = α0 + α1 × Y + α2 × T + α4 × Y × T + β’ X + e,
Treat-high-before = α0 + α1 × Y + α3 × H + α5 × Y × H + β’ X + e,
Treat-low-before = α0 + α1 × Y + β’ X + e,
Control-high-after = α0 + α2 × T + α3 × H + α6 × T × H + β’ X + e,
Control-low-after = α0 + α2 × T + β’ X + e,
Control-high-before = α0 + α3 × H + β’ X + e,
Control-low-before = α0 + β’ X + e
Taking Equations (6)–(13) into Equation (5), the derived wage change after policy change is α7, which is the “net” effect of the higher-education expansion policy on the university wage premium of the junior group.
4. Empirical Results
4.1. DDD in Unconditional Estimation
Based on the concept of the DDD model, unconditional estimates are shown in Table 2 and the results indicate that the first 10-year higher-educational expansion resulted in a NT$ 7889 diploma devaluation, as the university wage premium of the junior group was NT$ 7889 lower than that of their senior counterparts. The devaluation effect of higher-educational expansion kept enlarging: the second 10-year treatment effect was NT$ 9951. It is certain that poorly designed educational policy may lead to unexpected effects on the wage premiums of the treated groups.
4.2. DDD in Conditional Estimation
The regression estimates of the DDD model are shown in Table 3. It is worth noting that almost all covariates are statistically significant and the signs of the human capital covariates are all consistent with theory; e.g., potential experience and seniority are all positive and their quadratic terms are all negative to figure hump-shaped wage profiles over working experience and tenure. Besides, the marriage premium is about 5.7% and public sector employees’ monthly wage is on average 14.3% higher than private sector employees’ given other fixed factors.
For the DDD model control variables, we are interested in α7 and δ7, which represent the treatment effects of educational expansion on the university wage premia of the two separate decades after 1995. The treatment effect of the first period was −12.1% and that of the second period, −20.8%. The results indicate the negative effect of higher-education expansion resulted in a 12% lower university wage premium for the junior group in comparison with the senior group in years 1996–2005, while the negative treatment effect enlarged to be 21% in years 2006–2015. Both in the short term and longer term, the expansion of higher education does affect the wages of university graduates in Taiwan. Obviously, higher-education expansion inevitably led to the worsening of the university wage premium of the junior group in Taiwan. Findings of this study are inconsistent with those of Ma (2019), who found that China’s higher-education expansion policy had a short-term impact on the wages of new university graduates; but in the long term, the negative impact of the policy on wages disappeared. Different results between Taiwan and China may be caused by various labor market conditions.
5. Conclusions
In the mid-1990s, after the implementation of the policy of liberalization and expansion of higher education in Taiwan, the redistribution of educational resources affected the accumulation of personal human capital, which led to a change of labor productivity and the relative wages of university graduates decreased more than those of non-university educated workers. This paper analyzes the effects of a higher-education expansion without thorough consideration of the possible effects on wage structure across the educational categories. As Taiwan’s university numbers had tripled from the mid-1990s to the early 2000s, the graduates with university diplomas fluxed into the labor market and reduced job opportunities for lower-than-university educated workers. On the other hand, the oversupply of university graduates was in terms of quantity but not necessarily in terms of quality, and may further depreciate the value of the university premium. The empirical estimates show that the university wage premium depreciated by 12% in the first decade after the higher-education expansion, and was further devalued by 21% in the second decade after the expansion. Findings of this paper are consistent with those of Gindling and Sun (2002) and Hsu (2021). In conclusion, dramatic expansion of higher education may not increase the quality of human capital in the short run but will more likely depreciate the value of credentials. It would be insightful to explore the impact of education expansion on university wage premia across the wage distribution; this is the topic of our future research.
Author Contributions
Conceptualization, C.-L.C.; methodology, C.-L.C.; software, C.-L.C.; validation, C.-L.C.; formal analysis, C.-L.C. and L.-C.C.; data curation, C.-L.C. and L.-C.C.; writing—original draft preparation, L.-C.C.; writing—review and editing, C.-L.C. and L.-C.C.; visualization, L.-C.C.; supervision, C.-L.C.; funding acquisition, C.-L.C. All authors have read and agreed to the published version of the manuscript.
Funding
Chien-Liang Chen acknowledges financial support by the Center for Research in Econometric Theory and Applications (Grant No. 109L900201, 110L900201) from The Featured Areas Research Center Program within the framework of the Higher Education Sprout Project by the Ministry of Education, and by the Ministry of Science and Technology (MOST 109-2634-F-002-045; MOST 110-2634-F-002-045).
Institutional Review Board Statement
Not applicable.
Informed Consent Statement
Not applicable.
Data Availability Statement
Not applicable.
Acknowledgments
We would like to thank two anonymous referees for their constructive comments.
Conflicts of Interest
The authors declare no conflict of interest.
References
- Allen, J., and B. Belfi. 2020. Educational expansion in the Netherlands: Better chances for all? Oxford Review of Education 46: 44–62. [Google Scholar] [CrossRef] [Green Version]
- Becker, G. S. 1964. Human Capital: A Theoretical and Empirical Analysis, with Special Reference to Education. New York: Columbia University Press. [Google Scholar]
- Berger, Mark C. 1983. Labor Supply and Spouse’s Health: The Effects of Illness, Disability, and Mortality. Social Science Quarterly 64: 494–509. [Google Scholar]
- Chang, Yi-Chun. 2017. Cohort Differences in Returns to Higher Education: The Role of Labor Market Transformation. Taiwan Journal of Sociology of Education 17: 87–139. [Google Scholar]
- Collins, Randall. 2011. Credential Inflation and the Future of Universities. Italian Journal of Sociology of Education 3: 23–46. [Google Scholar]
- Gindling, T. H., and Way Sun. 2002. Higher Education Planning and the Wages of Workers with Higher Education in Taiwan. Economics of Education Review 21: 153–69. [Google Scholar] [CrossRef]
- Green, F., and G. Henseke. 2021. Europe’s evolving graduate labour markets: Supply, demand, underemployment and pay. Journal for Labour Market Research 55: 1–13. [Google Scholar] [CrossRef]
- Hsu, Mei. 2021. Higher Education Expansion Policy in Policy in Taiwan: Effects on the Wages of University or Higher and the Overeducation. Taiwan Economic Forecast and Policy 51: 47–48. [Google Scholar]
- Ma, Xinxin. 2019. The Impact of Higher Education Expansion Policy on the Wages of Female and Male College Graduates. International Journal of Economics and Finance 11: 68–84. [Google Scholar] [CrossRef] [Green Version]
- Mincer, J. 1974. Schooling, Experience, and Earnings. New York: Columbia University Press. [Google Scholar]
- MUS—Manpower Utilization Survey. 1985–2015. Directorate-General of Budget, Accounting and Statistics, Executive Yuan. Available online: https://srda.sinica.edu.tw/browsingbydatatype_result.php?category=surveymethod&type=4&typeb=007&csid=30 (accessed on 10 July 2021).
- Olden, Andreas, and Jarle Moen. 2020. The Triple Difference Estimator. Discussion Papers 2020/1. Bergen: Norwegian School of Economics, Department of Business and Management Science. [Google Scholar]
- Oppedisano, Veruska. 2014. Higher Education Expansion and Unskilled Labour Market Outcomes. Economics of Education Review 40: 205. [Google Scholar] [CrossRef]
- Truong, H. T., and T. D. Nguyen. 2021. Higher Education Expansion and Labor Market Outcomes: The Case of Vietnam. Journal of Asian Finance, Economics and Business 8: 1263–68. [Google Scholar]
- Yang, J., and M. Gao. 2018. The impact of education expansion on wage inequality. Applied Economics 50: 1309–23. [Google Scholar] [CrossRef]
- Zheng, Yi’an. 2010. NSC-99-2815-C-260-021-H, National Science Council, Executive Yuan. Available online: https://wsts.most.gov.tw/STSWeb/Award/AwardMultiQuery.aspx?year=99&code=QS05&organ=&name=鄭詒安 (accessed on 10 July 2021).
Figure 1.
Junior educational category ratio. Source: MUS; author calculated.

Figure 2.
Senior educational category ratio. Source: same as Figure 1.
Figure 2.
Senior educational category ratio. Source: same as Figure 1.

Figure 3.
Junior real monthly wage rates. Source: same as Figure 1.
Figure 3.
Junior real monthly wage rates. Source: same as Figure 1.

Figure 4.
Senior real monthly wage rates. Source: same as Figure 1.
Figure 4.
Senior real monthly wage rates. Source: same as Figure 1.

Figure 5.
Junior relative wage ratio. Source: same as Figure 1.
Figure 5.
Junior relative wage ratio. Source: same as Figure 1.

Figure 6.
Senior relative wage ratio. Source: same as Figure 1.
Figure 6.
Senior relative wage ratio. Source: same as Figure 1.


Table 1.
General Statistics of Three Decades of Junior and Senior Groups.
| 1985–1995 | 1996–2005 | 2006–2015 | ||||||||||
|---|---|---|---|---|---|---|---|---|---|---|---|---|
| Junior (Aged 20–34) | Senior (Aged 45–64) | Junior (Aged 20–34) | Senior (Aged 45–64) | Junior (Aged 20–34) | Senior (Aged 45–64) | |||||||
| Variable | Mean | Std. | Mean | Std. | Mean | Std. | Mean | Std. | Mean | Std. | Mean | Std. |
| Monthly real wage | 23,958 | 10,630 | 38,668 | 18,102 | 28,755 | 11,595 | 45,456 | 25,053 | 26,206 | 9248 | 37,395 | 19,613 |
| high school | 0.156 | 0.363 | 0.225 | 0.417 | 0.115 | 0.319 | 0.191 | 0.393 | 0.096 | 0.294 | 0.187 | 0.390 |
| vocational school | 0.500 | 0.500 | 0.290 | 0.454 | 0.412 | 0.492 | 0.339 | 0.473 | 0.276 | 0.447 | 0.372 | 0.483 |
| college | 0.220 | 0.414 | 0.250 | 0.433 | 0.291 | 0.454 | 0.239 | 0.427 | 0.185 | 0.389 | 0.223 | 0.416 |
| university | 0.124 | 0.329 | 0.236 | 0.425 | 0.181 | 0.385 | 0.231 | 0.421 | 0.443 | 0.497 | 0.218 | 0.413 |
| gender | 0.528 | 0.499 | 0.825 | 0.38 | 0.502 | 0.500 | 0.690 | 0.463 | 0.493 | 0.500 | 0.609 | 0.488 |
| experience | 5.870 | 3.896 | 30.959 | 5.857 | 6.076 | 4.006 | 28.766 | 4.803 | 6.117 | 4.029 | 29.603 | 4.933 |
| tenure | 3.120 | 2.808 | 15.207 | 10.552 | 3.353 | 2.810 | 14.417 | 9.808 | 3.380 | 2.772 | 13.657 | 9.298 |
| married | 0.284 | 0.486 | 0.924 | 0.265 | 0.341 | 0.474 | 0.883 | 0.321 | 0.253 | 0.435 | 0.815 | 0.389 |
| public | 0.189 | 0.391 | 0.597 | 0.491 | 0.115 | 0.319 | 0.414 | 0.493 | 0.080 | 0.271 | 0.253 | 0.435 |
| Obs. | 74,441 | 11,942 | 78,927 | 20,523 | 70,888 | 37,599 | ||||||
Data source: MUS, Author Calculated.
Table 2.
Unconditional DDD model.
| 1985–1995 (before) | 1996–2005 (after 1) | 2006–2015 (after 2) | |||||
|---|---|---|---|---|---|---|---|
| Groups/Educate | Low | High | Low | High | Low | High | |
| Junior (Treat) | 19,004 | 28,124 | 24,037 | 32,834 | 22,650 | 26,667 | |
| Senior (Control) | 32,351 | 43,370 | 33,833 | 52,418 | 28,168 | 44,034 | |
| Junior (Treat) | 1 st diff. (high-low) | 9120 | 8797 | 4017 | |||
| Senior (Control) | 1 st diff. (high-low) | 11,019 | 18,586 | 15,866 | |||
| Junior (Treat) | 2 nd diff. (high-low) | −323 | −5103 | ||||
| Senior (Control) | 2 nd diff. (high-low) | 7567 | 4847 | ||||
| 3rd diff. | −7899 | −9951 | |||||
Data source: MUS, Author Calculated.
Table 3.
DDD Model Regression Results.
| Variables | Coefficient | Stdev. | t Value |
|---|---|---|---|
| α1 | 0.020 | 0.005 | 0.370 |
| α2 | 0.420 | 0.006 | 69.770 |
| α3 | 0.258 | 0.007 | 39.520 |
| α4 | 0.010 | 0.004 | 2.200 |
| α5 | 0.068 | 0.007 | 9.230 |
| α6 | 0.077 | 0.008 | 9.350 |
| α7 | −0.121 | 0.009 | −12.990 |
| δ4 | 0.308 | 0.006 | 53.160 |
| δ5 | 0.034 | 0.004 | 8.280 |
| δ6 | 0.093 | 0.008 | 12.390 |
| δ7 | −0.208 | 0.009 | −24.300 |
| gender | 0.218 | 0.001 | 188.680 |
| experience | 0.017 | 0.000 | 67.510 |
| experience2/100 | −0.035 | 0.001 | −56.130 |
| tenure | 0.026 | 0.000 | 95.700 |
| tenure2/100 | −0.039 | 0.001 | −44.800 |
| married | 0.057 | 0.001 | 40.120 |
| public | 0.143 | 0.002 | 90.070 |
| year effect | V | ||
| Adj_Rsq | 0.493 | ||
| Obs. No. | 294,500 |
Data source: MUS, Author Calculated.
Publisher’s Note: MDPI stays neutral with regard to jurisdictional claims in published maps and institutional affiliations. |
© 2021 by the authors. Licensee MDPI, Basel, Switzerland. This article is an open access article distributed under the terms and conditions of the Creative Commons Attribution (CC BY) license (https://creativecommons.org/licenses/by/4.0/).
Share and Cite
MDPI and ACS Style
Chen, C.-L.; Chen, L.-C. The Impact of Higher Education Expansion on the Educational Wage Premium in Taiwan: 1985 to 2015. Int. J. Financial Stud. 2021, 9, 38. https://0-doi-org.brum.beds.ac.uk/10.3390/ijfs9030038
AMA Style
Chen C-L, Chen L-C. The Impact of Higher Education Expansion on the Educational Wage Premium in Taiwan: 1985 to 2015. International Journal of Financial Studies. 2021; 9(3):38. https://0-doi-org.brum.beds.ac.uk/10.3390/ijfs9030038
Chicago/Turabian StyleChen, Chien-Liang, and Lin-Chuan Chen. 2021. "The Impact of Higher Education Expansion on the Educational Wage Premium in Taiwan: 1985 to 2015" International Journal of Financial Studies 9, no. 3: 38. https://0-doi-org.brum.beds.ac.uk/10.3390/ijfs9030038
Note that from the first issue of 2016, this journal uses article numbers instead of page numbers. See further details here.