
Efficiency in Vietnamese Banking: A Meta-Regression Analysis Approach


1
Institute for Development & Research in Banking Technology, University of Economics and Law, Ho Chi Minh City 700000, Vietnam
2
Vietnam National University, Ho Chi Minh City 700000, Vietnam
3
School of Finance & Banking, University of Economics and Law, Ho Chi Minh City 700000, Vietnam
4
School of Aviation, Massey University, Palmerston North 4442, New Zealand
5
University of Economics & Business, Vietnam National University, Hanoi 10000, Vietnam
*
Authors to whom correspondence should be addressed.
Int. J. Financial Stud. 2021, 9(3), 41; https://0-doi-org.brum.beds.ac.uk/10.3390/ijfs9030041
Submission received: 8 June 2021
/
Revised: 26 July 2021
/
Accepted: 27 July 2021
/
Published: 3 August 2021
Abstract
:This study explains the differences and variances in the efficiency scores of the Vietnamese banking sector retrieved from 27 studies published in refereed academic journals under the framework of meta-regression analysis. These scores are mainly based on frontier efficiency measurements, which essentially are Data Envelopment Analysis (DEA) and Stochastic Frontier Analysis (SFA) for Vietnamese banks over the period of 2007–2019. The meta-regression is estimated by using truncated regression to obtain bias-corrected scores. Our findings suggest that only the year of publication is positively correlated with efficiency, whilst the opposite is true for the data type, and sample size.
JEL Classifications:
C13; C80; D24; G21; L251. Introduction
The banking system fosters economic growth through allocating their savings to competitive firms, entrepreneurs, individuals and governments to enhance capital accumulation and profitability (Bumann et al. 2013; Pagano 1993; Rajan and Zingales 1998). Thus, efficiency measurement in the banking sector becomes one of the most intriguing issues of research in economics and finance because of the substantial impacts an efficient banking system has on the microeconomic as well as the macroeconomic development of the economy. Furthermore, the results of efficiency studies inform policy decisions and influence individual behaviors. From that branch of literature, banking has become an interesting case study for evaluating the policies of a country in attempting to regulate its national banking to increase efficiency (Aiello and Bonanno 2016; Iršová and Havránek 2010).
The ever-growing attractiveness of efficiency studies in the banking industry is also driven by various methodological concerns. Initially, the conventional view of efficient calculation using ratio analysis can be misleading as the cross-sectional variations in input and output combinations and their prices are not appropriately accounted for (Iršová and Havránek 2010). Started from Farrel (1957)’s seminal work on firms’ efficiency using the so-called frontier analysis (FA) approach, researchers have developed a number of different methods to examine and evaluate the efficiency and performance of firms, or decision-making units (DMUs), in various industries, including the banking sector. Berger and Humphrey (1997) found 130 FA studies on financial institutions, mostly banks and bank branches. A more recent review of Liu et al. (2013) emphasizes that the number of studies on the banking industry accounts for the highest (about 10.31%) among 3134 empirical research papers that employed Data Envelopment Analysis (DEA) as the main methodology.
It is noted that different studies bring different outcomes (Berger and Humphrey 1997; Fethi and Pasourias 2010), mainly due to the variety of study designs underlying each work: the choice of parametric or non-parametric methods, stochastic or deterministic approaches, functional forms and specifications of the frontiers, distribution assumptions for the errors and efficiency term, the nature of the data and so on (Berger and Humphrey 1997; Boubaker et al. 2020; Fethi and Pasourias 2010; Liu et al. 2013; Paradi and Zhu 2013). Further, it has been pointed out that other factors such as the sample size, the number of inputs/outputs examined and the period covered in the study could also affect the efficiency results (Aiello and Bonanno 2016).
The conflicting results have been well-acknowledged in several fields. In social science, particularly in education, Glass (1976, p. 3) pointed out that “the individual findings of different studies can vary in confusing irregularity across contexts, classes of subjects and countless other factors”. In medical, important medical questions can be studied more than once by different teams at different locations (Chalmers et al. 1977), and therefore the diverse and conflicting results of these multiple small studies on an issue makes the clinical decision-making more difficult (Haidich 2010). To address this issue, meta-analysis and then meta-regression analysis (henceforth MRA), the statistical methods that integrate the results of several independent studies together, have been used (Haidich 2010). While a certain study examines a set of observations from its own sample and generalizes the results for the whole population that the sample represents, the basic idea of MRA is very similar. In which, this analysis treats all studies on the same topic as the sample and thereafter generalizes the results for the ‘true’ population, i.e., the topic being examined (Tatsioni and Ioannidis 2017). Furthermore, Borenstein et al. (2009) argued that MRA collects and incorporates the results of different studies on the same topics to examine whether (and to what extent) the characteristics of each study (or expected relevant explanatory variables such as estimation method, year of publication, sample size, study design, data properties or authors’ specifics, etc.) affect the findings. Even though MRA has been widely used in many fields such as psychology, epidemiology, medicine, economics (Bravo-Ureta et al. 2007; Brons et al. 2005; Nguyen and Coelli 2009; Odeck and Bråthen 2012), the use of MRA in the banking sector is still limited (Aiello and Bonanno 2016; Iršová and Havránek 2010). More especially, there is no study for the Asia-Pacific region.
Since joining the World Trade Organization (WTO) in 2007, Vietnam’s economy has witnessed remarkable changes. Indeed, Vietnam is considered the next Asian dragon with an annual economic growth of approximately 6.2% from 2007 to 2019 (Nguyen et al. 2021). Since the capital market is relatively underdeveloped, the Vietnamese banking system is seen as the backbone of the emerging economy (Le 2019). To maintain a healthy and sustainable stability banking sector, it requires good quality of management, shareholder’s behavior, banks’ competitive strategies, risk management and efficiency. For the last criterion, several studies attempt to examine the determinants of bank efficiency in Vietnam by using DEA as a non-parametric approach and Stochastic Frontier Analysis (SFA) as a parametric approach. However, these studies show different findings. To the best of our knowledge, there is no such work summarizing the available information across prior studies to provide readers a broader overview of how frontier estimates of bank efficiency in Vietnam vary under different study circumstances. Our study, therefore, attempts to fill in this research gap by conducting an MRA examination on 27 empirical studies so far on bank efficiency in Vietnam to provide a more systematic understanding of the performance of the Vietnamese banking sector. Our research question is therefore ‘Why there are differences in the efficiency scores of previous studies on Vietnamese banks?’
This study answers the above question by analyzing the differences and variances in the efficiency scores of the Vietnamese banking sector retrieved from 27 studies published in refereed academic journals during the 2007–2019 period under the framework of meta-regression analysis. To the best of our knowledge, this is the first to do so. Upon the analysis of the influences of publication year, publication type, data type, method type, returns-to-scale assumption, sample size, efficiency estimates and the number of authors of each study on its result, we found that the efficiency scores are associated with the year of publication, data type and sample size.
2. Measuring Efficiency: Methodological Issues
2.1. DEA and SFA in Banking Efficiency
Since efficiency is evaluated in relation to the best practice (Aiello and Bonanno 2016), one of the main concerns is which method is more appropriate to estimate the frontier. A common criterion of classifying the frontier models distinguishes between parametric and non-parametric approaches. The former form, based on empirical knowledge, takes inefficiency as a distance from the efficient frontier and assumes how random error will be separated from inefficiency. Among the parametric techniques, the three most common are SFA (Clark and Siems 2002), distribution-free approach (DFA) (Berger 1995) and the thick frontier approach (TFA) (Humphrey and Pulley 1997). On the other hand, the non-parametric techniques, based on employing mathematical linear programming, neither assume a particular production function nor assign a distribution to the error term. The two most commonly used formulations are DEA (Thompson et al. 1997) and its alternative variants, and the free disposal hull (FDH-De Borger et al. 1998; Cooper et al. 2007)—Appendix A provides the summary of features of these methods. In the scope of this study, we focus on DEA and SFA only, which are the most two commonly used in the technical efficiency literature irrespective of the sector being analyzed as well as in the Vietnamese banking literature.
To begin with, in DEA, the relative efficiency of a group of related decision-making units (DMUs) (i.e., a set of same-sector banks) is measured by using a linear programming technique. DEA calculates efficiency scores for DMUs by combining several inputs and outs at the same time. Next, DEA compares each DMU with those that have the same inputs and outputs using linear programming. An efficiency frontier is then described by DEA as a linear set of the most efficient units. As a result, DMUs that are not on the frontier are ineffective. The DEA determines each DMU’s relative efficiency based on its distance from the efficient frontier, so the DMUs will become less efficient if they are farther away. The DEA method was first used by Charnes et al. (1978) under an input-oriented efficiency approach and the assumption of constant returns to scale (CRS), based on the principle of efficiency suggested by Farrel (1957). A variable-returns to scale (VRS) model was later proposed by Banker et al. (1984). These are the two major DEA models, and they have been used extensively in many studies.
Moving on, SFA is another popular method for estimating the efficiency proposed by Aigner et al. (1997), and Battese and Corra (1977). This approach is based on the premise that a variety of factors contribute to DMUs not being on the efficient frontier and not fully controlled by these DMUs. When building the effective frontier, SFA allows the production functions to account for the presence of errors. Random noise and inefficiency are separated from these errors. Following a symmetric normal distribution, the former reflects the factors that influence the dependent variable but not observable. Meanwhile, the latter denotes inefficiency and s often characterized by a truncated normal distribution (Berger and Humphrey 1997).
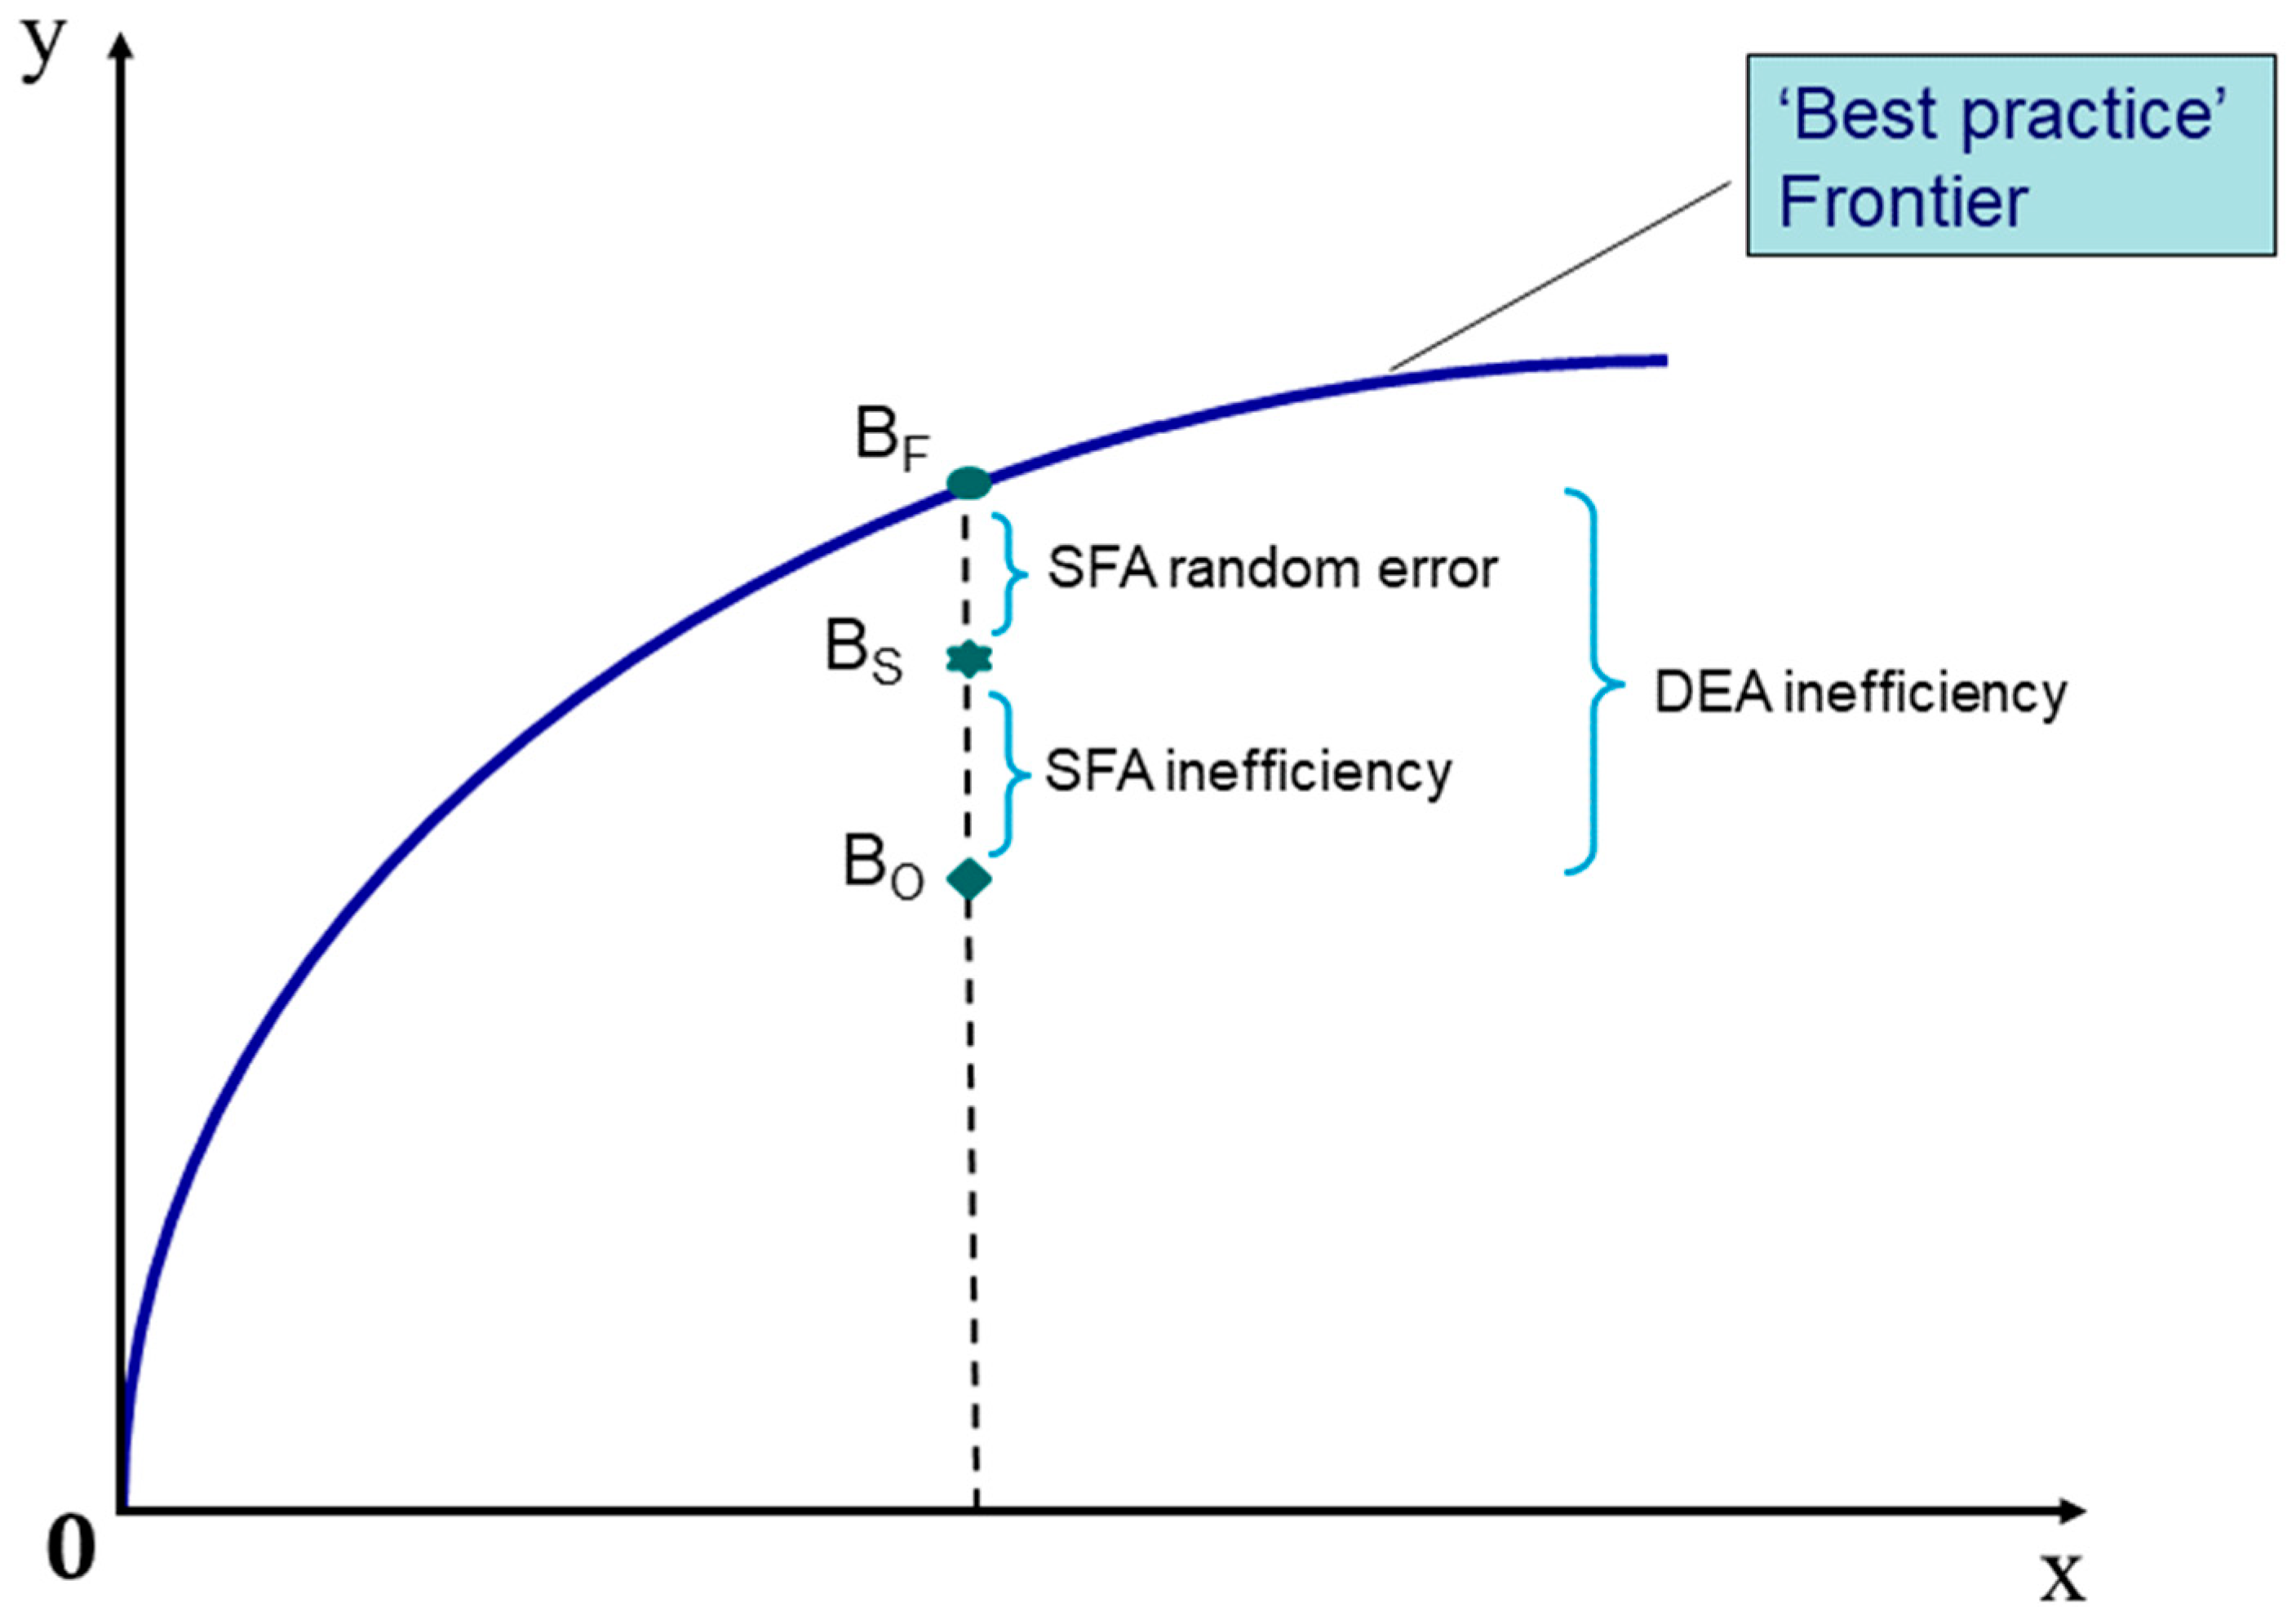
Figure 1 below illustrates the main difference between DEA and SFA. SFA can vary from the best practice DEA frontier due to measurement error and other random factors affecting output. If the error is negative, for example, SFA would be lower than DEA. On the one hand, we calculate inefficiency using DEA as the difference between the estimated output function f(x) and the x generated by xi inputs (measured by the angled line). On the other hand, using SFA, the estimated frontier lies below and the distance from it to x is shorter (measured by the curved line). DEA, therefore, would provide a higher estimate of inefficiency in this situation.
In the banking sector, DEA and SFA are widely used to measure the efficiency of banks in terms of technical (or production) efficiency, cost efficiency and profit efficiency (Berger and Humphrey 1997; Iršová and Havránek 2010). While the estimation of the former only requires physical data on inputs and outputs, which makes it become the most popular measurement in efficiency analysis (Aiello and Bonanno 2016; Odeck and Bråthen 2012), the latter two need additional information on the prices of the inputs involved (Ngo and Tripe 2016) and thus are less popular.
2.2. Meta-Regression Analysis (MRA)
It is commonly difficult to compare the findings of scientific works, even if they are on the same topic since these studies vary in several aspects. One way to deal with it is to treat each study as an independent observation and the collection of those studies as a sample representing the ‘true’ population which is the topic being examined. Meta-regression analysis (MRA) is a valuable statistical tool that investigates the association between the main findings of various studies (as a dependent variable of the regression model) and the characteristics of those studies, e.g., sample size, methods or studying period (as independent variables of the regression model) (Glass 1976; Glass et al. 1981; Stanley and Jarrell 1989). In this sense, MRA synthesizes different studies into a single model and assesses the impact of particular aspects of the original studies on (the variability of) the results. More details about MRA as well as its pros and cons are available in Haidich (2010); Stanley et al. (2013) and Tatsioni and Ioannidis (2017), and among others.
Even though there has been a widespread use of MRA in economics, education and medical research, only a few deals with efficiency and, when they do, the majority focuses on the agriculture sector (Bravo-Ureta et al. 2007; Thiam et al. 2001), urban transport (Brons et al. 2005), seaports (Odeck and Bråthen 2012) or hospital (Nguyen and Coelli 2009). Even though banking efficiency is among the most popular applications of FA (Berger and Humphrey 1997; Liu et al. 2013), MRA in banking efficiency is still a newly emerging issue. Iršová and Havránek (2010) are among the pioneers to use MRA to review the US banking efficiency literature with 53 observations from 32 studies in a 20-year period. Their results suggest that US banks are less efficient when generating profits than controlling costs. In another study focused on five transitional economies in Central and Eastern Europe, Iršová and Havránek (2011) found that the variety of banks’ efficiency can be explained by the differences in the choice of variables (e.g., the intermediation approach versus other approaches, see Sealey and Lindley (1997), the choice of estimation method (e.g., parametric versus non-parametric) and so on. A more recent MRA study covered 1661 efficiency scores retrieved from 120 papers published over the 2000–2014 period of Aiello and Bonanno (2016) reconfirms the above findings. Interestingly, although Aiello and Bonanno (2016) have pointed out that FA studies on bank efficiency of Asian countries accounted for 37% of their dataset, most of those studies are on Indian, Japan or Australian banks. To the best of our knowledge, however, there is no MRA study on banking efficiency in Vietnam, and our study, therefore, can contribute to the above picture.
Following Odeck and Bråthen (2012) and Aiello and Bonanno (2016), the empirical MRA model investigating the relationship between study characteristics of the Vietnamese banking efficiency scores can be presented as follows:
where EFi is the (average) efficiency scores derived from study i and Xij represents the matrix of covariates consisting of the study i’s characteristics, and are the measurement errors. It is noted that the number of observations is equal to the number of data points extracted from the studies, i.e., one study may provide more than one observation.
By definition, the efficiency scores EFi are censored between zero and unity. Consequently, the traditional Ordinary Least Squares regression could produce biases when estimating Equation (1) and thus, Tobit regression is more appropriate to deal with such censored dependent variable (Iršová and Havránek 2010; Assaf and Josiassen 2015; Aiello and Bonanno 2016). However, it is suggested that it is practically impossible to have EFi below or equal to zero so that EFi is actually truncated rather than being censored—the truncated regression therefore performs even better than the Tobit regression (Simar and Wilson 2007). Our truncated MRA model is consequently represented as follows.
where YEAR represents the year of publication of observation i; DATA is a dummy variable to represent the data type used in observation i that takes a value of 1 for panel data and 0 for cross-sectional data; METHOD is a dummy variable to account for the frontier approach of observation i that takes a value of 1 for DEA method and 0 for SFA method; RTS is a dummy variable that takes a value of 1 for the assumption of constant returns to scale in observation i and 0 otherwise; PUB is a dummy variable to represent the type of publications of observation i that takes a value of 1 for a published journal and 0 otherwise; SIZE represents the number of banks involved in observation i; PRODUCT and COST are the dummy variables represent the type of efficiency that are estimated in observation i, the reference measurement in this case is profit efficiency; AUTHOR is a dummy variable denoting the number of authors in observation i that takes a value of 1 for a single author observation and 0 otherwise.
Due to the small number of our sample, we also perform a conventional bootstrapped Tobit/truncated regression in estimating Equation (1) to improve the statistics of our results. The descriptions of our data as well as our MRA results are then presented in the next section.
3. Results and Discussions
3.1. The Data: FA Studies on Vietnamese Banking Efficiency
To construct the data sample, we searched for all studies on bank efficiency in Vietnam that use frontier analysis, both DEA and SFA. The collection of relevant literature was primarily identified through searches in several databases (Google Scholar, Science Direct and Web of Science) for a combination of the three keywords of “bank efficiency”, “frontier analysis” and “Vietnam”. We also used the bibliographic snowballing technique to manually check the reference lists of the retrieved articles for additional relevant studies. Given that some studies provided more than one data point, our final sample consists of 27 studies which provide us 39 observations for the MRA estimation.
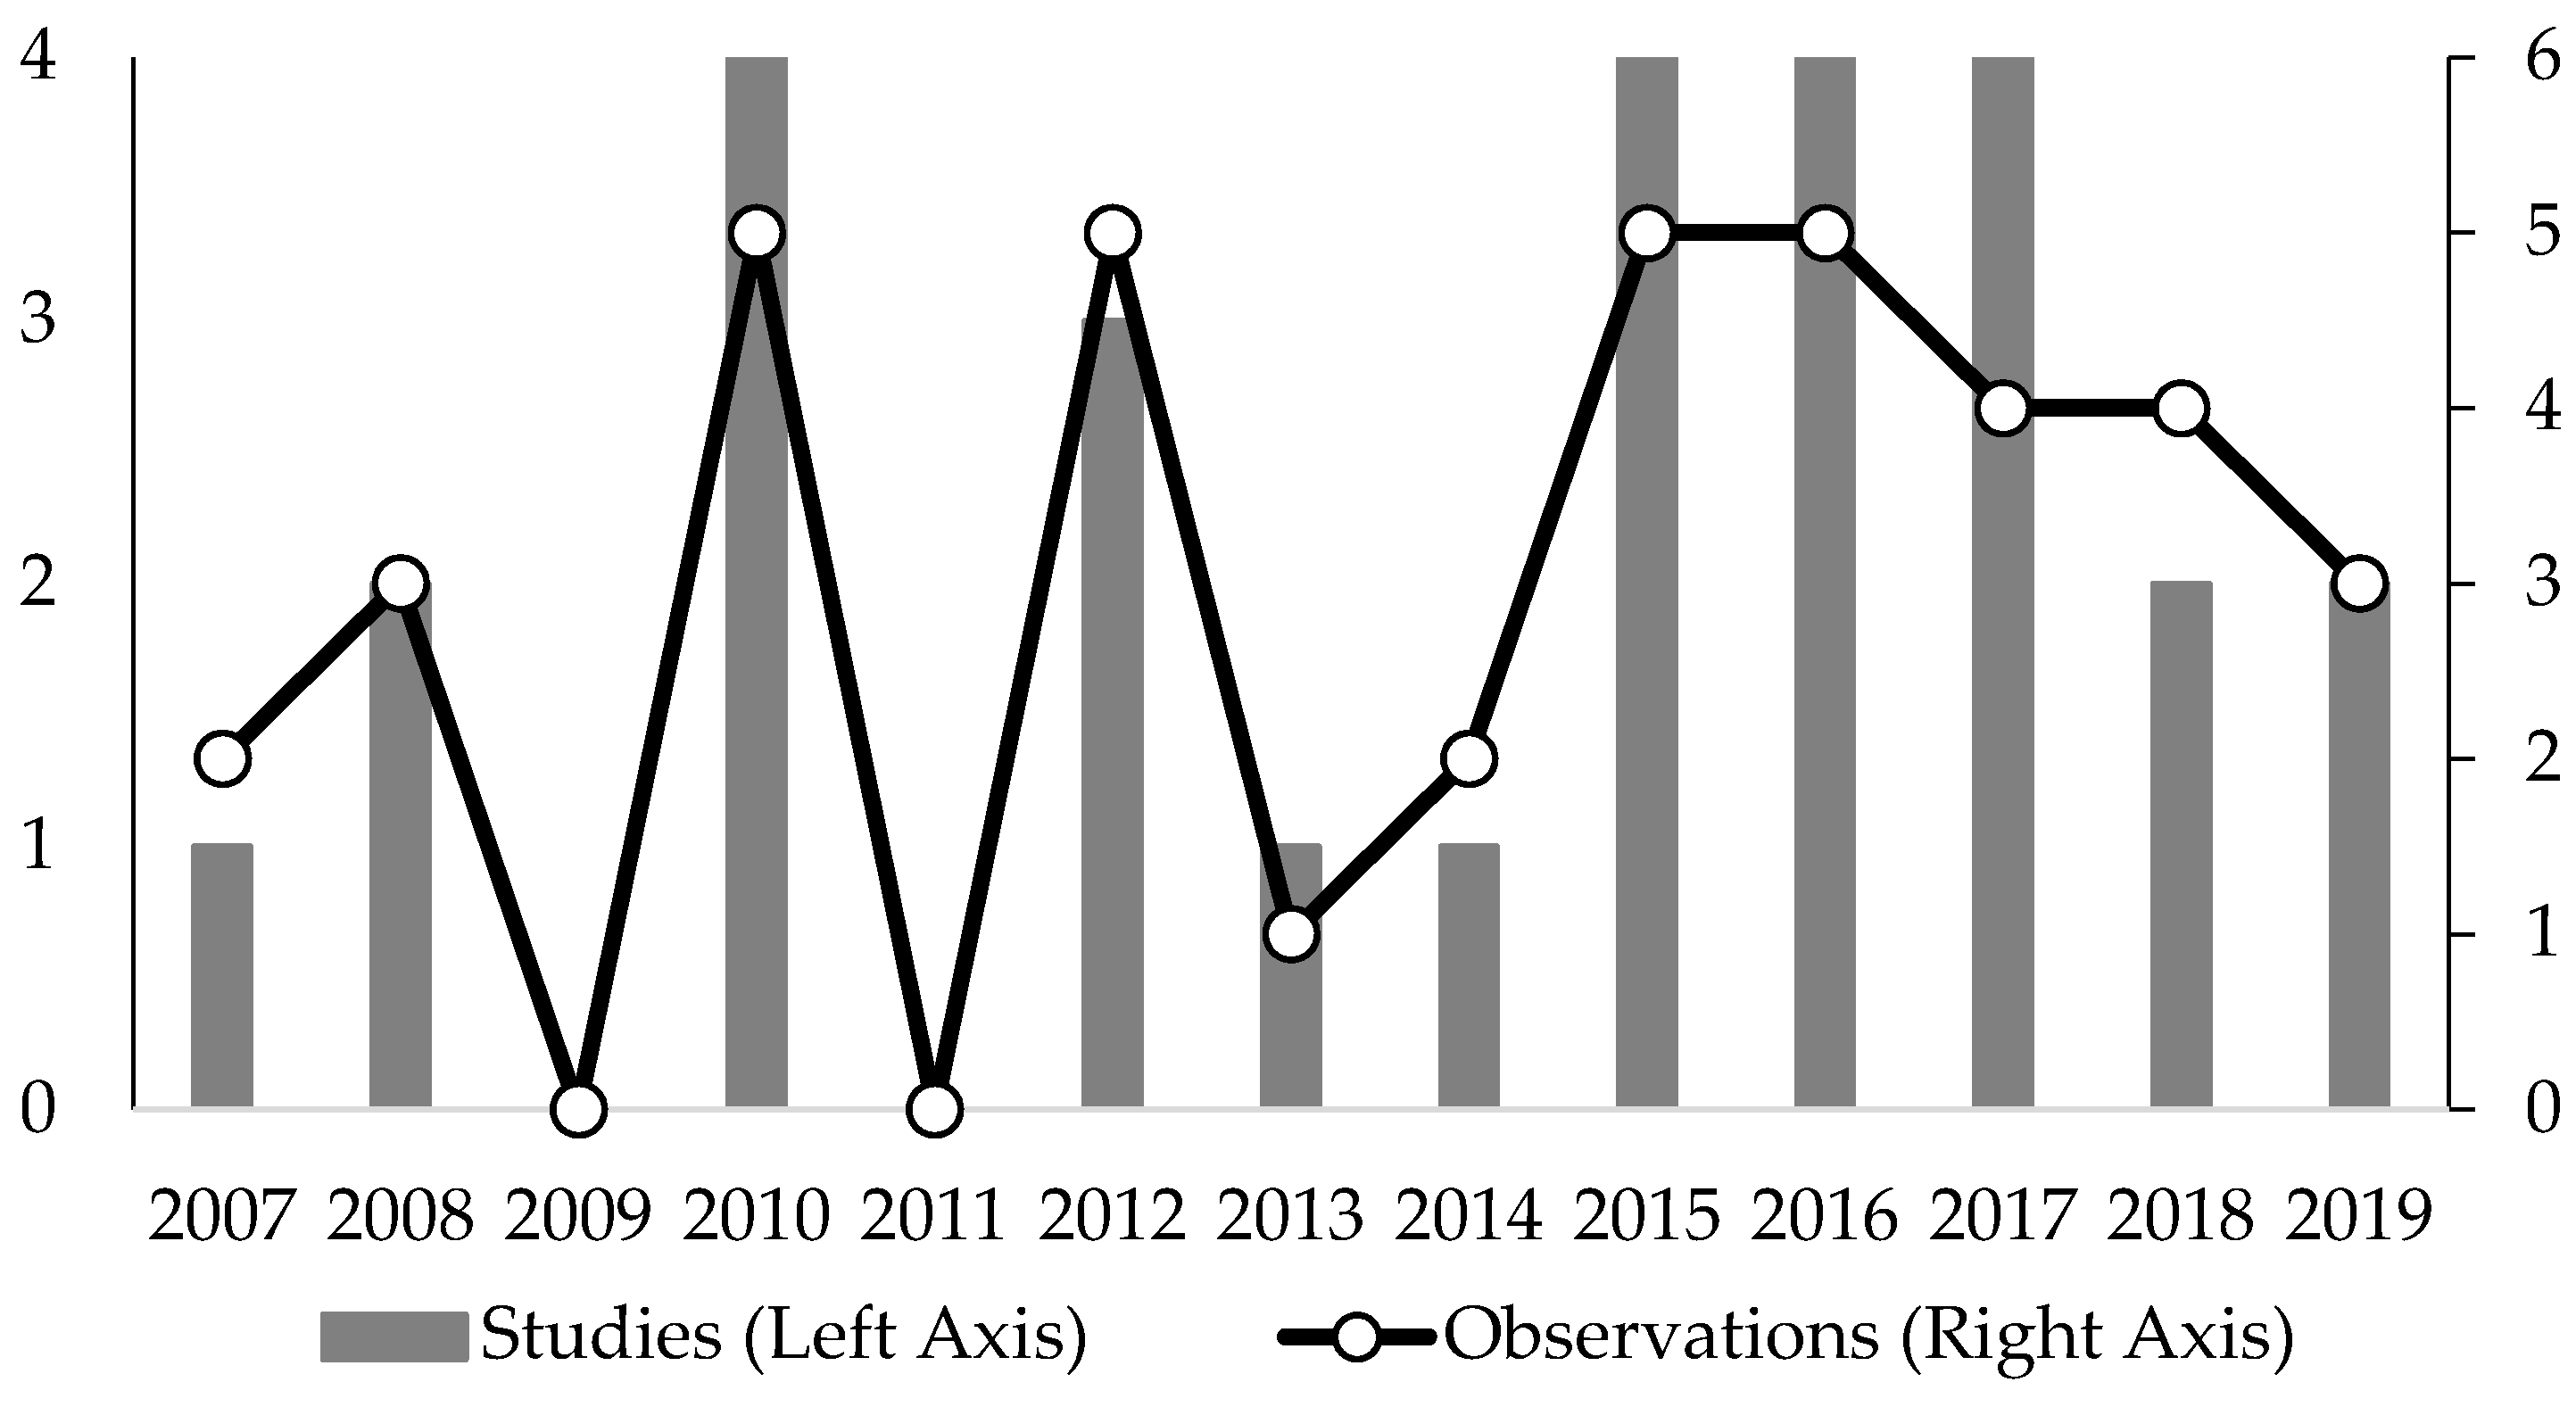
Figure 2 shows that FA studies on Vietnamese banks only emerge from 2007. In the first two years of 2007 and 2008, there were only three articles published, providing a total of five data points or observations in our sample. The number of studies has been increased since 2010, particularly after 2015, resulting in 16 articles and 21 observations for the 2015–2019 period. It is noted that the number of data points belong to the published academic journals representing for 69.23% of the sample whereas working papers accounted for 30.77%. Additionally, the number of studies conducted by a group of authors (58.97%) are higher than those performed by a single author (41.03%). Further information regarding our sample is also presented in Appendix B.
With respect to the type of frontier analysis, i.e., METHOD, the majority of studies (69.2%) were DEA-based while another 30.8% were SFA studies. This is understandable that DEA is often used in the context of the Vietnamese banking system due to a relatively small number of banks and the availability of their data (for example, see the dataset provided by Ngo and Le 2017)—before July 2009, Vietnamese banks were not required to publish their data (Vietnamese Government 2009). Regarding the type of data used, i.e., DATA, most studies (89.7%) used panel data whereas 10.3% used cross-section data (see Table 1). Overall, the average efficiency score of Vietnamese banks across the sampled studies/observations is 0.770, suggesting a moderate level of performance among those banks.
3.2. The MRA Results: Efficiency of Vietnamese Banks
Table 2 provides the MRA results for the determinants of banking efficiency in Vietnam. The consistency among the four models (i.e., Tobit regression, bootstrapped Tobit regression, truncated regression and bootstrapped truncated regression) suggests that our results are robust to the estimation method and that the findings are reliable (the final models are presented in Appendix C). The key findings for the causes of the differences in efficiency scores of previous studies on Vietnamese banks are presented as follows.
Firstly, the positive and significant coefficients of YEAR across the four models suggest that newer studies tend to find higher efficiency scores in Vietnamese banks. This finding is in line with another MRA study on banking efficiency of Aiello and Bonanno (2016) where it is suggested that market regulations in the financial sector over the past years have helped the banks to improve their efficiency, so do the results of efficiency studies on those banks. Note that this trend in efficiency improvement of Vietnamese banks has also been found in Nguyen et al. (2018, 2019), among others.
Secondly, DATA has a negative and significant impact on the efficiency scores, implying that FA studies utilizing panel data found the Vietnamese banks with lower performance than for studies using cross-sectional data. Similar results have been found in Iršová and Havránek (2010) and Aiello and Bonanno (2016), with a plausible explanation that cross-sectional efficiency analysis does not account for technological progress while FA studies using panel data do—technological improvement can thus contribute to the efficiency improvement of the banks (Krishnasamy et al. 2004; Ngo and Tripe 2017).
Thirdly, it is suggested that the number of banks being examined in each study/observation, i.e., SIZE (slightly) impacts the efficiency estimate: the more banks involved the lower (average) efficiency score. As discussed in Diewert (1993) and Brons et al. (2005), when the number of banks increases, the probability that those additional banks were inefficient are higher than them being efficient. Consequently, the average efficiency which is defined as the sum of all individual bank’s efficiency scores divided by the number of banks will likely to decrease (Aiello and Bonanno 2016; Zhang and Bartels 1998).
Due to the limitation of our sample, we could not find a clear (and significant) relationship between other characteristics such as METHOD, RTS, PUB, PRODUCT, COST, PROFIT and AUTHOR and the average efficiency scores of Vietnamese banks. It is noted that this impact is inconclusive, for example, Brons et al. (2005) found that SFA studies tend to find lower efficiency scores than DEA studies whilst Aiello and Bonanno (2016) found the opposite. We suggest that further MRA on the Vietnamese banking sector when more FA studies are available in the coming years may contribute to that debate.
4. Conclusions
Our study investigated what causes the differences in the efficiency scores of Vietnamese banks retrieved from 27 bank-efficiency studies that were conducted from 2007 to 2019 using meta-regression analysis. Particularly, we examined the impacts of the year of publication, type of data used, type of method used, type of returns-to-scale assumption involved, type of publication, sample size, type of efficiency estimate involved and the number of authors of each study on its result (i.e., efficiency scores). While this study could not find a significant relationship between efficiency scores and the other characteristics (e.g., type of method or of publication involved) due to data limitation, it still provides insightful information on the efficiency of Vietnamese banks as well as its relevant studies. For instance, our findings show that efficiency scores of the Vietnamese banking sector during the 2007–2019 period is moderately high at an average of 0.770. More important, the efficiency scores tend to be higher for newer publications which may reflect the increasing trend of the performance of Vietnamese banks over time; however, it mainly comes from technological improvements rather than from the operational performance of the banks. As such, the inclusion of more (inefficient) banks in the sample tends to decrease the average efficiency score estimation. Those findings are robust to different estimation methods (i.e., Tobit and truncated regressions) and under the bootstrapping approach.
This study could be extended to a larger sample, especially for Vietnam and other emerging markets in the Asia-Pacific regions, so that more empirical evidence regarding the other characteristics (e.g., type of efficiency estimate or number of authors) can be examined. It is also interesting to apply advanced techniques such as the DEA bootstrap (Simar and Wilson 2007) or the hierarchical regression (Woltman et al. 2012) into MRA to acquire more robust and efficient results.
Author Contributions
Conceptualization, T.N. and T.D.Q.L.; methodology and software, D.T.N.; validation, T.N. and T.D.Q.L.; formal analysis, T.H.H.; investigation, D.T.N.; resources, T.H.H.; data curation, T.H.H.; writing—original draft preparation, T.H.H. and D.T.N.; writing—review and editing, T.N. and T.D.Q.L.; visualization, T.N.; supervision, T.D.Q.L.; project administration, T.D.Q.L.; funding acquisition, T.H.H. All authors have read and agreed to the published version of the manuscript.
Funding
This research was funded by the University of Economics and Law, Vietnam National University, Ho Chi Minh City, Vietnam.
Institutional Review Board Statement
Not applicable.
Informed Consent Statement
Not applicable.
Data Availability Statement
The data presented in this study are available on request from the corresponding author. The data are not publicly available due to privacy.
Conflicts of Interest
The authors declare no conflict of interest. The funders had no role in the design of the study; in the collection, analyses or interpretation of data; in the writing of the manuscript or in the decision to publish the results.
Appendix A

Table A1.
A Breakdown of Some Methods Used to Estimate Efficiency.
| Non-Parametric and Deterministic Approaches | Parametric and Stochastic Approaches | ||||
|---|---|---|---|---|---|
| DEA | FDH | SFA | DFA | TFA | |
| Functional form of the frontier | Not specified | Not specified | To be specified | To be specified | To be specified |
| Error disturbance | Not allowed | Not allowed | Composite term
| Composite term
| Composite term
|
| Efficiency |
|
|
|
|
|
| Advantages |
|
|
|
|
|
| Caveats |
|
|
|
|
|
Notes: Following Aiello and Bonanno (2016), DEA—Data Envelopment Analysis; FDH—Free Disposal Hall; SFA—Stochastic Frontier Approach; DFA—Distribution Free Approach; TFA—Thick Frontier Approach.
Appendix B
Table A2.
List of Studies Used.
| No. | Authors (Year) | Topic | Journal/Others | Method | Data Type | Data Year | No. of Banks | No. of Estimations | Average Efficiency |
|---|---|---|---|---|---|---|---|---|---|
| 1 | Nguyen (2007) | Measuring Efficiency of Vietnamese Commercial Banks: An Application of Data Envelopment Analysis (DEA) | Technical Efficiency and Productivity Growth in Vietnam | DEA | Panel | 2001–2003 | 13 | 2 | 0.650 |
| 2 | Nguyen (2008) | Phan tich cac nhan to anh huong den hieu qua hoat dong của các NHTM ở VN | PhD dissertation of National Economics University, Vietnam | DEA | Panel | 2001–2005 | 32 | 2 | 0.791 |
| SFA | 0.74 | ||||||||
| 3 | Nguyen and De Borger (2008) | Bootstrapping Efficiency and Malmquist Productivity Indices: An Application to Vietnamese Commercial Banks | Conference Paper at at the Asia-Pacific Productivity Conference 2008, Academia Sinica, Taiwan | DEA | Panel | 2003–2006 | 15 | 1 | 0.915 |
| 4 | Ngo (2010c) | Danh gia hieu qua su dung nguon luc cua mot so NHTMCP o VN—Ung dung phuong phap DEA | Working paper | DEA | CS | 2008 | 22 | 1 | 0.917 |
| 5 | Ngo (2010a) | Evaluating the Efficiency of Vietnamese Banking System: An Application Using DEA | Conference paper at the International DEA Symposium “Pushing the envelope!” | DEA | CS | 2008 | 22 | 2 | 0.944 |
| 6 | Ngo (2010b) | Evaluating Vietnamese Commercial Banks Using Data Envelopment Analysis Approach (Vietnamese Government) | SSRN eLibrary | DEA | CS | 2008 | 22 | 1 | 0.917 |
| 7 | Nguyen et al. (2013) | Efficiency and super-efficiency of commercial banks in Vietnam: Performances and determinants | Asia-Pacific Journal of Operational Research | DEA | Panel | 2001–2005 | 32 | 1 | 0.787 |
| 8 | Vu and Turnell (2010) | Cost efficiency of the banking sector in Vietnam: A Bayesian stochastic frontier approach with regularity constraints | Asian Economic Journal | SFA | Panel | 2000–2006 | 56 | 1 | 1.015 |
| 9 | Ngo (2012) | Measuring the performance of the banking system—case of VN | Journal of Applied Finance and Banking | DEA | Panel | 1990–2010 | 21 | 1 | 0.49 |
| 10 | Nguyen (2012) | Evaluating the efficiency and productivity of Vietnamese commercial banks: A data envelopment analysis and Malmquist index | VNU Journal of Economics and Business | DEA | Panel | 2007–2010 | 20 | 3 | 0.763 |
| 11 | Vu and Nahm (2013) | The determinants of profit efficiency of banks in Vietnam | Journal of the Asia Pacific Economy | DEA | Panel | 2000–2006 | 56 | 1 | 0.494 |
| 12 | Le (2014) | Profit and Cost Efficiency Analysis in Banking Sector: A Case of Stochastic Frontier Approach for Vietnam | Journal of Knowledge Management, Economics and Information Technology | SFA | Panel | 2007–2012 | 45 | 2 | 40.135 |
| 13 | Le (2015) | Do Bank Mergers and Acquisitions Improve Technical Efficiency of Vietnamese Commercial Banks? | Conference Paper at the 28th Australasian Finance and Banking Conference | DEA | Panel | 2007–2011 | 21 | 1 | 0.965 |
| 14 | Stewart et al. (2015) | Efficiency in the Vietnamese banking system: A DEA double bootstrap approach | Research in International Business and Finance | DEA | Panel | 1999–2009 | 48 | 2 | 0.775 |
| 15 | Tran and Phan (2015) | Banking industry development and bank efficiency in an emerging market economy | Proceedings of the Second Asia-Pacific Conference on Global Business, Economics, Finance and Social Sciences | SFA | Panel | 2000–2013 | 27 | 2 | 0.62 |
| 16 | Ngo and Tripe (2016) | Stochastic cost frontier analysis—sensitivity analysis on cost measures | Pacific Accounting Review | SFA | Panel | 2003–2010 | 12 | 1 | 0.916 |
| 17 | Nguyen et al. (2016b) | Management Behaviour in Vietnamese Commercial Banks | Australian Economic Papers | SFA | Panel | 2000–2014 | 32 | 1 | 0.908 |
| 18 | Nguyen et al. (2016a) | Efficiency, innovation and competition: evidence from Vietnam, China and India | Empirical economics | SFA | Panel | 1995–2011 | 28 | 1 | 0.814 |
| 19 | Nguyen et al. (2016c) | Bank reforms and efficiency in Vietnamese banks: evidence based on SFA and DEA | Applied Economics | SFA | Panel | 2000–2014 | 32 | 2 | 0.937 |
| DEA | 0.926 | ||||||||
| 20 | Le (2017b) | The efficiency effects of bank mergers—An analysis of case studies in Viet Nam | Risk governance and control: financial markets and institutions | DEA | Panel | 2008–2015 | 35 | 1 | 0.960 |
| 21 | Le (2017a) | The Determinants of Commercial Bank Profitability in Vietnam | Working paper | DEA | Panel | 2005–2009 | 40 | 1 | 0.831 |
| 22 | Ngo and Tripe (2017) | Measuring efficiency of Vietnamese banks—Accounting for NPLs in a single-step stochastic cost frontier analysis | Pacific Accounting Review | SFA | Panel | 2003–2010 | 12 | 1 | 0.799 |
| 23 | Nguyen (2017) | Income diversification and bank efficiency in Vietnam | Journal of Economics and Development | DEA | Panel | 2007–2015 | 34 | 1 | 0.858 |
| 24 | Nguyen et al. (2018) | Operational efficiency of bank loans and deposits: A case study of Vietnamese banking system | International Journal of Financial Studies | DEA | Panel | 2008–2015 | 43 | 2 | 0.755 |
| 25 | Vo and Nguyen (2018) | Bank restructuring and bank efficiency—The case of Vietnam | Cogent Economics and Finance | DEA | Panel | 1999–2015 | 26 | 2 | 0.936 |
| 26 | Le et al. (2019) | The impact of multimarket contacts on bank stability in Vietnam | Pacific Accounting Review | DEA | Panel | 2006–2015 | 40 | 1 | 0.877 |
| 27 | Nguyen et al. (2019) | Measuring banking efficiency in Vietnam: Parametric and Non-parametric methods | Banks and bank systems | DEA | Panel | 2011–2015 | 30 | 2 | 0.946 |
| SFA | 0.764 |
Source: Synthesized by the authors.
Appendix C
Table A3.
The Final Models of Efficiency Scores.
| Tobit: | (A1) | |
| Bootstrap Tobit: | (A2) | |
| Truncated: | (A3) | |
| Bootstrap truncated: | (A4) |
Note: The models are based on Table 2 but only included significant (independent) variables.
| 1 | Note that SFA studies have already accounted for the variable returns to scale assumption allowing for the calculation of scale efficiency (Ngo et al. 2019; Vu and Turnell 2010). |
References
- Aiello, Francesco, and Graziella Bonanno. 2016. Efficiency in banking: A meta-regression analysis. International Review of Applied Economics 30: 112–49. [Google Scholar] [CrossRef]
- Aigner, Dennis, Knox Lovell, and Peter Schmidt. 1997. Formulation and estimation of stochastic frontier production function models. Journal of Econometrics 6: 21–37. [Google Scholar] [CrossRef]
- Assaf, George, and Alexander Josiassen. 2015. Frontier Analysis: A State-of-the-Art Review and Meta-Analysis. Journal of Travel Research 55: 612–27. [Google Scholar] [CrossRef]
- Banker, Rajiv, Abraham Charnes, and William Cooper. 1984. Some models for estimating technical and scale inefficiencies in data envelopment analysis. Management Science 30: 1078–92. [Google Scholar] [CrossRef] [Green Version]
- Battese, George, and Greg Corra. 1977. Estimation of a production frontier model with application to the pastoral zone of eastern Australia. Australian Journal of Agricultural Economics 21: 169–79. [Google Scholar] [CrossRef] [Green Version]
- Berger, Allen. 1995. The profit-structure relaionship in banking tests of market power and efficient structure hypotheses. Journal of Money, Credit and Banking 27: 404–31. [Google Scholar] [CrossRef]
- Berger, Allen, and David Humphrey. 1997. Efficiency of financial institutions: International survey and directions for future research. European Journal of Operational Research 98: 175–212. [Google Scholar] [CrossRef] [Green Version]
- Borenstein, Michael, Larry Hedges, Julian Higgins, and Hannah Rothstein. 2009. Introduction to Meta-Analysis. Hoboken: John Wiley & Sons Inc. [Google Scholar]
- Boubaker, Sabri, Duc Trung Do, Helmi Hammami, and Kim Cuong Ly. 2020. The role of bank affiliation in bank efficiency: A fuzzy multi-objective data envelopment analysis approach. Annals of Operations Research. [Google Scholar] [CrossRef]
- Bravo-Ureta, Boris, Daniel Solis, Victor Moreira Lopez, Jose Maripani, Abdourahmane Thiam, and Teodoro Rivas. 2007. Technical efficiency in farming: A meta-regression analysis. Journal of Productiviy Analysis 27: 57–72. [Google Scholar] [CrossRef]
- Brons, Martijn, Peter Nijkamp, Eric Pels, and Piet Rietveld. 2005. Efficicency of Urban pubic transit: A meta analysis. Transportation 32: 1–21. [Google Scholar] [CrossRef] [Green Version]
- Bumann, Silke, Niels Hemres, and Robert Lensink. 2013. Financial Liberalization and Economic Growth: A Meta-Analysis. Journal of International Money and Finance 33: 225–81. [Google Scholar] [CrossRef]
- Chalmers, Thomas C., Raymond J. Matta, Jr. Harry Smith, and Aanne-Marie Kunzler. 1977. Evidence favoring the use of anticoagulants in the hospital phase of acute myocardial infarction. New England Journal of Medicine 297: 1091–96. [Google Scholar] [CrossRef]
- Charnes, Abraham, William Cooper, and Eduardo Rhodes. 1978. Measuring the efficiency of decision making units. European Journal of Operational Research 2: 429–44. [Google Scholar] [CrossRef]
- Clark, Jeffrey Arthur, and Tom F. Siems. 2002. X-efficiency in Banking: Looking beyond the Balance Sheet. Journal of Money, Credit and Banking 34: 987–1013. [Google Scholar] [CrossRef]
- Cooper, William W, Lawrence M. Seiford, and Kaoru Tone. 2007. Data Envelopement Analysis: A Comprehensive Text with Models, Applications, References, and DEA-Solver Software. New York: Springer. [Google Scholar]
- De Borger, Bruno, Gary Ferrier, and Kristiaan Kerstens. 1998. The choice of a technical efficiency measure on the free disposal hull reference technology: A comparison using US banking data. European Journal of Operational Research 105: 427–46. [Google Scholar] [CrossRef]
- Diewert, Erwin. 1993. Data envelopment analysis: A practical alternative? In Swan Consultants (Canberra), Measuring the Economic Performance of Government Enterprises, Proceedings of a Conference held at the Sheraton International Airport Hotel, February 1993. [Google Scholar]
- Farrel, Michael James. 1957. The Measurement of Productive Efficiency. Journal of Royal Statistical Society 120: 253–81. [Google Scholar] [CrossRef]
- Fethi, Meryem Duygun, and Fotios Pasourias. 2010. Assessing Bank Efficiency and Performance with Operational Research and Artificial Intelligence Techniques: A Survey. European Journal of Operational Research 204: 189–98. [Google Scholar] [CrossRef]
- Glass, Gene. 1976. Primary, secondary, and meta-analysis of research. Educational Researcher 5: 3–8. [Google Scholar] [CrossRef]
- Glass, Gene, Barry McGaw, and Mary Lee Smith. 1981. Meta-Analysis in Social Research. Beverly Hills: Sage Publications. [Google Scholar]
- Haidich, Anna-Bettina. 2010. Meta-analysis in medical research. Hippokratia 14: 29–37. [Google Scholar] [PubMed]
- Humphrey, David B., and Lawrence B. Pulley. 1997. Banks’ responses to deregulation: Profits, technology, and efficiency. Journal of Money, Credit and Banking 29: 73–93. [Google Scholar] [CrossRef]
- Iršová, Zuzana, and Tomas Havránek. 2010. Measuring Bank Efficiency: A Meta-Regression Analysis. Prague Economic Papers 4: 307–28. [Google Scholar] [CrossRef] [Green Version]
- Iršová, Zuzana, and Tomas Havránek. 2011. Bank Efficiency in Transitional Countries: Sensitivity to Stochastic Frontier Design. Transition Studies Review 18: 230–70. [Google Scholar] [CrossRef] [Green Version]
- Krishnasamy, Geeta, Alfieya Hanuum Ridzwa, and Vignesen Perumal. 2004. Malaysian post merger banks’ productivity: Application of Malmquist productivity index. Managerial Finance 30: 63–74. [Google Scholar] [CrossRef]
- Le, Ngan. 2014. Profit and Cost Efficiency Analysis in Banking Sector: A Case of Stochastic Frontier Approach for Vietnam. Journal of Knowledge Management, Economics and Information Technology 4: 1–17. [Google Scholar]
- Le, Tu D. Q. 2015. Do bank mergers and acquisitions improve technical efficiency of Vietnamese commercial banks? In Univerity of New South Wales (Sydney), Proceedings of the 28th Australasian Finance and Banking Conference, Sydney, Australia, December 2015. Available online: https://papers.ssrn.com/sol3/papers.cfm?abstract_id=2647244 (accessed on 1 June 2021).
- Le, Tu D. Q. 2017a. The Determinants of Commercial Bank Profitability in Vietnam. Working paper. Ho Chi Minh City: University of Economics & Law. [Google Scholar]
- Le, Tu D. Q. 2017b. The efficiency effects of bank mergers—An analysis of case studies in Viet Nam. Risk Governance & Control: Financial Markets & Institutions 7: 61–70. [Google Scholar] [CrossRef] [Green Version]
- Le, Tu D. Q. 2019. The interrelationship between liquidity creation and bank capital in Vietnamese banking. Managerial Finance 45. [Google Scholar] [CrossRef]
- Le, Tu D. Q., Son H. Tran, and Liem T. Nguyen. 2019. The impact of multimarket contacts on bank stability in Vietnam. Pacific Accounting Review 31: 336–57. [Google Scholar] [CrossRef]
- Liu, John S., Louis Y. Y. Lu, Wen-Min Lu, and Bruce J. Y. Lin. 2013. A survey of DEA applications. OMEGA 41: 893–902. [Google Scholar] [CrossRef]
- Ngo, Thanh. 2010a. Evaluating the Efficiency of Vietnamese Banking System: An Application Using DEA. In University of Queensland (Brisbane), Proceedings of The International DEA Symposium, September 2010. Available online: https://mpra.ub.uni-muenchen.de/27882/ (accessed on 1 June 2021).
- Ngo, Thanh. 2010b. Evaluating Vietnamese Commercial Banks Using Data Envelopment Analysis Approach (Vietnamese). SSRN eLibrary. Available online: https://www.researchgate.net/publication/228122139_Evaluating_Vietnamese_Commercial_Banks_Using_Data_Envelopment_Analysis_Approach_Vietnamese (accessed on 1 June 2021).
- Ngo, Thanh. 2010c. Danh gia Hieu qua su Dung Nguon luc cua mot so NHTMCP o VN—Ung Dung Phuong Phap DEA. SSRN eLibrary. Available online: https://papers.ssrn.com/sol3/papers.cfm?abstract_id=1584030 (accessed on 1 June 2021).
- Ngo, Thanh. 2012. Measuring the performance of the banking system—Case of VN. Journal of Applied Finance and Banking 2: 289–312. [Google Scholar]
- Ngo, Thanh, and Tu D. Q. Le. 2017. Resource for Research: A Vietnamese Banking Database [Updated November 2017]. SSRN eLibrary. p. 14. Available online: https://papers.ssrn.com/sol3/papers.cfm?abstract_id=3028996 (accessed on 1 June 2021).
- Ngo, Thanh, and David Tripe. 2016. Stochastic cost frontier analysis—A sensitivity analysis on cost measures. Pacific Accounting Review 28: 401–10. [Google Scholar] [CrossRef]
- Ngo, Thanh, and David Tripe. 2017. Measuring efficiency of Vietnamese banks: Accounting for nonperforming loans in a single-step stochastic cost frontier analysis. Pacific Accounting Review 29: 171–82. [Google Scholar] [CrossRef]
- Ngo, Thanh, Tu Le, Son H. Tran, Anh Nguyen, and Canh Nguyen. 2019. Sources of the performance of manufacturing firms: Evidence from Vietnam. Post-Communist Economies 31: 790–804. [Google Scholar] [CrossRef]
- Nguyen, Hung V. 2007. Measuring Efficiency of Vietnamese Commercial Banks: An Application of Data Envelopment Analysis (DEA). In Technical Efficiency and Productivity Growth in Vietnam. Edited by K. M. Nguyen and T. L. Giang. Hanoi: Publishing House of Social Labour, pp. 60–70. [Google Scholar]
- Nguyen, Hung V. 2008. Phan tich cac nhan to anh huong den hieu qua hoat dong của các NHTM o VN. Hanoi: National Economics University. [Google Scholar]
- Nguyen, Vinh T. H. 2012. Evaluating the efficiency and productivity of Vietnamese commercial banks: A data envelopment analysis and Malmquist index. VNU Journal of Economics and Business 28: 103–14. [Google Scholar]
- Nguyen, Sang M. 2017. Income diversification and bank efficiency in Vietnam. Journal of Economics and Development 19: 52–67. [Google Scholar] [CrossRef]
- Nguyen, Kim H., and Tim Coelli. 2009. Quantifying the effects of modellig choices on hospital efficiency measures: A meta-regression analysis. Centre for Efficiency and Productivity Analysis WP 7. Available online: https://economics.uq.edu.au/files/5259/WP072009.pdf (accessed on 1 June 2021).
- Nguyen, X. Quang, and Bruno De Borger. 2008. Bootstrapping Efficiency and Malmquist Productivity Indices: An Application To Vietnamese Commercial Banks. In The Asia-Pacific Productivity Conference 2008. Taipei City: Academia Sinica. [Google Scholar]
- Nguyen, Minh K., Long T. Giang, and Hung V. Nguyen. 2013. Efficiency and super-efficiency of commercial banks in Vietnam: Performances and determinants. Asia-Pacific Journal of Operational Research 30: 1250047. [Google Scholar] [CrossRef] [Green Version]
- Nguyen, T. P. Thanh, Son H. Nghiem, Edurado Roca, and Parmendra Sharma. 2016a. Efficiency, innovation and competition: Evidence from Vietnam, China and India. Empirical Economics 51: 1235–59. [Google Scholar] [CrossRef]
- Nguyen, Thanh P. T., Son H. Nghiem, and Edurado Roca. 2016b. Management Behaviour in Vietnamese Commercial Banks. Australian Economic Papers 55: 345–67. [Google Scholar] [CrossRef] [Green Version]
- Nguyen, Thanh P. T., Son H. Nghiem, Edurado Roca, and Parmendra Sharma. 2016c. Bank reforms and efficiency in Vietnamese banks: Evidence based on SFA and DEA. Applied Economics. [Google Scholar] [CrossRef] [Green Version]
- Nguyen, Tram, David Tripe, and Thanh Ngo. 2018. Operational Efficiency of Bank Loans and Deposits: A Case Study of Vietnamese Banking System. International Journal of Financial Studies 6: 14. [Google Scholar] [CrossRef] [Green Version]
- Nguyen, T. Nga, T. Loan Vu, and H. Linh Dinh. 2019. Measuring banking efficiency in Vietnam: Parametric and non parametric methods. Banks and Bank Systems 14: 55–64. [Google Scholar] [CrossRef] [Green Version]
- Nguyen, Thanh Dat, Tu Duc Quang Le, and Huu Tin Ho. 2021. Intellectual Capital and Bank Risk in Vietnam—A Quantile Regression Approach. Journal of Risk and Financial Management 14: 27. [Google Scholar] [CrossRef]
- Odeck, James, and Svein Bråthen. 2012. A meta-analysis of DEA and SFA studies of the technical efficiency of seaports: A comparison of fixed and random-effects regression models. Transportation Research Part A: Policy and Practice 46: 1574–85. [Google Scholar] [CrossRef]
- Pagano, Macro. 1993. Financial Markets and Growth: An Overview. European Economic Review 37: 613–22. [Google Scholar] [CrossRef]
- Paradi, Joseph, and Haiyan Zhu. 2013. A survey on bank branch efficiency and performance research with data envelopment analysis. OMEGA 41: 61–79. [Google Scholar] [CrossRef]
- Rajan, Raghuram, and Luigi Zingales. 1998. Financial Dependence and Growth. The American Economic Review 88: 559–86. [Google Scholar]
- Sealey, Calvin. W., and James T. Lindley. 1997. Inputs, outputs, and a theory of production and cost at depository financial institutions. Journal of Finance 32: 1251–66. [Google Scholar] [CrossRef]
- Simar, Leopold, and Paul W. Wilson. 2007. Estimation and inference in two-stage, semi-parametric models of production processes. Journal of Econometrics 136: 31–64. [Google Scholar] [CrossRef]
- Stanley, Tom D., and Stephen B. Jarrell. 1989. Meta-regression analysis: A quantitative method of literature surveys. Journal of Economic Surveys 3: 161–70. [Google Scholar] [CrossRef]
- Stanley, Tom D., Hristos Doucouliagos, Margaret Giles, Jost H. Heckemeyer, Robert J. Johnston, Patrice Laroche, Jon P. Nelson, Martin Paldam, Jacques Poot, Geoff Pugh, and et al. 2013. Meta-analysis of economics research reporting guidlines. Journal of Economic Surveys 27: 390–94. [Google Scholar] [CrossRef]
- Stewart, Chris, Roman Matousek, and Thao N. Nguyen. 2015. Efficiency in the Vietnamese banking system: A DEA double bootstrap approach. Research in International Business and Finance 36: 96–111. [Google Scholar] [CrossRef] [Green Version]
- Tatsioni, Aathina, and John P. A. Ioannidis. 2017. Meta-analysis. In International Encyclopedia of Public Health. Edited by S. R. Quah. Oxford: Academic Press, pp. 117–24. [Google Scholar]
- Thiam, Aabdourahmane, Boris E. Bravo-Ureta, and E. Teodoro Rivas. 2001. Technical efficiency in developing country argiculture: A meta-analysis. Argiculture Economics 25: 235–43. [Google Scholar] [CrossRef]
- Thompson, Russell G., Emile J. Brinkmann, P. S. Dharmapala, M. D. Gonzalez-Lima, and Robert M. Thrall. 1997. DEA/AR profit ratios and sensitivity of 100 large U.S. banks. European Journal of Operational Research 98: 213–29. [Google Scholar] [CrossRef]
- Tran, Thao P., and Thuy C. Phan. 2015. Banking industry development and bank efficiency in an emerging market economy. Paper presented at the The Second Asia-Pacific Conference on Global Business, Economics, Finance and Social Sciences, Da Nang, Vietnam, 10–12 July 2021. [Google Scholar]
- Vietnamese Government. 2009. Decree No. 59/2009/ND-CP on Organization and Operation of Commercial Banks, Hanoi. Available online: https://vanbanphapluat.co/decree-no-59-2009-nd-cp-of-july-16-2009-on-organization-and-operation-of-commercial-banks (accessed on 1 June 2021).
- Vo, X. Vinh, and Huan H. Nguyen. 2018. Bank restructring and bank efficiency—The case of Vietnam. Cogent Economics & Finance 6: 1520423. [Google Scholar] [CrossRef] [Green Version]
- Vu, Ha Thu, and Daehoon Nahm. 2013. The determinants of profit efficiency of banks in Vietnam. Journal of the Asia Pacific Economy 18: 615–31. [Google Scholar] [CrossRef]
- Vu, Ha Thu, and Sean Turnell. 2010. Cost efficiency of the banking sector in Vietnam: A Bayesian stochastic frontier approach with regularity constraints. Asian Economic Journal 24: 115–39. [Google Scholar] [CrossRef]
- Woltman, Heather, Andrea Feldstain, J. Christine MacKay, and Meredith Rocchi. 2012. An introduction to hierarchical linear modeling. Tutorials in Quantitative Methods for Psychology 8: 52–69. [Google Scholar] [CrossRef] [Green Version]
- Zhang, Yun, and Robert Bartels. 1998. The Effect of Sample Size on the Mean Efficiency in DEA with an Application to Electricity Distribution in Australia, Sweden and New Zealand. Journal of Productivity Analysis 9: 187–204. [Google Scholar] [CrossRef]
Figure 1.
Illustration of SFA and DEA model

Figure 2.
Numbers of SFA/DEA studies and observations on Vietnamese banks.

Table 1.
Descriptive statistics of our data.
| Variables | Observations | Mean | Standard Deviation | Minimum | Maximum |
|---|---|---|---|---|---|
| EF | 39 | 0.770 | 0.032 | 0.101 | 0.970 |
| YEAR | 39 | 2013 | 0.585 | 2007 | 2019 |
| DATA (Panel = 1) | 39 | 0.897 | 0.049 | 0 | 1 |
| METHOD (DEA = 1) | 39 | 0.692 | 0.075 | 0 | 1 |
| RTS (CRS = 1) | 39 | 0.308 | 0.075 | 0 | 1 |
| PUB (Journal = 1) | 39 | 0.692 | 0.075 | 0 | 1 |
| SIZE | 39 | 30.205 | 1.887 | 12 | 56 |
| PRODUCT | 39 | 0.769 | 0.068 | 0 | 1 |
| COST | 39 | 0.154 | 0.059 | 0 | 1 |
| PROFIT | 39 | 0.077 | 0.043 | 0 | 1 |
| AUTHOR (Single = 1) | 39 | 0.410 | 0.080 | 0 | 1 |
Notes: EF represents the average efficiency scores derived from observation i; YEAR indicates the year of publication of observation i; DATA is a dummy variable representing the data type used in observation i that takes a value of 1 for panel data and 0 for cross-sectional data; METHOD is a dummy variable accounting for the frontier approach of observation i that takes a value of 1 for DEA method and 0 for SFA method; RTS is a dummy variable that takes a value of 1 for the assumption of constant returns to scale in observation i and 0 otherwise; PUB is a dummy variable representing the type of publications of observation i that takes a value of 1 for a published journal and 0 otherwise; SIZE represents the number of banks involved in observation i; PRODUCT and COST are the dummy variables representing the type of efficiency that are estimated in observation i, the reference measurement in this case is profit efficiency (PROFIT); AUTHOR is a dummy variable denoting the number of authors in observation i that takes a value of 1 for a single author observation and 0 otherwise.
Table 2.
Regression results.
| Tobit Regression | Bootstrap Tobit | Truncated Regression | Bootstrap Truncated | |||||
|---|---|---|---|---|---|---|---|---|
| Coef. | Std. Err. | Coef. | Std. Err. | Coef. | Std. Err. | Coef. | Std. Err. | |
| YEAR | 0.029 *** | 0.007 | 0.029 *** | 0.009 | 0.039 *** | 0.011 | 0.039 *** | 0.012 |
| DATA | −0.153 ** | 0.069 | −0.153 ** | 0.077 | −0.321 ** | 0.161 | −0.321 *** | 0.121 |
| METHOD | 0.055 | 0.050 | 0.055 | 0.060 | 0.087 | 0.074 | 0.087 | 0.083 |
| RTS | −0.064 | 0.044 | −0.065 | 0.051 | −0.121 * | 0.068 | −0.121 | 0.075 |
| PUB | −0.045 | 0.059 | −0.045 | 0.103 | −0.076 | 0.085 | −0.076 | 0.132 |
| SIZE | −0.008 *** | 0.002 | −0.009 *** | 0.003 | −0.009 *** | 0.002 | −0.009 *** | 0.003 |
| PRODUCT | 0.120 | 0.071 | 0.120 | 0.150 | 0.163 * | 0.096 | 0.163 | 0.179 |
| COST | −0.138 * | 0.078 | −0.138 | 0.167 | −0.137 | 0.098 | −0.137 | 0.187 |
| AUTHOR | −0.031 | 0.041 | −0.031 | 0.053 | −0.037 | 0.062 | −0.037 | 0.069 |
| Constant | −57.56 *** | 14.28 | −57.56 *** | 18.95 | −77.01 *** | 22.29 | −77.01 *** | 24.85 |
| Log-likelihood | 31.762 | 31.762 | 39.345 | 39.344 | ||||
| 47.67 | 45.040 | 54.22 | 48.59 | |||||
| Observations | 39 | 39 | 39 | 39 | ||||
Note: YEAR indicates the year of publication of observation i; DATA is a dummy variable representing the data type used in observation i that takes a value of 1 for panel data and 0 for cross-sectional data; METHOD is a dummy variable accounting for the frontier approach of observation i that takes a value of 1 for DEA method and 0 for SFA method; RTS is a dummy variable that takes a value of 1 for the assumption of constant returns to scale in observation i and 0 otherwise; PUB is a dummy variable representing the type of publications of observation i that takes a value of 1 for a published journal and 0 otherwise; SIZE represents the number of banks involved in observation i; PRODUCT and COST are the dummy variables representing the type of efficiency that are estimated in observation i, the reference measurement in this case is profit efficiency (PROFIT); AUTHOR is a dummy variable denoting the number of authors in observation i that takes a value of 1 for a single author observation and 0 otherwise. The dependent variable is EF which represents the average efficiency scores derived from observation i. The number of bootstraps is 2000. Coef. Stands for coefficient and Std. Err. Stands for standard errors. *, **, *** represent the significance levels at 10, 5 and 1 percent, respectively.
Publisher’s Note: MDPI stays neutral with regard to jurisdictional claims in published maps and institutional affiliations. |
© 2021 by the authors. Licensee MDPI, Basel, Switzerland. This article is an open access article distributed under the terms and conditions of the Creative Commons Attribution (CC BY) license (https://creativecommons.org/licenses/by/4.0/).
Share and Cite
MDPI and ACS Style
Ho, T.H.; Nguyen, D.T.; Ngo, T.; Le, T.D.Q. Efficiency in Vietnamese Banking: A Meta-Regression Analysis Approach. Int. J. Financial Stud. 2021, 9, 41. https://0-doi-org.brum.beds.ac.uk/10.3390/ijfs9030041
AMA Style
Ho TH, Nguyen DT, Ngo T, Le TDQ. Efficiency in Vietnamese Banking: A Meta-Regression Analysis Approach. International Journal of Financial Studies. 2021; 9(3):41. https://0-doi-org.brum.beds.ac.uk/10.3390/ijfs9030041
Chicago/Turabian StyleHo, Tin H., Dat T. Nguyen, Thanh Ngo, and Tu D. Q. Le. 2021. "Efficiency in Vietnamese Banking: A Meta-Regression Analysis Approach" International Journal of Financial Studies 9, no. 3: 41. https://0-doi-org.brum.beds.ac.uk/10.3390/ijfs9030041
Note that from the first issue of 2016, this journal uses article numbers instead of page numbers. See further details here.