
Fintech Credit and Bank Efficiency: International Evidence


1
Institute for Development and Research in Banking Technology, University of Economics and Law, Ho Chi Minh City 70000, Vietnam
2
Vietnam National University, Ho Chi Minh City 70000, Vietnam
3
School of Finance and Banking, University of Economics and Law, Ho Chi Minh City 700000, Vietnam
4
School of Aviation, Massey University, Palmerston North 4442, New Zealand
5
University of Economics and Business, Vietnam National University, Hanoi 10000, Vietnam
*
Author to whom correspondence should be addressed.
Int. J. Financial Stud. 2021, 9(3), 44; https://0-doi-org.brum.beds.ac.uk/10.3390/ijfs9030044
Submission received: 22 July 2021
/
Revised: 15 August 2021
/
Accepted: 16 August 2021
/
Published: 17 August 2021
(This article belongs to the Special Issue The Financial Industry 4.0 Part 2)
Abstract
:The expansion of fintech credit around the world is challenging the global banking system. This study investigates the interrelationships between the development of fintech credit and the efficiency of banking systems in 80 countries from 2013 to 2017. The findings indicate a two-way relationship between them. More specifically, a negative relationship between bank efficiency and fintech credit implies that fintech credit is more developed in countries with less efficient banking systems. Meanwhile, a positive impact of fintech credit on the efficiency of banking systems suggests that fintech credit may serve as a wake-up call to the banking system. Therefore, fintech credit should be encouraged by the authorities around the world.
Keywords:
fintech credit; banking efficiency; data envelopment analysis; structural equations model; GMMJEL Classification:
E51; G23; O311. Introduction
The literature documents that the financial sector is the backbone of any economy. Since the rapid development of financial technology, a new relationship between banks and capital markets has evolved. Capital markets and banks are viewed as competing sources of financing, since one sector develops at the expense of the other (Allen and Gale 1999), but these intermediaries can also be considered complementary to each other (Song and Thakor 2010). Recently, Ngo and Le (2019) demonstrated the existence of a two-way nexus between the capital market and the banking system. This study, therefore, revisits the causal relationship between the recent development of fintech credit platforms and the banking system.
The global credit markets have experienced an undergoing transformation in which new digital lending models (i.e., peer-to-peer (P2P)/marketplace lending and invoice trading) have grown in many countries. Following Claessens et al. (2018), fintech credit is defined as all types of credit facilitated for both consumers and businesses by online platforms rather than conventional banks or lending institutions. Fintech credit models were initially established based on decentralized platforms in which individual lenders or institutional investors select potential borrowers or projects to advance in a specific framework (Jagtiani and Lemieux 2019). The detailed description of big tech credit models is out of the scope of this study but was comprehensively discussed by Cornelli et al. (2020). Previous lessons emphasize that an excessive expansion of credit can trigger a financial crisis and severe recession in an economy (Aliber and Kindleberger 2015). Since the growth of fintech credit is very rapid and has become more economically relevant, there is an urgent need for an adequate assessment of this aspect.
Several studies investigating the determinants of fintech credit have found that fintech credit is more developed in countries where banking intermediation and banking coverage are lower (Cornelli et al. 2020). A general conclusion is that fintech credit seems complementary rather than a substitute for the banking system (Claessens et al. 2018), and more especially promoting access to credit for underserved segments and financial inclusion (Oh and Rosenkranz 2020). However, Tang (2019) suggested that P2P lending platforms in the US serve as substitutes for bank lending regarding infra-marginal bank borrowers, while acting as complements in terms of small loans. This partly confirms the early findings of De Roure et al. (2016), who found that P2P lending substitutes the banking sector for high-risk consumer loans, and those of De Roure et al. (2018), who presented further evidence in favor of such bottom fishing. Furthermore, Yeo and Jun (2020) proved that bank stability is not affected by P2P lending, as these platforms operate in the low-credit segment.
Our study contributes to the literature in several ways. Empirical studies on fintech credit are scarce due to data unavailability. Prior studies commonly investigated the determinants of fintech credit development when controlling several aspects of banking regulation. Additionally, few theoretical and empirical works using proprietary P2P lending data have attempted to examine the impact of P2P lending on bank lending in several borrowers’ segments. These studies, however, may provide an incomplete picture of the causal relationship between the development of fintech credit and banking systems. For instance, when the banking system is less efficient because of either implementing an inappropriate procedure to assess the credit quality of borrowers or underserving consumers in remote regions where there is limited bank access, this would encourage a shift towards online lending platforms. Meanwhile, fintech credit platforms could also reduce the issue of asymmetric information via their screening and evaluating practices, especially by offering investors more information about the risk of a potential loan and other characteristics of prospective borrowers. Consequently, this may reduce the necessity of the banking system. We also contend that the growth of fintech credit may serve as a wake-up call for the banking systems, as they may respond to the greater pressure caused by these platforms by enhancing their efficiency. The efficiency of the banking system is defined as its ability to produce the existing level of outputs with minimal inputs, i.e., input-oriented DEA efficiency (Coelli et al. 2005). This study is the first attempt to examine the interrelationships between fintech credit and bank efficiency using a two-stage framework in 80 countries from 2013 to 2017. In the first stage, banking efficiency scores are estimated by DEA with the use of financial ratios, as proposed by Ngo and Le (2019). Those efficiency scores are then linked with the growth of fintech credit, as measured by the natural logarithm of the volume of fintech credit per capita in the second stage using the Generalized Method of Moments estimator in a simultaneous equations model (SEM). This thus would help to shed light on the interrelationships between them so that some recommendations on fintech credit can be drawn.
2. A Brief Literature Review
The literature can be divided into two strands. The first strand focuses on the relationship between the emergence of financial technology (fintech) firms and the banking system. Several studies argued that fintech competitors generating new business models with the use of big data may disrupt conventional banks, although banks are gradually adapting to digital finance (Vives 2017). One of the potential advantages of new competitors is to provide digital services that attract the younger generation, due to more convenience and better ease of use (Deloitte 2015). Therefore, the development of fintech credit was a potential threat to the banking system. However, in the case of high switching costs, a bank that faces difficulty in distinguishing old from new customers may act as a quiet fat cat, because it needs to secure the profitability derived from its huge client base. This thus may permit fintech firms to enter the market and serve unbanked people or/and technology-savvy customers. This may be true for the case of P2P lending platforms, where they utilize advanced technology based on a large amount of information from social media that may mitigate adverse selection and moral hazard issues. Therefore, the partnership between a new entrant and incumbent seems to be the most appropriate. Vives (2017) further emphasized that this strategy is more relevant to regulatory arbitrage, given that the regulation on fintech credit is less strict. On the other hand, banks may prefer barriers to new entrants. In the case of payment segments where fintech firms may rely on the payment infrastructure of the incumbents to provide complementary or differentiated services, these incumbents have more incentives to increase the costs of entrants.
Although empirical studies on the impact of fintech credit on the banking system are limited, they show mixed findings. Buchak et al. (2018) found that the most vulnerable are US rural commercial banks that gradually lost lending volumes to fintech credit, especially personal loans, and that tend to lend to riskier borrowers, while the lending volumes of urban commercial banks are not affected. In the same vein, P2P lending platforms may substitute bank lending volumes in terms of infra-marginal bank borrowers in the US (Tang 2019) or high-risk consumer loans in Germany (De Roure et al. 2016). However, others showed opposite findings. Tang (2019) also showed that P2P lending serves as a complementary for the banking system regarding small loans. The positive relationship between fintech and banking sector development may be because fintech firms focus on serving niche segments such as either low-cost services or unbanked people or high quality of services that could meet consumers’ needs regarding accessibility, customization, and speed based on the analysis of a large amount of information on personal data (Navaretti et al. 2017). Therefore, the banking system may not be disrupted by the evolution of fintech credit (Siek and Sutanto 2019; Yeo and Jun 2020). A recent study by Sheng (2021) even demonstrated that fintech can enhance the overall supply of bank credit to small and medium enterprises but this impact varies between small and large banks.
In the second strand, the impact of the banking system on fintech credit is focused on. Given the presence of fintech credit in the marketplace, incumbent banks may respond to it in several ways, such as cooperating with new entrants, acquiring them partially or completely, or competing with them directly. These strategies depend on whether an investment would make a firm more competitive or more vulnerable in the competitive market. A conceptual framework of Bömer and Maxin (2018) proposes that the fintech–bank partnership allows fintech firms to sell their products and services by using different label approaches. Thus, banks may improve fintech’s profitability. Only a few studies on the factors affecting the development of fintech credit consistently show that fintech credit is more developed in markets where there is a low level of banking coverage (Claessens et al. 2018; Cornelli et al. 2020) and a less competitive banking system (Le 2021).
In sum, several studies investigate a one-way relationship between the banking system and the development of fintech credit or the impact of fintech credit on bank lending. A study by Ngo and Le (2019) indicated the existence of interrelationships between financial development and banking efficiency. Given the emergence of fintech credit in the financial market, our study is the first attempt to examine whether a two-way relationship between fintech credit and bank efficiency exists.
3. Data and Research Methodology
3.1. Data
Our data were gathered at an aggregate or national level. More specifically, data used in DEA analysis were extracted from the Financial Development and Structural Dataset (Beck et al. 2000), while those used in SEM analysis were mainly collected from the database provided by Cornelli et al. (2020), who provided an update on the Global Alternative Finance Database. The database is held at the Cambridge Centre for Alternative Finance (CCAF). Other macroeconomic variables were extracted from the World Development Indicators (World Bank 2017). Initially, a total of 203 banking systems in the Financial Development and Structural Dataset were considered in our initial sample. We then excluded those for which fintech credit data (either the volume of fintech credit or the volume of fintech credit per capita) were unavailable. After matching these datasets, we arrived at an unbalanced dataset of 80 countries from 2013 to 2017, as presented in Table A1 in Appendix A.1
3.2. First Stage: Estimating the Efficiency of Banking Systems
The literature suggests that bank efficiency can be calculated by using either a non-parametric method (i.e., DEA) or a parametric approach (i.e., stochastic frontier analysis (SFA)) (Berger and Humphrey 1997; Boubaker et al. 2020). However, Liu et al. (2013) showed that DEA was used as the main methodology among 3134 non-theoretical research papers, among which banking studies accounted for the highest proportion. DEA was thus selected in our study, since it works well with a small sample size and is also less prone to specification errors than SFA—and therefore is more flexible (Reinhard et al. 2000).
Furthermore, the DEA method has also received much attention in studying the efficiency of firms in financial services such as stock markets, insurance, pension funds, mutual funds, risk tolerance, and corporate failure prediction (Boubaker et al. 2018, 2021; Paradi et al. 2017; Vidal-García et al. 2018).2
In DEA, the efficiency of a bank/banking system, or the so-called Decision-Making Unit (DMU), is estimated as its ability to transform inputs into outputs. A DMU is efficient if it either utilizes the fewer inputs to produce a given set of outputs (input-oriented) or if it can produce the most outputs from the given set of inputs (output-oriented). In our efficiency estimations, an input-oriented DEA model is used because a banking system may find it easier to manage its inputs rather than outputs in a more competitive market (Ngo and Le 2019).
For a set of n DMUs (j = 1, …, n) each using s inputs (i = 1, …, s) to produce m outputs (r = 1, …, m), based on the constant-returns-to-scale model introduced by Charnes et al. (1978), Banker et al. (1984) proposed the variable-returns-to-scale (VRS) DEA model to estimate the efficiency score of the j0-th DMU as
where u and v are the weights of the outputs and inputs, respectively.
Following Ngo and Le (2019), the whole banking system of an economy is treated as a single DMU in the VRS DEA model with indices for the inputs and outputs as measured at the aggregate level. Note that the efficiency scores of DMUs derived from the DEA approach are affected by the selection of inputs and outputs. The literature suggests that the choice of inputs and outputs is determined based on three main approaches, including the intermediation approach and production approach and the revenue (or value-added) approach (Drake et al. 2006; Ho et al. 2021; Le and Ngo 2020). In our study, the intermediation approach was adopted, since it is more appropriate to examine the whole banking system. Accordingly, the entire banking system of a nation was considered an intermediary between depositors and borrowers. That means any banking system tends to utilize deposits and overhead costs to provide credits to the private sector and increase its earnings (Ngo and Le 2019). Hence, the input-oriented DEA model was used to estimate the technical efficiency of the banking systems regarding pursuing this objective.
Similar to Ngo and Le (2019), our inputs included the ratio of total bank deposits to GDP (DEPOSIT) and the ratio of total bank overhead costs to total assets (LABOR), whilst outputs consisted of the private credit to GDP as a share of GDP (CREDIT) and the ratio of net interest revenue to interest-bearing assets (NIM). Note that because of substantially missing data on other input and output variables (the ratio of non-performing loans to total loans, the ratio of bank capital to total assets, returns on assets, and returns on equity), a set of two inputs and two outputs was used. Given that our sample ranged from at least 50 countries in 2013 up to 80 countries in 2017, the use of a set of two inputs and two outputs was consistent with the DEA literature (Ngo and Le 2019). Because the DEA calculation is year-based, and we did not examine the productivity change over time, the unbalanced data did not affect our analysis.
Table 1 presents the descriptive statistics of inputs and outputs used in DEA analysis. There appears to be little change in the costs (LABOR) and profitability (NIM) of banking systems over the examined period. When observing DEPOSIT, there was an increasing trend in the first three years and then a decrease in the latter period. However, the opposite phenomenon was observed in the case of CREDIT. This perhaps may reflect the growth of fintech credit platforms in providing financial solutions and services, which gradually increases the market share of lending. Additionally, a high standard deviation of these variables suggests that large volatilities and scale differences exist among our selected banking systems. This further demonstrates the appropriate use of VRS DEA to examine the scale effect.
3.3. Second Stage: The Interrelationship between Banking Efficiency and Fintech Credit
Most empirical studies examine the determinants of either banking efficiency (Manlagnit 2015) or fintech credit (Claessens et al. 2018; Cornelli et al. 2020). Additionally, several studies used bank-level data to investigate the interrelationship between banking efficiency and other environmental factors (Le 2018), while others used cross-country data to investigate the two-way linkage between capital market development and banking efficiency (Ngo and Le 2019). As explained above, fintech credit is more likely to expand in economies where banks do not meet the demand for banking products/services, while fintech credit may serve as a wake-up call to banking systems. Taken together, we further investigate the interrelationship between fintech credit and bank efficiency, since the one-way investigation may suffer from simultaneous bias. Because a structural equations model (SEM) can offer a set of interrelated questions in a single, systematic, and comprehensive analysis (Gefen et al. 2000), the following SEM is proposed:
where LNFINCAP and EF are the two endogenous variables. represents the banking efficiency in economy i at time t and ranges from 0 to 1, deriving from the first stage, whilst is measured by the natural logarithm of the volume of fintech credit per capita in economy i at time t.3
Following Claessens et al. (2018) and Cornelli et al. (2020), the development of fintech credit is associated with a country’s level of economic and financial development (GDPCAP, the gross domestic product per capita), fintech regulation (REGFIN, a dummy variable that takes a value of 1 if an explicit regulation of fintech credit was in place in a country, and 0 otherwise), mobile phone subscriptions (MOBILE, mobile phone subscriptions per 100 persons), the density of the bank branch network (BRANCH, a number of bank branches per 100,000 adults), and a country’s economic growth (GDPGR, the GDP growth rate). Because GDPCAP is likely to be a proxy for many factors relating to a country’s stage of development, a positive impact of GDPCAP on LNFINCAP is expected. We further included GDPCAP2, a squared GDP per capita to capture possible non-linearity in this relationship. When a fintech regulation (REGFIN) is introduced, this may further foster the development of fintech credit because of more trust towards new intermediaries regarding the supply of funds from investors. Additionally, most fintech credit platforms have apps on mobile devices, intending to improve their convenience for users. Thus, an increase in mobile phone subscriptions (MOBILE) may promote the development of fintech credit. Furthermore, economic growth (GDPGR) may increase demand for financial products and services, and borrowers may seek credit from different sources of funds with better prices. This, therefore, increases the development of fintech credit. When traditional lending providers are limited to offering their financial products and services during economic downturns, this creates an opportunity for the expansion of fintech credit.
Following Phan et al. (2016) and others, banking efficiency is associated with banking competition (LERNER, the Lerner index of the banking sector mark-ups), market concentration (CONCEN, the ratio of three largest banks’ assets to all commercial banks’ assets), and banking regulation (RS, a regulatory stringency index for the banking sector), economic growth (GDPGR, the GDP growth rate), and inflation (INF, the inflation rate). The information generation hypothesis suggests a negative impact of competition on banking efficiency (Marquez 2002). Greater competition may reduce banks’ capability of gathering information and increase the probability of adverse borrower selection. Consequently, this results in lower banking efficiency. The quiet life hypothesis proposes that market concentration (or market power) impacts banking efficiency negatively because it permits banks to enjoy a ‘quiet life’—reducing the bank manager’s efforts to minimize their bank’s inefficiency (Berger and Hannan 1998). Empirical studies show mixed findings (Le and Ngo 2020; Phan et al. 2016). Moreover, Manlagnit (2015) documented conflicting findings regarding the relationship between banking regulation and banking efficiency in prior studies using bank-level data. We, however, used aggregate data to control for this relationship. Last, the effect of macroeconomic conditions such as economic growth and inflation was also considered. Table A2 in Appendix A provides a summary of variables used in SEM with their definitions and expected signs.
Moreover, Table A3 in Appendix A presents descriptive statistics of variables used in SEM analysis. There appears to be an increasing trend in LNFINCAP and LNALTERCAP from 2013 and 2017, which reflects the rapid penetration of fintech and big tech firms in lending markets. The growth of fintech credit platforms is further facilitated by the increasing use of mobile phones (MOBILE) and a reduction in the number of bank branches (BRANCH).
We test for heteroscedasticity using a two-step Breusch–Pagan test when one or more regressors are endogenous. Firstly, each of the two equations with pooled OLS with robust standard errors is run. Thereafter, Breusch–Pagan tests are performed. The results show that p-values of Equations (2) and (3) are 0.00 and 0.02, respectively, suggesting high heteroscedasticity.
From Equations (2) and (3), the error terms and may be related because the same data are used. If unaccounted for, the simultaneous equation bias from these equations can result in inconsistent and biased estimators. These errors are simultaneously correlated, as they include the impact of factors that may be omitted. Because the banking systems’ operation is homogenous in many ways, the impact of the omitted factors on the relationship between fintech credit and banking efficiency for one country may be similar to that for another. If this is true, these errors account for similar effects and will be correlated. To address this issue and control for heteroskedasticity and arbitrary autocorrelations, the panel Generalized Method of Moment (GMM) (Baltagi 2008) was used. The GMM estimator is more efficient than other conventional estimators such as fixed or random effects when a serial correlation exists or when the assumption on the strict exogeneity of regressor is false (Wooldridge 2001). Since the SEM framework effectively controls for the endogeneity and the GMM estimator generates efficiency gains when endogenous explanatory regressors are present, all estimations in our results were run with the use of the GMM estimator, which utilizes the interactions among the innovations in Equations (2) and (3). We further used the Newey and West (1987) method to control for heteroskedasticity and arbitrary autocorrelations when estimating Equations (2) and (3). Because the Newey–West method involves an expression in the squares of the residuals which is analogous to White’s formula, these estimates contain White’s correction. When the context of time series is considered, Newey–West standard errors are robust to both arbitrary heteroskedasticity and arbitrary autocorrelation. Therefore, our study used the SEM with GMM estimator combined with the Newey–West method to examine the interrelationships between fintech credit and banking efficiency. This approach was also used by several other studies, such as Nguyen (2012), Le and Pham (2021), and Le (2020), among others.
4. Results
4.1. The Analysis of the Efficiency of Banking Systems around the World
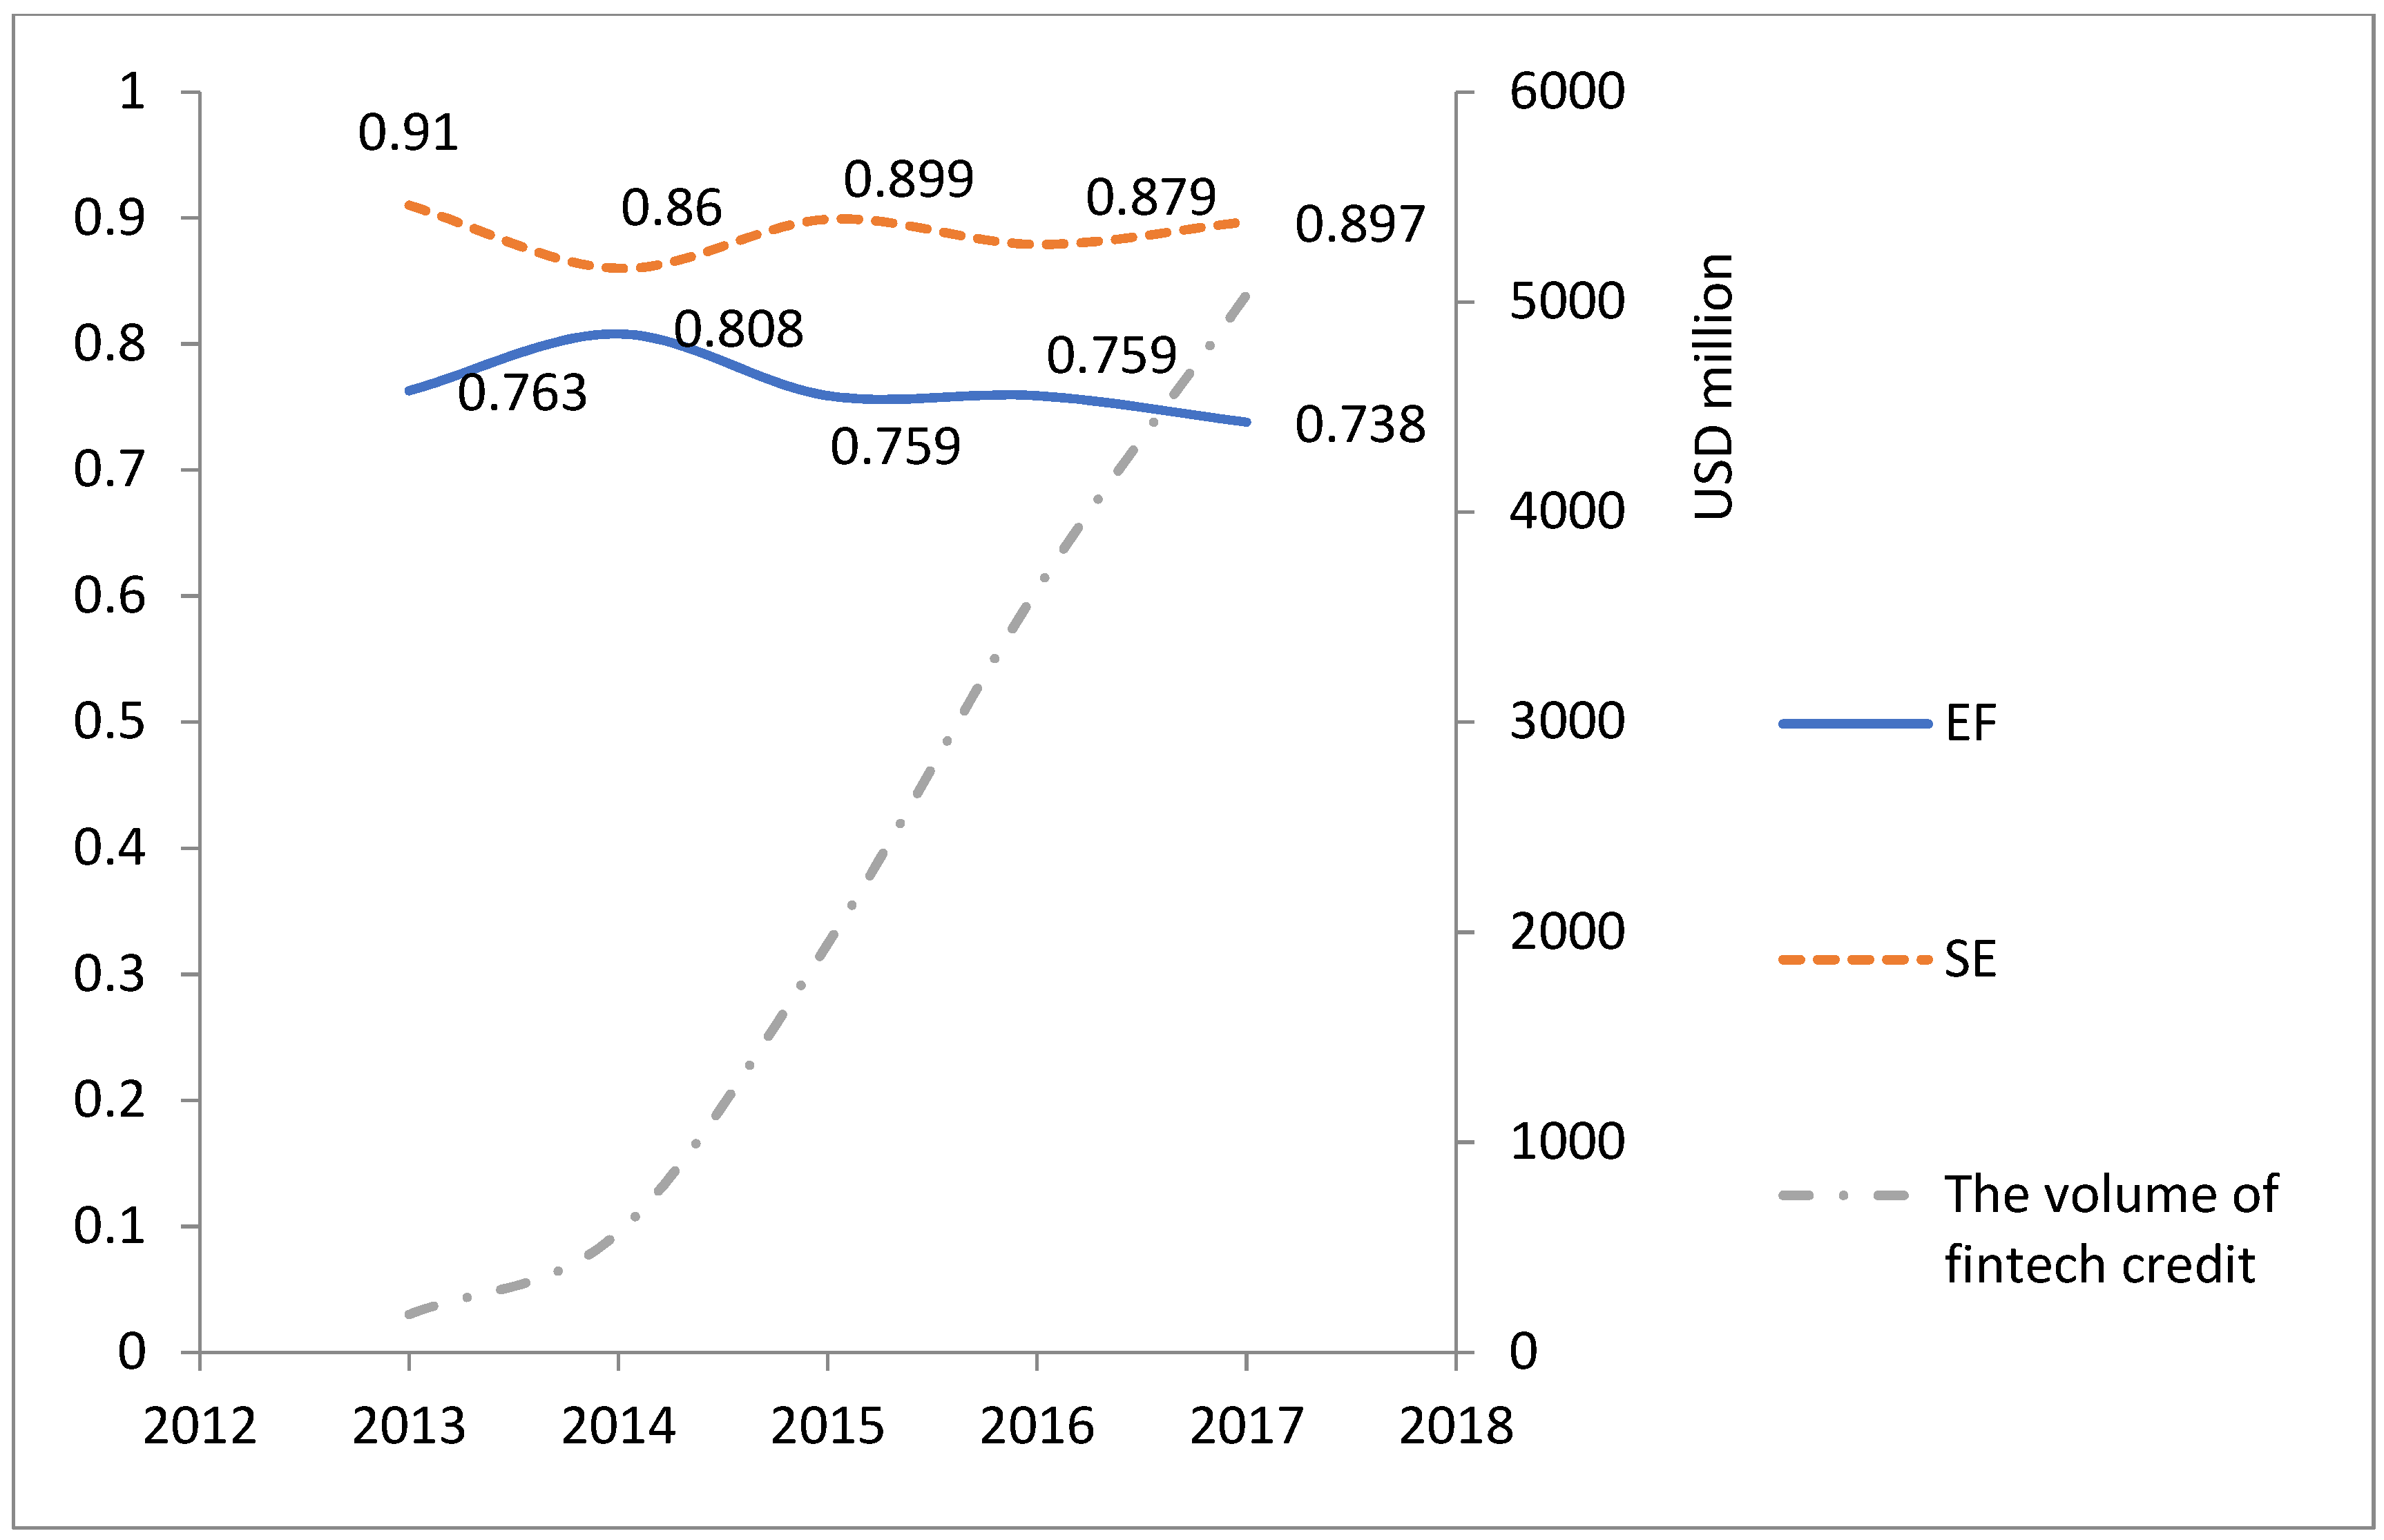
The average efficiency scores (EF) of global banking systems ranged from 0.738 (i.e., 26.2% inefficient) to 0.808 (i.e., 19.2% inefficient), as indicated in Figure 1. A modest decrease in the technical efficiency of the banking systems around the world over the examined period may reflect the consequence of the global financial crisis of 2007–2008 and the European debt crisis. Additionally, there appears to be a slight reduction in scale efficiency (SE), from 0.91 in 2013 to 0.897 in 2017, implying a more competitive environment of the global banking system. In contrast to a slight reduction in banking efficiency, the volume of fintech credit significantly increased over the studied period.
4.2. The Interrelationships between Fintech Credit and Banking Efficiency
Table A4 in Appendix A describes the correlation matrix of the variables used in SEM. At first glance, EF is negatively related to LNFINCAP and positively associated with LNALTERCAP. Additionally, there appear no significant correlations between the explanatory variables used in each equation. Nonetheless, the intertemporal relationship between EF and LNFINCAP can only be examined by using the SEM analysis.
Table 2 shows that the p-value of the Hansen test is statistically not significant, and thus the null hypothesis cannot be rejected. This means no evidence of over-identifying restrictions in SEM analysis with the use of the GMM estimator. Alternatively, all conditions for the moments are met and the instruments are accepted.
For the determinants of fintech credit development (Part 1 of Table 2), EF is significantly and negatively associated with LNFINCAP, suggesting that the less efficient the banking system in a country is, the more developed its fintech credit is. This somewhat supports the early findings of Cornelli et al. (2020), who found that fintech credit is more developed where the level of bank intermediation of deposits to loans is lower. LNFINCAP is also significantly and positively related to GDPCAP, implying that fintech credit is more developed in nations where there is a greater level of economic and institutional development. However, the coefficient of GDPCAP2 is negative and significant, suggesting that this positive link becomes less crucial at greater levels of development. Nonetheless, this confirms the findings of Cornelli et al. (2020) and Claessens et al. (2018). Furthermore, a positive coefficient estimate on REGFIN demonstrates that the growth of fintech credit is rapid in a country where there is an explicit fintech credit regulation. This is comparable with the findings of Rau (2020), who demonstrated that the introduction of an explicit legal framework significantly boosts crowdfunding volume.
Additionally, BRANCH impacts LNFINCAP negatively, supporting the view that fintech credit serves either in underbanked regions or in the low-credit market segment (Yeo and Jun 2020) as a complement to conventional bank credit (Cornelli et al. 2020). This finding is also comparable with the use of agency banking. Nonetheless, we do not find any significant evidence that fintech credit is affected by economic growth (GDPGR) or mobile phone subscriptions (MOBILE).
For the determinants of banking efficiency (Part 2 of Table 2), a positive coefficient estimate on LNFINCAP suggests that fintech credit may serve as a wake-up call for the banking system. New credit activities provide financial services in which lenders and borrowers conduct transactions directly without the need for the intermediation of traditional financial institutions. The banking systems may respond to the increasingly competitive environment caused by the rapid expansion of fintech credit platforms by improving their efficiency. Learning from fintech credit platforms, the banking systems may utilize the application of emerging technologies in the banking industry (i.e., artificial intelligence technology, blockchain technology, cloud computing technology, big data technology) to their operating activities. In this sense, Cheng and Qu (2020) highlighted that the development of bank fintech is more likely to reduce credit risk for Chinese commercial banks. Additionally, LERNER is positively and significantly associated with EF, suggesting that the efficiency of the banking system is improved with a less competitive banking system. Therefore, this supports the view of the information generation hypothesis as proposed by Marquez (2002). Furthermore, a positive impact of INF on EF suggests that future movements in inflation are fully anticipated by the banking systems, and thus this increases their profits. This is consistent with prior studies such as Demirgüç-Kunt and Huizinga (1999). Finally, we do not find any significant evidence that bank efficiency is influenced by market concentration, economic growth, and regulatory stringency for the banking system.
In sum, the findings suggest that there is a two-way relationship between fintech credit development and banking efficiency. Similar to the findings of Cornelli et al. (2020), the depth of fintech credit is more likely associated with a reduction in banking efficiency. Meanwhile, an expansion of fintech credit may serve as a wake-up call to the banking systems and perhaps place competitive pressure on them to improve their operations to remain a viable competitor.
4.3. Robustness Checks
For robustness, we first replace fintech credit with total alternative credit as measured by a sum of fintech credit and big tech credit (LNALTERCAP), as shown in Table 3. In contrast to prior studies such as Cornelli et al. (2020) and Claessens et al. (2018), we do not report the results of big tech credit as a dependent variable in SEM with the GMM estimator because of the smaller number of countries and years in which big tech credit is present. The number of observations for big tech credit only accounts for 14.84% of the total observations.
Part 2 of Table 3 confirms the positive impact of total alternative credit on banking efficiency, while the development of total alternative credit is not affected by the banking efficiency, as indicated in Part 1 of Table 3. This insignificant impact can be explained by the fact that big tech firms have operated in different countries, and thus may go beyond the capacity of domestic controls to capture the global nature of big tech business models. Big tech firms often have a wide range of business lines, in which lending accounts for only one (often small) part. However, the volume of big tech credit is usually large (i.e., this was at least twice as large as fintech credit in 2019) (Cornelli et al. 2020). The advantage of using large volumes of information allows big tech firms to effectively measure the loan quality of potential borrowers based on a large existing and cross-border user base, given the application of advanced technology in lending segments. Additionally, big tech firms may focus on serving potential borrowers who have already been existing customers in their ecosystem.
Following the classification by Cornelli et al. (2020), we also divide our sample into two groups, including developed and non-developed economies. Although the results cannot be reported here but are available upon request, the findings show that a two-way relationship between fintech credit and banking efficiency still holds for the case of non-advanced economies. Again, this confirms our above findings. When observing advanced economies, there appears only a one-way negative impact of fintech credit on banking efficiency, suggesting that fintech credit tends to substitute for the banking system. This is because more developed economies will have a higher demand for credit from firms and households, and thus, these potential borrowers tend to switch to new intermediaries. The advantages of fintech credit and big tech credit are comprehensively discussed by Cornelli et al. (2020) and Claessens et al. (2018). However, these findings need to be cautiously interpreted because of the small sample size used in SEM with the GMM estimator (i.e., there are only 92 observations in the case of developed economies).
Furthermore, we use the natural logarithm of the volume of fintech credit as an alternative measure of fintech credit. A positive impact of fintech credit on banking efficiency still holds, while the relationship in the other direction is insignificant. Additionally, we replace REGFIN with other variables that reflect countries’ institutional characteristics (i.e., barriers to entry, as expressed by the ease of doing business variables, and investor disclosure and efficiency of the judicial system). For the ease of doing business, we used score starting a business (overall), score-time (days), score-paid-in minimum capital (% of income per capita), and score-cost (% of income per capita). For the investor protection and judicial system, we used the extent of disclosure index, trial, and judgment (days), enforcement of judgment (days), and enforcement fees (% of claim). All indicators were collected from the World Bank Ease of Doing Business database. We ran each indicator individually to avoid multicollinearity issues. The findings indicate a two-way relationship between fintech credit and banking efficiency, although the reports are not presented but are available upon request. Nonetheless, our above findings are confirmed.
5. Conclusions
This study investigates the causal relationship between fintech credit and banking efficiency in 80 countries from 2013 to 2017 using a two-stage framework. In the first stage, DEA with the use of financial ratios was employed to estimate the efficiency of the banking systems around the world. In the second stage, the GMM estimation in SEM was used to examine the above interrelationship. The findings of the first stage show that the average efficiency scores of these banking systems are relatively low, suggesting that there is still room for them to improve.
Importantly, the findings of the second stage indicate that there is a negative relationship between banking efficiency and fintech credit, while greater fintech credit can promote banking efficiency. Additionally, a negative relationship between the density of bank branch networks and fintech credit suggests that fintech credit serves underbanked regions. Our findings further emphasize that fintech credit is more developed in economies where explicit fintech regulation is present. Therefore, the implementation of a legal framework regarding fintech credit is very important for the development of fintech credit. Additionally, our findings reemphasize the significance of monitoring and anticipating the movement of the inflation rate is very important to enhancing the efficiency of the banking system. All in all, promoting fintech credit would bring about mutual benefits, including (1) addressing the unbanked or low-credit segments that banking systems do not serve, and (2) enhancing the efficiency of the banking systems.
This study has some limitations. We could not extend the choice of variables in our DEA model nor incorporating the country-fixed effect variables in our SEM analysis due to data limitations. Future research may extend the data so that a balanced panel could be obtained to examine the efficiency and productivity changes over time of the banking systems. Additionally, future studies are encouraged to use different DEA models under the different assumptions in the first stage. For the second stage SEM analysis, the impact of big tech credit on banking efficiency should be considered in future studies when the relevant data are more widely available.
Author Contributions
Conceptualization, T.D.Q.L. and T.N.; methodology and software, D.T.N.; validation, T.D.Q.L.; formal analysis, T.H.H.; investigation, D.T.N.; resources, T.H.H.; data curation, T.H.H.; writing—original draft preparation, T.H.H. and D.T.N.; writing—review and editing, T.D.Q.L. and T.N.; visualization and supervision, T.D.Q.L.; project administration, T.D.Q.L.; funding acquisition, T.D.Q.L. All authors have read and agreed to the published version of the manuscript.
Funding
This research was funded by the University of Economics and Law, Vietnam National University, Ho Chi Minh City, Vietnam.
Institutional Review Board Statement
Not applicable.
Informed Consent Statement
Not applicable.
Data Availability Statement
The data presented in this study are available on request from the corresponding author. The data are not publicly available due to privacy.
Conflicts of Interest
The authors declare no conflict of interest. The funders had no role in the design of the study; in the collection, analyses, or interpretation of data; in the writing of the manuscript, or in the decision to publish the results.
Appendix A

Table A1.
The list of countries included in our sample.
| United Arab Emirates | France | Malaysia | Senegal |
| Argentina | Ghana | Mozambique | El Salvador |
| Austria | Guatemala | Nigeria | Togo |
| Australia | Hong Kong | Netherlands | Thailand |
| Belgium | Indonesia | Norway | Turkey |
| Burkina Faso | Ireland | New Zealand | United Republic of Tanzania |
| Bulgaria | Israel | Panama | Uganda |
| Burundi | India | Peru | United States of America |
| Brazil | Italy | Philippines | Uruguay |
| Côte d’Ivoire | Jordan | Pakistan | Viet Nam |
| Chile | Japan | Poland | South Africa |
| China | Kenya | Portugal | Zambia |
| Colombia | Cambodia | Paraguay | Bolivia |
| Czech Republic | Korea | Russian Federation | Cameroon |
| Germany | Lebanon | Rwanda | Costa Rica |
| Denmark | Lithuani | Saudi Arabia | Georgia |
| Ecuador | Latvia | Sweden | Zimbabwe |
| Estonia | Madagascar | Singapore | |
| Egypt | Mali | Slovenia | |
| Spain | Myanmar | Slovakia | |
| Finland | Mexico | Sierra Leone |
Table A2.
A summary of variables used in SEM and their expected signs.
| Variables | Definitions | Expected Signs | Sources | |
|---|---|---|---|---|
| LNFINCAP | The development of fintech credit | The natural logarithm of the volume of fintech credit per capita | ± | Cornelli et al. (2020) and CCAF |
| EF | Bank efficiency | Efficiency score of the individual banking system as derived from Data Envelopment Analysis under variable returns to scale assumption | ± | The Financial Development and Structural Dataset |
| GDPCAP | a country’s level of economic and financial development | The gross domestic product per capita | + | World Bank |
| REGFIN | Fintech regulation | A dummy variable that takes a value of 1 for a country where an explicit fintech credit regulation is in place, and 0 otherwise | + | Rau (2020) |
| MOBILE | Mobile phone subscriptions | Mobile phone subscriptions per 100 persons | + | World Bank |
| BRANCH | The density of bank branch network | The number of bank branches per 100,000 adult population | ± | World Bank |
| LERNER | Banking competition | The Lerner index of the banking sector mark-ups | ± | World Bank and Igan et al. (forthcoming) |
| CONCEN | Market concentration | The ratio of three largest banks’ assets to all commercial banks’ assets | ± | The Financial Development and Structural Dataset |
| RS | Banking regulation | A regulatory stringency index for the banking sector | ± | World Bank |
| GDPGR | Economic growth | The GDP growth rate | ± | World Bank |
| INF | Inflation | The inflation rate | ± | World Bank |
Table A3.
Descriptive statistics of variables used in the second-stage analysis.
| 2013 | 2014 | 2015 | 2016 | 2017 | ||||||
|---|---|---|---|---|---|---|---|---|---|---|
| Mean | STD | Mean | STD | Mean | STD | Mean | STD | Mean | STD | |
| LNFINCAP | −2.31 | 2.14 | −2.26 | 2.6 | −1.36 | 2.56 | −0.5 | 2.39 | −0.18 | 2.55 |
| LNALTERCAP | 1.19 | 3.03 | 1.77 | 3.28 | 2.49 | 3.64 | 3.31 | 3.37 | 4.31 | 3.02 |
| GDPCAP | 19.17 | 16.68 | 23.15 | 19.91 | 23.71 | 19.78 | 22.31 | 18.79 | 22.5 | 19.06 |
| GDPCAP2 | 639.16 | 775.57 | 925.07 | 1270.4 | 946.89 | 1283.16 | 845.54 | 1229.45 | 864.56 | 1274.52 |
| REGFIN 1 | 0.14 | 0.35 | 0.17 | 0.38 | 0.19 | 0.4 | 0.24 | 0.43 | 0.29 | 0.45 |
| MOBILE | 99.22 | 34.36 | 108.97 | 37.33 | 112.7 | 35.6 | 112.8 | 31.13 | 116.07 | 34.13 |
| BRANCH | 16.47 | 15.99 | 17.57 | 15.5 | 17.49 | 14.97 | 17.97 | 14.59 | 15.94 | 12.44 |
| LERNER 2 | 0.28 | 0.09 | 0.3 | 0.14 | 0.29 | 0.13 | 0.31 | 0.15 | 0.31 | 0.15 |
| CONCEN | 63.14 | 18.32 | 63.28 | 18.93 | 62.48 | 17.22 | 60.5 | 15.55 | 60.21 | 17.26 |
| RS 3 | 0.72 | 0.08 | 0.73 | 0.09 | 0.73 | 0.08 | 0.73 | 0.09 | 0.64 | 0.09 |
| GDPGR | 4.12 | 3.67 | 3.75 | 2.42 | 3.12 | 4.65 | 3.05 | 2.18 | 3.84 | 1.94 |
| INF | 4.19 | 4.69 | 3.46 | 4.35 | 2.94 | 4.6 | 3.43 | 5.05 | 3.92 | 4.84 |
Notes: The dependent variable was winsorized at the 1% and 99% levels. 1 REGFIN is obtained from Rau (2020). 2 LERNER was collected from the World Bank data. However, the data over the period 2015–2017 were obtained based on the estimates of Igan et al. (forthcoming). 3 RS is constructed by Navaretti et al. (2017) from the World Bank database.
Table A4.
Correlation matrix between variables used in this study.
| 1 | 2 | 3 | 4 | 5 | 6 | 7 | 8 | 9 | 10 | 11 | |
|---|---|---|---|---|---|---|---|---|---|---|---|
| 1. LNFINCAP | 1 | ||||||||||
| 2. LNALTERCAP | 0.8 *** | 1 | |||||||||
| (22.08) | |||||||||||
| 3. EF | −0.03 | 0.04 | 1 | ||||||||
| (−0.48) | (0.64) | ||||||||||
| 4. GDPCAP | 0.52 *** | 0.48 *** | −0.07 | 1 | |||||||
| (10.34) | (9.21) | (−1.25) | |||||||||
| 5. GDPCAP2 | 0.43 *** | 0.39 *** | −0.02 | 0.93 *** | 1 | ||||||
| (8.09) | (7.12) | (−0.37) | (43.74) | ||||||||
| 6. BRANCH | 0.26 *** | 0.22 *** | −0.18 *** | 0.49 *** | 0.29 *** | 1 | |||||
| (4.6) | (3.87) | (−3.06) | (9.37) | (5.12) | |||||||
| 7. MOBILE | 0.29 *** | 0.25 *** | −0.07 | 0.59 *** | 0.48 *** | 0.32 *** | 1 | ||||
| (5.04) | (4.43) | (−1.25) | (12.17) | (9.09) | (5.65) | ||||||
| 8. LERNER | 0.08 | 0.07 | 0.22 *** | 0.13 ** | 0.27 *** | −0.05 | 0.14 ** | 1 | |||
| (1.3) | (1.26) | (3.81) | (2.14) | (4.68) | (−0.91) | (2.4) | |||||
| 9. CONCEN | 0.19 *** | 0.06 | −0.04 | 0.28 *** | 0.28 *** | −0.01 | 0.12 ** | −0.01 | 1 | ||
| (3.24) | (1.08) | (−0.66) | (4.89) | (4.98) | (−0.19) | (2.03) | (−0.12) | ||||
| 10. GDP | −0.12 ** | −0.1 * | 0.04 | −0.22 *** | −0.11 * | −0.28 *** | −0.24 *** | 0.08 | −0.2 *** | 1 | |
| (−2.05) | (−1.72) | (0.63) | (−3.78) | (−1.89) | (−4.99) | (−4.16) | (1.38) | (−3.49) | |||
| 11. INF | −0.43 *** | −0.32 *** | 0.36 *** | −0.45 *** | −0.35 *** | −0.38 *** | −0.35 *** | 0.02 | −0.12 ** | 0.04 | 1 |
| (−8.07) | (−5.64) | (6.55) | (−8.38) | (−6.34) | (−6.86) | (−6.32) | (0.34) | (−1.99) | (0.67) |
Notes: t-statistics are shown in parentheses, *, ** and *** denote the significance at the 10%, 5%, and 1% levels, respectively.
| 1 | It is important to note that the data on fintech credit provided by Cornelli et al. (2020) and CCAF were available from 2013 to 2018, while the data used to estimate efficiency scores of banking systems were available until 2017. Therefore, our sample period of 2013–2017 was selected to maintain our observations as many as possible. |
| 2 | DEA techniques have been extensively used in finance studies. For more details, please see Boubaker et al. (2015) and Kaffash and Marra (2017). |
| 3 | Since the number of countries is relatively high, compared to the number of observations, we did not use the country fixed-effect dummy variables in our models. In addition, the inclusion of several country-specific regressors prevents us from using a set of country dummies. To be specific, we controlled for differences in the examined countries in terms of their banking competition (LERNER), market concentration (CONCEN), banking regulation (RS), fintech regulation (REGFIN) as well as other institutional characteristics (for robustness checks). We believe that any country-level differences should be accounted for in the robustness testing. |
References
- Aliber, Robert Z., and Charles P. Kindleberger. 2015. Manias Panics and Crashes: A History of Financial Crises. Hampshire: Palgrave Macmillan. [Google Scholar]
- Allen, Franklin, and Douglas Gale. 1999. Diversity of opinion and financing of new technologies. Journal of Financial Intermediation 8: 68–89. [Google Scholar] [CrossRef] [Green Version]
- Baltagi, Badi H. 2008. Econometric Analysis of Panel Data. New York: John Wiley. [Google Scholar]
- Banker, Rajiv D., Abraham Charnes, and William Wager Cooper. 1984. Some models for estimating technical and scale inefficiencies in data envelopment analysis. Management Science 30: 1078–92. [Google Scholar] [CrossRef] [Green Version]
- Beck, Thorsten, Asli Demirgüç-Kunt, and Ross Levine. 2000. A new database on financial development and structure. [Updated September 2019]. World Bank Economic Review 14: 597–605. [Google Scholar] [CrossRef]
- Berger, Allen N., and Timothy H. Hannan. 1998. The efficiency cost of market power in the banking industry: A test of the ‘quiet life’ and related hypotheses. Review of Economics and Statistics 80: 454–65. Available online: https://0-www-jstor-org.brum.beds.ac.uk/stable/2646754 (accessed on 30 April 2021). [CrossRef]
- Berger, Allen N., and David B. Humphrey. 1997. Efficiency of financial institutions: International survey and directions for future research. European Journal of Operational Research 98: 175–212. [Google Scholar] [CrossRef] [Green Version]
- Bömer, Max, and Hannes Maxin. 2018. Why fintechs cooperate with banks—Evidence from germany. Zeitschrift für die Gesamte Versicherungswissenschaft 107: 359–86. [Google Scholar] [CrossRef] [Green Version]
- Boubaker, Sabri, Amal Hamrouni, and Qi-Bin Liang. 2015. Corporate governance, voluntary disclosure, and firm information environment. Journal of Applied Business Research (JABR) 31: 89–102. [Google Scholar] [CrossRef] [Green Version]
- Boubaker, Sabri, Asma Houcine, Zied Ftiti, and Hatem Masri. 2018. Does audit quality affect firms’ investment efficiency? Journal of the Operational Research Society 69: 1688–99. [Google Scholar] [CrossRef]
- Boubaker, Sabri, Duc Trung Do, Helmi Hammami, and Kim Cuong Ly. 2020. The role of bank affiliation in bank efficiency: A fuzzy multi-objective data envelopment analysis approach. Annals of Operations Research S.I (MOPGP19). [Google Scholar] [CrossRef]
- Boubaker, Sabri, Riadh Manita, and Wael Rouatbi. 2021. Large shareholders, control contestability and firm productive efficiency. Annals of Operations Research 296: 591–614. [Google Scholar] [CrossRef]
- Buchak, Greg, Gregor Matvos, Tomasz Piskorski, and Amit Seru. 2018. Fintech, regulatory arbitrage, and the rise of shadow banks. Journal of Financial Economics 130: 453–83. [Google Scholar] [CrossRef]
- Charnes, Abraham, William W. Cooper, and Edwardo Rhodes. 1978. Measuring the efficiency of decision making units. European Journal of Operational Research 2: 429–44. [Google Scholar] [CrossRef]
- Cheng, Maoyong, and Yang Qu. 2020. Does bank FinTech reduce credit risk? Evidence from China. Pacific-Basin Finance Journal 63: 101398. [Google Scholar] [CrossRef]
- Claessens, Stijn, Jon Frost, Grant Turner, and Feng Zhu. 2018. Fintech Credit Markets around the World: Size, Drivers and Policy Issues. BIS Quarterly Review. Available online: https://www.bis.org/publ/qtrpdf/r_qt1809e.htm (accessed on 14 August 2021).
- Coelli, Timothy J., Dodla Sai Prasada Rao, Christopher J. O’Donnell, and George Edward Battese. 2005. An Introduction to Efficiency and Productivity Analysis. New York: Springer. [Google Scholar]
- Cornelli, Giulio, Jon Frost, Leonardo Gambacorta, P. Raghavendra Rau, Robert Wardrop, and Tania Ziegler. 2020. Fintech and Big Tech Credit: A New Database. BIS Working Papers No. 887. Basel: Bank for International Settlements. [Google Scholar]
- De Roure, Calebe, Loriana Pelizzon, and Paolo Tasca. 2016. How Does P2P Lending Fit into the Consumer Credit Market? Discussion Paper No 30/2016. Frankfurt: Deutsche Bundesbank. [Google Scholar]
- De Roure, Calebe, Loriana Pelizzon, and Anjan V. Thakor. 2018. P2P Lenders versus Banks: Cream Skimming or Bottom Fishing? SAFE Working Paper No. 206. Frankfurt: Sustainable Architecture for Finance in Europe. [Google Scholar]
- Deloitte. 2015. Millennials and wealth management: Trends and challenges of the new clientele. In Inside: Quaterly Insights, CFO Edition. Luxembourg: Deloitte. [Google Scholar]
- Demirgüç-Kunt, Ash, and Harry Huizinga. 1999. Determinants of commercial bank interest margins and profitability: Some international evidence. The World Bank Economic Review 13: 379–408. Available online: https://0-www-jstor-org.brum.beds.ac.uk/stable/3990103 (accessed on 30 April 2021).
- Drake, Leigh, J. B. Maximillan Hall, and Richard Simper. 2006. The impact of macroeconomic and regulatory factors on bank efficiency: A non-parametric analysis of Hong Kong’s banking system. Journal of Banking & Finance 30: 1443–66. [Google Scholar] [CrossRef] [Green Version]
- Gefen, David, Detmar Straub, and Marie-Claude Boudreau. 2000. Structural equation modeling and regression: Guidelines for research practice. Communications of the Association for Information Systems 4: 1–78. [Google Scholar] [CrossRef] [Green Version]
- Ho, Tin H., Dat T. Nguyen, Thanh Ngo, and Tu D. Q. Le. 2021. Efficiency in Vietnamese banking: A meta-regression analysis approach. International Journal of Financial Studies 9: 41. [Google Scholar] [CrossRef]
- Igan, Deniz, Maria Soledad Martinez Peria, Nicola Pierri, and Andrea F. Presbitero. forthcoming. When They Go Low, We Go High? Bank Market Power and Interest Rates. Washington: IMF Working Papers.
- Jagtiani, Julapa, and Catharine Lemieux. 2019. The roles of alternative data and machine learning in fintech lending: Evidence from the LendingClub consumer platform. Financial Management 48: 1009–29. [Google Scholar] [CrossRef]
- Kaffash, Sepideh, and Marianna Marra. 2017. Data envelopment analysis in financial services: A citations network analysis of banks, insurance companies and money market funds. Annals of Operations Research 253: 307–44. [Google Scholar] [CrossRef] [Green Version]
- Le, Tu D. Q. 2018. Bank risk, capitalisation and technical efficiency in the Vietnamese banking system. Australasian Accounting Business & Finance Journal 12: 42–61. [Google Scholar] [CrossRef]
- Le, Tu D. Q. 2020. The interrelationship among bank profitability, bank stability, and loan growth: Evidence from Vietnam. Cogent Business & Management 7: 1–18. [Google Scholar] [CrossRef]
- Le, Tu D. Q. 2021. The Roles of Financial Inclusion and Financial Markets Development in Fintech Credit: Evidence from Developing Countries. Ho Chi Minh City: Institute for Development & Research in Banking Technology, University of Economics and Law. [Google Scholar]
- Le, Tu D. Q., and Thanh Ngo. 2020. The determinants of bank profitability: A cross-country analysis. Central Bank Review 20: 65–73. [Google Scholar] [CrossRef]
- Le, Tu D. Q., and Xuan T. T. Pham. 2021. The inter-relationships among liquidity creation, bank capital and credit risk: Evidence from emerging Asia–Pacific economies. Managerial Finance 47: 1149–67. [Google Scholar] [CrossRef]
- Liu, John S., Louis Y. Y. Lu, Wen-Min Lu, and Bruce J. Y. Lin. 2013. A survey of DEA applications. Omega 41: 893–902. [Google Scholar] [CrossRef]
- Manlagnit, Maria Chelo V. 2015. Basel regulations and banks’ efficiency: The case of the Philippines. Journal of Asian Economics 39: 72–85. [Google Scholar] [CrossRef]
- Marquez, Robert. 2002. Competition, adverse selection, and information dispersion in the banking industry. The Review of Financial Studies 15: 901–26. [Google Scholar] [CrossRef]
- Navaretti, Giorgio Barba, Giacomo Calzolari, José Manuel Mansilla-Fernandez, and Alberto F. Pozzolo. 2017. Fintech and Banking. Friends or Foes. In Fintech and Banking. Edited by Giorgio Barba Navaretti, Giacomo Calzolari and Alberto Franco Pozzolo. Rome: Europeye srl. [Google Scholar]
- Newey, Whitney K., and Kenneth D. West. 1987. A simple, positive semi-definite, heteroskedasticity and autocorrelation consistent covariance matrix. Econometrica 55: 703–8. [Google Scholar] [CrossRef]
- Ngo, Thanh, and Tu Le. 2019. Capital market development and bank efficiency: A cross-country analysis. International Journal of Managerial Finance 15: 478–91. [Google Scholar] [CrossRef]
- Nguyen, James. 2012. The relationship between net interest margin and noninterest income using a system estimation approach. Journal of Banking & Finance 36: 2429–37. [Google Scholar] [CrossRef]
- Oh, Eun Young, and Peter Rosenkranz. 2020. Determinants of Peer-to-Peer Lending Expansion: The Roles of Financial Development and Financial Literacy. Working Paper Series 613. Philippines: Asian Development Bank. [Google Scholar]
- Paradi, Joseph C., H. David Sherman, and Fai Keung Tam. 2017. Data Envelopment Analysis in the Financial Services Industry: A Guide for Practitioners and Analysts Working in Operations Research Using DEA. Cham: Springer, vol. 266. [Google Scholar]
- Phan, Hanh Thi My, Kevin Daly, and Selim Akhter. 2016. Bank efficiency in emerging Asian countries. Research in International Business and Finance 38: 517–30. [Google Scholar] [CrossRef]
- Rau, P. Raghavendra. 2020. Law, Trust, and the Development of Crowdfunding. Cambridge: Cambridge Centre for Alternative Finance Working Paper. [Google Scholar]
- Reinhard, Stijn, C. A. Knox Lovell, and Geert J. Thijssen. 2000. Environmental efficiency with multiple environmentally detrimental variables; estimated with SFA and DEA. European Journal of Operational Research 121: 287–303. [Google Scholar] [CrossRef]
- Sheng, Tianxiang. 2021. The effect of fintech on banks’ credit provision to SMEs: Evidence from China. Finance Research Letters 39: 101558. [Google Scholar] [CrossRef]
- Siek, Michael, and Andrew Sutanto. 2019. Impact analysis of fintech on banking industry. Paper presented at the 2019 International Conference on Information Management and Technology (ICIMTech), Jakarta, Indonesia, August 19–20; pp. 356–61. [Google Scholar] [CrossRef]
- Song, Fengshua, and Anjan Thakor. 2010. Banks and capital markets as a coevolving financial system. VoxEU.org, December 1. [Google Scholar]
- Tang, Huan. 2019. Peer-to-peer lenders versus banks: Substitutes or complements? The Review of Financial Studies 32: 1900–38. [Google Scholar] [CrossRef]
- Vidal-García, Javier, Marta Vidal, Sabri Boubaker, and Majdi Hassan. 2018. The efficiency of mutual funds. Annals of Operations Research 267: 555–84. [Google Scholar] [CrossRef]
- Vives, Xavier. 2017. The impact of Fintech on banking. In Fintech and Banking. Friends or Foes? Edited by Giorgio Barba Navaretti, Giacomo Calzolari and Alberto Franco Pozzolo. Roma: Europeye srl. [Google Scholar]
- Wooldridge, Jeffrey M. 2001. Econometric Analysis of Cross Section and Panel Data. Cambridge: The MIT Press. [Google Scholar]
- World Bank. 2017. World Development Indicators (WDI). Washington: The World Bank. [Google Scholar]
- Yeo, Eunjung, and Jooyong Jun. 2020. Peer-to-Peer Lending and Bank Risks: A Closer Look. Sustainability 12: 6107. [Google Scholar] [CrossRef]
Figure 1.
The evolution of banking efficiency (left axis) and the volume of fintech credit (right axis).
Figure 1.
The evolution of banking efficiency (left axis) and the volume of fintech credit (right axis).

Table 1.
Descriptive statistics of the inputs and outputs used in DEA analysis.
| Year | 2013 | 2014 | 2015 | 2016 | 2017 |
|---|---|---|---|---|---|
| No. Obs | 50 | 59 | 66 | 75 | 80 |
| DEPOSIT | |||||
| Mean | 52.96 | 63.61 | 63.23 | 60.35 | 62.24 |
| STD | 44.02 | 57.41 | 54.95 | 42.27 | 51.05 |
| LABOR | |||||
| Mean | 3.75 | 3.18 | 3.56 | 3.4 | 3.56 |
| STD | 2.69 | 2.24 | 4.13 | 3.53 | 2.7 |
| CREDIT | |||||
| Mean | 67.47 | 60.12 | 61.25 | 59.58 | 61.34 |
| STD | 113.68 | 47.09 | 46.83 | 40.88 | 42.001 |
| NIM | |||||
| Mean | 4.86 | 4.12 | 3.86 | 4.09 | 4.92 |
| STD | 3.27 | 2.88 | 2.83 | 2.99 | 3.91 |
Sources: Authors’ calculation based on Beck et al. (2000).
Table 2.
Results of second-stage SEM analysis.
| Part 1. Equation (2) of SEM | |||
| Dependent Variable: LNFINCAP | |||
| Independent Variables | Coefficient | Standard Error | t-Statistic |
| Constant | −0.553 | 1.095 | −0.505 |
| EF | −2.944 ** | 1.285 | −2.291 |
| GDPCAP | 0.152 *** | 0.027 | 5.702 |
| GDPCAP2 | −0.001 *** | 0.0003 | −3.509 |
| REGFIN | 0.791 ** | 0.378 | 2.093 |
| MOBILE | −0.005 | 0.005 | −1.089 |
| BRANCH | −0.021 * | 0.012 | −1.815 |
| GDPGR | −0.01 | 0.046 | −0.212 |
| No. Obs | 330 | ||
| J-Statistics (p-value) | 0.158 | ||
| Part 2. Equation (3) of SEM | |||
| Dependent Variable: EF | |||
| Independent Variables | Coefficient | Standard Error | t-Statistic |
| Constant | 0.585 *** | 0.115 | 5.101 |
| LNFINCAP | 0.022 ** | 0.01 | 2.222 |
| LERNER | 0.295 *** | 0.071 | 4.168 |
| CONCEN | −0.0002 | 0.001 | −0.335 |
| RS | 0.05 | 0.149 | 0.332 |
| GDPGR | −0.001 | 0.004 | −0.177 |
| INF | 0.021 *** | 0.003 | 7.932 |
| No. Obs | 330 | ||
| J-Statistics (p-value) | 0.158 | ||
Notes: LNFINCAP, the natural logarithm of the volume of fintech credit per capita; EF, efficiency score of the individual banking system as derived from VRS DEA estimation; GDPCAP, the GDP per capita; GDPCAP2, the squared term of GDPCAP; REGFIN, a dummy variable that takes a value of 1 for a country where an explicit fintech credit regulation is in place, and 0 otherwise; MOBILE, the mobile phone subscriptions per 100 persons given the mobile-based nature of most fintech credit platforms; BRANCH, the number of bank branches per 100,000 adult population; LERNER, the Lerner index of the banking sector mark-ups in an economy; CONCEN, the ratio of three largest banks’ assets to all commercial banks’ assets; RS, a regulatory stringency index for the banking sector of an economy; GDPGR, the economic growth rate; and INF, the inflation rate. The table contains results estimated using a simultaneous equations model (SEM) with the GMM estimator and the Newey–West method. EF and LNFINCAP represent the two endogenous variables in SEM. *, ** and *** denote the two-tail significance at the 10%, 5%, and 1% levels, respectively.
Table 3.
Results of second-stage SEM analysis using an alternative measure of fintech credit.
| Part 1. Equation (2) of SEM | |||
| Dependent Variable: LNALTERCAP | |||
| Independent Variables | Coefficient | Standard Error | t-Statistic |
| Constant | −0.149 | 0.662 | −0.225 |
| EF | 0.368 | 0.818 | 0.45 |
| GDPCAP | 0.082 *** | 0.013 | 6.178 |
| GDPCAP2 | −0.001 *** | 0.0002 | −3.840 |
| REGFIN | 0.352 * | 0.209 | 1.687 |
| MOBILE | −0.003 | 0.002 | −1.955 |
| BRANCH | −0.019 *** | 0.006 | −3.387 |
| GDPGR | 0.009 | 0.023 | 0.377 |
| No. Obs | 330 | ||
| J-Statistics (p-value) | 0.135 | ||
| Part 2. Equation (3) of SEM | |||
| Dependent Variable: EF | |||
| Independent Variables | Coefficient | Standard Error | t-Statistic |
| Constant | 0.551 *** | 0.131 | 4.197 |
| LNALTERCAP | 0.04 ** | 0.017 | 2.356 |
| LERNER | 0.280 *** | 0.067 | 4.166 |
| CONCEN | 0.0001 | 0.001 | 0.246 |
| RS | −0.002 | 0.142 | −0.017 |
| GDPGR | 0.001 | 0.004 | 0.288 |
| INF | 0.018 *** | 0.002 | 8.351 |
| No. Obs | 330 | ||
| J-Statistics (p-value) | 0.135 | ||
Notes: LNALTERCAP, the natural logarithm of the volume of total alternative credit per capita; EF, efficiency score of the individual banking system as derived from VRS DEA estimation; GDPCAP, the GDP per capita; GDPCAP2, the squared term of GDPCAP; REGFIN, a dummy variable that takes a value of 1 for a country where an explicit fintech credit regulation is in place, and O otherwise; MOBILE, the mobile phone subscriptions per 100 persons given the mobile-based nature of most fintech credit platforms; BRANCH, the number of bank branches per 100,000 adult population; LERNER, the Lerner index of the banking sector mark-ups in an economy; CONCEN, the ratio of three largest banks’ assets to all commercial banks’ assets; RS, a regulatory stringency index for the banking sector of an economy; GDPGR, the economic growth rate; and INF, the inflation rate. The table contains results estimated using a simultaneous equations model (SEM) with the GMM estimator and the Newey–West method. EF and LNALTERCAP represent the two endogenous variables in SEM. *, ** and *** denote the two-tail significance at the 10%, 5%, and 1% levels, respectively.
Publisher’s Note: MDPI stays neutral with regard to jurisdictional claims in published maps and institutional affiliations. |
© 2021 by the authors. Licensee MDPI, Basel, Switzerland. This article is an open access article distributed under the terms and conditions of the Creative Commons Attribution (CC BY) license (https://creativecommons.org/licenses/by/4.0/).
Share and Cite
MDPI and ACS Style
Le, T.D.Q.; Ho, T.H.; Nguyen, D.T.; Ngo, T. Fintech Credit and Bank Efficiency: International Evidence. Int. J. Financial Stud. 2021, 9, 44. https://0-doi-org.brum.beds.ac.uk/10.3390/ijfs9030044
AMA Style
Le TDQ, Ho TH, Nguyen DT, Ngo T. Fintech Credit and Bank Efficiency: International Evidence. International Journal of Financial Studies. 2021; 9(3):44. https://0-doi-org.brum.beds.ac.uk/10.3390/ijfs9030044
Chicago/Turabian StyleLe, Tu D. Q., Tin H. Ho, Dat T. Nguyen, and Thanh Ngo. 2021. "Fintech Credit and Bank Efficiency: International Evidence" International Journal of Financial Studies 9, no. 3: 44. https://0-doi-org.brum.beds.ac.uk/10.3390/ijfs9030044
Note that from the first issue of 2016, this journal uses article numbers instead of page numbers. See further details here.