
The Effects of Business Model on Bank’s Stability


1
Faculty of Banking and Finance, Foreign Trade University, Hanoi 10000, Vietnam
2
Faculty of Business and Economics, Phenikaa University, Hanoi 10000, Vietnam
3
QA Global Co., Hanoi 10000, Vietnam
4
School of Economics and International Business, Foreign Trade University, Hanoi 10000, Vietnam
5
School of Business, Law and Entrepreneurship, Swinburne University of Technology, Melbourne 3122, Australia
*
Author to whom correspondence should be addressed.
Int. J. Financial Stud. 2021, 9(3), 46; https://0-doi-org.brum.beds.ac.uk/10.3390/ijfs9030046
Submission received: 23 June 2021
/
Revised: 29 July 2021
/
Accepted: 18 August 2021
/
Published: 26 August 2021
(This article belongs to the Special Issue Banks and Profitability of Banks)
Abstract
:The literature shows little evidence of the effects of business models upon the volatility of banks in developing and fast-growing economies. Hence, this study examines the effects of business model choice on the stability of banks in ASEAN countries. Using GMM and other robust econometric methods on the sample of 99 joint stock commercial banks, we find significant and negative impacts of a diversification model in which banks shift toward non-interest and fees-based activities. We also find that the impacts are different between two groups of countries. For Vietnam, Indonesia and the Philippines, the diversification entails negative impacts on stability while demonstrating positive impacts for Thailand and Malaysia. Based on these findings, we draw policy implications for more sustainable development in the ASEAN banking business.
1. Introduction
Over the last few decades, the banking system has embarked upon drastic change on a global scale. Financial institutions like banks have adopted a diversification approach to move away from a traditional deposit-taking and lending model toward more technologically-driven fees-based and commission-based services, such as e-banking, consumer credits, securities trading, insurance and investment brokerage. This trend appears inevitable since increasing domestic and foreign rivalry in the banking business puts pressure on traditional interest margins. In addition, the quick pace of technological progress also facilitates new services, helps cut transaction costs and saves time for clients. However, the genuine benefits of the new and non-traditional fees-based and commission-based model are still under scrutiny. While recent literature, such as Chiorazzo et al. (2008), Hamdi et al. (2017), Meslier et al. (2014) and Trivedi (2015), supports the positive impacts of non-interest income on banks’ profitability, some question whether the new sources of income may entail a higher level of risk and instability (DeYoung and Roland 2001; Stiroh 2004; Williams and Prather 2010).
Upon the expansion of fees-based services in banking industry, a new line of research has been pursued and light has been shed on the causality between fees-based products and the performance of the bank. Abuzayed et al. (2018) argued that diversification of income sources into non-correlated activities could decentralize risk and decrease the propensity of financial distress. Moreover, diversification might enhance the intermediation role of banks and motivate managerial efficiency (Drucker and Puri 2009; Hamdi et al. 2017).
In contrast, previous literature has challenged the link between diversification and banks, stability, providing evidence that bank size, ownership structure and model are the significant determinants of stability rather than diversification (Chiorazzo et al. 2008; Kohler 2015; Lee et al. 2014). Furthermore, Lee et al. (2014) found no evidence supporting the expected benefits of diversification, perhaps because diversified banks tend to take more risks and operate with greater financial leverage than non-diversified counterparts (Cebenoyan and Strahan 2004).
The new evidence in this recent line of research motivates this research to examine whether the diversification model has positive or negative impacts on the stability of banks. This research extends the literature in the context of ASEAN countries where little evidence is documented, and even if it is, the impacts vary from one country to another (Lee et al. 2014; Nguyen and Pham 2020). Additionally, since King and Levine (1993) find that financial diversification and bank stability are robustly associated with economic growth, we aim to shed more light on the impacts of economic growth on such a relationship in ASEAN markets.
The impacts of diversification on listed banks’ stability are examined with a modelling approach described in Kohler (2015), in which Z score and risk-adjusted profitability measures are the alternative proxies for the stability. The robustness of our findings is controlled with a variety of diversification indicators, non-linear effects, and heterogeneity and endogeneity considerations.
This study aims to determine the extent of the influence of business models on banks’ stability. Our contributions are the empirical evidence along with policy implications regarding business models of banks in ASEAN countries where little is known about the effects of income diversification.
We find that diversification of business models significantly reduces the level of stability at banks in the ASEAN region, except for Malaysia and Thailand where diversification effects are statistically positive. Such findings demonstrate significant different effects of diversification between ASEAN and developed countries.
The paper is organized as follows: Section 2 reviews the literature on the relationship between bank diversification and stability before the development of hypotheses. Section 3 outlines the data, variables and methodology, while Section 4 presents the empirical results. Section 5 concludes along with several practical implications.
2. Literature Review
Bank stability has been revisited, especially after the failure of banking system during the financial crisis in 2008–2009. Among a variety of factors, diversification emerged and was debated upon in the previous literature. In most research, bank diversification involves two main aspects: income diversification and funding sources diversification. In our paper, we focus on the impacts of income diversification, which are the increase in share of fee, net trading profit and other non-interest income (Mahdaleta et al. 2016).
Until recently, the literature has suggested a mixed picture of such impacts. A variety of studies reveal positive effects of income diversification on bank stability. For instance, Froot et al. (1993) and Froot and Stein (1998) emphasize the importance of how income and asset diversification can reduce the probability of bank distress since revenues from different activities are not perfectly correlated. In a study of European banks, the researchers report that the emergence of non-interest income activities contributes to the stability of retail-oriented banks by strengthening the intermediation function and reducing information asymmetries (Baele et al. 2007; Kohler 2015). Acharya et al. (2006) and Lepetit et al. (2008) add that non-interest income could boost competition and financial innovation. The positive evidence of diversification in EU and US banks is also documented in the studies relating to Asia and other emerging countries (e.g., Sanya and Wolfe 2011; Nguyen et al. 2012; Amidu and Wolfe 2013; Nguyen and Pham 2020).
Other findings supported the positive impacts by providing further evidence on positive influence of non-credit income on profitability and risk reduction. Boyd and Prescott (1986) and Drucker and Puri (2009) show that expanding operations across different products and services as well as geographically reduces risk concentration, thereby decreasing the likelihood of financial distress. Such desirable effects are achieved through lower monitoring costs, greater efficiencies, and scale economy of managerial skills. Moreover, evidence from the US, Pakistan, India and the Philippines advocates the positive impacts of income diversification on profitability (Ismail et al. 2015; Trivedi 2015; Li et al. 2021). Meslier et al. (2014), Saunders et al. (2014) and Sissy et al. (2017) highlight that bank performance is boosted via cross-border diversification.
In contrast, some opposing evidence indicates negative or ambiguous causality from diversification to bank stability. With the development of non-interest activities, banks in the US and EU encounter greater levels of risk, depending on bank size, ownership and the type of non- interest income diversification (DeYoung and Roland 2001; DeYoung and Torna 2013; Lepetit et al. 2008; Stiroh and Rumble 2006; Yang et al. 2020). Williams (2016) found similar results for Australian banks. These studies also specify several reasons for the negative impacts, such as the reduction in bank’ incentives (Acharya et al. 2006) or the growing involvement into derivatives markets or larger loan portfolios undermine the buffer of capital tiers (Demsetz and Strahan 1997; DeYoung and Roland 2001). Meanwhile, a paper on banks in emerging countries finds that, despite lowering banks’ risk, income diversification is unable to enhance bank stability (Abuzayed et al. 2018).
Moreover, the literature shows mixed results on the effects of diversification upon risk and return. While Craigwell and Maxwell (2006) and Stiroh and Rumble (2006) find that fees-based activities actually darkened the risk profile, they still impose positive effects on profitability. Sianipar (2015) claims that although income diversification can lower idiosyncratic and total risk, it does not raise the market value of the bank significantly.
Others find that income diversification neither increases the return nor reduces the banks’ risk (Acharya et al. 2006; Hayden et al. 2007). Under some circumstances, the relationship varies across different types of risks (e.g., Abedifar et al. 2018; Akhigbe and Stevenson 2010; Carlson 2004; De Vries 2005; Elyasiani and Wang 2012; Banwo et al. 2019). Hence, no apparent consensus has been reached on the diversification effects. The lack of consensus also extends geographically since studies in different areas, such as the US, EU (DeYoung and Roland 2001; DeYoung and Torna 2013; Lepetit et al. 2008; Stiroh and Rumble 2006), emerging countries (Sanya and Wolfe 2011; Wu et al. 2020), Africa (Sissy et al. 2017; Adesina 2021) and Asia (Meslier et al. 2014; Nguyen et al. 2012; Nguyen and Pham 2020), yield inconsistent results. Such inconsistency suggests that the effects of income diversification on banks’ stability is country-specific.
As a result, the link between income diversification and banks’ stability in ASEAN might be distinctive. Little evidence is found in existing papers involving ASEAN banking systems, and almost none is found on the direct causality of income diversification on banks’ stability. A rare paper (Meslier et al. 2014) provides evidence of positive relationship between income diversification and risk-adjusted performance of banks in Philippines; however, the relationship is insignificant for small banks. Nguyen and Pham (2020) examined listed and unlisted banks in Vietnam and demonstrated evidence of diversification impacts on risk mitigation; and such impacts are stronger for unlisted banks and for banks undergoing restructuring. Given the heterogeneity and divergence in size, dynamics, efficiency and technology adopted among ASEAN banking system, income diversification is likely to have dissimilar effects on banks’ stability in each country. Our paper, therefore, seeks to shed more light on that matter.
3. Data and Methodology
3.1. Data
The sample of listed banks in ASEAN is arranged in panel form. The dependent and independent variables data are extracted from Refinitiv Eikon and cross-checked with the official periodical reports of listed banks in ASEAN stock exchanges in 2011–2019 period. Bank data has tremendous advantages over corporate data with respect to accuracy, especially for listed banks, since such data are input by better-trained staff and checked by internal audit, creditworthy auditors and the central bank.
Using equity screening application on Refinitiv Eikon, we collected the initial sample consisting of 236 banks and 2585 observations from 2010 to 2019 of five ASEAN countries (Vietnam, Thailand, Indonesia, Malaysia and Philippines). In all countries, except for Vietnam, under the name of one bank there were numerous types of equity, including ordinary shares, American Depositary Receipts (ADRs), non-voting depositary receipts, and rights and preference shares. However, we just keep the ordinary shares to avoid duplication, resulting in a drop of 124 datapoints and 693 observations. We further filtered out missing dependent variables for two consecutive years to keep the series in each datapoint sufficiently long to be consistent with a more robust econometric technique (i.e., the DGMM). The final sample comprised 99 banks and 987 observations. All of the observations were free from outlier problem since they were winsorized at the 5% and 95% levels.
In the sample, we employed several alternative proxies for bank’s stability, including Z-score, risk-adjusted return on assets (RAROA) and risk-adjusted capital adequacy ratio. Z-score was calculated by the sum of ROA and CAR, divided by SDROA, where ROA was return on assets, CAR was the fraction of total equity divided by total assets and SDROA was the standard deviation of ROA. To enhance the robustness, RAROA and RACAR were also considered as varieties of risk-adjusted measures for banks’ stability. According to Kohler (2015), the higher Z-score or RAROA or RACAR entails lower risk and higher stability.
Regarding independent groups of variables, net interest income (NII) is the one that best captures the traditional interest-based business model. The spread between lending and deposit rates has been a major income source of banks and hence is supposed to exert positive effects on banks’ stability (Kohler 2015). Alternatively, net non-interest income (NNII) and trading are proxies for non-traditional and fees-based sources of income. NNII and trading activities help banks diversify their revenue streams to spread the risks inherently concentrated on conventional interest-based products and services. NNII and trading could enhance banks’ sustainability for commercially-oriented banks, while they may undermine stability since excessive engagement in fee-generating activities such as currency trading or off-balance sheet securitization tends to damage one’s risk profile (Kohler 2015; Altunbas et al. 2011; DeYoung and Roland 2001).
In principle, most of the variables in the final sample are kept in the fraction form, except for total assets, which is converted to log form to reduce the skewness and enhance variance stability (Lütkepohl and Xu 2010). Detailed formulae and description for each variable are presented in Table 1.
3.2. Methodology
The potential causality between income diversification and banks’ stability is examined with a standard linear function. To ensure the robustness of findings, the usual suspects of endogeneity, spatial dependence and country heterogeneity are controlled by Driscoll–Kraay’s robust error and Difference Generalized Method of Moments (DGMM).
With a cross-country panel data, one of the potential selection biases lies in the time-invariant country confounder in that the hypothetical change in the independent or control variables within the same country could inflate the impacts on the dependent variables in an OLS regression model (Mummolo and Peterson 2018). This paper limits selection bias caused by country heterogeneity with country fixed-effects model. We further control for spatial dependence, heteroscedasticity and serial correlation problems with Driscoll–Kraay’s robust standard errors. Finally, one of the key econometric issues in panel data analysis is potential endogeneity bias since it can yield misleading conclusions or even incorrect signs of the coefficients (Ullah et al. 2018). Indeed, Wooldridge (2010) proved that the omitted and observed/unobserved variables unincorporated in the model are the causes of such endogeneity. Accordingly, we control for the omitted variables as well as potential pairwise correlation between independent variables and the error term with the endogenous treatment in the Difference Generalized Method of Moments (DGMM) model. Specifically, the initial equation in DGMM model is as follows:
Equation (2) is transformed into first-difference form to suppress potential fixed effects assumed in panel data.
4. Results
4.1. Descriptive Statistics
The descriptive results show that for all countries, the average Z-score is 39.08. The maximum value of Z-score is 267.249, and the minimum is 0.052. They also indicate that the average value of RAROA is 2.947 and that of RACAR is 36.113. For business model metrics, NII averages around 2.321 and NNII 1.017. The remaining variables are summarized in Table 2. It is noteworthy that Vietnamese banks’ Z-scores, RACAR, and RAROA appear to be relatively smaller than the counterparts of other ASEAN countries (Table 3).
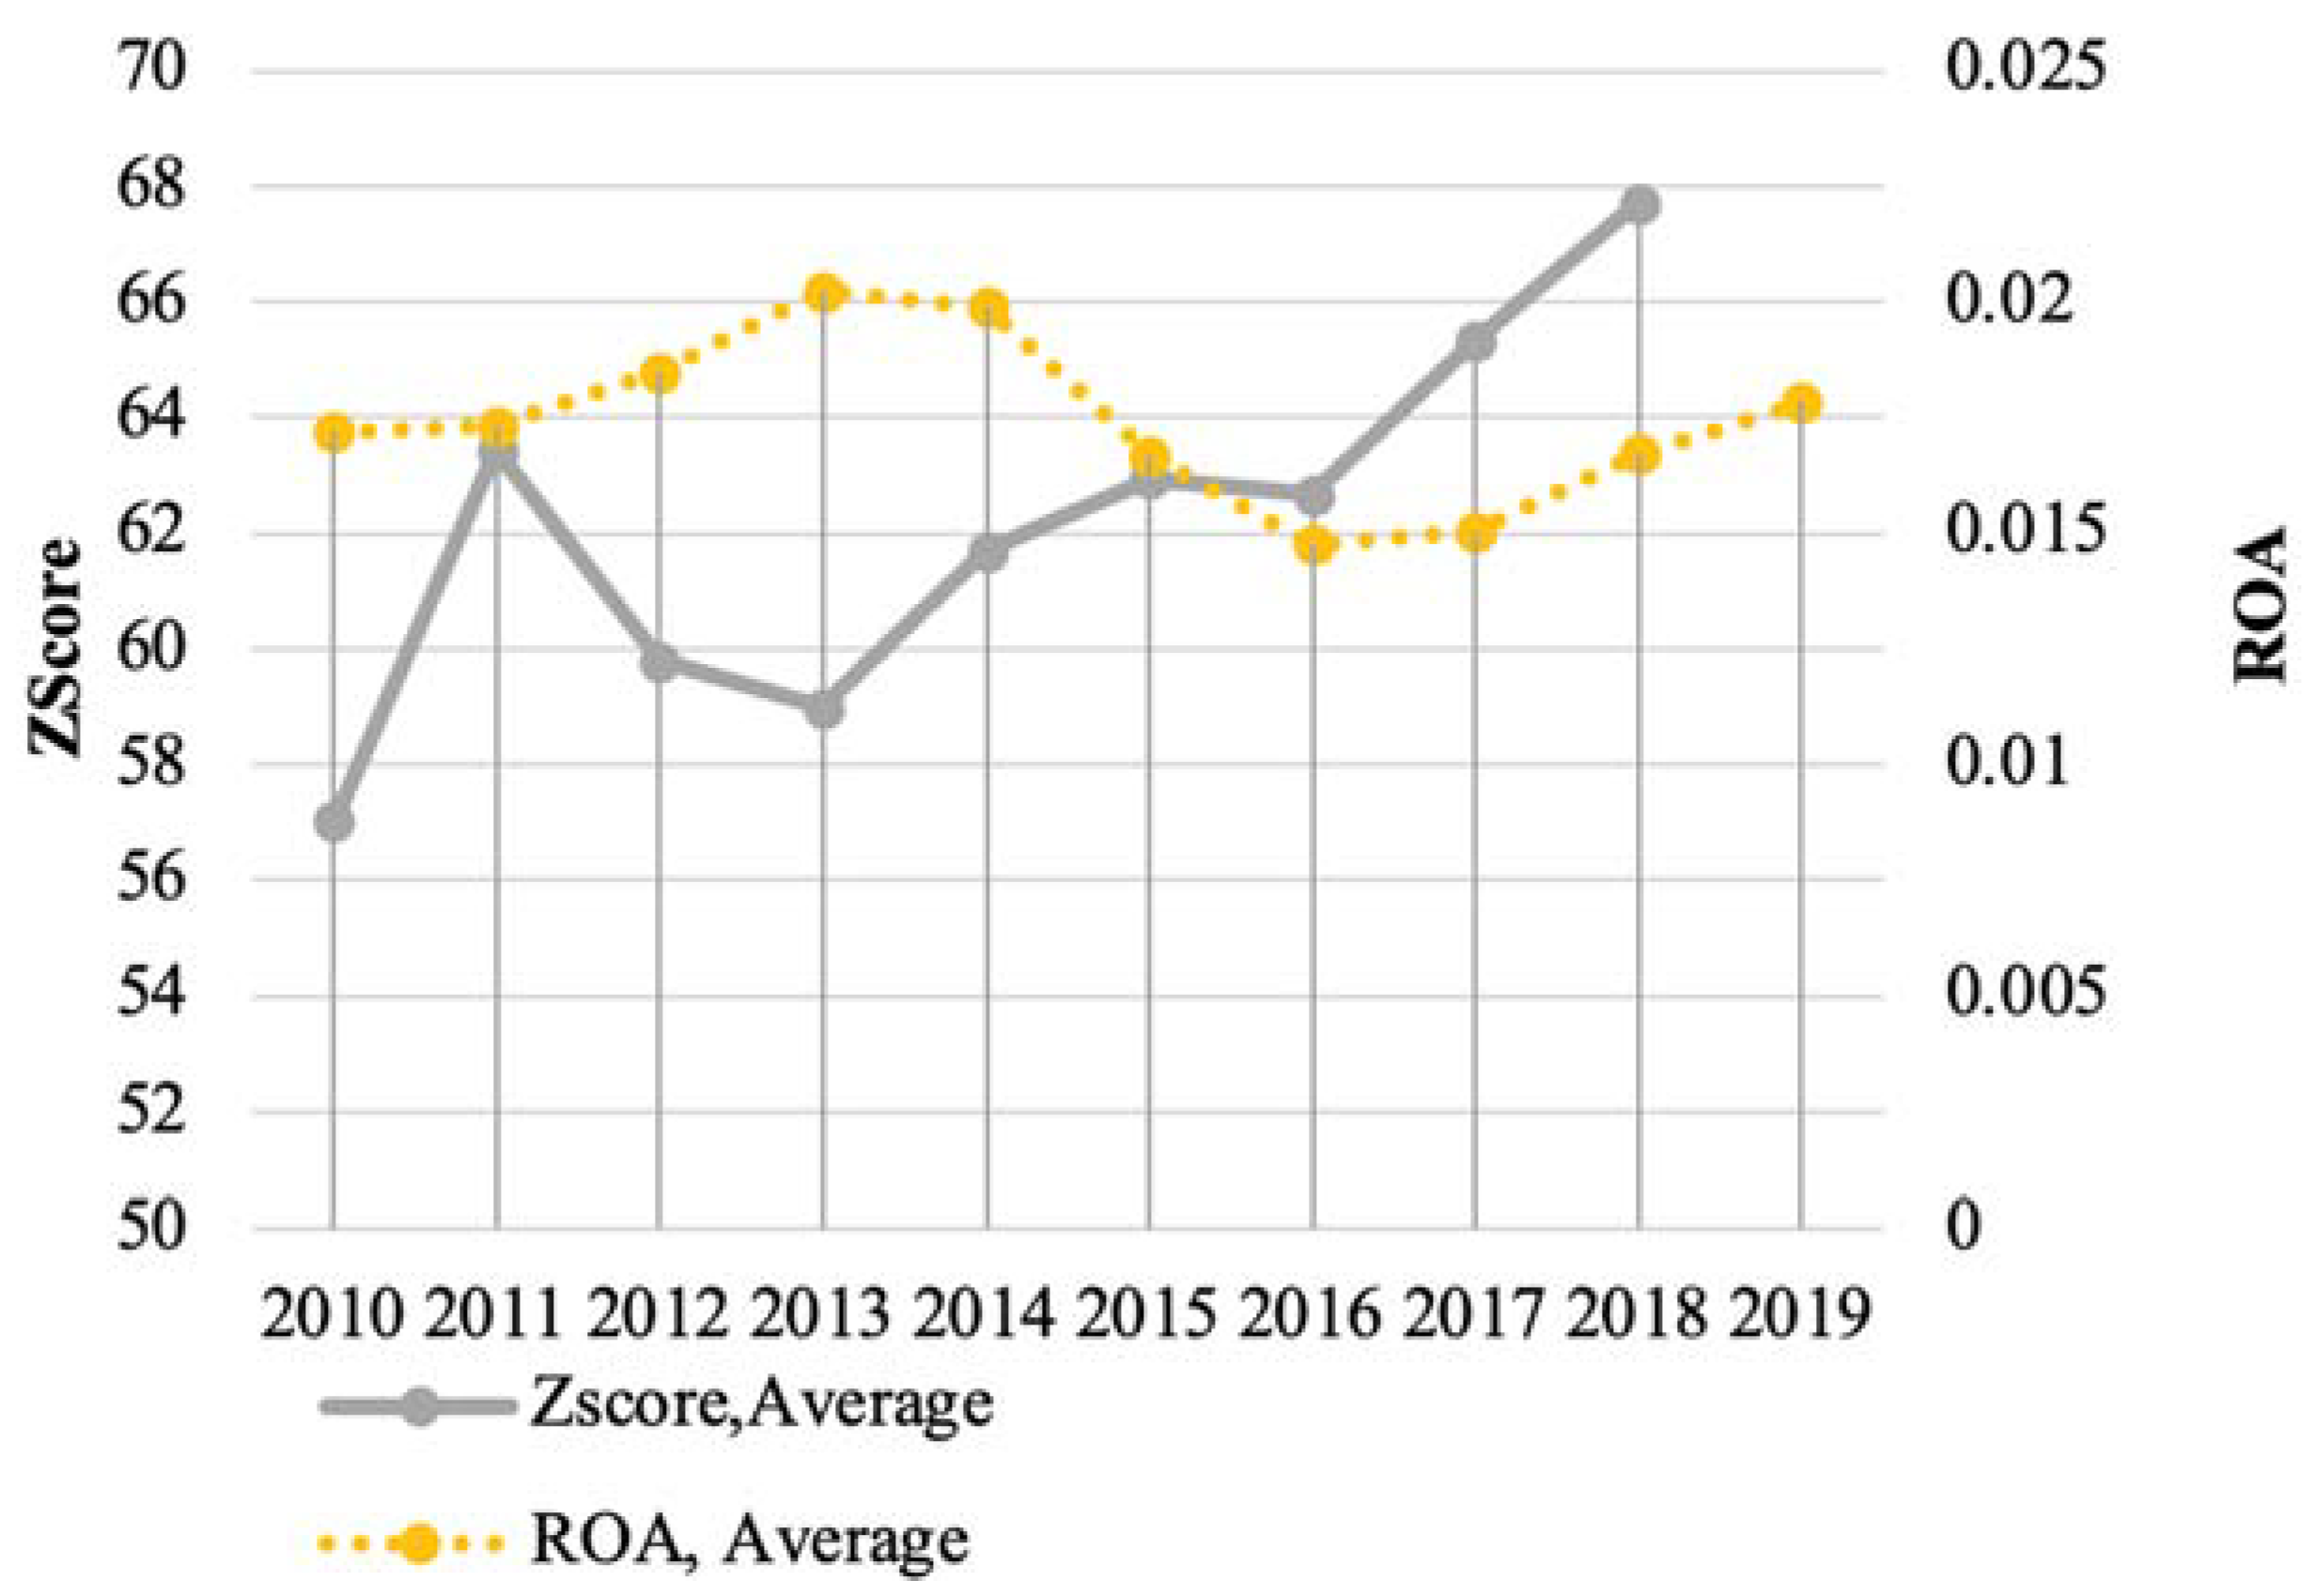
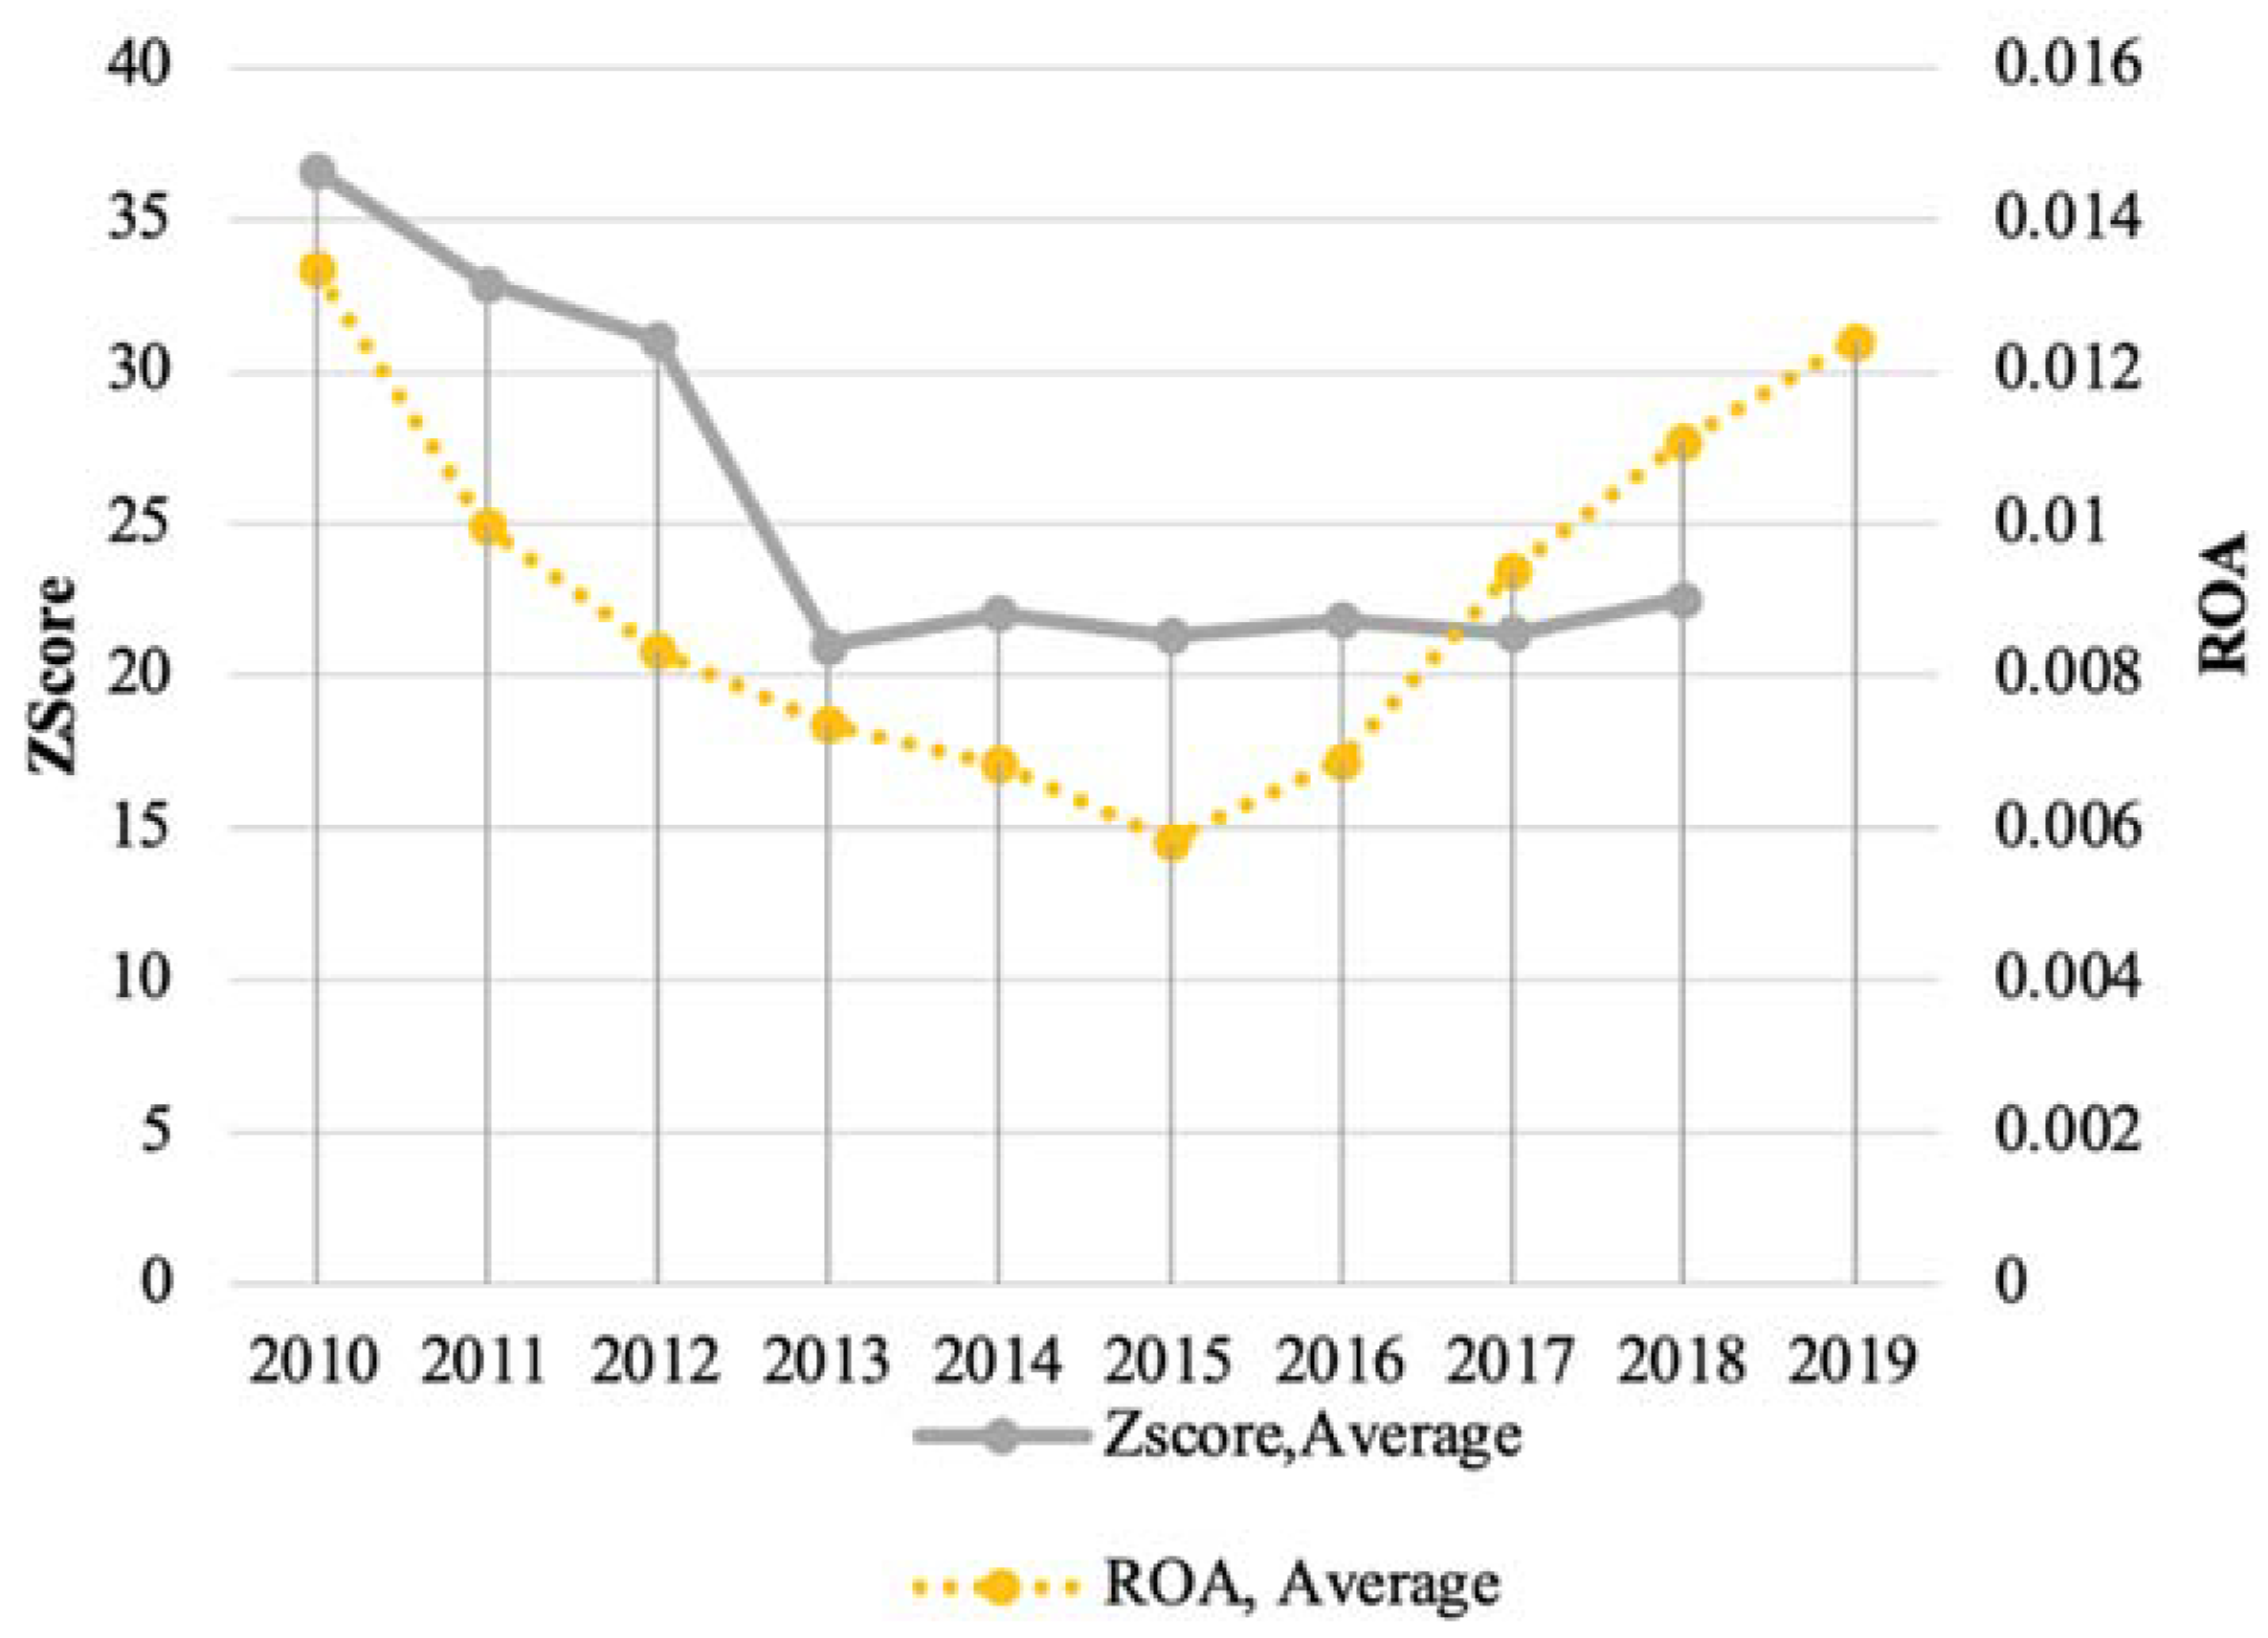
Figure 1 and Figure 2 compare the general trends of ROA and Z-score from 2010 to 2019. In Figure 1, these two indicators seem to have a negative correlation. The bigger the Z-score (the greater the risk), the lower the level of ROA, notably in the period from 2010 to 2015. Until 2019, these two indicators tend to converge. In contrast, for Vietnamese banks the correlation between ROA and Z-score tend to be opposite as they both decrease in the period 2010–2016 and increase gradually since 2016. This partly shows the difference in the relationship between ROA and Z-score in Vietnam and other countries in the region.
Table 4 illustrates the distribution of listed banks by country, including 43 banks in Indonesia, accounting for 43.43%, 18 banks in Vietnam (18.18%), 14 banks in Philippines (14.15%), 13 banks in Malaysia (13.13%) and 11 in from Thailand (11.11%).
4.2. The Driscoll–Kraay’s Regression Results
The regression results yielded through Driscoll–Kraay’s robust standard errors method illustrate that all of net interest income (NII), net non-interest income (NNII) and trading income ratio (TRADE) have negative impacts on Z-score, RACAR and RAROA (Table 5). According to this table, the increase in non-interest income tends to reduce banks’ stability. Thus, the expansion toward fees-based activities can, on one hand, cushion income volatility. On the other hand, such activities appear inefficient and undermine the overall performance, perhaps because the fees-based expansion compromises incentives for supervision of traditional loans, leading to lower loans quality and profitability (Abuzayed et al. 2018; Acharya et al. 2006). Furthermore, risk mitigation through diversification involves a trade-off with an increase in exposure to more volatile non-traditional services, which is referred to as “the dark side” of diversification (Stiroh and Rumble 2006).
Overall, our findings are consistent with some evidence found in previous studies on the significant and negative impacts of fees-based expansion (Abuzayed et al. 2018; Acharya et al. 2006; Hayden et al. 2007; Lepetit et al. 2008; Williams and Prather 2010). Such findings lend support to the detrimental effects of diversification model on ASEAN banking system. In addition, other significant variables such as TRADE and NIM are also consistent with our prediction that the increase in non-traditional trading services will impair banks’ stability as it diverts managerial focus away from traditional deposit and lending activities.
4.3. Robustness Check for Endogeneity
To control for the endogeneity problems potentially leading to bias coefficients, and to check whether the relationship between the diversification of bank business model and stability is robust, a GMM estimator is employed. Consistently, the GMM model (Table 6) yields similar results, especially on the impacts of diversification on bank stability, in that net non-interest income (NNII) has negative and statistically significant effects on the Z-score. The Hansen test statistic is in the good range, according to (Roodman 2009), and supports the rejection of the null hypothesis of over-identifying restrictions.
On country level, the estimated results (Table 7) demonstrate that the impacts of net non—interest income (NNII) are similar in Vietnam and Indonesia in the sense that increasing non-interest income statistically reduces stability. This evidence supports the negative impacts of diversification model on the efficiency of banks. By contrast, Malaysia and Thailand have more in common as NNII has positive and significant impacts on stability, which supports the positive effects of diversification model on banks’ stability. Perhaps the difference in the level of financial market development among ASEAN countries mediates the impacts of NNII and diversification.
TRADE is the other proxy of income diversification in the regression model, and its negative impacts on banks’ stability apparently converge in all countries except for Philippines and Malaysia, suggesting that foreign exchange trading activities statistically undermine the stability of banks. Contrary to the theoretical suggestions, we find negative correlation between NIM and stability. In principle, the implicit assumption in banking business is that banks cope with default and various types of risks by setting the loan–deposit spread, and consequently the NIM, wide enough to buffer against adverse consequences. Thus, the increase in NIM lowers the risk of interest-based activities, and hence NIM accounts for the majority of income in a traditional bank. Against our anticipation, our significant evidence of inverse relationship between NIM and banks’ stability suggests that the increase in NIM, perhaps as the consequence of higher lending rate, comprises higher risk of non-performing loans (Brock and Rojas Suarez 2000), lowers quality of earning assets and leads to an increased level of risk in the next period. Our findings confirm those of Brock and Rojas Suarez (2000)1 and Marinković and Radović (2014), who documented a similar negative association between default risk and bank spreads in developing countries.
5. Conclusions and Implications
With the rise of diversification in the banking business, little is known about the impacts of a diversification model switch, especially in emerging markets. Hence, we set forth to examine whether a gradual change of business model into diversification has positive or negative effects on banks’ stability. We employed net non-interest income (NNII) and foreign exchange trading activities (TRADE) as corresponding proxies for diversification and fees-based activities, and conducted a variety of robustness checks on model levels upon sampling listed banks in ASEAN countries. Our findings indicate that NNII and other fees-based activities (TRADE) tend to have negative impacts on the stability of banks in ASEAN. Evidently, traditional interest-based activities are still key drivers of income for ASEAN banks, and the recent gradual switch to fees-based services has not yet produced a significant effect.
5.1. Theoretical Implications
With evidence of a significant and negative link between the diversification of business models and the stability of ASEAN banks, this paper extends existing empirical evidence of the diversification impacts on banks’ stability with regard to emerging financial markets. Even though the ongoing trend of the fees-based activities model persists, diversification seems to be a barrier to banks’ development and stability in Vietnam, Indonesia, Thailand and Philippines. On the contrary, the more developed financial environments, as in Malaysia, are likely to be motivated by the significant and positive impacts of fees-based diversification. Hence, future research may focus on the mediating effects of factors related to the financial environment on the relationship between diversification models and banks’ stability.
5.2. Practical Implications
The findings can serve as a reference for banks in ASEAN to help them build a more efficient business model in that banks in more developed countries may reach for the fruit of income and fees-based diversification more effectively than their less-developed counterparts in ASEAN region. More specifically, the findings on the negative impacts of diversification suggests that a decision to switch from a traditional to a more fees-based model should be examined more thoroughly on a case-by-case basis, especially for banks in Vietnam and Indonesia. However, in a country with a more developed financial market such as Malaysia, the ostensibly positive sign of diversification motivates the gradual switch to a more contemporary fees-based business model.
Author Contributions
Conceptualization, T.T.N. (Thuy Thu Nguyen); Data curation, H.H.H., D.V.N. and T.T.N. (Trang Thu Nguyen); Formal analysis, D.V.N.; Funding acquisition, T.T.N. (Thuy Thu Nguyen); Investigation, Anh Cam Pham; Project administration, H.H.H.; Resources, T.T.N. (Thuy Thu Nguyen); Software, D.V.N.; Supervision, T.T.N. (Thuy Thu Nguyen); Validation, H.H.H. and T.T.N. (Trang Thu Nguyen); Visualization, D.V.N.; Writing—original draft, H.H.H. and Anh Cam Pham; Writing—review & editing, T.T.N. (Thuy Thu Nguyen) and H.H.H. All authors have read and agreed to the published version of the manuscript.
Funding
This research was funded by Vietnam National Foundation for Science and Technology Development (NAFOSTED), grant number 502.02-1018.16. The APC was funded by the authors.
Institutional Review Board Statement
Not applicable.
Informed Consent Statement
Not applicable.
Data Availability Statement
Not applicable.
Conflicts of Interest
The authors declare no conflict of interest.
| 1 | Brock and Rojas Suarez (2000) present descriptive statistics showing that spreads are more correlated with loan rate rather than deposit rates in Latin American countries. |
References
- Abedifar, Pejman, Philip Molyneux, and Amine Tarazi. 2018. Non-interest income and bank lending. Journal of Banking & Finance 87: 411–26. [Google Scholar] [CrossRef] [Green Version]
- Abuzayed, Bana, Nedal Al-Fayoumi, and Phil Molyneux. 2018. Diversification and bank stability in the GCC. Journal of International Financial Markets, Institutions and Money 57: 17–43. [Google Scholar] [CrossRef]
- Acharya, Viral V., Iftekhar Hasan, and Anthony Saunders. 2006. Should Banks Be Diversified? Evidence from Individual Bank Loan Portfolios on JSTOR. The Journal of Business 79: 1355–412. [Google Scholar] [CrossRef]
- Adesina, Kolade Sunday. 2021. How diversification affects bank performance: The role of human capital. Economic Modelling 94: 303–19. [Google Scholar] [CrossRef]
- Akhigbe, Aigbe, and Bradley A. Stevenson. 2010. Profit efficiency in U.S. BHCs: Effects of increasing non-traditional revenue sources. The Quarterly Review of Economics and Finance 50: 132–40. [Google Scholar] [CrossRef]
- Altunbas, Yener, Simone Manganelli, and David Marques-Ibanez. 2011. Bank Risk During the Financial Crisis—Do Business Models Matter? ECB Working Paper Series, No. 1394. Frankfurt: European Central Bank. [Google Scholar]
- Amidu, Mohammed, and Simon Wolfe. 2013. Does bank competition and diversification lead to greater stability? Evidence from emerging markets. Review of Development Finance 3: 152–66. [Google Scholar] [CrossRef] [Green Version]
- Baele, Lieven, Olivier De Jonghe, and Rudi Vander Vennet. 2007. Does the stock market value bank diversification? Journal of Banking & Finance 31: 1999–2023. [Google Scholar] [CrossRef]
- Banwo, Opeoluwa, Paul Harrald, and Francesca Medda. 2019. Understanding the consequences of diversification on financial stability. Journal of Economic Interaction and Coordination 14: 273–92. [Google Scholar] [CrossRef] [Green Version]
- Boyd, John H., and Edward C. Prescott. 1986. Financial intermediary-coalitions. Journal of Economic Theory 38: 211–32. [Google Scholar] [CrossRef]
- Brock, Philip L., and Liliana Rojas Suarez. 2000. Understanding the behavior of bank spreads in Latin America. Journal of Development Economics 63: 113–134. [Google Scholar] [CrossRef]
- Carlson, Mark. 2004. Are Branch Banks Better Survivors? Evidence from the Depression Era. Economic Inquiry 42: 111–26. [Google Scholar] [CrossRef] [Green Version]
- Cebenoyan, A. Sinan, and Philip E. Strahan. 2004. Risk management, capital structure and lending at banks. Journal of Banking & Finance 28: 19–43. [Google Scholar] [CrossRef]
- Chiorazzo, Vincenzo, Carlo Milani, and Francesca Salvini. 2008. Income Diversification and Bank Performance: Evidence from Italian Banks. Journal of Financial Services Research 33: 181–203. [Google Scholar] [CrossRef]
- Craigwell, Roland, and Chanelle Maxwell. 2006. Non-interest income and financial performance at commercial banks in Barbados. Savings and Development 30: 309–28. [Google Scholar]
- De Vries, Casper G. 2005. The simple economics of bank fragility. Journal of Banking & Finance 29: 803–25. [Google Scholar] [CrossRef]
- Demsetz, Rebecca S., and Philip E. Strahan. 1997. Diversification, Size, and Risk at Bank Holding Companies on JSTOR. Journal of Money, Credit, and Banking 29: 300–13. [Google Scholar] [CrossRef]
- DeYoung, Robert, and Gökhan Torna. 2013. Nontraditional banking activities and bank failures during the financial crisis. Journal of Financial Intermediation 22: 397–421. [Google Scholar] [CrossRef]
- DeYoung, Robert, and Karin P. Roland. 2001. Product Mix and Earnings Volatility at Commercial Banks: Evidence from a Degree of Total Leverage Model. Journal of Financial Intermediation 10: 54–84. [Google Scholar] [CrossRef]
- Drucker, Steven, and Manju Puri. 2009. On Loan Sales, Loan Contracting, and Lending Relationships. The Review of Financial Studies 22: 2835–72. [Google Scholar] [CrossRef]
- Elyasiani, Elyas, and Yong Wang. 2012. Bank holding company diversification and production efficiency. Applied Financial Economics 22: 1409–28. [Google Scholar] [CrossRef]
- Froot, Kenneth A., and Jeremy C. Stein. 1998. Risk management, capital budgeting, and capital structure policy for financial institutions: An integrated approach. Journal of Financial Economics 47: 55–82. [Google Scholar] [CrossRef] [Green Version]
- Froot, Kenneth A., David S. Scharfstein, and Jeremy C. Stein. 1993. Risk Management: Coordinating Corporate Investment and Financing Policies. The Journal of Finance 48: 1629–58. [Google Scholar] [CrossRef] [Green Version]
- Hamdi, Helmi, Abdelaziz Hakimi, and Khemais Zaghdoudi. 2017. Diversification, bank performance and risk: Have Tunisian banks adopted the new business model? Financial Innovation 3: 22. [Google Scholar] [CrossRef]
- Hayden, Evelyn, Daniel Porath, and Natalja V. Westernhagen. 2007. Does Diversification Improve the Performance of German Banks? Evidence from Individual Bank Loan Portfolios. Journal of Financial Services Research 32: 123–40. [Google Scholar] [CrossRef]
- Ismail, Aisha, Rahila Hanif, Sadaf Choudhary, and Nisar Ahmad. 2015. Income-diversification in banking sector of Pakistan: A “Blessing” or “Curse”? The Journal of Commerce 7: 11–22. [Google Scholar]
- King, Robert G., and Ross Levine. 1993. Finance and Growth: Schumpeter Might Be Right. The Quarterly Journal of Economics 108: 717–37. [Google Scholar] [CrossRef]
- Kohler, Matthias. 2015. Which banks are more risky? The impact of business models on bank stability. Journal of Financial Stability 16: 195–212. [Google Scholar] [CrossRef]
- Lee, Chien-Chiang, Shih-Jui Yang, and Chi-Hung Chang. 2014. Non-interest income, profitability, and risk in banking industry: A cross-country analysis. The North American Journal of Economics and Finance 27: 48–67. [Google Scholar] [CrossRef]
- Lepetit, Laetitia, Emmanuelle Nys, Philippe Rous, and Amine Tarazi. 2008. Bank income structure and risk: An empirical analysis of European banks. Journal of Banking & Finance 32: 1452–67. [Google Scholar] [CrossRef] [Green Version]
- Li, Xingjian, Hongrui Feng, Sebastian Zhao, and David A. Carter. 2021. The effect of revenue diversification on bank profitability and risk during the COVID-19 pandemic. Finance Research Letters, 101957. [Google Scholar] [CrossRef]
- Lütkepohl, Helmut, and Fang Xu. 2010. The role of the log transformation in forecasting economic variables. Empirical Economics 42: 619–38. [Google Scholar] [CrossRef] [Green Version]
- Mahdaleta, Ela, Iskandar Muda, and Gusnardi Muhammad Nasir. 2016. Effects of Capital Structure and Profitability on Corporate Value with Company Size as the Moderating Variable of Manufacturing Companies Listed on Indonesia Stock Exchange. Academic Journal of Economic Studies 2: 30–43. [Google Scholar]
- Marinković, Srđan, and Ognjen Radović. 2014. Bank net interest margin related to risk, ownership and size: An exploratory study of the Serbian banking industry. Economic Research-Ekonomska Istraživanja 27: 134–54. [Google Scholar] [CrossRef]
- Meslier, Céline, Ruth Tacneng, and Amine Tarazi. 2014. Is bank income diversification beneficial? Evidence from an emerging economy. Journal of International Financial Markets, Institutions and Money 31: 97–126. [Google Scholar] [CrossRef] [Green Version]
- Mummolo, Jonathan, and Erik Peterson. 2018. Improving the Interpretation of Fixed Effects Regression Results. Political Science Research and Methods 6: 829–835. [Google Scholar] [CrossRef] [Green Version]
- Nguyen, My, Michael Skully, and Shrimal Perera. 2012. Market power, revenue diversification and bank stability: Evidence from selected South Asian countries. Journal of International Financial Markets, Institutions and Money 22: 897–912. [Google Scholar] [CrossRef]
- Nguyen, Phong Hoang, and Duyen Thi Bich Pham. 2020. Income diversification and cost-efficiency of Vietnamese banks. International Journal of Managerial Finance 16: 623–43. [Google Scholar] [CrossRef]
- Roodman, David. 2009. How to do xtabond2: An introduction to difference and system GMM in Stata. Stata Journal 9: 86–136. [Google Scholar] [CrossRef] [Green Version]
- Sanya, Sarah, and Simon Wolfe. 2011. Can Banks in Emerging Economies Benefit from Revenue Diversification? Journal of Financial Services Research 40: 79–101. [Google Scholar] [CrossRef] [Green Version]
- Saunders, Anthony Markus Schmid, and Ingo Walter. 2014. Non-interest Income and Bank Performance: Is Banks’ Increased Reliance on Non-interest Income Bad? SSRN Electronic Journal. [Google Scholar] [CrossRef]
- Sianipar, Aryanti Sariartha. 2015. Pengaruh diversifikasi pendapatan terhadap kinerja bank. Jurnal Siasat Bisnis 19: 27–35. [Google Scholar] [CrossRef] [Green Version]
- Sissy, Aisha Mohammed, Mohammed Amidu, and Joshua Yindenaba Abor. 2017. The effects of revenue diversification and cross border banking on risk and return of banks in Africa. Research in International Business and Finance 40: 1–18. [Google Scholar] [CrossRef]
- Stiroh, Kevin J. 2004. Diversification in Banking: Is Noninterest Income the Answer? Journal of Money, Credit and Banking 36: 853–82. [Google Scholar] [CrossRef] [Green Version]
- Stiroh, Kevin J., and Adrienne Rumble. 2006. The dark side of diversification: The case of US financial holding companies. Journal of Banking & Finance 30: 2131–61. [Google Scholar] [CrossRef]
- Trivedi, Smita Roy. 2015. Banking Innovations and New Income Streams: Impact on Banks’ Performance. Vikalpa 40: 28–41. [Google Scholar] [CrossRef] [Green Version]
- Ullah, Subhan, Pervaiz Akhtar Akhtar, and Ghasem Zaefarian. 2018. Dealing with Endogeneity Bias: The Generalized Method of Moments (GMM) for Panel Data. Industrial Marketing Management 71: 69–78. [Google Scholar] [CrossRef]
- Williams, Barry, and Laurie Prather. 2010. Bank risk and return: The impact of bank non-interest income. International Journal of Managerial Finance 6: 220–44. [Google Scholar] [CrossRef]
- Williams, Barry. 2016. The impact of non-interest income on bank risk in Australia. Journal of Banking & Finance 73: 16–37. [Google Scholar] [CrossRef] [Green Version]
- Wooldridge, Jeffrey. 2010. Econometric Analysis of Cross Section and Panel Data. Cambridge and London: The MIT Press. [Google Scholar]
- Wu, Ji, Limei Chen, Minghua Chen, and Bang Nam Jeon. 2020. Diversification, efficiency and risk of banks: Evidence from emerging economies. Emerging Markets Review 45: 100720. [Google Scholar] [CrossRef]
- Yang, Hsin-Feng, Chih-Liang Liu, and Ray Yeutien Chou. 2020. Bank diversification and systemic risk. The Quarterly Review of Economics and Finance 77: 311–26. [Google Scholar] [CrossRef]
Figure 1.
Z-score and ROA for ASEAN countries.

Figure 2.
Z-score and ROA in Vietnam.


Table 1.
The description of variables.
| Variable | Description | Expected |
|---|---|---|
| Alternative Dependent variable | ||
| Z-score | Fraction of (ROA+CAR)/SDROA | |
| RAROA | Faraction of ROA/SDROA | |
| RACAR | Fraction of CAR/SDCAR | |
| Independent variables | ||
| NII | Fraction of abs(net interest income)/abs(total income) | (+) |
| NNII | Fraction of net non-interest income/net operating income | (+) |
| TRADE | Fraction of trading income/net operating income | (−) |
| Control variables | ||
| CAR | Fraction of equity/total assets | |
| SIZE | Ln(Total assets) | (−) |
| LOANS | Fraction of total loans/total assets | (+) |
| NIM | Fraction of net interest revenue/average earning assets | (+) |
Source: Authors’ synthesis.
Table 2.
Descriptive statistics for all countries.
| Variable Name | Mean | SD | Min | Max |
|---|---|---|---|---|
| Z-score | 39.080 | 35.975 | 0.052 | 267.249 |
| RAROA | 2.947 | 2.662 | −2.786 | 21.254 |
| RACAR | 36.113 | 33.766 | 0.000 | 248.724 |
| NII | 2.321 | 10.322 | 0.005 | 188.302 |
| NNII | 1.017 | 2.643 | −1.089 | 69.551 |
| TRADE | −0.519 | 20.988 | −635.648 | 105.737 |
| ROA | 1.503 | 1.489 | −10.700 | 10.210 |
| CAR | 17.146 | 19.353 | 0.000 | 489.580 |
| SDROA | 0.827 | 0.903 | 0.002 | 4.720 |
| SDROE | 0.064 | 0.045 | 0.022 | 0.230 |
| LOANS | 0.604 | 0.129 | 0.020 | 0.920 |
| NIM | 4.149 | 4.163 | −0.009 | 45.030 |
Note: The mean Z-score is remarkably higher than the safety level for non-manufacturers (2.90). Some banks are still subject to bankruptcy since the minimum level of Z-score is below the critical level (0.15). The sample contains 987 observations (N) for 99 banks in ASEAN banks. Source: Authors’ synthesis.
Table 3.
Descriptive statistics for Vietnam and ASEAN countries.
| Variable Name | Mean | SD | Min | Max |
|---|---|---|---|---|
| Vietnam | ||||
| Z-score | 25.670 | 18.007 | 0.052 | 99.718 |
| RAROA | 2.061 | 1.584 | −2.602 | 6.613 |
| RACAR | 23.556 | 17.269 | 0.000 | 96.548 |
| NII | 0.236 | 0.718 | 0.005 | 9.650 |
| NNII | 0.222 | 0.296 | −1.089 | 3.003 |
| NIM | 0.032 | 0.014 | −0.009 | 0.094 |
| LOANS | 0.556 | 0.120 | 0.145 | 0.744 |
| TRADE | −3.264 | 52.344 | −635.647 | 105.737 |
| ROA | 0.009 | 0.008 | −0.060 | 0.029 |
| CAR | 0.108 | 0.064 | 0.000 | 0.402 |
| SDROA | 0.006 | 0.005 | 0.002 | 0.023 |
| ASEAN countries | ||||
| Z-score | 41.765 | 38.370 | 0.864 | 267.249 |
| RA_ROA | 3.138 | 2.790 | −2.786 | 21.254 |
| RA_CAR | 38.627 | 36.037 | 2.507 | 248.724 |
| NII | 2.749 | 11.045 | 0.014 | 188.301 |
| NNII | 1.191 | 2.788 | 0.011 | 69.551 |
| NIM | 5.074 | 3.943 | 0.260 | 45.030 |
| LOANS | 0.000 | 0.000 | 0.000 | 0.000 |
| TRADE | 0.009 | 0.022 | 0.000 | 0.077 |
| ROA | 1.828 | 1.504 | −10.700 | 10.210 |
| CAR | 20.404 | 18.705 | 6.150 | 489.580 |
| SDROA | 1.011 | 0.903 | 0.070 | 4.720 |
Note: The mean Z-score of Vietnamese banks; minimum and maximum values are all lower than counterparts of other ASEAN averages. The mean values of RAROA and RACAR (alternative proxies for bank’s stability) in Vietnam are also lower than those of other ASEAN countries. The aggregate of statistics suggests a different pattern in the overall stability of Vietnamese banks. Source: Author’s synthesis.
Table 4.
The distribution of listed banks by country.
| Country | No. of Banks | Percentage |
|---|---|---|
| Indonesia | 43 | 43.43% |
| Philippines | 14 | 14.15% |
| Vietnam | 18 | 18.18% |
| Malaysia | 13 | 13.13% |
| Thailand | 11 | 11.11% |
| Total | 99 | 100% |
Source: Author’s synthesis.
Table 5.
Regression results for ASEAN countries.
| Model 1 | Model 2 | Model 3 | Model 4 | Model 5 | Model 6 | |
|---|---|---|---|---|---|---|
| Variables | Zscore | Zscore | Racar | Racar | Raroa | Raroa |
| NII | −0.0365 ** | −0.0272 * | −0.00935 *** | |||
| (0.0149) | (0.0149) | (0.00266) | ||||
| NNII | −0.126 * | −0.107 | −0.0192 *** | |||
| (0.0709) | (0.0682) | (0.00436) | ||||
| TRADE | −0.0225 *** | −0.0224 *** | −0.0223 *** | −0.0223 *** | −0.000182 | −0.000184 |
| (0.00717) | (0.00719) | (0.00658) | (0.00661) | (0.000748) | (0.000746) | |
| SIZE | 0.0969 | 0.120 | 0.107 | 0.121 | −0.00983 | −0.000158 |
| (0.0811) | (0.0798) | (0.0747) | (0.0739) | (0.0148) | (0.0119) | |
| LOANS | −23.38 *** | −23.53 *** | −22.18 *** | −22.32 *** | −1.198 * | −1.209 * |
| (4.973) | (4.964) | (5.018) | (5.011) | (0.684) | (0.675) | |
| NIM | −0.179 ** | −0.174 * | −0.260 *** | −0.257 *** | 0.0819 *** | 0.0826 *** |
| (0.0896) | (0.0898) | (0.0958) | (0.0954) | (0.0180) | (0.0180) | |
| CAR | 0.492 *** | 0.492 *** | 0.490 *** | 0.490 *** | 0.00199 | 0.00185 |
| (0.0263) | (0.0265) | (0.0247) | (0.0249) | (0.00271) | (0.00264) | |
| Constant | 43.58 *** | 43.02 *** | 39.90 *** | 39.62 *** | 3.687 *** | 3.406 *** |
| (2.407) | (2.229) | (2.402) | (2.254) | (0.420) | (0.465) | |
| Observations | 914 | 914 | 914 | 914 | 914 | 914 |
| No. of groups | 96 | 96 | 96 | 96 | 96 | 96 |
Note: the regression results are generated with Driscoll and Kraay estimator. Standard errors in parentheses. *** p < 0.01, ** p < 0.05 and * p < 0.1.
Table 6.
Estimated results with GMM.
| Model 1 | Model 2 | Model 3 | Model 4 | Model 5 | Model 6 | |
|---|---|---|---|---|---|---|
| Variables | Zscore | Zscore | Racar | Racar | Raroa | Raroa |
| ZSCORet−1 | 0.547 *** | 0.558 *** | ||||
| (0.00792) | (0.00667) | |||||
| RACARt−1 | 0.471 *** | 0.459 *** | ||||
| (0.0179) | (0.0206) | |||||
| RAROAt−1 | 0.853 *** | 0.821 *** | ||||
| (0.0183) | (0.0229) | |||||
| NII | −0.106 *** | −0.166 ** | −0.00486 ** | |||
| (0.00528) | (0.0726) | (0.00241) | ||||
| NNII | −0.0890 *** | 0.278 | 0.0428 | |||
| (0.0219) | (0.777) | (0.0479) | ||||
| TRADE | −0.131 ** | −0.154 *** | −0.204 *** | −0.192 *** | 0.0857 | −0.0101 *** |
| (0.0547) | (0.0566) | (0.0771) | (0.0698) | (0.0771) | (0.00373) | |
| SIZE | −0.572 *** | −0.195 *** | −1.433 *** | −1.503 *** | −0.0319 ** | 0.143 *** |
| (0.0367) | (0.0354) | (0.239) | (0.228) | (0.0141) | (0.0229) | |
| LOANS | 11.16 *** | 11.18 *** | 28.85 *** | 27.81 *** | 0.565 *** | 0.991 *** |
| (1.161) | (1.007) | (7.885) | (8.254) | (0.132) | (0.291) | |
| NIM | −0.523 *** | −0.634 *** | −0.852 *** | −1.147 *** | 0.0749 *** | −0.00286 |
| (0.0628) | (0.0494) | (0.318) | (0.330) | (0.0221) | (0.0289) | |
| CAR | 0.477 *** | 0.460 *** | 0.573 *** | 0.557 *** | 0.0123 | 0.0275 *** |
| (0.0234) | (0.0240) | (0.0390) | (0.0447) | (0.00754) | (0.00873) | |
| Constant | 21.93 *** | 11.07 *** | 37.78 *** | 41.61 *** | 0.507 | −4.844 *** |
| (1.568) | (1.113) | (7.260) | (6.210) | (0.351) | (0.700) | |
| Observations | 836 | 836 | 836 | 836 | 843 | 843 |
| No. of groups | 96 | 96 | 96 | 96 | 96 | 96 |
| AR(2) | 0.172 | 0.154 | 0.369 | 0.324 | 0.704 | 0.164 |
| Hansen test | 0.383 | 0.287 | 0.322 | 0.274 | 0.308 | 0.213 |
Standard errors in parentheses, *** p < 0.01, ** p < 0.05.
Table 7.
Business model for individual countries.
| Z-Score | RAROA | RACAR | ||||
|---|---|---|---|---|---|---|
| Country | NNII | TRADE | NNII | TRADE | NNII | TRADE |
| Indonesia | −0.045 *** | −45.43 *** | 0.0088 *** | −1.197 | −0.036 *** | −44 23 *** |
| Malaysia | 108.2 *** | −0.843 | 17.49 *** | 10.56 *** | 90.69 *** | −11.40 |
| Philippines | −39.15 | −32.98 | 9.449 ** | −2.842 | −48.60 | −30.14 |
| Thailand | 14.51 * | −90.78 ** | 0.451 | −1.458 | 14.06 * | −89.33 ** |
| Vietnam | −25.47 *** | −0.0197 ** | −0.336 *** | −0.00042 | −24.68 *** | −0.0195 ** |
Note: *** p < 0.01, ** p < 0.05 and * p < 0.1.
Publisher’s Note: MDPI stays neutral with regard to jurisdictional claims in published maps and institutional affiliations. |
© 2021 by the authors. Licensee MDPI, Basel, Switzerland. This article is an open access article distributed under the terms and conditions of the Creative Commons Attribution (CC BY) license (https://creativecommons.org/licenses/by/4.0/).
Share and Cite
MDPI and ACS Style
Nguyen, T.T.; Ho, H.H.; Nguyen, D.V.; Pham, A.C.; Nguyen, T.T. The Effects of Business Model on Bank’s Stability. Int. J. Financial Stud. 2021, 9, 46. https://0-doi-org.brum.beds.ac.uk/10.3390/ijfs9030046
AMA Style
Nguyen TT, Ho HH, Nguyen DV, Pham AC, Nguyen TT. The Effects of Business Model on Bank’s Stability. International Journal of Financial Studies. 2021; 9(3):46. https://0-doi-org.brum.beds.ac.uk/10.3390/ijfs9030046
Chicago/Turabian StyleNguyen, Thuy Thu, Hai Hong Ho, Duy Van Nguyen, Anh Cam Pham, and Trang Thu Nguyen. 2021. "The Effects of Business Model on Bank’s Stability" International Journal of Financial Studies 9, no. 3: 46. https://0-doi-org.brum.beds.ac.uk/10.3390/ijfs9030046
Note that from the first issue of 2016, this journal uses article numbers instead of page numbers. See further details here.