
Corporate Social Practices and Firm Financial Performance: Empirical Evidence from France


GEF-2A Lab, Institut Supérieur de Gestion de Tunis (ISG Tunis), Université de Tunis, Bardo 2000, Tunisia
*
Author to whom correspondence should be addressed.
Int. J. Financial Stud. 2021, 9(4), 54; https://0-doi-org.brum.beds.ac.uk/10.3390/ijfs9040054
Submission received: 21 August 2021
/
Revised: 17 September 2021
/
Accepted: 18 September 2021
/
Published: 28 September 2021
(This article belongs to the Collection Corporate Social Responsibility in Finance)
Abstract
:The present work aimed to examine the association between Corporate Social performance (CSP) and corporate financial performance (CFP) taking into account corporate social irresponsibility. Here, we used a sample of French non-financial firms listed on SBF 120 between 2011 and 2016. Our findings provided evidence that corporate social responsibility (CSR) and corporate social irresponsibility (CSI) exert opposite effects on the CFP. Using an estimation of the vector autoregressive (VAR) model for panel data, we showed that the CSI has a greater and more lasting impact on CFP than CSR.
1. Introduction
Faced with the global financial crisis and declining stakeholder confidence, several reforms were launched worldwide to advance environmental, social, and governance (ESG) issues, commonly referred to as corporate social responsibility (CSR). “CSR refer to company activities—voluntary by definition—demonstrating the inclusion of social and environmental concerns in business operations and in interactions with stakeholders” (Van Marrewijk 2003, p. 102). The motivation was to move from a shareholder perception of value to a more global perception, including the interests of all stakeholders. As a result, CSR has emerged as a significant dimension for the development of sustainable strategies that affect business performance positively (Eccles and Serafeim 2013; Činčalová and Hedija 2020).
In France, since 2001, CSR has been the subject of numerous regulations. The law on New Economic Regulations (NRE) obliges listed companies to disclose information relating to their social and environmental impacts in their annual reports. It is important to note that this law did not prescribe social rules to be implemented, new emission thresholds, or the use of renewable energies. In 2009, the Grenelle I law defined actions to improve sustainable development activities and promote socially responsible investment. This law was followed by the law of 12 July 2010, known as Grenelle II, on national commitment to the environment. In addition, the decree of 24 April 2012 relating to the transparency of information related to social and environmental impact and the decree of 13 May 2013 require companies to appoint an independent third-party body to verify the information disclosed and write a report including a certificate on the presence of all mandatory information and the fairness of the information appearing in the annual report and the CSR report.
Several empirical studies have analyzed the link between corporate social performance (CSP) and corporate financial performance (CFP) (Fatemi et al. 2015; Velte 2017; Sroufe and Gopalakrishna-Remani 2019). Although most studies indicate a positive link, others find negative or insignificant results (Brammer et al. 2006; Nollet et al. 2016). These mixed results can be explained mainly by the use of different measures of CSP and CFP (Galant and Cadez 2017).
While many studies consider corporate social performance as an overall score (Fatemi et al. 2015; Goel and Misra 2017; Sroufe and Gopalakrishna-Remani 2019), others suggest that individual dimensions, such as community, diversity, human rights, and etc. should be considered separately (Blasi et al. 2018; Boubaker et al. 2020). Indeed, it is not clear whether some aspects contribute to the relationship between CSP and CFP. Recently, researchers have begun integrating corporate social irresponsibility (CSI) to better understand the impact of CSP on CFP. Oikonomou et al. (2014) suggested that companies can display both socially responsible and irresponsible practices. In general, CSP is tied to “doing good” and overlap with CSR. However, companies are responsible not only for “doing good” but also for “avoiding bad” in order to prevent corporate social irresponsibility (CSI). “CSI is seen as immoral and/or illegal corporate actions with negative consequences for others” (Lin-Hi and Müller 2013, p. 1932).
Our study is related to the literature on social and financial performance. However, contrary to previous studies (Li et al. 2019; Maqbool and Zameer 2018; Velte 2017) that consider CSR as a measure of corporate social performance, we relied on components of CSP to elucidate its effect on financial performance. Unlike Blasi et al. (2018) and Boubaker et al. (2020), we focused on responsible and irresponsible social practices as CSP components.
Our study makes a clear contribution to the existing literature. More specifically, it examined how the social performance components, CSR and CSI, could affect corporate financial performance. In addition, it studied the strength and duration of their impacts on financial performance. We focused on French firms listed on the SBF 120 index from 2011 to 2016. The choice is motivated by the growing interest in ESG issues in the French context.
The current study provided the following results. CSP components: CSR and CSI exert opposite effects on firm financial performance. Interestingly, using an estimation of a VAR model for panel data, the results revealed that CSI has a stronger and longer effect on CFP than CSR. These results can give policy makers and regulators insight into the importance of avoiding CSI as a performance pillar.
2. Theoretical Framework
The fundamental theory for analyzing the relationship between CSP and financial performance is the stakeholder theory (Freeman 1984). This theory stipulates that firms must satisfy all the stakeholders who can affect the existence of the firm, not only shareholders. Connecting with stakeholders can enhance satisfaction, loyalty, and produce a positive reputation and favorable firm image. Accordingly, balancing the various stakeholders’ interests becomes a critical task for managers to build a positive reputation. From this perspective, CSR reduces firm costs, creates value for stakeholders, and hence boosts its financial performance.
The stakeholder theory conceptualizes CSI as an opposite to CSR that prompts negative stakeholder perception and relationship and produces negative consequences as costly lawsuits, costs associated with a negative firm reputation and increased financial risk. The first study of CSI in the literature was introduced by Armstrong (1977). He defined CSI as “a decision to accept an alternative that is thought by the decision maker to be inferior to another alternative when the effects upon all parties are considered. Generally, this involves a gain by one party at the expense of the total system” (Armstrong 1977, p. 185).
Frooman (1999) merged the stakeholder theory and the resource-dependence theory to propose several ways in which stakeholders could exercise their influence over the firm’s management decision. The resource-dependence theory suggests that access and control over resources are essential elements to a firm’s success, and, therefore, firms must carefully implement strategies to maintain access to these resources. Therefore, firms depend on stakeholders to survive because they provide the material and intangible resources essential to a firm’s success (Hill and Jones 1992). If stakeholders take resources in whole or in part, a company may not continue to subsist or may suffer a financial disaster (Clarkson 1995; Harjoto and Laksmana 2018). Key stakeholders, namely shareholders, have control over these resources and could influence management decisions and gain control over the firm. CSR commitment serves as a control mechanism that balances the interest of multiple groups of stakeholders (Mason and Simmons 2014).
Another perspective is presented by the agency theory that augurs a negative relationship between CSR and firm performance. For agency theorists, the main objective of the firm is to increase the wealth of the shareholders. Friedman (1970) identified CSR as an agency problem in which managers misallocate shareholders’ wealth to pursue a social mission they choose. Such a situation puts managers in a favorable position, i.e., not to be adequately evaluated for the results of their decisions, thereby increasing the risks of excessive discretion and potential inefficiency in capital allocation. Socially responsible investment can result in a waste of resources that can weaken rather than strengthen a business, with a loss of wealth for shareholders. Choosing to invest in CSR is a decision based on principles that expose the company to risks relative to the goal of maximizing financial value (Jensen 2001). Consequently, social action involves costs that affect profit negatively. The underlying assumption is that the payoffs of CSR activities do not exceed their costs.
Another explanation is that firms waste valuable but limited resources in corporate social investment to build a reputation to their advantage. Once investors determine companies’ true intentions, they could penalize them in the stock market; thus, CSR engagement decreases firm performance. Besides, CSR investment diverts valuable corporate resources that could be used in other projects, such as developing new product lines or building stronger R&D capabilities (Barnea and Rubin 2010). As a result, CSR investments may decrease the firm’s competitiveness.
To summarize, two main theoretical perspectives offer insights into the relationship between CSR and CFP. On the one hand, the corporate social investment reflects the interest of the company towards the various stakeholders who control the resources necessary for the survival of the company, hence its positive effect on financial performance. On the other hand, the agency theory indicates that engagement in social behavior offers no financial return to offset its costs; thus, CSR has a negative effect on financial performance.
2.1. Corporate Social Performance and Firm Financial Performance
Although the relationship between CSP and CFP is extensively empirically examined, the results are inconclusive (Lu et al. 2014). Several authors found a negative or insignificant effect (Brammer et al. 2006; Nollet et al. 2016), which is explained by the waste of precious resources by over-investing in CSR. For example, Ayadi et al. (2015) evidenced that American companies with better CSP have a higher risk-taking level than those with lower CSP. Lyon et al. (2013) found that companies winning Business Green Leaders Awards generate negative abnormal returns. However, McWilliams and Siegel (2001) estimated that the costs of social responsibility investment consume the profits generated, which leads to a situation of equilibrium. Yang (2016) explained this negative or insignificant relation by the time horizon of the analysis. He argued that there may be a negative relationship in the short term, but a positive relationship will eventually dominate in the long-term.
Several other studies report a positive relationship between CSP and financial performance (Fatemi et al. 2015; Goel and Misra 2017; Sroufe and Gopalakrishna-Remani 2019). For instance, Reverte et al. (2016) documented a positive relationship between CSR practices and both financial and non-financial outcomes (reputation) in Spanish firms. They also noted that this relationship is mediated by innovation for the manufacturing companies.
CSP can create additional benefits for the company that can affect its performance (Sun and Cui 2014). Indeed, companies with a higher CSR commitment face fewer constraints (Jo and Harjoto 2012; Cheng et al. 2014; Al-Hadi et al. 2019). For example, Al-Hadi et al. (2019) showed that commitment to good social practices significantly reduces the financial distress of the company. Based on a sample of US-listed firms, Boubaker et al. (2020) argued that CSR have a negative effect on financial default risk, and thus high-CSR firms exhibit lower financial default risk. They also showed that this relationship is driven by community, diversity, and employee dimensions of CSR. Other authors believe that CSP can reduce the cost of equity and the cost of debt (El Ghoul et al. 2011; Goss and Roberts 2011). El Ghoul et al. (2017) assessed the relationship between corporate social performance and firm value and the channels through which CSR initiatives reduce transaction costs in 53 countries. They provided evidence that better CSP is associated with lower default risk and better access to finance in countries with weak capital and credit markets. In addition, Cui et al. (2018) noted a negative effect of CSP on asymmetric information in US companies. Indeed, socially-efficient firms are more closely followed by analysts (Hong and Kacperczyk 2009) and receive more favorable recommendations (Ioannou and Serafeim 2015), which leads to greater accuracy in analysts’ forecasts (Dhaliwal et al. 2012). Besides, CSR promotes effective corporate governance and corporate value (Jo and Harjoto 2012; Velte 2017). Recently, Hunjra et al. (2021) noted a positive impact of CSR on financial performance. They also showed that CSR mediated the relationship between culture, religiosity, and firm performance for a sample of Pakistani firms.
The impact of CSP on financial performance in different industries was also widely discussed. A study by Weber (2017) analyzed the sustainability performance of Chinese banks from annual financial and non-financial reports between 2009 and 2013. The author concluded that the integration of sustainability into the financial sector does not obstruct financial performance, but rather increases it. Green credit policies, such as those of China, can produce two effects: increasing the sustainability of banks and creating a more stable and efficient financial sector. Additionally, Maqbool and Zameer (2018) found that CSP measured by an index based on a content analysis of information collected from annual reports had a positive impact on the financial performance of Indian banks. Based on a sample of Pakistani commercial banks, Ramzan et al. (2021) provided evidence on the positive impact of CSR on financial performance, financial inclusion, and financial stability. Similar results were found by Jahmane and Gaies (2020) for CAC40 companies. Baron et al. (2011) conducted a cross-industry analysis and found that CSR is related positively to the financial performance of consumer markets and negatively to that of the industrial market. These results were confirmed by Taylor et al. (2018), who noted that disclosure of social responsibility scores is associated with higher levels of firm value, measured by Tobin’s Q. Furthermore, Blasi et al. (2018) analyzed the impact of different categories of ESG score on firm performance by disaggregating firms by industry. They found that CSP has a positive effect on financial performance. They also noted that companies in the oil and gas industry invest more in all areas of ESG with an almost always positive return on financial performance. In a recent study of US technology companies, Okafor et al. (2021) provided evidence on the positive impact of corporate social investment on the firm’s long-term growth.
Based on the stakeholder theory and the results of previous empirical research, we assume that CSP is positively related to corporate financial performance.
Hypothesis 1.
CSP has a positive effect on corporate financial performance.
2.2. CSR, CSI, and Firm Performance
The study of social performance is often referred to as the study of corporate social responsibility. However, corporate social performance is a combination of responsible and irresponsible social practices. Some prior studies support that CSR is positively associated with companies’ performances; thus, companies are rewarded for CSR performance and penalized for violations (Wang and Sarkis 2017). Oikonomou et al. (2014) suggested that “It is commonplace for firms to exhibit both positive and negative indicators of CSP”. The effect of social responsibility and irresponsibility on financial performance is largely unresolved in the literature. Indeed, researchers have recently begun to study the impact of CSP on corporate performance by including the CSI.
Most studies have shown that CSR increases the company value, while CSI has the opposite effect (Gregory-Smith et al. 2014). In particular, Fatemi et al. (2018) studied the interrelationship between good and bad ESG practices and firm performance and found that good ESG practices increase the company value, and bad ones reduce it. They also found that reporting such information reduces the company value because of the shaded image arising from the interaction of the good and bad practices disclosed. Based on a sample of US companies operating in controversial industries, Jo and Na (2012) found that the commitment to socially responsible practices negatively affects firm risk. They examined the effect of risk reduction by engaging in CSR activities on two samples of companies operating in non-controversial and controversial businesses and found that it was economically and statistically more significant in companies operating in controversial industries. Based on scores of CSR strengths and concerns provided by the KLD agency, Harjoto and Laksmana (2018) found that CSP measured by an overall score is negatively associated with deviations from the optimal risk level. They argued that CSR serves as a control mechanism to limit excessive risk-taking and reduce risk avoidance. They also find that CSR strengths are negatively related to deviations from optimal risk-taking, while CSR concerns are positively related to them. The authors explained these results by the fact that companies with a high score of strengths devote a significant portion of their resources to CSR activities; accordingly, fewer resources are available for risk-taking activities.
Goss and Roberts (2011) showed that firms with CSR concerns are penalized by an increase in their cost of debt, while those with CSR strengths only benefit from a negligible increase in their cost of debt. Hence, socially irresponsible firms should be significantly exposed to higher risk, while socially responsible ones may marginally decrease their risk. In the same vein, Oikonomou et al. (2012) indicated a strong positive relationship between CSI and financial risk and a weak negative relationship between CSR and firm systematic risk. It has also been suggested that CSR lowers firm idiosyncratic risk, whereas CSI increases it (Mishra and Modi 2013). This discussion leads to our hypothesis:
Hypothesis 2.
CSR (CSI) has a positive (negative) effect on firm financial performance.
We have formulated our theoretical and empirical reasoning on the contradictory effects of CSR and CSI on financial performance. CSR creates value from good relationships with stakeholders to create a competitive advantage (Jones 1995) used to increase firm performance. However, CSI erodes the value of stakeholder relationships and decreases firm performance by diminishing competitive advantage. Several authors have studied and compared the effect of CSR and CSI on different aspects of financial performance. In particular, Goss and Roberts (2011) showed that CSI has a positive and significant effect on the cost of debt, while CSR has a negligible negative effect. Moreover, a strong positive relationship between CSI and financial risk and a weak negative relationship between CSR and systematic business risk have been established by Oikonomou et al. (2012) and Nguyen and Nguyen (2015). Price and Sun (2017) confirmed this proposal and found that corporate social irresponsibility has a more significant and longer enduring effect than CSR initiatives on firm value, measured by Tobin’s Q, and idiosyncratic risk. They also suggested that firms doing little CSR and little CSI perform better than firms engaging in a high level of both. Some explanations for the stronger reactions to CSI can be found in the psychology literature. Indeed, previous research on human psychology demonstrates that there is a significant asymmetry between the cognitive processing that people perform in response to negative information versus positive information (Kanouse and Hanson 1972). Therefore, irresponsible and/or illegal behavior is strongly and negatively received by stakeholders (Frooman 1997). Although stakeholders cannot demand socially responsible behavior from the company, irresponsible behavior risks being sanctioned by the different stakeholders (Sweetin et al. 2013). Therefore, we assume that the negative effects of CSI will be stronger than the positive effects of CSR. In addition to assuming that CSI will have a greater effect on firm performance than CSR, we assume that the effect of CSI will last longer than the effect of CSR. Psychology literature also supports this hypothesis. Indeed, negative news about a firm tends to stay in the memory of stakeholders for a longer period than positive ones (Veitch and Griffitt 1976). We then formulate the following assumptions:
Hypothesis 3.
CSI has a greater impact than CSR on firm financial performance.
Hypothesis 4.
CSI has a longer impact than CSR on firm financial performance.
3. Empirical Design
3.1. Data and Sample
The original sample encompassed firms listed on the SBF 120 index between 2011 and 2016. CSR information was obtained from the ASSET4 database available via Thomson Reuters DataStream. This dataset only covers 96 of the SBF 120 companies. We excluded 15 financial companies because their account structures and governance systems are different. Therefore, a total of 81 firms and 486 firm-year observations composed our final sample.
Financial and accounting data were obtained from the Thomson Reuters DataStream database. Governance data were hand collected from reference documents available on the firms’ websites.
3.2. Variables
Corporate Social Performance (CSP): is measured by the ESG combined score, which is the average of the ESG and the ESG controversies scores. It provides a comprehensive rating of the company’s ESG performance based on information reported in the ESG pillars with ESG controversies that capture information from global media sources.
Corporate social responsibility (CSR): corresponds to the ESG score extracted from ASSET4-Datastream. The ESG score is based on measures which are grouped into three pillars, namely (1) environmental performance, (2) social performance, and (3) corporate governance, spread over 10 categories. Different categories are weighted proportionally to the number of measures in each category to form the final ESG score. The weightings of the categories are determined by the number of indicators that make up each category compared to all the indicators used in the ESG rating.
Corporate social irresponsibility (CSI): is measured as follows:
ESG controversies score is calculated based on 23 ESG themes. As the percentile ranking method is adopted to calculate the ESG controversies score, a higher score indicates that the firm is less socially irresponsible.
CSI = 1 − ESG controversies score
Firm performance (Tobin’s Q): We used Tobin’s Q, which combines market and accounting data, to measure firm financial performance (Price and Sun 2017; Velte 2017; Nekhili et al. 2017; Taylor et al. 2018). Tobin’s Q is the ratio of a firm’s market value to the replacement value of its assets. In our study, we used a proxy of Tobin’s Q calculated as the ratio of market capitalization and total debt to total assets.
Control variables:
We included a series of control variables to control the effect of the firm’s characteristics and governance on its financial performance. Board size (B-SIZE) was measured as the number of directors on the board. We controlled for board independence (INDEP) because board independence might influence firm performance. We measured board independence by calculating the percentage of independent directors on the board of directors (number of independent directors/total number of directors). The duality of functions of CEO and chairman of the board (DUAL) was measured by a binary variable equal to 1 if the functions of chairman of the board of directors and general manager are entrusted to a single person and 0 if not. We used auditor affiliation to the BIG4 as a measure of the reputation of the auditor (BIG4), as it acts as a mechanism to constrain earnings management. Indeed, a large audit firm has no interest in damaging its reputation by approving distorted financial statements. This results in a decrease in the asymmetry of information between the manager and the different stakeholders of the company, the improvement of the quality of the reported financial information, and, consequently, the improvement of the company’s performance. Following most previous studies on the relationship between CSR and financial performance, we controlled for firm size (F-SIZE) measured as the natural logarithm of the book value of total assets (Sun and Cui 2014; Price and Sun 2017; Velte 2017; Al-Hadi et al. 2019). This measure controls the differences in resources from which the company generates profit and funding opportunities (Dang et al. 2018; Al-Hadi et al. 2019). We also controlled for Leverage (LEV) measured as the debt-to-equity ratio. This ratio is calculated by dividing firm’s total liabilities by its market value of equity. The company’s age (AGE) was measured by the logarithmic transformation of the number of years since the creation of the company. Age and size are company characteristics that can influence its performance, as experience and accumulated knowledge increase with age. According to St-Pierre et al. (2010), size and age are not substitutable variables and have effects on firm performance. We also controlled for firm growth (GROWTH) by the growth rate of its assets. This rate is calculated as the change in book value of total assets from the previous year. The use of asset growth as a measure of growth is motivated by the findings of Cooper et al. (2008), which show that asset growth is an essential predictor of future abnormal returns. Positive asset growth reduces the change in equity returns.
3.3. Emirical Model
To test our hypothesis, we considered the following two models:
i denotes firms and t represents time periods.
Tobin’s Qit = β0 + β1 CSPit + β2 B-SIZEit + β3 INDEPit + β4 DUALit + β5 BIG4it + β6 F-SIZEit + β7 AGEit + β8 LEVit + β9 GROWTHit + εit
Tobin’s Qit = β0 + β1 CSRit + β2 CSIit + β3 B-SIZEit + β4 INDEPit + β5 DUALit + β6 BIG4it + β7 F-SIZEit + β8 AGEit + β9 LEVit + β10 GROWTHit + εit
We estimated our models using the System Generalized Method of Moments (GMM) for panel data. Our choice was motivated by several reasons. First, this method deals with reverse causality through the instrumentation of endogenous explanatory variables by their lagged values (Blundell and Bond 1998). The reliability of these instruments is tested using Sargan’s overidentification test and Arellano and Bond test for second-order (AR 2) autocorrelation in first differential errors. Second, it controls the potential impact of performance persistence (i.e., dynamic panel bias) by adding lags of each dependent variable (Roodman 2009).
4. Results
4.1. Preliminary Analysis
Table 1 illustrates the descriptive statistics. The companies in our sample are characterized by good financial performance. Their market values represent, on average, 1.12 of their book values. Similar results were found during the period 2009–2011 by Boubaker et al. (2014) for the SBF 120 companies. The authors noted an average of Tobin’s Q equal to 1.09 and a standard deviation of 0.84 with a minimum and a maximum of 0.22 and 7.86, respectively.
The average score of corporate social performance was 56.09%, with a standard deviation of 14.98%. This finding indicates the dispersion of the level of social commitment of French companies, which can be explained by the fact that French companies are only required by law to disclose ESG information in their reference documents or annual reports, but they have no commitments to fulfil. Furthermore, the average social responsibility score was 64.68%, while the irresponsibility score was 52.41%.
Boards have an average of 13 members, which indicates an expanded size of boards. A large number of directors can create agency conflicts, as it can be a factor of the diversity of resources and knowledge. Independent directors represent 51.47% of board members, which indicates that SBF 120 non-financial companies are aligned with the recommendation of the good governance code AFEP-MEDEF (33%). Moreover, CEO duality is widespread in French companies as 58.4% of our sample companies have the same person occupying the positions of chairman of the board and general manager. This last result is comparable to that of Ahmadi et al. (2018), who found that 59% of CAC 40 companies between 2011 and 2013 have CEO duality. We found that about 52% of companies appoint auditors from the Big 4 audit firms. The average size of the companies was 9.2969 (logarithm transformation of book value of total assets). The debt-to-equity ratio was around 0.87 for all the companies in our sample. The average age of the companies in our sample was 65.5 years (3.87 for logarithmic age transformation), indicating that the SBF 120 index is composed of mature companies. Finally, we note that the asset growth average was 5.87% and is characterized by high volatility (standard deviation of 12.76%).
Table 2 depicts the number of observations and descriptive statistics of key variables per industry. We preferred to use the ICB classification (industry classification/ten industries) to the SIC classification (20 sector classification) to obtain more industry observations.
We noticed that most of the firms in our sample (27%) belong to the “Industrial” sector. Moreover, the companies belonging to the “Health Care” industry are the most financially efficient. In terms of social performance, these companies are characterized by a weak commitment to good practices (CSR), but also by a low level of irresponsibility.
Companies in the “Utilities” industry had the lowest financial performance. Despite the commitment of these companies to good social practices, they had the lowest social performance score. This last finding is explained by the high average of irresponsibility score. Indeed, good social practices are offset by bad ones. As a result, companies have, on the one hand, to be careful to avoid irresponsibility and, on the other hand, to implement good practices to have better social performance. Businesses belonging to the “Consumer Services” industry had the highest CSP scores and CSR scores averages. Additionally, companies in the “Technology” industry had the lowest irresponsibility score.
Table 3 presents the matrix of correlations between the different variables of our study. We found that the correlation between the explanatory variables of the same model was not high except for the correlation between the board size and the firm size. However, the variance inflation factor (VIF) values did not exceed two. These results indicate that there was no multicollinearity problem in our case.
Regarding the correlation matrix, we noted that CSR was positively correlated with social performance. However, CSI was negatively correlated with social performance. This result indicates that good social practices increase the company’s social performance, while bad practices reduce it. We found that the CSR and CSI measures were positively correlated. This observation reveals that the more engaged in good social practices the company is, the more likely it is to have bad practices, as companies involved in bad social practices try to invest in good ones to hide irresponsibility.
Measures of good and bad social practice were positively correlated with firm size. We also noted that the size of the board and its independence were positively correlated. This finding shows that the larger the board, the more independent it is.
4.2. Estimation Results
Table 4 illustrates the regression results. We noted that CSP had no significant impact on performance. Thus, our first hypothesis on the association between CSP and firm performance (H1) was not supported by our results. One explanation comes from the multidimensional nature of CSP scores and the overlap of the different components (responsibility/irresponsibility). Furthermore, we can explain this result by balancing the use of valuable resources by investing in socially responsible activities and the profits associated with this investment. Indeed, McWilliams and Siegel (2001) estimated that the costs of social responsibility consume the profits generated, which leads to a situation of equilibrium.
The results of the estimation of the effect of CSR and CSI on firm performance showed that CSR and CSI exert opposite effects on firm performance. In particular, a higher CSR score reflecting a higher social commitment improved the company’s performance, but in a non-significant way. However, CSI had a negative and significant effect on financial performance. Accordingly, Hypothesis 2 is validated. Similar results were found by Price and Sun (2017) and Fatemi et al. (2018).
Furthermore, the results showed that the impact of CSI was stronger than that of CSR on the financial performance of the company. Indeed, we observed a negative and significant impact at the 1% threshold for CSI compared with a non-significant coefficient for CSR. These results confirm Hypothesis (H3) and are consistent with the results of Price and Sun (2017).
These results suggested that, for the French market, addressing bad social practices is more valued and has a greater impact on the financial performance of companies than the development of good social practices. This observation can be attributed to the fact that when faced with bad social practices, stakeholders react strongly and no longer appreciate the company’s good social practices, hence the need to take a closer look at the duration and strength of CSR and CSI effects.
To examine the duration of CSR and CSI effects on financial performance, we used a vector autoregressive (VAR) model designed for panel data. This method allowed for the exploration of the dynamic relationship between the variables of the panel data (Abrigo and Love 2016). These models include systems of equations that assume that the variables within each system influence each other in the time series. The results of their long-term effects are reflected by the impulse response functions (IRF). The IRFs show the magnitude of the change that one variable will have as a function of the change (one standard deviation) of another variable.
This elasticity can be visualized to illustrate the direction and strength of the relationship. To this end, we first determined the number of lags to be performed based on the three model selection criteria by Andrews and Lu (2001). Indeed, the VAR analysis for panel data is based on the choice of the optimal lag order in the model specification. Andrews and Lu (2001) proposed selection criteria analogous to the various criteria for selecting models based on the commonly used maximum likelihood, namely the Akaike information criteria (AIC) (Akaike 1969, 1981), the Bayesian Information Criteria (BIC) (Schwarz 1978; Akaike 1977), and the Hannan-Quinn Information Criteria (HQIC) (Hannan and Quinn 1979). For these different criteria, the rule is to select the model for which this criterion is minimal. For our study, the first-order VAR was the selected model because it has the smallest MBIC, MAIC, and MQIC.
Then, based on the selection criteria, we used a GMM method for VAR model to estimate the equations using the lagged terms as instruments. This method uses a Helmert transformation on variables by default. Table 5 presents the results of the estimation by the VAR model.
Taking into account the dynamic nature of the effects of CSR and CSI, the impact of CSR became significant at the 10% level. CSI had a negative and significant impact at the 5% level.
Before evaluating the impulse response functions (IRF) and forecast error variance decomposition (FEVD), we first checked the stability condition of the estimated panel VAR. The resulting table and the graph of eigenvalues confirmed that the estimate was stable.
The long-term effect was then demonstrated by generating IRFs from the system. We calculated the significance intervals of the elasticity estimators using a 1000-fold Monte-Carlo simulation. This analysis aimed to determine the significance of the effects of CSR and CSI over a 10-year forecast period. Table 6 shows the results of the forecast error variance decomposition.
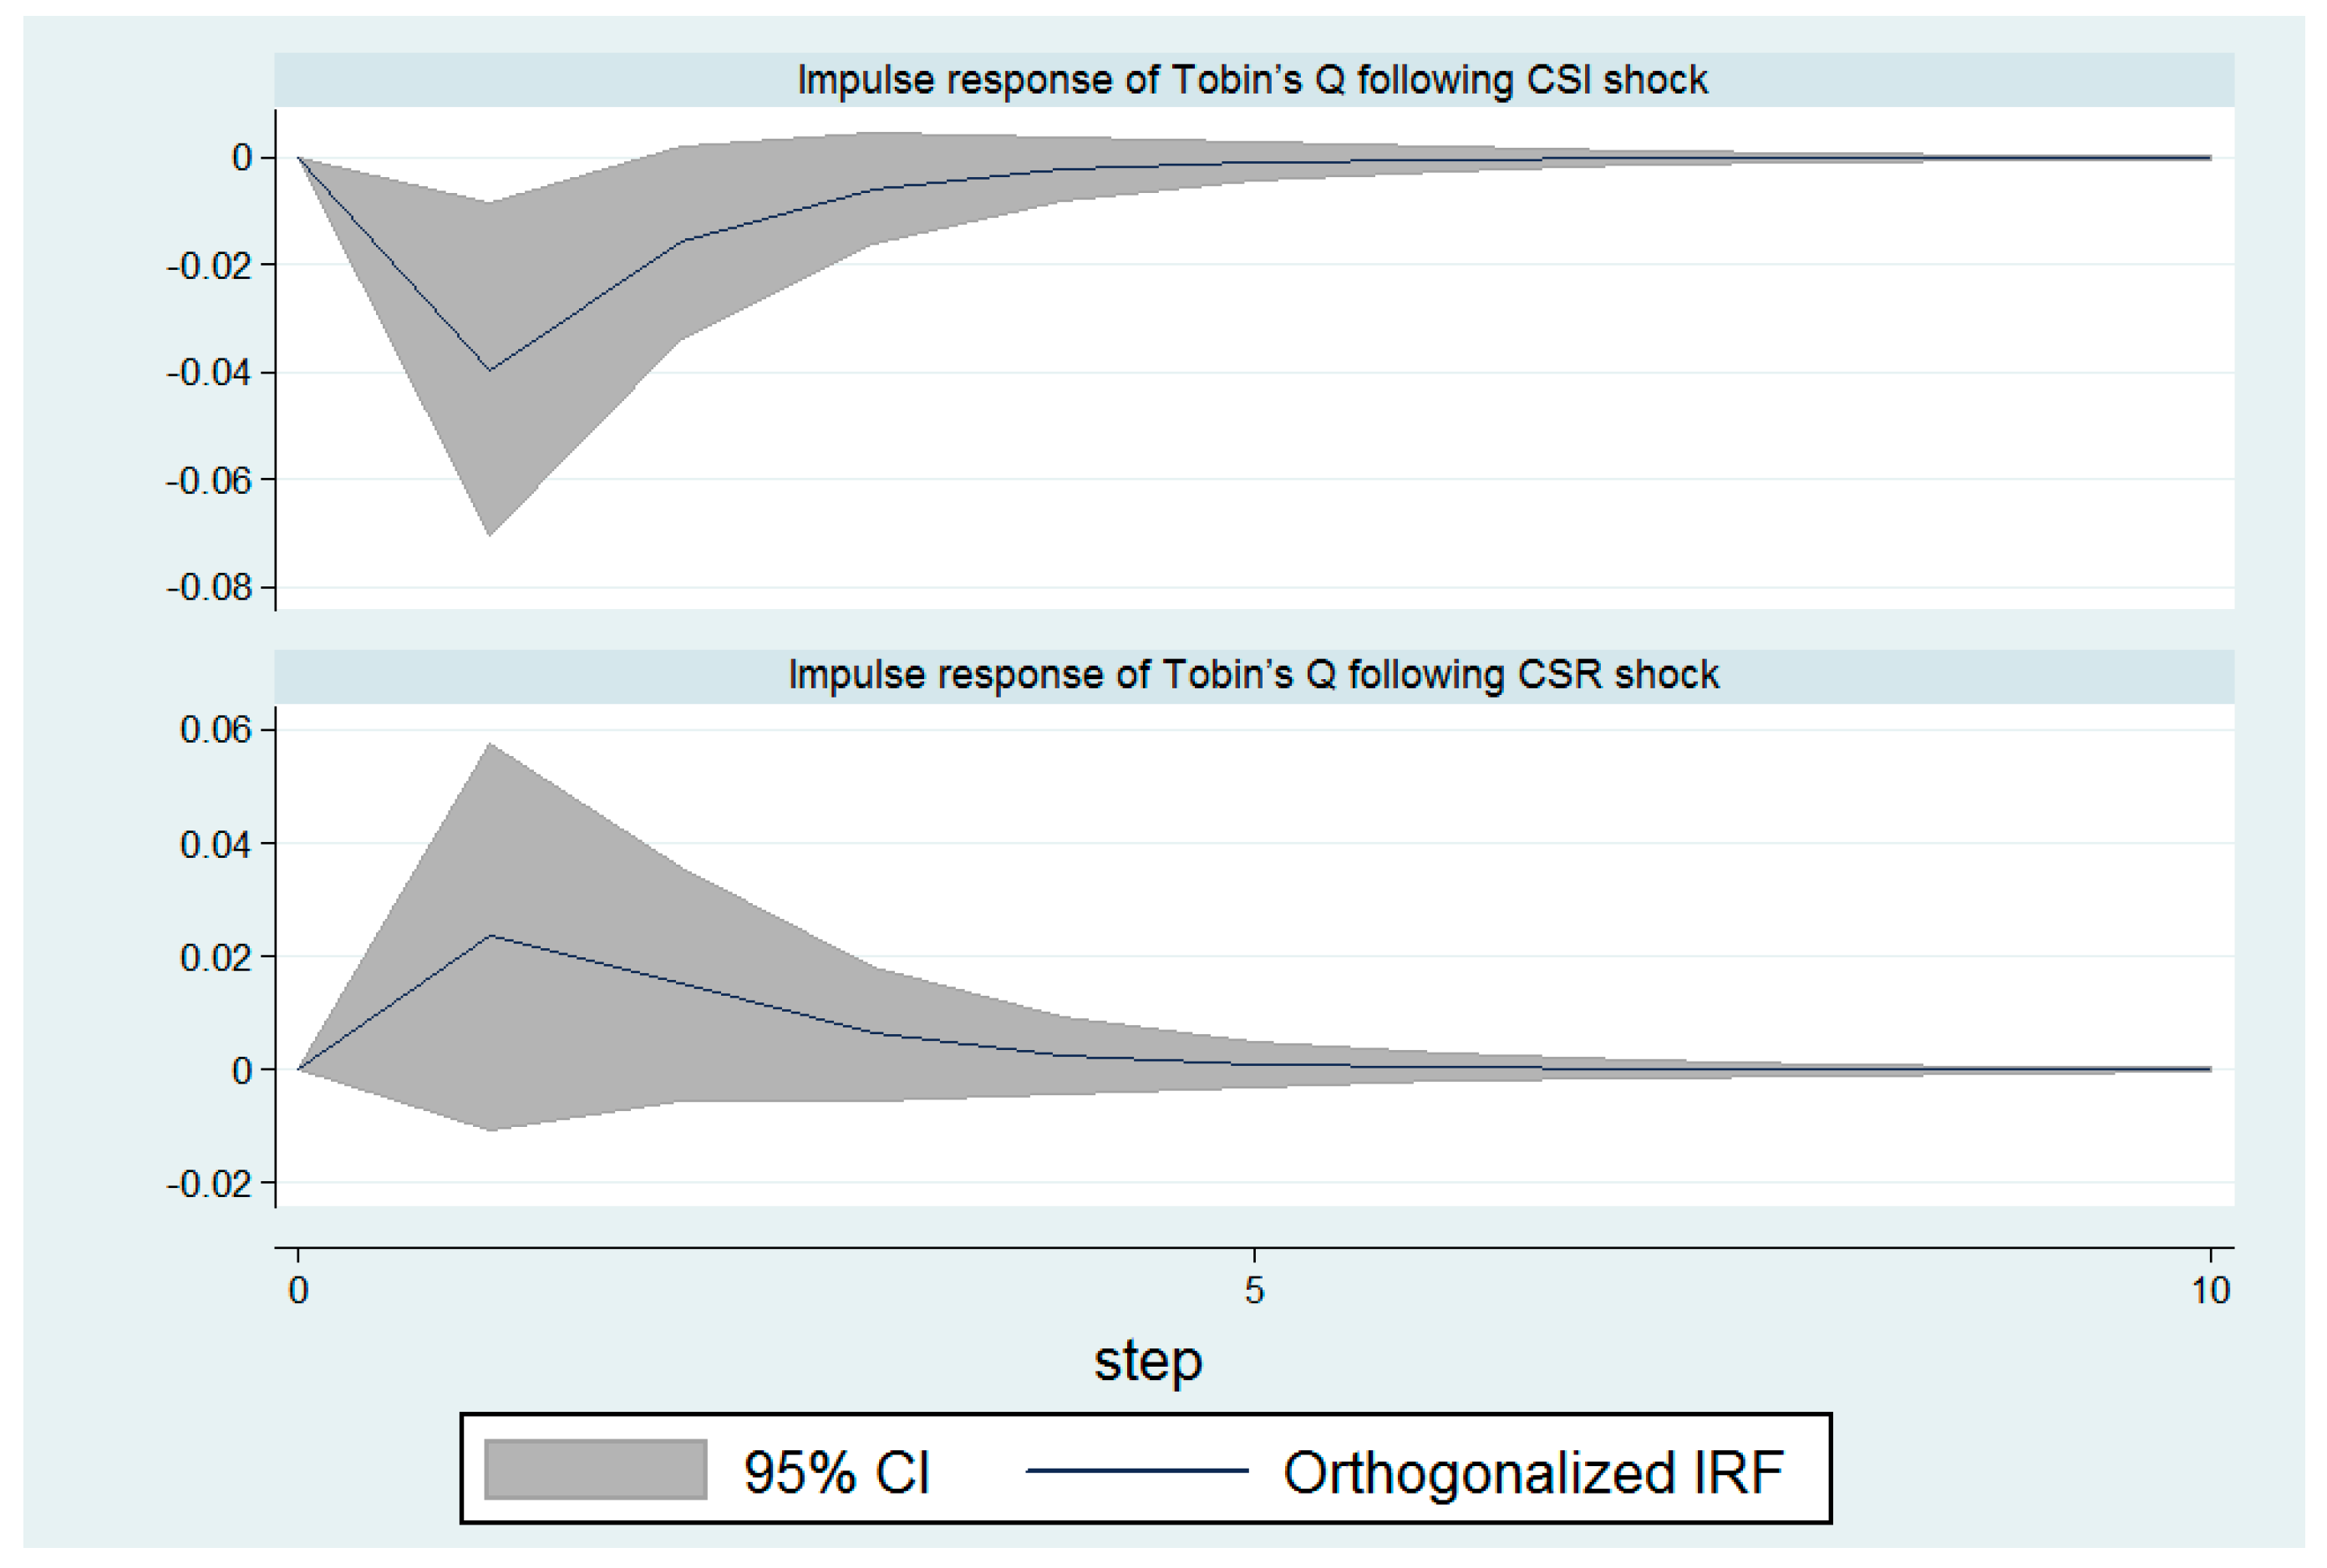
Following the FEVD estimates, we can see that the variation in financial performance measurement was explained by CSI up to three times more than CSR over the 2nd forecast period. This gap narrowed and stabilized as of the 3rd period, from which CSI exerted a double effect on the financial performance of companies compared with CSR. Nonetheless, we noticed that the effect of a CSI shock lasted longer than a CSR shock. Indeed, the impact of CSR was established from the 4th period, while the impact of CSI only stabilized from the 5th period; thus, our Hypothesis 4 was confirmed. More germane to this study is the reaction of stakeholders to CSI reflected in the financial performance of firms. We found that financial performance decreased more after CSI shocks than increased after CSR investment, in absolute value. This is consistent with the prediction of the stakeholder’s theory and psychology literature.
As can be seen in Figure 1, the effects of CSR and CSI were best reflected when we assumed that the impacts of the two components of CSP were not instantaneous and lasted over time. Based on these results, we can conclude that CSI not only produces a much stronger effect than CSR, but also has a more persistent effect. This finding adds to the stakeholder theory that it is crucial to avoid CSI practices to satisfy stakeholders. The stakeholders’ disappointment following a negative event has a stronger impact that lasts longer than their satisfaction following a positive event on financial performance. Indeed, irresponsible behavior persists more than responsible behavior in the memory of stakeholders.
Our findings may be explained from the following three aspects:
First, the media tend to pay more attention to negative news rather than to positive ones. In particular, firms are supposed to behave ethically, and thus CSI practices attract media agencies (Sun and Ding 2021). Hence, CSI practices will be widespread among stakeholders and will affect the analyst recommendations and investors and consumers’ perceptions, and therefore firm performance and value (Luo et al. 2010).
Second, board characteristics, as a governance mechanism, may help to understand the opposite effects of CSR and CSI on CFP. In fact, many board characteristics impact the quality of CSR engagement. For example, a better CSR use associated with better performance is detected in larger and more experienced boards, as well as those with more independent directors (Pekovic and Vogt 2021; Rossi et al. 2021). Likewise, board gender diversity was shown to exert a greater impact on avoiding CSI than on investing in CSR (Boulouta 2013; Boukattaya and Omri 2021).
Third, CSR and CSI practices vary significantly depending on the company’s industry. In fact, firms belonging to high competition intensity industries are particularly focused on maximizing competitive advantages and minimizing disadvantages because the latter will deteriorate firm reputation and decrease the brand equity and the firm value (Sun and Ding 2021).
5. Conclusions
In line with the proliferation of initiatives related to CSR in the world and in France in particular, this study enriches the debate on the role of corporate social practices in enhancing firm performance. Specially, this research aimed to analyze the relationship between CSP and the financial performance of French listed companies taking into account corporate social irresponsibility. It provided different contributions. First, this work extends previous literature (Price and Sun 2017; Blasi et al. 2018) on the relationship between CSP and CFP, showing that corporate social commitment varies according to the industry in which the firm operates.
Second, this study improves the understanding of the CSP-CFP relationship. Prior studies that used an aggregate measure of CSP (Brammer et al. 2006; Fatemi et al. 2015; Nollet et al. 2016; Goel and Misra 2017; Sroufe and Gopalakrishna-Remani 2019) have found mixed results. This study combined the influence of CSR and CSI practices on firm financial performance. Specifically, this study provided evidence that CSR and CSI exert opposite effects on financial performance. By the estimation of the VAR model for panel data, we could spot that the CSI had a greater and more lasting impact than CSR on financial performance. In short, the relationship between social and financial performance depends on the practices considered.
Our results have theoretical and practical implications. Indeed, we extended the stakeholder theory by integrating CSI into the analysis of the relationship between social and financial performance. The existence of CSI could compromise CSR, which could explain the controversial results for the relationship between CSP and CFP (Mishra and Modi 2013). In practice, our results provided information on the differences between the effects of CSR and CSI on CFP. Policy makers and managers need to understand the larger and more durable influence of the CSI and be primarily attentive to potential incidents.
This study presents some limitations that have to be considered in future research. First, the study relied on Asset 4 data for the CSR and CSI measures. Although sub-scores for different CSR areas (ESG pillars) exist in the Asset 4 data, the database does not provide CSI sub-scores. There is only one global CSI score which groups together concerns in different environmental, social, or governance areas. The dimensions of CSR and CSI must be defined to better understand which areas guide the relationship with the financial performance of the company. The importance of these different areas varies for the different stakeholders, such as employee, shareholders, customers, and suppliers. Second, the impact of CSR and CSI on firm financial performance could be influenced by many factors that we did not consider in our study, such as the reputation, research and development intensity, and innovation. Future research could investigate the mediating or moderating mechanisms through which CSR and CSI affect the firm performance.
Author Contributions
S.B. designed the research, collected and analyzed data, and wrote the manuscript, and A.O. supervised and revised the research and paper. Both authors have read and agreed to the published version of the manuscript.
Funding
This research received no external funding.
Data Availability Statement
No new data were created or analyzed in this study. Data sharing is not applicable to this article.
Conflicts of Interest
The authors declare no conflict of interest.
References
- Abrigo, Michael RM, and Inessa Love. 2016. Estimation of panel vector autoregression in Stata. Stata Journal 16: 778–804. [Google Scholar] [CrossRef] [Green Version]
- Ahmadi, Ali, Nejia Nakaa, and Abdelfettah Bouri. 2018. Chief Executive Officer attributes, board structures, gender diversity and firm performance among French CAC 40 listed firms. Research in International Business and Finance 44: 218–26. [Google Scholar] [CrossRef]
- Akaike, Hirotugu. 1969. Fitting autoregressive models for prediction. Annals of the Institute of Statistical Mathematics 21: 243–47. [Google Scholar] [CrossRef]
- Akaike, Hirotugu. 1977. An objective use of Bayesian models. Annals of the Institute of Statistical Mathematics 29: 9–20. [Google Scholar] [CrossRef]
- Akaike, Hirotugu. 1981. Likelihood of a model and information criteria. Journal of Econometrics 16: 3–14. [Google Scholar] [CrossRef]
- Al-Hadi, Ahmed, Bikram Chatterjee, Ali Yaftian, Grantley Taylor, and Mostafa Monzur Hasan. 2019. Corporate social responsibility performance, financial distress and firm life cycle: Evidence from Australia. Accounting & Finance 59: 961–89. [Google Scholar] [CrossRef]
- Andrews, Donald WK, and Biao Lu. 2001. Consistent model and moment selection procedures for GMM estimation with application to dynamic panel data models. Journal of Econometrics 101: 123–64. [Google Scholar] [CrossRef]
- Armstrong, J. Scott. 1977. Social Irresponsibility in Management. Journal of Business Research 5: 185–213. [Google Scholar] [CrossRef] [Green Version]
- Ayadi, Mohamed, Martin. I. Kusy, Minyoung Pyo, and Samir Trabelsi. 2015. Corporate social responsibility, corporate governance, and managerial risk-taking. Journal of Theoretical Accounting Research 11: 50–113. [Google Scholar] [CrossRef]
- Barnea, Amir, and Amir Rubin. 2010. Corporate social responsibility as a conflict between shareholders. Journal of Business Ethics 97: 71–86. [Google Scholar] [CrossRef]
- Baron, David P., Maretno Agus Harjoto, and Hoje Jo. 2011. The economics and politics of corporate social performance. Business and Politics 13: 1–46. [Google Scholar] [CrossRef] [Green Version]
- Blasi, Silvia, Massimiliano Caporin, and Fulvio Fontini. 2018. A Multidimensional Analysis of the Relationship Between Corporate Social Responsibility and Firms’ Economic Performance. Ecological Economics 147: 218–29. [Google Scholar] [CrossRef]
- Blundell, Richard, and Stephen Bond. 1998. Initial conditions and moment restrictions in dynamic panel data models. Journal of Econometrics 87: 115–43. [Google Scholar] [CrossRef] [Green Version]
- Boubaker, Sabri, Alexis Cellier, Riadh Manita, and Asif Saeed. 2020. Does corporate social responsibility reduce financial distress risk? Economic Modelling 91: 835–51. [Google Scholar] [CrossRef]
- Boubaker, Sabri, Rey Dang, and Duc Khuong Nguyen. 2014. Does board gender diversity improve the performance of French listed firms? Gestion 2000 31: 259–69. [Google Scholar] [CrossRef]
- Boukattaya, Sonia, and Abdelwahed Omri. 2021. Impact of Board Gender Diversity on Corporate Social Responsibility and Irresponsibility: Empirical Evidence from France. Sustainability 13: 4712. [Google Scholar] [CrossRef]
- Boulouta, Ioanna. 2013. Hidden connections: The link between board gender diversity and corporate social performance. Journal of Business Ethics 113: 185–97. [Google Scholar] [CrossRef]
- Brammer, Stephen, Chris Brooks, and Stephen Pavelin. 2006. Corporate social performance and stock returns: UK evidence from disaggregate measures. Financial Management 35: 97–116. [Google Scholar] [CrossRef] [Green Version]
- Cheng, Beiting, Ioannis Ioannou, and George Serafeim. 2014. Corporate social responsibility and access to finance. Strategic Management Journal 35: 1–23. [Google Scholar] [CrossRef]
- Činčalová, Simona, and Veronika Hedija. 2020. Firm Characteristics and Corporate Social Responsibility: The Case of Czech Transportation and Storage Industry. Sustainability 12: 1992. [Google Scholar] [CrossRef] [Green Version]
- Clarkson, Max E. 1995. A stakeholder framework for analyzing and evaluating corporate social performance. Academy of Management Review 20: 92–117. [Google Scholar] [CrossRef]
- Cooper, Michael J., Huseyin Gulen, and Michael J. Schill. 2008. Asset growth and the cross-section of stock returns. Journal of Finance 63: 1609–51. [Google Scholar] [CrossRef]
- Cui, Jinhua, Hoje Jo, and Haejung Na. 2018. Does corporate social responsibility affect information asymmetry? Journal of Business Ethics 148: 549–72. [Google Scholar] [CrossRef]
- Dang, Chongyu, Zhichuan Frank Li, and Chen Yang. 2018. Measuring firm size in empirical corporate finance. Journal of Banking & Finance 86: 159–76. [Google Scholar] [CrossRef]
- Dhaliwal, Dan S., Suresh Radhakrishnan, Albert Tsang, and Yong George Yang. 2012. Nonfinancial disclosure and analyst forecast accuracy: International evidence on corporate social responsibility disclosure. The Accounting Review 87: 723–59. [Google Scholar] [CrossRef]
- Eccles, Robert G., and George Serafeim. 2013. A tale of two stories: Sustainability and the quarterly earnings call. Journal of Applied Corporate Finance 25: 8–19. [Google Scholar] [CrossRef]
- El Ghoul, Sadok, Omrane Guedhami, and Yongtae Kim. 2017. Country-level institutions, firm value, and the role of corporate social responsibility initiatives. Journal of International Business Studies 48: 360–85. [Google Scholar] [CrossRef] [Green Version]
- El Ghoul, Sadok, Omrane Guedhami, Chuck C. Kwok, and Dev R. Mishra. 2011. Does corporate social responsibility affect the cost of capital? Journal of Banking & Finance 35: 2388–406. [Google Scholar] [CrossRef]
- Fatemi, Ali, Iraj Fooladi, and Hassan Tehranian. 2015. Valuation effects of corporate social responsibility. Journal of Banking & Finance 59: 182–92. [Google Scholar] [CrossRef]
- Fatemi, Ali, Martin Glaum, and Stefanie Kaiser. 2018. ESG performance and firm value: The moderating role of disclosure. Global Finance Journal 38: 45–64. [Google Scholar] [CrossRef]
- Freeman, R. Edward. 1984. Strategic Management: A Stakeholder Approach. Pitman Series in Business and Public Policy. Boston: Pitman, p. 276. [Google Scholar]
- Friedman, Milton. 1970. The social responsibility of business is to increase profit. The New York Times Magazine, September 13, 32–33. [Google Scholar]
- Frooman, Jeff. 1997. Socially irresponsible and illegal behavior and shareholder wealth a meta-analysis of event studies. Business & Society 36: 221–49. [Google Scholar] [CrossRef]
- Frooman, Jeff. 1999. Stakeholder influence strategies. Academy of Management Review 24: 191–205. [Google Scholar] [CrossRef]
- Galant, Adriana, and Simon Cadez. 2017. Corporate social responsibility and financial performance relationship: A review of measurement approaches. Economic Research-Ekonomska Istraživanja 30: 676–93. [Google Scholar] [CrossRef]
- Goel, Puneeta, and Rupali Misra. 2017. Sustainability Reporting in India: Exploring Sectoral Differences and Linkages with Financial Performance. Vision-The Journal of Business Perspective 21: 214–24. [Google Scholar] [CrossRef]
- Goss, Allen, and Gordon S. Roberts. 2011. The impact of corporate social responsibility on the cost of bank loans. Journal of Banking & Finance 35: 1794–810. [Google Scholar] [CrossRef]
- Gregory-Smith, Ian, Brian GM Main, and Charles A. O’Reilly III. 2014. Appointments, pay and performance in UK boardrooms by gender. The Economic Journal 124: F109–F28. [Google Scholar] [CrossRef] [Green Version]
- Hannan, Edward J., and Barry G. Quinn. 1979. The determination of the order of an autoregression. Journal of the Royal Statistical Society. Series B (Methodological) 41: 190–95. [Google Scholar] [CrossRef]
- Harjoto, Maretno, and Indrarini Laksmana. 2018. The impact of corporate social responsibility on risk taking and firm value. Journal of Business Ethics 151: 353–73. [Google Scholar] [CrossRef]
- Hill, Charles WL, and Thomas M. Jones. 1992. Stakeholder-agency theory. Journal of Management Studies 29: 131–54. [Google Scholar] [CrossRef]
- Hong, Harrison, and Marcin Kacperczyk. 2009. The price of sin: The effects of social norms on markets. Journal of Financial Economics 93: 15–36. [Google Scholar] [CrossRef]
- Hunjra, Ahmed Imran, Sabri Boubaker, Murugesh Arunachalam, and Asad Mehmood. 2021. How does CSR mediate the relationship between culture, religiosity and firm performance? Finance Research Letters 39: 101587. [Google Scholar] [CrossRef]
- Ioannou, Ioannis, and George Serafeim. 2015. The impact of corporate social responsibility on investment recommendations: Analysts’ perceptions and shifting institutional logics. Strategic Management Journal 36: 1053–81. [Google Scholar] [CrossRef] [Green Version]
- Jahmane, Abderrahmane, and Brahim Gaies. 2020. Corporate social responsibility, financial instability and corporate financial performance: Linear, non-linear and spillover effects—The case of the CAC 40 companies. Finance Research Letters 34: 101483. [Google Scholar] [CrossRef]
- Jensen, Michael. 2001. Value maximisation, stakeholder theory, and the corporate objective function. European Financial Management 7: 297–317. [Google Scholar] [CrossRef] [Green Version]
- Jo, Hoje, and Haejung Na. 2012. Does CSR reduce firm risk? Evidence from controversial industry sectors. Journal of Business Ethics 110: 441–56. [Google Scholar] [CrossRef]
- Jo, Hoje, and Maretno A. Harjoto. 2012. The causal effect of corporate governance on corporate social responsibility. Journal of Business Ethics 106: 53–72. [Google Scholar] [CrossRef]
- Jones, Thomas M. 1995. Instrumental stakeholder theory: A synthesis of ethics and economics. Academy of Management Review 20: 404–37. [Google Scholar] [CrossRef]
- Kanouse, David E., and L. Reid Hanson Jr. 1972. Negativity in evaluations. In Attribution: Perceiving the Causes of Behavior. Edited by Edward E. Jones, David E. Kanouse, Harold H. Kelley, Richard E. Nisbett, Stuart Valins and Bernard Weiner. Morristown: General Learning Press, pp. 47–62. [Google Scholar] [CrossRef]
- Li, Zhichuan, Dylan B. Minor, Jun Wang, and Chong Yu. 2019. A learning curve of the market: Chasing alpha of socially responsible firms. Journal of Economic Dynamics and Control 109: 103772. [Google Scholar] [CrossRef]
- Lin-Hi, Nick, and Karsten Müller. 2013. The CSR bottom line: Preventing corporate social irresponsibility. Journal of Business Research 66: 1928–36. [Google Scholar] [CrossRef]
- Lu, Weisheng, K. W. Chau, Hongdi Wang, and Wei Pan. 2014. A decade’s debate on the nexus between corporate social and corporate financial performance: A critical review of empirical studies 2002–2011. Journal of Cleaner Production 79: 195–206. [Google Scholar] [CrossRef] [Green Version]
- Luo, Xueming, Christian Homburg, and Jan Wieseke. 2010. Customer satisfaction, analyst stock recommendations, and firm value. Journal of Marketing Research 47: 1041–58. [Google Scholar] [CrossRef]
- Lyon, Thomas, Yao Lu, Xinzheng Shi, and Qie Yin. 2013. How do investors respond to Green Company Awards in China? Ecological Economics 94: 1–8. [Google Scholar] [CrossRef]
- Maqbool, Shafat, and M. Nasir Zameer. 2018. Corporate social responsibility and financial performance: An empirical analysis of Indian banks. Future Business Journal 4: 84–93. [Google Scholar] [CrossRef]
- Mason, Chris, and John Simmons. 2014. Embedding corporate social responsibility in corporate governance: A stakeholder systems approach. Journal of Business Ethics 119: 77–86. [Google Scholar] [CrossRef]
- McWilliams, Abagail, and Donald Siegel. 2001. Corporate social responsibility: A theory of the firm perspective. Academy of Management Review 26: 117–27. [Google Scholar] [CrossRef]
- Mishra, Saurabh, and Sachin B. Modi. 2013. Positive and negative corporate social responsibility, financial leverage, and idiosyncratic risk. Journal of Business Ethics 117: 431–48. [Google Scholar] [CrossRef]
- Nekhili, Mehdi, Haithem Nagati, Tawhid Chtioui, and Claudia Rebolledo. 2017. Corporate social responsibility disclosure and market value: Family versus nonfamily firms. Journal of Business Research 77: 41–52. [Google Scholar] [CrossRef]
- Nguyen, Pascal, and Anna Nguyen. 2015. The effect of corporate social responsibility on firm risk. Social Responsibility Journal 11: 324–39. [Google Scholar] [CrossRef]
- Nollet, Joscha, George Filis, and Evangelos Mitrokostas. 2016. Corporate social responsibility and financial performance: A non-linear and disaggregated approach. Economic Modelling 52: 400–7. [Google Scholar] [CrossRef] [Green Version]
- Oikonomou, Ioannis, Chris Brooks, and Stephen Pavelin. 2012. The impact of corporate social performance on financial risk and utility: A longitudinal analysis. Financial Management 41: 483–515. [Google Scholar] [CrossRef] [Green Version]
- Oikonomou, Ioannis, Chris Brooks, and Stephen Pavelin. 2014. The financial effects of uniform and mixed corporate social performance. Journal of Management Studies 51: 898–925. [Google Scholar] [CrossRef]
- Okafor, Anthony, Michael Adusei, and Bosede Ngozi Adeleye. 2021. Corporate social responsibility and financial performance: Evidence from US tech firms. Journal of Cleaner Production 292: 126078. [Google Scholar] [CrossRef]
- Pekovic, Sanja, and Sebastian Vogt. 2021. The fit between corporate social responsibility and corporate governance: The impact on a firm’s financial performance. Review of Managerial Science 15: 1095–125. [Google Scholar] [CrossRef]
- Price, Joseph M., and Wenbin Sun. 2017. Doing good and doing bad: The impact of corporate social responsibility and irresponsibility on firm performance. Journal of Business Research 80: 82–97. [Google Scholar] [CrossRef]
- Ramzan, Muhammad, Muhammad Amin, and Muhammad Abbas. 2021. How does corporate social responsibility affect financial performance, financial stability, and financial inclusion in the banking sector? Evidence from Pakistan. Research in International Business and Finance 55: 101314. [Google Scholar] [CrossRef]
- Reverte, Carmelo, Eduardo Gomez-Melero, and Juan Gabriel Cegarra-Navarro. 2016. The influence of corporate social responsibility practices on organizational performance: Evidence from Eco-Responsible Spanish firms. Journal of Cleaner Production 112: 2870–84. [Google Scholar] [CrossRef]
- Roodman, David. 2009. How to do xtabond2: An introduction to difference and system. gmm in stata. The Stata Journal 9: 86–136. [Google Scholar] [CrossRef] [Green Version]
- Rossi, Matteo, Jamel Chouaibi, Salim Chouaibi, Wafa Jilani, and Yamina Chouaibi. 2021. Does a Board Characteristic Moderate the Relationship between CSR Practices and Financial Performance? Evidence from European ESG Firms. Journal of Risk and Financial Management 14: 354. [Google Scholar] [CrossRef]
- Schwarz, Gideon. 1978. Estimating the dimension of a model. The Annals of Statistics 6: 461–64. [Google Scholar] [CrossRef]
- Sroufe, Robert, and Venugopal Gopalakrishna-Remani. 2019. Management, social sustainability, reputation, and financial performance relationships: An empirical examination of US firms. Organization & Environment 32: 331–62. [Google Scholar] [CrossRef] [Green Version]
- St-Pierre, Josée, Pierre-André Julien, and Martin Morin. 2010. L’effet de l’âge et de la taille sur la performance financière et économique des PME. Journal of Small Business & Entrepreneurship 23: 287–306. [Google Scholar] [CrossRef]
- Sun, Wenbin, and Kexiu Cui. 2014. Linking corporate social responsibility to firm default risk. European Management Journal 32: 275–87. [Google Scholar] [CrossRef]
- Sun, Wenbin, and Zhihua Ding. 2021. Is doing bad always punished? A moderated longitudinal analysis on corporate social irresponsibility and firm value. Business & Society 60: 1811–48. [Google Scholar] [CrossRef]
- Sweetin, Vernon H., Lynette L. Knowles, John H. Summey, and Kand S. McQueen. 2013. Willingness-topunish the corporate brand for corporate social irresponsibility. Journal of Business Research 66: 1822–30. [Google Scholar] [CrossRef]
- Taylor, Joseph, Joseph Vithayathil, and Dobin Yim. 2018. Are corporate social responsibility (CSR) initiatives such as sustainable development and environmental policies value enhancing or window dressing? Corporate Social Responsibility and Environmental Management 25: 971–80. [Google Scholar] [CrossRef]
- Van Marrewijk, Marcel. 2003. Concepts and definitions of CSR and corporate sustainability: Between agency and communion. Journal of Business Ethics 44: 95–105. [Google Scholar] [CrossRef]
- Veitch, Russell, and William Griffitt. 1976. Good news-bad news: Affective and interpersonal effects. Journal of Applied Social Psychology 6: 69–75. [Google Scholar] [CrossRef]
- Velte, Patrick. 2017. Does ESG performance have an impact on financial performance? Evidence from Germany. Journal of Global Responsibility 8: 169–78. [Google Scholar] [CrossRef]
- Wang, Zhihong, and Joseph Sarkis. 2017. Corporate social responsibility governance, outcomes, and financial performance. Journal of Cleaner Production 162: 1607–16. [Google Scholar] [CrossRef]
- Weber, Olaf. 2017. Corporate sustainability and financial performance of Chinese banks. Sustainability Accounting, Management and Policy Journal 8: 358–85. [Google Scholar] [CrossRef] [Green Version]
- Yang, Shou-Lin. 2016. Corporate social responsibility and an enterprise’s operational efficiency: Considering competitor’s strategies and the perspectives of long-term engagement. Quality & Quantity 50: 2553–69. [Google Scholar] [CrossRef]
Figure 1.
Impulse response of Tobin’s Q following CSR and CSI shocks. Tobin’s Q is the dependent variable, measured as the ratio of market capitalization and total debt to total assets; CSR is the ESG score extracted from ASSET 4 database; CSI is measured as 1-ESG controversies score available on the ASSET 4 database.


Table 1.
Descriptive statistics of key variables.
| Variables | N | Mean | Standard Deviation | First Quartile | Median | Third Quartile | Minimum | Maximum |
|---|---|---|---|---|---|---|---|---|
| Tobin’s Q | 486 | 1.1224 | 0.8884 | 0636 | 0.89 | 1.338 | 0.254 | 7.86 |
| CSP | 486 | 0.5609 | 0.1498 | 0.44 | 0.56 | 0.68 | 0.22 | 0.92 |
| CSR | 486 | 0.6468 | 0.1324 | 0.57 | 0.65 | 0.75 | 0.25 | 0.92 |
| CSI | 486 | 0.5241 | 0.2274 | 0.37 | 0.41 | 0.79 | 0.08 | 1 |
| B-SIZE | 486 | 13.265 | 3.52 | 11 | 13 | 16 | 5 | 26 |
| INDEP | 486 | 0.5147 | 0.1928 | 0.39 | 0.47 | 0.64 | 0.07 | 1 |
| DUAL | 486 | 0.5844 | 0.4933 | 0 | 1 | 1 | 0 | 1 |
| BIG4 | 486 | 0.5185 | 0.5002 | 0 | 1 | 1 | 0 | 1 |
| F-SIZE | 486 | 9.297 | 1.316 | 8.34 | 9.08 | 10.28 | 6.53 | 12.54 |
| AGE | 486 | 3.871 | 0.8553 | 3.3 | 3.81 | 4.5 | 0 | 5.24 |
| LEV | 486 | 0.8736 | 1.2036 | 0.331 | 0.6355 | 1.129 | −5.061 | 11 |
| GROWTH | 486 | 0.0587 | 0.1276 | 0 | 0.04 | 0.1 | −0.59 | 0.74 |
The full sample consists of 486 French firm-year observations for the period 2011 to 2016. Financial firms are excluded. Tobin’s Q is the dependent variable, measured as the ratio of market capitalization and total debt to total assets; CSP is the ESG combined score extracted from ASSET 4 database; CSR is the ESG score extracted from ASSET 4 database; CSI is measured as 1-ESG controversies score available on ASSET 4 database; B-SIZE is the number of board members; INDEP is the proportion of independent directors on the board; DUAL is a dummy variable that takes the value of 1 if the CEO is also the chairman of the board and 0 otherwise; BIG4 is a dummy variable that takes 1 when the firm is audited by two BIG4 and 0 otherwise; F-SIZE is the natural logarithm of total assets; AGE is the natural logarithm of the number of years since the creation of the company; LEV is the debt-to-equity ratio and GROWTH is the growth rate of its assets.
Table 2.
Descriptive statistics by industry.
| ICB Code | Industry | Firms Number | Percentage of Firms | Tobin’s Q | CSP | CSR | CSI |
|---|---|---|---|---|---|---|---|
| 0001 | Oil & Gas | 4 | 4.9% | 0.8108 | 51.17% | 60.42% | 51.75% |
| 1000 | Basic Materials | 4 | 4.9% | 1.0423 | 55.83% | 63.33% | 53.5% |
| 2000 | Industrials | 22 | 27.2% | 0.9614 | 57.24% | 63.47% | 49.30% |
| 3000 | Consumer Goods | 16 | 19.8% | 1.5862 | 54.75% | 65.70% | 56.41% |
| 4000 | Health Care | 5 | 6.2% | 1.6117 | 52.03% | 59.63% | 48% |
| 5000 | Consumer services | 17 | 21% | 0.8829 | 59.86% | 68.82% | 52.52% |
| 6000 | Telecommunications | 1 | 1.2% | 0.7933 | 42.67% | 72.67% | 87% |
| 7000 | Utilities | 5 | 6.2% | 0.6399 | 49.77% | 66.33% | 69.5% |
| 9000 | Technology | 7 | 8.6% | 1.41581 | 58.64% | 60.62% | 43.79% |
| Total | 81 | 100% | 1.1224 | 56.09% | 64.58% | 52.41% | |
Tobin’s Q is the dependent variable, measured as the ratio of market capitalization and total debt to total assets; CSR is the ESG score extracted from ASSET 4 database; CSI is measured as 1-ESG controversies score available on ASSET 4 database.
Table 3.
Pearson correlation matrix.
| Variables | 1 | 2 | 3 | 4 | 5 | 6 | 7 | 8 | 9 | 10 | 11 | 12 |
|---|---|---|---|---|---|---|---|---|---|---|---|---|
| 1. Tobin’s Q | 1 | |||||||||||
| 2. CSP | 0.0337 | 1 | ||||||||||
| 3. CSR | −0.1013 ** | 0.5325 *** | 1 | |||||||||
| 4. CSI | −0.1978 *** | −0.2950 *** | 0.2709 *** | 1 | ||||||||
| 5. B-SIZE | −0.2056 *** | −0.1273 *** | 0.2304 *** | 0.3012 *** | 1 | |||||||
| 6. INDEP | −0.0851 * | 0.1916 *** | 0.2796 *** | 0.0393 | −0.2751 *** | 1 | ||||||
| 7. DUAL | −0.2062 *** | −0.1273 *** | −0.0325 | −0.0506 | 0.2899 *** | −0.1840 *** | 1 | |||||
| 8. BIG4 | −0.1392 *** | 0.1224 *** | 0.4190 *** | 0.2165 *** | 0.2047 *** | 0.0249 | 0.1315 *** | 1 | ||||
| 9. F-SIZE | −0.2858 *** | −0.0620 | 0.4665 *** | 0.4243 *** | 0.6225 *** | −0.0016 | 0.1621 *** | 0.3135 *** | 1 | |||
| 10. AGE | 0.1658 *** | 0.0704 | 0.1215 *** | −0.0653 | 0.0894 ** | −0.0529 | 0.0203 | −0.0251 | 0.1883 *** | 1 | ||
| 11. LEV | −0.1938 *** | 0.0104 | 0.0751 * | 0.0458 | 0.0628 | 0.0173 | −0.0063 | 0.0339 | 0.1898 *** | 0.0302 | 1 | |
| 12. GROWTH | 0.2012 *** | −0.0455 | −0.1920 *** | −0.1096 ** | −0.0996 ** | −0.0082 | 0.0108 | −0.1154 ** | −0.1056 ** | 0.0495 | 0.0035 | 1 |
Tobin’s Q is the dependent variable, measured as the ratio of market capitalization and total debt to total assets; CSP is the ESG combined score extracted from ASSET 4 database; CSR is the ESG score extracted from ASSET 4 database; CSI is measured as 1-ESG controversies score available on ASSET 4 database; B-SIZE is the number of board members on boards; INDEP is the proportion of independent directors on the board; DUAL is a dummy variable that takes the value of 1 if the CEO is also the chairman of the board and 0 otherwise; BIG4 is a dummy variable that takes 1 when the firm is audited by two BIG4 and 0 otherwise; F-SIZE is the natural logarithm of total assets; AGE is the natural logarithm of the number of years since the creation of the company; LEV is the debt-to-equity ratio and GROWTH is the growth rate of its assets. *, **, *** represent the significance level of 10%, 5%, and 1%, respectively.
Table 4.
System GMM regression.
| Variables | Equation (1) | Equation (2) | ||
|---|---|---|---|---|
| Coefficient | P > ∣z∣ | Coefficient | P > ∣z∣ | |
| Tobin’s Qt−1 | 0.3856 *** | 0.000 | 0.3887 | 0.000 |
| CSP | 0.0477 | 0.447 | - | - |
| CSR | - | - | 0.0158 | 0.931 |
| CSI | - | - | −0.2823 *** | 0.000 |
| B-SIZE | −0.0040 | 0.648 | −0.0045 | 0.593 |
| INDEP | 0.0509 | 0.599 | 0.0324 | 0.722 |
| DUAL | 0.0237 | 0.469 | 0.0056 | 0.855 |
| BIG4 | −0.1612 *** | 0.001 | −0.1508 *** | 0.004 |
| SIZE | −0.3112 *** | 0.002 | −0.2231 ** | 0.036 |
| AGE | −0.0891 | 0.426 | −0.0618 | 0.555 |
| LEV | 0.0076 * | 0.059 | 0.0042 | 0.205 |
| GROWTH | 0.0886 | 0.417 | 0.0866 | 0.374 |
| Year-industry fixed effects | Yes | Yes | ||
| Wald chi square | 143.14 *** | 191.11 *** | ||
| Arellano-Bond test AR(1) (z, p-value) | −2.9353 (0.0033) | −3.0345 (0.0024) | ||
| Arellano-Bond test AR(2) (z, p-value) | −0.3810 (0.7032) | −0.48049 (0.6309) | ||
| Sargan Test (Chi2, p-value) | 14.2936 (0.1123) | 14.6089 (0.1023) | ||
Tobin’s Q is the dependent variable, measured as the ratio of market capitalization and total debt to total assets; CSP is the ESG combined score extracted from ASSET 4 database; CSR is the ESG score extracted from ASSET 4 database; CSI is measured as 1-ESG controversies score available on ASSET 4 database; B-SIZE is the number of board members; INDEP is the proportion of independent directors on the board; DUAL is a dummy variable that takes the value of 1 if the CEO is also the chairman of the board and 0 otherwise; BIG4 is a dummy variable that takes 1 when the firm is audited by two BIG4 and 0 otherwise; F-SIZE is the natural logarithm of total assets; AGE is the natural logarithm of the number of years since the creation of the company; LEV is the debt-to-equity ratio and GROWTH is the growth rate of its assets. *, **, *** represent the significance level of 10%, 5%, and 1%, respectively.
Table 5.
VAR estimation results.
| Variables | Coefficient | Z-Statistic | P > ∣z∣ |
|---|---|---|---|
| Tobin’s Qt−1 | 0.1444 | 1.32 | 0.186 |
| CSRt−1 | 0.8331 * | 1.69 | 0.091 |
| CSIt−1 | −0.2685 ** | −2.59 | 0.010 |
| B-SIZE | 0.0252 | 1.06 | 0.287 |
| INDEP | 1.0580 ** | 2.01 | 0.044 |
| DUAL | 0.0692 | 0.38 | 0.707 |
| BIG4 | −0.2786 | −1.50 | 0.134 |
| F-SIZE | −0.5116 *** | −2.62 | 0.009 |
| AGE | 0.4100 | 1.17 | 0.242 |
| LEV | 0.0370 * | 1.86 | 0.063 |
| GROWTH | −0.0551 | −0.26 | 0.794 |
Tobin’s Q is the dependent variable, measured as the ratio of market capitalization and total debt to total assets; CSR is the ESG score extracted from ASSET 4 database; CSI is measured as 1-ESG controversies score available on ASSET 4 database; B-SIZE is the number of board members on boards; INDEP is the proportion of independent directors on the board; DUAL is a dummy variable that takes the value of 1 if the CEO is also the chairman of the board and 0 otherwise; BIG4 is a dummy variable that takes 1 when the firm is audited by two BIG4 and 0 otherwise; F-SIZE is the natural logarithm of total assets; AGE is the natural logarithm of the number of years since the creation of the company; LEV is the debt-to-equity ratio and GROWTH is the growth rate of its assets. *, **, *** represent the significance level of 10%, 5%, and 1%, respectively.
Table 6.
FEVD of financial performance according to CSR and CSI.
| Response Variable: Tobin’s Q | Impulse Variables | |
|---|---|---|
| CSR | CSI | |
| Periods | ||
| 1 | 0 | 0 |
| 2 | 0.0161 | 0.0456 |
| 3 | 0.0225 | 0.0521 |
| 4 | 0.0236 | 0.0529 |
| 5 | 0.0238 | 0.0530 |
| 6 | 0.0238 | 0.0531 |
| 7 | 0.0238 | 0.0531 |
| 8 | 0.0238 | 0.0531 |
| 9 | 0.0238 | 0.0531 |
| 10 | 0.0238 | 0.0531 |
Tobin’s Q is the dependent variable, measured as the ratio of market capitalization and total debt to total assets; CSR is the ESG score extracted from ASSET 4 database; CSI is measured as 1-ESG controversies score available on the ASSET 4 database.
Publisher’s Note: MDPI stays neutral with regard to jurisdictional claims in published maps and institutional affiliations. |
© 2021 by the authors. Licensee MDPI, Basel, Switzerland. This article is an open access article distributed under the terms and conditions of the Creative Commons Attribution (CC BY) license (https://creativecommons.org/licenses/by/4.0/).
Share and Cite
MDPI and ACS Style
Boukattaya, S.; Omri, A. Corporate Social Practices and Firm Financial Performance: Empirical Evidence from France. Int. J. Financial Stud. 2021, 9, 54. https://0-doi-org.brum.beds.ac.uk/10.3390/ijfs9040054
AMA Style
Boukattaya S, Omri A. Corporate Social Practices and Firm Financial Performance: Empirical Evidence from France. International Journal of Financial Studies. 2021; 9(4):54. https://0-doi-org.brum.beds.ac.uk/10.3390/ijfs9040054
Chicago/Turabian StyleBoukattaya, Sonia, and Abdelwahed Omri. 2021. "Corporate Social Practices and Firm Financial Performance: Empirical Evidence from France" International Journal of Financial Studies 9, no. 4: 54. https://0-doi-org.brum.beds.ac.uk/10.3390/ijfs9040054
Note that from the first issue of 2016, this journal uses article numbers instead of page numbers. See further details here.