
Did Financial Consumers Benefit from the Digital Transformation? An Empirical Investigation


1
KEPCO International Nuclear Graduate School (KINGS), 658-91 Haemaji-ro, Seosaeng-Myeon, Ulju-gun, Ulsan 45014, Korea
2
KDI School of Public Policy and Management, 263 Namsejong-ro, Sejong-si 30149, Korea
*
Author to whom correspondence should be addressed.
Int. J. Financial Stud. 2021, 9(4), 57; https://0-doi-org.brum.beds.ac.uk/10.3390/ijfs9040057
Submission received: 11 September 2021
/
Revised: 5 October 2021
/
Accepted: 6 October 2021
/
Published: 18 October 2021
(This article belongs to the Special Issue The Financial Industry 4.0 Part 2)
Abstract
:This study aimed to test, through empirical investigation, how the rapid advancement of digital transformation (DT) has impacted the price of financial services. To this end, we compiled a set of macro-level indicators on the aggregate outcomes of the financial services sector in Korea over the last three decades and conducted an analysis to gauge the effects of DT on the country using those indicators. Using the ARDL-ECM (autoregressive distributed lag error-correction model), we show that, over time, the unit cost of financial intermediation in Korea has tended to move in tandem with the growth in economic output, although the profit portion of the unit cost has not exhibited a long-term relationship with the GDP trend. The long-term effect of the DT trend is negative (i.e., cost-saving) for labor input, capital expenditure, and the total unit cost of financial intermediation, which are all shown to be statistically significant. Consequently, we conclude that DT contributed to enhancing consumer benefit, mainly by achieving the operational efficiency of labor and capital, from 1990 to 2019 in Korea. From a policy perspective, our finding implies that DT-driven innovation in the sector can benefit financial customers if excessive levels of profit are restrained through market competition.
1. Introduction
It is well established that there is generally an endogenous, or mutually reinforcing, relationship between financial development and economic growth (King and Levine 1993; Rajan and Zingales 1998; Manning 2003; Pagano and Pica 2012). Additionally, as in the case of many emerging-market countries, the financial sector in Korea has played a direct role in promoting socio-economic growth, as is evidenced by the various credit programs during the high-growth period of the 1970s to the 1990s. Meanwhile, starting in the 1980s, various financial liberalization measures were implemented, which were accelerated after the Asian financial crisis (AFC) in 1997–1999. As a consequence, the sector has grown substantially since the AFC in terms of both size and diversity.
However, whether growth in the financial sector in Korea has contributed to key macroeconomic outcomes in any meaningful fashion, such as in industrial productivity or income inequality, has rarely been examined.
Philippon (2015, 2016) reported that that the financial services sector in the US has been overpriced since the early 1980s, as evidenced by its realized per-unit cost of providing the service continuously exceeding the projected optimal level. In addition, studies argue that the disruptive innovations in the sector introduced by digital transformation, often labeled as FinTech, can contribute to enhancing the operational efficiency of existing financial institutions.
At a global level, there have been two interrelated mega-trends during the last two decades that are making a profound impact on the financial services sector in most countries. First, there has been a rapid advancement of digital transformation (DT) in delivering various types of financial services, often referred to as FinTech (or financial technology), which encompasses areas such as P2P lending and crowdfunding, online payments, cryptocurrencies, robo-advisors, InsurTech, and RegTech1. Second, there have been growing legal and regulatory efforts to protect consumers in the financial markets, as evidenced by such legislations as the Dodd–Frank Wall Street Reform and Consumer Protection Act of 2010, as well as those “good” practices suggested by (G20/OECD/INFE 2017; Organization of Economic Cooperation and Development (OECD) 2019; The World Bank 2012; and Cho and Park 2021).
Given these ongoing trends, this study aims to tackle two particular research questions. First, what impact does this trend of digital transformation (DT) have on aggregate (or macro-level) outcomes of the financial services sector in Korea as a whole? Second, what implications can we draw from the findings of the macro-level analysis? More specifically, we would like to look at how the per-unit price of financial services has been changed, in a similar vein to the analysis performed by Philippon (2015), and to further investigate whether the DT trend has made any significant impact on price changes. This study focuses on the financial market of Korea during a period when both rapid DT and financial market strengthening occurred. This study on Korea, where rapid DT and financial market deepening occurred during the observation period, may provide a different view of the labor efficiency of the financial industry from that of the US, which was investigated by Philippon (2015). More importantly, Korea’s case may shed light on the impact of DT on the efficiency gains in the financial industry, which may provide policy implications for other emerging markets.
To this end, we compiled a set of indicators of the aggregate outcomes of the financial services sector in Korea during the last three decades and used the correlation estimate as a proxy for the country’s DT trend. In so doing, the method put forth by Philippon (2015, 2016) was employed, which involved computing the unit cost of financial intermediation, i.e., an aggregate cost of providing the service during a given time period divided by the total monetary value of the financial service at the end of the period. We also attempted to contribute to the literature by breaking down the unit cost into its sub-components—labor cost, capital expenditure, and profit elements—and used those sub-categories in our empirical analysis. For the empirical analysis, we used the ARDL-ECM (autoregressive distributed lag error-correction model) to investigate the short- and long-term effects of digital transformation on three specific variables related to providing financial services: labor cost, capital expenditure, and total cost.
Our empirical results show that, over time, the unit cost of financial intermediation in Korea has tended to move in tandem with the growth in economic output, although the profit portion of the unit cost did not exhibit a long-term relationship with the GDP trend. Furthermore, the long-term effect of the DT trend is negative (i.e., cost-saving) for labor input, capital expenditure, and the total unit cost of financial intermediation, which is shown to be statistically significant. Consequently, we show that DT has contributed to an enhancement in consumer benefit, mainly by achieving the operational efficiency of labor and capital in Korea.
Through these findings, we aim to contribute to measuring the social cost of financial services and analyzing the impact of DT on the financial industry, which relates to financial consumer protection from an economic perspective. It could also provide a sound basis for establishing financial consumer policy and international comparisons.
2. Financial Sector Development and Digitalization
A well-functioning financial services sector is crucial, both in the micro sense of consumer welfare and in the macro sense of economic and social development (Odedokun 1996). There is generally an endogenous, or mutually reinforcing, relationship between financial market development and economic growth; that is, a positive association between the size of private credit and the GDP growth rate is fairly well established and is more pronounced in developing countries than in developed ones (King and Levine 1993; Rajan and Zingales 1998; Manning 2003; Pagano and Pica 2012). In addition, an inverse U-shaped relationship between economic growth and the ratio of private credit to GDP has also been documented, implying that the strengthening of the financial market can have a detrimental effect on growth after a certain threshold (e.g., 100% of the ratio of private credit to GDP as reported), possibly due to an overinvestment in a sector that is generally viewed as a less productive segment of the economy (Cecchetti and Kharroubi 2012; Arcand et al. 2012; Cournède and Denk 2015).
Since the recent financial crisis, there has been debate in the literature that the price of financial services has been too high vis à vis its direct input costs, and that the operational efficiency thereof should be substantially enhanced. In particular, Philippon (2015, 2016) estimated the unit cost of providing financial intermediation in the US and documented that the sector has been too expensive since the early 1980s, and that, as a remedy for the efficiency gain, the disruptive innovations introduced by the FinTech industry can contribute to restoring the efficiency of the sector by posing heightened competition and contestability to existing financial institutions. As a related point, there has also been argument for more innovative and specialized business models in the financial services sector, including a “narrow banking” model, for which FinTech is viewed as a potential driver (Pennachi 2012; Chamley et al. 2012; Cochrane 2014). In this study, we examine the price dimension of financial intermediation, i.e., whether or not service providers (financial consumers) have increased service charges (pay) too much (following the same inquiry posed by Philippon 2015), which is a macro-level financial consumer issue.
From an emerging-market perspective, the financial services sector in Korea has strengthened as aggregate economic output has grown since the 1960s. To illustrate this, the three key service sectors for financial consumers—banking, insurance, and investment—have all exhibited steady growth along with the growth2 in GDP. However, the growth in the financial services sector after the AFC, in terms of both size and diversity, has not contributed to macroeconomic outcomes, such as increasing industrial productivity or narrowing societal income and wealth inequality (Cho et al. 2017).
Another relevant trend in Korea to note is digital transformation (DT). Unlike in the US and several other advanced economies, where information and communications technology (ICT)-driven innovations in the financial sector started in the 1990s and have been showing a continuous pattern ever since, FinTech and other innovative financial services in Korea are more recent and discrete with an abrupt and rapidly increasing pattern. However, this DT-driven financial innovation appears to be similar between Korea and other countries.
In particular, Cho (2021) summarizes four main social outcomes from tech-based financial intermediation. First, thanks to much cheaper, faster, and more convenient intermediation based on the internet or mobile platforms, FinTech service providers have greatly enhanced the efficiency of financial intermediation (International Monetary Fund (IMF) 2017; Buchak et al. 2017; Fuster et al. 2018; Frost et al. 2019; Jagtiani and Lemieux 2019; Organization of Economic Cooperation and Development (OECD) 2019). Second, FinTech can also lead to over-leverage for some consumer segments (Chava and Paradkar 2018; DiMaggio and Yao 2018). Third, regarding financial inclusion, FinTech service providers tend to serve those borrowers with low credit scores or thin filers (i.e., those consumers with no or low records of financial transactions) more often, and their lending activities penetrate those areas with fewer bank branches per capita, as well as those where the local economy is not performing well (Jagtiani and Lemieux 2019; De Roure et al. 2018). Fourth, FinTech service providers are shown to be reducing the effect of information asymmetry between borrower and lender by collecting and utilizing various types of soft data for ex ante credit evaluation for financial consumers (Lin et al. 2013; Iyer et al. 2016; Puri et al. 2017; Hildebrand et al. 2017; Freedman and Jin 2017; Berg et al. 2018). Lastly, those BigTech-affiliated financial service providers can contribute to the macroeconomy in two main ways: by imposing competition and contestability on existing financial institutions and by increasing the factor productivity of the firms within a BigTech-driven innovation ecosystem (Citi GPS 2018; Frost et al. 2019). In addition, a number of recent studies have documented the effects of the FinTech services sector on various micro-aspects of the financial services sectors, e.g., on the financial behavior of individual investors in the COVID-19 era (Priem 2021), on collaborative consumption behavior in the technology-driven sharing economy (Graessley et al. 2019), on green financial behavior and the transition to a low-carbon economy (Ionescu 2020b, 2021a, 2021b), and on data aggregation and the provision of FinTech infrastructure (Ionescu 2020a).
In an aggregate sense, digital technologies can have both positive and negative effects on efficiency in the finance sector through various channels. For example, Le et al. (2021) showed that the expansion of FinTech credit may serve as a wake-up call to the banking system and thus make a positive impact, even though FinTech credit tends to be more developed in countries with less efficient banking systems.
As an initial observation, the DT-driven financial innovations in Korea appear to be making an impact on the existing financial institutions already. As shown in Figure 1 and Figure 2, the extent of digital transformation in the banking sector is increasing in Korea: bank branches and ATM per capita are declining, while mobile and internet accounts are increasing.
Figure 1 shows that the number of physical bank branches declined from 1.82 per million adults in 2011 to 1.55 per million adults in 2017. It also shows that the number of ATM machines decreased from 28.8 per million adults in 2012 to 27.2 per million adults in 2016. Conversely, mobile and internet banking accounts soared from 20,463 per million adults to 28,251 per million adults in 2015. The two figures demonstrate a clear trend of digital transformation in the finance sector.
3. Valuing the Financial Services Sector in Korea
3.1. Cost of Financial Intermediation
Financial consumers pay the user cost of finance for financial services. The total user cost comprises the return to saver and the cost of financial intermediation (Philippon 2015). The return to saver is the capital cost of the financial services industry and the cost of financial intermediation, which is a net value add of the financial industry. Conceptually, the cost of financial intermediation is a net cost that a society pays for consuming financial services. The cost of financial intermediation is distributed as a wage, capital expenditures (“Capex” hereafter), and profit. Thus, from the input perspective, the net value add of the financial industry (“VAF” hereafter) is composed of the four components below:
where L = labor cost, K = operating Capex, Y = profit, and T = tax, and the “operating capital expenditures (K)” does not include a return to saver (capital cost for intermediation).
We established VAF data from 1990 to 2019 based on the National Accounts produced by the Bank of Korea (BOK). All monetary values were converted into 2015 prices by the producer price index.
3.2. Intermediated Asset and Unit Cost of Intermediation
The quantity of financial services was measured by the year-end stock of intermediated assets in the financial industry. We included the total credit created by the financial industry and the stock market cap. The total amount of created credit was measured by total liquidity (L) minus M1 monetary supply, as below:
where L = total liquidity, M1 = M1 money supply, and S = stock market cap.
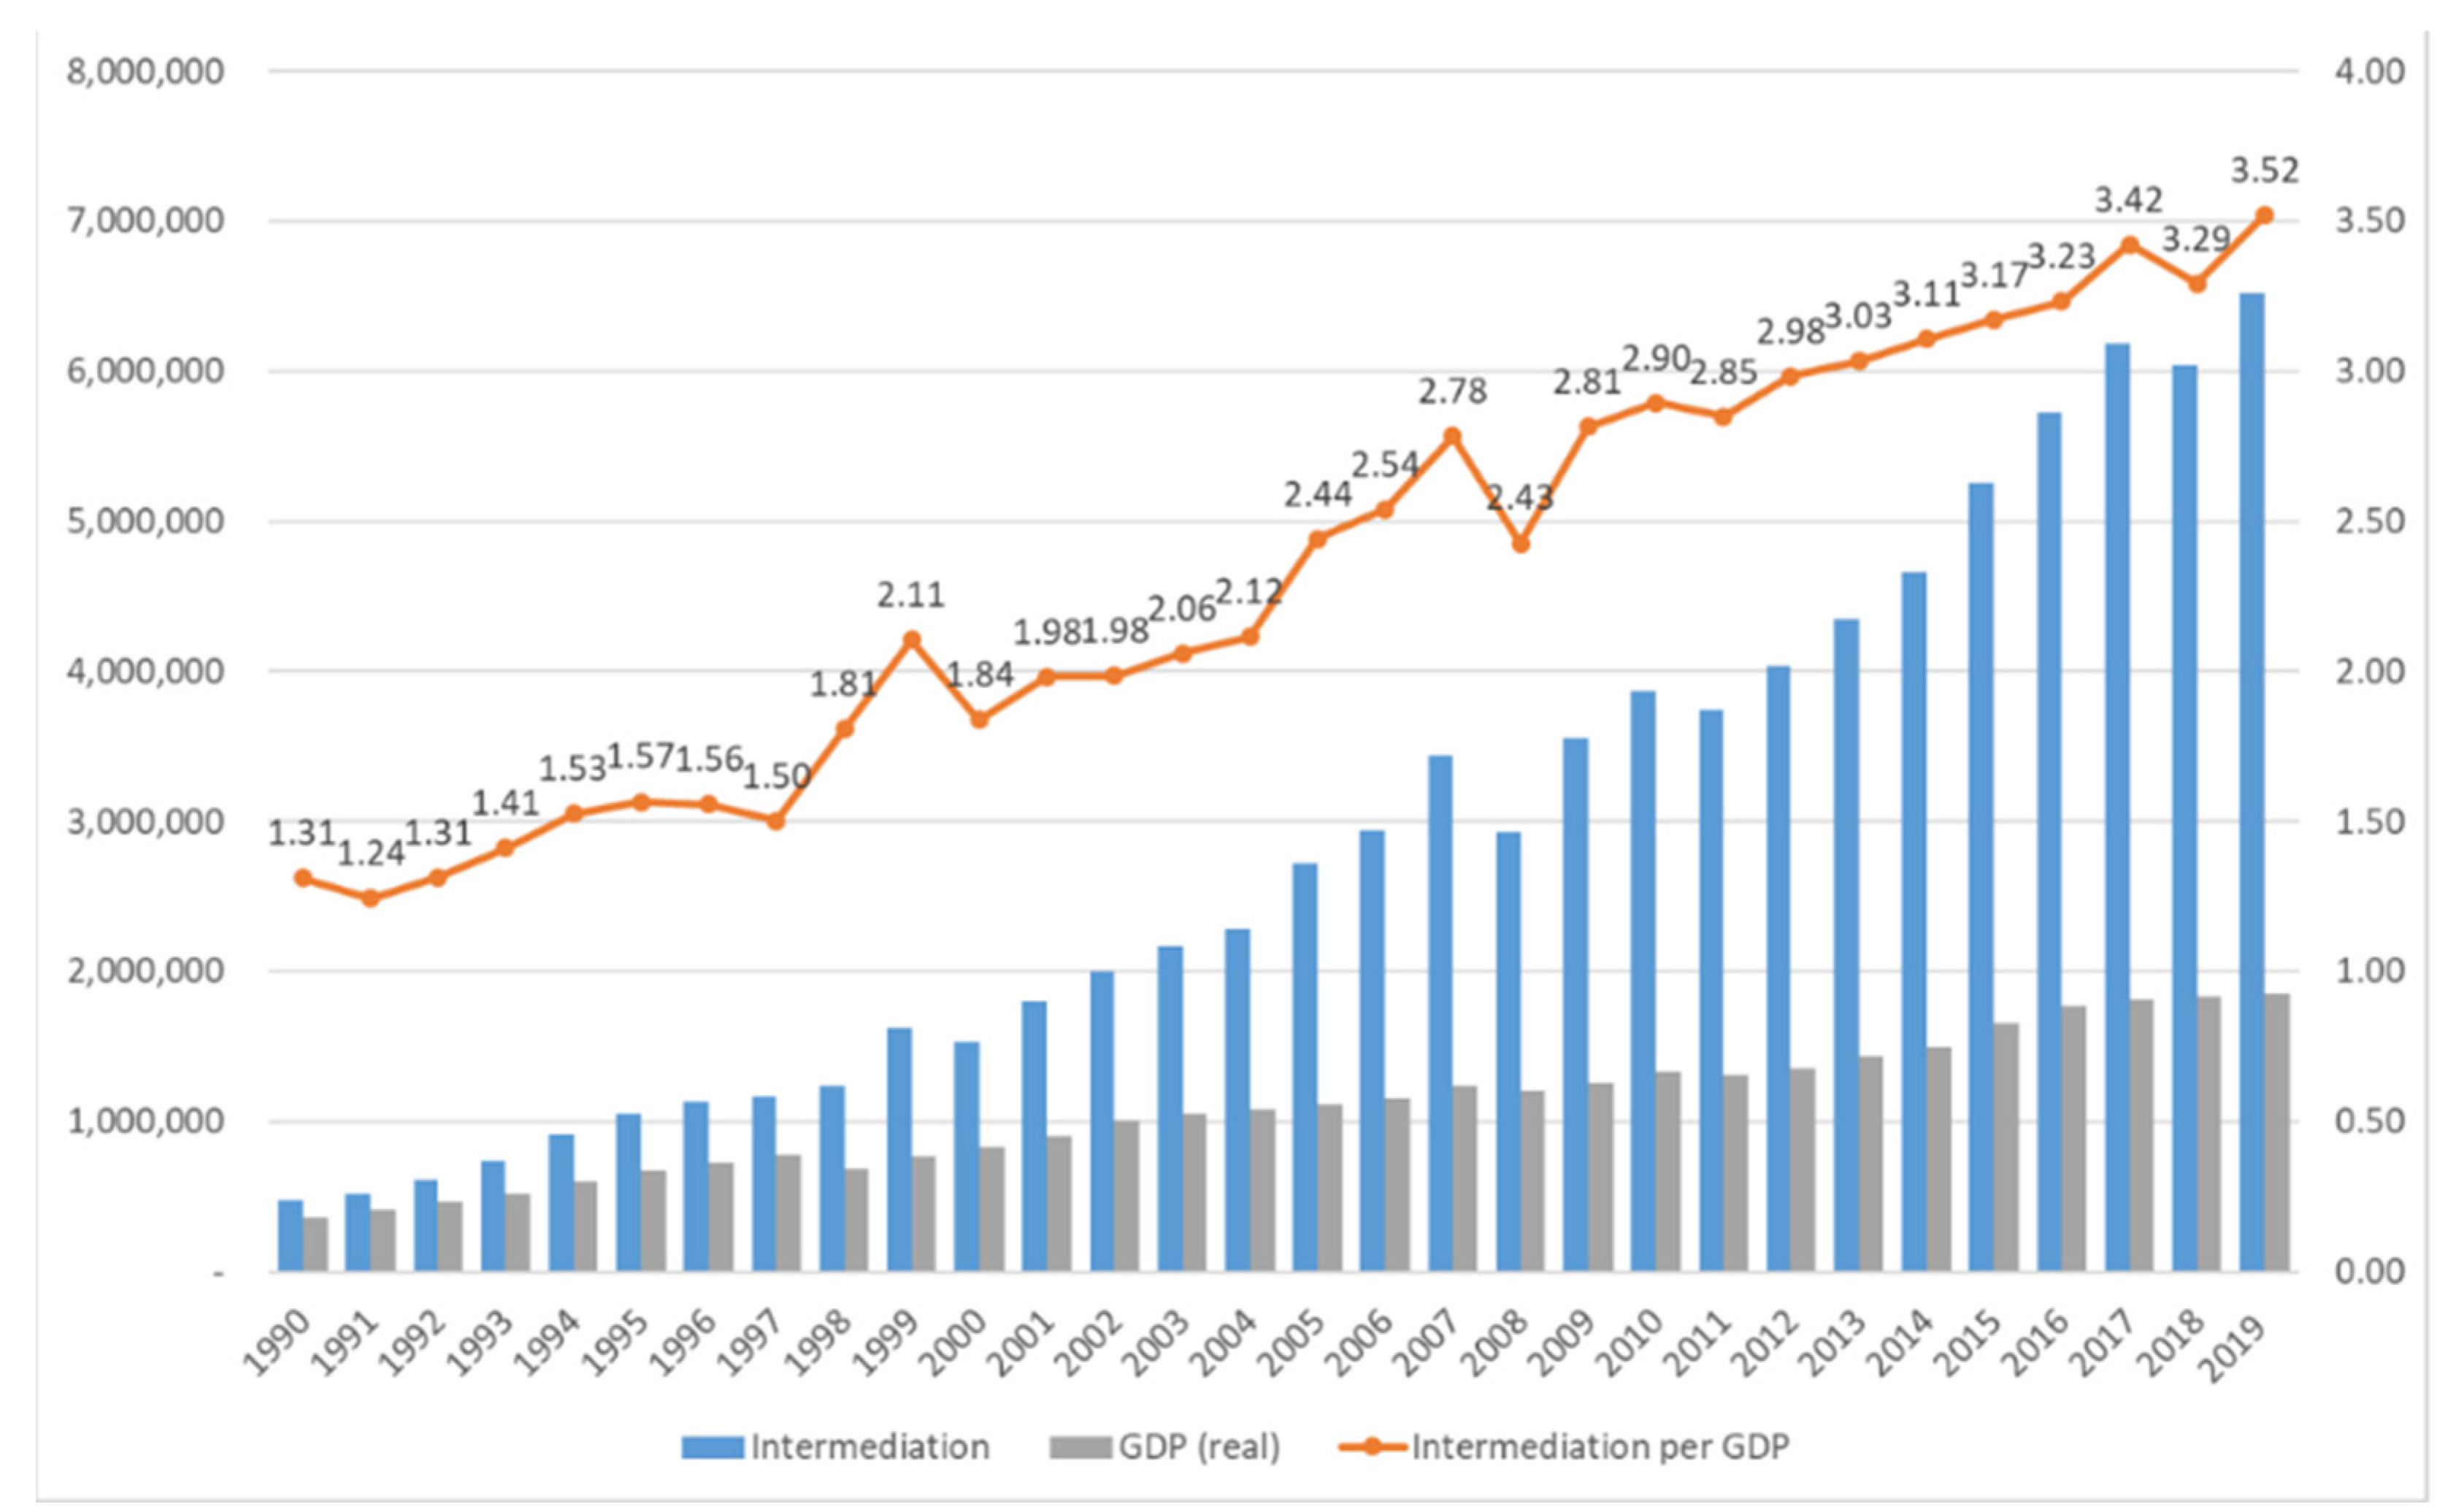
Intermediated assets have increased faster than GDP growth, reaching 3.52 times the GDP in 2019 from 1.31 times in 1990. As a trend to illustrate this, Figure 3 shows the total value of financial intermediation, which is the size of total intermediated assets as a multiple of GDP.
Finally, we established the unit cost of intermediated asset data from 1990 to 2019 by dividing the VAF by the intermediated asset. The unit cost of intermediated asset (UCIA) is the consumer cost of using one unit of intermediated asset:
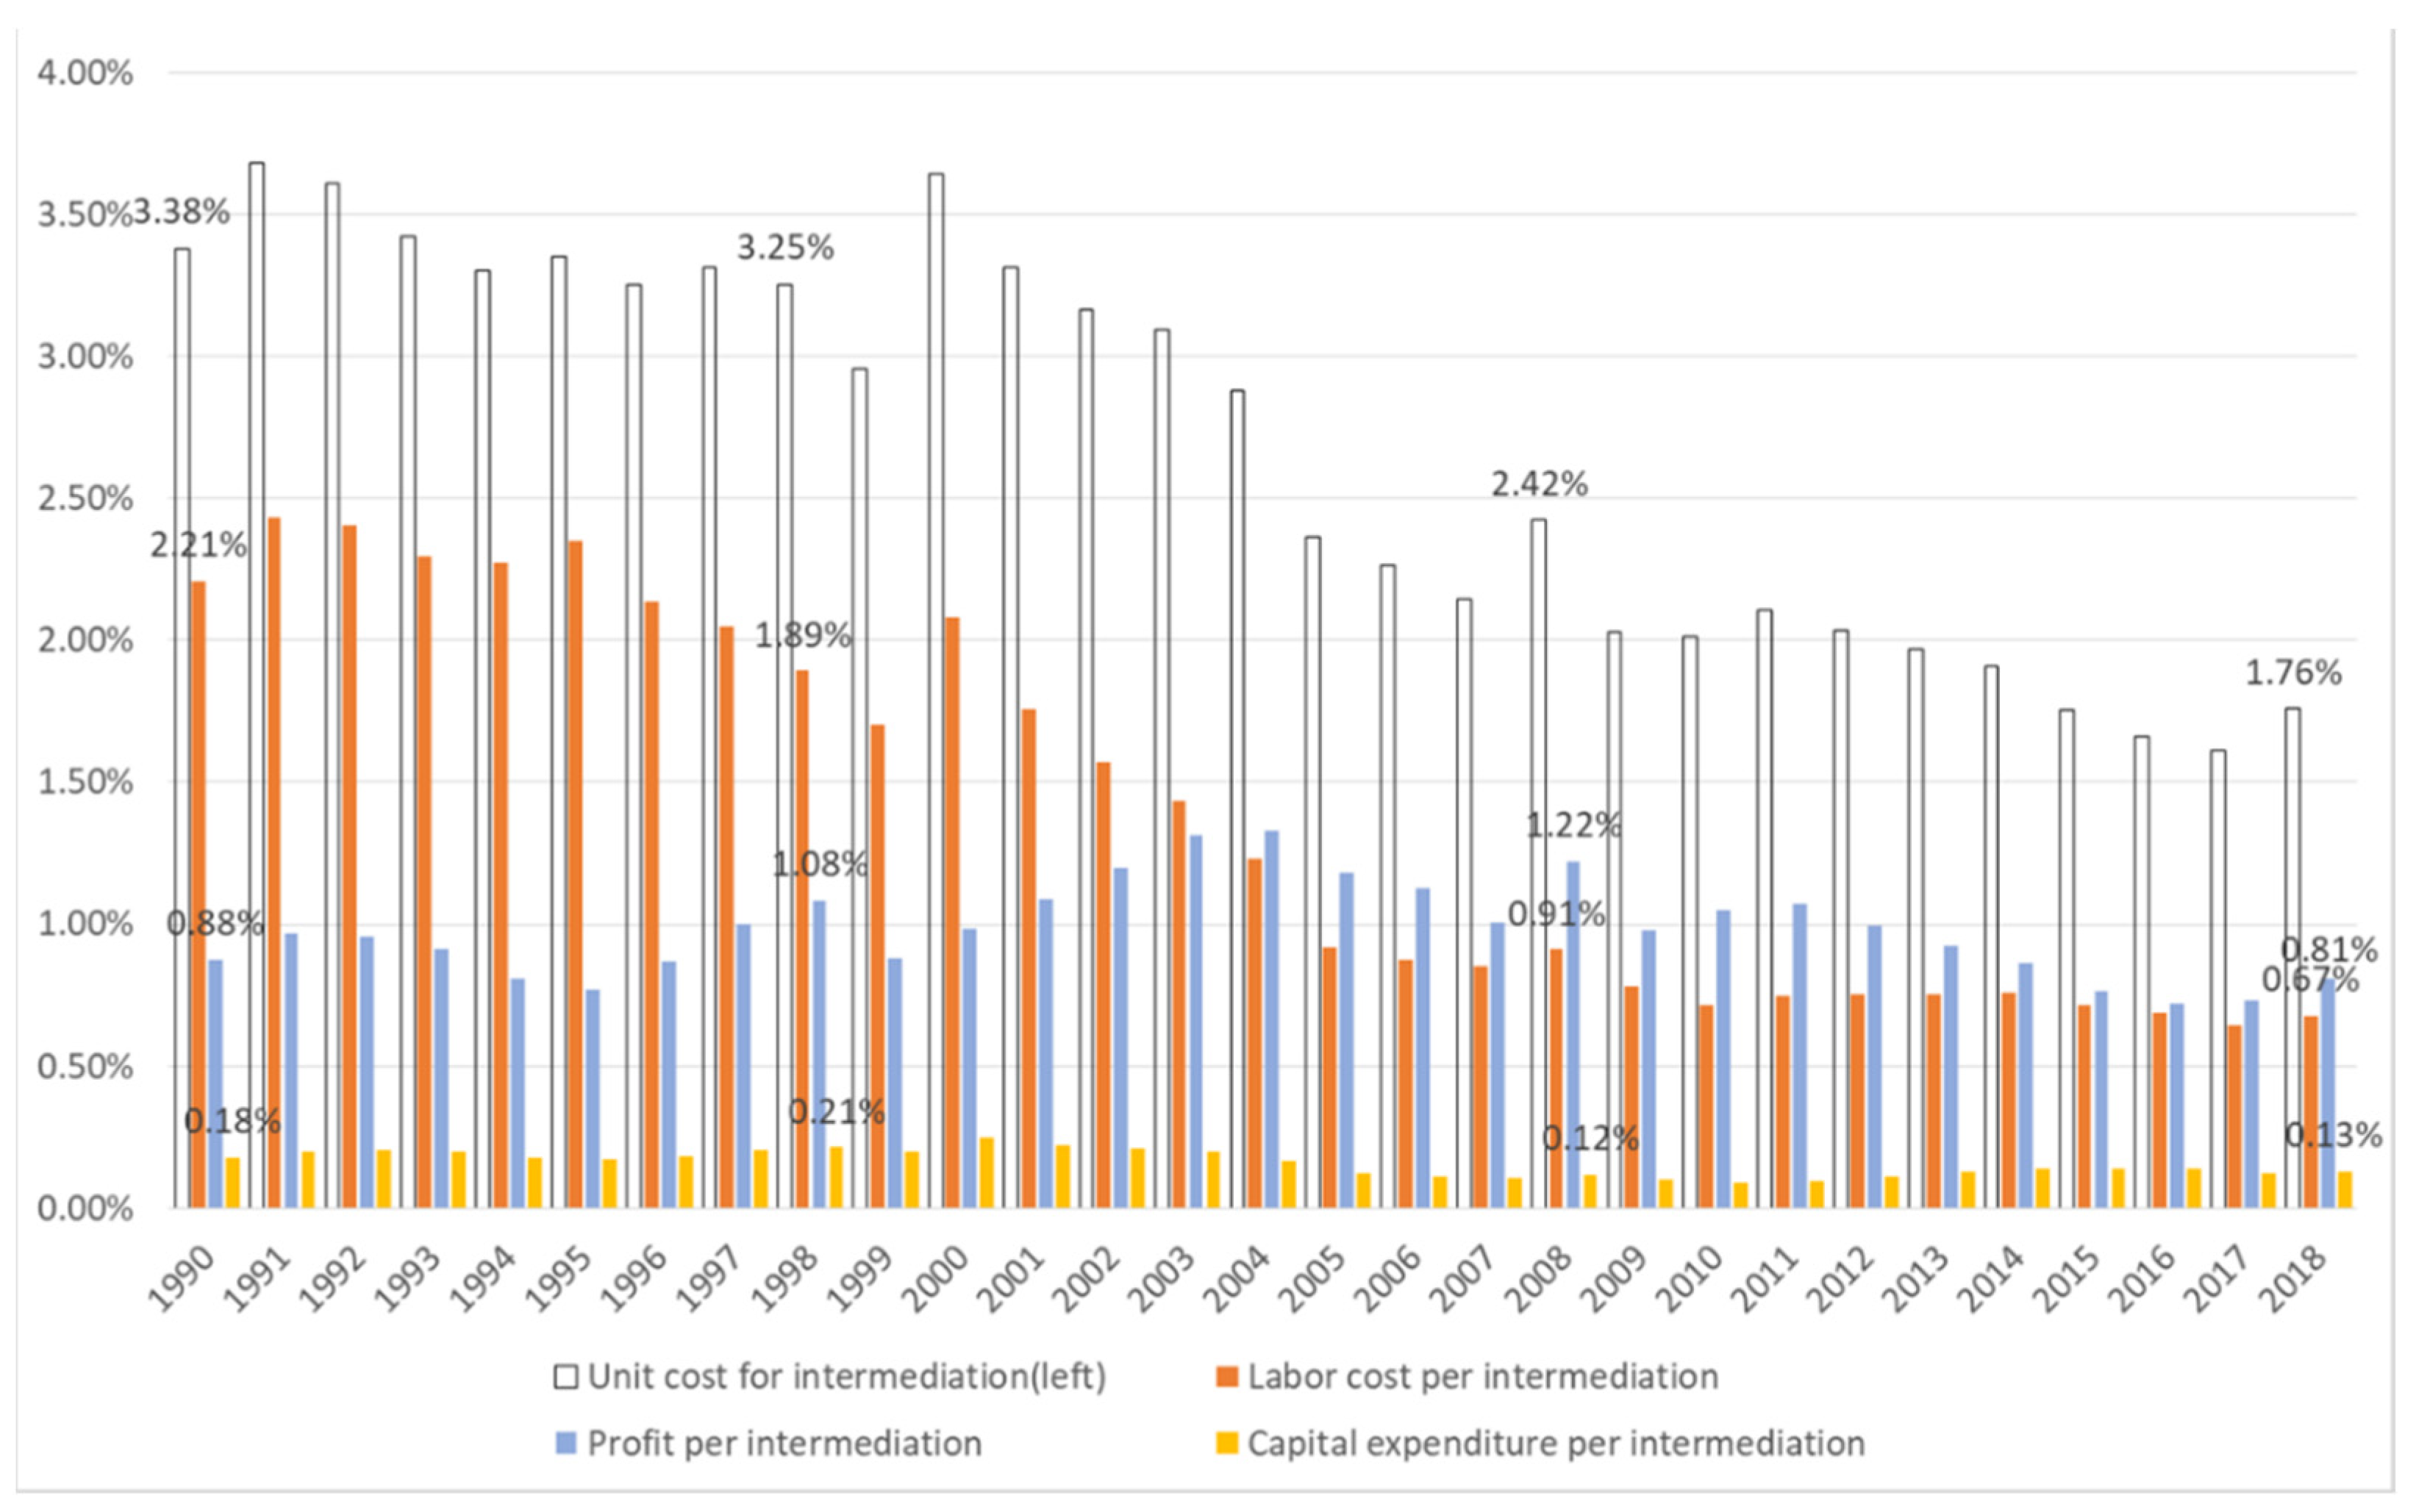
The UCIA decreased from 3.38% in 1990 to 1.76% in 2019. We broke down the portion of UCIA into labor cost (L), Capex (K), and profit (Y) as illustrated in Figure 4. The labor cost per intermediated asset continuously decreased, whereas the profit per intermediated asset stayed around 0.976% on average. It was found that the decrease in financial services cost, measured by UCIA, was mainly due to a decrease in the unit cost of labor per intermediated asset from 1990 to 2019. In contrast, the profit per intermediated asset was comparatively stable, even with a downward shift after 2011. From the analysis of Philippon (2015), the ratio of intermediated asset over GDP in the US was around 2.9–4.1 after 1990, which is higher than that of Korea (1.31–3.52 times). Yet, the UCIA in the US was around 1.8–2.2% after 1990, which is slightly lower than that of Korea (1.76–3.38%). Furthermore, it tends to decline from 1990 onwards, a trend which is similar in both economies.
We further checked the number of employees in the financial industry from 1990 to 2018. No trend exists, but there is a shape of periodical fluctuation. We observed that the wage, VAF, and profit per employee continuously increased. In particular, the intermediated asset per employee significantly increased from 1.07 billion in 1990 to 8.63 billion in 2018. These results are consistent with the continuous decrease in labor cost per intermediated asset as discussed above. Thus, we found that the savings in the UCIA were mainly caused by the operational efficiency of labor. Additionally, the unit cost of operating Capex per UCIA decreased, even though the portion is small. We will test whether the operational efficiency gains of these two factors are caused by digital transformation in the finance sector in Korea.
3.3. Digital Transformation in Finance Sector
We collected the data related to digital transformation in the finance sector from internet and mobile bank accounts, the number of which have increased rapidly since the early 2000s. During this process, we were confronted with the problem that the data have not existed for a long enough period to study. Therefore, we selected a percentage of internet users as a variable proxy for internet and mobile bank accounts to explain the degree of digital transformation in the finance industry, as there is a high degree of correlation: the correlation between internet users and the number of internet bank accounts is 0.8837, and the correlation between internet users and the number of mobile bank accounts is 0.8911.
3.4. Digital Transformation and Unit Cost of Intermediation
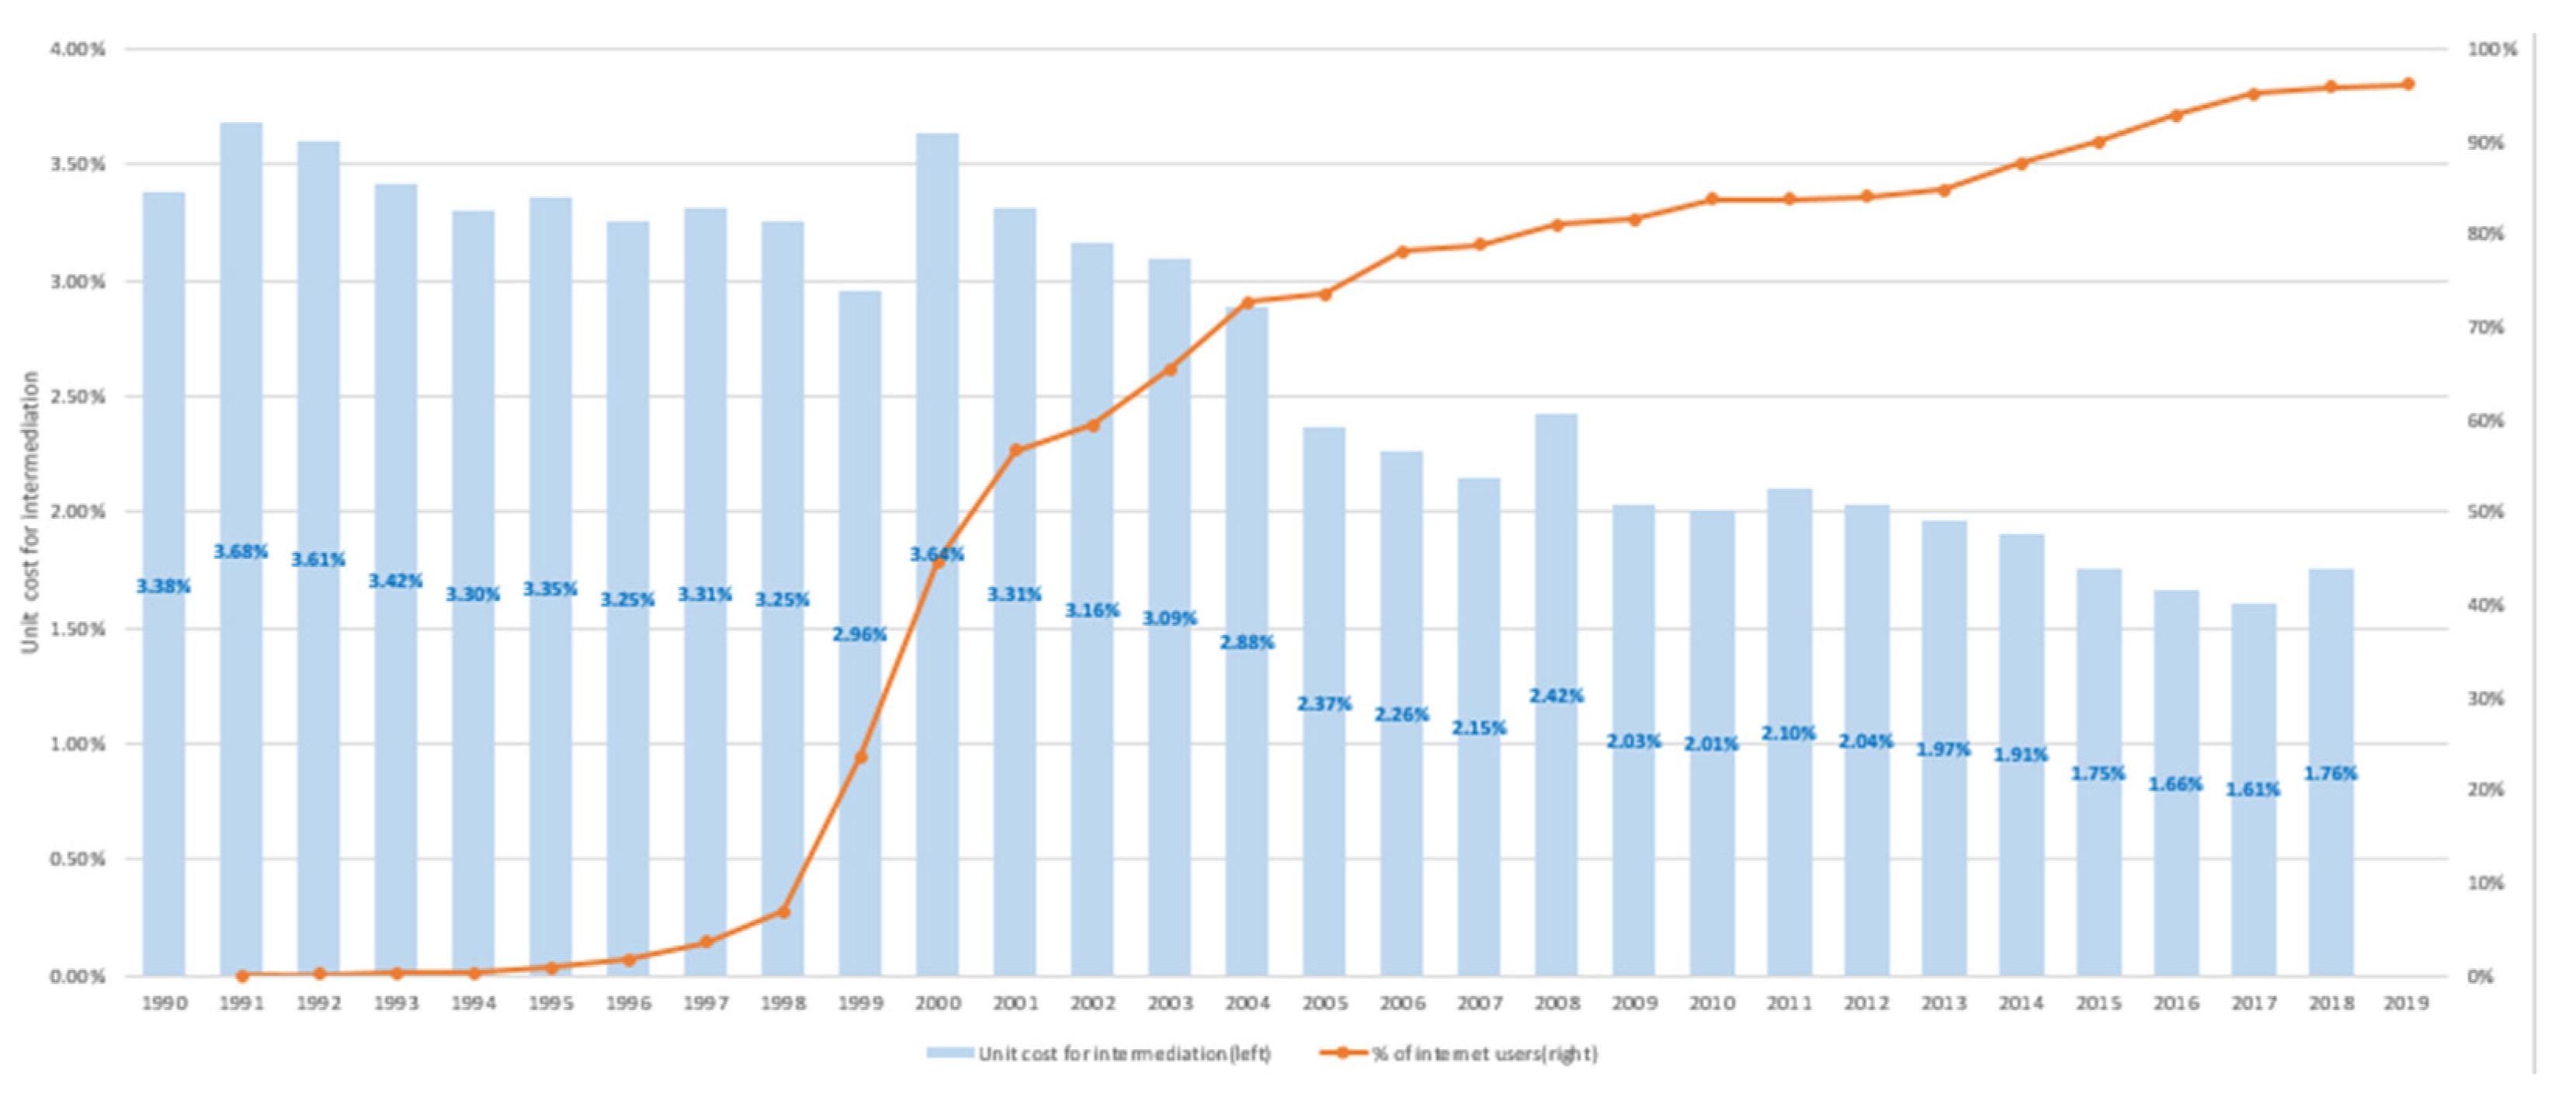
Before the empirical investigation, we visualized the trends in digital transformation, measured by the percentage of internet users, and compared them with the UCIA. The UCIA decreased rapidly from 2000 to 2005, during which period the percentage of internet users increased greatly, as can be observed from the graphs in Figure 5.
Figure 5 illustrates that the percentage of internet users rose sharply from 1999 and then stabilized from 2005. This trend is highly correlated with Figure 2, except for the difference in timing. It makes sense that the supply of the internet in Figure 5 precedes the distribution of internet and mobile banking in Figure 2. The UCIA rose once in 2000 and continued to decrease from 3.64% to 1.76% until 2018.
In the next section, we will test whether digital transformation caused the operational efficiency of the financial industry, either in labor or capital. If it is proved that an efficiency gain was achieved through digital transformation, we will further investigate whether the operational efficiency gain was delivered to financial customers. This will mean that the efficiency gain was not exclusively enjoyed by stakeholders as a form of profit.
4. Empirical Test and Result
4.1. Testing Methodology
We found a non-stationary distribution issue, which may cause spurious regression, when we performed the augmented Dickey–Fuller test. Therefore, we decided to use an ARDL (autoregressive distributed lag)-based error-correction model (ECM). The ECM is useful, as it includes an error-correction term, thus allowing non-stationary variables (Engle and Granger 1987; Hassler and Wolters 2006).
For the purpose of applying the ARDL-ECM, we tested the existence of a long-run cointegration relationship based on the “bounds test” (Pesaran et al. 2001): the OLS (Ordinary Least Squares) estimators of short-run parameters are asymptotically normal, and the corresponding estimators are consistent if the regressors are I (1) processes and asymptotically normally distributed, regardless of the order of integrations. Pesaran et al. (2001) suggested asymptotic critical values of band from all regressors being purely I (0) to all regressors being purely I (1). Later, Narayan (2005) studied the corresponding critical values for various sample sizes, including small samples. We selected three variables (UCIA, labor cost per intermediated asset, and Capex per intermediated asset) that showed long-term cointegration with digital transformation in the financial industry, which was measured by a proxy variable of the percentage of internet users. In addition, the optimal lags of the variables were determined based on the AIC (Akaike information criterion).
We used the ARDL-ECM (autoregressive distributed lag error-correction model) to investigate the short- and long-term impact of digital transformation on (Model 1) labor costs for financial services, (Model 2) capital expenditure for financial services, and (Model 3) costs for financial services (Pesaran and Shin 1999).
where adjustment = ; long-term relationship = ; short-term relationship = ; and 0 < θ < 1.
After the modeling, we performed the Durbin–Watson and Breusch–Godfrey tests to check the serial correlation. We also utilized the White test to check for heteroskedasticity issues. The above three models were selected from a number of trials to meet the assessment criteria. Finally, we checked the stability of our models based on the cumulative sum of squares (CUSUMQ) in residuals (Brown et al. 1975; Stamatiou and Dritsakis 2014).
4.2. Data and Statistics
The Table 1 represents a summary of the variables used for the empirical test.
The Table 2 shows the basic statistics of our data. We used interpolation for the missing years.
4.3. Test Result
First, we performed the DF-GLS (Dickey-Fuller with Generalized Least Squares method) unit root test with the four main variables: percentage of internet users (user_internet), labor cost per intermediated asset (labor_intermedi), capital expenditure per intermediated asset (capex_intermedi), and UCIA (cost_intermedi). As expected, we confirmed that all four variables are not stationary, as they are time-series data.
Second, we selected candidate variables and formulated ARDL (p, q) models by OLS to obtain the optimal lag orders p and q of Equation (4) based on the AIC model selection criteria. In addition, we performed a bounds test, where it was assumed that the model comprised both I (0) and I (1) variables, and two levels of critical values were obtained. The procedure was to test the joint significance of the lagged levels of the variables. The null hypothesis of no cointegration was rejected if the F-statistic was higher than the critical value of I (0) and I (1) regressors and the t-statistic was smaller than the critical value of I (0) and I (1) regressors. We selected three dependent variables that showed a long-term correlation with the degree of digital transformation3 (measured by “user_internet”).
The selected variables, optimal lag orders, and bound test results for three models are summarized in Table 3.
Once the existence of long-term autocorrelation was checked, we estimated three ARDL-ECMs. The first model tested the effect of digital transformation (user_internet) on the labor efficiency gains (labor_intermedi). The test result is summarized in Table 4.
The error term (−(1 − θ)) from Equation (4) determines how quickly the long-term equilibrium is restored, and the estimated result should exist between −1 and 0. As expected, the coefficient of error (adjustment) term was estimated at –0.433 and was statistically significant under the 99% confidence level. The coefficient of the long-term relationship (β) from Equation (4) was estimated at –0.0168 under the 99% confidence level. We found that, if the percentage of internet users increases by 1%p, the labor cost per intermediated asset decreases by 0.0168%p, ceteris paribus. We conclude that digital transformation in the finance sector caused the operational efficiency of labor, resulting in savings of labor cost per intermediated asset from a long-term perspective in Korea.
The second model tested the effect of digital transformation (user_internet) on the operational capital cost efficiency gains (capex_intermedi). The test result is summarized in Table 5.
The coefficient of adjustment (error) term was estimated at –0.450 and was statistically significant under the 99% confidence level. The coefficient of the long-term relationship (β) from Equation (4) was estimated at –0.000955 under the 99% confidence level. The test results showed that if the percentage of internet users increases by 1%p, the operational capital expense per intermediated asset decreases by 0.000955%p, ceteris paribus. We conclude that digital transformation in the finance sector also enhanced the operational efficiency of capital and resulted in savings in operational capital cost per intermediated asset from a long-term perspective in Korea.
The third model tested the effect of digital transformation (user_internet) on the UCIA (cost_intermedi). The test result is summarized in Table 6. The UCIA is the sum of unit cost of labor, operational capex, and profit per intermediated asset. Furthermore, it measures the consumer cost paid for financial services. We performed this test separately from the above two to check whether the operational efficiency gains achieved from digital transformation was ultimately delivered to consumers as a reduced service cost.
The coefficient of error adjustment term was estimated at –0.498 and was statistically significant under the 99% confidence level. The coefficient of the long-term relationship (β) from Equation (4) was estimated at –0.018 under the 99% confidence level. The test results showed that if the percentage of internet users increases by 1%p, the unit cost of intermediated asset decreases by 0.018%p, ceteris paribus. We conclude that digital transformation in the finance sector ultimately resulted in a decrease in the unit cost of financial services per intermediated asset from a long-term perspective in Korea. From Equations (1) and (3), the UCIA can be rephrased as below:
From the above two test results, the long-term cost efficiency gains of labor () was measured as 0.0168%p, and that of capital expenditure () was measured as 0.000955%p. The sum of these two estimations equals 0.01775%p, which is close to the third test result of 0.018%p. With Equation (5) and the three test results, we conclude that the operational efficiency gains in both labor and operational assets, achieved from digital transformation, are ultimately delivered to consumers as a reduced service cost in Korea. Another important consideration is the role of profit per intermediated asset. The above result was partly due to the comparatively stable level of profit per intermediated asset, which shared 0.000245%p of a comparatively small portion of efficiency gains.
The long-term impact on financial services is estimated at a 0.018%p decrease, which is similar to the sum of savings in labor cost and capital expenditure. The costs for financial services comprises labor cost, capital expenditure, profit, and tax. It is estimated that digital transformation saved 0.0169%p of labor costs and 0.000955%p of capital expenditure, measured as a ratio to unit cost for intermediation. The cost for financial services also follows the trend of GDP growth in Korea. However, we found that financial industry profits, measured as financial mediation, did not have a long-term relationship with digital transformation.
In summary, our empirical results show: over time, the unit cost for financial services moves in tandem with the trend in GDP growth in Korea, although the profit portion of the cost did not have a long-term relationship with the DT trend; the DT trend saves 0.0168%p of labor costs, and 0.000955%p of capital expenditure, measured as a ratio to unit cost for intermediation; and the long-term impact of the DT trend on total service cost is estimated to be a 0.018%p decrease, which is similar to the sum of savings in labor cost and capital expenditures.
4.4. Robustness Check
We checked the existence of a serial correlation issue through the Durbin–Watson and Breusch–Godfrey tests with three models. We also performed the White test to check for heteroskedasticity issues. The results suggest that three models do not have serial autocorrelation or heteroskedasticity issues, as summarized in Table 7.
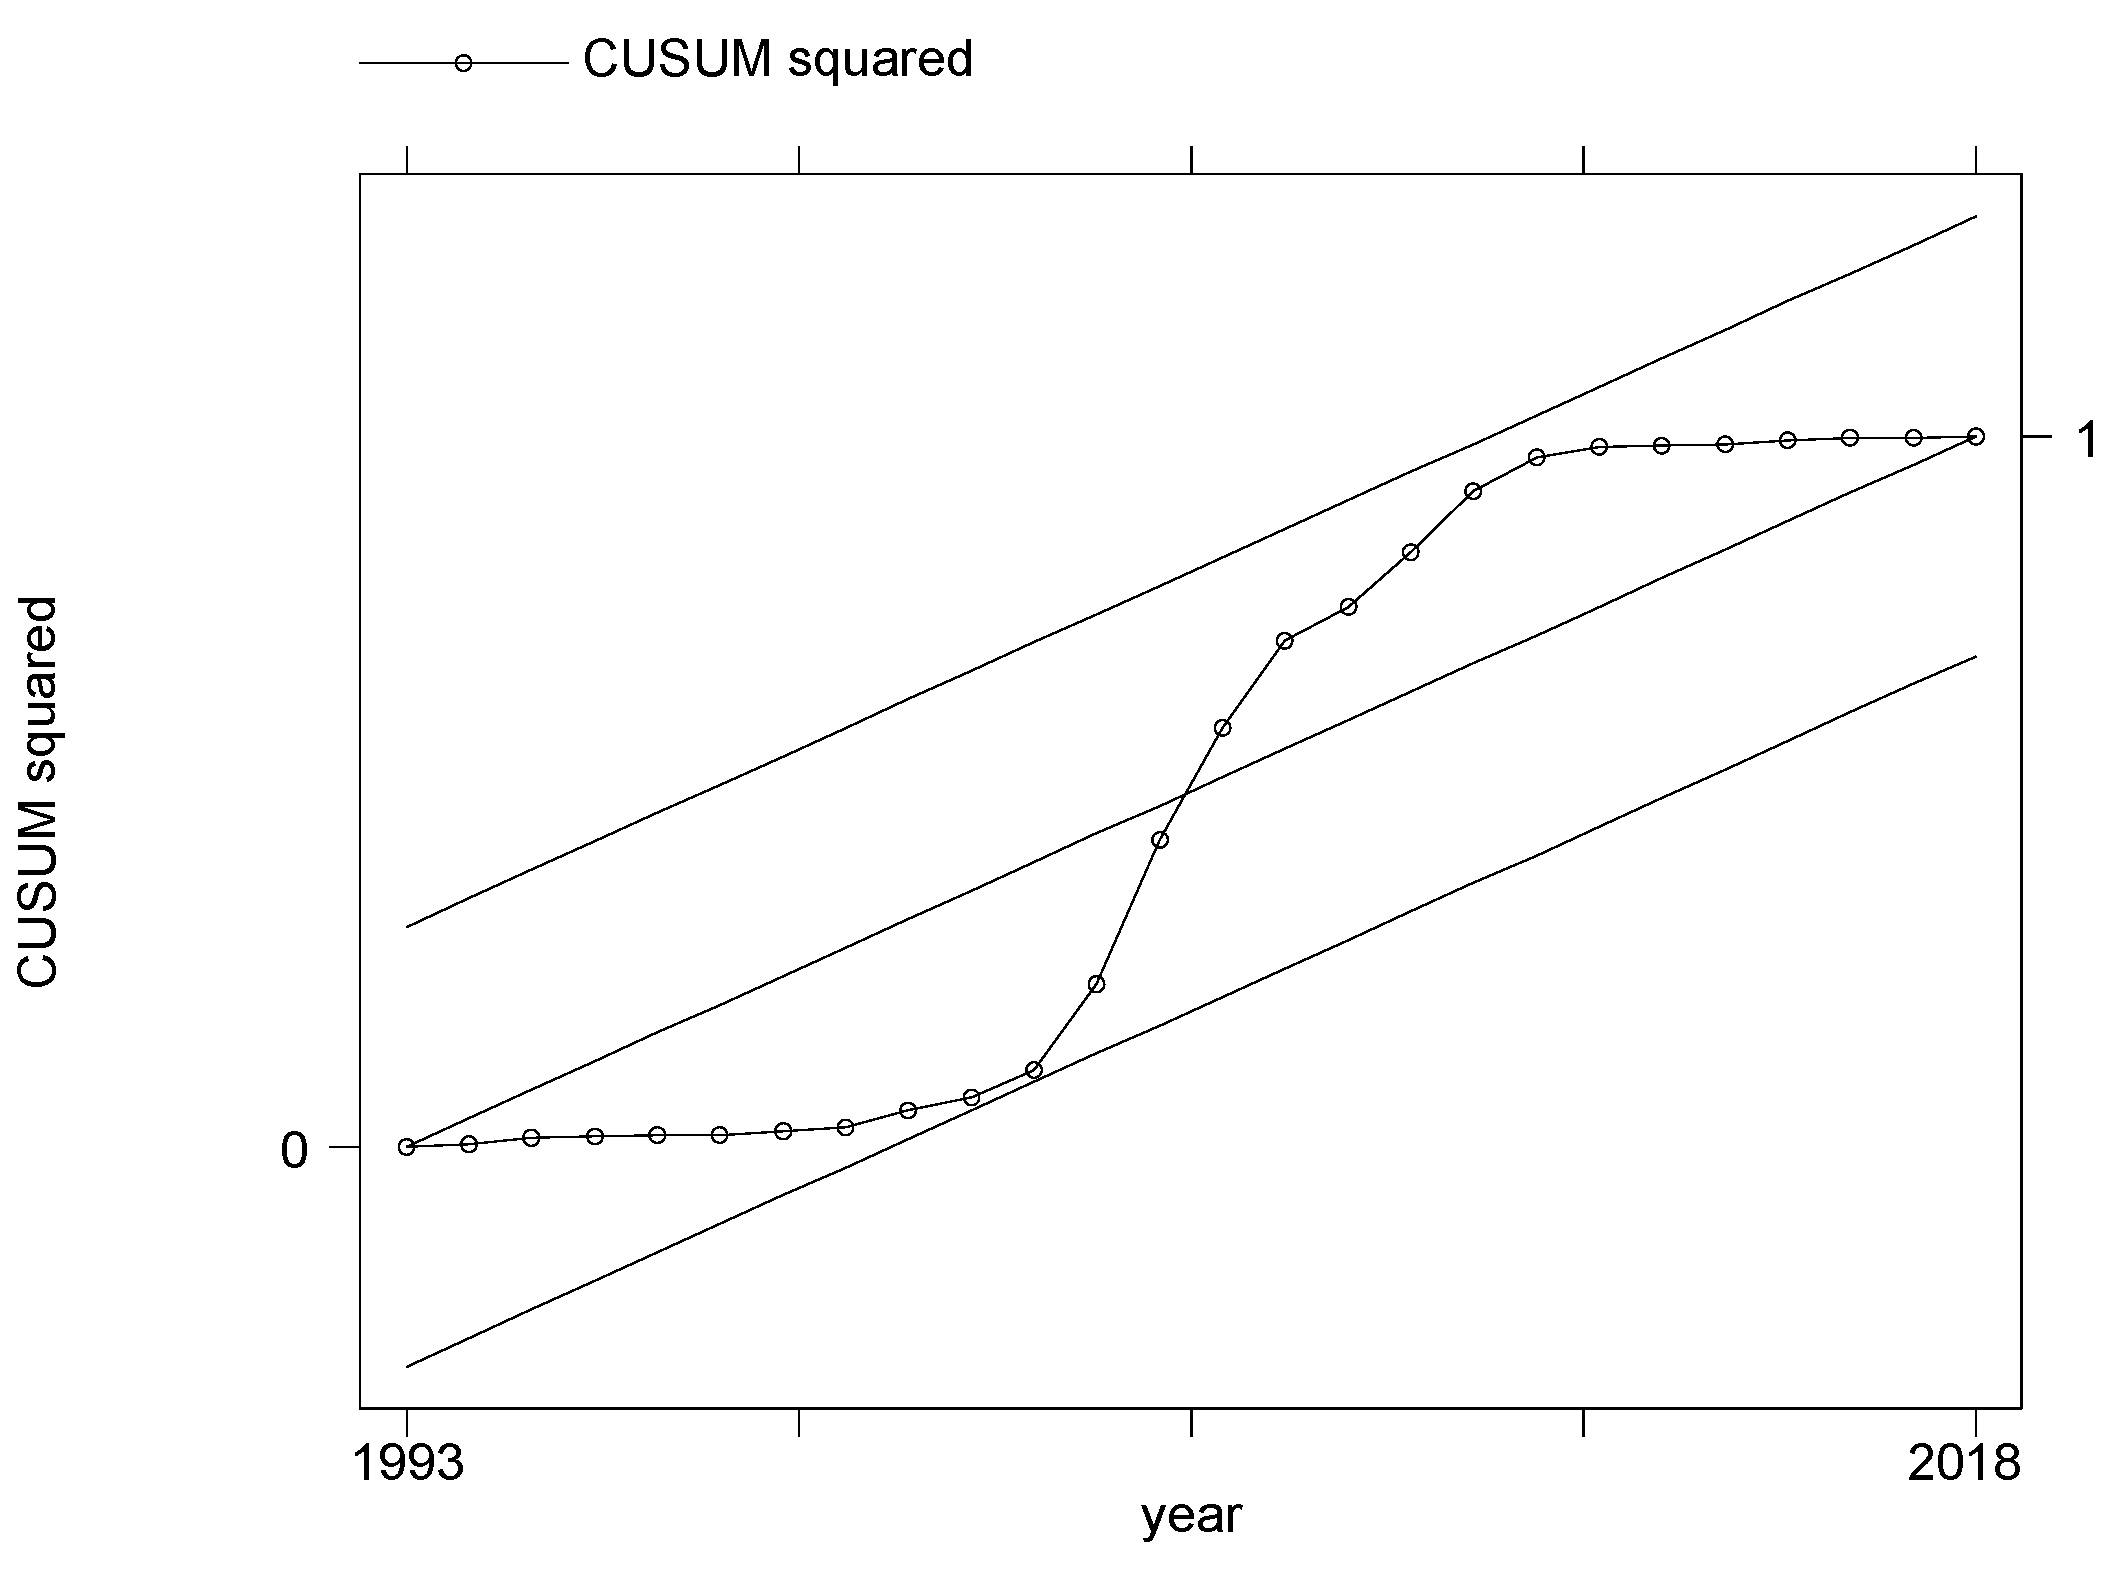
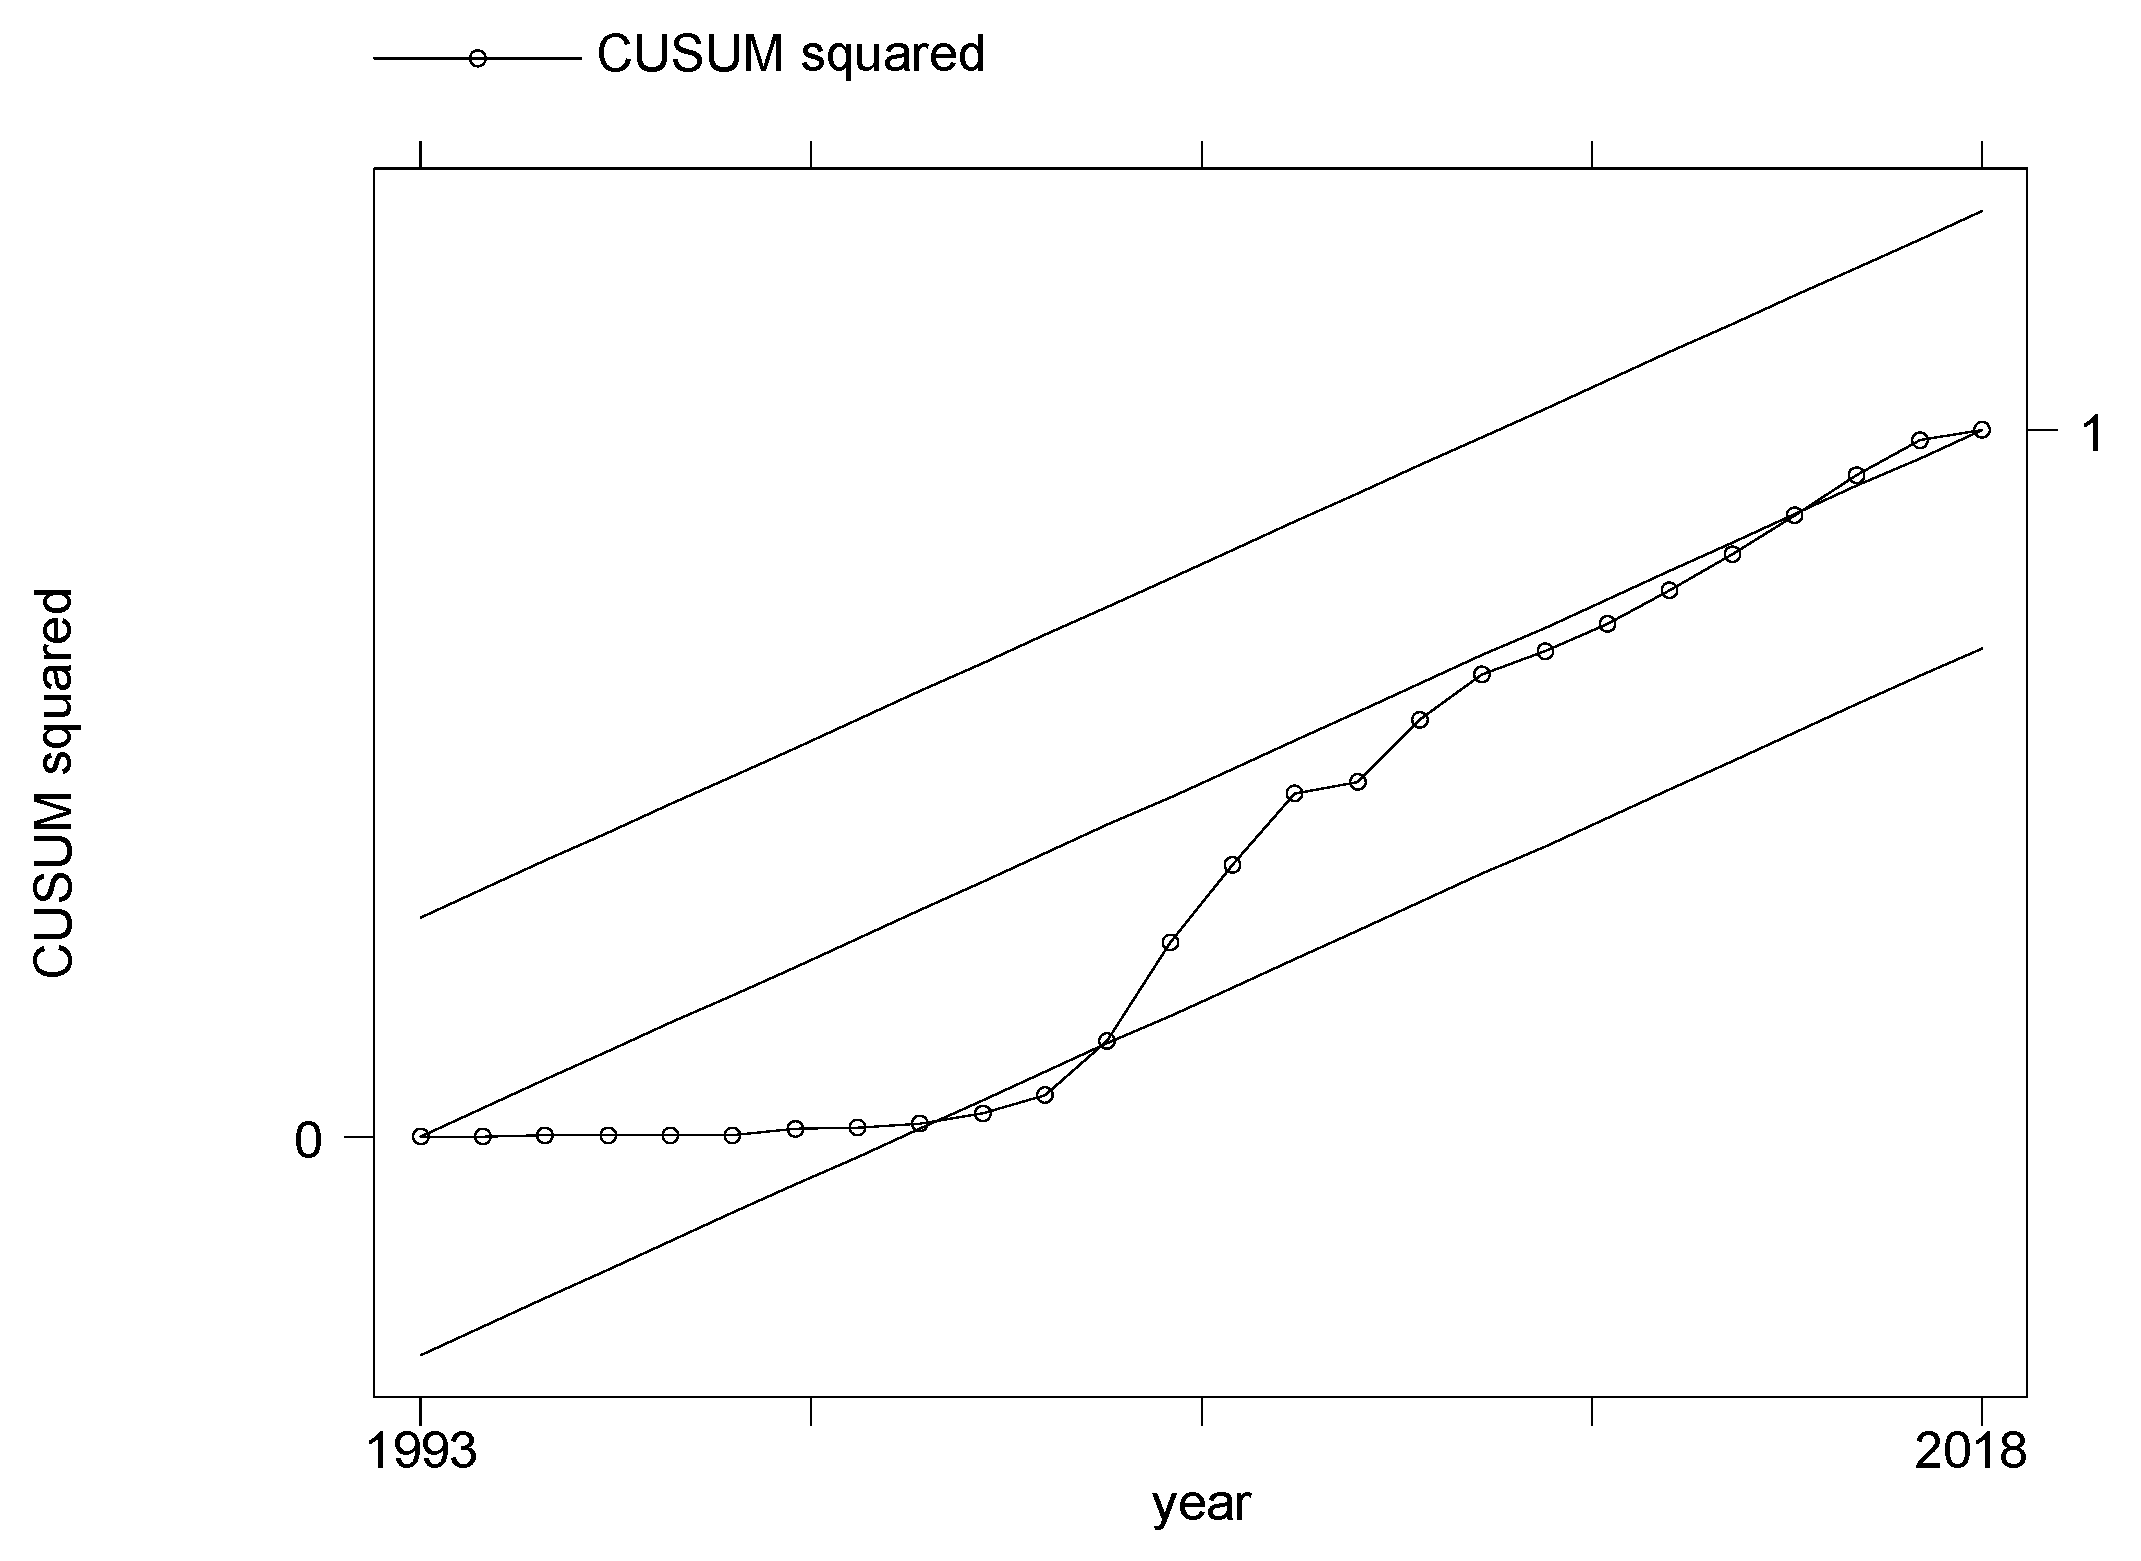
Lastly, once the three ARDL-ECMs were determined, the cumulative sum of squares (CUSUMQ) in recursive residuals was plotted to assess the parameter stability (Brown et al. 1975; Stamatiou and Dritsakis 2014). As can be seen from the Figure 6, Figure 7 and Figure 8, the graphs of statistical CUSUMQ are within the critical values at the 5% significance level, which means that all the coefficients in the three models are stable. All three models proved to be stable within 5% of the upper and lower bounds. The results are illustrated as follows.
4.5. Discussion and Policy Implication
It was observed that in Korea, from the late 1990s to 2000s, the saved operating cost per unit of financial intermediation, achieved through digital transformation (DT), was used for a reduction in consumer fees rather than increasing the industry’s profit or wage per intermediated asset. We conclude that digital transformation (DT) in the nation has contributed to a decreased financial services cost and has resulted in improved consumer benefit.
In fact, the total number of employees in the Korean financial industry fluctuated during our analysis window, and the wage per employee constantly increased. On the other hand, the amount of intermediated asset served by one employee increased far more quickly than the increase in salary per person, resulting in a decrease in labor cost per intermediated asset, which is measured by UCIA.
This result is surprising, as Philippon (2015, 2016) maintained that the wage level in this industry in the US is much higher than in other industries and the gap is widening. The UCIA in Korea (3.38%) was higher than in the US (2.2%) in 1990, but it decreased dramatically to 1.75%, which is close to that of US in 2015 (approximately 1.8%). Our study shows that, while the recent literature documents a high and rising cost of financial intermediation in the US and in other countries, the consumer cost per financial intermediation has constantly improved over time in Korea.
From a financial policy perspective, our study may provide a possible direction for where the efficiency gains from innovative DT could be used to reduce the customer cost while constantly increasing the labor wage per person in the finance sector. However, it can only be achieved when the excessive level of profit is constrained, either by market competition or through intervention from the authorities. In addition, financial authorities may leverage the ongoing trend of digital transformation (DT) as a driver of efficiency gain in the financial services sector as a whole, which could be promoted via various means of incentives to the service providers.
5. Conclusions
This study aimed to empirically investigate the interrelationship between digital transformation in the financial services sector and financial consumer benefit by utilizing a set of aggregate outcomes indicators of the financial services sector in Korea. The main findings are that, over time, the unit cost for financial intermediation in Korea has tended to move in tandem with the growth in economic output, although the profit portion of the cost has not exhibited a long-term relationship with the GDP trend. Furthermore, the long-term effect of the DT trend is negative (i.e., cost-saving) for labor input and capital expenditure, which are shown to be statistically significant, and, as a consequence, its impact on the total intermediation cost is also positive and statistically significant.
The main implication of our empirical findings is that, while the recent literature documents a high and rising cost of financial intermediation in the US and in other countries, the financial services sector in Korea is seemingly different from those countries, in that we did not find evidence that the cost of intermediation in the country is excessive in comparison with those countries, as well as over time within the country.
In addition, the ongoing trend of digital transformation appears to be working as a driver of efficiency gain in the financial services sector as a whole. From a financial consumer perspective, these outcomes should be viewed as positive as the price of the service is not overly expensive, and the data and ICT-driven innovations in the sector are also working in their favor. From a policy perspective, our findings imply that DT-driven innovation in the sector can work in the customer’s favor if the excessive level of profit is restrained through market competition.
As to future research topics, we note several issues to be tackled going forward. First, the more specific welfare implications of DT, as discussed in Section 2, could be theoretically and empirically examined, e.g., intermediation efficiency via internet- or mobile platform-based services, the financial inclusion effects across consumer segments or geographical areas, and the BigTech-driven innovation effects along with the appropriate regulatory regimes for them. Second, the interplay between digital technologies and specific financial products, and their welfare implications, could be further analyzed. For example, a change in the shares of certain financial products may have affected the change in UCIA in Korea during our test period, along with the efficiency gains through digital transformation. In particular, the rapid growth in the residential mortgage lending sector, which is based on standardized lending products, may have enhanced operational efficiency, and could be specifically examined in future research. Third, the length of the time series data in our research was short, and a similar empirical investigation with more extended time series data could also be performed, for Korea as well as for other countries. International comparative studies in that vein would also contribute to the compilation of a set of meaningful KPIs (Key Performance Indicators) for assessing the progress of DT in those countries.
Author Contributions
Conceptualization, S.P. and M.C.; data curation, S.P.; formal analysis, S.P. and P.E.K.; funding acquisition, P.E.K.; investigation, M.C.; methodology, M.C.; resources, M.C.; software, S.P.; supervision, S.P.; validation, M.C.; writing—original draft, P.E.K.; writing—review and editing, S.P. and M.C. All authors have read and agreed to the published version of the manuscript.
Funding
This work was supported by the 2021 Research Fund of the KEPCO International Nuclear Graduate School (KINGS), Republic of Korea.
Institutional Review Board Statement
Not applicable.
Informed Consent Statement
Not applicable.
Data Availability Statement
The datasets used and/or analyzed during the current study are available from the corresponding author on reasonable request.
Conflicts of Interest
The authors declare no conflict of interest.
| 1 | |
| 2 | The size of household lending as a % of GDP has grown from 3.6% in 1975 to 99.1% in 2018; the size of insurance and pensions together has increased from 1.3% to 78.2% during the same period; and the total capitalization in the stock market has risen from 100% in 1997 to 1400% in 2018. |
| 3 | We selected the percentage of internet users as a proxy measure for the number of internet banking users and the number of mobile phone banking users as the latter two variables provide too short a period for analysis. The correlation measured between the percentage of internet users and the number of internet banking users is 0.883, and that between the percentage of internet users and the number of phone banking users is 0.891. |
References
- Arcand, Jean Louis, Enrico Berkes, and Ugo Panizza. 2012. Too Much Finance? IMF Working Paper 12/161. Washington, DC: IMF. [Google Scholar]
- Bank of Korea. 2020. National Account. Available online: https://kosis.kr/statHtml/statHtml.do?orgId=301&tblId=DT_111Y003&conn_path=I3 (accessed on 27 December 2020).
- Bank of Korea. 2021. Economic Statistics System. Available online: https://ecos.bok.or.kr/flex/EasySearch.jsp (accessed on 1 February 2021).
- Berg, Tobias, Valentin Burg, Ana Gombović, and Manju Puri. 2018. On the Rise of FinTechs—Credit Scoring using Digital Footprints. The Review of Financial Studies 33: 2845–97. [Google Scholar] [CrossRef]
- Brown, Robert L., James Durbin, and James M. Evans. 1975. Techniques for testing the constancy of regression relationships over time (with discussion). Journal of the Royal Statistical Society. Series B 37: 149–92. [Google Scholar]
- Buchak, Greg, Gregor Matvos, Tomasz Piskorski, and Amit Seru. 2017. Fintech, Regulatory Arbitrage, and the Rise of Shadow Banks (NBER Working Paper 23288). Journal of Financial Economics 130: 453–83. [Google Scholar] [CrossRef]
- Cecchetti, Stephen, and Enisse Kharroubi. 2012. Reassessing the Impact of Finance on Growth. BIS WP 381. Basel: Bank for International Settlements. [Google Scholar]
- Chamley, Christophe, Laurence J. Kotlikoff, and Herakles Polemarchakis. 2012. Limited-purpose banking–moving from “trust me” to “show me” banking. American Economic Review 102: 113–19. [Google Scholar] [CrossRef] [Green Version]
- Chava, Sudheer, and Nikhil Paradkar. 2018. Winners and Losers of Marketplace Lending: Evidence from Borrower Credit Dynamics. Georgia Tech Working Paper 18-16. Atlanta: Georgia Institute of Technology. [Google Scholar]
- Cho, Man. 2021. FinTech Megatrends: An Assessment of Their Industrial and Welfare Implications. International Review of Financial Consumers 6: 1. [Google Scholar]
- Cho, Man, and Soojin Park. 2021. Financial Consumer Protection in the Era of Digital Transformation: A Critical Survey of Literature and Policy Practices. KDI School of Pub Policy & Management Paper No. DP21-04. March 20. Available online: https://ssrn.com/abstract=3914573 (accessed on 5 January 2021).
- Cho, Man, Seung Dong You, and Young Man Lee. 2017. Financial Consumer Protection in the Household Lending Sector: An Assessment of the Korean Experience. The International Review of Financial Consumers 2: 15–23. [Google Scholar] [CrossRef]
- Citi Global Perspectives and Solutions. 2018. BANK OF THE FUTURE: The ABCs of Digital Disruption in Finance. March. Available online: http://www.smallake.kr/wp-content/uploads/2018/05/AHDX6.pdf (accessed on 5 January 2021).
- Cochrane, John H. 2014. Toward a run-free financial system. In Across the Great Divide: New Perspectives on the Financial Crisis. Edited by Martin Neil Baily and John B. Taylor. Stanford: Hoover Press. [Google Scholar]
- Cournède, Boris, and Oliver Denk. 2015. Finance and Economic Growth in OECD and G20 Countries. OECD Economics Department Working Papers No. 1223. ECO/WKP(2015)41. Paris: OECD. [Google Scholar]
- De Roure, Calebe, Loriana Pelizzon, and Anjan V. Thakor. 2021. P2P Lenders versus Banks: Cream Skimming or Bottom Fishing? SAFE Working Paper No. 206, Michael J. Brennan Irish Finance Working Paper Series. Research Paper No. 18-13. Available online: https://ssrn.com/abstract=3174632 (accessed on 5 January 2021).
- DiMaggio, Marco, and Vincent Yao. 2018. Fintech Borrowers: Lax-Screening or Cream Skimming? Available online: https://ssrn.com/abstract=3224957 (accessed on 5 January 2021).
- Engle, Robert F., and Clive W. J. Granger. 1987. Co-integration and error correction: Representation, estimation, and testing. Econometrica 55: 251–76. [Google Scholar] [CrossRef]
- Freedman, Seth, and Ginger Zhe Jin. 2017. The Information Value of Online Social Networks: Lessons from Peer-to-Peer Lending. International Journal of Industrial Organization 51: 185–222. [Google Scholar] [CrossRef]
- Frost, Jon, Leonardo Gambacorta, Yi Huang, Hyun Song Shin, and Pablo Zbindenn. 2019. BigTech and the Changing Structure of Financial Intermediation. BIS Working Papers No 779. Available online: https://www.bis.org/publ/work779.htm (accessed on 5 January 2021).
- Fuster, Andreas, Matthew Plosser, Philipp Schnabl, and James Vickery. 2018. The Role of Technology in Mortgage Lending. NBER Working Paper 24500. Cambridge: NBER. [Google Scholar]
- G20/OECD/INFE. 2017. G20/OECD INFE Report on Adult Financial Literacy in G20 Countries. Paris: OECD. [Google Scholar]
- Graessley, Scott, Jakub Horak, Maria Kovacova, Katarina Valaskova, and Milos Poliak. 2019. Consumer Attitudes and Behaviors in the Technology-Driven Sharing Economy: Motivations for Participating in Collaborative Consumption. Journal of Self-Governance and Management Economics 7: 25–30. [Google Scholar] [CrossRef] [Green Version]
- Hassler, Uwe, and Jürgen Wolters. 2006. Autoregressive distributed lag models and cointegration. Allgemeines Statistisches Archiv 90: 59–74. [Google Scholar] [CrossRef] [Green Version]
- Hildebrand, Thomas, Manju Puri, and Jörg Rocholl. 2017. Adverse Incentives in Crowdfunding. Management Science 63: 587–608. [Google Scholar] [CrossRef] [Green Version]
- International Monetary Fund (IMF). 2017. Fintech and Financial Services: Initial Considerations. Staff Discussion Notes No. SDNEA2017005. Washington, DC: IMF. [Google Scholar]
- Ionescu, Luminiţa. 2020a. Digital Data Aggregation, Analysis, and Infrastructures in FinTech Operations. Review of Contemporary Philosophy 19: 92–98. [Google Scholar] [CrossRef]
- Ionescu, Luminiţa. 2020b. The Economics of the Carbon Tax: Environmental Performance, Sustainable Energy, and Green Financial Behavior. Geopolitics, History, and International Relations 12: 101–7. [Google Scholar] [CrossRef]
- Ionescu, Luminiţa. 2021a. Transitioning to a Low-Carbon Economy: Green Financial Behavior, Climate Change Mitigation, and Environmental Energy Sustainability. Geopolitics, History, and International Relations 13: 86–96. [Google Scholar] [CrossRef]
- Ionescu, Luminiţa. 2021b. Leveraging Green Finance for Low-Carbon Energy, Sustainable Economic Development, and Climate Change Mitigation during the COVID-19 Pandemic. Review of Contemporary Philosophy 20: 175–86. [Google Scholar] [CrossRef]
- Iyer, Rajkamal, Asim Ijaz Khwaja, Erzo F. P. Luttmer, and Kelly Shue. 2016. Screening Peers Softly: Inferring the Quality of Small Borrowers. Management Science 62: 1554–77. [Google Scholar] [CrossRef] [Green Version]
- Jagtiani, Julapa, and Catharine Lemieux. 2019. The Roles of Alternative Data and Machine Learning in Fintech Lending: Evidence from the LendingClub Consumer Platform (Philadelphia Fed Working Paper). Financial Management 48: 1009–29. [Google Scholar] [CrossRef]
- King, Robert G., and Ross Levine. 1993. Finance and Qrowth: Schumpeter Might be Right. Quarterly Journal of Economics 108: 713–37. [Google Scholar] [CrossRef]
- Korea Statistics Information System (KSIS). 2021. Available online: https://kosis.kr/statHtml/statHtml.do?orgId=101&tblId=DT_2KAAA13&conn_path=I3 (accessed on 20 January 2021).
- Le, Tu D. Q., Tin H. Ho, Dat T. Nguyen, and Thanh Ngo. 2021. Fintech Credit and Bank Efficiency: International Evidence. International Journal of Financial Studies 9: 44. [Google Scholar] [CrossRef]
- Lin, Mingfeng, Nagpurnanand R. Prabhala, and Siva Viswanathan. 2013. Judging Borrowers by the Company They Keep: Friendship Networks and Information Asymmetry in Online Peer-to-Peer Lending. Management Science 59: 17–35. [Google Scholar] [CrossRef]
- Manning, Mark J. 2003. Finance Causes Growth: Can We Be So Sure? The B.E. Journal of Macroeconomics 3: 1–24. [Google Scholar] [CrossRef]
- Narayan, Paresh Kumar. 2005. The saving and investment nexus for China: Evidence from cointegration tests. Applied Economics 37: 1979–90. [Google Scholar] [CrossRef]
- Odedokun, Matthew O. 1996. Alternative econometric approaches for analysing the role of the financial sector in economic growth: Time-series evidence from LDCs. Journal of Development Economics 50: 119–46. [Google Scholar] [CrossRef]
- Organization of Economic Cooperation and Development (OECD). 2019. The Digital Innovation Policy Landscape in 2019. OECD Science, Technology and Innovation Policy Papers, May 2019 No. 71. Available online: https://0-www-oecd--ilibrary-org.brum.beds.ac.uk/science-and-technology/the-digital-innovation-policy-landscape-in-2019_6171f649-en (accessed on 5 January 2021).
- Pagano, Marco, and Giovanni Pica. 2012. Finance and Employment. Economic Policy 27: 5–55. [Google Scholar] [CrossRef]
- Pennachi, George. 2012. Narrow banking. Annual Review of Financial Economics 4: 141–159. [Google Scholar] [CrossRef]
- Pesaran, M. Hashem, and Yongcheol Shin. 1999. An Autoregressive Distributed Lag Modelling Approach to Cointegration Analysis. In Econometrics and Economic Theory in the 20th Century: The Ragnar Frisch Centennial Symposium. Edited by Steinar Strøm. Cambridge: Cambridge University Press. [Google Scholar]
- Pesaran, M. Hashem, Yongcheol Shin, and Richard J. Smith. 2001. Bounds testing approaches to the analysis of level relationships. Journal of Applied Econometrics 16: 289–326. [Google Scholar] [CrossRef]
- Philippon, Thomas. 2015. Has the us finance industry become less efficient? on the theory and measurement of financial intermediation. The American Economic Review 105: 1408–38. [Google Scholar] [CrossRef] [Green Version]
- Philippon, Thomas. 2016. The Fintech Opportunity. NBER Working Paper No. w22476. Available online: https://ssrn.com/abstract=2819862 (accessed on 5 January 2021).
- Priem, Randy. 2021. An Exploratory Study on the Impact of the COVID-19 Confinement on the Financial Behavior of Individual Investors. Economics, Management, and Financial Markets 16: 9–40. [Google Scholar] [CrossRef]
- Puri, Manju, Jörg Rocholl, and Sascha Steffen. 2017. What do a million observations have to say about loan defaults? Opening the black box of relationships. Journal of Financial Intermediation 31: 1–15. [Google Scholar] [CrossRef]
- Rajan, Raghuram, and Luigi Zingales. 1998. Financial Dependence and Growth. American Economic Review 88: 559–86. [Google Scholar]
- Stamatiou, Pavlos P., and Nikolaos Dritsakis. 2014. The impact of Foreign Direct Investment on the Unemployment Rate and Economic Growth in Greece: A Time Series Analysis. Paper presented at International Work-Conference on Time Series Analysis (ITISE), Granada, Spain, 25–27 September; vol. 1, pp. 97–108. [Google Scholar]
- The World Bank. 2012. Good Practices for Financial Consumer Protection. Washington, DC: The World Bank. [Google Scholar]
- The World Bank. 2019. Last updated in 27 February 2019. The G20 Basic Set of Financial Inclusion Data Repository. Available online: https://databank.worldbank.org/reports.aspx?source=g20-basic-set-of-financial-inclusion-indicators (accessed on 1 March 2021).
- The World Bank. 2021. Global Partnership for Financial Inclusion. G20 Financial Inclusion Indicators|Home|The World Bank. Available online: https://datatopics.worldbank.org/g20fidata/ (accessed on 21 January 2021).
Figure 1.
Number of bank branches and ATMs, Korea (2011–2017). Source: (The World Bank 2019).
Figure 1.
Number of bank branches and ATMs, Korea (2011–2017). Source: (The World Bank 2019).

Figure 2.
Number of online banking accounts (per 100,000 adults), Korea (2001–2015). Note: The number is counted based on registered accounts. One person may have multiple accounts that are each counted separately. Source: (Bank of Korea 2021).
Figure 2.
Number of online banking accounts (per 100,000 adults), Korea (2001–2015). Note: The number is counted based on registered accounts. One person may have multiple accounts that are each counted separately. Source: (Bank of Korea 2021).

Figure 3.
Intermediated asset over GDP. Source: (Bank of Korea 2020; The World Bank 2021).
Figure 3.
Intermediated asset over GDP. Source: (Bank of Korea 2020; The World Bank 2021).

Figure 4.
Unit cost per intermediated asset by components. Source: Author compilation quoted in (Bank of Korea 2020; Korea Statistics Information System (KSIS) 2021).
Figure 4.
Unit cost per intermediated asset by components. Source: Author compilation quoted in (Bank of Korea 2020; Korea Statistics Information System (KSIS) 2021).

Figure 5.
Impact of digital transformation and unit cost for intermediation. Source: Author compilation quoted in (Bank of Korea 2020; Korea Statistics Information System (KSIS) 2021).
Figure 5.
Impact of digital transformation and unit cost for intermediation. Source: Author compilation quoted in (Bank of Korea 2020; Korea Statistics Information System (KSIS) 2021).

Figure 6.
CUSUMQ for Model 1.

Figure 7.
CUSUMQ for Model 2.

Figure 8.
CUSUMQ for Model 3.


Table 1.
Variable descriptions.
| Name of Variables | Mean | Description | Unit |
|---|---|---|---|
| VAF | Value add in finance industry | Value add of financial industry * selected from national accounts of Korea | billion Korea Won |
| Labor | Labor cost | Labor cost among VAF, selected from national accounts of Korea | billion Korea Won |
| Profit | Profit | Profit among VAF, selected from national accounts of Korea | billion Korea Won |
| Capex | Capital expenditure | Capital expenditure among VAF, selected from national accounts of Korea | billion Korea Won |
| Tax | Tax | Tax among VAF, selected from national accounts of Korea | billion Korea Won |
| GDP_growth | GDP growth rate | GDP growth rate in Korea (year to year) | percent |
| Empl | Number of employees | Thousand number of employees in financial industry of Korea | thousand people |
| Wage | Total wage of financial industry | Total sum of wages in financial industry of Korea | billion Korea Won |
| Intermedi | Intermediated asset of financial industry | Scale of financial services, measured by the liquidity aggregate (L) minus monetary base (M0) plus market cap of stock in Korea | billion Korea Won |
| Internet | Number of internet banking users | Thousand people of internet banking users in Korea | thousand people |
| Mobile | Number of mobile banking users | Thousand people of mobile phone banking users in Korea | thousand people |
| user_internet | Percentage of internet users | Percentage of internet users in Korea | percent |
(*) Financial industry includes banks, stocks, insurance, and other financial services companies. Note: all monetary values are converted into 2015 value, based on the producer’s price index of Korea.
Table 2.
Basic statistics.
| Variable | Obs | Mean | Std. Dev. | Min | Max |
|---|---|---|---|---|---|
| cost_intermedi | 29 | 2.6810 | 0.7122 | 1.61 | 3.64 |
| labor_intermedi | 29 | 1.4041 | 0.6773 | 0.64 | 2.34 |
| capex_intermedi | 29 | 0.1596 | 0.0470 | 0.08 | 0.24 |
| user_internet | 30 | 54.0933 | 38.1594 | 0.00 | 96.20 |
| gdp_grow | 30 | 5.1833 | 3.4747 | −5.10 | 11.50 |
| internetb | 15 | 52,792.93 | 31,511.59 | 10,918 | 109,760 |
| wage_empl | 29 | 42.3806 | 10.6291 | 23.53 | 59.53 |
Note: cost_intermedi = consumer cost per unit of intermediated asset (VAF/Intermedi); labor_intermedi = labor cost per unit of intermediated asset (Labor/Intermedi); capex_intermedi = capital expenditure per unit of intermediated asset (capex/Intermedi); user_internet = percentage of internet users; gdp_grow = growth rate of GDP; internetb = number of internet banking users; wage_empl = average wage per employee in financial industry.
Table 3.
Lag orders and result of bounds test for the selected dependent variables.
| Model # | Dependent Variable | Independent Variable | Selected Lag Orders (p, q) | Bounds Test | |
|---|---|---|---|---|---|
| F-Test Result | t-Test Result | ||||
| 1 | labor_intermedi | user_internet | (2, 3) | 6.507 ** | −3.314 ** |
| 2 | capex_intermedi | user_internet | (2, 3) | 6.233 ** | −3.522 ** |
| 3 | cost_intermedi | user_internet | (1, 3) | 10.050 *** | −4.444 *** |
Note: **, *** represent significance levels at 5%, and 1%, respectively.
Table 4.
Model 1—impact of digital transformation on labor cost efficiency gains.
| D.labor_Intermedi | Adjustment | Long Run | Short Run |
|---|---|---|---|
| VARIABLES | |||
| LD.labor_intermedi | 0.614 *** | ||
| (0.141) | |||
| D.user_internet | 0.0153 *** | ||
| (0.00354) | |||
| LD.user_internet | −0.00787 | ||
| (0.00551) | |||
| L2D.user_internet | 0.0102 * | ||
| (0.00507) | |||
| L.labor_intermedi | −0.433 *** | ||
| (0.131) | |||
| user_internet | −0.0168 *** | ||
| (0.000920) | |||
| Constant | 0.933 *** | ||
| (0.296) | |||
| Observations | 26 | 26 | 26 |
| R-squared | 0.747 | 0.747 | 0.747 |
Note 1. Standard errors in parentheses: *** p < 0.01, * p < 0.1. Note 2. D = first difference operator, L = lagged variable.
Table 5.
Model 2—impact of digital transformation on operational capital cost efficiency gains.
| D.capex_Intermedi | Adjustment | Long Run | Short Run |
|---|---|---|---|
| VARIABLES | |||
| LD.capex_intermedi | 0.538 *** | ||
| (0.159) | |||
| D.user_internet | 0.00203 *** | ||
| (0.000702) | |||
| LD.user_internet | −0.000755 | ||
| (0.000826) | |||
| L2D.user_internet | 0.00163 * | ||
| (0.000805) | |||
| L.capex_intermedi | −0.450 *** | ||
| (0.128) | |||
| user_internet | −0.000955 *** | ||
| (0.000152) | |||
| Constant | 0.0852 *** | ||
| (0.0242) | |||
| Observations | 26 | 26 | 26 |
| R-squared | 0.634 | 0.634 | 0.634 |
Note 1. Standard errors in parentheses: *** p < 0.01, * p < 0.1. Note 2. D = first difference operator, L = lagged variable.
Table 6.
Model 3—impact of digital transformation on financial services cost.
| D.cost_Intermedi | Adjustment | Long Run | Short Run |
|---|---|---|---|
| VARIABLES | |||
| D.user_internet | 0.0246 *** | ||
| (0.00616) | |||
| LD.user_internet | −0.00157 | ||
| (0.00797) | |||
| L2D.user_internet | 0.0168 ** | ||
| (0.00744) | |||
| L.cost_intermedi | −0.498 *** | ||
| (0.112) | |||
| user_internet | −0.0180 *** | ||
| (0.00131) | |||
| Constant | 1.643 *** | ||
| (0.383) | |||
| Observations | 26 | 26 | 26 |
| R-squared | 0.624 | 0.624 | 0.624 |
Note 1. Standard errors in parentheses: *** p < 0.01, ** p < 0.05. Note 2. D = first difference operator, L = lagged variable.
Table 7.
Diagnostic test results.
| Tests | Model 1 | Model 2 | Model 3 | |||
|---|---|---|---|---|---|---|
| Test Value | Decision | Test Value | Decision | Test Value | Decision | |
| Durbin–Watson (d-statistic) | 1.9073 | No autocorrelation | 1.997 | No autocorrelation | 1.8520 | No autocorrelation |
| Breusch–Godfrey LM test (Prob > chi2) | 0.9072 | No serial correlation | 0.7529 | No serial correlation | 0.3095 | No serial correlation |
| White test (Prob > chi2) | 0.4076 | No heteroskedasticity | 0.4070 | No heteroskedasticity | 0.6799 | No heteroskedasticity |
Publisher’s Note: MDPI stays neutral with regard to jurisdictional claims in published maps and institutional affiliations. |
© 2021 by the authors. Licensee MDPI, Basel, Switzerland. This article is an open access article distributed under the terms and conditions of the Creative Commons Attribution (CC BY) license (https://creativecommons.org/licenses/by/4.0/).
Share and Cite
MDPI and ACS Style
Park, S.; Kesuma, P.E.; Cho, M. Did Financial Consumers Benefit from the Digital Transformation? An Empirical Investigation. Int. J. Financial Stud. 2021, 9, 57. https://0-doi-org.brum.beds.ac.uk/10.3390/ijfs9040057
AMA Style
Park S, Kesuma PE, Cho M. Did Financial Consumers Benefit from the Digital Transformation? An Empirical Investigation. International Journal of Financial Studies. 2021; 9(4):57. https://0-doi-org.brum.beds.ac.uk/10.3390/ijfs9040057
Chicago/Turabian StylePark, Soojin, Prida Erni Kesuma, and Man Cho. 2021. "Did Financial Consumers Benefit from the Digital Transformation? An Empirical Investigation" International Journal of Financial Studies 9, no. 4: 57. https://0-doi-org.brum.beds.ac.uk/10.3390/ijfs9040057
Note that from the first issue of 2016, this journal uses article numbers instead of page numbers. See further details here.